financing us renewable energy projects through public capital vehicles - www
DESCRIPTION
goodTRANSCRIPT

NREL is a national laboratory of the U.S. Department of Energy, Office of Energy Efficiency & Renewable Energy, operated by the Alliance for Sustainable Energy, LLC.
Contract No. DE-AC36-08GO28308
Financing U.S. Renewable Energy Projects Through Public Capital Vehicles: Qualitative and Quantitative Benefits Michael Mendelsohn and David Feldman
Technical Report NREL/TP-6A20-58315 April 2013

NREL is a national laboratory of the U.S. Department of Energy, Office of Energy Efficiency & Renewable Energy, operated by the Alliance for Sustainable Energy, LLC.
National Renewable Energy Laboratory 15013 Denver West Parkway Golden, Colorado 80401 303-275-3000 • www.nrel.gov
Contract No. DE-AC36-08GO28308
Financing U.S. Renewable Energy Projects Through Public Capital Vehicles: Qualitative and Quantitative Benefits Michael Mendelsohn and David Feldman
Prepared under Task No. SM13.1030
Technical Report NREL/TP-6A20-58315 April 2013

NOTICE
This report was prepared as an account of work sponsored by an agency of the United States government. Neither the United States government nor any agency thereof, nor any of their employees, makes any warranty, express or implied, or assumes any legal liability or responsibility for the accuracy, completeness, or usefulness of any information, apparatus, product, or process disclosed, or represents that its use would not infringe privately owned rights. Reference herein to any specific commercial product, process, or service by trade name, trademark, manufacturer, or otherwise does not necessarily constitute or imply its endorsement, recommendation, or favoring by the United States government or any agency thereof. The views and opinions of authors expressed herein do not necessarily state or reflect those of the United States government or any agency thereof.
Available electronically at http://www.osti.gov/bridge
Available for a processing fee to U.S. Department of Energy and its contractors, in paper, from:
U.S. Department of Energy Office of Scientific and Technical Information P.O. Box 62 Oak Ridge, TN 37831-0062 phone: 865.576.8401 fax: 865.576.5728 email: mailto:[email protected]
Available for sale to the public, in paper, from:
U.S. Department of Commerce National Technical Information Service 5285 Port Royal Road Springfield, VA 22161 phone: 800.553.6847 fax: 703.605.6900 email: [email protected] online ordering: http://www.ntis.gov/help/ordermethods.aspx
Cover Photos: (left to right) PIX 16416, PIX 17423, PIX 16560, PIX 17613, PIX 17436, PIX 17721
Printed on paper containing at least 50% wastepaper, including 10% post consumer waste.
iii
Acknowledgments The authors thank the U.S. Department of Energy (DOE) for its sponsorship and direction of this work. We also appreciate the critical reviews of the following individuals, which greatly improved and informed the work:
• Doug Arent, National Renewable Energy Laboratory (NREL) • David Arfin, First Energy Finance, LLC • Jaime Carlson, DOE • Richard Kauffman, DOE • David Kline, NREL • Jeffrey Logan, NREL • Robert Margolis, NREL • Alok Mathur, DOE • Jim McCrea, DOE • Brendan Pierpont, Climate Policy Initiative • Uday Varadarajan, Climate Policy Initiative • Morgan Wright, DOE.

iv
List of Acronyms ABS asset-backed security DOE U.S. Department of Energy DSCR debt service coverage ratio EBITDA earnings before income tax, depreciation, and amortization GW gigawatt IRS Internal Revenue Service ITC investment tax credit LCOE levelized cost of energy MLP master limited partnership NREL National Renewable Energy Laboratory PCTO public capital take-out PLR private letter ruling PPA power purchase agreement PTC production tax credit PV photovoltaic RE renewable energy REIT real estate investment trust

v
Executive Summary Financing renewable energy (RE) projects via capital raised through public markets (public capital) offers the potential to substantially increase the availability, and lower the cost, of investment that is critical to continued industry growth. Public capital represents securities that are regularly traded and priced by the market, including stocks, bonds, and various investment vehicles that are designed to pool a collection of assets that have payment streams. Although no strict definition applies, public capital vehicles generally include:
• Asset-backed securities (ABSs), which comprise payments on assets such as mortgages, auto loans, and student debt
• Investment pools such as master limited partnerships (MLPs)
• Real estate investment trusts (REITs). RE projects are typically developed so that the power generated is sold through a long-term power purchase agreement (PPA), or the equipment is leased to an entity that hosts the system and uses the generated power. Additional revenues may be received through the sale of RE credits or environmental benefits as part of the PPA or through a separate agreement. Thus, RE projects can generally offer long-term, stable cash flows, and accordingly may be well suited for investors who are seeking such investment characteristics.
The fundamental function of creating a public capital vehicle, or security, is to pool a set of cash flows to devise a low-risk, easily tradable product that enables a broad set of investors to invest. Through this process of pooling assets and selling off ownership interests—sometimes called securitization—the public capital vehicle takes on numerous attributes that may be attractive to investors. These benefits include:
• Diversity of investment through pooled assets
• Liquidity (marketability) of the security once procured
• Transparency of the market price through public trading. Public capital vehicles are thus generally perceived as being lower risk than private investments and can attract capital at a lower yield or return. Thus, access to public capital can generally lower the associated return on investment, and therefore the cost of energy. Public capital may also expand the availability, increase the accessibility, and lower the transaction costs associated with accessing capital, and thus increase and expedite the deployment of renewable technologies.
Public capital can be injected into a project in various forms (equity and debt) and phases (construction versus operation) of an RE project. To quantify the possible benefits of these options, the following analysis assessed the levelized cost of energy (LCOE) impact of public capital availability against current methods of financing solar and wind assets. The analysis applied ABSs to represent public capital incorporated as debt, and MLPs to represent public capital incorporated as equity. Likely variations in possible financing costs were modeled to determine a range of possible LCOEs. Wind was modeled for 2014 (when the production tax credit expires) and solar for 2017 (when the investment tax credits revert to 10%).
vi
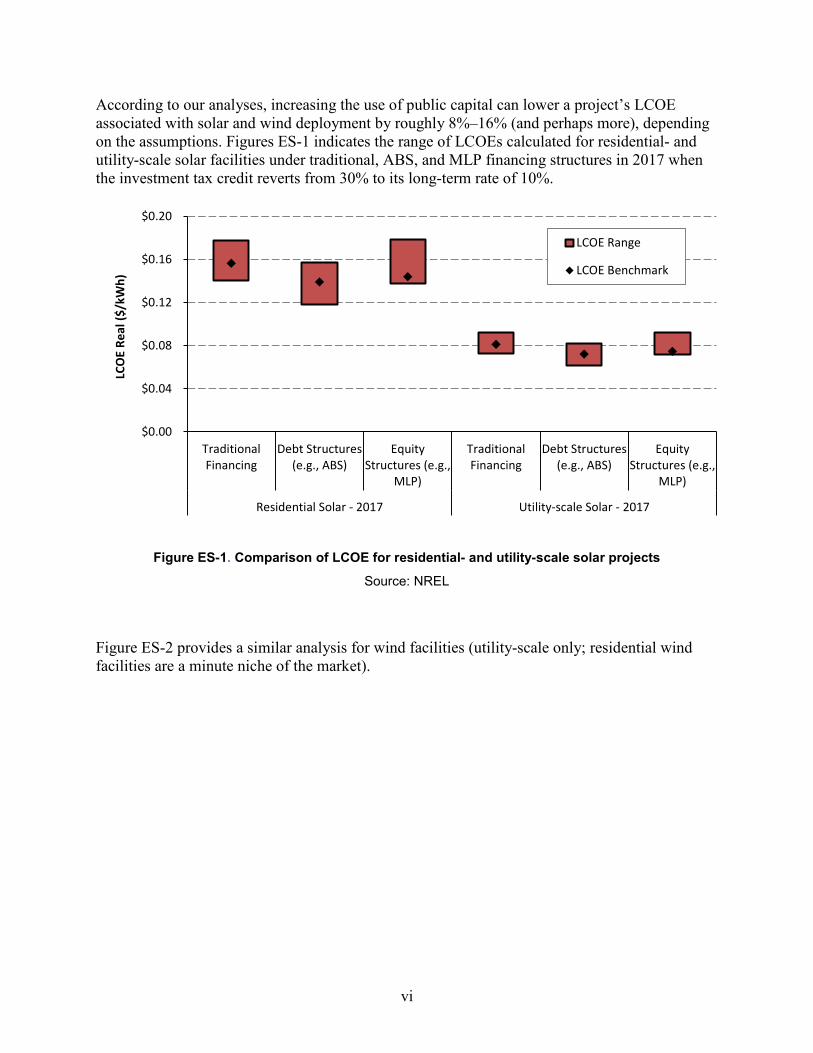
According to our analyses, increasing the use of public capital can lower a project’s LCOE associated with solar and wind deployment by roughly 8%–16% (and perhaps more), depending on the assumptions. Figures ES-1 indicates the range of LCOEs calculated for residential- and utility-scale solar facilities under traditional, ABS, and MLP financing structures in 2017 when the investment tax credit reverts from 30% to its long-term rate of 10%.
Figure ES-1. Comparison of LCOE for residential- and utility-scale solar projects
Source: NREL
Figure ES-2 provides a similar analysis for wind facilities (utility-scale only; residential wind facilities are a minute niche of the market).
$0.00
$0.04
$0.08
$0.12
$0.16
$0.20
TraditionalFinancing
Debt Structures(e.g., ABS)
EquityStructures (e.g.,
MLP)
TraditionalFinancing
Debt Structures(e.g., ABS)
EquityStructures (e.g.,
MLP)
Residential Solar - 2017 Utility-scale Solar - 2017
LCO
E Re
al ($
/kW
h)
LCOE Range
LCOE Benchmark

vii
Figure ES-2. Comparison of LCOE for wind projects
Source: NREL
The combined impact of more readily available and lower cost financial capital associated with public capital vehicles could have a significant impact on the wind and solar industries. Access to public capital markets might lower the cost of and expedite deployment, expand market opportunities, and induce economies of scale in various facets of component manufacturing and project development.
$0.00
$0.01
$0.02
$0.03
$0.04
$0.05
$0.06
$0.07
Traditional Financing Debt Structures (e.g., ABS) Equity Structures (e.g., MLP)
Wind - 2014
LCO
E Re
al ($
/kW
h)
LCOE Range
LCOE Benchmark

viii
Table of Contents 1 Introduction to Public Capital Markets ............................................................................................... 1
1.1 Capital Requirements of the Renewable Energy Industry ............................................................... 1 1.2 Tax Benefit History.......................................................................................................................... 2 1.3 Financial Vehicles To Access Public Capital .................................................................................. 3 1.4 Securitization Fundamentals ............................................................................................................ 5 1.5 Access to Public Markets as Part of Normal Technology Maturation ........................................... 11 1.6 Incompatibilities of Tax Equity and Public Capital ....................................................................... 13
2 Application of Public Capital to Renewable Energy Projects ........................................................ 15 2.1 Public Capital as Part of the Initial Capital Stack .......................................................................... 15 2.2 Public Capital as “Take-Out Financing” ........................................................................................ 15
3 Levelized Cost of Energy Impact ...................................................................................................... 18 4 Conclusion .......................................................................................................................................... 21 References ................................................................................................................................................. 22 Appendix A: Pre-Tax or After-Tax Returns ............................................................................................. 25 Appendix B: Model Assumptions ............................................................................................................ 26

ix
List of Figures Figure ES-1. Comparison of LCOE for residential- and utility-scale solar projects ..................... vi Figure ES-2. Comparison of LCOE for wind projects ................................................................. vii Figure 1. Estimated capital requirements for historical and projected PV and wind deployment ..1 Figure 2. 2011 Global assets under management, in $ trillion (hatched excluded from
calculations) ...............................................................................................................................6 Figure 3. Conceptual overview of asset securitization ....................................................................7 Figure 4. Hypothetical solar ABSs ..................................................................................................8 Figure 5. Credit enhancement structures .......................................................................................10 Figure 6. U.S. solar PV deployment and price, by year .................................................................11 Figure 7. U.S. wind deployment and price, by year ......................................................................12 Figure 8. Auto loan ABS issuances and yield................................................................................13 Figure 9. Potential pipeline for PCTO financing (i.e., cumulative U.S. RE projects that have
passed recapture period) (GW) ................................................................................................17 Figure 10. Comparison of LCOE between traditional financing and public capital financing
(residential and utility-scale solar) ...........................................................................................19 Figure 11. Comparison of LCOE between traditional financing and public capital financing
(wind) .......................................................................................................................................20 List of Tables Table 1. Cost of Capital, Market Size, and Investors— Tax Equity Versus Public Market (U.S.
Only) ..........................................................................................................................................4 Table 2. Comparison of Qualities Beneficial for Securitization Between Different Sectors ..........5 Table B-1. Basic Assumptions .......................................................................................................26 Table B-2. Financial Assumptions .................................................................................................27 Table B-3. Debt/Equity % of Asset ...............................................................................................28 Table B-4. Common Assumptions .................................................................................................28

1
1 Introduction to Public Capital Markets 1.1 Capital Requirements of the Renewable Energy Industry The wind and photovoltaic (PV) industries required an estimated $35 billion to finance 2012 deployments, including an estimated $23 billion1 to install 13.1 GW of wind capacity and $12 billion (SEIA and GTM 2013) to install 3.3 GW of solar PV capacity (see Figure 1).
Figure 1. Estimated capital requirements for historical and projected PV and wind deployment
Source: NREL
Meeting a significant expansion of installations consistent with the U.S. Department of Energy’s (DOE) Wind Program (DOE 2012a) and Sunshot Initiative (DOE 2012b) goals (20 GW of wind, 25–30 GW of PV) will require access to broad new sources of financial capital. The projected level of capital required in 2020 represents roughly twice the investment required in 2012 for the two technologies combined, including significant reductions in installed system costs.2
Public capital vehicles, such as asset-backed securities (ABSs), master limited partnerships (MLPs), and various debt products, represent valuable potential mechanisms by which to attract such capital and offer the opportunity to do so at low cost. This improves the affordability of renewable energy (RE) systems. Further, if tax credits expire for wind and solar installations—as current legislation dictates—in 2014 and 2017, respectively, tax equity investors (who comprise a large source of current RE capital) will
1 Calculated as expected deployment multiplied by industry average price. Assumes wind is installed at $1.76/W. 2 2020 financing values assume wind is installed at $1.675/W and solar is installed at $1.00–$1.50/W for utility-scale to residential-scale development in 2020.
-
10
20
30
40
50
60
70
2006 2007 2008 2009 2010 2011 2012 2020P
Inve
stm
ent (
$ Bi
llion
s)
PV
Wind

2
lose a significant portion of their primary investment benefit, which will magnify the need for new sources of capital.
1.2 Tax Benefit History The U.S. government currently supports RE deployment through a series of tax policies. These policies can generally be categorized into:
• Tax credits, either through production tax credits (PTCs), which are historically available to wind, geothermal, and biomass technologies, and investment tax credits (ITCs), which are historically available to solar, fuel cell, and small wind technologies.
• Accelerated depreciation benefits, provided through the 5-year Modified Accelerated Cost Recovery System, relative to a straight-line depreciation method over a longer period.3
When combined, these are called tax benefits and represent approximately 50%–55%4 of a project’s installed cost. Generally, RE project developers do not have sufficient taxable income to directly take advantage of the tax benefits (without having to “carry them forward,” which reduces their value at the time of investment) (Mendelsohn and Harper 2012). Accordingly, maximizing the tax benefit requires that the project either include third parties—known as tax equity investors—in the financial structure, or be developed by large entities that have taxable income—known as tax appetite—from other business ventures.
Structuring projects to attract tax equity investors has proven to be a time-consuming and expensive process, requiring extensive legal, engineering, and environmental due diligence analysis. And though a rating agency will conduct similar due diligence on the assets that comprise a security, the uniformity of the securitized assets and the large volume of assets pooled in the security will likely lower the per-unit due diligence costs (Schwabe et al. 2012). Further, tax equity investment is highly specialized because it requires investors who, among other things:
• Have a substantial current and future tax liability
• Have the financial acumen to engage in a complex project structure
• Are willing to hold their ownership interests in the projects for several years
• Are able to invest in illiquid assets that tie up cash and cannot easily be resold
3 5-year Modified Accelerated Cost Recovery System is not a benefit to RE projects alone, as the tax code allows for many asset classes to depreciate the cost of the asset over a shorter period than the life of the asset. 4 Based on a 7% unlevered “real” discount rate typical of a private investor (10% nominal). Also, values referenced are based on the gross benefit of depreciation. The outlay from the government is arguably only the net difference between a nonaccelerated straight-line depreciation schedule (representing about 16% of initial capital costs) and the accelerated depreciation schedule (representing about 25% of initial capital costs).

3
• Are sufficiently sophisticated to account for a shifting tax policy environment in their investment decisions (Mendelsohn and Harper 2012).
This list of requirements constrains the supply of tax equity, increases the required yield, and, in effect, negates some of the value of the tax benefits.5 The complexity of tax-equity-based finance has limited the number of tax equity investors to fewer than 20, and the amount of tax equity to $3–$6 billion per year for the entire RE industry, over the past several years (Mendelsohn and Harper 2012). The limited supply of tax equity essentially caps the number of RE projects that are deployed.
1.3 Financial Vehicles To Access Public Capital Many parties in the RE industry are seeking financial innovations that can greatly expand the availability and lower the cost of capital (Morris 2012; Schwabe et al. 2012). Chester et al. (2011) and other researchers have found that the RE industry6 would benefit significantly from the availability of “public market capital,” or investments that are made through financial vehicles that are procured, sold, and priced on open markets, such as:
• ABSs. ABSs pool assets and resell the cash flows into various risk-defined tranches. Examples include mortgage-backed securities as well as securities from pools of auto loans, credit card debt, student loans, and a myriad of other cash flows (see Figure 2).
• Debt products. Examples include government-issued bonds, covered bonds (Covered Bond Investor 2013),7 collateralized debt obligations, and similar structures.
• MLPs. MLPs are tax advantaged because they are pass-through entities; thus, their income is not taxed at the corporate level. These structures are specifically available to energy and mineral extraction and transportation concerns, but are currently not open to solar and wind technologies.
• Real estate investment trusts (REITs). Pools of income producing “real property” such as shopping malls, commercial offices, and apartment buildings. Similar to MLPs, REITs are generally not taxed at the corporate level as long as distribution criteria are met.
The cost of public capital can range (required yield) from a few basis points over U.S. Treasuries to the low double-digit range, depending on the risk of:
• The pooled credit; for example, of power purchasers or those who lease equipment
• The value and liquidity of any collateral; for example, car titles
5 Structuring public capital vehicles is also expensive and time-consuming, but can be applied to a much larger pool of projects, thereby distributing the set-up fees and lowering the costs to individual projects. 6 Primarily, this benefit is perceived for the residential, commercial, and industrial markets, and less so for utility-scale development wherein each project is highly specialized. 7 Covered bonds are debt securities backed by cash flows from mortgages or public sector loans.

4
The performance of the asset (if applicable)
The tranche being invested in (see Table 1).
For example, the top-rated tranche for an auto loan ABS may be rated AAA and carry a “spread” over relevant Treasuries of 10–15 basis points. U.S. Treasuries trade in durations of 6 months and 1, 3, 5, and 20 years. A securitization vehicle can be indexed off the Treasury that is closest in duration to the life of the underlying asset.
Table 1. Cost of Capital, Market Size, and Investors— Tax Equity Versus Public Market (U.S. Only) 7F
8
Cost of Capital
(Indicative)
Market Size— Securities Outstanding
(billions of dollars)
Tax equitya
Utility-scale, unlevered 7%–10% N/A (approximately 20 firms, mostly financial)b Levered 12%–18%
Public capital vehicles
Mortgage-backed securitiesc 3%–7% $13,200
ABS (non-mortgages)d 3%–7% $2,150
Debt productse 3%–7% $31,200
MLPsf 5%–9% $338
REITsg 7%–12% $579 a Smith (2013) b Mendelsohn and Harper (2012) c Board of Governors of the Federal Reserve System (2012) d Gorton and Metrick (2011)
e Includes bonds only, not bond or loan aggregations such as collateralized debt obligations (Bank for International Settlements (2009) f National Association of Publicly Traded Partnerships (2012) g National Association of Real Estate Investment Trusts (2012)
All combined, these public capital vehicles enable trillions of dollars in investment for a wide array of assets. Because of the breadth, maturity, and liquidity of these markets, they might be extended to RE asset portfolios relatively quickly and efficiently.
Certain criteria must be met for these markets to form. Schwabe et al. (2012) found that although accessing public markets may be a viable pathway to expand the capital base, a lack of data, standardization, and scale currently inhibits that opportunity. Specifically, the report showed:
8 See Appendix A for discussion of pre-tax versus post-tax return.

5
• The lack of historical, publicly available data addressing RE risks—including system production, customer defaults, and operations and maintenance costs—is one of the greatest challenges in engaging untapped capital.
• There is no homogeneity among financial transactions for renewables, which greatly increases structuring costs and the due diligence requirements for each investment.9
A heterogeneous pool of contracts or evaluation practices would require a potential investor (e.g., a pension fund) to comprehend and model the wide array of risk factors, a seemingly impossible task for a securitization pooling thousands of assets.10 Standardized components and contracts11 increase the visibility of the relevant risks and encourage a high degree of investor confidence, particularly if rated by a credit rating entity. Projects that “conform” to industry standards in the manner they are designed, built, and contractually arranged are far more likely to be included in a securitization pool, but initiating practice of those standards can require significant industry and investor coordination (see Table 2).12
Table 2. Comparison of Qualities Beneficial for Securitization Between Different Sectors
Housing Automobiles RE Generating Assets
Long lived asset Yes 3–7 years 20–30 years Asset depreciation No Yes—quickly Yes—slowly
Contracted cash flows Yes (with mortgage)
Yes (with loan or lease)
Yes (with loan, lease or PPA)
1.4 Securitization Fundamentals Securitization transforms illiquid financial assets (e.g., a solar lease contract) into tradable investment products.13 Potential investors in solar securities may include institutional investors, private wealth,14 and sovereign investment funds. These investor classes (together referred to as untapped capital sources) held about $105 trillion in global assets under management in 2011, but have traditionally not invested in U.S. RE projects (TheCityUK 2012). Insurance funds and private equity—shown in Figure 2—
9 The National Renewable Energy Laboratory and DOE are working to solve these problems by making data available to assess the risks in RE investment and organizing the solar industry to standardize documents and create homogeneity among financial transactions. 10 A partial exception to this generality are mortgage-backed securities which often aggregate thousands of loans from properties in multiple states, different kinds of loans (fixed/floating rate, interest-only, or balloon amortization schedules, 15/30 year, first/second lien, mortgages/home equity lines of credit, different credit ratings, and indebtedness metrics). 11 Contracts that can be standardized include, but are not limited to, PPA contracts or leases, site control documents, and “interconnection agreements,” which dictate how RE projects interact with the electricity grid. 12 The National Renewable Energy Laboratory was recently awarded a 3-year contract by DOE to build consensus among developers, financiers, public capital investors, utilities, and others on standard contracts and other components to enable access to public capital. 13 Securities may be tradable formally—i.e., via an open exchange, or informally through bilateral negotiations such as private placement debt. 14 Including private “family foundations” and direct stock ownership by households.

6
currently invest in RE projects, and thus were excluded from the calculation of untapped capital sources, although securitized RE assets would likely improve the investment opportunity for these entities as well. Of the untapped capital sources, 46% is invested in the United States.
Figure 2. 2011 Global assets under management, in $ trillion (hatched excluded from calculations)
Source: TheCityUK
To put that value in perspective, if $1 of every $1,000 (0.1%) of the untapped capital sources went toward U.S. RE projects, it would result in about $105 billion in incremental investments, more than three times total U.S. solar investment to date, roughly equal to the total wind investment over the past 10 years, or 15 times the maximum annual level of tax equity invested in the wind and solar industries over the last several years.
For additional perspective, by the end of 2012 an estimated $3.4 billion will be invested in third-party-owned residential PV systems ($1.8 billion in 2012 alone), generating approximately $93 million in lease/PPA payments per year (EIA 2012a; Barbose et al. 2011; GTM/SEIA 2012a, 2012b, 2013; DOE 2011; CSI Database 2013).15 This value represents about 0.003% of all untapped capital sources.
Recent investment activities also suggest significant interest in public capital investment in renewables. Warren Buffett’s MidAmerican Energy Holdings (MidAmerican) offered a public issuance for the 550-MW Topaz Solar Farm in California. The bond offering for
15 Calculation based on lease/PPA payments equal in value to the average U.S. residential retail rate of $0.1186, with a capacity factor of 15.5%. Key assumptions for $3.4 billion third-party investments: residential system ASP2012 second quarter reported price; residential installations (2006–2009; third-party ownership (assumed same percentage of market, by capacity).
0 10 20 30 40
Private Wealth
ETFs
Hedge funds
Private equity
Sovereign Wealth
Mutual funds
Insurance funds
Pension funds
Global Assets under Management ($ trillions)
Non-Conventional Assets
Conventional Assets

7
$850 million was oversubscribed by more than $400 million and analysts expect the company to issue another round for additional project funds (Doom and Bhayar 2012). The success of the bond issuance indicated that high-quality solar projects can attract low-cost capital from investors. Importantly, however, various market analysts attributed the success to the strong balance sheet of MidAmerican and the confidence in Warren Buffett and his Berkshire Hathaway investment fund (Lowder 2012).16
Securitization offers the opportunity to expand low-cost capital to smaller projects, projects developed by smaller developers and/or developers with less financial backing. Securitization also offers the potential to open the asset class to a wider array of investors who seek investment through a liquid, tradable product.
In securitization, assets are standardized and then pooled so that small ownership shares can be easily procured, traded, and priced (Jobst 2008) (see Figure 3). Standardization requires common contractual documents, value appraisals, or other protocols to ensure uniformity among the pooled assets. Beyond industry organization and data gathering, the government can play a role in adoption of standardized contracts and other protocols by making available credit enhancements, which may also speed and broaden access to the securitization and other public capital markets. See text box, Government Credit Enhancements To Support Access to Public Capital (see page 10).
Figure 3. Conceptual overview of asset securitization
When properly designed, securitization offers a range of potential benefits to the security owner, including:
16 The DOE loan guarantee did not provide credit or other support to the Topaz project.

• A dividend yield
• Low risk through the diversity of the underlying assets
• High liquidity with many potential buyers and sellers
• Consistency through standardized documentation
• Price transparency by the public market as opposed to confidential bilateral negotiation.
Certain securitization mechanisms have incremental risk specialization capabilities. For example, ABSs are generally configured into different “tranches,” or segmented slices of the investment, each with a different risk level and credit rating (see Figure 4). The highest rated (lowest risk) tranche is paid first. The second-highest rated tranche is paid after the first tranche is fully paid, and so on. Investors can invest in a specific tranche based on their risk comfort and reward expectation.
Figure 4. Hypothetical solar ABSs
As evidenced in the financial crisis of 2008–2009, these instruments can be highly volatile, and a poor evaluation of underlying asset values or cash flow certainties can lead to misperception of the investment risks. The industry will need to address quality assurance considerations for securitized RE assets to ensure long-term success.
Other financial vehicles that can tap public capital markets, such as MLPs and REITs, are not securitization vehicles per se, but accomplish a similar goal to enable ownership shares through a liquid, tradable, low cost of capital product that is priced by the market. These vehicles are not currently available to invest directly in RE asset portfolios. MLPs are open to energy extraction and transportation industries only, and thus, do not extend
8

9
to solar and wind assets (Coons 2012).17 REITs are not technically available to solar and wind assets, as these technologies have not been recognized as real property by the Internal Revenue Service (IRS) (Feldman et al. 2012).18
MLPs and REITs generally have simpler structures than ABSs; the shares of a given MLP or REIT generally all have equal value (other than for managers of the portfolio). In other words, these structures do not share ABS’s ability to differentiate the riskiness of each project in their portfolio through tranches, (see Figure 4). Instead, these structures represent equity ownership shares in projects held by the financial vehicle and managed by the vehicle’s managers.
17 In 2012, Senator Chris Coons of Delaware introduced the Master Limited Partnership Parity Act, which would, among other things, extend the definition of assets includible in MLPs to solar and wind technologies. 18 As of the publication of this paper, several companies have requested private letter rulings by the IRS to broaden the definition of real property to include solar assets.

10
Government Credit Enhancements to Support Access to Public Capital
Federal, state, and local governments can provide credit enhancements to RE investments to support the transition from traditional financing structures to the application of public capital vehicles. Credit enhancements represent a variety of investment support structures that are generally designed to leverage modest public investment to garner significant private (market) investment. Three possible strategies are:
• “First loss” reserve. An insurance product offered by the government to a pool of projects; it is the first source of capital to take a loss (last to be paid).
• Coinvestment with private equity. The government invests in RE projects alongside private investments. The government has an equal risk to other equity investments.
• Mezzanine investment. The government invests in RE projects and is repaid before equity investors but after lenders.
These strategies can greatly reduce the risk perception among investors, reduce yield requirements, and provide valuable experience to nascent forms of securitization (see Figure 5). Credit enhancements may also represent a valuable incentive by which to spur adoption of standardized contracts and installation best practices that may improve the opportunity for success in the securitization vehicles.
Government investment in public capital credit enhancements can be a low-risk strategy because renewable energy generation projects are backed by long-term contracts. They often also carry other guarantees from the developer, equipment manufacturer, and construction entity. See Mendelsohn (2011).
Source: Deutsche Bank Climate Change Advisors, 2011
Repa
ymen
t Pos
ition
“First Loss” reduces risk exposure of other
equity investors
In “Co-Investment”, public and private equity
are equally ranked
“Mezzanine” Investment reduces amount of
private equity required
Debt
Private Sector Equity
Public First Loss Investment
Debt
Public Mezzanine Investment
Private Sector Equity Investor
Debt
Public Co-Investment
Private Sector Equity
Figure 5. Credit enhancement structures

11
1.5 Access to Public Markets as Part of Normal Technology Maturation
Technologies and investment vehicles have a pace of maturation. The solar industry, for example, has increased dramatically in scale, both nationally and internationally, and consistent with early phases of historical technology adoption, the cost of solar facilities—particularly for PV modules—has decreased dramatically (see Figure 6).
Figure 6. U.S. solar PV deployment and price, by year
Source: NREL
Wind technology cost and deployment trends have been mixed because of constraints in manufacturing, PTC availability, and other factors (Wiser et al. 2012) (see Figure 7). Wind component shortages (caused by increased demand) and larger turbine size (to take better advantage of poorer quality wind sites) increased the overall cost of wind turbines between 2006 and 2009 (DOE 2012a). The wind development market has also ebbed and flowed with the availability of the PTC. For example, the looming expiration of the PTC at the end of 2012 spurred a significant increase in development for that year but also caused the development pipeline to contract for 2013.
0.0
0.5
1.0
1.5
2.0
2.5
3.0
3.5
$0
$3
$6
$9
$12
2006 2007 2008 2009 2010 2011 2012
Annu
al U
.S. I
nsta
lls (G
W)
2011
$/W
att D
C
Annual U.S. PV Capacity Additions
Capacity Weighted Average Installed Cost, Solar

12
Figure 7. U.S. wind deployment and price, by year
Sources: DOE 2012a; AWEA 2013
Of course, wind and solar technologies are still in the early phases of overall market penetration, providing about 2% of U.S. electricity (EIA 2012b; Mendelsohn 2012).19
Beyond adoption of the technology, the financing generally goes through a parallel cycle of maturation from high-risk/high-cost/low-liquidity investment to a low-risk/low-cost/high-liquidity investment. During this cycle, initial access to capital can be very difficult, and investment is often spurred by government support structures such as direct grants and loan guarantees. As technologies mature into early commercialization phases, private funding and project finance are frequently deployed to capitalize deployment. Project finance—the currently dominant form of capitalizing RE facilities—often transitions to more widely available and lower cost public capital markets.
Customer procurement of products has evolved through similar levels of maturation. Loan products for upfront capital investments, such as homes, automobiles, and college education, have evolved over time. Individual financial arrangements (loans) were created to enable market procurement, thus expanding adoption. As the markets continued to mature, institutional financial options evolved (e.g., GMAC financing for purchasers of General Motors cars), allowing for the pooling and securitization of individual financial arrangements. This greatly expanded the availability of financial capital. Auto loans, for example, expanded from initial securitization of $0.9 billion in 1980 to about $127 billion in 2010 (see Figure 8) (Gorton and Metrick 2011, Table 1).20
19 The Annual Energy Outlook includes all renewable sources of electricity except hydro and biomass. The value of solar is likely underestimated, as EIA reports PV systems only 1 MW or larger and those that are voluntarily reported. 20 Auto loan ABS peaked at $234 billion in 2003.
0
4
8
12
16
$0
$1
$2
$3
$4
2006 2007 2008 2009 2010 2011 2012
Annu
al U
.S. I
nsta
lls (G
W)
2011
$/W
att A
C
Annual U.S. Wind Capacity Additions
Capacity Weighted Average Installed Cost, Wind

13
Figure 8. Auto loan ABS issuances and yield
Auto loan ABS has historically provided a yield—as required in the markets—of approximately 1% over 1-year U.S. Treasury bills, a primary index for the cost of capital. The primary exception to this yield spread was during the financial crisis of 2008–2009.
Public capital vehicles have several attributes that might be attractive to investors, including:
• Diversity of investment through pooled assets
• Liquidity (marketability) of the security once procured
• Transparency of the market price through public trading. These benefits reduce the risk of individual projects and allow public capital vehicles to raise capital at a lower cost (or yield) than private investments. Thus, access to public capital can generally lower the associated required return on investment, and therefore the cost of energy, for a given RE project.
1.6 Incompatibilities of Tax Equity and Public Capital Tax benefits are frequently monetized through tax equity investors: third-party entities that have the means and capabilities to use these incentives. Compensation to the tax equity investors—for their investments that represent about 50%–60% of the initial capital costs—will often comprise some of the tax benefits and an allocation of the cash flow generated by the project. Specific details will be negotiated by the sponsor (also called the developer), the tax equity investor, and the lender (to the extent there is debt held by the project).
To take advantage of the tax benefits, the tax equity investor must not be a closely held C corporation or is required by law to either:
• Maintain “active” ownership, which requires a continuing obligation to share losses
0
20
40
60
80
100
120
(2.0%)(1.0%)0.0%1.0%2.0%3.0%4.0%5.0%6.0%
Billi
ons (
$)
Auto ABS Issuance
Class A Tranche Spread Over 1-Year U.S. T-Bill

14
• Apply the benefits against “passive losses,” which generally represent rental or other passive income.21
Investments through pension funds, mutual funds, and similarly managed assets do not meet the definition of active ownership, nor do they usually have the passive losses from realty income and similar investments to take advantage of the tax benefits.22 Accordingly, it is very difficult to apply public market capital to the tax benefit portion of an RE project. However, public market capital can be invested to monetize the cash flows of a RE project.
In essence, although the tax benefits represent a critical support structure for the success of RE deployment, they can also preclude other forms of financial innovation, including the development of investment vehicles designed to tap the public capital markets. The situation raises several important public policy questions, discussed in Section 2, about the effectiveness of alternative public support structures.
21 Income through traditional stocks and bonds does not represent “passive” or “active” income but rather “portfolio” income. 22 MLPs and REITs are not structured to pass along tax benefits. REITs distribute dividends to shareholders not income and thus cannot take advantage of losses. REITs also cannot pass through the ITC. Losses generated by MLPs can only be used by the same MLP, and thus constrain their application.
15
2 Application of Public Capital to Renewable Energy Projects
Public capital can be applied via two basic methods that could open this type of investment to RE deployment:
1. As part of the “initial capital stack,” representing an original source of capital funding. There are two ways to use this method and still take advantage of the tax benefits.
A. Replace project debt (from commercial lenders) with public capital that has a lower capital cost23
B. Replace equity (either sponsor or tax) after the tax benefits expire or diminish (post-2013 for wind, and post-2016 for solar).24
2. As “take-out financing,” which would procure the remaining interest of a tax equity investor once the tax benefits are fully utilized (and the project is allowed to be sold without recapture penalty by the IRS).
2.1 Public Capital as Part of the Initial Capital Stack Public capital can be applied as a component of a project’s initial investment when it is placed in service. For example, if bank debt were replaced by debt raised through public markets, it could expand the availability and lower the cost of such debt (potentially by several hundred basis points).
Public capital could be raised either in the form of equity in projects pooled within a securitization vehicle (such as MLPs and REITs or a corporate stock equity) or debt associated with the lease payments or power purchases (e.g., ABS and debt products). This opportunity is particularly relevant after current tax credit regulations terminate. Specifically, the PTC is set to expire for large wind projects that have not yet begun construction by December 2013; in 2017 the ITC is reduced from 30% to 10% for solar projects and some other RE generation technologies (DSIRE 2013).25 Without these tax-based incentives, an RE project’s predictable, pre-tax cash flows could look very similar to other asset classes that have received investments through public markets, such as auto loans, mortgages, or consumer credit, because they produce predictable, long-term cash flows that are available for distribution.
2.2 Public Capital as “Take-Out Financing” Take out financing represents the opportunity to refinance part of the capital stack, particularly tax equity investment, through the securitization vehicle referred to as public
23 Project debt can be fairly inexpensive, but is constrained by a smaller investment pool. Replacing public capital for project debt may provide primary benefit of expanding quantity of capital rather than lowering its required yield. 24 While public capital can replace tax equity before the tax benefits expire or diminish, as discussed above, it may not be able to utilize these benefits. 25 The PTC continues until 2014 for landfill gas, biomass, geothermal, and municipal solid waste systems.

16
capital take-out (PCTO). The availability of a PCTO vehicle may have three unique benefits to a project:
• Tax equity investors—typically investment banks—generally seek short-term investments by which to reapply their capital. These entities generally do not want to hold assets for the life of the project. Accordingly, tax equity investors are likely to realize a significant benefit from the availability of a PCTO vehicle, which, in turn, may induce tax equity to be available at lower required yields, in greater quantities, or both. Similarly, project sponsors may desire some liquidity to reinvest in additional RE projects.
• By replacing expensive tax equity at the time of take out with lower cost public capital, the project may benefit from the lower overall cost of financing.26 That is, once the tax benefits have been fully utilized, the project may benefit from substituting public capital for tax equity, thereby lowering the required return from that point forward.27
• During the period when tax incentives are still in place, PCTO investments can establish a market for public investments in RE projects, thus providing a smooth transition once the tax incentives expire.
An analysis was performed to estimate the annual pipeline of potential RE projects that will be beyond their tax credit recapture period, from 2013–2017, and thus ideal for take-out financing from public capital.
Figure 9 shows that by 2017 20 GW of wind and solar projects will be past their recapture period and could be refinanced through public capital. Wind projects in 2013 alone could represent $10 billion in freed up capital for reinvestment.28
26 Lowering the cost of capital with take-out of financing will not necessarily have a direct effect on the negotiated purchase price of electricity on a per project basis. However, PCTO is likely to affect the overall availability of capital and in the long run has the potential to lower the initial cost of capital (in turn lowering the purchase price of electricity). 27 Tax equity investors must hold onto their asset through the entire period of tax credit claims or face recovery (also known as recapture or clawback) of the benefits by the IRS. 28 Assuming 5 GW of turbines at a cost of $2/W.

17
Figure 9. Potential pipeline for PCTO financing (i.e., cumulative U.S. RE projects that have passed recapture period) (GW)29
Data from DOE 2012a, GTM/SEIA 2013, and CSI 2013
29 Figure 9 represents all wind projects installed from 1998 that are no longer receiving PTC (10 years after asset was placed in service). Assets before 1998 were not included as they may be perceived as too old (or with too little time left on their PPA contracts) to repurchase. Solar values represent all utility-scale and third-party owned distributed PV projects from 2007 past the 5-year ITC recapture period. There was not significant utility-scale or third-party owned PV deployment before 2007.
0
2
4
6
8
10
12
14
16
18
20
22
2013 2014 2015 2016 2017
Cum
ulat
ive
Gig
awat
tsAC
Distributed PVUtility-scale PVWind

18
3 Levelized Cost of Energy Impact An analysis was conducted on the LCOE impact of public capital vehicles as part of this initial capital stack against current methods of financing solar and wind assets.30 ABSs were used to represent public capital inserted as debt and MLPs to represent public capital inserted as equity. Likely variations in possible financing costs were modeled to determine a range of possible LCOEs. The “high” scenarios assumed the upper end of likely debt and equity returns (and no use of the ITC for an MLP structure); the “low” scenarios assumed the lower end of likely debt and equity returns (and an ability to use the ITC for an MLP structure). (See Appendix B for a description of the range of inputs assessed.) Because the greatest cost impact is most likely to occur when the tax credits expire, wind was modeled for 2014 and solar for 2017.
The solar analysis was conducted for residential- and utility-scale projects, as these segments bracket the market in terms of installed cost and cost of capital, as residential projects generally carry higher yield requirements than utility scale.
All solar scenarios assumed the ITC declines from 30% to 10% in 2017. The ABS product was modeled as offering the following benefits over the traditional debt portion of the asset financing:
• Lower yield (benchmark values were assumed to decline from 7.5% to 5.5%)
• Longer tenor (from 12 to 20 years)
• Higher debt ratio (slightly more debt on the project, from 55% to 57%, consistent with coverage ratio requirements).31
The MLP product was modeled as offering the following benefits on the equity portion of the asset financing:
• Lower yield (benchmark values were assumed to decline from 11.7% to 6.0%)
• Higher equity ratios (from 45% to 100%, assumed full MLP ownership of the asset).32
The solar analysis in Figure 10 indicated savings of approximately 10% on benchmark cases were available to residential and utility-scale projects. Depending on the assumed starting and ending points, maximum savings greater than 30% may be available over time to the extent the securitization markets can increase comprehension and lowers yield requirements over successive issuance of securities.
30 As noted above, although we believe public capital has the potential to be used as take-out financing for RE projects, particularly in years when tax incentives are in place, its impact on the price of energy will be more indirect, and thus harder to model. 31 A debt service coverage ratio of 1.45x was assumed for all solar projects 32 MLPs would most likely use some form of debt, however not to improve the cost of capital but to better manage capital raises.

19
Figure 10. Comparison of LCOE between traditional financing and public capital financing (residential and utility-scale solar)33
Importantly, the systems modeled under "traditional financing" in Figure 10 are assumed to successfully access both tax equity and debt, which are difficult and time consuming to obtain. Currently, many projects must either forgo debt—as it is simply unavailable—and acquire funding from higher yield equity or simply fail due to lack of capital. The greatest benefit of successful access to capital markets might not be in reduced LCOE but in the ability to expand the scale and increase the speed of solar deployment. These benefits were not estimated.
Figure 11 displays the wind results for the public capital analyses conducted. Wind projects benefit more directly from available equity structures, reducing LCOE by 16% compared to only 8% for solar projects. This is because solar access to MLPs might constrain use of the ITC benefits for solar projects. Both wind and solar enjoy roughly 10% LCOE declines due to access to ABS or other debt products.
33 See Appendix B for a full list of assumptions.
$0.00
$0.04
$0.08
$0.12
$0.16
$0.20
TraditionalFinancing
DebtStructures(e.g., ABS)
EquityStructures(e.g., MLP)
TraditionalFinancing
DebtStructures(e.g., ABS)
EquityStructures(e.g., MLP)
Residential Solar - 2017 Utility-scale Solar - 2017
LCO
E Re
al ($
/kW
h)
LCOE Range
LCOE Benchmark

20
Figure 11. Comparison of LCOE between traditional financing and public capital financing (wind)34
34 See Appendix B for a full list of assumptions.
$0.00
$0.01
$0.02
$0.03
$0.04
$0.05
$0.06
$0.07
Traditional Financing Debt Structures (e.g., ABS) Equity Structures (e.g., MLP)
Wind - 2014
LCO
E Re
al ($
/kW
h)
LCOE Range
LCOE Benchmark
21
4 Conclusion Public capital markets offer the potential to reduce the cost of financing for renewable energy projects. Commonly used vehicles such as ABSs, MLPs, and REITs can be used to pool projects and access low-cost capital at substantially higher volumes than are currently applied to the RE industry.
The cost of energy from solar and wind projects, as measured by the LCOE, is projected to decline from access to public capital, when used to fund RE projects. Just as importantly, public capital may increase the availability of project funds significantly; something of vital necessity if expensive tax equity investments are to be replaced by cheaper forms of capital and to meet the required capital needed for significant expansion of installations consistent with DOE’s Sunshot Initiative and Wind Program goals (DOE 2012a; DOE 2012b).
Federal and state governments can play important roles in developing capital markets for RE. Encouraging standardization of documents has the potential to make investors more comfortable with RE investment and will to enable assets to be pooled into funds more easily. In the early development stages of RE securitization, credit enhancements offered by the government can remove some of the riskiness of the debt products to allow them to more easily go to market. This can give investors time to become more comfortable with these investments and their true underlying risks. Finally, rule changes by the IRS, with regards to REITs, and the passage of law, with regards to MLPs, can allow companies to be formed that can more easily tap investment vehicles that historically have been allowed only by other asset classes. REITs and MLP investors have invested billions of dollars in the real estate, energy transmission, and natural gas pipeline infrastructure (among others), which has allowed these industries to have tremendous growth; changes by the government may do the same for RE. By engaging more investors, lowering investment risks, and using more diversification and liquidity, securitization could greatly improve access to low-cost capital for wide-scale solar deployment.

22
References AWEA. (2013). AWEA U.S. Wind Industry Fourth Quarter 2012 Market Report. American Wind Energy Association. Accessed March 27, 2013: http://awea.org/learnabout/publications/reports/AWEA-US-Wind-Industry-Market-Reports.cfm.
Bank for International Settlements. (2009). Outstanding World Bond Market Debt. Accessed March 27, 2013: www.bis.org/statistics/secstats.htm.
Barbose, G.; Darghouth, N.; Wiser, R. (2011). Tracking the Sun IV: An Historical Summary of the Installed Cost of Photovoltaics in the United States from 1998 to 2010. Berkeley, CA: Lawrence Berkeley National Laboratory. Accessed March 27, 2013: http://eetd.lbl.gov/ea/ems/reports/lbnl-5047e.pdf.
Board of Governors of the Federal Reserve System. (2012). Mortgage Debt Outstanding, September 2012. Accessed November 12, 2012: www.federalreserve.gov/econresdata/releases/mortoutstand/current.htm
California Solar Initiative (CSI). Current CSI Data. Accessed March 13, 2013: www.californiasolarstatistics.ca.gov/current_data_files/.
Chester, J.; Fellerhoff, W.J.; Tan, M. (October 2011). “Financing Renewable Energy Projects and the Potential for Securitization.” Power Finance and Risk.
Coons, C. (2012). The Master Limited Partnerships Parity Act. Accessed March 27, 2013: http://www.coons.senate.gov/issues/master-limited-partnerships-parity-act.
Covered Bond Investor. (2013). Accessed March 27, 2013: http://www.coveredbondinvestor.com/about-0.
DOE. (2011). 2011 Wind Technologies Market Report. DOE/GO-102012-3472. Washington, DC: U.S. Department of Energy. Accessed March 27, 2013: www1.eere.energy.gov/wind/pdfs/2011_wind_technologies_market_report.pdf.
DOE. (2012a). SunShot Vision Study. DOE/GO-102012-3037. Washington, DC: U.S. Department of Energy. Accessed March 27, 2013: www1.eere.energy.gov/solar/pdfs/47927.pdf.
DOE. (2012b). 2011 Wind Technologies Market Report. DOE/GO-102012-3472. Washington, DC: U.S. Department of Energy. Accessed March 27, 2013: www1.eere.energy.gov/wind/pdfs/2011_wind_technologies_market_report.pdf.
Doom, J.; Buhayar, N. (2012). “Buffett Plans More Solar Bonds After Oversubscribed Deal.” Bloomberg. Accessed March 27, 2013: www.bloomberg.com/news/2012-02-29/buffett-plans-more-solar-bonds-after-oversubscribed-topaz-deal.html.

23
DSIRE. (2013). Database of State Incentives for Renewable Energy. Accessed March 21, 2013: www.dsireusa.org.
EIA. (October 2012a). Electric Power Monthly. Washington, DC: U.S. Energy Information Administration. Accessed January 28, 2013: www.eia.gov/electricity/monthly/current_year/October2012.pdf.
EIA. (2012b). Annual Energy Outlook, 2013 Early Release Overview. Accessed January 28, 2013: http://www.eia.gov/forecasts/aeo/er/index.cfm.
EIA. (December 2012c). EOP Task 1606, Subtask 3 – Review of Power Plant Cost and Performance Assumptions for NEMS. Prepared by SAIC Energy, Environmental & Infrastructure, LLC.
Feldman, D.; Mendelsohn, M.; Coughlin, J. (2012). The Technical Qualifications for Treating Photovoltaic Assets as Real Property by Real Estate Investment Trusts. Golden, CO: NREL. Accessed March 27, 2013: http://www.nrel.gov/docs/fy12osti/55396.pdf.
Gorton, G.; Metrick, A. (2011). “Securitization.” Yale University.
Jobst, A. (September 2008). “What is Securitization?” Finance and Development. International Monetary Fund. Accessed March 27, 2013: www.imf.org/external/pubs/ft/fandd/2008/09/pdf/basics.pdf.
Jordan, J.; Okongwu, C.; Sabry, F. (2008), “Study of the Benefits of Securitization: Preliminary Results.” Presented to American Securitization Forum.
Lowder, T. (2012); “MidAmerican Takes Solar Out to Wall Street.” Accessed March 21, 2013: https://financere.nrel.gov/finance/content/midamerican-solar-thin-film-utility-scale-project-Topaz-550-MW-megawatt-bond-financing.
Mendelsohn, M. (2012). “Where Did All the Solar Go: Calculating Total U.S. Solar Energy Production.” Accessed March 27, 2013: https://financere.nrel.gov/finance/content/calculating-total-us-solar-energy-production-behind-the-meter-utility-scale.
Mendelsohn, M.; Harper, J. (2012). §1603 Treasury Grant Expiration: Industry Insight on Financing and Market Implications.” TP-6A20-53720. Golden, CO: National Renewable Energy Laboratory. Accessed March 27, 2013: https://financere.nrel.gov/finance/publications.
Morris, J. (2012). “Renewable Energy-Backed Securities: Coming Soon to a Solar System Near You.” Accessed March 27, 2013: http://blog.rmi.org/blog_renewable_energy-backed_securities_coming_soon_to_a_solar_system_near_you.
National Association of Publicly Traded Partnerships. (2012). “Master Limited Partnerships 101: Understanding MLPs.”

24
National Association of Real Estate Investment Trusts. (2012). “REITWatch: A Monthly Statistical Report on the Real Estate Investment Trust Industry.”
Schwabe, P.; Mendelsohn, M.; Mormann, F.; Arent, D. (2012). “Mobilizing Public Markets to Finance Renewable Energy Projects: Insight from Expert Stakeholders.” Golden, CO: NREL. Accessed March 27, 2013: https://financere.nrel.gov/finance/publications.
SEIA and GTM Research. (March 2012a). “U.S. Solar Market Insight Report: Q4 2011 & 2011 Year-In-Review.”
SEIA and GTM Research. (March 2013). “U.S. Solar Market Insight Report: Q4 2012.”
SEIA and GTM Research. (September 2012b). “U.S. Solar Market Insight Report: Q2 2012.”
Smith, J. (2013); as published in “Cost of Capital: 2013 Outlook,” Project Finance Newswire; Chadbourne & Parke, LLP; February, 2013 Credit Suisse.
TheCityUK. (2012). “Fund Management, November 2012.”
USAID. (2009). “Public Capital Stimulates Investment in Clean Energy.” Washington, DC: US Agency for International Development. Accessed January 28, 2013: http://transition.usaid.gov/our_work/economic_growth_and_trade/energy/publications/stories/nicaragua_investment.pdf.
Wiser, R.; Lantz, E.; Bolinger, M.; Hand, M. (2012). “Recent Development in the Levelized Cost of Energy From U.S. Wind Power Projects.” Accessed March 27, 2013: http://emp.lbl.gov/publications/recent-developments-levelized-cost-energy-us-wind-power-projects.

25
Appendix A: Pre-Tax or After-Tax Returns A complicating facet of investment analysis is whether expected returns are evaluated on a pre-tax or an after-tax basis. Traditional public market investments, which have no tax benefits associated with investing, have pre-tax returns approximately 67% higher than their after-tax returns (based on an assumed 35% federal tax rate and an 8% state tax rate). The equation for this calculation is:
After tax return = pre-tax return*(1-combined federal and state tax rate)
Therefore, when looking at an investor’s cost of capital it is important to define whether it is before or after taxes. Investments in RE are typically evaluated on an after-tax return because tax incentives are received through project ownership; evaluating these projects on a pre-tax basis does not fully show all potential ownership benefits. However, when these tax benefits have been minimized or already used, investments in RE, like traditional public market investments, can be judged on a pre-tax basis.
This is further complicated when comparing the tax consequences of investments in traditional C corporations to REITs and MLPs. C corporations, in which tax-equity investors are most often classified, are taxed at the corporate level and then at the investor level, through capital gains and dividend taxes. REITs and MLPs pay no, or a minimal amount, of corporate tax, but dividends are usually treated as ordinary income. Finally, corporate income, ordinary income, and capital gains tax rates can vary depending on an individual’s or a corporation’s tax bracket. Because a multitude of factors can impact an investor’s return, it is important to understand the characteristics of a typical investor and the investor’s expectations for the specific investment.

26
Appendix B: Model Assumptions Three technologies (residential solar, utility-scale solar, and large wind) were modeled using three financial structures (traditional financing, ABS, and MLP). Each financial structure has three sets of assumptions: benchmark assumptions, a “high” scenario, and a “low” scenario. The arrangement of each financial structure is described briefly here:
Traditional financing. The asset is purchased and placed in service by equity investors. These are tax equity and sponsor equity investors with an after-tax return expectation, weighted by their percentage ownership in the project. Part of the project is purchased through private debt, which is refinanced after 12 years at a higher yield. Debt is sized to satisfy the given debt service coverage ratio (DSCR).
ABS. This scenario is identical to the “traditional financing” model, except that instead of private debt, debt is raised in the form of an ABS, which is never refinanced and is sized to satisfy the given DSCR.
MLP. The asset is purchased and placed in service by equity from the MLP. All funds are received through the MLP. The general partner of the MLP receives a partner’s fee.
Table B-1. Basic Assumptions
Residential Solar (2017)
Utility-Scale Solar (2017)
Large Wind (2014)
Capital cost ($/W) 2.85a 1.90a 1.755b
Capacity factor 16.2%c 20.87%d 33.6%e
Annual output degradation, % per annum 1.00%f 1.00% 0.30%
Operations and maintenance costs, $/kW-yr 32.80 f 22.20g 39.55 g
Federal ITC rate 10% 10% 0% a Represents straight-line cost reduction from SunShot Vision Study 2010 benchmarks of $6/W (residential) and $4/W (utility-scale) to 2020 SunShot goals of $1.50/W (residential) and $1/W (utility-scale). b Represents 2012 installed cost (see DOE 2011). c Capacity factor calculated by PVWatts (version 1) for a PV system in Kansas City, Missouri, with a derate of 0.84, azimuth of 180 degrees, and tilt of 25 degrees. d Capacity factor calculated by PVWatts (version 1) for a PV system in Phoenix, Arizona, with a derate of 0.87, azimuth of 180 degrees, and tilt equal to the latitude. e Capacity-weighted average capacity factor (see DOE 2011). f DOE 2012. g EIA 2012c.

27
Table B-2. Financial Assumptions
Traditional Financing ABS MLP
Bench High Low Bench High Low Bench High Low
Interest rate—initial term 7.5% 9.0% 6.0% 5.5% 7.0% 3.0% – – –
Interest rate—refinancing premium
2.0% 2.0% 2.0% – – – – – –
Initial debt term (yrs) 12 12 12 20 20 20 – – –
Refinancing term (yrs) 8 8 8 – – – – – –
Equity yielda 11.7% 15.0% 10.0% 11.7% 15.0% 10.0% 6.0% 8.0% 6.0%
General partner’s fee, % of total capital investment
– – – – – – 1.0% 1.0% 1.25%c
Portion financed through ITCb
– – – – – – – – Yesc
a The equity yield refers to different measurements, depending on the structure. In the case of “traditional financing” and “ABS” it refers to the project’s after-tax internal rate of return. In the case of the “MLP” it refers to earnings before income tax, depreciation and amortization (EBITDA) percentage of the asset’s initial investment. Revenues are sculpted to give a given EBITDA for each year, which are assumed to be distributed to MLP unit holders. b In the case of solar, an MLP is still eligible to receive the 10% ITC, however, because it does not affect the distributable cash, it has no value in the MLP model. If it could be monetized, it would have the potential to lower the LCOE. To estimate this value, the model assumes that 10% of the asset is financed directly through the ITC (and thus 90% by the MLP). The general partner’s fee is also increased to account for potential additional parties in the transaction. c Only for solar, not for wind. General partner’s fees in the wind scenarios are kept constant at 1%.

28
Table B-3. Debt/Equity % of Asset
Table B-4. Common Assumptions
Traditional Financing ABS MLP
Residential and Utility PV Bench High Low Bench High Low Bench High Low
Debt, % of asset 54.8% 56.9% 54.4% 57.3% 58.9% 58.5% 0.0% 0.0% 0.0%
Equity, % of asset 45.2% 43.1% 45.6% 42.7% 41.1% 41.5% 100% 100% 100%
Large Wind
Debt, % of asset 62.5% 64.7% 62.2% 65.4% 67.1% 66.9% 0.0% 0.0% 0.0%
Equity, % of asset 37.5% 35.3% 37.8% 34.6% 32.9% 33.1% 100% 100% 100%
Federal tax rate 35%
State tax rate 8%
Target DSCR 1.40
Residual (multiple of EBITDA) 6.0
Inflation 2.5%