financing the sustainable - cedlas.econo.unlp.edu.ar
TRANSCRIPT

Documento de Trabajo Nro. 211
Mayo, 2017
ISSN 1853-0168
www.cedlas.econo.unlp.edu.ar
Financing the Sustainable Management of Rwanda’s Protected Areas
Onil Banerjee, Martin Cicowiez, Thomas Ochuodho, Michel Masozera, Bernabas Wolde, Pankaj Lal, Sebastian Dudek y Janaki R.R. Alavalapati

1
Financing the Sustainable Management of Rwanda’s Protected Areas
Onil Banerjeea, Martin Cicowiez
b, Thomas Ochuodho
c, Michel Masozera
d, Bernabas Wolde
e,
Pankaj Lale, Sebastian Dudek
f and Janaki R.R. Alavalapati
g*
a Corresponding author
Inter-American Development Bank
Environment, Rural Development, Environment and Disaster Risk Management Division
1300 New York Avenue N.W.
Washington, D.C., 20577, USA
+1-202-942-8128
b Universidad Nacional de la Plata
Facultad de Ciencias Económicas
Calle 6 entre 47 y 48, 3er piso, oficina 312
1900
La Plata, Argentina
+54-221-4834901
c University of Kentucky
223 Thomas Poe Cooper Building
730 Rose St, Lexington, KY
40546, USA
+1-859-257-1770
d Wildlife Conservation Society
Box 1699, Gasabo
Kigali, Rwanda
e Montclair State University
1 Normal Avenue, Montclair, NJ
07043, USA
+1-540-449-9153
f RMGEO
65620 Island Road
Deer island, OR

2
97054, USA
+1-360-477-9047
g*
Project Principal Investigator
Auburn University
3301 Forestry and Wildlife Building
602 Duncan Drive, Auburn, AL
36849, USA
+1-334-844-1004
Acknowledgements
Funding support from the Science for Nature and People Partnership (SNAPP), a collaboration
of The Nature Conservancy, the Wildlife Conservation Society, the National Center for
Ecological Analysis and Synthesis (NCEAS), and Auburn University through a project
“Integrating Natural Capital into System of National Accounts”.
The Inter-American Development Bank, Climate Change and Sustainable Development
Division’s in-kind contribution to this research is kindly acknowledged.

3
Abstract
Rwanda’s Nyungwe National Park is a biodiversity hotspot with the most endemic species in the
ecoregion as well as the highest number of threatened species internationally. In addition to great
biological diversity, Nyungwe National Park supplies significant ecosystem services to the
Rwandan population including water provisioning and tourism services. Tourism in the Park has
strong potential for improving the sustainable management of the Park for continued provision of
natural habitat and critical ecosystem services. This paper explores quantitatively the economic
impacts of adjustment in Park visitation fees and tourism demand as a source of revenues to
improve Park tourism opportunities and ongoing operations and maintenance where budgetary
restrictions are particularly acute. The methods developed in this paper are novel in integrating
the results of stated preference techniques with regional economy-wide modelling approaches to
capture multi-sectoral, direct, indirect and induced impacts. Such methods have strong potential
for assessing revenue generation alternatives in other contexts where Park Managers are faced
with the need to generate additional revenue for sustainable park management while facing
diminishing budget allocations.
Keywords: Financing protected areas; economy-wide regional model; park fees; tourism
demand; stated preference; Rwanda.

4
1.0. Introduction
Nyungwe National Park forms part of the largest remnant of intact lower montane forest in
Africa and is an important conservation area within the Albertine Rift Valley biodiversity
hotspot. It is part of an eco-regional natural forest ecosystem known for the most diverse
endemic vertebrae in the African continent, the most endemic species in the ecoregion, and the
second highest number of threatened species internationally (Plumptre et al., 2007, Fischer and
Killmann, 2008). The Park is home to threatened or near-threatened primates, including
chimpanzees and owl-faced monkeys (Dowsett, 1990). Nyungwe National Park is also home to
over 300 bird species, including 16 endemics, and 75 different species of mammals. As
Rwanda’s primary water catchment area and to protect it from the encroaching threat of logging,
agricultural intensification and mining, Nyungwe was designated as a National Park in 2004
from its earlier status as a national reserve (Birnie et al., 2015).
Figure 1. Rwanda’s National Parks.
Source: Authors’ own elaboration based on Rwanda Ministry of Agriculture and Animal
Resources, Centre for Geographic Information Systems of National University of Rwanda data.
Nyungwe provides a range of critical ecosystem services to society and the economy. In terms of
water provisioning ecosystem services, Nyungwe generates 70% of Rwanda’s rainfall input in

5
the country’s principal river systems, including the Nyabarongo and Akagera river systems of the
southern Nile Basin to the east, and the Lake Kivu and Congo River systems to the west. The
Park plays a vital role in erosion control on the lower cultivated slopes surrounding the Park. The
densely-forested slopes in this area are responsible for regulating ecosystem services that reduce
the potential for flooding and act as a reservoir of nutrients for the economically important
agricultural areas downslope. The Park contributes to climate regulation both through its role in
carbon sequestration and in regulating rainfall patterns. Finally, its abundant plant diversity
supports pollination ecosystem services that drive agricultural productivity in the region
(Masozera et al., 2006).
In terms of cultural and aesthetic ecosystem services, tourism in Nyungwe makes important
contributions to the regional economy. Since becoming a National Park in 2004, visitation has
increased steadily from 2,386 in 2005 to 13,644 in 2016, representing 15% of total Park
visitation in Rwanda. Nyungwe has also experienced higher average annual growth in visitation
than Rwanda’s three other National Parks, Volcanoes, Akagera and Gishwati - Mukura National
Parks. Overall visitation is still lower, relative to those of Volcanoes and Akagera National Parks
which received over 32 thousand and 41 thousand visitors in 2016, respectively.
There are substantial opportunities for increasing the Park’s contribution to Rwanda’s economy,
and to do so in a sustainable way. In 2015, Park revenue was US$317,992, accounting for only
2.1% of Rwanda’s total tourism revenue. Projected tourism revenue, however, is expected to
increase by 61% by 2025 (WTTC, 2016) and Nyungwe is well poised to capture a greater share
of this growth. Certainly its natural features are like none other in the region with the oldest
continuous rainforests in the world and the best preserved montane rainforest in East Africa. The
recent introduction of two new lodges and the addition of a popular new attraction, the canopy
walk, have strengthened demand and are indicative of the scope and positive impacts new
tourism opportunities can have on visitation and tourism demand.
Despite the positive outlook for Park visitation, as a developing country, the resources the
Rwandan Government can allocate toward sustainable management of Nyungwe National Park
are limited given competing priorities for scarce public funds. To address this challenge,
Rwanda’s Development Board carried out a comprehensive strategic review of its protected area
management functions which led to consideration of Public-Private Partnership arrangements

6
between the Development Board and the private sector. Such arrangements have proven to be
successful in the management of Rwanda’s Akagera National Park.
Following this strategic review, the Rwandan Development Board commissioned the
development of a 10-year business plan, produced by Conservation Capital, which assessed the
status of Nyungwe’s conservation context and determined conservation priorities for the Park
(Birnie et al., 2015). The plan identified conservation management actions, potential revenue
generation models, as well as appropriate governance structures. The plan outlines the
investments that would be required to finance the improvements in Park recreational
opportunities, conservation and management, considering a first five-year development phase
followed by a consolidation phase that would continue into the foreseeable future. The first
phase would involve developing a management framework and implementing new management
operations, completing the requisite capital expenditures to support these operations, and
developing the structures for the commercial revenue flow system that would be expected to
mature during the second consolidation phase. The total cost of the plan over the ten-year period
is approximately US$16.1 million, with recurring annual operations and maintenance costs of
US$776,124.
Nyungwe National Park fees serve the dual role of a marketing tool and a revenue generation
tool to finance Park operations and management. The marketing function of the fees projects an
image of quality and exclusivity, as international visitors have shown strong preferences for a
quality experience related to Rwanda’s Park visitation. The revenue generation function is
critical for Park operations and maintenance; in the case of Volcanoes National Park, visitor fees
generate 75% of total Park revenues. The shortfall between revenues and costs is greater in the
case of Nyungwe National Park, and is usually supplemented with donor financing (Moore and
Baca, 2012).
With the investments proposed under the business plan, securing additional revenues for Park
management is a high priority issue on the Rwandan Development Board’s Agenda.
Demonstrating the potential economic contribution Nyungwe can make to regional development
can stimulate private sector investment and substantiate a business case for investing in the Park.
As in the case of Akagera National Park, there is significant scope for public-private partnerships
and new revenue generation models through the development and leasing of concession spaces

7
and educational centers. Demonstrating the development impact of such investment can also help
make a compelling case for development grant financing.
This paper contributes to the current debate by evaluating the regional economic impacts of
investing in improving the tourism opportunities and management of Nyungwe National Park.
We develop a regional computable general equilibrium model (RCGE) of Rwanda’s South and
West Provinces to evaluate the potential economic impacts from adjusting the current Park fee
structure and from increased tourism demand for Nyungwe arising from an enhanced tourism
experience. This paper is organized as follows. Section two reviews the importance of fee
structures for the sustainable management of protected areas and provides a review of a recent
study assessing consumer surplus for Nyungwe National Park. Section three presents the
methodology and provides an overview of the RCGE model. Section four describes the scenarios
implemented in the RCGE and presents the results. The paper closes with a discussion of how
the evidence generated here can support investment in Nyungwe National Park as a means of
stimulating regional development and the establishment of public-private partnerships for the
Park.
2.0. Financing Protected Area Management through Park Access and Activity Fees
Sustainable management of a national Park for nature-based tourism requires a delicate balance
between competing economic and environmental objectives. The value of the tourist visit
depends to large measure on the quality of the visitor experience which is closely related to
environmental quality. Analysis of visitor preferences at Nyungwe National Park in particular
has revealed strong visitor preferences for quality. Policies to increase Park visitation necessarily
must consider the carrying capacity of the ecosystems and how protected area visitation is
distributed over time. The use of Park entrance and activity fees are market mechanisms that
Park managers have to achieve this balance.
A well designed fee structure serves to regulate access, reduce congestion, and reduce
disturbance of the wildlife and other natural features that are the key assets of protected areas
(Cessford, 2000). At the same time, Park activity and entrance fees are important sources of
revenue for Park operations and maintenance as public budget allocations to protected areas is
commonly insufficient (Manning, 1999, Walpole et al., 2001, Whitelaw et al., 2014).

8
Furthermore, Park fees can help compensate for the opportunity cost of protected areas (Buckley,
2003).
The current fee structure at Nyungwe National Park has been shown to generate visitor
dissatisfaction. Since the Park was formally established, the number of activities available in the
Park has increased and the menu of options expanded. Currently, fees are a function of activity,
activity duration and visitor residency status, among other variables. The fee structure also has
caused issues for Park tour operators, particularly when there are unannounced changes in fees.
This can affect client relations as well as generate unnecessary uncertainty in operator financial
planning (Moore and Baca, 2012).
Determining the correct pricing structure for protected areas is a complex task requiring
consideration of revenue requirements for management and equitable Park access to all segments
of society. Understanding potential visitor responses to changing Park fee structures before
implementing changes is critical (More and Stevens, 2000, Kim and Crompton, 2002, Fix and
Vaske, 2007). Contingent valuation is a stated preference approach (Champ et al., 2003) that can
be used to determine how visitors would respond to changes in fee structures. Estimates of
tourist willingness to pay (WTP) can be used to estimate fee structures that ensure adequate
revenues while maintaining visitation rates at a desirable level.
In this study, we use estimates generated by Lal et al (2017) through a contingent valuation
exercise to estimate visitor WTP for improved Park features at Nyungwe National Park (Lal et
al., 2017). Lal et al (2017) surveyed 304 international tourists between February and July 2015.
This period includes part of the peak tourism season which facilitated access to potential
respondents. In addition to eliciting respondent Park use habits and standard demographic
information, respondents were asked which activities they participated in and the maximum
amount they would be willing to pay to engage in these activities.
Next, respondents were advised that there was a proposal to improve the quality of the visit to
Nyungwe National Park where the proposed improvements included improving Park protection
to increase the population of birds and primate species thus improving the probability of spotting
wildlife during a visit. Additional improvements would enhance the beauty of the waterfalls and
the nature walks with more rest areas and better trails. Respondents were asked to select from a

9
list of options which indicated the entry and activity fee that they would be willing to pay to
finance the Park improvements. For visitor residents of Rwanda, the mean WTP was US$6.15
for activities and US$4.66 for the entrance fee. For tourist non-residents, the mean WTP was
estimated as a 29% increase over the current fee structure. For the entrance fee, the WTP was
estimated at US$14.35. Table 1 shows the current and proposed fee structure based on Lal et al.
(2017). The proposed fee structure along with the estimated WTP for a Park entrance fee
represents potential new direct revenues that would result from adjusting the Park fee structure.
These direct benefits can contribute to financing the sustainability of current and future Park
operations and maintenance following an investment in Park improvements.
Table 1. Current and proposed activity fee in USD.
Activity Current fee New fee
Guided Nature Walk of Trails $ 40 $ 52
Guided Birding Walk $ 50 $ 65
Canopy Walkway Guided Hike $ 60 $ 77
Tropical Waterfall Guided Hike $ 50 $ 65
Congo Nile Trail Guided Hike $ 100 $ 129
Chimpanzee Tracking with Guides $ 90 $ 116
Other Primates Tracking with Guide $ 60 $ 77
Camping/Tent/Night Stay $ 30 $ 39
Source: Lal et al. (2017).
The Park improvements considered follow the valuation scenarios described in Lal et al (2017)
and the investments considered in the business plan for the Park (Birnie et al., 2015). The
business plan assessed Nyungwe’s natural values and determined priority lines of action for
conservation management. These lines of action included strengthening research, evaluation and
monitoring functions, maintaining the wilderness character of Nyungwe, increasing the natural
character of the buffer zones, restoring degraded habitats, and strengthening policy and advocacy
for the Park.
Threats were also identified in the plan, most of which were directly related to the livelihood
needs of inhabitants surrounding the Park. These threats included fire, invasive species,
agricultural expansion, wood-gathering, mining, poaching, and infrastructure development. To
combat these threats, priority lines of action included strengthening the community engagement
program, improving law enforcement, and building stronger relationships with government

10
authorities. To capitalize on the opportunities presented by Nyungwe National Park and allay the
perceived threats, the business plan proposed management actions that may be classified as Field
Operations and Central Project Management actions. For each line of action, objectives,
strategies and required resources were delineated. For Field Operations, major lines of action are:
(i) law enforcement; (ii) habitat and wildlife management; (iii) community engagement; (iv)
transport and logistics; (v) research, and; (vi) monitoring and evaluation.
Under Central Project Management, major lines of action are delineated as: (i) finance
management; (ii) general administration, compliance and human resources management; (iii)
commercial management; (iv) revenue collection; (v) risk management; (vi) stakeholder
management; (vii) donor management, and; (viii) policy development. The investment costs used
in this paper follow directly from the business plan and are estimated at US$16.1 million for the
first ten-years, followed by recurring annual operations and maintenance costs of US$776,124
(Birnie et al., 2015).
3.0. Methods
The tourism industry is not an isolated sector. Indeed, it is comprised of and has important
linkages with many sectors, ranging from the hotel and restaurant sector where it is dominant, to
food and beverages and transport, where its influence is also strong. Similarly, investments in
diverse sectors contribute to the development of tourism, from infrastructure development, the
provision of basic public services such as water and sanitation, and capacity building in the
services sector, to institutional strengthening in terms of tourism-sector governance.
Thus, to assess the economic impact of the many types of policy interventions, investments and
external shocks that might affect the tourism sector, a framework that considers all economic
sectors and their inter-linkages is essential (Dwyer, 2015, Banerjee et al., 2015). A computable
general equilibrium (CGE) model provides a systematic method for predicting both the direction
and approximate magnitudes of impacts of policies and external shocks on different economic
agents and institutions. What follows is an overview of the regional, tourism-extended, dynamic
RCGE model for Rwanda’s South and West Provinces developed to evaluate the direct, indirect
and induced impacts of investing in improving the visitor experience in Nyungwe, a restructuring

11
of the Park’s fee system and increased tourism demand. The RCGE model was developed for the
South and West Provinces since Nyungwe National Park straddles both of these provinces.
3.1. A Dynamic Computable General Equilibrium Model for Rwanda’s South and West
Provinces
The RCGE model developed here combines a relatively standard recursive dynamic CGE model
(Lofgren et al., 2002, Robinson et al., 1999) with a tourism-specific extension. The tourism
extension follows (Banerjee et al., 2016, Banerjee et al., 2015) and contains additional equations
and variables where one can define: (i) the domestic and foreign tourism demand; (ii) different
modalities of tourism supply and demand, and; (iii) the impact of public capital investment in
infrastructure on sectoral productivity.
Given the regional character of the model developed here, it is customized to account for: (i)
trade between the modeled region and the rest of the country and the rest of the world, and; (ii)
local and central government operations in the modeled region (i.e., tax collection and current
and capital spending). In summary, compared to other RCGE models, the one developed here
provides a combination of policy-relevant features for the study of tourism investment or policy
counterfactual scenarios in a regional economy. Figure 2 depicts, for each simulation period, the
circular flow of income within the regional economy and between this regional economy and the
rest of the country and the rest of the world.
The major building blocks of the RCGE model for Rwanda’s South and West Provinces can be
categorized as: activities (producers of commodities), markets for commodities (goods and
services); markets for factors (labor, land and capital stock) and five institutions: households,
government, the rest of the country, the rest of the world, and foreign tourists. As shown, foreign
tourism is a source of income and foreign exchange earnings for the modeled region. In
applications of the RCGE, the blocks depicted are disaggregated; the disaggregation used in the
current application is shown in table 2.
12
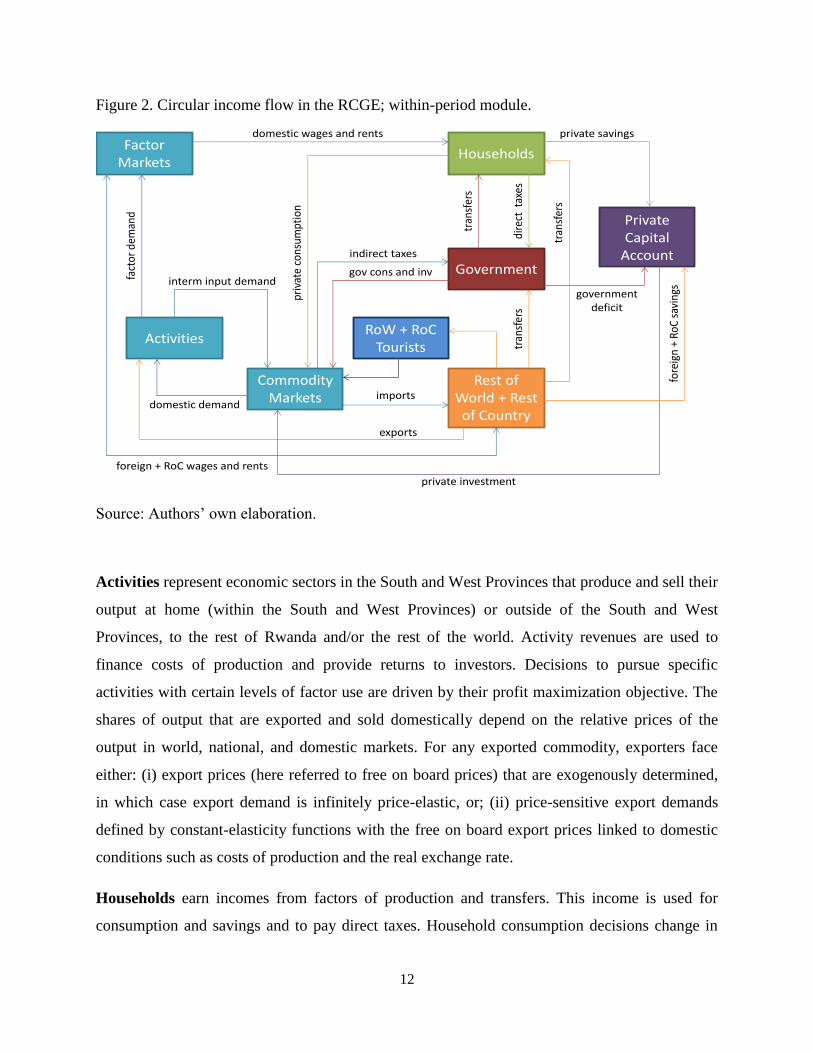
Figure 2. Circular income flow in the RCGE; within-period module.
Source: Authors’ own elaboration.
Activities represent economic sectors in the South and West Provinces that produce and sell their
output at home (within the South and West Provinces) or outside of the South and West
Provinces, to the rest of Rwanda and/or the rest of the world. Activity revenues are used to
finance costs of production and provide returns to investors. Decisions to pursue specific
activities with certain levels of factor use are driven by their profit maximization objective. The
shares of output that are exported and sold domestically depend on the relative prices of the
output in world, national, and domestic markets. For any exported commodity, exporters face
either: (i) export prices (here referred to free on board prices) that are exogenously determined,
in which case export demand is infinitely price-elastic, or; (ii) price-sensitive export demands
defined by constant-elasticity functions with the free on board export prices linked to domestic
conditions such as costs of production and the real exchange rate.
Households earn incomes from factors of production and transfers. This income is used for
consumption and savings and to pay direct taxes. Household consumption decisions change in
Factor Markets
Activities
Households
CommodityMarkets
Rest of World + Restof Country
Government
PrivateCapital
Account
domestic wages and rentsfa
ctor
dem
and
foreign + RoC wages and rents
domestic demand
exports
imports
interm input demand
priv
ate
cons
umpt
ion
gov cons and inv
indirect taxes
private savings
tran
sfer
s
tran
sfer
s
tran
sfer
s
dire
ctta
xes
fore
ign
+ Ro
Csa
ving
s
governmentdeficit
private investment
RoW + RoCTourists

13
response to income and price changes. By design and as a constraint imposed by the household
budget, the value of household consumption is equal to its income net of direct taxes and
savings.
The government receives revenue from taxes and transfers from abroad, and uses these for
consumption, to transfer to households, and for investment, drawing on the loanable funds
market for supplementary funding. To remain within its budget constraint, the government
adjusts its spending according to available receipts or mobilizes additional receipts to finance its
spending plans.
The rest of the country institution represents income flows from the South and West Provinces
to and from the rest of the country to the South and West Provinces.The rest of the world
account represents income flows to the Rwanda and from Rwanda and are those that appear in
the balance of payments. This account sends foreign currency to the Provinces in the form of
transfers to its government and households. The Provinces use these inflows to finance their
imports. It is assumed that the balance of payments clears meaning that inflows and outflows are
equalized through adjustments in the local real exchange rate (the ratio between the international
and domestic price levels), influencing export and import quantities and values in foreign
currency.
The private capital account for the South and West Provinces provides investment financing
from savings by households, the government, the rest of the world and the rest of Rwanda.
Tourism demand from the rest of the world and the rest of Rwanda can be modeled as an
exogenous volume or using constant elasticity of demand functions. In the latter case, the South
and West Provinces face downward-sloping demand curves for their tourism exports. In both
cases, total tourism demand is disaggregated across locally produced commodities using fixed
coefficients. Equations 1 and 2 show the demand functions used to model tourism export demand
from the rest of the world and the rest of Rwanda, respectively.
These relationships in the model are described by the following equations:
irowt
EXRPQ
EXRPQqtrowQTROW
c
cicic
,
00,,
eqn’ 1

14
iroct
CPIPQ
CPIPQqtrocQTROC
c
cicic
,
00,,
eqn’ 2
where
c = tourism-related commodities such as hotels and restaurants
i = tourism demand modalities such as tourist and business visitors
icQTROW , = Rest of the World (RoW) tourism type i demand quantity of commodity c
icQTROC , = Rest of Country (RoC) tourism type i demand quantity of commodity c
cPQ = composite commodity price for c
CPI = consumer price index
EXR = exchange rate
icqtroc
, = baseline RoC tourism type i demand quantity of commodity c
icqtroc
, = baseline RoW tourism type i demand quantity of commodity c
iroct , = constant price elasticity of RoC tourism demand (< 0)
irow, = constant price elasticity of RoW tourism demand (< 0)
As shown, constant elasticity of demand functions are used to model tourism export demand
from the rest of the world and the rest of the country. In addition, within domestic and foreign
tourism demand, the model allows for the identification of one or more tourism demand
modalities (i.e., see index i in equations (1) and (2)).1 In equation (1), foreign tourist demand is a
function of local tourism-related prices relative to the exchange rate. In equation (2), national
tourist demand is a function of local tourism-related prices relative to the consumer price index.
Note that although tourists from the rest of Rwanda do not need to change currencies, a real
exchange rate exists between any specific region of Rwanda that is being modeled and the rest of
the country. This regional exchange rate is defined as the ratio between regionally tradable and
non-tradable commodities such as housing.
1 For example, index i in equation (1) can refer to tourists from different countries.

15
In domestic commodity markets, flexible prices ensure balance between demand and supply.
Import prices in most cases would be exogenous, but the assumptions of the model can be
adjusted for cases where their prices are endogenous; for example, where a large increase in
imports from a specific region of the country could push up prices. The share of imports in the
national market is determined by their international prices relative to domestic prices. In factor
markets, demand curves are downward-sloping reflecting the responses of production activities
to changes in factor prices.
In the case of labor, unemployment is endogenous. For each labor type, the model assumes an
inverse relationship between the real wage and the unemployment rate (Blanchflower and
Oswald, 2004, Blanchflower and Oswald, 1994). The model allows for different assumptions
about labor mobility in response to wage differentials between Rwanda and outside the country
and between one region and another within Rwanda. For non-labor factors, the supply curves are
vertical in any single year: that is, their quantity is fixed, but price adjusts according to the level
of demand.
In this RCGE, national income growth over time is largely endogenous and the economy grows
as capacity expands which is determined by net fixed capital formation, labor force growth, and
improvements in total factor productivity which have both endogenous and exogenous
components. The endogenous determinants of total factor productivity include the levels of
government capital stock and economic openness. The accumulation of private and government
capital is through investment financed by local and external savings. Increased private capital is
allocated across sectors according to their relative profitability. Once installed, capital becomes
sector-specific and can only be adjusted through exogenously-determined depreciation and the
attraction of new investments.

16
Table 2. Accounts in the South West Regional SAM
Category Sector Category Sector
Primary Food crops Services continued Realestate
*(6) Export crops Technological services
Livestock Support services
Forestry Government
Fisheries Education
Mining Health
Manufacturing Processed food Factors Other services
*(8) Beverages and tobacco prod *(6) Labor
Textiles Capital
Wood products Land
Chemicals, rubber and plastic Livestock
Non-metallic mineral prod Natural resources
Machinery and equipment Taxes Commodity taxes
Other manufactures *(3) Import taxes
Services Electricity Direct taxes
*(15) Water Institutions Households
Construction *(4) Government
Repairs Rest of Country
Trade Rest of World
Transportation Savings and investment Tourism
Hotel and restaurant *(4) Savings
Telecommunications Non-government investment
Financial Government investment
Source: Authors’ own elaboration based on the Social Accounting Matrix for the South and West
Provinces of Rwanda (2011).
The basic accounting structure and much of the underlying data required to implement the RCGE
model is based on the Social Accounting Matrix (SAM) developed for Rwanda’s South and West
Provinces. A SAM is a comprehensive, economy-wide statistical representation of the economy
at a specific point in time. It is a square matrix with identical row and column accounts, where
each cell in the matrix shows a payment from its column account to its row account. It can be
used for descriptive purposes and is the core database input for a CGE. Major accounts in a
standard SAM match the main building blocks of the CGE as described above: activities,
commodities, factors used in production, and institutions such as households, government, and
the rest of the world/country. Table 2 shows the main accounts in the SAM while table 3
provides a snapshot of the economy of Rwanda’s South and West Provinces.

17
Table 3. Macro indicators for South and West Provinces; millions of 2011 USD.
Source: Authors’ own calculations based on the SAM for the South and West Provinces of
Rwanda (2011).
Gross regional product (GRP) for the South and West is equal to US$2.6 billion which is
equivalent to approximately 41% of national Gross Domestic Product (GDP). Imports into the
two provinces are slightly greater than exports at US$982 million and US$753 million,
respectively. Total supply must balance with demand and is equal to US$3.58 billion. Regional
tourism demand, much of which can be attributed to Nyungwe National Park, is US$115 million.
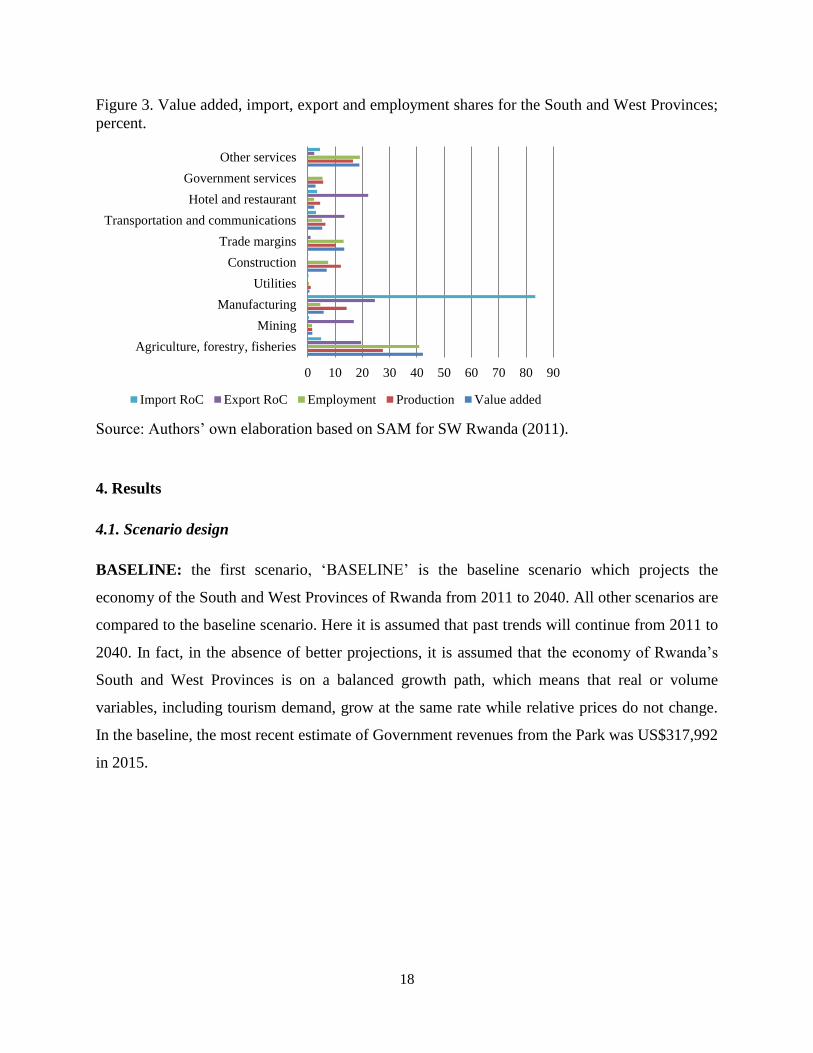
Figure 3 shows the sectoral structure of the South and West Provinces of Rwanda. In this region,
the hotel and restaurant sectors most closely related to tourism are responsible for 2.4% of value
added and 2.3% of employment. The strongest value added sectors are the agriculture sector
(42% of value added), followed by other services (18.9%), commerce and trade (13.4%) and
construction (6.9%); employment shares are similar to value added shares. Exports to the rest of
the country are highest for manufacturing, hotel and restaurants and agriculture (24.6%, 22.1%
and 19.6%, respectively). Imports from the rest of the country are outweighed by manufacturing
exports with an 83.4% import share.
Item USD
Demand
Private consumption 1,806
Government consumption 419
Fixed investment 492
Exports 753
Tourism demand 115
Total demand 3,584
Supply
Gross Regional Product 2,603
Imports 982
Total supply 3,584
18
Figure 3. Value added, import, export and employment shares for the South and West Provinces;
percent.
Source: Authors’ own elaboration based on SAM for SW Rwanda (2011).
4. Results
4.1. Scenario design
BASELINE: the first scenario, ‘BASELINE’ is the baseline scenario which projects the
economy of the South and West Provinces of Rwanda from 2011 to 2040. All other scenarios are
compared to the baseline scenario. Here it is assumed that past trends will continue from 2011 to
2040. In fact, in the absence of better projections, it is assumed that the economy of Rwanda’s
South and West Provinces is on a balanced growth path, which means that real or volume
variables, including tourism demand, grow at the same rate while relative prices do not change.
In the baseline, the most recent estimate of Government revenues from the Park was US$317,992
in 2015.
0 10 20 30 40 50 60 70 80 90
Agriculture, forestry, fisheries
Mining
Manufacturing
Utilities
Construction
Trade margins
Transportation and communications
Hotel and restaurant
Government services
Other services
Import RoC Export RoC Employment Production Value added

19
Figure 4. Visitors to Nyungwe National Park and additional Park revenue with new fee structure;
(2011 USD).
Source: Authors’ own elaboration. Data source: Lal et al (2017) and RDB (2015).
The primary y-axis of figure 4 shows the number of visitors to Nyungwe National Park. In 2010,
non-resident and resident visitors to the Park were 4,930 and 839 visitors, respectively. With the
short time series of observations for visitor numbers, a conservative approach is taken to
projecting growth in Park visitation by imposing a linear trend line on the data. In this scenario,
no assumptions are made about an increase in the number of tourists as a result of any
investments or improvements made in the Park. By 2040, the number of Park visitors is 16,581
and 5,231 for non-resident and resident visitors, respectively. The projection of the number of
non-resident visitors and the product of the activity fee increase and the entrance fee represent
the increase in government revenue derived from the change in fee structure (secondary y-axis).
INVEST: The second scenario, ‘INVEST’ simulates the Government investment in improving
Park tourism opportunities and management. This scenario increases government expenditure
100,000
150,000
200,000
250,000
300,000
350,000
400,000
0
2,000
4,000
6,000
8,000
10,000
12,000
14,000
16,000
18,000
Ad
dio
nta
l p
ark
rev
enu
e (U
SD
)
Nu
mb
er o
f v
isit
ors
Non-resident visitor Resident visitor Additional revenue

20
and investment by US$2,015,035 per year from 2018 to 2022, and by US$776,124 annually
thereafter.
ACTFEE: The third scenario ‘ACTFEE’, simulates the increase in the activity fee for non-
resident visitors to the Park. This is equivalent to US$90,281 in 2018 and, driven by the
business-as-usual growth rate in visitors, it is equal to US$189,780 by 2040. Since the estimated
willingness to pay for activities was linked to Park improvements, this scenario also includes the
investment described in the INVEST scenario. The Rwandan Government, as the Park manager,
is the recipient of the activity fee.
ENTFEE: The fourth scenario ‘ENTFEE’, simulates the establishment of an entrance fee to the
Park for non-resident visitors. In 2018, this is equal to US$82,804 and, driven by the business-as-
usual growth rate in visitors, reaches US$180,684 by 2040. Since the estimated willingness to
pay for entrance to the Park was linked to Park improvements, this scenario also includes the
investment described in the INVEST scenario. The Rwandan Government, as the Park manager,
is the recipient of the entrance fee.
DEMAND: The fifth scenario ‘DEMAND’, simulates a 10% increase in tourism demand
resulting from improvements in Park tourism opportunities. The increase begins gradually in
2018 and reaches 10% in 2022. This scenario also includes the INVEST scenario which is
reasoned to be largely responsible for this increase in demand. This increase in demand, although
above baseline demand, is still conservative given tourism demand projections made elsewhere
(Lal et al., 2017, Moore and Baca, 2012).
COMBI: The sixth scenario is ‘COMBI’ which simulates the INVEST, ACTFEE, ENTFEE and
DEMAND scenarios simultaneously. As depicted in figure 4, the new fee structure generates an
additional US$173,085 in direct government revenues in 2018 and reaches US$370,464 by 2040.
At the macro level, the RCGE model requires the specification of the equilibrating mechanism
for three macroeconomic balances. For the non-base scenarios these are:
(i) The impact on the government fiscal balance is cleared through changes in income tax
rates on households. This assumption ensures that the simulations are budget neutral; that
is, there is no additional domestic and/or foreign financing beyond baseline values.

21
(ii) Private investment in the South West region follows an exogenously imposed path; given
this path, adjustments in savings from the rest of Rwanda clear the savings-investment
balance; and
(iii) The real exchange rate adjusts to equilibrate inflows and outflows of foreign exchange,
by influencing export and import quantities. That is, the simulations are neutral in terms
of changes in regional net foreign assets. The non-trade-related payments of the (local)
balance of payments (transfers and foreign investment) are non-clearing, following
exogenously imposed paths.
In addition, given the regional character of the model, a mechanism is required to clear the
current account of the balance of payments between the South and West Provinces and the rest of
Rwanda. Specifically, it is assumed that the real exchange rate is flexible with respect to the rest
of Rwanda, with equilibrium achieved through changes in the price of local non-tradable
commodities. In other words, prices for non-tradable commodities are region-specific, while for
tradable commodities the local price is a weighted average of the price of three different
varieties: local commodities, commodities from the rest of Rwanda, and commodities from the
rest of the world.
4.2. Scenario Results
Figure 5 shows the way in which the activity fee and the imposition of an entrance fee are
transmitted in the model and how they impact key economic indicators. The increased fees are
transferred to the Government account which increases government savings. An increase in
government savings enables greater levels of non-government investment. At the same time, the
Park fee payments cause a small appreciation of the exchange rate which negatively impacts
exports from the South and West Provinces while imports increase.
Figure 5. Activity and entrance fee transmission pathways in the RCGE model.
Source: Authors’ own elaboration
↑park fee payments by
foreign tourism↓real exchange rate ↓exports and ↑imports
↑gov savings ↑non-gov investment

22
Figure 6 shows how in the INVEST scenario, the new Government investment is transmitted
through the economy. In this scenario, there are three main mechanisms at work. Panel A
describes how the increase in tourism infrastructure that arises from the investment generates
increased government demand for goods and services. This represents the purchase of goods and
services that are required to improve the tourism opportunities within Nyungwe National Park.
Construction services, for example, are a key economic sector stimulated as a result of the
investment. This increased demand for goods and services produces increased demand for
factors of production including labor which pushes wages up, unemployment down, and results
in greater household income, consumption and well-being.

23
Figure 6. Panel A. Government investment transmission pathways in the RCGE model.
Panel B.
Panel C.
Source: Authors’ own elaboration.
Panel B shows the impact of the Government investment in generating additional tourism
infrastructure and capital stock. This increase in capital stock results in an increase in tourism
factor productivity which directly produces faster economic growth and boosts gross regional
product. Panel C describes the impact of increased foreign borrowing to finance the investment.
New foreign borrowing to finance Park improvements increases the stock of foreign debt. The
large influx of investment capital leads to exchange rate appreciation rendering exports less
competitive and imports more appealing as was the case with the activity and entrance fee
transmission mechanism.
Figure 7. Tourism demand transmission pathway in the RCGE model.
Source: Authors’ own elaboration.
Figure 7 describes how the increase in foreign tourism demand is transmitted through the RCGE
model. With increased tourist arrivals and/or expenditure, there is an increase in demand for
tourism-related goods and services which includes hotels, restaurants and transportation among
↑gov inv tourism infra↑final demand
(construction svc)
↑wages and
↓unemployment↑hhd income
↑hhd cons and sav
↑gov inv tourism
infra↑infra capital stock ↑sector-specific TFP ↑GRP
↑foreign debt stock
↑gov inv tourism infra ↑gov foreign borrowing ↓real exchange rate ↓exports and ↑imports
↑foreign tourism ↓real exchange rate ↓exports and ↑imports
↑dem tourism-related
svc
↑wages and
↓unemployment↑hhd income ↑hhd cons and sav
24
other goods and services. This increased demand is transmitted through the economy by
increasing the output from these and related sectors and at the same time, increasing demand for
factors of production including labor. This increased demand results in higher wages, reduced
unemployment and greater household consumption, savings and well-being. At the same time,
the increase in tourism demand contributes to an appreciation of the exchange rate which renders
exports less competitive and imports more appealing for the South and West Provinces.
Figure 8 shows the difference from baseline values in 2040 for key macroeconomic indicators. In
the baseline by 2040, GRP would grow to US$10.7 billion. Clearly, it is the DEMAND scenario
that would drive results with a GRP impact of US$9.5 million. The investment itself is second in
terms of its impact, and would increase regional product by US$1.28 million (INVEST scenario).
The activity fee and the entrance fee would increase GRP by US$1.30 million, though the
investment makes the larger contribution in this scenario. The GRP impact of ENTFEE would be
similar to that of ACTFEE (US$1.30 million).
Figure 8 shows that in the COMBI scenario, imports from both the rest of Rwanda and the rest of
the world would increase by US$6.88 million and US$56.52 million, respectively. Exports in the
COMBI scenario would also tend to fall from both the rest of Rwanda and the rest of the world,
by US$9.69 million and US$28.51 million, respectively. It is the appreciation of the real regional
exchange rate that would make exports less competitive and imports more appealing across
scenarios. Absorption would increase by US$32.77 and GRP by US$9.57 million.

25
Figure 8. Macro-indicators, difference from baseline by 2040; millions of USD (2011).
Source: Authors’ own elaboration based on modelling results.
Figure 9 shows cumulative value added of sector output. Value added would increase across
most sectors with the exceptions of the agriculture, forestry and fisheries, mining, and
manufacturing sectors. These sectors are the most export-oriented and thus would be the most
heavily impacted by the real exchange rate appreciation. The hotel and restaurant sector would
grow the most, by US$167.4 million in the COMBI sector, followed by other services (US$70
million) and trade and commerce (US$50.1 million).
Singling out the investment impact on the regional economy, the other services sector,
construction and trade and commerce would be those most stimulated by the Government
investment (US$8.8 million, US$5.8 million and US$5.3 million, respectively). This is due to the
fact that both the construction and trade/commerce sectors are the mainstays of the public
sector’s capital stock. Increased consumption of government services on the other hand are a
function of increased Government purchasing.
Absorption
Private consumption
Fixed investment
Government fixed investment
Government consumption
Exports RoW
Imports RoW
Exports RoC
Imports RoC
Gross regional product
Millions of USD
COMBI DEMAND ENTFEE ACTFEE INVEST

26
Figure 9. Cumulative value added between 2040 and baseline; millions of USD (2011).
Source: Authors’ own elaboration based on modelling results.
In this analysis, equivalent variation is used as the measure of changes in household welfare
(Banerjee et al., in review.). Equivalent variation is the change in household income at current
prices that a change in prices would have on household welfare if income were held constant. In
other words, where an intervention does not occur, equivalent variation is the amount of income
an individual would have to be given to make them as well off if the intervention did take place.
Impacts on equivalent variation are shown in figure 10. It is the COMBI scenario, followed
closely by the DEMAND scenario, that would result in the greatest positive welfare impact. By
the end of the period, welfare would increase by US$31.7 million in COMBI and US$31 million,
US$1.17 million, US$1.18 million and US$1.05 million in DEMAND, ENTFEE, ACTFEE and
INVEST, respectively.
-200.0 -150.0 -100.0 -50.0 0.0 50.0 100.0 150.0 200.0
Agriculture, forestry, fisheries
Mining
Manufacturing
Utilities
Construction
Trade and commerce
Transportation and communications
Hotel and restaurant
Government services
Other services
Millions of USD
COMBI DEMAND ENTFEE ACTFEE INVEST

27
Figure 10. Welfare impacts expressed as equivalent variation; millions of USD (2011).
Source: Authors’ own elaboration based on modelling results.
The net present value of each scenario was calculated using a discount rate of 12%. The net
present value for the INVEST, ACTFEE, ENTFEE, DEMAND and COMBI scenarios would be
equal to US$10.61 million, US$11.33 million, US$11.29 million, US$92.69 million and
US$103.59 million respectively.
5.0. Conclusions and Discussion
In this paper, an RCGE for the South and West Provinces of Rwanda was developed to evaluate
the regional economic impacts of an investment in improving the tourism opportunities in
Nyungwe National Park, an adjustment to the Park fee structure, and the impact of increased
tourism demand. The methods developed here can be applied to other contexts where Park
Managers are faced with the need to generate additional revenue for sustainable park
management while facing diminishing budget allocations. Results of this analysis show that
overall, increases in Park activity fees and imposing an entrance fee have a small relative impact
when compare to the regional economic impact of investment in the Park visitor experience and
increased tourism demand.
The investment in Park improvements alone would generate an increase of US$1.28 million in
gross regional product, while the increased fees, together with the investment impact, would
increase regional product by US$1.30 million. It was the increase in tourism demand that would
0
5
10
15
20
25
30
35M
illi
on
s o
f U
SD
INVEST ACTFEE ENTFEE
COMBI DEMAND

28
drive the overall regional economic impact and would raise regional product by US$9.5 million.
Fee adjustments, investment and increased tourism demand taken together would lift regional
product by US$9.57 million while the overall increase in household well-being would be
US$31.7 million.
Evaluating the transmission channels through which the scenarios impacted regional economic
development, the reasons for the small impact arising from the fee adjustment are evident.
Imposing an entrance fee and adjusting the current Park activity fee structure would result in an
increase in the direct transfer of resources from foreign tourists to the Rwandan Government, as
the manager of Nyungwe National Park. While these additional resources may be made available
for Park operations and maintenance, they would not permeate the regional economy in any
significant way, nor would they produce second-round economic impacts and spill-overs. Where
the investment in Park tourism opportunities is concerned, there would be increased Government
consumption of the goods and services required to improve the visitor experience in Nyungwe
National Park. This increased consumption would stimulate greater output and demand for
factors of production including labor which would push up regional wages, reduce employment
and increase household income, consumption and well-being. These effects would be largely
absent in the case of adjustments to the Park fee structure.
In the case of a conservative increase in tourism demand, the aforementioned effects would be
amplified. The increase in tourism demand would generate an increase in the production of a
broader set of goods and services consumed by tourists than those demanded by the Government
in the investment scenario. More demand for goods and services from multiple sectors would
increase economic activity which would be catalyzed by stimulating a greater number of
backward and forward sector linkages characteristic of tourism-related sectors. With greater
direct, indirect and induced benefits, household welfare would also improve markedly with
heightened tourism demand.
What this analysis highlights is that if the Government of Rwanda is interested in generating
higher revenues for investing in Nyungwe National Park and to offset Park operations and
maintenance, an emphasis on Park fees may be misguided. Though the results presented in Lal et
al (2017) show that there is a willingness to pay for improved Park services, in terms of overall
economic impact and revenue generation, adjusting fees would have a small marginal effect.

29
On the other hand, this analysis demonstrated that efforts to increase tourism demand for
Nyungwe National Park, potentially through communications and marketing of the new
opportunities available in the Park, would be justified as a strategy for generating additional
revenues for investments in the Park and its ongoing operations and management. The flow on
regional economic impacts and spill-overs arising from greater tourism demand would have a
significant impact on the regional economy, wages, employment and household well-being. This
increase in regional economic output would generate additional tax revenues which could be
used for investment in the Park and its operations and maintenance. While issues of Park
ecological and managerial carrying capacity must be considered, current rates of visitation are
low and there is significant scope to expand Park visitation before such limits are reached.
Of course for such a strategy to be successful, it would be necessary for the increased tax
revenue arising from greater tourism demand be allocated to the Park. While this would require
more complex political maneuvering and involve more institutions and stakeholders than would
a simple adjustment to the Park fee structure, the overall economic impact of increased tourism
demand would compensate for potential increased transaction costs, generating a win-win
outcome for Nyungwe National Park management and the Government of Rwanda.

30
References
BANERJEE, O., CICOWIEZ, M. & COTTA, J. 2016. Economics of tourism investment in data scarce
countries. Annals of Tourism Research, 60, 115-138.
BANERJEE, O., CICOWIEZ, M. & GACHOT, S. 2015. A quantitative framework for assessing public
investment in tourism – An application to Haiti. Tourism Management, 51, 157-173.
BANERJEE, O., CICOWIEZ, M. & MOREDA, A. in review. Reconciliation Once and For All: Economic Impact
Evaluation and Social Cost Benefit Analysis. Annals of Tourism Research.
BIRNIE, N., DAVIES, G., RICE, M. & MCLUCKIE 2015. Nyungwe National Park, Rwanda: Business Plan and
Recommendations for a Public-Private Co-Management Partnership. London: Conservation
Capital.
BLANCHFLOWER, D. G. & OSWALD, A. J. 1994. Estimating a Wage Curve for Britan: 1973-90. Economic
Journal, 104, 1025-43.
BLANCHFLOWER, D. G. & OSWALD, A. J. 2004. Well-Being Over Time in Britain and the USA. Journal of
Public Economics, 88, 1359-1386.
BUCKLEY, R. 2003. Pay to Play in Parks: An Australian Policy Perspective on Visitor Fees in Public
Protected Areas. Journal of Sustainable Tourism, 11, 56-73.
CESSFORD, G. R. 2000. Identifying Research Needs for Improved Management of Social Impacts in
Wilderness Recreation. In: MCCOOL, S. F., COLE, D. N., BORRIE, W. T. & O’LOUGHLIN, J. (eds.)
Wilderness Science in a Time of Change Conference: Wilderness as a Place for Scientific Inquiry.
Missoula: US Department of Agriculture, Forest Service, Rocky Mountain Research STation.
CHAMP, P. A., BOYLE, K. J. & BROWN, T. C. 2003. A primer on nonmarket valuation, Dordrecht; Boston,
Kluwer Academic Publishers.
DOWSETT, R. J. 1990. Survey of the Fauna and Flora of Nyungwe Forest, Rwanda. Tauraco Research
Report No. 3.
DWYER, L. 2015. Computable General Equilibrium Modelling: An Important Tool for Tourism Policy
Analysis. Tourism and Hospitality Management, 21, 111-126.
FISCHER, E. & KILLMANN, D. 2008. Illustrated Field Guide to the Plants of Nyungwe National Park
Rwanda. Koblenz Geographical Colloquia, Series Biogeographical Monographs 1.
Oberreifenberg: Koeltz Botanical Books.
FIX, P. J. & VASKE, J. J. 2007. Visitor Evaluations of Recreation User Fees at Flaming Gorge National
Recreation Area. Journal of Leisure Research, 39.

31
KIM, S.-S. & CROMPTON, J. L. 2002. The Influence of Selected Behavioral and Economic Variables on
Perceptions of Admission Price Levels. Journal of Travel Research, 41, 144-152.
LAL, P., WOLDE, B., MASOZERA, M., BURLI, P., ALAVALAPATI, J., RANJAN, A., MONTAMBAULT, J.,
BANERJEE, O., OCHUODHO, T. & MUGABO, R. 2017. Valuing visitor services and access to
protected areas: The case of Nyungwe National Park in Rwanda. Tourism Management, 61, 141-
151.
LOFGREN, H., HARRIS, R. L., ROBINSON, S., THOMAS, M. & EL-SAID, M. 2002. A Standard Computable
General Equilibrium (CGE) Model in GAMS. Washington, D.C.: IFPRI.
MANNING, R. E. 1999. Studies in Outdoor Recreation: Search and Reserach for Satisfaction, Corvallis,
Oregon State University Press.
MASOZERA, M. K., ALAVALAPATI, J. R. R., JACOBSON, S. K. & SHRESTHA, R. K. 2006. Assessing the
suitability of community-based management for the Nyungwe Forest Reserve, Rwanda. Forest
Policy and Economics, 8, 206-216.
MOORE, J. & BACA, M. 2012. Optimization of Activities Fees for Improved Visitor Satisfaction in
Nyungwe National Park. Kigali: USAID.
MORE, T. & STEVENS, T. 2000. Do User Fees Exclude Low-Income People from Resource-based
Recreation. Journal of Leisure Research, 32.
PLUMPTRE, A. J., DAVENPORT, T. R. B., BEHANGANA, M., KITYO, R., EILU, G., SSEGAWA, P., EWANGO, C.,
MEIRTE, D., KAHINDO, C., HERREMANS, M., PETERHANS, J. K., PILGRIM, J. D., WILSON, M.,
LANGUY, M. & MOYER, D. 2007. The biodiversity of the Albertine Rift. Biological Conservation,
134, 178-194.
ROBINSON, S., YUNEZ-NAUDE, A., HINOJOSA-OJEDA, R., LEWIS, J. D. & DEVARAJAN, S. 1999. From
stylized to applied models: - Building multisector CGE models for policy analysis. North American
Journal of Economics and Finance, 10, 5-38.
WALPOLE, M. J., GOODWIN, H. J. & WARD, K. G. R. 2001. Pricing Policy for Tourism in Protected Areas:
Lessons from Komodo National Park, Indonesia
Política Tarifaria para el Turismo en Areas Protegidas: Lecciones del Parque Nacional Komodo,
Indonesia. Conservation Biology, 15, 218-227.
WHITELAW, P. A., KING, B. E. M. & TOLKACH, D. 2014. Protected areas, conservation and tourism –
financing the sustainable dream. Journal of Sustainable Tourism, 22, 584-603.
WTTC 2016. Travel and Tourism Economic Impact 2016, Rwanda. London: World Travel and Tourism
Council.