financing the response to hiv in low- and middle-income countries: how it is affected by the...
TRANSCRIPT
Financing the response to HIV in low- and middle-income countries: how it is affected by the economic crisis?
Robert Greener
July 20, 2011
Summary of Presentation
• What was the effect of the economic downturn in low and middle-income countries?– On economic growth– On resources available for HIV
• What is the financing challenge?• What are the potential sources for
increased and sustainable investment?
Summary of Presentation
• What was the effect of the economic downturn in low and middle-income countries?– On economic growth– On resources available for HIV
• What is the financing challenge?• What are the potential sources for
increased and sustainable investment?
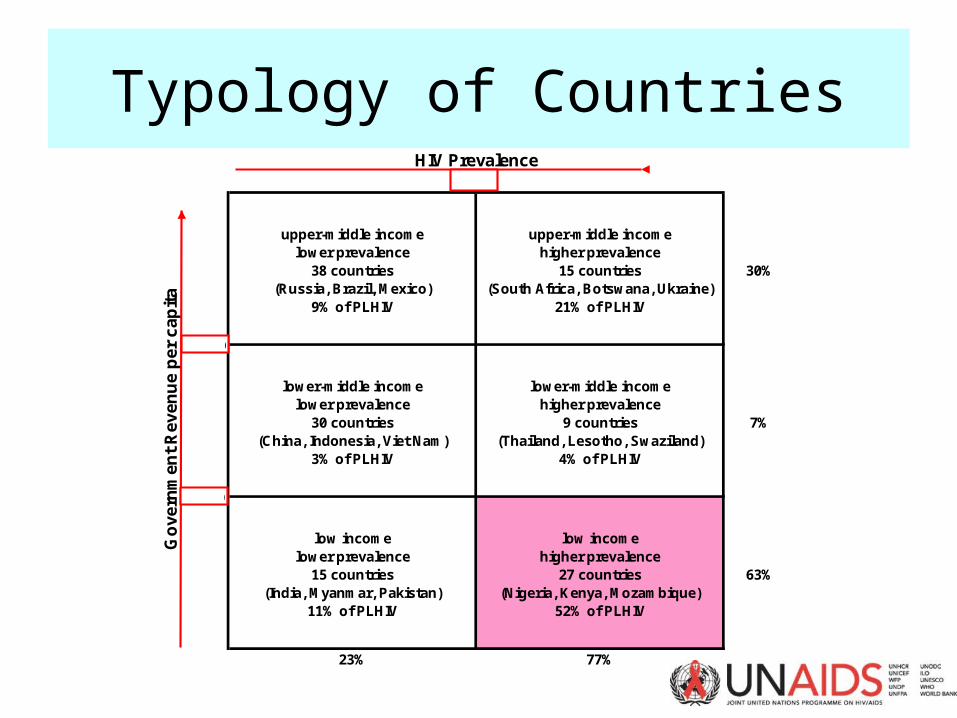
Typology of Countries
upper-middle incomelower prevalence
38 countries(Russia, Brazil, Mexico)
9% of PLHIV
upper-middle incomehigher prevalence
15 countries(South Africa, Botswana, Ukraine)
21% of PLHIV
30%
lower-middle incomelower prevalence
30 countries(China, Indonesia, Viet Nam)
3% of PLHIV
lower-middle incomehigher prevalence
9 countries(Thailand, Lesotho, Swaziland)
4% of PLHIV
7%
low incomelower prevalence
15 countries(India, Myanmar, Pakistan)
11% of PLHIV
low incomehigher prevalence
27 countries(Nigeria, Kenya, Mozambique)
52% of PLHIV
63%
23% 77%
HIV PrevalenceG
ove
rnm
en
t R
eve
nu
e p
er c
apit
a1%
$1150
$250
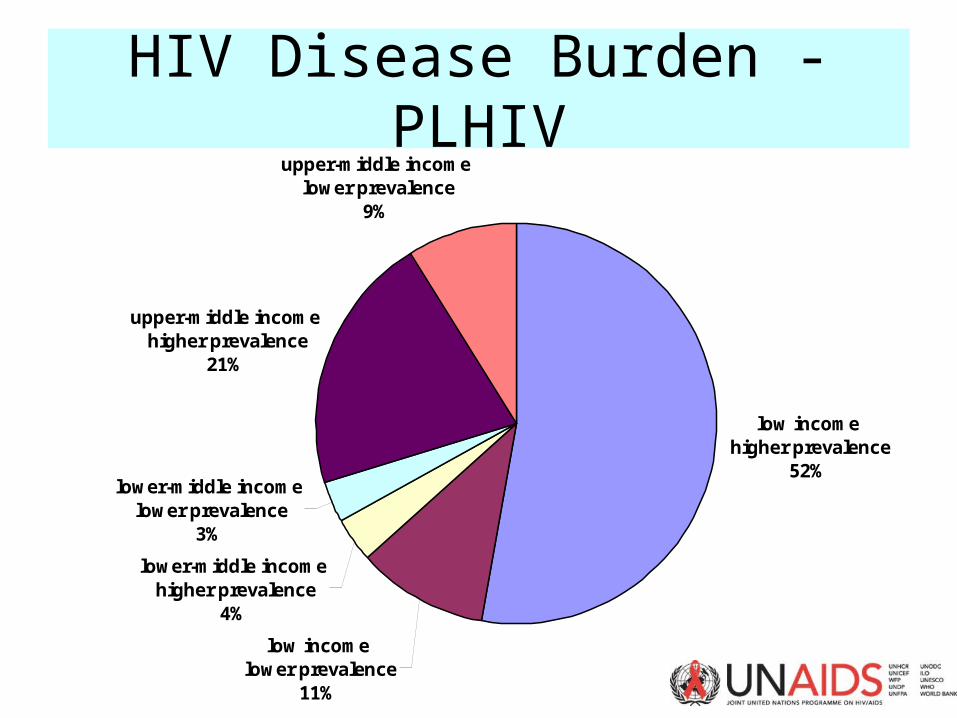
HIV Disease Burden - PLHIV
low income higher prevalence
52%
low income lower prevalence
11%
lower-middle income higher prevalence
4%
lower-middle income lower prevalence
3%
upper-middle income higher prevalence
21%
upper-middle income lower prevalence
9%
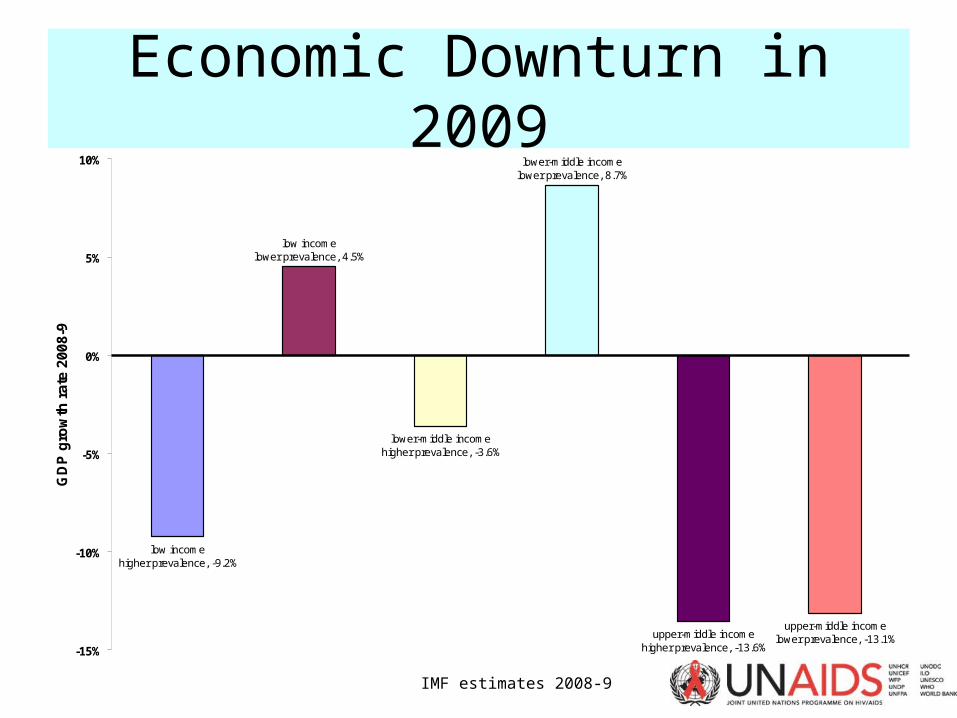
Economic Downturn in 2009
IMF estimates 2008-9
low income higher prevalence, -9.2%
low income lower prevalence, 4.5%
lower-middle income higher prevalence, -3.6%
lower-middle income lower prevalence, 8.7%
upper-middle income higher prevalence, -13.6%
upper-middle income lower prevalence, -13.1%
-15%
-10%
-5%
0%
5%
10%
GD
P g
row
th r
ate
20
08
-9
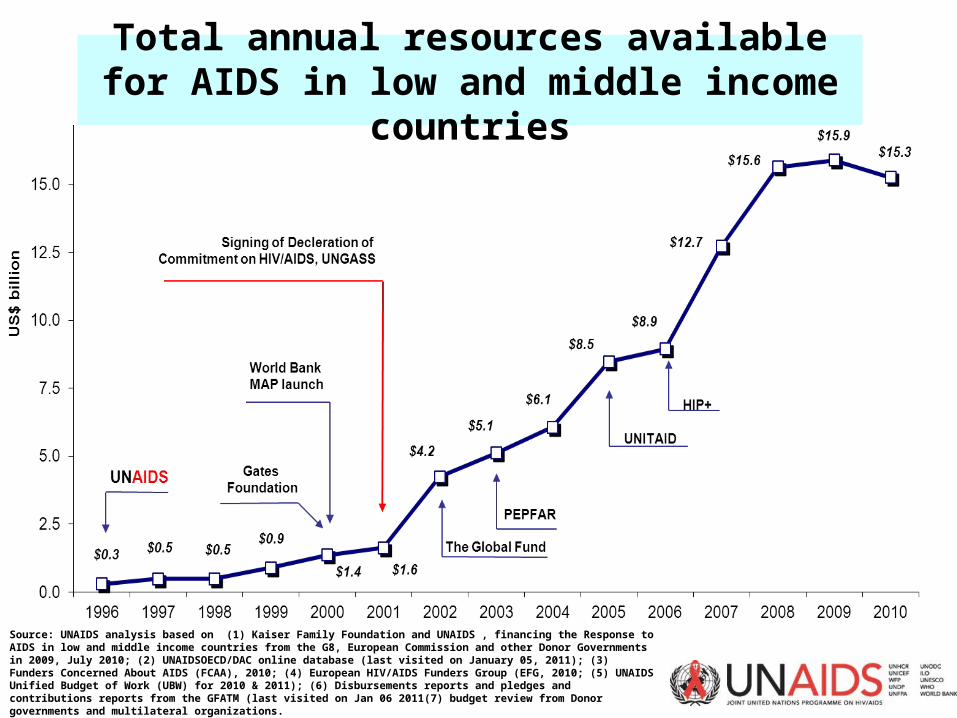
Total annual resources available for AIDS in low and middle income countries
Source: UNAIDS analysis based on (1) Kaiser Family Foundation and UNAIDS , financing the Response to AIDS in low and middle income countries from the G8, European Commission and other Donor Governments in 2009, July 2010; (2) UNAIDSOECD/DAC online database (last visited on January 05, 2011); (3) Funders Concerned About AIDS (FCAA), 2010; (4) European HIV/AIDS Funders Group (EFG, 2010; (5) UNAIDS Unified Budget of Work (UBW) for 2010 & 2011); (6) Disbursements reports and pledges and contributions reports from the GFATM (last visited on Jan 06 2011(7) budget review from Donor governments and multilateral organizations.
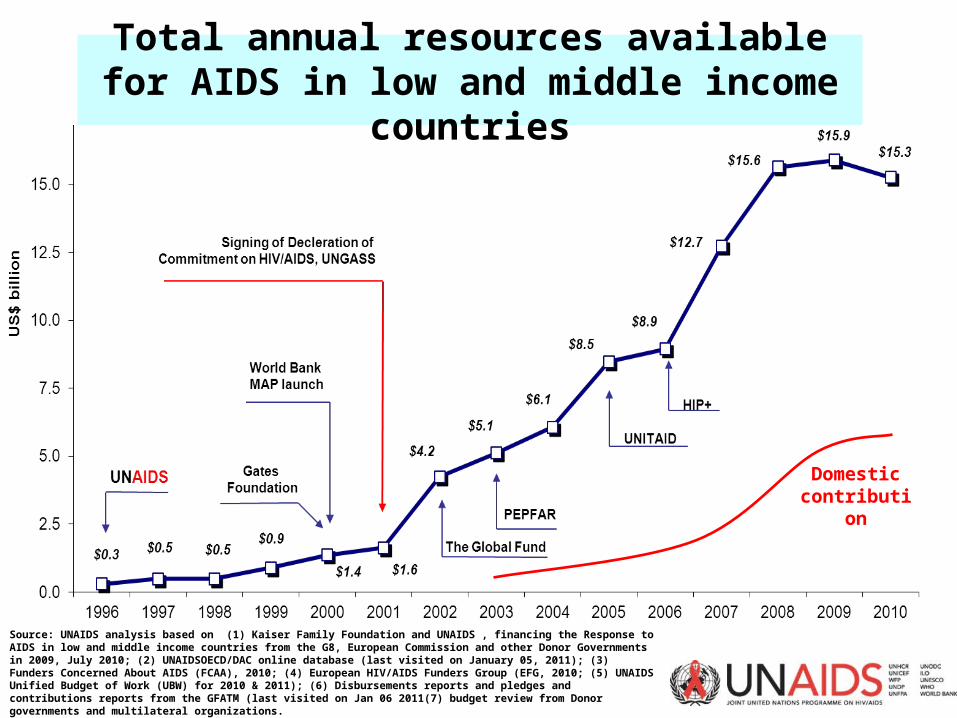
Domestic contribution
Summary of Presentation
• What was the effect of the economic downturn in low and middle-income countries?– On economic growth– On resources available for HIV
• What is the financing challenge?• What are the potential sources for
increased and sustainable investment?
Resource Needs for the Global AIDS Response
0
5
10
15
20
2011
2012
2013
2014
2015
2016
2017
2018
2019
2020
Glo
bal
Res
ou
rce
Nee
d $
bn upper-middle income
lower prevalence
upper-middle income higher prevalence
lower-middle income lower prevalence
lower-middle income higher prevalence
low income lower prevalence
low income higher prevalence
Summary of Presentation
• What was the effect of the economic downturn in low and middle-income countries?– On economic growth– On resources available for HIV
• What is the financing challenge?• What are the potential sources for
increased and sustainable investment?
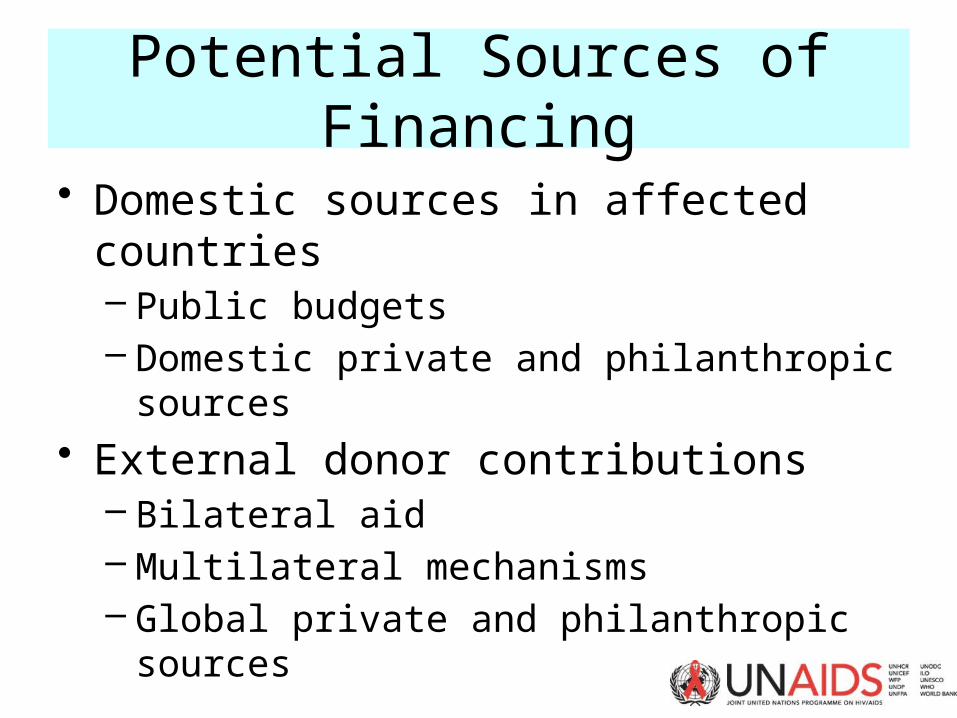
Potential Sources of Financing
• Domestic sources in affected countries– Public budgets– Domestic private and philanthropic sources
• External donor contributions– Bilateral aid– Multilateral mechanisms– Global private and philanthropic sources
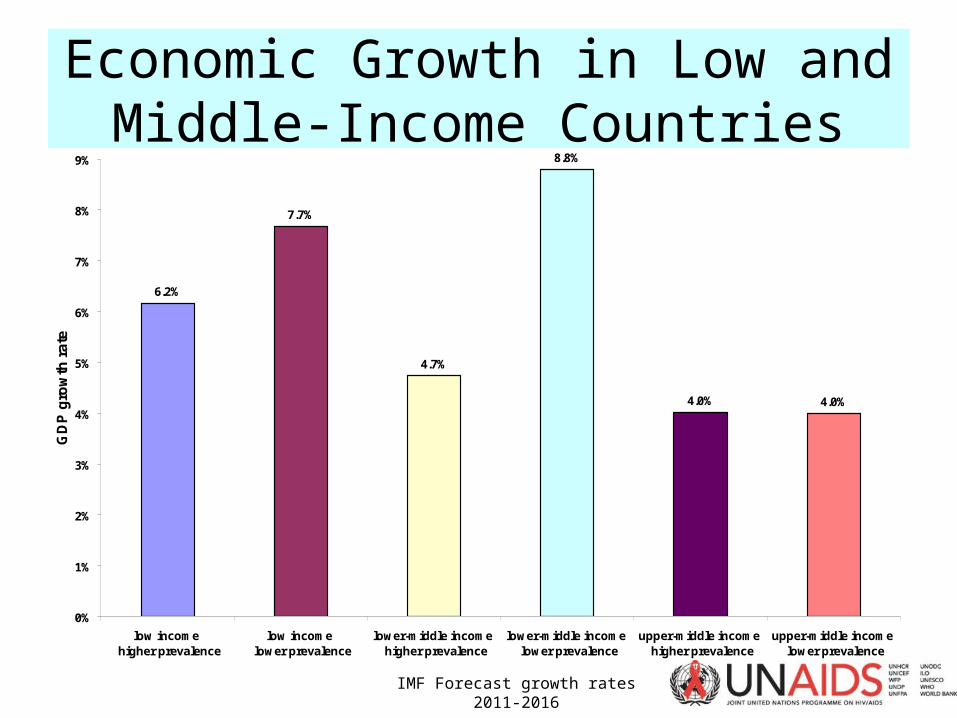
Economic Growth in Low and Middle-Income Countries
IMF Forecast growth rates 2011-2016
6.2%
7.7%
4.7%
8.8%
4.0% 4.0%
0%
1%
2%
3%
4%
5%
6%
7%
8%
9%
low income higher prevalence
low income lower prevalence
lower-middle income higher prevalence
lower-middle income lower prevalence
upper-middle income higher prevalence
upper-middle income lower prevalence
GD
P g
row
th r
ate
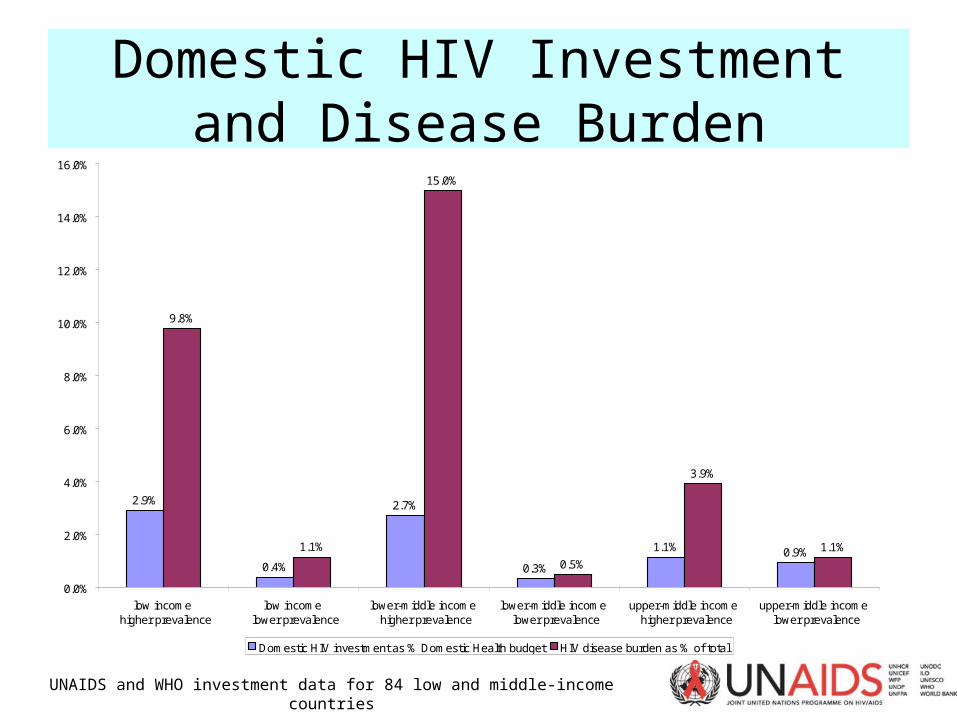
Domestic HIV Investment and Disease Burden
2.9%
0.4%
2.7%
0.3%
1.1% 0.9%
9.8%
1.1%
15.0%
0.5%
3.9%
1.1%
0.0%
2.0%
4.0%
6.0%
8.0%
10.0%
12.0%
14.0%
16.0%
low income higher prevalence
low income lower prevalence
lower-middle income higher prevalence
lower-middle income lower prevalence
upper-middle income higher prevalence
upper-middle income lower prevalence
Domestic HIV investment as % Domestic Health budget HIV disease burden as % of total
UNAIDS and WHO investment data for 84 low and middle-income countries

Donor Dependency and Health
52.7%
85.7%
80.6%
10.1%
16.7%
44.7%
24.6%
11.2%
17.8%
6.5%
0.2% 0.5%2.2%
0.3%0.0%
10.0%
20.0%
30.0%
40.0%
50.0%
60.0%
70.0%
80.0%
90.0%
100.0%
East & SouthernAfrica
West & CentralAfrica
South Asia Latin America Eastern Europe &Central Asia
South East Asia East Asia
% f
rom
ext
ern
al s
ou
rces
HIV Health
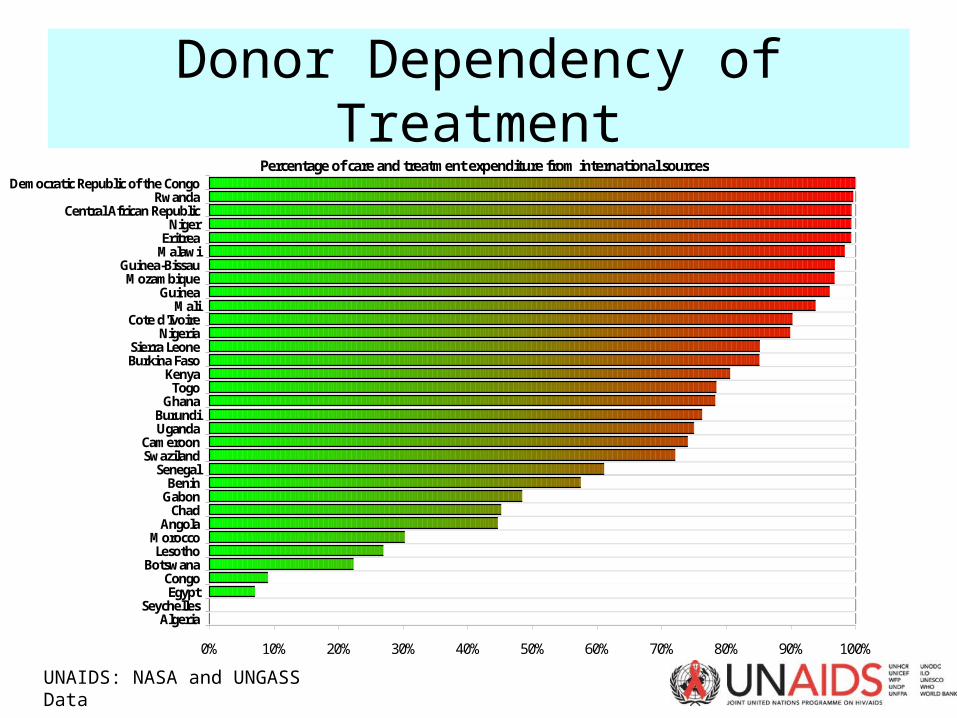
Donor Dependency of Treatment
UNAIDS: NASA and UNGASS Data
Percentage of care and treatment expenditure from international sources
0% 10% 20% 30% 40% 50% 60% 70% 80% 90% 100%
AlgeriaSeychelles
EgyptCongo
BotswanaLesotho
MoroccoAngola
ChadGabonBenin
SenegalSwazilandCameroon
UgandaBurundi
GhanaTogo
KenyaBurkina FasoSierra Leone
NigeriaCote d'Ivoire
MaliGuinea
MozambiqueGuinea-Bissau
MalawiEritrea
NigerCentral African Republic
RwandaDemocratic Republic of the Congo
Domestic Financing Scenario
Suppose that by 2020:• Domestic health budgets average at least
15% of government revenue (as in the Abuja Declaration in Africa)
• Domestic allocation to AIDS is in proportion to the AIDS disease burden
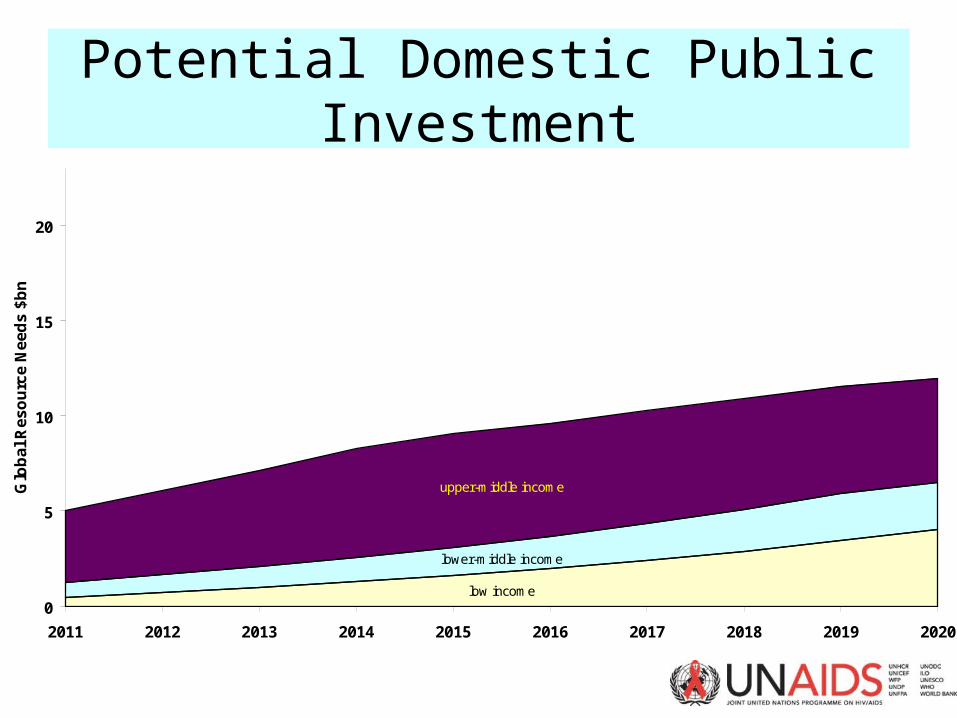
Potential Domestic Public Investment
low income
lower-middle income
upper-middle income
0
5
10
15
20
2011 2012 2013 2014 2015 2016 2017 2018 2019 2020
Glo
ba
l R
es
ou
rce
Ne
ed
s $
bn
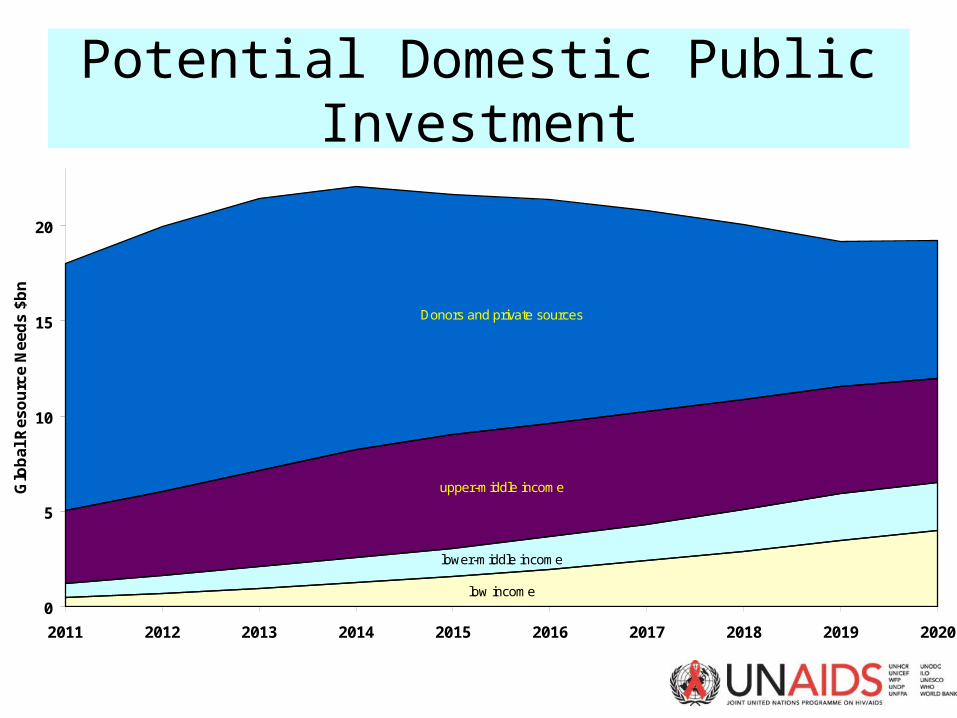
Potential Domestic Public Investment
low income
lower-middle income
upper-middle income
Donors and private sources
0
5
10
15
20
2011 2012 2013 2014 2015 2016 2017 2018 2019 2020
Glo
ba
l R
es
ou
rce
Ne
ed
s $
bn
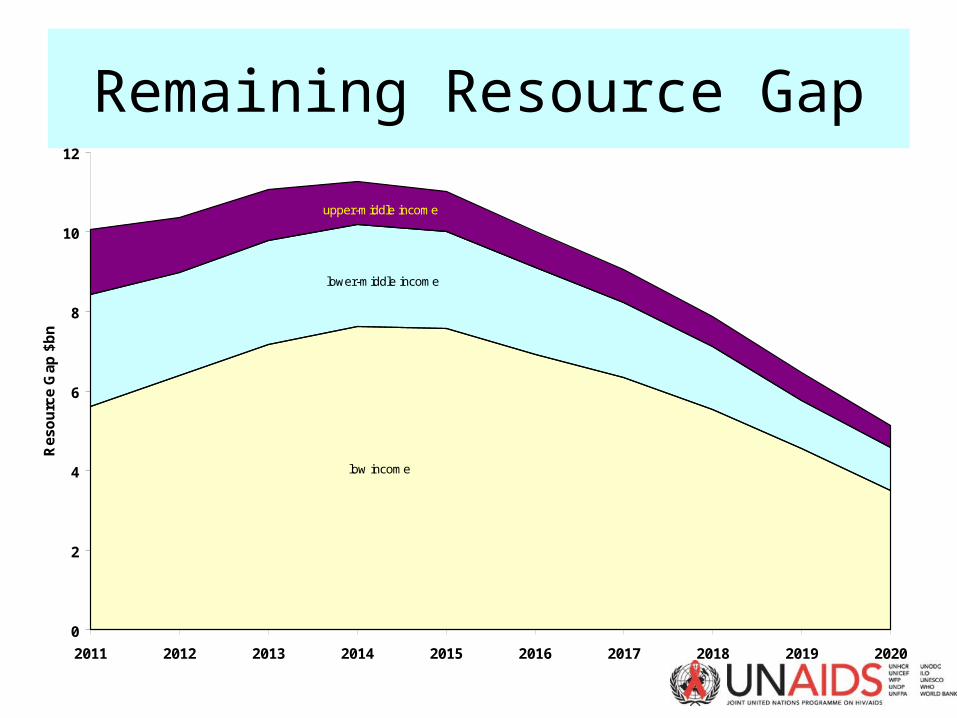
Remaining Resource Gap
low income
lower-middle income
upper-middle income
0
2
4
6
8
10
12
2011 2012 2013 2014 2015 2016 2017 2018 2019 2020
Re
so
urc
e G
ap
$b
n
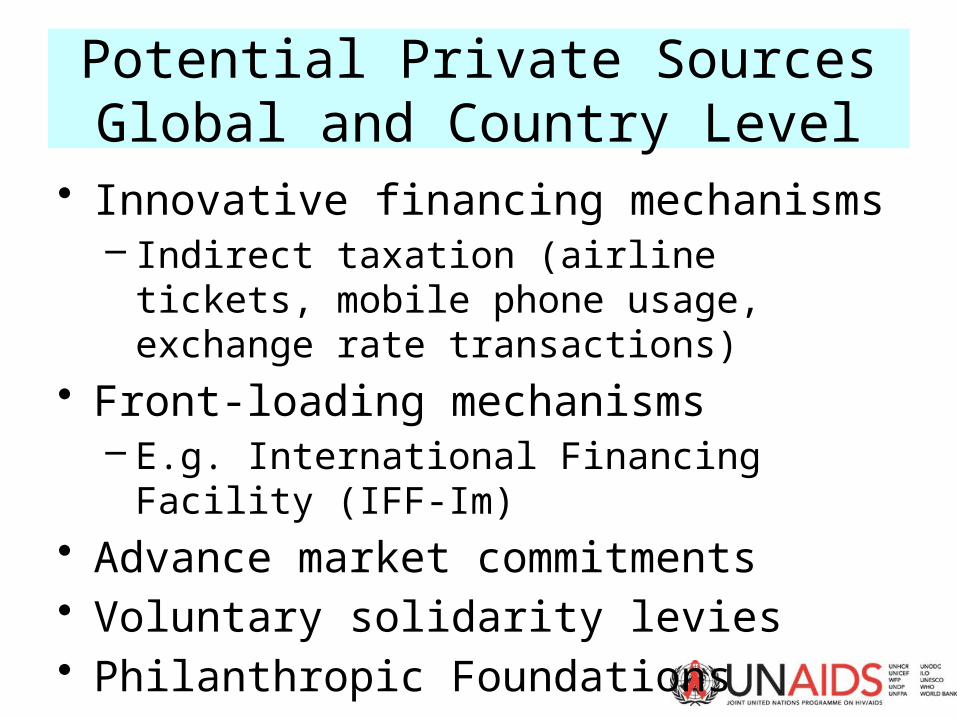
Potential Private SourcesGlobal and Country Level
• Innovative financing mechanisms– Indirect taxation (airline tickets, mobile phone
usage, exchange rate transactions)• Front-loading mechanisms
– E.g. International Financing Facility (IFF-Im)• Advance market commitments• Voluntary solidarity levies• Philanthropic Foundations
Political Declaration on HIV/AIDS: resources for the AIDS response
• Close the global resource gap by 2015– $6 billion annually, overall target between $22 billion and $24
billion
• Support and strengthen existing financial mechanisms– including the Global Fund and relevant UN organizations
• Expand voluntary and additional innovative financing mechanisms
• Break the upward trajectory of costs through the efficient utilization of resources– Simplify treatment regimens and delivery (Treatment 2.0)– Integrate HIV programmes with other areas of the health system