financing the plan - planning commission
TRANSCRIPT

34 Eleventh Five Year Plan
3Financing the PlanFinancial Resources: Centre and States
INTRODUCTION3.1. This chapter presents projections of the likelyavailability of total savings in the economy and also ofpublic sector resources in the Eleventh Plan period giventhe target GDP growth rate of 9%. The overall picture interms of resources for the economy as a whole suggeststhat given recent trends, it will be possible to mobilize thesavings needed to finance the gross domestic investmentneeded for 9% growth. As far as public sector resourcesis concerned, the estimates show resource availability forthe Eleventh Plan of Rs 3644718 crore at 2006–07 pricefor the Centre and States taken together. At comparableprices, this amounts to an increase of 120.5% over theTenth Plan realization.
3.2. These projections imply that public sector resourcesfor the Plan will increase from 9.46% of GDP in the TenthPlan to 13.54% in the Eleventh Plan. Thus outcomedepends critically on achievement of buoyancy in taxrevenue, effective control over consumption expenditureand subsidies, and an improvement in the resourcemobilizing capacity of Public Sector Undertakings (PSUs)both at the Central and State levels.
PUBLIC SECTOR RESOURCES IN THE TENTH PLAN3.3. This section presents an overview of the resourcesof the Centre and States in the Tenth Plan period.
CENTRE’S RESOURCES3.4. The GBS to the Tenth Plan was projected at Rs 706000crore at 2001–02 price. This included Rs 300265 croreof Central assistance (CA) to the States and UTs. With
the Tenth Plan resources of Central Public SectorUnits (CPSUs) projected at Rs 515556 crore,resources available for the Central Plan was fixed atRs 921291 crore.
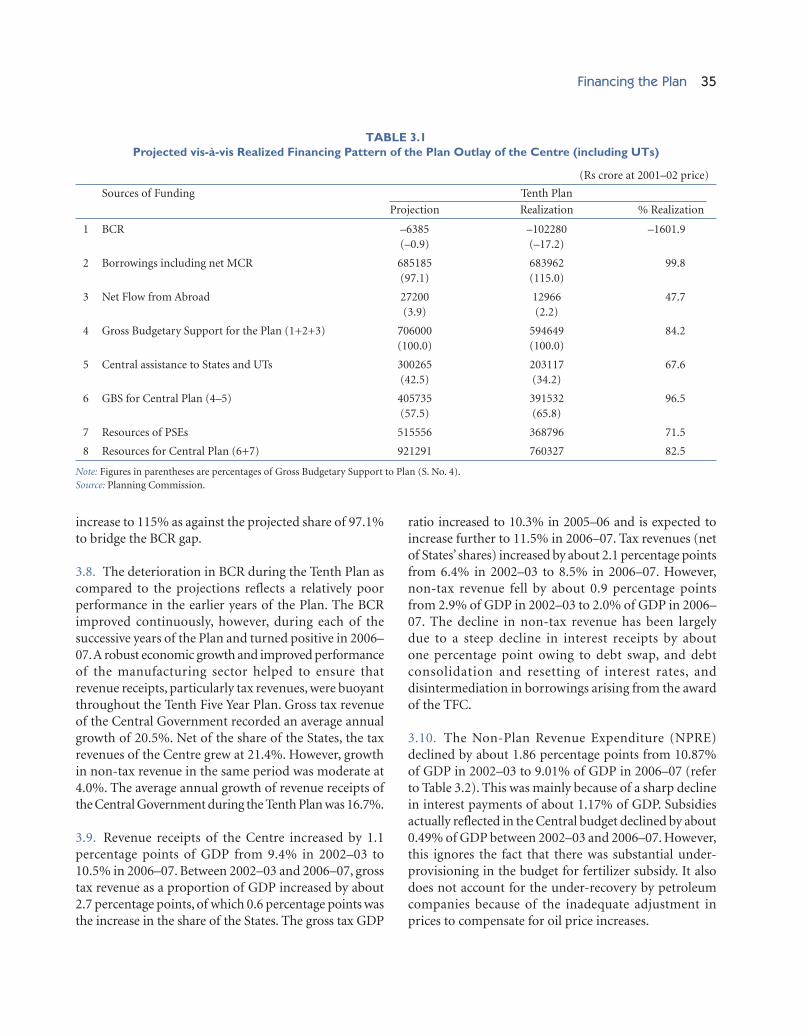
3.5. Table 3.1 shows the financing pattern of the Centre’sPlan during the Tenth Plan. The realized GBS availablefor the Plan was 84.2% of the projected amount. RealizedCentral assistance to States and UTs at Rs 203117 crorewas 67.6% of the projected level. As a percentage of GBS,this declined from 42.5% to 34.2%. This decline in theshare of CA to States and UTs is partly a reflection of thedisintermediation of the loan portion of CA followingthe Twelfth Finance Commission’s (TFC) award in themiddle of the Tenth Plan period, and partly also a resultof the increasing resource transfers to States through CSSspecially in health, education and rural development,which expanded well beyond what was originallyprojected. CPSUs achieved 71.5% of resources projectedin the Plan.
3.6. The total resources available for the Central Plan,consisting of GBS for the Central Plan plus PSUs’ resources,worked out to 82.5% of the projected level i.e. Rs 760327crore at 2001–02 price.
3.7. The pattern of funding GBS in the Tenth Plan asactually realized reflects a significant deterioration of non-debt contribution compared with the Plan projections.The share of Balance from Current Revenues (BCR) inGBS was projected to be (–)0.9% but deteriorated sharplyto (–)17.2%. The realized share of borrowings had to
Financing the Plan 35
increase to 115% as against the projected share of 97.1%to bridge the BCR gap.
3.8. The deterioration in BCR during the Tenth Plan ascompared to the projections reflects a relatively poorperformance in the earlier years of the Plan. The BCRimproved continuously, however, during each of thesuccessive years of the Plan and turned positive in 2006–07. A robust economic growth and improved performanceof the manufacturing sector helped to ensure thatrevenue receipts, particularly tax revenues, were buoyantthroughout the Tenth Five Year Plan. Gross tax revenueof the Central Government recorded an average annualgrowth of 20.5%. Net of the share of the States, the taxrevenues of the Centre grew at 21.4%. However, growthin non-tax revenue in the same period was moderate at4.0%. The average annual growth of revenue receipts ofthe Central Government during the Tenth Plan was 16.7%.
3.9. Revenue receipts of the Centre increased by 1.1percentage points of GDP from 9.4% in 2002–03 to10.5% in 2006–07. Between 2002–03 and 2006–07, grosstax revenue as a proportion of GDP increased by about2.7 percentage points, of which 0.6 percentage points wasthe increase in the share of the States. The gross tax GDP
ratio increased to 10.3% in 2005–06 and is expected toincrease further to 11.5% in 2006–07. Tax revenues (netof States’ shares) increased by about 2.1 percentage pointsfrom 6.4% in 2002–03 to 8.5% in 2006–07. However,non-tax revenue fell by about 0.9 percentage pointsfrom 2.9% of GDP in 2002–03 to 2.0% of GDP in 2006–07. The decline in non-tax revenue has been largelydue to a steep decline in interest receipts by aboutone percentage point owing to debt swap, and debtconsolidation and resetting of interest rates, anddisintermediation in borrowings arising from the awardof the TFC.
3.10. The Non-Plan Revenue Expenditure (NPRE)declined by about 1.86 percentage points from 10.87%of GDP in 2002–03 to 9.01% of GDP in 2006–07 (referto Table 3.2). This was mainly because of a sharp declinein interest payments of about 1.17% of GDP. Subsidiesactually reflected in the Central budget declined by about0.49% of GDP between 2002–03 and 2006–07. However,this ignores the fact that there was substantial under-provisioning in the budget for fertilizer subsidy. It alsodoes not account for the under-recovery by petroleumcompanies because of the inadequate adjustment inprices to compensate for oil price increases.
(Rs crore at 2001–02 price)
Sources of Funding Tenth Plan
Projection Realization % Realization
1 BCR –6385 –102280 –1601.9(–0.9) (–17.2)
2 Borrowings including net MCR 685185 683962 99.8(97.1) (115.0)
3 Net Flow from Abroad 27200 12966 47.7(3.9) (2.2)
4 Gross Budgetary Support for the Plan (1+2+3) 706000 594649 84.2(100.0) (100.0)
5 Central assistance to States and UTs 300265 203117 67.6(42.5) (34.2)
6 GBS for Central Plan (4–5) 405735 391532 96.5(57.5) (65.8)
7 Resources of PSEs 515556 368796 71.5
8 Resources for Central Plan (6+7) 921291 760327 82.5
Note: Figures in parentheses are percentages of Gross Budgetary Support to Plan (S. No. 4).Source: Planning Commission.
TABLE 3.1Projected vis-à-vis Realized Financing Pattern of the Plan Outlay of the Centre (including UTs)

36 Eleventh Five Year Plan
3.11. During the Tenth Plan, expenditure on subsidiesincreased by 22.8% from Rs 43533 crore in 2002–03 toRs 52935 crore in 2006–07. The main factor behind theincrease was fertilizer subsidy, which more than doubled.While food subsidy remained stable and other subsidiesincreased by 29%, petroleum subsidies reflected in thebudget declined in nominal terms. The apparent declinein petroleum subsidies, however, does not reflect thequasi-fiscal subsidization of oil prices through the issueof oil bonds. Subsidy rationalization, including targetingof the poor, has been an announced policy objective ofthe government for over a decade. However, success inthis area has been rather limited.
3.12. Because of buoyant revenue receipts and somecontrol over expenditure following the enactment ofthe fiscal responsibility legislation (see Box 3.1), theborrowings of the Central Government have beencontained within the projected level in absolute terms.The percentage of interest payments to revenue receiptsdeclined from 51% in 2002–03 to 34.5% in 2006–07implying improved sustainability of the Centre’s debtburden. The debt burden of the Centre has declined byalmost 3.1 percentage points from 63.4% in 2002–03 to60.3% of GDP as per 2006–07 BE.
3.13. The gross fiscal deficit of the Centre, as a percentof GDP, declined from 5.9% in 2002–03 to 4.1% in 2005–
06 and further to 3.5% in 2006–07. The gross fiscal deficitof the States, as a percent of GDP, also declined from 4.2%in 2002–03 to 2.8% in 2006–07 revised estimates (RE). Asa result, the combined fiscal deficit of the Centre and Statescame down from 9.6% in 2002–03 to 6.4% in 2006–07(RE). The average fiscal deficit for the Tenth Plan, as apercent of GDP, was 4.4% for the Centre, 3.5% for theStates and 7.7% for the Centre and States combined. Theyear-wise figures of fiscal deficit are provided in Table 3.3.
3.14. The net inflow from abroad on governmentaccount, which is deployed for funding externally aidedprojects, was projected to contribute 3.9% of GBS in theTenth Plan. However, actual realization was less than halfof the projected level, thereby reducing its realized sharein Plan resources to 2.2% of GBS. The fall in net inflowfrom abroad is due to the repayment of costlier debt inthe initial years of the Tenth Plan.
3.15. The IEBR of the CPSUs was projected to provideRs 515556 crore but the actual realization was only Rs368796 crore or 71.5% of the projected amount. As a resultthe realized share of IEBR in the Central Plan resourceswas only 48.5%, substantially lower than the projectedshare of 56%.
3.16. The investment by CPSUs is financed throughbudgetary support provided by the Central Government,which is a part of total plan outlay and GBS, and IEBRraised by CPSUs on their own. IEBR comprises of InternalResources, and Extra-Budgetary Resources (EBR).Internal Resources comprise retained profits—net ofdividend paid to government, depreciation provision, and
(Rs crore)
2002–03 2006–07Actual Provisional
1 Interest 117804 149553(4.79) (3.62)
2 Pension 14496 21984(0.59) (0.53)
3 Salary* 18253 23232(0.74) (0.56)
4 Subsidies 43533 52935(1.77) (1.28)
5 Other NPRE 73058 123940(2.97) (3.00)
6 (Total) NPRE 267144 371644(10.87) (9.01)
Note: *2006–07 is BE. Figures in parentheses are percentages of GDP.Source: Planning Commission.
TABLE 3.2Non-Plan Revenue Expenditure (NPRE)
and its Components(as % of GDP)
Year Centre States Combined
2002–03 5.9 4.2 9.6
2003–04 4.5 4.5 8.5
2004–05 4.0 3.5 7.5
2005–06 4.1 2.5 6.7
2006–07 (RE) 3.7* 2.8 6.4
2007–08 (BE) 3.3 2.4 5.6
Tenth Plan (2002–07) 4.4 3.5 7.7
Note: *3.5 (2006–07 Provisional). BE stands for Budget Estimates.Source: Macroeconomic and Monetary Developments Mid-Term Review2007–08, 30 October 2007, RBI.
TABLE 3.3Gross Fiscal Deficit

Financing the Plan 37
carried forward reserves and surpluses. EBR consist ofreceipts from the issue of bonds, debentures, ECB,suppliers’ credit, deposit receipts, and term loans fromfinancial institutions.
3.17. IEBR contributed 83% of the Plan outlay of CPSUsduring the Tenth Plan. Of this, Internal Resourcescontributed 47% and Extra-Budgetary Resources, 36%.In the original projections, Internal Resources (IR) wereto contribute 79% and EBR were to contribute only about21%. However, over the Tenth Plan, realization of IR hasbeen about half the projection. The shortfall in IR has
led to increased borrowings by the CPSUs. Consequently,EBR have exceeded the Tenth Plan target by about 51%.
RESOURCES OF STATES AND UNIONTERRITORIES (UTs)3.18. The Tenth Plan resources of the States and UTs wereprojected at Rs 590948 crore at 2001–02 price. Therealization at 2001–02 prices is placed at Rs 569233 croreor 96.3% of the projected level. The realized pattern offunding, however, shows a divergence from the projectedlevels (as shown in Table 3.4). BCR has deterioratedby about 67 percentage points over the projected
Box 3.1FRBMA, 2003 and Fiscal Consolidation
The Fiscal Reforms and Budget Management Act (FRBMA) enacted in 2003, is an important institutional mechanism toensure fiscal prudence and support for macro economic balance. According to the Rules framed under the Act, revenuedeficit is to be eliminated by 31 March 2009, and fiscal deficit is to be reduced to no more than 3% of estimated GDP byMarch 2009. The process of fiscal consolidation under FRBMA has been continuous. It has yielded rich dividends in terms ofcreating fiscal space for increased spending on infrastructure and social sectors. The traditional annual budgeting has movedto a more meaningful medium-term fiscal planning framework. FRBMA provides the basic structure around which manyfiscal measures have been implemented. Some of the important among these include: reducing peak rates of customs duties,rectifying anomalies like inverted duty structure, rationalizing excise duties, relying on voluntary tax compliance, introductionof State-level VAT, increasing productivity of expenditure through an outcome budget framework, and innovative financingmechanisms like creation of special purpose vehicles for infrastructure projects. The success in fiscal consolidation in theTenth Plan has provided a good foundation to build the Eleventh Plan.
(Rs crore at 2001–02 price)
Sources of Funding Projection Realization % realization
1 Balance from Current Revenues –15295 –25514 –166.8(–2.6) (–4.5)
2 Resources of PSEs 82684 95714 115.8(14.0) (16.8)
i) Internal resources –7760 9653 224.4(–1.3) (1.7)
ii) Extra-Budgetary resources 90444 86061 95.23 Borrowings 264802 299022 112.9
(44.8) (52.5)4 State’s Own Resources (1+2+3) 332191 369222 111.1
(56.2) (64.9)5 Central assistance 258757 200011 77.3
(43.8) (35.1)6 Aggregate Plan Resources (4+5) 590948 569233 96.37 GBS to Plan (6–2) 508264 473519 93.28 GBS as percentage of GDP 3.6 3.4
Note: Figures in parentheses are percentages of Aggregate Plan Resources.Source: Planning Commission.
TABLE 3.4Core Tenth Plan Resources of States and UTs

38 Eleventh Five Year Plan
level. However, with resources of the PSEs being 16%higher and borrowings 13% higher, the States’ ownresources have improved by 11 percentage points overthe projected level.
3.19. Performance of the States can be analysed, broadly,in terms of three components, viz, the BCR reflectingnon-debt resources, States’ borrowings reflecting debtbased funding, and Central assistance, which is nowall grant.
3.20. The BCR of the States was expected to be (–)Rs15295 crore but the actual situation has been muchworse, with a negative BCR of Rs 25514 crore. The States’own tax revenues have increased due to improvementsmade possible through the introduction of value-addedtax (VAT). The share of Central taxes devolved to the Stateshas also improved owing to buoyant resources of theCentre. However, compression of non-Plan expenditurehas not been as expected.
3.21. Against a projected contribution of 44.8% of thePlan resources, borrowings in the Tenth Plan reached52.5%. The higher share of borrowings is partly dueto the deterioration in BCR. Central assistance to Statesand UTs in the Tenth Plan was 77.3% of the projectedlevel, and its contribution to Plan resources however,has been only 35% as against the projection of about44%. This has been a consequence of disintermediationof Plan loans to States and UTs in the wake ofrecommendations of the TFC and increased resourcetransfers through CSS.
PUBLIC SECTOR RESOURCES IN THEELEVENTH PLAN
CENTRE’S RESOURCES3.22. There have been several important developmentsduring the Tenth Plan that have implications forfinancing of the Eleventh Plan. FRBMA, 2003 is in forceand the TFC award for 2005–10 is being implemented.Service tax has emerged as a very promising source ofrevenue. An announcement has also been made thatefforts will be made to introduce an unified goods andservice tax (GST) by 1 April 2010. The Sixth Central PayCommission was constituted in October 2006 and isscheduled to submit its recommendations in 2008–09.
Effect of FRBMA3.23. FRBMA, 2003 and the associated rules notified on5 July 2004, enjoined the Central Government to reducethe fiscal deficit by no less than 0.3% of GDP every yearand to bring it down to no more than 3% of GDP by2008–09. The imposition of a ceiling on the fiscal deficitconstrains the scope for enhancing GBS by resortingto more borrowings. While in the short to mediumrun this appears to constrain the government frommaking productive investments, it is necessary to take amore long-term view of the implications of FRBMA.Borrowings increase resource availability in the shortrun but they also increase the outstanding debt, andhence the interest burden of the Centre. This increasesNPRE and hence reduces GBS in the future. High fiscaldeficits also generate other undesirable consequencessuch as uncertainty about macro fundamentals whichcan affect investor confidence and make the climateunsuitable for private investment with adverse effectsupon growth.
3.24. The projections assume that FRBMA will effectivelyconstrain the fiscal deficit to the levels indicated, leadingto a reduction in debt financing for funding of GBS for theEleventh Plan. Accordingly, the Centre’s net borrowings,which stood at 3.47% of GDP in 2006–07, are projectedto decline to 3% in 2008–09 and remain at this levelduring the Eleventh Plan. Eleventh Plan projections onborrowings do not distinguish between external anddomestic debt.
3.25. FRBMA not only prescribes the required reductionin fiscal deficit, but also a reduction in revenue deficit byno less than 0.5% of GDP every year and the eliminationof such deficit by 2008–09. The imposition of a zerorevenue deficit condition has an impact on total revenueexpenditure given revenue receipts. This, in turn, hasimplications for the composition of Plan expenditure interms of the revenue component of the Plan. The Centre’sGBS deployment now involves a substantial componentof revenue expenditure exceeding 80%, reflecting thelarge grants to States under the CSS which show upas revenue expenditure in the Centre’s budget. Theimposition of a revenue deficit ceiling, in addition to afiscal deficit ceiling, makes it vitally important to controlnon-Plan expenditure to ensure that the total of Plan andNPRE does not exceed the permitted ceiling.
Financing the Plan 39
Effect of TFC3.26. The Twelth Finance Commission’s recommenda-tions have essentially two critical implications for Planfinancing. First, the TFC award increased the devolutionto the States and thus improved their financial positionand hence their capacity to finance the Plan. This increasedcapacity must be kept in mind when determining thenecessary Plan transfers from the Centre to the States inthe form of Normal Central Assistance (NCA). Second,implementation of the TFC’s award has also led to aproblem of straightforward comparison of GBS in thepre- and post-TFC period. For example, in 2004–05, GBSfor the fourth year of the Tenth Plan of Rs 132292 croreincluded Rs 24806 crore of State Plan loans intermediatedby the Centre. A straightforward comparison with GBSof Rs 140638 crore in 2005–06 gives an increase of only6.3%. However, a proper comparison, after deductingwhat would have been dis-intermediated in 2004–05under the TFC award, shows an increase of 30.8% in2005–06 over the previous year.
3.27. The TFC’s recommendations cover the period up to2009–10, which includes the first three years of the EleventhPlan. The projections of resources for the Eleventh Planhave been made assuming that the same proportions ofresource transfers as under the TFC award will continuein 2010–11 and 2011–12. The assumption may not provevalid, as it is not possible to anticipate the nature of theThirteenth Finance Commission’s recommendations.The only possible basis on which projection can be madeis to assume continuation of the existing proportions.
Effect of Service Tax3.28. The introduction of service tax has provided apromising source of revenue, but there are some caveatswhich have to be kept in mind before making projectionsfor the Eleventh Plan. First, the scope for expandingthe service tax net to more and more services getsnarrower as the net is widened. The contribution of theexpanding net will, therefore, reduce over time. Second,the preponderance of small service providers below thetaxable limit of turnover constrains the scope of revenuemobilization beyond a certain level. Third, service taxwas introduced under the residuary entry No. 97 in ListI in the Seventh Schedule of the Constitution and, as such,is not subject to sharing with the States. There are alreadystrong demands for a sharing of the tax base between the
Centre and the States, particularly in the context of phasingout of Central Sales Tax. Any sharing of the tax base withthe States will diminish the Centre’s available resourcesto finance the Plan. Fourth, with the declared goal ofintroducing a unified GST by 1 April 2010, there isconsiderable uncertainty about the rates, base, andmechanism for setting off (i.e. input tax credit), all ofwhich have implications for future revenue collections.
3.29. Keeping in mind the implication of the FRBM andalso the prospects for service tax, an assessment has beenmade of the likely GBS of the Centre, assuming that thegrowth rate of GDP will average 9% per annum in theEleventh Plan, reaching 10% growth in the final year. Theresource projection made by the Working Group on theCentre’s resources yields a projection of GBS of the Centrewhich indicates that it will grow from 2.99% of GDP in2006–07 to 5.38% of GDP in 2011–12. The average GBSfor the Central Plan in the Eleventh Plan period standsat 3.97% of GDP as against 2.77% of GDP realized inthe Tenth Plan.
3.30. The tax revenue (net of States’ share) increases from8.5% of GDP in 2006–07 to 10.26% of GDP in 2011–12,averaging 9.28% during the Eleventh Plan. Collection ofdirect tax is projected to exceed indirect tax collection, forthe first time in history, from 2008–09 onwards. Corporatetax collection averages 63% of direct tax collection duringthe Eleventh Plan. It increases from 3.5% of GDP in2006–07 to 5.31% of GDP in 2011–12 averaging 4.28%of GDP, that is, 1.66 percentage points increase over theaverage Tenth Plan realization. It may be mentioned thatthe projection regarding corporate taxes by the WorkingGroup is based on the assumption of a corporate taxelasticity of 2.27. This is the weighted average of theestimated elasticity over the period 1995–96 to 2005–06and the buoyancy estimated by the Task Force on theimplementation of the FRBM Act, 2003.
3.31. Subsidies in the first year of the Eleventh Plan havebeen taken as per 2007–08 BE. As a proportion of GDPat current market prices, the projection assumes that thetotal subsidies will decline from 1.17% in 2007–08 BE to0.93% in 2011–12. This, however, ignores the underrecoveries on petroleum items because of the failureto fully pass on the effects of world oil prices and alsounderpayment on fertilizer subsidy. Inability to pass on

40 Eleventh Five Year Plan
increases in global oil prices to the consumers would havea substantial impact on resources for the Plan if thissituation is not addressed urgently.
3.32. Table 3.5 presents the resources of the Centre andits funding in the Eleventh Plan. The GBS available for thePlan is estimated at Rs 1421711 crore at 2006–07 price.Central assistance to the States’ and UTs’ Plan works outto be Rs 324851 crore. IEBR of CPSUs is estimated atRs 1059711 crore. The total resources available for theCentral Plan are projected at Rs 2156571 crore.
(Rs crore at 2006–07 price)
Sources of Funding Projection
1 Balance from Current Revenues 653989(46.0)
2 Borrowings including net MCR 767722(54.0)
3 Gross Budgetary Support to Plan (1 + 2) 1421711(100)
4 Central assistance to States & UTs 324851(22.8)
5 Total GBS for Central Plan (3–4) 1096860(77.2)
6 Resources of PSEs including borrowed 1059711resource (74.5)
7 Total Resources for Central Plan (5+6) 2156571
Note: Figures in parentheses are percentages of GBS to Plan (S. No. 3).Source: Planning Commission.
TABLE 3.5Projection of the Eleventh Plan Resources
of the Centre
(as % of GDP)
Sources of Funding Tenth Plan Eleventh Plan Increases (+)/Realization Projections Decreases (–)
1 Balance from Current Revenues –0.84 2.31 3.152 Borrowings including net MCR 5.03 2.86 –2.173 Net Flow from Abroad 0.06 – –4 Gross Budgetary Support to Plan (1 to 3) 4.25 5.17 0.925 Central assistance to States & UTs 1.48* 1.20 –0.286 GBS for Central Plan (4–5) 2.77 3.97 1.207 Resources of PSEs 2.61 4.02 1.418 Resources for Central Plan (6+7) 5.38 7.99 2.61
Note: * If Plan loans intermediated to States and UTs are excluded, this reduces to 0.99% of GDP, which is the relevant figure for comparison.Source: Planning Commission.
TABLE 3.6Tenth Plan Realization and Eleventh Plan Projection of Resources of the Centre
3.33. Table 3.6 compares the funding pattern in theEleventh Plan with the Tenth Plan realization as percentagesof GDP. The imposition of the fiscal deficit ceiling ensuresthat borrowings, including net miscellaneous capitalreceipts, decline from 5.03% of GDP to 2.86% in theEleventh Plan.
STATES’ RESOURCES3.34. The FRBM legislations in the States prescribe thatthey should achieve a fiscal deficit of 3% of GDP by theend of 2008–09. Therefore, the gross fiscal deficit of allthe States, which stood at 3.73% of GDP in 2006–07 hasbeen projected to decline to 3% by 2008–09 and to remainat this level in the remaining years of the Eleventh Plan.This inevitably limits the scope for mobilizing borrowedresources and the States, therefore, have to look at improvingrevenue realization and controlling non-Plan expenditure.
3.35. The core aggregate Plan resources of the States andUTs have been projected to be Rs 1488147 crore at 2006–07 price (see Table 3.7). This comprises of Rs 1163296crore of own resources (including borrowings) andRs 324851 crore of Central assistance. UTs account for3.8% of the combined aggregate Plan resources of theStates and UTs.
3.36. As a proportion of GDP, aggregate Plan resourcesof the States and UTs are projected at 5.55% of GDP,registering an increase of 1.47 percentage points over theTenth Plan realization (refer to Table 3.8). The BCR, whichwas negative in the Tenth Plan, is projected to improve toa large positive figure of Rs 385050 crore. This representsan improvement of 1.59 percentage points of GDP per

Financing the Plan 41
year over the Tenth Plan. However, projections of resourcesof PSEs and Central assistance to the States show a declineof 0.19 percentage points and 0.23 percentage points,respectively as compared with the Tenth Plan.
3.37. Mobilization of resources of such a magnitudefor the Eleventh Plan is contingent upon significantimprovement in the States’ own resources, mainly throughimproved BCR. The States will have to step up efforts to
increase their own tax and non-tax revenue collectionsthrough better tax administration, plugging the scope forleakages and recovery of cost based user charges.
3.38. As shown in Table 3.8, the Central assistance beingtransferred to the States in the Eleventh Plan amounts to1.2% of GDP as against 1.43% in the Tenth Plan. However,as noted in the footnote of Table 3.8, if the Tenth Planfigure is adjusted to remove loans intermediated through
(Rs crore at 2006–07 price)
Sources of Funding Projection
State UTs Total
1 Balance from Current Revenues 341202 43848 385050(23.8) (77.2) (25.9)
2 Resources of PSEs 128824 – 128824(9.0) (8.7)
i) Internal resources 5692 5692(0.4) (0.4)
ii) Extra-Budgetary resources 123132 123132(8.6) (8.3)
3 Borrowings 636459 12964 649423(44.5) (22.8) (43.6)
4 State’s Own Resources (1 to 3) 1106485 56811 1163296(77.3) (100.0) (78.2)
5 Central assistance 324851 – 324851(22.7) (21.8)
6 Aggregate Plan Resources 1431336 56811 1488147(100.0) (100.0) (100.0)
Note: Figures in parentheses are percentages of aggregate Plan resources.Source: Planning Commission.
TABLE 3.7Eleventh Plan Resources of States and UTs
(% of GDP)
Sources of Funding Tenth Plan Eleventh Plan Increases (+)/Realization Projections Decreases (–)
1 Balance from Current Revenues –0.18 1.41 1.592 Resources of PSEs 0.69 0.49 –0.193 Borrowings 2.14 2.45 0.304 States’ Own Resources (1 to 3) 2.65 4.35 1.705 Central assistance 1.43* 1.20 –0.236 Aggregate Plan Resources (4+5) 4.08 5.55 1.47
Note: *This is based on the figures reported by the States. Hence, it is slightly different from the figure of Central assistance to States and UTs in Table 3.5. IfPlan loans intermediated to States and UTs are excluded, this reduces to 0.99% of GDP which is the relevant figure for comparison.Source: Planning Commission.
TABLE 3.8Core Tenth Plan Realization and Eleventh Plan Projection of Resources of States and UTs

42 Eleventh Five Year Plan
the Centre, the Tenth Plan figure is lower at 0.99%.Besides, Central assistance is not the only means ofPlan transfer. Large transfers take place through the CSSwhich have been greatly expanded in the Eleventh Plan.Accordingly, the States will receive larger transfer ofCentral resources to them.
OVERALL FINANCING PATTERN3.39. Table 3.9 compares the structure of financingprojected in the Eleventh Plan for the Centre and States,combined with that actually realized in the Tenth Plan.The most notable feature is that the Eleventh Planprojections show relatively modest dependence onborrowings amounting to 38.9% of the total Plan resourcescompared with 73.9% in the Tenth Plan realization. Thisoutcome is the consequence of tighter fiscal disciplineimposed by the fiscal responsibility framework, bothat the Centre and the States, and an optimistic revenueoutlook driven by the buoyancies in revenue collectionsduring the last three years of the Tenth Plan reflectingthe robust performance of the economy. This is reflectedin the projected massive improvement in BCR which wasnegative in the Tenth Plan and is projected as a largepositive figure for both the Centre and the States.
3.40. The financing plan outlined above will pose majorchallenges. As shown in Table 3.10, the total resources forthe Central and State Plans taken together have to increasefrom an average of 9.46% of GDP in the Tenth Plan to anaverage of 13.54% of GDP in the Eleventh Plan. It may benoted that while the total size of the Plan is projected at13.54% of GDP, the total public investment in the economyis projected to be lower at 8.6% (see Chapter 1). Thisdifference reflects the fact that a great deal of Planexpenditure finances current expenditure on variousitems of public service delivery which are not counted asinvestment. The increase of 4.08% of GDP in totalresources for the Plan has to be achieved while keepingborrowing within the FRBM requirement of reducingthe fiscal deficit of the Centre and States to 3% on eachaccount. Taking account of the resources mobilized by thepublic sector, the combined BCR of the Centre and theStates has to increase by more than the projected increasein Plan resources.
3.41. The Centre’s BCR, realized in the Tenth Plan,averaged (–)0.84% of GDP. It is projected to average 2.31%of GDP over the Eleventh Plan, that is, an improvementof 3.15 percentage points of GDP. Similarly, the BCR of
(Rs crore at 2006–07 price)
Tenth Plan Realization Eleventh Plan Projection
Sources of Funding Centre States & UTs Total Centre States & UTs Total
1 Balance from Current Revenues –127166 –31722 –158888 653989 385050 1039039(–13.4) (–4.5) (–9.6) (30.3) (25.9) (28.5)
2 Borrowings including net MCR 850382 371779 1222161 767722 649423 1417145(89.9) (52.5) (73.9) (35.6) (43.6) (38.9)
3 Net Inflow from Abroad 16121 16121 – – –(1.7) – (1.0)
4 Centre’s GBS (1+2+3) 739337 739337 1421711 – 1421711(78.2) – (44.7) (65.9) – (39.0)
5 Resources of PSEs 458530 119003 577533 1059711 128824 1188535(48.5) (16.8) (34.9) (49.1) (8.7) (32.6)
6 State’s Own Resources (1+2+5) 459060 459060 – 1163296 1163296(64.9) (27.8) – (78.2) (31.9)
7 Central assistance to States & UTs –252539 248677 –3862 –324851 324851 –(–26.7) (35.1) (–0.2) (–15.1) (21.8) –
8 Resources of the Public Sector 945328 707737 1653065 2156571 1488147 3644718Plan (1+2+3+5+7)
Note: Figures in parentheses are percentages of Resources of the Public Sector Plan.Source: Planning Commission.
TABLE 3.9Comparison of Tenth Plan Realization with Eleventh Plan Projection of Resources

Financing the Plan 43
the States is also expected to improve substantially from(–) 0.18% of GDP as realized in the Tenth Plan to 1.41%of GDP in the Eleventh Plan. As can be seen from Table3.10, the projected improvement required in the combinedBCR of the Centre and States taken together is therefore4.74 percentage points of GDP. It must be emphasizedthat achievement of these BCR targets is a key elementin the financing of the Plan.
3.42. Underlying the projected BCR is a projection thattax revenues (net to Centre) would grow from 8.5% ofGDP in 2006–07 to 10.26% of GDP in 2011–12. NPREis expected to decline from 9.01% of GDP in 2006–07to 6.91% in 2011–12. Thus the projected improvementof 3.15% of GDP in BCR of the Centre is expected tocome slightly more from contraction in NPRE thangrowth in taxes.
3.43. The assumption of strong growth in tax revenuesof the Centre and the States built into the projections isnot unreasonable. Tax revenues recorded in the recentpast has shown high buoyancy facilitated by tax reformsand also significant improvements in the efficiency oftax administration. These efforts will continue in theEleventh Plan period and should contribute to achievingthe targeted tax-to-GDP ratios. However, the BCRprojections are equally dependent upon the ability tomoderate the growth in NPRE and this aspect of theprojections deserves focused attention.
3.44. There are several factors which could make it difficultto contain expenditures to the projected level. There areinevitable uncertainties associated with the impact of the
Sixth Pay Commission’s recommendations. Equally, ifnot, more important is the upward pressure of subsidies,particularly on fertilizer and petroleum, and also on food.Petroleum subsidies have not so far been factored into theplan resources calculations since they have been financedby the issue of bonds not included in fiscal deficitaccounting, and some portion being borne by the oilcompanies themselves. However, this practice cannot besustained indefinitely. Reform of the subsidy regime hasto be urgently taken up to keep the total subsidy, includingthe present off-budget subsidy, to within the ceiling of0.93% of GDP in 2011–12 that the resources projectionshave built in.
ALLOCATION OF PUBLIC SECTOR RESOURCES:CENTRE AND STATES3.45. The projection of the overall resources for theEleventh Plan has been presented in the precedingsection. This section focuses on the allocation of PublicSector Resources for the Eleventh Plan between theCentre and the States/UTs and the proposed sectoraldistribution of the resources in keeping with the objectiveof achieving faster and more inclusive growth.
3.46. The projected assessment of resources of thepublic sector for the Eleventh Plan at Rs 3644718 croreat 2006–07 prices comprises of the Centre’s share atRs 2156571 crore and the States/UTs share at Rs 1488147crore. The resources for the Central Plan includesthe GBS component of Rs 1096860 crore and the IEBRcomponent of Rs 1059711 crore at 2006–07 prices.Resource allocation in the Central sector accordingto different Heads of Development is indicated inAnnexure 3.1 and the ministry/department-wisedetails of budgetary support and IEBR are indicated inAnnexure 3.2.
3.47. The Eleventh Plan resources of the States and UTsare projected at Rs 1488147 crore at 2006–07 prices, outof which States’ own resources are Rs 1163296 croreand the Central assistance to States and UTs is Rs 324851crore at 2006–07 prices. Head of Development-wiseallocation for the States/UTs is indicated in Annexeure3.1 with States/UTs-wise core plan details furnished inAnnexure 3.3. These allocations would be finalized inconsultation with the States. Table 3.11 indicates theresources and allocation of public sector resources forthe Eleventh Plan.
Aggregate Plan Tenth Eleventh Increase overResources Plan Plan Tenth Plan
Centre 5.38 7.99 2.61
States 4.08 5.55 1.47
Centre and States 9.46 13.54 4.08
Balance fromCurrent Revenues
Centre –0.84 2.31 3.15
States –0.18 1.41 1.59
Centre and States –1.02 3.72 4.74
Source: Planning Commission.
TABLE 3.10Plan Resources as Per Cent of GDP

44 Eleventh Five Year Plan
3.48. A comparison of the distribution of the total GBSin the Tenth and the Eleventh Plan has been shown inTable 3.12. In comparison to the Tenth Plan realization,there is an increase of 125% in the projected GBS forthe Centre for the Eleventh Plan. Central assistance to State/UT Plans for State sector programmes is about 85.6%higher than the grant component realized during theTenth Plan. The share of the projected grant componentof the Central assistance to States/UTs plan in the totalGBS for Eleventh Plan has decreased slightly from whathas been realized in the Tenth Plan (from 26.4% to22.8%) primarily because a much higher allocation hasbeen made to the CSS. The allocation to CSS has increasedfrom 1.40% of GDP for the Tenth Plan to 2.35% of GDPin the Eleventh Plan.
3.49. The projection of GBS allocation to differentsectors, Ministries/Departments and the support tothe State/UT Plan has been made in tune with theapproach adopted for the Eleventh Plan for ‘faster, morebroad-based and inclusive growth’. The Eleventh Planaims at putting the economy on a sustainable growthtrajectory with a growth rate of 10% by the end of thePlan period by targeting robust growth in agriculture at4% per year and by creating productive employment at afaster pace than before. The Eleventh Plan focuses onpoverty reduction, ensuring access to basic physicalinfrastructure, health and education facilities to all whilegiving importance to bridging the regional/social/genderdisparities and attending to the marginalized and theweaker social groups. Accordingly, a major structural shift
(Rs crore at 2006–07 prices)
Centre
Sources of Funding Allocation
1 Budgetary Support 1096860
2 IEBR 1059711
3 Total Centre(1+2) 2156571
States and UTs
Sources of Funding Allocation
4 State Own Resources 1163296
5 Central assistance to State/UT Plan 324851
6 Total States & UTs (4+5) 1488147
Total Public Sector Outlay
7 Grand Total (3+6) 3644718
Source: Planning Commission.
TABLE 3.11Public Sector Allocation for Eleventh Plan
(Rs crore at 2006–07 prices)
Tenth Plan Realization Eleventh Plan Projections
Amount % share in Amount % share in % increase overTotal GBS Total GBS Tenth Plan
Central Sector 486798 73.6 1096860 77.2 125.3
Support to State Plan* 175021 26.4 324851 22.8 85.6
Total 661819 100 1421711 100 114.8
Note: *Grant component only.Source: Planning Commission.
TABLE 3.12GBS Allocation in Tenth and Eleventh Plans

Financing the Plan 45
across sectors has been proposed by allocating moreresources to the priority areas identified for ensuringinclusiveness. A broad picture of the structural changein terms of sectoral allocation of resources has beenshown in the Table 3.13.
3.50. About 74% of the total central allocation for theEleventh Plan has been put aside for the priority sectorslisted in Table 3.13, whereas, their share was only 55%in the Tenth Plan. It may be noted that the share ofinfrastructure and energy in the GBS allocation has fallendespite their being in the priority list. This is not areflection of lack of priority but a reflection of a consciouspolicy to shift from public sector funding in thesesectors to a strategy of increased IEBR and Public-Private Partnership.
3.51. As pointed out in Chapter 1, the objective of theEleventh Plan is to increase investment in infrastructure(including irrigation) from 5% of GDP in 2006–07 to 9%by 2011–12.
3.52. The sector-wise thrust areas identified for EleventhPlan are given in Box 3.2.
3.53. To mobilize resources for allocation to the prioritysectors and to realize a sustainable growth of 10% by theend of the Plan period, there is a need to substantially
enhance the resources for infrastructure development, skilldevelopment and industrial growth, as well. This willcontribute to raising the income levels through employmentgeneration and will also provide impetus to the otherprogrammes. In addition to the identified priority sectors,investment in the private sector including farming,MSMEs has a vital role in achieving regionally balancedand more inclusive growth and also the potentialto generate off-farm employment. Steps are proposedto be taken to provide a comfortable and competitiveenvironment for the MSMEs to grow and some structuraland regulatory changes have also been proposed to attractprivate and foreign investors. Keeping in mind thesocio-economic diversity in the country, decentralizedplanning complemented with greater transparency andaccountability is desirable for the overall development ofthe country. Also, our development strategy should be wellcomplemented by policies for environmental protectionand sustainability.
3.54. The Eleventh Plan proposes to provide Rs 324851crore at 2006–07 prices as CA to State/UT Plans.Table 3.14 indicates the details of sector-wise CAcomponent of the resources of the States/UTs. Out ofthe total CA to States/UTs of Rs 324851 crore at 2006–07prices, 37% (i.e., Rs 122852 crore) has been earmarkedfor the Gadgil Formula driven NCA, Special Plan Assistance(SPA) for Special Category States and Special Central
(Rs crore at 2006–07 prices)
Tenth Plan Eleventh Plan
S. No. Sectors BE# % to Total Projected % to TotalAllocation
1 Education 62461 7.68 274228 19.292 Rural Development Land resources 87041 10.70 190330 13.39
and Panchayati Raj3 Health Family Welfare and Ayush 45771 5.62 123900 8.714 Agriculture and Irrigation 50639 6.22 121556 8.555 Social Justice 36381 4.47 90273 6.356 Physical Infrastructure 89021 10.94 128160 9.017 Scientific Departments 29823 3.66 66580 4.688 Energy 47266* 5.81 57409 4.04
Total Priority Sector 448403 55.10 1052436 74.039 Others 365375 44.90 369275 25.97
Total 813778 100.00 1421711 100.00
Note: #Tenth Plan BE represents the actual allocation during the five years and not the original Tenth Plan projections; *Includes APDRP grantcomponent only.
TABLE 3.13Sectoral Allocation—Tenth Plan and Eleventh Plan

46 Eleventh Five Year Plan
(Rs crore at 2006–07 price)
Sectors Programme Allocation
State Development Plan Normal Central assistance 94720Special Category States Special Plan Assistance 13238
Central Pool for North East and Sikkim 3095Agriculture Rashtriya Krishi Vikas Yojana 22104
Shifting Cultivation 212SCA Border Area Development Programme/Hill Area Development 14894
Programme/North Eastern CouncilIrrigation Accelerated Irrigation Benefit Programme 41568Power Accelerated Power Development & Reform Programme 12820Urban/Local Area Development Jawaharlal Nehru Urban Renewal Mission 41490
Brihan Mumbai Storm Water Drain Project, Mumbai 113MPs’ Local Area Development Programme 6985
Balanced Regional Development Backward Region Grant Fund 25711Elderly and Weaker Section National Social Assistance Programme 15691Adolescent Girls National Programme for Adolescent Girls 886Roads and Bridges 7972Externally Aided Projects Various EAPs 14273Disaster Management Tsunami Rehabilitation Programme 2985Sports Commonwealth Games, 2010 2133E-governance National e-Governance Action Plan 2942Total 324851
TABLE 3.14Projected Central Assistance to States/UTs for Eleventh Plan
Box 3.2Thrust Areas of the Eleventh Plan
Sectors Thrust Areas
Education Quality upgradation in Primary Education, Expansion of Secondary Education, majoremphasis on upgradation of Higher Education including Technical Education, ICTthroughout education system.
Health, Nutrition, Drinking Major upgradation of rural health infrastructure, Medical education, NutritionalWater, and Sanitation support to children and pregnant and lactating women through ICDS, health insurance
based urban health facilities, Health care for elderly, achieving sustainability, improvementin service levels and moving towards universal access to safe and clean drinking water.
Agriculture and Irrigation Ensuring Food Security, Supporting State-specific agriculture strategy and programmes,Better seed production, Focused agricultural research, Extension, Development ofmodern markets.
Rural Development, Land Universalization and improvement in programme delivery of NREGP, IntegratedResources and Panchayati Raj Watershed management including management of underground water level.Social Justice and Empowerment Special attention to the needs of SCs, STs and minorities and other excluded groups
through pre and post-metric scholarship, Hostels for boys/girls, Income and employmentgeneration opportunities, Multi-sectoral development programmes for minorities inminority concentration districts.
Physical Infrastructure Emphasis on the public–private partnership in investment, Initiate policies to ensure time-bound creation of world-class infrastructure, especially in remote and inaccessible ruralareas and NE, Hinterland connectivity through improved rail and road infrastructure.
Energy Electrification of all villages and extending free household connections to all 2.3 croreBPL households through RGGVY, Nuclear power development.
Scientific Departments Development of satellite launch capabilities to GSLV-Mk-III, Development of new energysystems, viz. advance heavy water reactor and nanotechnology.

Financing the Plan 47
Thus, while strenuous efforts are made by both the Centreand the states to achieve a large increase in Plan size, itsimpact is often negated by a running down of servicedelivery capacity already created. The problem arises froma framework that creates a distinction between Plan andnon-Plan expenditure within each sector, motivatedsolely by the need to identify and highlight provision ofincremental service.
3.58. Other perceptions that have developed aroundthis distinction, namely, that Non-Plan expenditureis inherently wasteful and has to be minimized, thatNon-Plan expenditure is different in kind from Planexpenditure, etc., are patently incorrect assessments thathave nevertheless taken deep root in the process ofgovernment expenditure planning. This dichotomy alsoresults in a fragmented view of resource allocations tovarious sectors. The problem has become particularlyacute as government’s emphasis has shifted to the socialsectors where salary costs are high. Routine bans onrecruitment for Non-Plan posts, ostensibly imposedto conserve expenditure, cause serious problem forservice delivery in health, education, extension systems,etc. The case against the use of these categories, bothon grounds of illogicality and dysfunctionality, istherefore indisputable.
3.59. At the same time, it is necessary to understand thatthis classification of expenditures has been usedessentially as a convenient shortcut for the performanceof functions that are inherent in public expendituremanagement. It is perhaps in the manner in which thePlan and Non-Plan distinction has been denuded of itssubstance over the years, rather than in any inherentconceptual inadequacy, that the causes of the present stateof affairs need to be found.
3.60. The basic functions of government expendituremanagement, as applied to an annual budgeting process,are the following:
(i) Assessing the amount of committed expenditure,that is, expenditure whose level cannot be alteredduring the Budget period by any decision thatmight be taken (though the areas where theseexpenditures can be applied may still be open toalteration, and, in any case, the levels of expendituresthemselves would be capable of being altered overa longer time horizon);
Assistance (SCA) for the Border Areas DevelopmentProgramme (BADP)/Hill Area Development Programme(HADP)/North East Council (NEC), etc. The remaining63% of Central assistance to the States is assigned toAdditional Central Assistance (ACA) for various flagshipprogrammes in accordance with the priority set for theEleventh Plan, such as the AIBP, National Social AssistanceProgramme (NSAP), APDRP, BRGF, and JNNURM. Anew programme, the RKVY, has been introduced toincentivize the States to accord a much higher priorityto the agriculture sector in their investment planningby supplementing area specific agricultural strategiesand programmes.
3.55. The overall plan outlay of all the States and UTsis projected to increase from Rs 673132 crore in theTenth Plan to Rs 1488147 crore in the Eleventh Plan(both at the same 2006–07 price levels), an increase of21.1% on a comparable basis. The aggregate pictureindicates that the States would be allocating more thanproportionate increase to social services (40.1%),transport (38.7%) and agriculture and allied activities(37.8%). The States would also be actively pursuingPPP models for infrastructure development whereverpossible. The aggregate picture, it must be noted, concealswide inter-State variations in terms of Plan sizes relativeto GSDP, per capita plan expenditure and percentagesectoral outlays.
ISSUES IN PLAN FINANCING3.56. Several conceptual issues arise from the presentstructure of the Plan financing. Important among theseare classification of expenditure—which has a bearingon the overall expenditure management, the Central Plantransfers mechanism, the treatment of investment ofPSUs financed by IEBR under the Plan, and the role ofSPVs/PPPs and other innovative methods of raisingadditional resources for investment.
CLASSIFICATION OF EXPENDITURE3.57. There has been much debate about the utility orotherwise of the classification of expenditure into Planand Non-Plan. It has been argued that this distinction isillogical and, what is more, even dysfunctional. Theargument against continuing with this distinction is thatthe focus on new schemes/new projects/new extensionsto currently running schemes, etc., which alone qualifyfor being included in the Plan, results in neglect ofmaintenance of the existing capacity and service levels.

48 Eleventh Five Year Plan
(ii) The amount of headroom available within theresource envelope after the committed expendituresare provided for;
(iii) The sectors in which this ‘discretionary’expenditure is to be applied; and
(iv) The process of monitoring and evaluating theefficiency and effectiveness with which theexpenditures are made.
3.61. These functions would have to be performedirrespective of whether we continue to have the twocategories of Plan and Non-Plan expenditures or not. Thesetwo categories, which were initially designed to enablethe fulfilment of the above functions, have now acquiredconnotations that lead to dysfunctionality. The solution,therefore, would be to do away with these categories and,instead, devise other mechanisms that will perform therequisite functions in a rational and effective manner.We need to draw up protocols that will specify who is toperform what part of the above functions and how theentire activity will be coordinated. In this effort, therewould be a need to redefine organizational mandates. Thisactivity will be taken up during the Eleventh Plan period.
3.62. The Revenue–Capital categorization of expenditurehas acquired renewed significance in the post-FRBMscenario. The FRBM law has stipulated the eliminationof revenue deficit in a context where more than three-fourths of Plan expenditure is revenue expenditure. Strictadherence to the FRBM stipulation would have a bearingon the ability of the Centre to formulate Plan schemesdirected at national priorities and also at equalizing theavailability and provision of services across States. Ineffect, we may be in a position where the total resourcesthat can be mobilized within the fiscal deficit ceilingcannot be deployed into schemes which have a highrevenue component.
3.63. The problem is further complicated by the fact thatthe categorization of expenditure into revenue and capitalthat has evolved over the years, does not appear to bestrictly in conformity with the constitutional position onthis issue. The Constitution distinguishes only between‘expenditure on revenue account’ and ‘other expenditure’.Over the years, ‘expenditure on revenue account’ has beenconstrued to mean revenue expenditure. This could bean incorrect interpretation as expenditure met out of
revenues of the Government of India (GoI) has beeninterpreted earlier (as is clear from reports of FinanceCommissions) as expenditure that is not self financing,that is, both revenue expenditure and those capitalexpenditures that are not self liquidating (in the sense ofnot providing financial returns to the government thatcould be used for servicing debt). In this view, the presentcategory of Defence Capital Expenditure, for instance,would have to be treated as ‘expenditure on revenueaccount’ only. This is in keeping with the economicclassification in the national accounts where Defencecapital expenditure is treated as consumption and notas investment.
3.64. It is also relevant to note that capital expenditureas currently defined is not always and invariablytantamount to investment. For example, recapitalizationof PSEs, though classified as capital expenditure, is not,in most cases, investment. In fact a loss-making PSUmay receive injections of equity to fund losses, in whichcase what is conceptually a subsidy will be classified as acapital expenditure.
3.65. Some argue that the Revenue–Capital classificationis also dysfunctional from an economic managementperspective as it militates against the principle of soundand efficient management of the entire expenditure in anintegrated manner. Over the years, essential maintenanceexpenditure has become a casualty of the revenue–capital distinction.
3.66. There are other inconsistencies also with ourcurrent system of classification. For example, fertilizerand food subsidies are not counted as Plan expenditurebut subsidy to socially desirable insurance schemes, andseveral other subsidies are also included. Exclusion oflarge subsidy items from Plan expenditure has the effectof avoiding any resource prioritization in the matter ofdetermining the appropriate balance between subsidylevels and other expenditure to promote commondevelopmental objectives.
3.67. Against the above backdrop, it would be appropriateto set up a HLC that could look into the entire gamut ofissues arising from the present classification of expenditureand suggest measures for efficient management ofpublic expenditure.

Financing the Plan 49
CENTRAL PLAN TRANSFERS3.68. The last two decades have seen a massive increasein both the number of CSS as well as funds availableunder individual schemes. These schemes provide CAfor Plan expenditure in particular sectors which arenormally in the domain of the States. However, unlikenormal CA which is not tied to specific programmes,funds available under CSS are tied to schemes inparticular sectors and are subject to centrally prescribedguidelines. The share of normal Central Plan assistanceto the States has declined as a proportion to total Plantransfers. The role of CSS has often been discussed anda view frequently expressed is that CSS should beabolished and the funds flowing through these schemesshould simply be transferred to the States directly,presumably as NCA. There are two arguments againstthis approach. First, there is merit in using Centralresources to tackle the specific obstacles that wouldprevent the achievement of inclusive growth and thisis best done by effectively earmarking resources tosupport State expenditure in particular areas such as ruraldevelopment, health, education, agriculture and irrigation.Unless this is done, it will be difficult to give a specialimpetus to these critical areas. Second, the mechanismof CSS enables the Centre to address problems as theyexist in different States without being constrained by theGadgil Formula, which would otherwise guide thetransfer of untied funds.
3.69. A large proportion of the fund transfers to the Statesunder CSS are also being routed to State and district levelbodies directly by the Central Government, bypassing theState Governments. This practice is motivated by a desireto avoid delays in administrative approvals and to preventdiversion of CSS funds by the States for supporting theirways and means position. Concerns about what this doesto accountability mechanisms have been expressed. Inview of the growing volume of such transfers, suitablemechanisms would have to be devised to ensure there isno dilution of accountability.
MONITORING OF PLAN EXPENDITURE3.70. The existing system of accounting for Plan schemes,both for the Centre and the States, does not adequatelysupport informed planning, budgeting, effective monitoringand decision making regarding these schemes. Thecurrent accounting system does not capture transaction-
oriented information. It also does not distinguishbetween transfers to States, final expenditure and advancepayments against which accounts have to be rendered.The extant accounting framework is also not structuredto generate State-wise and scheme-wise releases of fundsby the Central Government to States and other recipients,and also the actual utilization for the intended purpose.Hence, there is a great need to design and implement aPlan scheme that would thoroughly reform this process.This Plan scheme would, inter-alia, modify the existingCode of Accounts so as to fully capture the entire rangeof Plan schemes operated by the GoI and the States. TheCode of Accounts needs to be restructured to provideinformation relating to each implementing agency.While there have been stand-alone efforts by variousMinistries and programmes, there is no consolidatedfinancial information system based on the accountingstructure. A comprehensive Decision Support System(DSS) and Management Information System (MIS)for effective monitoring of Plan schemes would need tobe set up. This will work through a core accountingsolution on a central data centre. The scheme will beimplemented by the Controller General of Accounts(CGA). The details of the scheme would be finalized duringthe Eleventh Plan.
SCOPE OF THE PUBLIC SECTOR PLAN3.71. The administrative machinery through which thepublic sector plan is implemented has been continuouslychanging over the years. The setting up of PRIs, theestablishment of special purpose societies and agencies andcompanies that have been mandated to perform specialfunctions, are all elements of the plan implementationmachinery that did not exist earlier. At the same time,some organizations that were earlier part of the publicsector may have moved out of the public sector due toprivatization as in the case with a few enterprises—bothin the Centre and in the States. The focus on public–privatepartnership also creates new categories where publicsector resources are made available to projects owned andmanaged by the private sector. In this context, thedefinition of the organizational boundaries of the publicsector plan assumes importance, both for reasons ofanalytical clarity as well as inter-temporal comparability.This was a specific issue on which the Working Groupsthat were set up for estimation of Central and Stateresources were specifically required to comment.

50 Eleventh Five Year Plan
3.72. While the Centre has consistently followed thepractice of including the investment plans of a largenumber of PSEs in the public sector plan, the States havenot adopted any uniform policy in this regard. Even inthe case of the Centre, the PSEs that are included in thePlan from year to year show minor variations. Even amongthose PSEs that are included in the Plan, the resourcesestimates do not capture the entire quantum of resourcesavailable, and a portion of the available resources istreated as being outside the Plan.
3.73. As far as the States are concerned, there is nouniform practice across all States. While requesting theStates to estimate resources for the Eleventh Five Year Plan,they were advised that the public sector plan of the Stateswould have to be defined as the sum total of investmentsmade in a State by the State Government, taken as acomposite economic entity. It was explained that thiseconomic entity would be comprised of more than onelegal entity, and would include, apart from the StateGovernment itself, other legal entities such as the StatePSEs, and all urban and rural local bodies. As far as thePSEs themselves are concerned, the guidelines providedthat PSEs which are separate from the government onlyas legal entities (through share-holding or other form ofcapital being wholly or substantially held by the StateGovernment) and which make materially significantinvestments (i.e., other than small investments that are onlyincidental to or supportive of routine activities) in a directmanner (i.e., who are not financial intermediaries whoseactivities consist of providing either loan or equity capitalto other entities who in turn make investments) shouldbe included in the scope of the public sector plan.Unfortunately, the States have not uniformly rationalizedtheir definitions of the public sector plan on theseprinciples. Consequently, the resources estimates haveproceeded on the same basis as in earlier plans and, tothat extent, comparability across States is not what itshould be.
3.74. One of the new innovations that is likely to gainimportance in the Eleventh Plan period is the concept ofinvestment in infrastructure through PPPs, which ispromoted through means such as Viability Gap Funding(VGF). In such a case, the extent to which the investmentwas eventually made should be reflected as part of thepublic sector is an issue on which there is lack of clarity.If the expenditure from the public sector is viewed as a
grant, then it is a revenue expenditure on the part of thegovernment which finances investment in the privatesector, the grant being a source of financing for the privateinvestor.
3.75. The HLC referred to above (paragraph 3.67) wouldperhaps have to be entrusted the task of laying downclearly the definition of the public sector plan.
REVENUE DEFICIT CONSTRAINT3.76. Under the FRBM Act, all the States as well as theCentre are committed to reducing the revenue deficit tozero by 2008–09. This would mean that there would be nonet dis-saving on account of government administration.In fact, given the relationship between the revenue deficitand savings of the government, a zero revenue deficitwould probably, in fact, result in a small positive savingfrom government administration. One of the problemswith achieving a zero revenue deficit is that the Planoutlays of both the Centre and the States have, in recentyears, had an increasing share of revenue expenditure.In the Central budget, in particular, the grant componentof transfers to the States is revenue expenditure. As a result,the revenue expenditure component of the Centre’s GBSfor the Plan has risen to more than 80% in recent years.While the actuals of 2005–06 show that 79.5% of GBSwas revenue expenditure, this increased to 83.7% in therevised estimates for 2006–07, and 85% in the budgetestimates for 2007–08.
3.77. If the revenue deficit is to be reduced to zero from2008–09 onwards, this would mean that the revenueexpenditure component of GBS cannot exceed the BCR.In recent years, the Central Government has been achievinga positive BCR. However, going by the present projections,the BCR would reach only around 70% of GBS by theend of the Plan period if the gross fiscal deficit were tobe taken at the ceiling of 3% of GDP. In other words,leaving the revenue expenditure share in GBS at the samelevels at present would effectively mean that the total GBSwould have to be reduced to a level below what would bepermissible under a 3% gross fiscal deficit constraint.
3.78. The resources estimates now prepared make it veryclear that the constraint of maintaining the revenue deficitat zero from 2008–09 onwards will have the inevitableconsequence of very substantially limiting the overall GBSfor the Plan. The overall pattern of revenue and capital

Financing the Plan 51
expenditure in the GBS is the result of the core strategyof the Plan which seeks to substantially improve thesupply of social services in the relatively backward Statesthrough increased Central funding, while at the sametime providing an incentive framework for physicalinfrastructure to be created under PPP models. Given thisstrategy, and the consequent high revenue expenditureto GBS percentage, one option would be to insist on thebinding nature of only the GFD to GDP constraint while
accepting the inevitability of high revenue expenditurein view of the Plan strategy. The other option wouldbe to try and identify components of what is bookedas revenue expenditure in the accounts of the CentralGovernment that lead to capital asset creation in theeconomy and to suitably reflect this asset creation in theaccounting for the purposes of the FRBM Act. On abalance of advantage, it would appear that the formercourse would be preferable.
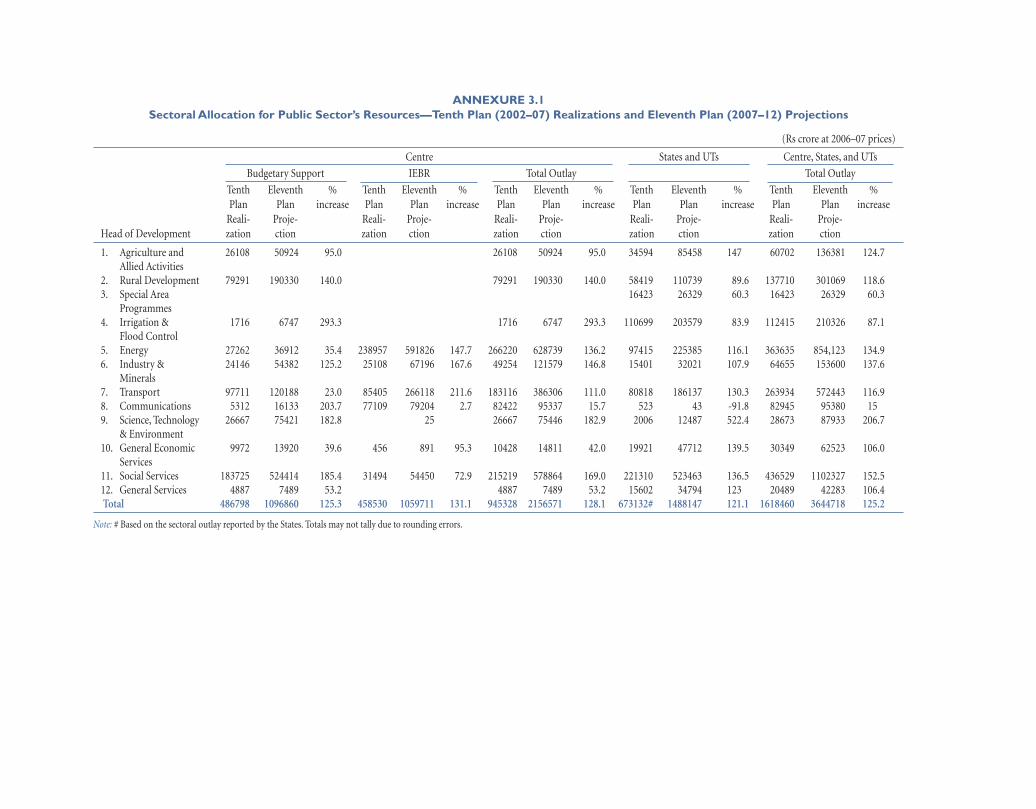
ANNEXURE 3.1Sectoral Allocation for Public Sector’s Resources—Tenth Plan (2002–07) Realizations and Eleventh Plan (2007–12) Projections
(Rs crore at 2006–07 prices)
Centre States and UTs Centre, States, and UTs
Budgetary Support IEBR Total Outlay Total Outlay
Tenth Eleventh % Tenth Eleventh % Tenth Eleventh % Tenth Eleventh % Tenth Eleventh %Plan Plan increase Plan Plan increase Plan Plan increase Plan Plan increase Plan Plan increase
Reali- Proje- Reali- Proje- Reali- Proje- Reali- Proje- Reali- Proje-Head of Development zation ction zation ction zation ction zation ction zation ction
1. Agriculture and 26108 50924 95.0 26108 50924 95.0 34594 85458 147 60702 136381 124.7Allied Activities
2. Rural Development 79291 190330 140.0 79291 190330 140.0 58419 110739 89.6 137710 301069 118.63. Special Area 16423 26329 60.3 16423 26329 60.3
Programmes4. Irrigation & 1716 6747 293.3 1716 6747 293.3 110699 203579 83.9 112415 210326 87.1
Flood Control5. Energy 27262 36912 35.4 238957 591826 147.7 266220 628739 136.2 97415 225385 116.1 363635 854,123 134.96. Industry & 24146 54382 125.2 25108 67196 167.6 49254 121579 146.8 15401 32021 107.9 64655 153600 137.6
Minerals7. Transport 97711 120188 23.0 85405 266118 211.6 183116 386306 111.0 80818 186137 130.3 263934 572443 116.98. Communications 5312 16133 203.7 77109 79204 2.7 82422 95337 15.7 523 43 -91.8 82945 95380 159. Science, Technology 26667 75421 182.8 25 26667 75446 182.9 2006 12487 522.4 28673 87933 206.7
& Environment10. General Economic 9972 13920 39.6 456 891 95.3 10428 14811 42.0 19921 47712 139.5 30349 62523 106.0
Services11. Social Services 183725 524414 185.4 31494 54450 72.9 215219 578864 169.0 221310 523463 136.5 436529 1102327 152.512. General Services 4887 7489 53.2 4887 7489 53.2 15602 34794 123 20489 42283 106.4 Total 486798 1096860 125.3 458530 1059711 131.1 945328 2156571 128.1 673132# 1488147 121.1 1618460 3644718 125.2
Note: # Based on the sectoral outlay reported by the States. Totals may not tally due to rounding errors.

ANNEXURE 3.2Budget Support, IEBR, and Outlay for Central Ministry/Department—Tenth Plan (2002–07) Realizations and Eleventh Plan (2007–12) Projections
(Rs crore at 2006–07 prices)
Ministry/Department Budgetary Support IEBR Total Outlay
Tenth Eleventh % Tenth Eleventh % Tenth Eleventh %Plan Plan increase Plan Plan increase Plan Plan increase
Realization Projection Realization Projection Realization Projection
1. Agriculture And Cooperation 16025 36549 128.07 16025 36549 128.072. Agricultural Research and Education 4956 11131 124.60 4956 11131 124.603. Animal Husbandry Dairying 2520 7121 182.58 2520 7121 182.58
and Fisheries4. Micro, Small, and Medium Enterprises 5786 10168 158.33 339.58 261.71 –22.93 6126 10430 141.16
(i) Agro And Rural Industries 3914 6631 69.43 3914 6631 69.43(ii) Small-Scale Industries 1872 3537 88.90 340 262 –23 2212 3798 71.73
5. Atomic Energy 16435 20318 23.63 9093 28699 216 25528 49017 92.016. Chemicals and Petrochemicals 612 1733 183.32 58 303 421 670 2036 203.997. Fertilizers 714 1320 84.84 3210 16919 427 3924 18239 364.768. Civil Aviation 588 1680 185.93 9947 41880 321 10535 43560 313.499. Coal 1019 1326 30.07 15563 61826 297 16582 63152 280.84
10. Commerce 5062 8767 73.19 53 5115 8767 71.3911. Industrial Policy and Promotion 1941 3698 90.47 1941 3698 90.4712. Posts 3845 3536 –8.03 3845 3536 –8.0313. Telecommunications 906 1549 70.98 76338 79204 4 77244 80753 4.5414. Information Technology 1902 11048 480.77 771 2674 11048 313.2315. Corporate Affairs 1 187 1 18716. Consumer Affairs 284 958 237.04 284 958 237.0417. Food and Public Distribution 268 614 128.96 456 891 95 725 1505 107.7518. Culture 1643 3116 89.63 1643 3116 89.6319. Defence20. Development of North Eastern Region 169 447 164.91 169 447 164.9121. Earth Sciences 1060 6193 484.45 1060 6193 484.4522. Environment and Forests 5600 8841 57.86 5600 8841 57.8623. External Affairs 3463 2201 –36.44 3463 2201 –36.4424. Economic Affairs* 2893 3946 36.42 2893 3946 36.4225. Expenditure 2 5 189.35 2 5 189.3526. Food Processing Industries 531 3564 570.78 531 3564 570.7827. Health and Family Welfare 38344 120375 213.93 504 38344 120879 215.2428. AYUSH 1112 3526 217.13 1112 3526 217.13
(Annexure 3.2 contd.)

(Annexure 3.2 contd.)
(Rs crore at 2006–07 prices)
Ministry/Department Budgetary Support IEBR Total Outlay
Tenth Eleventh % Tenth Eleventh % Tenth Eleventh %Plan Plan increase Plan Plan increase Plan Plan increase
Realization Projection Realization Projection Realization Projection
29. Heavy Industry 1409 3619 156.82 2074 6373 207 3483 9992 186.8830. Public Enterprises 101 48 –52.68 101 48 –52.6831. Home Affairs 1438 6189 330.31 1438 6189 330.3132. School Education and Literacy 50112 163506 226.28 50112 163506 226.2833. Higher Education 13112 75102 472.76 13112 75102 472.7634. Information and Broadcasting 1611 4809 198.50 1371 127 –91 2982 4936 65.5135. Labour and Employment 904 2210 144.48 904 2210 144.4836. Law and Justice 519 1300 150.35 519 1300 150.3537. Mines 1118 1043 –6.70 2293 6387 179 3411 7430 117.8338. Minority Affairs 120 6189 120 6189 5078.1339. Non-Conventional Energy Sources 1808 3537 95.65 2367 6246 164 4175 9783 134.3140. Panchayati Raj 136 775 471.57 136 775 471.5741. Parliamentary Affairs42. Personnel, Public Grievances and Pensions 188 491 161.43 188 491 161.4343. Petroleum and Natural Gas 370 174 –52.88 148532 244973 65 148902 245148 64.6444. Planning ** 207 22799 10919.26 207 2279945. Power 14444 26924 86.41 72495 278781 285 86938 305705 251.6346. Railways 40119 40513 0.98 51431 150000 192 91551 190513 108.1047. Revenue48. Rural Development 98432 172350 75.10 98432 172350 75.1049. Land Resources 6224 17205 176.42 6224 17205 176.4250. Drinking Water Supply 19893 41825 110.25 19893 41825 110.2551. Science and Technology 4407 9750 121.23 4407 9750 121.2352. Scientific and Industrial Research 3256 7957 144.36 25 3256 7982 145.1253. Biotechnology 1795 5649 214.74 1795 5649 214.7454. Shipping 1450 4465 207.86 8704 39409 353 10154 43874 332.0955. Road Transport and Highways 40294 73530 82.48 15323 34829 127 55617 108359 94.8356. Social Justice and Empowerment 7691 11532 49.95 7691 11532 49.9557. Space 11945 27305 128.59 11945 27305 128.5958. Statistics and Programme 314 530 68.59 314 530 68.59
Implementation
(Annexure 3.2 contd.)

(Annexure 3.2 contd.)
(Rs crore at 2006–07 prices)
Ministry/Department Budgetary Support IEBR Total Outlay
Tenth Eleventh % Tenth Eleventh % Tenth Eleventh %Plan Plan increase Plan Plan increase Plan Plan increase
Realization Projection Realization Projection Realization Projection
59. Steel 113 192 69.84 7979 8254 3 8092 8447 4.3960. Textiles 4909 12378 152.13 8 4918 12378 151.7061. Tourism 2849 4558 59.96 2849 4558 59.9662. Tribal Affairs 1481 3633 145.22 1481 3633 145.2263. Urban Development 12805 11001 –14.09 5066 13599 168 17871 24600 37.6564. Urban Employment and 2850 3260 14.37 25057 40220 61 27907 43480 55.80
Poverty Alleviation65. Water Resources 2435 2870 17.88 2435 2870 17.8866. Women and Child Development 16307 48420 196.92 16307 48420 196.9267. Youth Affairs And Sports 1949 5305 172.26 1949 5305 172.26
68. Grand Total 486798 1096860 125.32 458530 1059711 131 945328 2156571 128.13
Note: Totals may not tally due to rounding errors. * The allocation also includes funds for Central Road Fund. ** Includes allocation for Energy (R&D) and Skill Development Mission.

ANNEXURE 3.3Proposed Sectoral Allocations for States and Union Territories in the Eleventh Plan
(Rs crore at 2006–07 price)
S. No. Major Heads of Andhra %-age Arunachal %-age Assam %-age Bihar %-age Chhattisgarh %-age Goa %-ageDevelopment Pradesh to total Pradesh to total to total to total to total to total
1 2 3 4 5 6 7 8 9 10 11 12 13 14
I. Agriculture and Allied Activities 7377.69 5.01 752.00 9.52 517.94 2.16 1697.71 2.80 1482.96 2.76 211.76 2.50
II. Rural Development 14520.28 9.85 258.22 3.27 1878.69 7.84 7848.78 12.95 3234.57 6.02 234.98 2.77
III. Special Area Programmes 3552.61 2.41 423.38 5.36 97.41 0.41 646.43 1.07 198.80 0.37 23.10 0.27
IV. Irrigation and Flood Control 34292.18 23.27 516.95 6.54 2862.96 11.95 7876.15 12.99 5550.35 10.33 579.74 6.83
V. Energy 22582.35 15.32 1280.19 16.20 2601.67 10.86 4717.84 7.78 13991.40 26.04 830.08 9.78
VI. Industry and Minerals 5233.51 3.55 195.49 2.47 360.08 1.50 1982.43 3.27 924.16 1.72 117.73 1.39
VII. Transport 12629.76 8.57 1589.50 20.12 3173.47 13.25 14726.26 24.29 6007.06 11.18 716.84 8.45
VIII. Communications 0.00 0.00 0.00 0.00 0.00 0.00 0.00 0.00 0.00 0.00 0.00 0.00
IX. Science and Technology 35.41 0.02 44.94 0.57 213.74 0.89 311.32 0.51 2772.49 5.16 315.33 3.72
X. General Economic Services 2544.80 1.73 442.88 5.61 575.66 2.40 2797.37 4.61 1015.51 1.89 181.19 2.14
XI. Social Services 43111.28 29.25 2237.91 28.32 11152.75 46.56 17480.06 28.83 18316.70 34.09 3977.70 46.88Education 6061.14 4.11 1131.59 14.32 3306.90 13.81 5385.65 8.88 4217.84 7.85 1568.60 18.49Medical and Public Health 4206.26 2.85 287.62 3.64 848.06 3.54 872.54 1.44 1665.64 3.10 254.69 3.00Water Supply and Sanitation 5778.65 3.92 278.63 3.53 426.25 1.78 1587.39 2.62 5625.58 10.47 883.74 10.42Housing 5895.80 4.00 189.36 2.40 5.86 0.02 1429.28 2.36 182.68 0.34 94.68 1.12Urban Development 5332.86 3.62 230.99 2.92 5948.67 24.83 3666.88 6.05 4411.27 8.21 437.99 5.16Others Social Services 15836.57 10.74 119.72 1.52 617.01 2.58 4538.32 7.49 650.14 1.21 738.00 8.70
XII. General Services 1515.12 1.03 159.54 2.02 519.65 2.17 546.66 0.90 236.41 0.44 1296.55 15.28
Grand Total 147395.00 100.00 7901.00 100.00 23954.00 100.00 60631.00 100.00 53730.43 100.00 8485.00 100.00
(Annexure 3.3 contd.)

S. No. Major Heads of Gujarat %-age Haryana %-age Himachal %-age Jammu & %-age Jharkhand %-age KarnatakaDevelopment to total to total Pradesh to total Kashmir to total to total
1 2 15 16 17 18 19 20 21 22 23 24 25
I. Agriculture and Allied Activities 5639.37 5.27 1636.27 4.90 1470.08 10.67 1818.21 7.04 2517.75 6.26 4317.30
II. Rural Development 3154.80 2.95 1536.29 4.60 355.62 2.58 615.61 2.38 5500.57 13.67 4822.5
III. Special Area Programmes 83.61 0.08 173.54 0.52 20.47 0.15 1419.76 5.50 1855.78 4.61 683.35
IV. Irrigation and Flood Control 29196.49 27.31 3975.82 11.91 1220.62 8.86 735.02 2.85 3379.37 8.40 26033.78
V. Energy 3767.21 3.52 3901.64 11.69 1122.14 8.14 8196.95 31.73 5634.62 14.00 12876.51
VI. Industry and Minerals 3203.92 3.00 410.08 1.23 177.68 1.29 550.88 2.13 871.34 2.17 1259.31
VII. Transport 9368.75 8.76 4625.88 13.86 2142.28 15.55 2660.81 10.30 4712.74 11.71 12599.10
VIII. Communications 0.00 0.00 0.00 0.00 0.05 0.00 42.34 0.16 0.00 0.00 0.00
IX. Science and Technology 793.82 0.74 27.08 0.08 2.92 0.02 23.70 0.09 911.55 2.27 1370.23
X. General Economic Services 2057.60 1.92 1136.00 3.40 798.59 5.80 2740.98 10.61 647.65 1.61 2461.42
XI. Social Services 49586.47 46.38 15610.80 46.78 6060.29 43.99 6501.40 25.17 13261.34 32.96 33977.03Education * 3113.30 9.33 1679.87 12.19 2160.37 8.36 4468.63 11.10 5842.5Medical and Public Health * 676.31 2.03 1445.19 10.49 1353.15 5.24 1809.37 4.50 1963.01Water Supply and Sanitation * 4879.76 14.62 1443.93 10.48 1406.28 5.44 1225.51 3.05 5328.05Housing * 406.75 1.22 553.76 4.02 9.90 0.04 17.51 0.04 3931.04Urban Development * 817.66 2.45 127.54 0.93 788.39 3.05 1721.55 4.28 9510.28Others Social Services * 5717.02 17.13 810.00 5.88 783.31 3.03 4018.77 9.99 7402.11
XII. General Services 65.97 0.06 340.59 1.02 407.25 2.96 528.32 2.05 947.30 2.35 1263.46
Grand Total 106918.00 100.00 33374.00 100.00 13778.00 100.00 25834.00 100.00 40240.00 100.00 101664.00
(Annexure 3.3 contd.)
(Annexure 3.3 contd.)

S. No. Major Heads of %-age Kerala %-age Madhya %-age Maharashtra %-age Manipur %-age Meghalaya %-ageDevelopment to total to total Pradesh to total to total to total to total
1 2 26 27 28 29 30 31 32 33 34 35 36
I. Agriculture and Allied Activities 4.25 2418.65 5.77 3751.24 5.33 10203.04 8.00 439.23 5.39 735.22 8.00
II. Rural Development 4.74 1926.64 4.59 10739.26 15.27 13391.49 10.50 271.14 3.33 802.30 8.73
III. Special Area Programmes 0.67 344.88 0.82 887.60 1.26 765.23 0.60 231.43 2.84 189.09 2.06
IV. Irrigation and Flood Control 25.61 2343.41 5.59 14934.79 21.24 26782.98 21.00 772.38 9.47 219.72 2.39
V. Energy 12.67 5547.94 13.23 9416.25 13.39 19130.70 15.00 1498.71 18.38 1084.88 11.81
VI. Industry and Minerals 1.24 1180.84 2.82 591.12 0.84 1913.07 1.50 656.14 8.05 290.50 3.16
VII. Transport 12.39 2524.56 6.02 8006.72 11.38 8927.66 7.00 403.16 4.94 1623.62 17.68
VIII. Communications 0.00 0.00 0.00 0.00 0.00 0.00 0.00 0.00 0.00 0.00 0.00
IX. Science and Technology 1.35 1094.17 2.61 161.05 0.23 127.54 0.10 127.63 1.57 245.07 2.67
X. General Economic Services 2.42 2197.05 5.24 1564.95 2.23 5101.52 4.00 157.98 1.94 253.00 2.75
XI. Social Services 33.42 10056.12 23.98 20159.98 28.67 38261.40 30.00 3273.20 40.14 3481.74 37.91Education 5.75 687.38 1.64 8684.21 12.35 7652.28 6.00 748.44 9.18 1336.29 14.55Medical and Public Health 1.93 423.74 1.01 1318.37 1.87 2550.76 2.00 103.05 1.26 633.81 6.90Water Supply and Sanitation 5.24 1202.52 2.87 1558.92 2.22 14870.93 11.66 1135.14 13.92 580.99 6.33Housing 3.87 367.29 0.88 6.49 0.01 1836.55 1.44 309.20 3.79 121.48 1.32Urban Development 9.35 204.92 0.49 4606.36 6.55 5917.76 4.64 237.63 2.91 321.66 3.50Others Social Services 7.28 7170.26 17.10 3985.64 5.67 5433.12 4.26 739.74 9.07 487.51 5.31
XII. General Services 1.24 12305.74 29.34 116.04 0.16 2933.37 2.30 322.98 3.96 259.86 2.83
Grand Total 100.00 41940.00 100.00 70329.00 100.00 127538.00 100.00 8154.00 100.00 9185.00 100.00
(Annexure 3.3 contd.)
(Annexure 3.3 contd.)
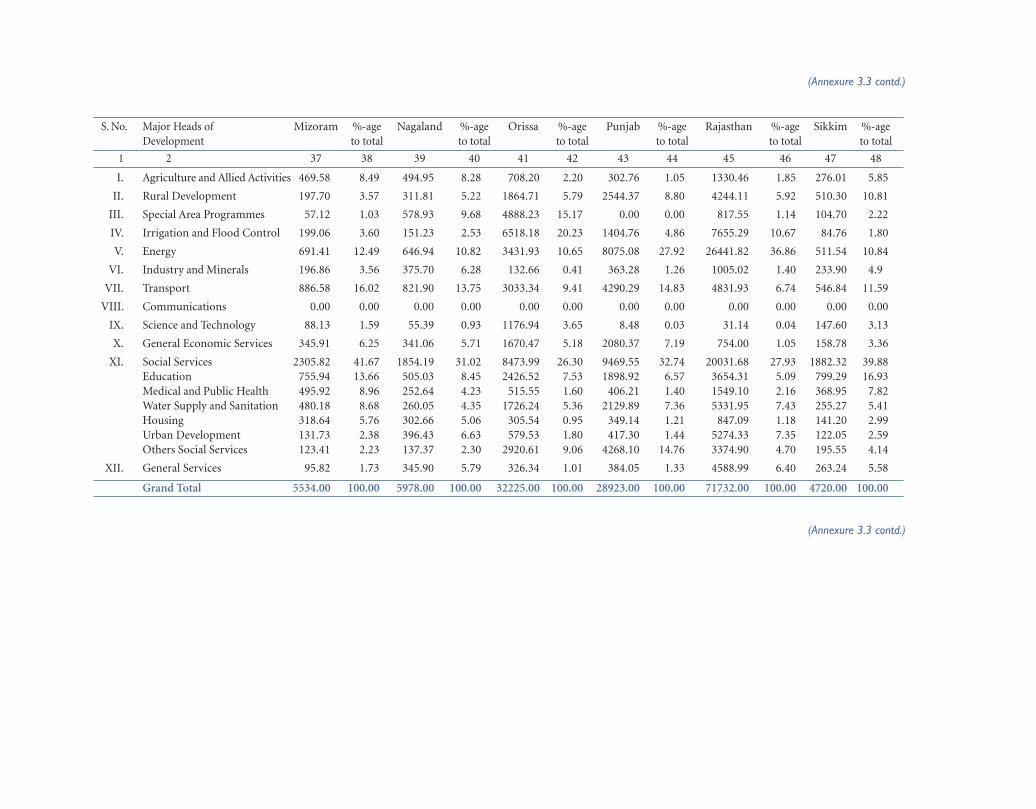
S. No. Major Heads of Mizoram %-age Nagaland %-age Orissa %-age Punjab %-age Rajasthan %-age Sikkim %-ageDevelopment to total to total to total to total to total to total
1 2 37 38 39 40 41 42 43 44 45 46 47 48
I. Agriculture and Allied Activities 469.58 8.49 494.95 8.28 708.20 2.20 302.76 1.05 1330.46 1.85 276.01 5.85
II. Rural Development 197.70 3.57 311.81 5.22 1864.71 5.79 2544.37 8.80 4244.11 5.92 510.30 10.81
III. Special Area Programmes 57.12 1.03 578.93 9.68 4888.23 15.17 0.00 0.00 817.55 1.14 104.70 2.22
IV. Irrigation and Flood Control 199.06 3.60 151.23 2.53 6518.18 20.23 1404.76 4.86 7655.29 10.67 84.76 1.80
V. Energy 691.41 12.49 646.94 10.82 3431.93 10.65 8075.08 27.92 26441.82 36.86 511.54 10.84
VI. Industry and Minerals 196.86 3.56 375.70 6.28 132.66 0.41 363.28 1.26 1005.02 1.40 233.90 4.9
VII. Transport 886.58 16.02 821.90 13.75 3033.34 9.41 4290.29 14.83 4831.93 6.74 546.84 11.59
VIII. Communications 0.00 0.00 0.00 0.00 0.00 0.00 0.00 0.00 0.00 0.00 0.00 0.00
IX. Science and Technology 88.13 1.59 55.39 0.93 1176.94 3.65 8.48 0.03 31.14 0.04 147.60 3.13
X. General Economic Services 345.91 6.25 341.06 5.71 1670.47 5.18 2080.37 7.19 754.00 1.05 158.78 3.36
XI. Social Services 2305.82 41.67 1854.19 31.02 8473.99 26.30 9469.55 32.74 20031.68 27.93 1882.32 39.88Education 755.94 13.66 505.03 8.45 2426.52 7.53 1898.92 6.57 3654.31 5.09 799.29 16.93Medical and Public Health 495.92 8.96 252.64 4.23 515.55 1.60 406.21 1.40 1549.10 2.16 368.95 7.82Water Supply and Sanitation 480.18 8.68 260.05 4.35 1726.24 5.36 2129.89 7.36 5331.95 7.43 255.27 5.41Housing 318.64 5.76 302.66 5.06 305.54 0.95 349.14 1.21 847.09 1.18 141.20 2.99Urban Development 131.73 2.38 396.43 6.63 579.53 1.80 417.30 1.44 5274.33 7.35 122.05 2.59Others Social Services 123.41 2.23 137.37 2.30 2920.61 9.06 4268.10 14.76 3374.90 4.70 195.55 4.14
XII. General Services 95.82 1.73 345.90 5.79 326.34 1.01 384.05 1.33 4588.99 6.40 263.24 5.58
Grand Total 5534.00 100.00 5978.00 100.00 32225.00 100.00 28923.00 100.00 71732.00 100.00 4720.00 100.00
(Annexure 3.3 contd.)
(Annexure 3.3 contd.)
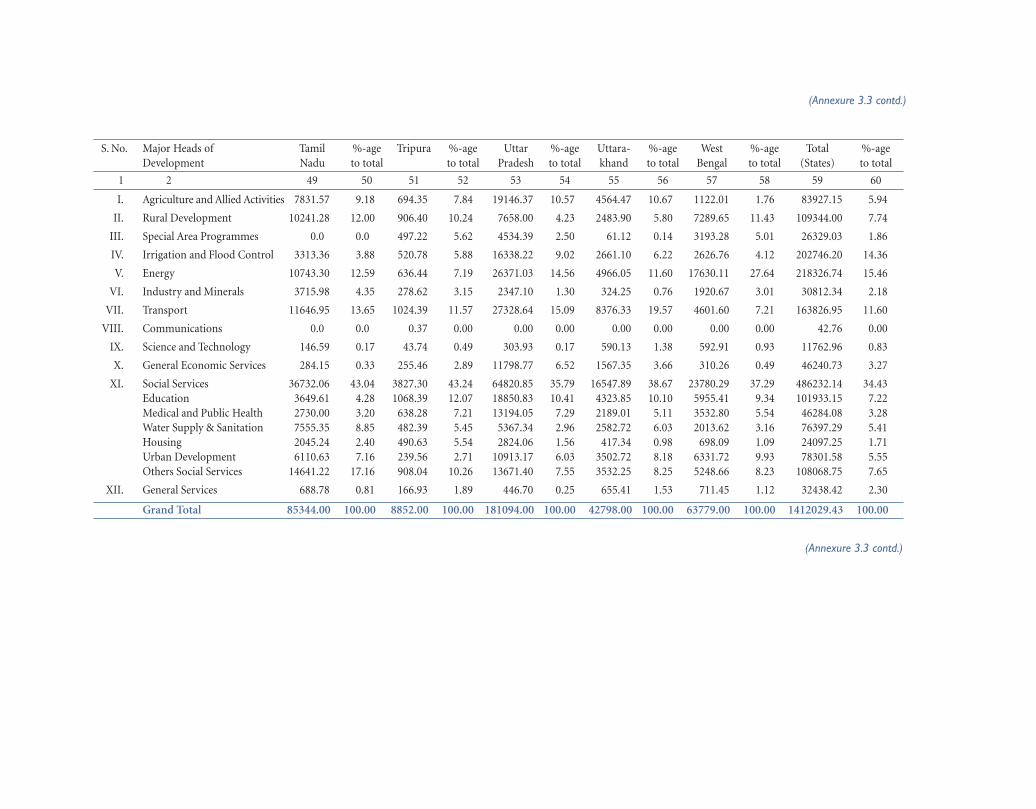
S. No. Major Heads of Tamil %-age Tripura %-age Uttar %-age Uttara- %-age West %-age Total %-ageDevelopment Nadu to total to total Pradesh to total khand to total Bengal to total (States) to total
1 2 49 50 51 52 53 54 55 56 57 58 59 60
I. Agriculture and Allied Activities 7831.57 9.18 694.35 7.84 19146.37 10.57 4564.47 10.67 1122.01 1.76 83927.15 5.94
II. Rural Development 10241.28 12.00 906.40 10.24 7658.00 4.23 2483.90 5.80 7289.65 11.43 109344.00 7.74
III. Special Area Programmes 0.0 0.0 497.22 5.62 4534.39 2.50 61.12 0.14 3193.28 5.01 26329.03 1.86
IV. Irrigation and Flood Control 3313.36 3.88 520.78 5.88 16338.22 9.02 2661.10 6.22 2626.76 4.12 202746.20 14.36
V. Energy 10743.30 12.59 636.44 7.19 26371.03 14.56 4966.05 11.60 17630.11 27.64 218326.74 15.46
VI. Industry and Minerals 3715.98 4.35 278.62 3.15 2347.10 1.30 324.25 0.76 1920.67 3.01 30812.34 2.18
VII. Transport 11646.95 13.65 1024.39 11.57 27328.64 15.09 8376.33 19.57 4601.60 7.21 163826.95 11.60
VIII. Communications 0.0 0.0 0.37 0.00 0.00 0.00 0.00 0.00 0.00 0.00 42.76 0.00
IX. Science and Technology 146.59 0.17 43.74 0.49 303.93 0.17 590.13 1.38 592.91 0.93 11762.96 0.83
X. General Economic Services 284.15 0.33 255.46 2.89 11798.77 6.52 1567.35 3.66 310.26 0.49 46240.73 3.27
XI. Social Services 36732.06 43.04 3827.30 43.24 64820.85 35.79 16547.89 38.67 23780.29 37.29 486232.14 34.43Education 3649.61 4.28 1068.39 12.07 18850.83 10.41 4323.85 10.10 5955.41 9.34 101933.15 7.22Medical and Public Health 2730.00 3.20 638.28 7.21 13194.05 7.29 2189.01 5.11 3532.80 5.54 46284.08 3.28Water Supply & Sanitation 7555.35 8.85 482.39 5.45 5367.34 2.96 2582.72 6.03 2013.62 3.16 76397.29 5.41Housing 2045.24 2.40 490.63 5.54 2824.06 1.56 417.34 0.98 698.09 1.09 24097.25 1.71Urban Development 6110.63 7.16 239.56 2.71 10913.17 6.03 3502.72 8.18 6331.72 9.93 78301.58 5.55Others Social Services 14641.22 17.16 908.04 10.26 13671.40 7.55 3532.25 8.25 5248.66 8.23 108068.75 7.65
XII. General Services 688.78 0.81 166.93 1.89 446.70 0.25 655.41 1.53 711.45 1.12 32438.42 2.30
Grand Total 85344.00 100.00 8852.00 100.00 181094.00 100.00 42798.00 100.00 63779.00 100.00 1412029.43 100.00
(Annexure 3.3 contd.)
(Annexure 3.3 contd.)

S. No. Major Heads of Andaman & %-age Chandigarh %-age Dadra & %-age Daman %-age Delhi %-ageDevelopment Nicoabar Islands to total to total Nagar Haveli to total & Diu to total to total
1 2 61 62 63 64 65 66 67 68 69 70
I. Agriculture and Allied Activities 107.50 2.62 4.34 0.20 29.61 2.28 21.63 2.40 163.79 0.30
II. Rural Development 221.63 5.41 19.24 0.90 35.36 2.72 15.59 1.73 712.69 1.30
III. Special Area Programmes 0.00 0.00 0.00 0.00 0.00 0.00 0.00 0.00 0.00 0.00
IV. Irrigation and Flood Control 52.94 1.29 3.19 0.15 52.41 4.03 27.89 3.10 333.67 0.61
V. Energy 183.96 4.49 305.19 14.31 235.14 18.09 138.07 15.34 5488.68 10.02
VI. Industry and Minerals 27.40 0.67 4.14 0.19 45.37 3.49 35.07 3.90 547.99 1.00
VII. Transport 1843.63 44.97 189.61 8.89 136.81 10.52 179.71 19.97 18572.89 33.89
VIII. Communications 0.00 0.00 0.00 0.00 0.00 0.00 0.00 0.00 0.00 0.00
IX. Science and Technology 93.43 2.28 151.10 7.09 117.59 9.05 12.32 1.37 81.89 0.15
X. General Economic Services 73.21 1.79 15.82 0.74 70.96 5.46 61.51 6.83 173.53 0.32
XI. Social Services 1237.39 30.18 1418.24 66.52 527.22 40.56 370.59 41.18 27434.52 50.06Education 351.65 8.58 282.09 13.23 180.55 13.89 108.59 12.07 4464.55 8.15Medical and Public Health 161.25 3.93 472.97 22.18 165.03 12.69 82.93 9.21 5309.43 9.69Water Supply and Sanitation 237.78 5.80 55.97 2.63 72.66 5.59 53.55 5.95 9125.89 16.65Housing 185.33 4.52 53.49 2.51 17.86 1.37 35.51 3.95 729.44 1.33Urban Development 139.06 3.39 484.12 22.71 69.35 5.33 50.96 5.66 5879.34 10.73Others Social Services 162.30 3.96 69.59 3.26 21.77 1.67 39.05 4.34 1925.89 3.51
XII. General Services 258.92 6.32 21.12 0.99 49.52 3.81 37.61 4.18 1289.48 2.35
Grand Total 4100.00 100.00 2132.00 100.00 1300.00 100.00 900.00 100.00 54799.15 100.00
(Annexure 3.3 contd.)
(Annexure 3.3 contd.)

S. No. Major Heads of Lakshadweep %-age Puducherry %-age Total %-age Total %-ageDevelopment to total to total (UTs) to total (States & UTs) to total
1 2 71 72 73 74 75 76 77 78
I. Agriculture and Allied Activities 185.30 8.82 1018.20 9.44 1530.37 2.01 85457.53 5.74
II. Rural Development 12.25 0.58 378.25 3.51 1395.02 1.83 110739.02 7.44
III. Special Area Programmes 0.00 0.00 0.00 0.00 0.00 0.00 26329.03 1.77
IV. Irrigation and Flood Control 47.55 2.26 314.98 2.92 832.63 1.09 203578.84 13.68
V. Energy 165.30 7.87 541.58 5.02 7057.94 9.27 225384.68 15.15
VI. Industry and Minerals 9.12 0.43 539.35 5.00 1208.45 1.59 32020.79 2.15
VII. Transport 564.91 26.90 822.51 7.63 22310.08 29.31 186137.03 12.51
VIII. Communications 0.15 0.01 0.00 0.00 0.15 0.00 42.91 0.00
IX. Science and Technology 81.85 3.90 186.25 1.73 724.43 0.95 12487.39 0.84
X. General Economic Services 638.43 30.40 438.17 4.06 1471.63 1.93 47712.35 3.21
XI. Social Services 297.12 14.15 5946.89 55.13 37231.97 48.91 523463.11 35.18Education 60.97 2.90 1348.27 12.50 6796.67 8.93 108729.83 7.31Medical and Public Health 34.53 1.64 1386.85 12.86 7613.01 10.00 53897.09 3.62Water Supply and Sanitation 37.26 1.77 466.33 4.32 10049.44 13.20 86446.74 5.81Housing 61.42 2.92 827.18 7.67 1910.23 2.51 26007.48 1.75Urban Development 23.51 1.12 582.17 5.40 7228.51 9.50 85530.10 5.75Others Social Services 79.42 3.78 1336.09 12.39 3634.10 4.77 162852.88 10.94
XII. General Services 98.02 4.67 600.82 5.57 2355.49 3.09 34793.91 2.34
Grand Total 2100.00 100.00 10787.00 100.00 76118.15 100.00 1488147.48 100.00
(Annexure 3.3 contd.)