financing for development - eurodad.orgeurodad.org/files/pdf/1546457-financing-for-developme… ·...
TRANSCRIPT
Financing for development:Key challenges for policy makers
By Jesse Griffiths
Challenge 1:
Stem the loss of tax rev
enues
Challenge 2:
Reduce the risks of priv
ate
investment and actively
manage it to maximise
benefits
Challenge 3:
Provide more and better
international public
resources
Challenge 4:
Reduce and resolve finan
ce
and debt crises

BEPS Base Erosion and Profit Shifting
CIT Corporate Income Tax
CPA Country Programmable Aid
CSO Civil society organisation
DAC Development Assistance Committee (OECD)
DTT Double Taxation Treaty
Eurodad European Network on Debt and Development
FAs Foreign Affiliates
FDI Foreign direct investment
FfD Financing for development
FTT Financial Transaction Tax
GDP Gross domestic product
GFI Global Financial Integrity
GIF Global infrastructure facility
GNI Gross national income
ICIJ International Consortium of Investigative Journalists
IMF International Monetary Fund
IFF Illicit financial flow
ILO International Labour Organization
LATINDADD Latin American Network on Debt, Development and Rights
LIC Low-income country
LMIC Lower middle-income country
LSE London School of Economics
MNC Multinational corporation
MSME Micro, small and medium-sized enterprises
NGO Non-governmental organisation
ODA Overseas development assistance
ODI Overseas Development Institute
OECD Organisation for Economic Co-operation and Development
SDRs Special Drawing Rights
SPE Special Purpose Entity
TJN Tax Justice Network
UMIC Upper middle-income country
UN United Nations
UNCTAD UN Conference on Trade and Development
UNDESA UN Department of Economic and Social Affairs
UNECA UN Economic Commission for Africa
UNEP UN Environment Programme
Acronyms

3
Financing for development: Key challenges for policy makers
Contents
Executive summary 04
Challenge 1: Stem the loss of tax revenues 07
International tax evasion 07
International tax avoidance 08
Tax wars 08
Time for a global tax body 09
Challenge 2: Reduce the risks of private investment 10 and actively manage it to maximise benefits
Domestic investment dominates 10
Significant risks of foreign private capital flows 10 mean quality is paramount
Allow developing countries the tools to maximise the 11 benefits of foreign private capital
Challenge 3: Provide more and better 13 international public resources
Public expenditure has a unique role to play 13
Domestic public resources are large, but not sufficient 14
Other international sources of public financing need 14 to be mobilised
Improving the quality of public resources is as 15 important as increasing the quantity
A renewed global effort to improve the quantity 15 and quality of public finance
Challenge 4: Reduce and resolve finance and 16 debt crises
The international system is prone to crises 16
Sovereign debt crises are a serious factor hindering 17 development
International debt resolution systems have not worked 17
It doesn’t have to be this way: the promise of a debt 18 workout mechanism
Conclusions and recommendations 19
Endnotes 20

4
Financing for development: Key challenges for policy makers
Eurodad’s report The State of Finance for Developing Countries 2014 provided the most comprehensive review of the quantity of different financing resources available to developing countries, and how these have changed over the past decade. It showed that the international economic and monetary system is stacked against developing countries, with losses of financial resources by developing countries proving to be more than double the inflows of financial resources since the 2007-08 global financial crisis.
This paper draws key conclusions for policy makers based on the evidence presented in that report, and other major analyses that have been published in the run up to the United Nations’ third Conference on Financing for Development (FfD), which takes place in Addis Ababa in July 2015.
Executive summary
This paper does not shy away from the scale of the problem. Instead it recognises that fundamental changes are needed in the global financial and economic system. It shows how proposals that have been on the table in the run up to Addis can help to create a system that supports, rather than undermines, development.
It highlights four key challenges facing policy makers, and proposes lasting solutions.
Challenge 1: Stem the loss of tax revenuesDeveloping countries lose very significant, though currently poorly quantified, tax revenues every year, due to failings of the international system. This happens for three main reasons:
International tax evasion. This includes that motivating or resulting from illicit financial flows (IFFs), though there are, as yet, no estimates of the tax lost to IFFs. Tax losses to money already hidden in tax havens are estimated at $190 billion per year. Other estimates for international tax evasion are still needed to fill in gaps in data.
International tax avoidance, where multinationals subvert the spirit, if not always the letter, of the law to avoid tax. Global estimates of the cost are only just beginning to emerge. For example, the United Nations Conference on Trade and Development (UNCTAD) estimates one tax avoidance method alone costs developing countries between $70 billion and $120 billion per year. International Monetary Fund (IMF) researchers estimate that developing countries lose more than $200 billion per year. Some governments assist multinational tax avoidance in order to capture a part of the tax base from activity that, in reality, remains in other countries.
International tax wars, which describes the unhealthy competition between countries to capture private investment, by reducing tax rates, offering incentives or negotiating unfair treaties resulting in sub-optimal outcomes. Again, the evidence on the extent of this problem is only beginning to emerge, although the existing figures suggest the scale may also be very large. For example, ActionAid International estimates that statutory corporate tax exemptions alone cost developing countries $138 billion per year. Ultimately, tax wars fuel a race to the bottom, with governments competing to destroy their tax base, rather than cooperating to fairly tax multinationals.
This is a global problem, affecting all countries. It therefore requires a much greater level of global cooperation and a revision of global tax standards to ensure that the interests of all countries, including developing countries, are represented. Unfortunately, the current global standards are full of loopholes and shortcomings. In many cases they are also clearly not designed to work in countries with low capacity, and in some cases they are outright biased towards the interests of developed countries. This is unsurprising, as they are created by the
4
5
Financing for development: Key challenges for policy makers
Organisation for Economic Co-operation and Development (OECD), a developed country grouping, which also includes many of the countries that are major causes of the problem, and whose secrecy makes it a prime target for lobbying by accountancy firms, multinational corporations and others who benefit from the system. This is why it is time for a truly representative, transparent, effective global tax body, placed under the auspices of the UN to ensure that all countries have a say, with the mandate and resources to tackle these serious problems.
Challenge 2: Reduce the risks of private investment and actively manage it to maximise benefitsInternational private flows have not been rising as a share of Gross Domestic Product (GDP) in developing countries; they remain small compared to domestic private investment. Foreign private financial flows to developing countries offer opportunities to support development, but they also come with substantial risks, which ought to be at the centre of discussions on financing for development. The risks includes volatility – inflows and outflows of private capital can be very destabilising to developing countries, and are often caused by factors outside the recipient country’s control. Recent research shows how developing countries have become more integrated into global capital markets and so are more vulnerable to crises caused by external factors than ever before. In addition, the degree of benefits that developing countries receive can vary widely, with, for example, extractive industry investments typically having relatively low employment impacts, and often high social or environmental costs.
However, policy debates on private finance and development have been dominated by how to ‘leverage’ more international private capital flows to developing countries using public institutions and public financing or guarantees, even though existing mechanisms do not have a great track record. It would be better to focus attention on measures that are needed to help developing countries reduce risks and manage foreign investment to maximise its development potential, including removing obstacles found in trade and investment agreements that prevent developing countries from managing private capital flows to reduce risks, and embracing a new international initiative on responsible financing standards, with strong implementation mechanisms.
Challenge 3: Provide more and better international public resourcesPublic financing has a unique role to play in supporting development, including in financing essential services and ensuring universal social protection floors. Domestic resources are large and can provide the lion’s share of the funding needed, and would be bolstered by efforts to stop tax dodging. However, there is still a significant public expenditure gap, particularly in the poorest countries. By 2013, donors were less than half way to their decades-long target
Developing countries lose hundreds of billions of tax dollars every year due to failings in the international system

6
Financing for development: Key challenges for policy makers
to provide 0.7% of Gross National Income (GNI) as Official Development Assistance (ODA), reaching only 0.29%. Progress towards other commitments, particularly the provision of $100 billion in climate finance by 2020, has been similarly slow.
A better source of additional international public finance could be innovative taxation, such as financial transaction taxes, although efforts to raise this have so far been limited. Significant additional public resources could be mobilised simply by adopting the UN’s proposals to issue new international reserve assets (known as Special Drawing Rights or SDRs) and to allocate these to developing countries.
Major improvements are also needed in the way donors and international institutions deliver international public finance, to solve the key problems of: donor bad practices that reduce the real value of aid; continued donor dominance, which reduces developing country ownership; and a lack of transparency and accountability. Major new efforts to improve both the quantity and quality of international public finance are needed, with strong timetables, starting with the untying of all aid.
Challenge 4: Reduce and resolve finance and debt crises
Finance and banking crises have become a recurring feature of the international economic system since the breakdown of the post-war Bretton Woods system in the early 1970s heralded an end to strict international control over capital flows and exchange rates. There has been a failure to tackle these issues seriously at international level, with perhaps the biggest problem being the lack of effective mechanisms for preventing damaging sovereign debt crises. Existing mechanisms, where they exist, are dominated by creditors, helping to explain why debt restructuring often takes a long time, rarely leads to reduction of debt to sustainable levels, and often comes with damaging conditions. The UN has started a process that provides a unique opportunity to set up a multilateral legal framework for sovereign debt, an important step towards a fair and development-friendly solution to sovereign debt problems. This will require the creation of a Debt Workout Institution, independent of creditors and debtors, to facilitate debt restructuring processes.
2015 is a unique year for global development, with three crucial UN summits promising agreements on Financing for Development, a new set of Sustainable Development Goals to replace the Millennium Development Goals, and a new climate treaty. However, it is clear that flaws in the way the global economic system is managed are fundamental blocks to progress. This paper shows, however, that clear proposals are on the table to deal with some of the biggest development challenges of our generation: now is the time to put these into action.
xx
“International private financial flows come with substantial risks, which should be at the centre of discussions on financing for development.“
6

Financing for development: Key challenges for policy makers
7
Developing countries lose very significant, though currently poorly quantified, tax revenues every year, due to failings of the international system that allow international tax evasion and tax avoidance. The system also promotes an unhealthy fight between countries to capture private investment, by reducing tax rates, or to outright capture taxes from other countries, which can be best described as ‘tax wars’.
For all these reasons, a sea change in international cooperation is needed, with the establishment of a truly representative, transparent, effective global tax body, under the auspices of the UN, which has the mandate and resources to tackle these serious problems.
Figure 1 summarises the incomplete picture of the scale of the tax losses suffered by developing countries caused by tax evasion, aggressive tax avoidance, and tax wars. It highlights the fact that the scale is likely to be very large – at least in the hundreds of billions of dollars – but that international institutions have not, until recently, devoted resources to attempting to estimate it. Hence Figure 1 shows partial estimates. There will be some overlap, but more importantly, in all three categories there are significant areas for which no figures currently exist.
International tax evasion Illicit financial flows – money that has been illegally earned, transferred or used – have long been recognised as a major problem. Eurodad’s calculations, based on figures from Global Financial Integrity (GFI) suggest that IFFs from developing countries were $634 billion in 2011, or 4.3% of their GDP.2 Low-income countries lost a higher proportion of their GDP than middle-income developing countries.3 Of course, given the nature of these flows, this can only be regarded as an indication of scale, though GFI, which provides the data, believes it to be an underestimate. The recent High Level Panel on Illicit Financial Flows from Africa estimates that IFFs make Africa a net creditor to the rest of the world, despite being the poorest continent in terms of GDP per capita.4
Such illicit flows inevitably involve tax evasion, even if this may not be their primary motivation. Illicit flows are caused by a variety of factors, and by a variety of actors, ranging from wealthy individuals to multinational corporations. It is fair to assume that little or no tax has been paid on these flows, and a portion of IFFs are also directly motivated by tax evasion. This is likely to cause a substantial loss of tax revenue to developing countries, although there are as yet no concrete estimates for the size of these losses. In addition, it is important to remember that IFFs also imply a loss of resources that otherwise could have been used for private domestic consumption or investment, boosting the economy of developing countries.
The accumulation of wealth transferred out of developing countries and hidden in tax havens means that tax revenues are not just lost in the year the wealth is transferred. The Tax Justice Network (TJN) estimates that, as of 2010, between $21 trillion and $32 trillion of global financial wealth from a sample of 139, mostly developing, countries has been invested “virtually tax free” through secrecy jurisdictions.5 Using a conservative method, based only on taxing the income from that wealth, they estimate that this has resulted in $189 billion in lost tax revenues annually. 6
Research by London School of Economics (LSE) Professor Gabriel Zucman estimated the annual tax lost on wealthy individuals’ financial assets only held in offshore financial centres is $190 billion, based on a lower
Challenge 1Stem the loss of tax revenues
Figure 1: Estimates of tax losses by developing countries to global problems1
Method Type Estimated annual tax loss (rounded)
Source (see text below for details) and notes
International tax evasion
TOTAL ESTIMATE Not known
The figures below show partial estimates of parts of the problem. There are significant areas for which no figures currently exist.
Illicit financial flows (paying less tax than they ought to owing to their illicit nature.)
Not known
Other international tax evasion Not known
Tax evaded on income on assets illicitly hidden in tax havens
$190 billion Tax Justice Network (TJN)
Gabriel Zucman (London School of Economics – LSE)
International tax avoidance (largely involving multinationals)
TOTAL ESTIMATE Not known
The figures below show partial estimates of part of the problem. There will be overlap and there are significant areas for which no figures currently exist.
Total amount, including all methods and all countries
Not known
Estimate examining only one method – artificial routing through financial centres
$70-120 billion UNCTAD
Partial estimate for profit shifting $210 billion IMF (estimated long run impacts)
‘Base capture’ - governments assisting multina-tional tax avoidance
Not known NB: this is also a major part of issue 3
International tax wars
TOTAL ESTIMATE Not known
The figures below show partial estimates of part of the problem. There are significant areas for which no figures currently exist.
Unfair tax treaties with rich countries Not known
Statutory corporate tax exemptions $140bn ActionAid International
Other tax deals for multinational corporations (MNCs)
Not known globally
Race to the bottom on tax rates Not known

8
Financing for development: Key challenges for policy makers
estimate of the total amount of offshore wealth of $7.6 trillion in 2013.7 Zucman argues that his method “probably delivers a lower bound” estimate, and that there is no way to currently estimate the value of other assets that may be held offshore to evade tax. He notes that “registry data show that a large chunk of London’s luxury real estate is held through shell companies, largely domiciled in the British Virgin Islands, a scheme that enables owners to remain anonymous and to exploit tax loopholes”.8
International tax avoidanceUnacceptable tax avoidance occurs when multinationals creatively structure their operations to avoid tax, undermining the spirit, if not always the letter of tax laws. This causes very significant tax losses to developing countries, although international institutions are only just beginning to calculate these.
This has become a front page issue in recent years, fuelled by investigative journalists using leaked information to expose the scale of the problem. Unfortunately, despite the fact that civil society organisations, including Eurodad, have campaigned on this issue for a number of years – and the fact that the launching of the Base Erosion and Profit Shifting (BEPS) initiative by the OECD shows that policy makers are aware of the issue – very few efforts have been made by official agencies to research and examine the extent of the problem. This is slowly beginning to change, but the main official studies, one by UNCTAD and one by IMF researchers, each only provides a very partial picture.
In 2015, UNCTAD released a study, which later formed part of its flagship World Investment Report.9 This attempted to estimate both the amount of tax paid by multinationals and how much might have been avoided. This exercise proved difficult because “most [multinationals] do not report taxes and other financial information at the level of their FAs [Foreign Affiliates]”.10 This is one reason why Eurodad has been calling for rules to make multinationals report key economic data publicly for every country in which they operate, known as country by country reporting.
UNCTAD examined the costs of tax avoidance dodges based on financial routing using both classic ‘tax havens’ and countries such as the Netherlands, which have introduced tax avoidance opportunities, according to UNCTAD, “due to a favourable
tax and investment regime, typically granted through the option to operate by means of Special Purpose Entities (SPEs)”. UNCTAD estimates that this single tax avoidance mechanism costs developing countries between $66–122 billion in tax per year.
However, the UNCTAD study11 is limited in scope, estimating tax losses to developing countries due to just one particular kind of tax avoidance activity by multinational companies – the use of financial centres to route foreign investment related flows in order to avoid tax. Although this is one aspect of the problem, there are many other methods that multinationals also use to avoid tax. One serious example is transfer mispricing12 – where multinationals artificially manipulate the payments made for goods and services between subsidiaries in order to be able to falsely claim to make the most profits in the jurisdictions with the lowest tax rates.
In the second official study, IMF researchers examined data for 173 countries over 33 years, to try to estimate the impacts of tax avoidance techniques on developing countries’ tax income. They concluded that the long-run revenue losses to developing countries due to profit shifting could be $212 billion per year in the long run, and $105 billion per year in the short term. Over the long term, this means that developing countries are likely to lose almost three times as much, relative to their GDP, as OECD countries.13
However, there are a number of limitations to the study, which again suggest that it is a significant underestimate of the true total. First, they excluded resource-rich developing countries, “since they will likely have distinct drivers and reflect a variety of distinct tax design choices”. Second, they focussed on examining the impact of classically defined tax havens – those small jurisdictions that have made facilitating tax avoidance a major part of their economic strategy, and as a result may not fully take into account the impacts of other major economies, such as the Netherlands and Switzerland, which are also major facilitators of tax avoidance, as the UNCTAD study recognises.
Finally, as the recent LuxLeaks exposés have shown, many countries are actively assisting in international tax avoidance, and undermining the tax base of other countries, through agreeing special deals with multinationals. The LuxLeaks scandal produced a significant amount of detail,
albeit only covering one small country, Luxembourg, about what had previously been a hidden practice: the complicity of some governments in the erosion of tax bases of other countries. LuxLeaks was an exposé by the International Consortium of Investigative Journalists (ICIJ), which released hundreds of tax rulings on multinational corporations that Luxembourg had made. ICIJ argued that, “Big companies can book big tax savings by creating complicated accounting and legal structures that move profits to low-tax Luxembourg from higher-tax countries where they’re headquartered or do lots of business. In some instances, the leaked records indicate, companies have enjoyed effective tax rates of less than 1 percent on the profits they’ve shuffled into Luxembourg.”14
This type of behaviour shows that some governments are effectively aiding and abetting multinationals that want to artificially structure their companies to avoid tax. This is therefore directly related to tax wars, to which we now turn.
International Tax WarsThe unhealthy fight between countries to capture private investment, by reducing tax rates, or to outright capture taxes from other countries can best be described as ‘tax wars’. The term ‘tax competition’ does not adequately imply the significant damage that can be caused in terms of lost revenues, misallocation of revenues and investment,
A global tax body could mandate a global crack down on tax havens and tax dodging and, because all countries have a say, ensure effective global implementation of the changes needed.“
1950
1960
1970
1980
1990
200
0
2010
% to GDP
Figure 2: Numbers of tax treaties signed by developing countries15
3000
2500
2000
1500
1000
500
0
New DTTs
New DTTs involving at least one country not high income

9
Financing for development: Key challenges for policy makers
and damage to international cooperation. There are four main issues at play here.
First, many tax treaties unfairly disadvantage developing countries. Developing countries have signed a large number of tax treaties with developed countries, and with each other in recent years. Figure 216 (previous page) shows the dramatic rise of Double Taxation Treaties (DTTs), which are treaties between two or more countries.
Although the stated aim of many of these treaties is to avoid ‘double taxation’ – where a company might have to pay tax for the same activity in two different jurisdictions – the impact can be extremely unfair, with developing countries being the biggest losers. For example, a recent study17 found that “one estimate… is that treaties with the Netherlands led to foregone revenue for developing countries of at least EUR 770 million in 2011”, while the IMF has produced “very rough calculations [which] suggest that US tax treaties cost their non-OECD country counterparts perhaps $1.6 billion in 2010”.18 The Latin American Network on Debt, Development and Rights (LATINDADD) estimates that Ecuador lost $223 million in tax revenues as a result of its 14 double taxation agreements between 2009 and 2011.19 These problems led the IMF to conclude “… that countries should not enter treaties lightly … but with close and well-advised attention to the risks that may be created”.20
Developing countries can lose out partly because they usually have far more limited negotiating capacity than developed countries, but also because the OECD model used for taxation treaties is part of the problem. One tax expert summarised it thus:
“By signing an OECD model treaty, a signatory accepts separate company accounting (which enables shell corporations), arm’s-length transfer pricing (a battle of the experts),21 and permanent establishment (a limitation on tax jurisdiction over companies doing business). The OECD model treaty—the accepted international standard—is the ultimate source of the problems.”22
Finally, it is worth noting that the supposed benefits of such treaties are highly questionable, with one academic study finding “double taxation treaties have no effect on FDI from developed to less developed countries”.23 In fact, in recent years, developing countries have increasingly begun to suspend or renegotiate such treaties, in recognition of the fact that the treaties can help to encourage rather than reduce tax avoidance.24
Second, taxes on multinational corporations have been significantly reduced in developing countries through the proliferation of tax breaks, tax deals and other tax ‘incentives’
offered by developing countries to multinational companies. Developing countries have a right to offer such incentives, which can be a sensible part of their development strategies. However, very often these are secret deals that developing countries may be under significant pressure to sign, and the true costs may not be fully estimated.
An IMF study found that, although tax incentives may have an impact on the amount of foreign direct investment received, this did not necessarily translate into benefits for the countries, as “lower corporate income tax rates and longer tax holidays are … not [effective] in boosting gross private fixed capital formation or growth”.26
While the benefits are disputed – or as one IMF expert put it “economists, including at the IMF [are] generally sceptical”28 – the losses caused can be enormous. Based on extrapolating from a study of 16 countries, a research report by ActionAid International estimates that “over $138 billion is likely given away by governments every year, just in statutory corporate income tax exemptions”.27 They called this the ‘tip of the iceberg’ as it only examined one form of tax of the five that the study highlighted, as shown in Figure 3.
Third, corporate tax rates have declined significantly in developing countries in recent years, partly due to countries competing to attract or retain multinational enterprises, as Figure 4 shows. Countries comparing their corporate tax rates with other countries, or reducing them to levels that are appropriate for their national circumstances is not per se a bad thing. However, in light of the huge problems identified above, the pressure on countries to slash their corporate tax rates – which, given that effective tax rates across the economy have not declined in developing countries in recent years, implies a rise in other tax rates to compensate29 – is so intense, it can end up as a race to the bottom where no country benefits.
Time for a global tax bodyLoss of tax revenues is a global problem, affecting all countries, which requires a much greater level of global cooperation and a revision of the global tax standards to ensure that the interests of all countries, including developing countries, are represented. Unfortunately, the current global standards are full of loopholes and shortcomings. In many cases they are also clearly not designed to work in countries with low capacity, and in some cases they are outright biased towards the interests of developed countries. This is unsurprising, as they are created by the OECD, a developed country grouping, which also includes many of the countries that are major causes of the problem, and whose secrecy makes it a prime target for lobbying by accountancy firms, multinational
corporations and others who benefit from the system.
Given the scale of the problem, and the fact that, as we have seen, the OECD has proved to be a poor choice of forum for resolving it, the time has come for a global intergovernmental UN tax body, placed under the auspices of the UN, to ensure that all countries have a say, with the mandate and resources to tackle these serious problems. Civil society organisations (CSOs) have published a briefing setting out the rationale for the body,31 and Eurodad has produced ideas about how it would work in practice.32
The establishment of such a body is on the agenda for the Addis Ababa FfD conference and beyond. Such a body would help to foster cooperation rather than a race to the bottom on tax rules. It could mandate a genuine global effort to crack down on tax havens and tax dodging and, by ensuring that all countries have a say, ensure effective global implementation of the changes needed.
Figure 3 – the rise in tax incentives in Sub-Saharan Africa25
Type of investment tax incentive
Proportion of countries offering incentives in...
1980 2005
Tax holidays 45% 69%
Reduced CIT rates 10% 51%
Investment allowances 59% 56%
Incentives for exports 10% 28%
Free zones 3% 46%
Investment code 31% 74%
1980
1984
1988
1992
1996
200
0
200
4
200
8
2012
%
Figure 4: Corporate tax rates in decline30
50
45
40
35
30
25
20
Low income Upper middle income
Lower middle income High income

10
Financing for development: Key challenges for policy makers
Insufficient attention has been paid to the need for developing countries to manage the significant risks associated with international private capital flows, through for example removing barriers to risk management that are currently in trade and investment agreements. Too much attention has been paid to the use of public institutions, finance and guarantees to leverage increased private investment, at the expense of a focus on improving the quality of those flows to maximise development benefits.
Domestic investment dominatesAs recent Eurodad research has shown, domestic private sector investment is far greater than foreign private investment for all categories of developing countries. Figure 5 shows how domestic investment reached over 30% of GDP in recent years for developing countries as a whole, and has been increasing steadily for all categories of developing countries. Although the figures do not allow a detailed breakdown into public and private investment, they suggest that the majority is private investment.33
Significant risks of foreign private capital flows mean quality is paramountContrary to popular wisdom, private capital flows to developing countries have not increased relative to the size of their economies in recent years. It is true that there has been an increase in international private capital flows in absolute dollar terms. However, developing countries’ overall GDP has grown faster than private inflows. This means, as Figure 6 shows, foreign direct investment (FDI) actually decreased as a share of GDP in developing countries as a whole in recent years. Although FDI has grown faster than GDP in the poorest category of developing country (low-income countries), this is caused by a very small number of resource-rich countries.35
Before examining the risks associated with foreign investment, is important to note that there can be a significant variation in its contribution to development, indicating the need to manage it carefully to maximise benefits. Foreign private finance has the capacity to create decent jobs, facilitate technology transfer, and generate domestic resources through taxation. However, we have seen in chapter 2 that developing countries are earning far less in tax than they could from developing countries, in part because of special tax deals multinationals negotiate before they invest.
The employment impacts of foreign investment can also vary greatly. Extractive
industries, which dominate foreign capital flows to many developing countries, employ relatively few people despite large investments. According to recent research, extractives account for 60–90% of FDI to low-income countries, yet generate only 1–2% of total employment.38 The resource extraction sector can also have huge social, environmental and human right impacts, and may increase problems of macroeconomic management. For example, economies that become dependent on a small number of commodities are highly vulnerable to changes in commodity prices, as we shall see in chapter 4.
Foreign capital flows to developing countries offer opportunities to support development, but they also come with substantial risks. The main risk is volatility, with stops and starts or major outflows of international private finance linked to either investors’ perceptions of risk in the recipient country, or factors entirely outside the control of the recipient. Short-term capital flows, or those that can quickly leave the country, such as ‘portfolio equity’ investments in stocks and shares, are regarded as the most risky, and can be highly volatile, as Figure 7 shows.
However, FDI can also be volatile and driven by external factors. For example, FDI inflows to developing countries fell from $491 billion in 2008 to $354 billion in 2009 due to the global financial crisis.39 Although they have subsequently recovered, this recovery is in part also driven by external factors – low interest rates in developed countries driving investors to ‘search for yield’ elsewhere. When interest rates begin to rise again in the coming years, developing countries could face significant shocks in terms of reduced
Challenge 2Reduce the risks of private investment and actively manage it to maximise benefits
Figure 5: Domestic Investment Trends (%GDP)34
% GDP equivalent
LIC LMIC UMIC Total developing country
200
3
200
4
200
5
200
6
2007
200
8
200
9
2010
2011
2012
40
35
30
25
20
15
10
5
0
Figure 6: Foreign Direct Investment (% GDP equivalent)36 % GDP equivalent
LIC LMIC UMIC Total developing country
200
3
200
4
200
5
200
6
2007
200
8
200
9
2010
2011
2012
6
5
4
3
2
1
0
Figure 7: Portfolio equity (%GDP)37
% GDP equivalent
LIC LMIC UMIC Total developing country
2.5
2
1.5
1
0.5
0
-0.5
-1.0
200
3
200
4
200
5
200
6
2007
200
8
200
9
2010
2011
2012

11
Financing for development: Key challenges for policy makers
3.5
3
2.5
2
1.5
1
0.5
0
200
3
200
4
200
5
200
6
2007
200
8
200
9
2010
2011
2012
Figure 8: Repatriated profits exceed new FDI inflows40
% GDP
Repatriated profit FDI inflow
FDI and other private flows.41
In addition, one reaction to the global financial crisis appears to be that FDI has become much more extractive. Since 2008, the repatriation of profits from developing economies by foreign investors has exceeded new FDI going in, as previous Eurodad research42 and Figure 8 shows. This would suggest that foreign investors are seeking to take a larger amount of profit out of their investments in developing countries, perhaps to compensate for their difficulties in developed markets.
Developing countries have become more integrated into global capital markets and so are more vulnerable to crises caused by external factors than ever before. A recent research report from the intergovernmental think tank, the South Centre, finds that international private capital flows to developing economies in recent years means that both their financial assets (that they own overseas) and liabilities (that foreigners own in their countries) have grown in the past decade. The effect of this is that they are now “closely integrated” into “an inherently unstable international financial system”.
This can offer benefits, of course, but the South Centre points out that the way this is happening is causing significant risks, with “almost all” developing countries now at risk of financial crisis. According to their research, there are now two types of developing countries. The first type looks familiar to students of previous financial crises. They have “bubbles in domestic credit and asset markets” and are heavily dependent on external financing – so
changes in exchange rates, or in the opinion of international investors, can spell disaster.
The second type is new, and mostly affects East Asian countries that look – from the outside – as if they are safe. They have “strong external positions” – meaning that they are not so vulnerable to the “typical external financial crisis [where] an emerging economy finds its access to international financial markets interrupted and faces a sudden stop in capital inflows”. Instead, foreign investors have become major players within the domestic financial markets of these countries. This means that a crisis could arise from within a country’s own financial system, but could be triggered by the actions of the foreign investors that are active players in that system, if for example they needed to withdraw capital because of a crisis in their own institution or elsewhere in the world.
Previous Eurodad research has also highlighted that the debt vulnerabilities faced by developing countries have increased in recent years, driven in part by increases in private debt levels, including international private debt.43
Finally, the small size of many developing country economies adds additional burdens to dealing with the risks of international private investment, as investments in single sectors or projects can have a major impact on the overall economy. For example, a study of FDI to low-income countries found that “it has been quite volatile in eight countries, reflecting peaks in oil investment in Cameroon, Chad and Gabon, large individual projects in Gambia and Mali, and political instability in Bolivia, CAR [Central African Republic] and Togo”.44
Allow developing countries the tools to maximise the benefits of foreign private capitalPolicy debates on private finance and development have been dominated by how to ‘leverage’ more international private capital flows to developing countries, even though existing mechanisms do not have a great track record. For example, a recent study for the European Parliament, which Eurodad co-authored, detailed the limitations of efforts to incentivize and subsidise private capital flows to developing countries. These included:
• “Difficulties in designing programmes that work for MSMEs [medium, small and micro enterprises] in low-income countries;
• Little success in generating ‘additional’ private sector investment, with external evaluations showing that many publicly-backed investments replace or supplant pure private sector investments;
• Unproven performance in leveraging private investment in developing countries;
• Low developing country ownership over the institutions and programmes of DFIs [development finance institutions];
• Significant problems in providing adequate transparency and accountability;
• Increasing debt risks, and very expensive financing”.45
Creating any significant increase in the relative scale of private capital flows to developing countries is likely to require an unprecedented change in investors’ behaviour. For example, the World Bank’s recently launched global infrastructure facility (GIF) has as its main long-term purpose, “…to help in the development of [emerging and developing economy] infrastructure as an asset class attractive to the full range of private investors”.46 However, the World Bank has also found that institutional investors “…have only around one percent of their portfolio exposure in infrastructure”,47 so the scale of change required in their current behaviour would be massive. An OECD paper on institutional investment in infrastructure lists some of the reasons why persuading these investors to radically change their portfolios will be extremely difficult:
“…the longer time horizons over which agency problems and related weaknesses can materialise, the greater uncertainty regarding investment returns, the particular illiquidity of long-term investments, … insufficient investor capacity to manage longer-term assets, and potential problems with investment conditions and market infrastructure.”48
It would be better to focus much more attention on measures that are needed to help developing countries reduce risks and manage foreign investment to maximise its development potential.
The minimum that is needed is to recognise that tools to regulate international capital flows – known as capital account regulation – are fundamental parts of the policy toolkit for all countries, but for developing countries in particular. Emerging markets have tried
Since 2008, the repatriation of profits from developing economies by foreign investors has exceeded new foreign direct investment going in.“

12
Financing for development: Key challenges for policy makers
to use the G20 as a venue to tackle the issue of their vulnerability to the financial, monetary and economic policies of rich countries. Initially, they had some success, forcing the IMF to change its position49 and to accept that capital controls can be a useful part of their policy toolkit, as they can be used to prevent sudden exits of capital, or to discourage the entry of risky capital in the first place. However, the IMF’s position is limited, and many trade and investment agreements constrain the use of these vital tools: they should be reviewed and these constraints should be removed. A comprehensive review, mandated by the UN, of all trade agreements and investment treaties would also help to identify other areas where they may limit developing countries’ ability to prevent and manage crises, and regulate capital flows to maximise development impacts.
A more proactive and positive agenda towards improving private investment would also embrace a new international initiative on responsible financing standards. The UN would be the natural place to lead such an initiative, given that the Human Rights Council in Geneva agreed in June 2014 to establish a working group to prepare an instrument introducing legal obligations for human rights for transnational corporations.
A new initiative like this could pull together existing frameworks and proposals, and help ensure that standards are properly implemented. The main international initiatives and proposed frameworks include: the UN Environment Programme (UNEP) Principles for Responsible Investment; UNCTAD’s Principles on Responsible Sovereign Lending and Borrowing; the OECD’s Guidelines for Multinational
Enterprises; the International Finance Corporation (IFC)’s Equator Principles for banks; and the UN Guiding Principles on Business and Human Rights. Eurodad has proposed a framework in our Responsible Finance Charter,50 which proposes an alternative set of stronger principles, noting that existing initiatives tend to be voluntary, focussed on a ‘do no harm’ approach with poor tools to monitor compliance, and leave large swathes of finance unaffected by them.
Finally, the use of public finance to subsidise, guarantee or leverage additional private finance should be carefully evaluated – a review led by developing country stakeholders would be a good start – not just because of the track record of such efforts highlighted above, but also because it reduces the public finance available to spend in other areas, a topic we will now turn to.

13
Financing for development: Key challenges for policy makers
Despite developing country efforts to increase domestic public resources, fulfilling the human rights of everyone on the planet cannot happen without increases in international public finance. The most obvious source of international public finance is that provided by rich country governments, but they have largely failed to live up to their promises: renewed efforts are needed to meet their commitments, with firm deadlines. In addition, efforts to increase innovative public financing, such as financial transaction taxes, should be part of the solution. Significant efforts are also needed to improve the quality of international public resources, starting by fully untying all aid.
Public expenditure has a unique role to playPublic financing has a unique role to play in supporting development. This is true for a number of reasons. For example, the nature of poverty means that poor people are simply unable to afford many of the amenities needed to ensure their basic human rights. A recent report by Development Finance Watch and Oxfam prioritises seven sectors where public finances have a critical role to play: “…agriculture and food, education, environment, health, social protection, water/sanitation/ hygiene (WASH), and women’s rights.”51 Box A gives further details on why this is the case for social protection expenditure, which is a critical area in which public funding has been sorely lacking, damaging global and national efforts to eradicate poverty.
However, public financing also has a crucial role to play in other areas. For example, the World Bank estimates that 80–85% of infrastructure investment in developing countries over the past decade has been publicly financed.52 This is because infrastructure investments can have long pay-off periods, and the benefits often extend to the whole of society rather than just to the private investors. Relying on private investment alone would result in sub-optimal levels of infrastructure investment, which would damage growth, poverty reduction,
and the accessibility of infrastructure to all groups.
In addition, protecting global public goods, such as the oceans and the climate, requires additional public expenditure, and the cost of this should not fall unduly on developing countries. This is particularly the case in areas such as climate change, where developed countries have historically accounted for the lion’s share of the greenhouse gas emissions that have caused the problem.
Domestic public resources are large, but not sufficientDomestic public resources are large but are relatively low as a percentage of GDP in the poorest countries. As Figure 9 shows, upper-middle income developing countries have been consistently mobilising around 20% of their GDP as government revenue. However, although low-income countries have improved their revenue-raising capacity in recent years, as the graph shows, they lag considerably behind, reaching less than 15% on average by 2011. For comparison, developed countries mobilised 24% of GDP as government revenues in 2012.
Losses of tax revenues, particularly to tax dodging, help to explain part of the problem, but many developing countries simply do not have the resources to meet even minimum requirements to finance basic public services and social protection. Chapter 2 details how developing countries lose significant tax revenues to international evasion and avoidance, and other tax issues. In addition, servicing debts sucks an increasing share of government expenditure, as chapter 4 shows. It is also true that problems of misallocation, corruption and poor financial management can reduce the effectiveness of government spending, although in part these are symptoms as well as causes of development problems.
However, the best estimates show that, even if developing countries were to raise the maximum amount possible through domestic taxation, and spend it effectively, they would still face a significant public financing gap. ODI examined resources available for social services and social protection in developing countries, and estimated a financing gap of $84 billion per year. ODI’s estimates are based on an assumption that developing countries collect as much as they can, based on their tax capacity, and that they allocate half of their total resources to the social sectors. In other words, they assume that countries do as much as they can to
fund essential social services and social protection themselves. However, it should be noted that the ODI estimates are based on a limited conception of social protection, not the internationally agreed definition (see Box A) and a limited expectation of essential services, focussing on free basic healthcare and primary and secondary education. Therefore these estimates should be regarded as underestimates, and the real financing gap is likely to be considerably larger. DFI and Oxfam, for example, estimate that, in addition to allocating domestic resources better, $1 trillion per year of additional international public finance is needed.53
Other international sources of public financing need to be mobilisedThe quantity of aid that is actually available to developing countries has consistently fallen short of the promises donors have made to provide 0.7% of GNI to developing countries. In 2014, the OECD Development Assistance Committee (DAC) estimated that its members provided $135 billion in Overseas Development Assistance (ODA, or ‘aid’)54 or just 0.29% of their GDP. However, the best measure of aid that actually reaches developing countries is what the OECD defines as Country Programmable Aid (CPA), which was only $64 billion in 2014. CPA is a subset of ODA, removing items that are: unpredictable by nature;55 entail no cross-border flows;56 do not form part of cooperation agreements
Challenge 3Provide more and better international public resources
200
6
2007
200
8
200
9
2010
2011
% GDP
Figure 9: Government revenue (excluding grants) % GDP57
30
25
20
15
10
5
0
Low income Upper middle income
Lower middle income High income

14
Financing for development: Key challenges for policy makers
Box A: Why a social protection floor requires public funding
What is a social protection floor?
In 2012, the International Labour Organization’s (ILO) 185 member countries approved an international legal instrument68 to promote national social protection floors, extending basic social security coverage with adequate benefits to all. Social protection floors include: pensions for all older persons; cash transfers for children; and benefits and support for people of working age in case of maternity, disability, work injury and for those without jobs. Social protection is a key instrument for reducing poverty and inequality, as well as for promoting human development.
Why public funding is needed
Despite the fact that social security is a human right, according to Articles 22 and 25 of the Universal Declaration of Human Rights, only 27% of the world population has adequate access, according to the ILO.69 To expand social protection to the remaining 73% of the world population, to ensure that all older people receive a pension, that all people who are sick, unemployed, severely disabled or who have children receive adequate support, public funding is essential. Current provision for social
protection floors is woeful. Though there has been huge progress in setting up national frameworks, with “by 2012, the majority of countries [having] social security schemes established by law covering all or most areas [of social protection]”, unfortunately “…in many cases [these are] only for a minority of their population.”70 This means that actual access to the social protection floor does not exist for many. For example, worldwide, 48% of people over pensionable age do not receive a pension, and only 12% of unemployed workers worldwide receive unemployment support.71
Social protection can be provided through social insurance, tax-funded social benefits, social assistance services, public works programmes and other schemes. With the exception of social insurance, based on contributions, the rest require public funding. If social protection floors are to be universal, public financing is needed to cover the many billions of people that are poor, or have low and erratic incomes and cannot contribute to social insurance.
How much is needed?
A recent analysis carried out by the ILO on nationally-defined social protection floors in 90 developing countries shows that the resources needed to operate
social protection floors (cash transfers and administrative costs) amount to 2.9% of their GDP, on average.72 This cost varies greatly, however, among countries and regions. For example, in Asia and the Pacific region, the cost is estimated at 2.6% of GDP, on average, while in sub-Saharan Africa the cost is estimated to represent 5.5% of GDP, on average. It is clear that developing country governments can do much more to fund social protection floors. The ILO highlights eight options for expanding the ‘fiscal space’ to adequately fund social protection. However, several of these are dependent on changes we have highlighted in this paper; the need to curtail tax losses and increase aid, for example.73
Estimates of the financing needs for social protection floors for developing countries vary depending on the methodology used. An Overseas Development Institute (ODI) estimate of $84 billion is based on a very narrow understanding of social protection, not the universal floors that have been internationally agreed by all world countries. A Development Initiatives study concludes that Least Developed Countries face a finance gap equivalent to 88% of the cost of the social protection coverage needed to end extreme poverty by 2030.74
between governments;58 or are not country programmable by the donor.59According to the OECD, “CPA is much closer to capturing the flows of aid that go to the partner countries than the concept of Official Development Assistance (ODA).”60
Figure 10, from Eurodad’s State of Development Finance 2014 report, shows that the poorest developing countries are particularly dependent on this source of revenue, reflecting the fact highlighted above that they simply do not have the minimum domestic public resources they need.
The other major promise that developed countries have made to developing countries is to provide $100 billion in new and additional climate financing by 2020, but public climate financing disbursements remain low, and largely represent double counting of aid commitments. The exact amount of current climate finance expenditure by donor countries is disputed, with the OECD estimating the 2013 figure at $37 billion, but Oxfam arguing that it is closer to $17.3 billion.61 However, both figures are based on estimates of the amount of ODA that is earmarked as climate finance, not the ‘new and additional’ money promised.
A better source of additional international public finance could be innovative taxation, although efforts to raise this have so far been limited. Eurodad examined current proposals in The State of Finance for Developing Countries 2014, and found the following:
• Financial Transaction Taxes (FTTs).62 In a sample of just seven G20 countries, the IMF has estimated that FTTs are already raising $15 billion per year, although this is not allocated to development.63 In 2011, the European Commission estimated that an EU-implemented FTT across all asset classes could raise “between €16.4 billion and €400 billion depending on assumptions on decrease in volume, the scope of products covered and the tax rates (0.01% for the first estimate and 0.1% for the second).”64
• An airline ticket levy: is already in existence in nine countries, with the proceeds from most countries earmarked for the global health initiative, UNITAID. It raised over $1 billion for UNITAID between 2006 and 2012.65 If expanded to more countries, or increased in scope, the potential raised could increase significantly.
• Developed country carbon taxes: A 2011 joint report by the IMF, World Bank and OECD estimated that a tax of $50 per tonne in developed countries would yield about $450 billion per year, or $250 billion ($25 per tonne) or $155 billion ($15 per tonne.)67 If a tax of $25 per tonne was
1 2 3 4 5 6 7 8
% GDP
Figure 10: Country Programmable Aid (% GDP equivalent)66
10
8
6
4
2
0
LIC LMIC UMIC
Developing countries (including regional aid)
15
Financing for development: Key challenges for policy makers
levied on aviation and bunker fuels and taxes paid by developing countries were rebated, the same report estimates that $22 billion per year could be raised, or $14 billion if the rate was $15 per tonne.
Finally, significant additional public resources could be mobilised simply by adopting the UN’s proposals to issue new Special Drawing Rights (SDRs, a kind of global reserve asset) and to allocate these to developing countries. SDRs are an international reserve asset held at the IMF by all member governments. The main proposal is to agree regular additional allocations of SDRs – in effect to create new reserve assets. In 2009, a G20 agreement led to the issuance of $250 billion in extra SDRs,75 showing that such ‘global quantitative easing’ is possible. The UN Department of Economic and Social Affairs (UNDESA) suggests annual allocations of $100 billion to $250 billion per year76 and, if the majority of new SDRs went to developing countries this would yield between $100 billion and $167 billion annually.
This is particularly important as developing countries, in order to insure themselves against the risks of financial crises, have invested enormous amounts of money in building their own reserves, by buying safe assets, particularly bonds from richer countries. In effect this means that poor countries have been lending to rich countries on a colossal scale. Over the five years between 2008 and 2012, close to $2.5 trillion was lent by developing countries to the developed world, in particular to the USA. However, as a Eurodad report pointed out,77 it entails significant opportunity costs in terms of revenues that could have otherwise been invested for development. The reasons that developing countries have to pay this price are because of the risks of international private capital movements (see chapter 2), and because developing countries do not have faith in existing global institutions and mechanisms of global economic governance, particularly the IMF.
Improving the quality of public resources is as important as increasing the quantityWhile a significant share of the responsibility for improving the quality of international public finance spending lies with developing countries, major improvements are also needed in the way donors and international institutions deliver finance. Additional international public resources do not automatically translate into development
gains: they must be used wisely. Given that the focus of this paper is on global financing for development challenges, we will not focus on the efforts at country level to improve public expenditure and fight corruption, although these are, of course, vitally important.
Instead we highlight three key problems that stem from failures at donor and international level: donor bad practices that reduce the real value of aid; continued donor dominance, which reduces developing country ownership; and a lack of transparency and accountability. As ODA is the best studied and largest international public financing resource, we will focus on this, but the lessons apply to other resources, including climate finance.
Many donor bad practices reduce the real value of aid, the most obvious one being aid tying. Many donors continue to tie the use of their aid to the purchase of goods and services from their own companies. Aid tying increases the costs of projects by 15–30%, according to the best estimates.78 Aid tying also undermines the ownership of developing countries, because key decisions on how aid is spent are determined by the donor.
Eurodad research suggests that the majority of aid is spent through public procurement contracts. The majority of these are won by companies from donor countries, thanks to informal tying: the use of procurement rules to favour companies from developed countries.79
Other loopholes in the aid reporting rules include allowing donors to report in-donor student and refugee costs as aid – money that never reaches any developing countries – inflating aid by an estimated 3.4 billion euros in the European Union alone in 2013, according to one estimate.80
Ultimately, aid is only likely to have lasting development benefits if it is truly owned by the developing country that receives it. This principle of ownership has been the basis of all global agreements on aid effectiveness over the past decade. However, the latest monitoring report on progress towards agreed commitments showed that, in 2013, less than half of aid for the government sector used national public financial management and procurement systems, and that there had been no improvement since 2010.81 In addition, donors continue to set up parallel systems for administering aid, not only undermining government systems, but
greatly weakening the likelihood that impacts will continue after the donor leaves.
Donors can also often dominate aid objective-setting and allocation, both reducing developing country ownership, and often leading to sub-optimal outcomes. Two brief examples highlight this tendency. The first is the European Commission’s promotion of the use of aid to ‘blend’ with private finance and their selection of donor-dominated mechanisms and institutions to do this, as previous Eurodad research has shown.82 The second is a recent study by Development Initiatives, which found:
“…the evidence shows that development cooperation agencies with a clear mandate to end poverty are much more effective at targeting their allocations towards the poorest countries. Agencies that have a legal mandate for ending poverty allocate over 80% of their ODA to countries with an above average poverty rate. In contrast, agencies without poverty reduction as an explicit goal allocate just 31% of their ODA to countries with an above-average poverty rate.” 83
Transparency and accountability, particularly to affected peoples, is the best guarantee of aid effectiveness. One indicator of this, which is measured by the OECD, is the percentage of aid that is reported in government budgets that are subject to parliamentary scrutiny. By 2013, only seven countries had reached the agreed target of 85% of aid appearing in national budgets,84 although there had been some improvement since 2010.
A renewed global effort to improve the quantity and quality of public financeIt is clear that stronger timetables are needed if developed countries are to be held to account for their commitments on aid and climate finance, and that these two commitments need to be monitored and accounted for separately. Innovative taxation can provide an excellent additional source of financing, particularly if disbursement mechanisms are based on development effectiveness principles and ensure strong developing country ownership with high levels of transparency. In addition, a renewed effort is needed to improve the quality of aid, starting with a commitment to untie all aid. A major new international effort is needed that ensures that untying happens both in policy (de jure) and in practice (de facto) across all aid within the next few years.

16
Financing for development: Key challenges for policy makers
The international system has proven to be prone to finance and debt crises, which can seriously hinder development. The international system has no effective systems for dealing with these crises: the most glaring gap is the lack of a sovereign debt workout mechanism.
The international system is prone to crisesFinance and banking crises have become a recurring feature of the international economic system, as Figure 11 shows, since the breakdown of the post-war Bretton Woods system in the early 1970s heralded an end to strict international control over capital flows and exchange rates.
Such crises often result in sovereign debt crises, as governments are forced to intervene to stabilise their banking sectors, or protect their currencies. Figure 12 shows just how high the fiscal costs of banking crises can be, reaching over 50% of GDP in Indonesia during the Asian financial crisis at the end of the last century.
Such financial crises are not the only recurring feature of the system. A very large number of developing countries, particularly the poorest, are commodity dependent,
as Figure 13 shows, making them very vulnerable to changes in commodity prices, which tend to be volatile.87 Like financial crises, falls in commodity prices can trigger balance of payments or currency crises, and these in turn can lead to sovereign debt crises. Balance of payments or currency crises can be triggered by other factors such as stock market collapses, for example.
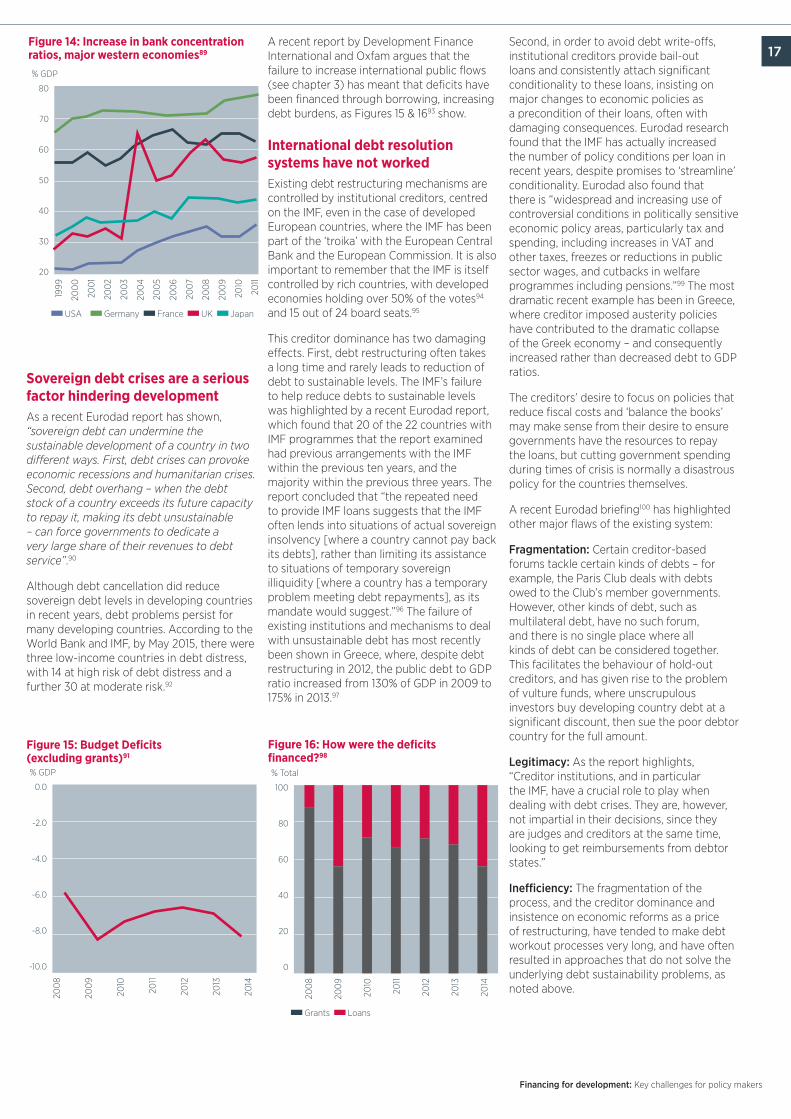
There has been a failure to tackle these issues seriously at an international level. For example, in recent years, in response to the global financial crisis, the G20 and the Financial Stability Board have prioritised tackling the problem that many banks are ‘too big to fail’. However, as Figure 14 shows,
in major western economies the share of the banking sector accounted for by the biggest three banks (the ‘bank concentration ratio’) continues on an upward trajectory.
Similarly, since the expiration of the system of international commodity agreements in the 1980s, there have been no major international efforts to tackle the problem of commodity price volatility seriously.
However, perhaps the biggest global governance failure has been in tackling sovereign debt crises, which is why we focus on this issue in the remainder of this chapter.
Challenge 4Reduce and resolve finance and debt crises
% of countries
Figure 11: Proportion of countries with banking crises, weighted by their share of world income85
45
40
35
30
25
20
15
10
5
0
190
019
03
190
619
09
1912
1915
1918
1921
1924
1927
1930
1933
1933
1936
1939
1942
1945
1948 1951
1954
1957
1960
1963
1966
1969
1972
1975
1978
1981
1984
1987
1990
1993
1996
1999
200
220
05
200
8
The Panic of 1907
World War 1
The Great Depression The first global financial
crisis of 21st century
Emerging markets, Japan the Nordic countries, and US (S&L)
Figure 12: The fiscal cost of banking crises86
Indonesia 97Chile 81
Thailand 97Uruguay 81
Korea 97Cote d’ivoire 88
Venezuela 94Japan 92
Mexico 94Malaysia 97Slovakia 92
Phillipines 83Brazil 94
Ecuador 96Bulgaria 96
Czech Replublic 89Finland 91
Hungary 91Senegal 88Norway 87
Spain 77Paraguay 95Sri Lanka 89Colombia 82
Malaysia 91Sweden 91
0 5 10 15 20 25 30 35 40 45 50 0%-20% 20%-40% 40%-60% 60%-80% 60%-80%
Figure 13: Commodity dependence, global map88
17
Financing for development: Key challenges for policy makers
Sovereign debt crises are a serious factor hindering developmentAs a recent Eurodad report has shown, “sovereign debt can undermine the sustainable development of a country in two different ways. First, debt crises can provoke economic recessions and humanitarian crises. Second, debt overhang – when the debt stock of a country exceeds its future capacity to repay it, making its debt unsustainable – can force governments to dedicate a very large share of their revenues to debt service”.90
Although debt cancellation did reduce sovereign debt levels in developing countries in recent years, debt problems persist for many developing countries. According to the World Bank and IMF, by May 2015, there were three low-income countries in debt distress, with 14 at high risk of debt distress and a further 30 at moderate risk.92
A recent report by Development Finance International and Oxfam argues that the failure to increase international public flows (see chapter 3) has meant that deficits have been financed through borrowing, increasing debt burdens, as Figures 15 & 1693 show.
International debt resolution systems have not workedExisting debt restructuring mechanisms are controlled by institutional creditors, centred on the IMF, even in the case of developed European countries, where the IMF has been part of the ‘troika’ with the European Central Bank and the European Commission. It is also important to remember that the IMF is itself controlled by rich countries, with developed economies holding over 50% of the votes94 and 15 out of 24 board seats.95
This creditor dominance has two damaging effects. First, debt restructuring often takes a long time and rarely leads to reduction of debt to sustainable levels. The IMF’s failure to help reduce debts to sustainable levels was highlighted by a recent Eurodad report, which found that 20 of the 22 countries with IMF programmes that the report examined had previous arrangements with the IMF within the previous ten years, and the majority within the previous three years. The report concluded that “the repeated need to provide IMF loans suggests that the IMF often lends into situations of actual sovereign insolvency [where a country cannot pay back its debts], rather than limiting its assistance to situations of temporary sovereign illiquidity [where a country has a temporary problem meeting debt repayments], as its mandate would suggest.”96 The failure of existing institutions and mechanisms to deal with unsustainable debt has most recently been shown in Greece, where, despite debt restructuring in 2012, the public debt to GDP ratio increased from 130% of GDP in 2009 to 175% in 2013.97
Second, in order to avoid debt write-offs, institutional creditors provide bail-out loans and consistently attach significant conditionality to these loans, insisting on major changes to economic policies as a precondition of their loans, often with damaging consequences. Eurodad research found that the IMF has actually increased the number of policy conditions per loan in recent years, despite promises to ‘streamline’ conditionality. Eurodad also found that there is “widespread and increasing use of controversial conditions in politically sensitive economic policy areas, particularly tax and spending, including increases in VAT and other taxes, freezes or reductions in public sector wages, and cutbacks in welfare programmes including pensions.”99 The most dramatic recent example has been in Greece, where creditor imposed austerity policies have contributed to the dramatic collapse of the Greek economy – and consequently increased rather than decreased debt to GDP ratios.
The creditors’ desire to focus on policies that reduce fiscal costs and ‘balance the books’ may make sense from their desire to ensure governments have the resources to repay the loans, but cutting government spending during times of crisis is normally a disastrous policy for the countries themselves.
A recent Eurodad briefing100 has highlighted other major flaws of the existing system:
Fragmentation: Certain creditor-based forums tackle certain kinds of debts – for example, the Paris Club deals with debts owed to the Club’s member governments. However, other kinds of debt, such as multilateral debt, have no such forum, and there is no single place where all kinds of debt can be considered together. This facilitates the behaviour of hold-out creditors, and has given rise to the problem of vulture funds, where unscrupulous investors buy developing country debt at a significant discount, then sue the poor debtor country for the full amount.
Legitimacy: As the report highlights, “Creditor institutions, and in particular the IMF, have a crucial role to play when dealing with debt crises. They are, however, not impartial in their decisions, since they are judges and creditors at the same time, looking to get reimbursements from debtor states.”
Inefficiency: The fragmentation of the process, and the creditor dominance and insistence on economic reforms as a price of restructuring, have tended to make debt workout processes very long, and have often resulted in approaches that do not solve the underlying debt sustainability problems, as noted above.
% GDP
Figure 14: Increase in bank concentration ratios, major western economies89
80
70
60
50
40
30
20
USA Germany France UK Japan
1999
200
0
200
1
200
2
200
3
200
4
200
5
200
6
2007
200
8
200
9
2010
2011
% GDP
Figure 15: Budget Deficits (excluding grants)91
0.0
-2.0
-4.0
-6.0
-8.0
-10.0
200
8
200
9
2010
2011
2012
2013
2014
% Total
Figure 16: How were the deficits financed?98
100
80
60
40
20
0
Grants Loans
200
8
200
9
2010
2011
2012
2013
2014

18
Financing for development: Key challenges for policy makers
18No regard for impacts on human rights or sustainable development: Countries are often forced to prioritise spending on servicing loans over spending on essential services, or investments to promote development.
It doesn’t have to be this way: the promise of a debt workout mechanismIn September 2014, the UN adopted a resolution that aimed to establish a “multilateral legal framework for sovereign debt restructuring processes”.101 This is a major step towards filling this gaping gap in the international economic governance architecture.
Eurodad believes this is a unique opportunity to create a fair and development-friendly solution to sovereign debt problems, by creating a multilateral legal framework and a Debt Workout Institution, independent of creditors and debtors, to facilitate debt restructuring processes that:
• Prevent debt crises by promoting compliance with responsible lending and
borrowing principles, and is mandated to monitor such compliance and sanction non-compliance.
• Deal with the whole sovereign debt stock of a country in one single and comprehensive process, and ensures fair burden sharing among different creditor categories.
• Can invoke an automatic standstill on debt payments in times of crises or overhangs, and ensure sufficient legal protection from vulture funds.
• Ensure that debt sustainability analyses based on financing needed to meet sustainable development goals guide decision-making throughout the whole debt restructuring process.
• Act in a transparent and accountable manner, makes all relevant information public, and gives all relevant stakeholders the right to be heard.

19
Financing for development: Key challenges for policy makers
Conclusions and recommendations
2015 is a unique year for global development, with three crucial UN summits promising agreements on Financing for Development, a new set of Sustainable Development Goals to replace the Millennium Development Goals, and a new climate treaty. However, it is clear that flaws in the way the global economic system is managed are fundamental blocks to progress.
This paper shows that clear proposals are on the table to deal with some of the biggest development challenges of our generation: now is the time to put these into action:
Help stem the loss of tax revenues through a truly representative, transparent, effective global tax body, placed under the auspices of the UN, with the mandate and resources to tackle these serious problems.
Reduce the risks of private investment and actively manage it to maximise benefits, by removing obstacles found in trade and investment agreements that prevent developing countries from managing private capital flows to reduce risks, and embracing a new international initiative on responsible financing standards, with strong implementation mechanisms.
Provide more and better international public resources by making major new efforts to improve both the quantity and quality of international public finance, with strong timetables, starting with the untying of all aid.
Reduce and resolve finance and debt crises by establishing a transparent and accountable Debt Workout Institution, independent of creditors and debtors, to rapidly and fairly restructure debt.

20
Financing for development: Key challenges for policy makers
Endnotes
1 See main text for all references.
2 Griffiths, Jesse (2015). The State of Finance for Developing Countries 2014 (Eurodad, Brussels). Eurodad used GFI figures, but classified ‘developing countries’ as those identified as middle-income or low-income countries by the World Bank. GFI also produces estimates for IFFs from developing countries, but use the IMF’s list of developing countries, which differs from the World Bank’s list. We prefer the World Bank’s list because it is based on an objective criteria. This means that the total we quote is lower, as some countries are on the IMF’s list, but not on the World Bank’s. It is important to note that there are a number of developing countries for which data is not available for GFI to calculate IFFs, hence the real developing country total will be higher.
3 Griffiths, Jesse. (2015)). The State of Finance for Developing Countries 2014. Brussels. Eurodad.
4 High Level Panel on Illicit Financial Flows from Africa. (2015). Illicit Financial Flow. Report of the High Level Panel on Illicit Financial Flows from Africa. AU/UN Economic Commission for Africa (UNECA).
5 TJN has developed the Financial Secrecy Index to define such jurisdictions that provide: “(1) anonymity for them, their families, and their business and political dealings; (2) the ability to minimize the net present value of future taxes…; (3) investment management…; (4) ability to easily access and manage their wealth from anywhere on the planet; (5) secure places to hang out, hide out and enjoy life; and (6) iron clad financial security.” Henry, James. (2012). The price of offshore revisited. London. Tax Justice Network, p.10.
6 Henry, James. (2012). The price of offshore revisited. London. Tax Justice Network.
7 Zucman, Gabriel. (2014)). ‘Taxing across Borders: Tracking Personal Wealth and Corporate Profits’ in Journal of Economic Perspectives, Volume 28, Number 4, Fall 2014—, pp. 121–148.
8 Zucman, Gabriel. (2014). citing O’Murchu, Cynthia. 2014. “Tax Haven Buyers Set off Property Alarm in England and Wales.” Financial Times, 31 July 2014. http://www.ft.com/intl/cms/s/0/6cb11114-18aa-11e4-a51a-00144feabdc0.html
9 UNCTAD. (2015). World Investment Report 2015. Reforming International Investment Governance. Geneva. UNCTAD.
10 UNCTAD. (2015). Establishing the baseline: estimating the fiscal contribution of multinational enterprises. ANNEX I - Technical background paper accompanying the UNCTAD Working Paper on “FDI, Tax and Development”. Geneva. UNCTAD.
11 The UNCTAD estimates are based on a sample of 104 countries, which it estimates to be representative of more than 90% of foreign direct investment (FDI) inward stocks.
12 UNCTAD argues that their figure should be regarded as additional to figures that could be developed for tax losses due to transfer mispricing or other methods.
13 Crivelli, Ernesto, De Mooij, Ruud and Keen, Michael. (2015). Base Erosion, Profit Shifting and Developing Countries. IMF Working Paper 15/118. Washington DC, IMF.
14 http://www.icij.org/project/luxembourg-leaks/leaked-documents-expose-global-companies-secret-tax-deals-luxembourg (accessed 7 July 2015).
15 Hearson, Martin (2014) Learning from past mistakes in tax and investment treaties - https://martinhearson.wordpress.com/2014/10/07/learning-from-past-mistakes-in-tax-and-investment-treaties/ [accessed 8 July 2015]
16 Hearson, Martin (2014) Learning from past mistakes in tax and investment treaties - https://martinhearson.wordpress.com/2014/10/07/learning-from-past-mistakes-in-tax-and-investment-treaties/ [accessed 8 July 2015]
17 McGauran, Katrin. (2013). Should the Netherlands Sign Tax Treaties with Developing Countries? Amsterdam. SOMO.
18 IMF. (2014). Spillovers in Corporate Taxation. Washington DC. IMF, p27.
19 LATINDADD. (2013). Double Taxation Agreements in Latin America. Analysis of the Links among Taxes, Trade and Responsible Finance.
20 Ibid, p28.
21 Meaning MNCs can employ experts to try to demonstrate why the prices they use for intra-group trade should be regarded as arm’s length’ prices (i.e. equivalent to prices determined by a market). Tax inspectors then have to go to battle if they want to question this expertise, often armed with considerably lower levels of resources.
22 Lee Sheppard, quoted in http://taxjustice.blogspot.ch/2013/05/lee-sheppard-dont-sign-oecd-model-tax.html (accessed 18 June 2015).
23 Baker, Paul. (2012). An Analysis of Double Taxation Treaties and their Effect on Foreign Direct Investment. Cambridge, University of Cambridge.
24 Athanasiou, Amanda. (2014). ‘Developing Countries Rethinking Tax Treaties’ in Tax Notes International, Vol 76, No 5, November 2014.
25 ActionAid International. (2013). Give us a break: how big companies are getting tax free deals. Johannesburg, ActionAid International.
26 https://www.wbginvestmentclimate.org/advisory-services/investment-generation/investment-policy-and-promotion/upload/Causes-Benefits-and-Risks-of-Business-Tax-Incentives.pdf (accessed 18 June 2015).
27 ActionAid International. (2013). Give us a break: how big companies are getting tax free deals. Johannesburg, ActionAid International.
28 Klemm, Alexander and Van Parys, Stefan. (2009). Empirical Evidence on the Effects of Tax Incentives.Washington DC. IMF.
29 http://data.worldbank.org/indicator/GC.TAX.TOTL.GD.ZS (accessed 7 July 2015). In 2001, lower-middle-income countries (for which the World Bank database referenced has the longest time series, dating back to 2011), had a tax revenue to GDP ratio of 9.8%. By 2012, this had risen to 10.9%.
30 IMF. (2014). Spillovers in Corporate Taxation. Washington DC. IMF.
31 10 Reasons Why an Intergovernmental UN Tax Body Will Benefit Everyone, June 2015.
32 Eurodad (2015) FAQ on Financing for Development and the Intergovernmental Tax Body.
33 Griffiths, Jesse. (2014). The State of Finance for Developing Countries. Brussels, Eurodad, p13.
34 Griffiths, Jesse. (2014). The State of Finance for Developing Countries. Brussels, Eurodad, p13.
35 Griffiths, Jesse. (2014). The State of Finance for Developing Countries. Brussels, Eurodad, p26.
36 Griffiths, Jesse. (2014). The State of Finance for Developing Countries. Brussels). Eurodad, p26.
37 Griffiths, Jesse. (2014). The State of Finance for Developing Countries. Brussels). Eurodad, p27.
38 Ramdoo, Isabelle. (2015). Presentation on Extractives, local content policies and industrial development, slide 6.
39 Griffiths, Jesse. (2014). The State of Finance for Developing Countries. Brussels. Eurodad, p26.
40 Griffiths, Jesse. (2014). The State of Finance for Developing Countries. Brussels. Eurodad, p26.
41 Akyüz, Yilmaz. (2012). Financial Crisis and Global
Imbalances: A Development Perspective. Geneva. South Centre.
42 Griffiths, Jesse. (2014). The State of Finance for Developing Countries. Brussels, Eurodad, p26.
43 Ellmers, Bodo and Hulova, Diana. (2013). The new debt vulnerabilities. 10 reasons why the debt crisis is not over. Brussels). Eurodad.
44 Bhinda, Nils and Martin, Matthew. (2010). Private capital flows to low-income countries. Dealing with boom and bust.
45 Griffiths, Jesse et al. (2014). Financing for development post-2015: improving the contribution of private finance. Brussels. Eurodad.
46 World Bank Group. (2014). Global Infrastructure Facility: Update for G20-September 2014. Washington DC.
47 World Bank Group. (2014). Practical solutions and models for addressing obstacles to institutional investment in infrastructure in developing countries. Washington DC.
48 OECD. (2014). Progress report on aggregation exercise on checklist on long-term investment financing strategies and institutional investors. (OECD progress report to G20 Finance Ministers and Central Bank Governors, Paris).
49 Bretton Woods Project. (2012). IMF new view on capital flows: “landmark” but still only a “baby-step forward”. London. Bretton Woods Project.
50 Eurodad. (2011). Responsible Finance Charter. Brussels. Eurodad.
51 Development Finance International and Oxfam. (2015). Financing the Sustainable Development Goals. Lessons from government spending on the MDGs. London. Development Finance International and Oxfam, p3.
52 World Bank. (2014). Overcoming constraints to the financing of infrastructure. (Prepared by the Staff of the World Bank Group for the G20 Investment and Infrastructure Working Group, Washington DC).
53 Development Finance International and Oxfam. (2015). Financing the Sustainable Development Goals. Lessons from government spending on the MDGs. London. Development Finance International and Oxfam.
54 http://www.oecd.org/dac/stats/documentupload/ODA%202014%20Technical%20Note.pdf (accessed 29 June 2015).
55 Humanitarian aid and debt relief.
56 Administrative costs, imputed student costs, promotion of development awareness and research and refugees in donor countries.
57 http://data.worldbank.org/indicator/GC.REV.XGRT.GD.ZS/countries/XD-XM-XN-XT?display=graph (accessed 29 June 2015). More recent figures than 2011 are not available for all categories of country.
58 Food aid and aid from local governments.
59 Core funding of non-governmental organisations (NGOs).
60 http://www.oecd.org/newsroom/aid-to-developing-countries-rebounds-in-2013-to-reach-an-all-time-high.htm (accessed 9 July 2015)
61 Oxfam International (2015) The Roadmap to $100billion / year by 2020: a foundation for success in Paris Oxfam International.
62 Taxes on the trading of shares, bonds, derivatives and foreign exchange.
63 Gates, Bill. (2011). Innovation With Impact: Financing 21st Century Development, p.13.
64 See http://www.consilium.europa.eu/uedocs/cms_data/docs/pressdata/en/ecofin/142513.pdf, Financial Transaction Tax, p9.

21
Financing for development: Key challenges for policy makers
65 UNDESA. (2012). World Economic and Social Survey 2012. In Search of New Development Finance.
66 Griffiths, Jesse. (2014). The State of Finance for Developing Countries. Brussels). Eurodad, p22.
67 World Bank Group. (2011). Mobilizing Climate Finance A Paper Prepared at the Request of G20 Finance Ministers.
68 ILO’s Social Protection Floors Recommendation, 2012 (No. 202).
69 ILO. (2015). World Social Protection Report 2014/15.
70 ILO. (2015). World Social Protection Report 2014/15, p4.
71 See ILO. (2015). World Social Protection Report 2014/15 for more details.
72 This global estimate is based on the cost of (i) a universal child benefit of 12% of a country’s national poverty line; (ii) a benefit of 100% of a country’s national poverty line to all orphans (iii) a maternity benefit during 4 months of 100% of a country’s national poverty line to all mothers with newborns; (iv) unemployment support of 100% of a country’s minimum wage to one person per vulnerable household during 90 days; (v) a benefit of 100% of a country’s national poverty line to all persons with severe disabilities; and (vi) a universal pension of 100% of a country’s national poverty line. All of these include administrative costs. Source: ILO. (2015). A Global Fund for Social Protection Floors in Least Developed Countries, informal note prepared by the ILO Social Protection Department as a technical input for the preparations of the Addis Ababa Conference on Financing for Development (13-16 July 2015).
73 ILO. (2015). pages 149-153 and Ortiz, Isabel, Cummins, Matthew and Karunanethy, K. (2015). Fiscal Space for Social Protection: Options to Expand Social Investments in 187 Countries. Geneva, ILO.
74 Development Initiatives. (2015) Getting poverty to zero: financing for social protection in least developed countries. Bristol.
75 See http://www.brettonwoodsproject.org/art-564159 See http://www.brettonwoodsproject.org/art-564159
76 UNDESA. (2012). World Economic and Social Survey 2012. In Search of New Development Finance.
77 Molina, Nuria and Ruiz, Marta. (2010) The cost of reserves. Developing countries pay the price of global financial instability. Brussels), Eurodad.
78 Clay, Edward J, Matthew Geddes & Luisa Natali (2009): Untying Aid: Is it working? page 1, quoting Jepma, C.J. (1991) The tying of aid (Paris, OECD)
79 Ellmers, Bodo. (2011). How to spend it. Smart procurement for more effective aid. Brussels. Eurodad.
80 CONCORD Aidwatch. (2014). Aid beyond 2015. Europe’s role in financing and implementing sustainable development goals post 2015. Brussels. CONCORD Aidwatch.
81 OECD. (2014). Making development cooperation more effective. 2014 progress report. Paris. OECD.
82 Romero, María José. (2014). A Private Affair. Brussels. Eurodad.
83 Development Initiatives. (2015). Improving ODA allocation for a post-2015 world. Targeting aid to benefit the poorest 20% of people in developing countries, p8.
84 OECD. (2014). Making development cooperation more effective. 2014 progress report. Paris. OECD, p41.
85 Reinhart, Carmen and Rogoff, Kenneth. (2008). Banking crises: an equal opportunity menace.
86 Honohan, Patrick and Daniela Klingebiel Controlling fiscal costs of banking crises. http://elibrary.worldbank.org/doi/pdf/10.1596/1813-9450-2441. The World Bank. Washington DC.
87 For a discussion of the extent of commodity price volatility, see UNCTAD. (2012). Excessive commodity price volatility: Macroeconomic effects on growth and policy options. Geneva. UNCTAD.
88 UNCTAD (2013). Commodities and Development Report. Geneva. UNCTAD
89 Luc Laeven, Lev Ratnovski, and Hui Tong (2014). Bank Size and Systemic Risk. IMF SDN/14/04
90 Stichelmans, T. (2015. Why a United Nations sovereign debt restructuring framework is key to implementing the post-2015 sustainable development agenda. Brussels, Eurodad.
91 Development Finance International and Oxfam. (2015).
Financing the Sustainable Development Goals. Lessons from government spending on the MDGs. London. Development Finance International and Oxfam.
92 IMF. (2015). List of LIC DSAs for PRGT-Eligible Countries. IMF, 7 May 2015.
93 Both figures are from Development Finance International and Oxfam. (2015). Financing the Sustainable Development Goals. Lessons from government spending on the MDGs. London. Development Finance International and Oxfam.
94 If the 2010 IMF governance reforms are adopted, ‘advanced economies’ will have 55.3% of the vote, down from 57.9% before the reforms: http://www.brettonwoodsproject.org/2010/11/art-567219/ (accessed 30 June 2015).
95 The USA, Japan, France, Germany, the UK, Saudi Arabia and the Russian Federation have their own seats. The Netherlands, Spain, Italy, Australia, Canada, Norway, Saudi Arabia and Switzerland were chairs of their multi-country constituencies at time of going to print.
96 Griffiths, Jesse and Todoulos, Konstantinos. (2014). Conditionally yours. An analysis of the policy conditions attached to IMF loans. Brussels, Eurodad.
98 IMF. (2014). World Economic Outlook Database (indicator: general government gross debt, percent of GDP).
97 Development Finance International and Oxfam. (2015). Financing the Sustainable Development Goals. Lessons from government spending on the MDGs. London. Development Finance International and Oxfam.
99 Griffiths, Jesse and Todoulos, Konstantinos. (2014). Conditionally yours. An analysis of the policy conditions attached to IMF loans. Brussels. Eurodad, p4.
100 Stichelmans, T. (2015). Why a United Nations sovereign debt restructuring framework is key to implementing the post-2015 sustainable development agenda. Brussels, Eurodad.
101 United Nations General Assembly, Resolution 68/304: Towards the establishment of a multilateral legal framework for sovereign debt restructuring processes: http://www.un.org/en/ga/search/view_doc.asp?symbol=A/RES/68/304 (accessed 30 June 2015).

22
Financing for development: Key challenges for policy makers
Acknowledgements
This paper was written by Jesse Griffiths. Many colleagues provided very useful comments, including María José Romero, Christian Hallum, Tove Ryding, Bodo Ellmers, Jeroen Kwakkenbos, Alex Cobham, Tim Strawson, Annabelle Burgett and Isabel Ortiz. Any errors or omissions are the responsibility of the author.
Vicky Anning copy edited the report.
Design: [email protected]
23EurodadThe European Network on Debt and Development is a specialist network analysing and advocating on official development finance policies. It has 46 member groups in 20 countries. Its roles are to:
• research complex development finance policy issues
• synthesise and exchange NGO and official information and intelligence
• facilitate meetings and processes which improve concerted advocacy action by NGOs across Europe and in the South.
Eurodad pushes for policies that support pro-poor and democratically-defined sustainable development strategies. We support the empowerment of Southern people to chart their own path towards development and ending poverty. We seek appropriate development financing, a lasting and sustainable solution to the debt crisis and a stable international financial system conducive to development. www.eurodad.org

ContactEurodadRue d’Edimbourg 18-261050 BrusselsBelgiumTel: +32 (0) 2 894 4640www.eurodad.org
www.facebook.com/Eurodadtwitter.com/eurodad