financing energy improvements on utility bills: technical ...financing energy improvements on...
TRANSCRIPT

Financing Energy Improvements on Utility Bills Technical Appendix—Case Studies Financing Solutions Working Group May 2014
The State and Local Energy Efficiency Action Network is a state and local effort facilitated by the federal government that helps states, utilities, and other local stakeholders take energy efficiency to
scale and achieve all cost-effective energy efficiency by 2020.
Learn more at www.seeaction.energy.gov

ii www.seeaction.energy.gov May 2014
Acknowledgements
Financing Energy Improvements on Utility Bills: Market Updates and Program Design Considerations is a product of the State and Local Energy Efficiency Action Network’s (SEE Action) Financing Solutions Working Group.
This report was prepared by Mark Zimring, Greg Leventis, Merrian Borgeson, Peter Thompson, Ian Hoffman and Charles Goldman of Lawrence Berkeley National Laboratory under contract to the U.S. Department of Energy Office of Energy Efficiency and Renewable Energy, Weatherization and Intergovernmental Programs Office (WIPO).
The authors received direction and comments from many members of the Financing Solutions Working Group including the following individuals who provided specific input:
• Bryan Garcia (Clean Energy Finance and Investment Authority - CEFIA)
• Philip Henderson (Natural Resources Defense Council - NRDC)
• Brad Copithorne (Environmental Defense Fund - EDF)
• Sandy Fazeli (National Association of State Energy Officials - NASEO)
• Peter Krasja (AFC First Financial Corporation)
• Jeff Pitkin (New York State Energy Research and Development Authority - NYSERDA)
• Jason Stringer (Wisconsin Energy Conservation Corporation - WECC)
In addition to direction and comment by the Financing Solutions Working Group, this report was prepared with highly valuable input from technical experts: Jeff Adams, John Ahearn, Jennifer Allen, Elena Alschuler, Ira Birnbaum, Holly Bisig, Bill Burns, Danielle Byrnett, William Codner, Alfred Gaspari, Nicole Graham, Jeanne Clinton, Anna Seiss Cooper, John-Michael Cross, George Edgar, Roy Haller, John Hayes, Kathleen Hogan, Chris Kramer, Leah MacDonald, Joshua McGill, Elizabeth Moore, Dennis O’Connor, Jeff Pratt, Bill Prindle, Becky Radtke, Andrea Schroer, Richard Sedano, Lindsey Smith, Michael Smith, Frank Spasaro, Michael Volker and Adam Zimmerman.
We appreciate the support and guidance of Marion Lunn and Anna Garcia at DOE EERE WIPO and want to thank Dana Robson, Katie Kirbus and Cathy Kunkel for technical support on report preparation.

iii www.seeaction.energy.gov May 2014
Acronyms and Abbreviations
ARRA—American Recovery and Reinvestment Act
CDFI—Community Development Financial Institution
CEWO—Clean Energy Works Oregon
CL&P—Connecticut Light and Power
CPUC—California Public Utilities Commission
CWSRF—Clean Water State Revolving Fund (overseen by the New York State Facilities Corporation)
DG—Distributed generation
DOE—U.S. Department of Energy
DR—Demand response
DSM—Demand-side management
DTI—Debt-to-income ratio
EE—Energy efficiency
EERE—U.S. DOE Office of Energy Efficiency and Renewable Energy
ESCO—Energy services company
GEFA—Georgia Environmental Finance Authority
IEEL—Illinois Energy Efficiency Loan program
IOU—Investor-owned utility
LIB—Line item billing
MH—Manitoba Hydro (Canadian utility)
NA—Not available or not applicable
NEM—Non-energy measure
NR—Not reported
NYSERDA—New York State Energy Research and Development Authority
OBF—On-bill finance
OBR—On-bill repayment
OBRF—On-bill repayment finance (NYSERDA on-bill loan offering)

iv www.seeaction.energy.gov May 2014
PACE—Property-Assessed Clean Energy financing
PAYS—Pay As You Save (on-bill model used by several programs)
PSRL—Power Smart Residential Loan (Manitoba Hydro)
RLF—Revolving loan fund
SBEA—Small Business Energy Advantage (CL&P and United Illuminating on-bill loan offering)
SEL—Smart Energy Loan (NYSERDA off-bill loan offering)
TVA—Tennessee Valley Authority
UK—United Kingdom
WPSC—Wisconsin Public Service Commission

v www.seeaction.energy.gov May 2014
Table of Contents
Acknowledgements ............................................................................................................................................... ii
Acronyms and Abbreviations ................................................................................................................................ iii
Table of Contents................................................................................................................................................... v
List of Figures ........................................................................................................................................................ vi
List of Tables ......................................................................................................................................................... vi
APPENDIX A: Domestic On-Bill Case Studies .......................................................................................................... 1 California On-Bill Financing & On-Bill Repayment Pilots ...................................................................................... 1 Georgia Environmental Finance Authority—Residential Energy Efficiency On-Bill Loan Programs .................. 13 Illinois Energy Efficiency Loan Program (IEEL) .................................................................................................... 18 How$mart® Kansas On-Bill Program ................................................................................................................... 23 National Grid On-Bill Loan Programs ................................................................................................................. 27 NYSERDA Green Jobs-Green New York On-Bill Recovery Program .................................................................... 32 Central Electric Power Cooperative Help My House On-Bill Pilot Program ....................................................... 39 Tennessee Valley Authority Energy Right Solutions Heat Pump and In-Home Energy Evaluation On-Bill
Program .................................................................................................................................................... 44 Connecticut Small Business Energy Advantage On-Bill Loan Program ............................................................... 49 Alliant Energy Shared Savings Wisconsin On-Bill Program................................................................................. 54
APPENDIX B: International On-Bill Case Studies................................................................................................... 60 The United Kingdom’s Green Deal: A Market Framework for Funding Energy Efficiency Improvements ......... 60 Manitoba Hydro Power Smart Residential Loan Program, Energy Finance Plan and Pay As You Save (PAYS)
Financing ................................................................................................................................................... 71

vi www.seeaction.energy.gov May 2014
List of Figures
Figure A - 1. Cumulative Distribution of Willingness to Pay (Predicted Values) of OBF Participant Survey Respondents (N=76) ...................................................................................................................................................... 5
Figure A - 2. High-Level Schematic of Centralized Hub Necessary to Support Open Market OBR ................................ 7
Figure A - 3. Breakdown of projects by measure installed (1997-2013) ..................................................................... 55
Figure A - 4. Breakdown of loan volume by sector (1997-2013) ................................................................................. 56
Figure B - 1. Green Deal Program Participation Steps ................................................................................................. 64
Figure B - 3. PSRL Project Volume by Measure (Over 70,000 Projects)—Multi-Measure Projects are Included in as “Other” ........................................................................................................................................................................ 73
List of Tables
Table A - 1. California OBF and OBR Pilots Key On-Bill Program Design Features ......................................................... 1
Table A - 2. Comparison of California OBF Program and new OBR Non-Residential Pilots ........................................... 3
Table A - 3. California OBF and OBR Pilots Program Summary ...................................................................................... 4
Table A - 4. Key On-Bill Program Design Features ......................................................................................................... 9
Table A - 5. CEWO On-Bill Program Summary ............................................................................................................. 10
Table A - 6. GEFA Key On-Bill Program Design Features .............................................................................................. 13
Table A - 7. Program Loan Volumes (by administrator) .............................................................................................. 14
Table A - 8. GEFA Program Summary .......................................................................................................................... 15
Table A - 9. IEEL Key On-Bill Program Design Features ................................................................................................ 18
Table A - 10. IEEL Program Summary .......................................................................................................................... 20
Table A - 11. How$mart Kansas Key On-Bill Program Design Features ....................................................................... 23
Table A - 12. How$mart Kansas Program Summary .................................................................................................... 25
Table A - 13. National Grid Key On-Bill Program Design Features ............................................................................... 27
Table A - 14. National Grid Program Summary ............................................................................................................ 29
Table A - 15. NYSERDA On-Bill Recovery Finance Key On-Bill Program Design Features ............................................ 32
Table A - 16. Comparison of Key OBRF and SEL Features ............................................................................................ 33
Table A - 17. Summary of NYSERDA’s Two-Tiered Underwriting Criteria .................................................................... 36
Table A - 18. On-Bill Recovery Finance Program Summary ......................................................................................... 37
Table A - 19. Help My House Pilot Key On-Bill Program Design Features ................................................................... 39
Table A - 20. Help My House Pilot Program Summary ................................................................................................ 41
Table A - 21. Energy Right Solutions Key On-Bill Program Design Features ................................................................ 44

vii www.seeaction.energy.gov May 2014
Table A - 22. Energy Right Solutions Program Summary ............................................................................................. 46
Table A - 23. Small Business Energy Advantage Key On-Bill Program Design Features ............................................... 49
Table A - 24. Small Business Energy Advantage Program Summary ........................................................................... 50
Table A - 25. Shared Savings Key On-Bill Program Design Features ............................................................................ 54
Table A - 26. Shared Savings Program Summary ......................................................................................................... 58
Table B - 1. Example of how Green Deal and ECO funding combine to provide bill-neutral measures at zero up-front cost .............................................................................................................................................................................. 66
Table B - 2. Measures installed under the Carbon Emissions Reduction Obligations ................................................. 67
Figure B - 2. Number of Green Deal Provider organizations offering Green Deal Plans in 2013 ................................. 69
Table B - 3. Manitoba Hydro Key On-Bill Program Design Features ............................................................................ 72
Table B - 4. Summary of Key On-Bill Program Features for Manitoba Hydro programs ............................................. 72
Table B - 5. Manitoba Hydro PSRL and PAYS Program Summaries .............................................................................. 74


May 2014 www.seeaction.energy.gov 1
APPENDIX A: Domestic On-Bill Case Studies
California On-Bill Financing & On-Bill Repayment Pilots
Program administrators: CA Investor-Owned Utilities: Southern California Gas, Southern California Edison, San Diego Gas & Electric and Pacific Gas & Electric
Location: California
Overview
California’s four investor-owned utilities (IOUs) operate on-bill financing (OBF) programs for business and government customers. These programs originally launched between 2006 and 2010. Over 1,300 loans totaling over $43M have been funded with utility bill-payer funds since the programs’ inception. In 2014, the IOUs will complement the OBF offering with a new set of on-bill repayment (OBR) pilots funded with private capital and targeting both residential and non-residential customers. The OBR pilots reflect a desire by the California Public Utilities Commission (CPUC), to deliver greater leverage of limited utility bill-payer funds.
Table A - 1. California OBF and OBR Pilots Key On-Bill Program Design Features
OBF OBR pilot Disconnection and Meter Attachment
On-Bill Loan with disconnection Line Item Billing & On-Bill Loan with disconnection
Source of Capital On-Bill Finance--Utility Billpayers Open-Market
Underwriting Alternative (utility bill payment history) TBD
Eligible Measures Energy efficiency measures Energy efficiency measures, renewable energy measures, non-energy measures1
Program Basics
The existing OBF programs provide financial incentives (i.e. rebates) and interest-free financing to business and government customers for energy efficiency improvements. The IOUs use utility bill-payer capital to fund the on-bill loans, whose non-payment subjects customers to the same protocols and procedures as non-payment of other utility bill charges and ultimately may result in service disconnection. The majority of participants have been small
1 As of the time of final publication of this report, uncertainty has been raised about the extent to which utility regulators will follow their initial decision to permit a wide range of measures due to restrictions on the use of utility bill payer funds that must be used for EE.
Key Takeaways • About 90 percent of applicants to California’s non-residential on-bill financing programs have been
approved for financing and the default rate on over $43 million in OBF loans has been less than one percent to date.
• In 2014, CA will launch a pilot program to complement existing OBF programs with privately-funded OBR products as regulators seek to increase the leverage of utility bill-payer funds.
• A wide range of measures, including distributed generation, demand response, energy efficiency, and non-energy measures may be eligible for the OBR pilot.

2 www.seeaction.energy.gov May 2014
businesses, although government agencies have accounted for the majority of borrowed funds in some utility service territories. For example, in PG&E territory small businesses represent 85 percent of financed projects but just 43 percent of borrowed capital. A key factor that contributes to this trend is that business customer loans are capped at $100,000 while government agencies may borrow up to $1 million. Lighting-only projects account for about 60 percent of the total amount financed ($43.7 million) in OBF projects. On average, rebates cover about one-third of project costs. Loan terms are capped at five and ten years for business and government customers, respectively. Underwriting is based on utility bill repayment history and about 85-90 percent of applicants are approved for financing. Despite this high approval rate, the default rate has been just 0.57 percent (See
Table A - 3 for a summary of key program statistics). Projects must meet the expectation that energy savings will be at least as large as financed project costs over the life of the loan (which is a more restrictive bill neutrality requirement in many cases, given the 5 or 10 year loan term, than energy savings exceeding project costs over the life of the installed improvements).
In 2013, the California Public Utilities Commission ordered changes to the OBF programs and the implementation of OBR pilots to test whether using third party capital (rather than utility bill-payer capital) to fund on-bill financial products can deliver higher leverage of utility bill-payer monies than the existing OBF programs. The OBR pilots will launch in 2014 and be available to non-residential and residential customers, alongside a modified version of the OBF programs (see Table A - 2 for a comparison of the OBF program and the OBR pilots). Two key features of the proposed OBR pilots are: (1) utility bill-payer-funded OBF may no longer be lighting-only projects,2 and (2) privately-funded, OBR may be used to finance a range of demand side management technologies (including demand response and distributed generation).
In the residential sector, California law does not permit utilities to disconnect customers for third party charges (including financing charges). In 2013, proposed legislation to exempt financing charges from this rule failed to pass in the California legislature. Due to this restriction, an alternative program will be piloted in the residential sector. For single family households and affordable multifamily properties, an “Energy Finance Line Item Charge (EFLIC)” pilot (e.g., line item billing), through which customers may opt to repay financing on-bill, but non-payment does not trigger the risk of service disconnection, will be piloted.3 These pilots will test the extent to which simply repaying a financing charge on-bill reduces participant default rates and whether the option to repay on-bill is attractive to consumers, contractors, and financial institutions (FI). Like all of the CA on-bill pilots, FIs are free to add additional sources of security they see fit (e.g., mortgage, personal guarantee).
2Advanced lighting projects still qualify. 3 Program administrators refer to the pilots by different names, but, for practical purposes, the treatment of the financing charge in the event of participant non-payment is the same. Program administrators refer to the multifamily pilot as On-Bill Repayment.

May 2014 www.seeaction.energy.gov 3
Table A - 2. Comparison of California OBF Program and new OBR Non-Residential Pilots
Program Element OBF
OBR Pilot
w/ Credit Enhancement w/out Credit Enhancement
Eligible Customers
Non-residential Small Business Non-residential
Interest Rate 0 percent TBD TBD
Maximum Term (Years)
Government: 10 Others: 5
TBD TBD
Underwriting Criteria
Utility Bill Repayment History
TBD TBD
Min/Max Loan Amount
Government: $5,000-$1 million Others: $5,000-$100,000
TBD TBD
Incentives Rebates Same as OBF Same as OBF
Eligible Measures
Bill-neutral projects that qualify for existing IOU EE incentives
All measures that qualify for IOU EE incentives (including lighting-only)
No bill-neutrality requirement (expected bill impacts must be disclosed to customers)
NEMs may acct for up to 30 percent of financed project costs
All measures that qualify for OBR Pilot with Credit Enhancement, plus:
DG and DR may acct for up to 100 percent of financed project costs
Disconnection and Meter Attachment
Threat of service disconnection for non-payment
Same as OBF Same as OBF
Transferable? No Yes, with consent Yes, with consent

4 www.seeaction.energy.gov May 2014
Table A - 3. California OBF and OBR Pilots Program Summary
OBF OBR
Total loans over program life
1,374 loans, $43.7 million (average $36,500)
N/A
Total loans in 2012 451 loans, $18.8 million (average $41,000)
N/A
Default rate 0.57 percent N/A
Application Decline Rate 5-15 percent (depending on the utility)
N/A
Average Project Savings Not reported N/A
Cumulative Penetration Rate
0.01 percent N/A
Market Served Business and Government Customers
All Customers (Small business definition for certain programs based on Small Business Administration definitions)
Program Start/End date
Between 2006 and 2010 (depending on the utility) to present
2014 launch
Interest Rate & Term 0 percent up to 5 years (10 years for government)
TBD for private capital, same as OBF for utility bill-payer funds
Max/Min Loan Amount $5,000-$100,000 ($1 million for government)
No limits for private capital; same as OBF for utility bill-payer funds
Rebates Available ~30 percent of project cost ~30 percent of project cost
Disconnection and Meter Attachment
Utility service disconnection Utility service disconnection
Transfers: Allowed? Process? Requirements?
No Yes. Consent Required
Property and tenancy changes involving OBF transfers
N/A N/A
Source(s) of Capital Utility bill-payer funds Utility bill-payer funds, private capital
Underwriting Requirements
Utility bill repayment history TBD for private capital, same as OBF for utility bill-payer funds

May 2014 www.seeaction.energy.gov 5
OBF OBR
Eligible measures Bill-neutral EE projects Utility Bill-Payer Funded: Same as OBF, except lighting may not make up more than 30 percent of financed project costs Private Capital Funded: Lighting-only
permitted and DG, DR and NEMs can be up to 30 percent project costs (for non-credit enhanced projects, DG & DR can be 100 percent project costs)
On-Bill Issues and Findings
The CA OBF program has been one of the most successful OBF programs in reaching small businesses in the US. Program administrators noted several factors that contribute to their relative success:
• Availability of financial incentives (e.g., rebates);
• Eligibility of short payback lighting-only improvements;
• High financing approval rate that underwriting to utility bill repayment history yields, and;
• No interest financing.
The new, privately-funded on-bill offerings are unlikely to rely solely on utility bill repayment history and applicants may face higher financing application rejection rates or requirements that they provide additional security (e.g., personal guarantee). Private capital providers will most certainly charge an interest rate on loans, and it is not clear what impact this will have on customer participation rates in the OBR pilots. For example, a survey of past program participants suggested that some customers may tolerate a low interest rate, but the drop-off in participation for even a modest interest charge would likely be substantial. About 30 percent of customers indicated they would not have participated in the program if the interest rate had been even one percent while 70 percent indicated that they would not have participated if the interest rate had been four percent or higher (see Figure A - 1).
Figure A - 1. Cumulative Distribution of Willingness to Pay (Predicted Values) of OBF Participant Survey Respondents (N=76)
(X-axis: Interest Rate, Y-axis: Predicted Proportion of Survey Respondents Willing to Pay Interest Rate)4
4 Source: The Cadmus Group. 2012. California 2010-2012 On-Bill Financing Process Evaluation and Market Assessment. Prepared for: California Public Utilities Commission. LINK

6 www.seeaction.energy.gov May 2014
Utility program administrators hope that reserving zero percent interest funds for multi-measure improvements will catalyze deeper per-project energy savings. However, many of the energy efficiency service providers active in the OBF program were lighting vendors and advanced lighting improvements remain eligible for OBF. It is not yet clear how much these vendors will need to adapt their models to the program changes, whether other contractors will step in to fill the void if vendors drop out, and/or whether C/I customers will adopt these multi-measure improvements given their frequent focus on short payback improvements.
The OBR Pilot includes several program design elements targeted at minimizing market disruption and driving substantial pilot participation:
• The pilots will provide participating financial institutions (FIs) serving small businesses with credit enhancements of up to 20 percent. The goal of these credit enhancements is to narrow the gap between the OBF offering and the OBR pilot offerings.
• Participants receiving credit-enhanced OBR pilot offerings funded with private capital will not have to meet a bill neutrality requirement and will be permitted to use up to 30 percent of OBF proceeds for DG, DR and non-energy measures (NEM). The goal of these features is to test whether consumers are more likely to invest in EE if they are also permitted to undertake other improvement activities.
• Non-residential participants may use up to 100 percent of OBR proceeds for DG and DR measures, if their FI does not receive credit enhancement. Because these projects won’t directly benefit from utility bill-payer funds targeted at energy efficiency, the pilots will permit participants to fund non-EE projects through OBR in order to increase pilot volume and help to overcome the up-front cost barrier for other energy improvements that serve CA’s policy goals. In the mid-term, fees charged to these projects for tapping the utility billing systems may help to offset the costs of setting up and maintaining program infrastructure (no fees will be charged during the pilot period).
New Program Infrastructure to Support an “Open Market OBR Approach”
If successful, the OBR Pilot will entail multiple financial institutions operating across multiple utility territories. In order to promote statewide consistency and streamline the management and transfer of data and monies between these entities, the CPUC authorized the creation of the California Hub for Energy Efficiency Financing (CHEEF). The California Alternative Energy and Advanced Transportation Finance Authority (CAEATFA), a state agency, will operate the CHEEF.5 The CHEEF’s primary role will be to instruct the utilities to place charges on customer utility bills when financial products are originated by private financial institutions, to collect customer on-bill payments from utilities and remit them to the appropriate financial institution, and to maintain data on the financial products and OBR program. This structure will enable participating FIs and utilities to have a single point of contact for all transactions rather than having to interact with multiple utilities or FIs, all with slightly different policies and procedures (see Figure A - 2).
5As of the time of this writing, the CA legislature had not yet authorized CAEATFA to work on the pilots, causing at least several months of delays in implementing the pilots.

May 2014 www.seeaction.energy.gov 7
Figure A - 2. High-Level Schematic of Centralized Hub Necessary to Support Open Market OBR
The Master Servicer structure should decrease transaction costs and make the lending process smoother for utilities, financial institutions and customers. However, it may be expensive to implement. For example, the CPUC has budgeted $8 million for utility IT systems to be upgraded to work with the Master Servicer and $9 million for administration and implementation. Program administrators face the risk that these up-front costs may become sunk costs if loan volume fails to materialize.
Disconnection and Meter Attachment
In the non-residential sector, in the event of delinquency of utility bill-payer-funded or privately-funded OBF products, the utilities pursue their normal delinquency procedures, which may result in utilities service disconnection. The structure of the on-bill charge was a key point of conflict between stakeholders during the OBR pilot design process. In the residential sector, state law does not permit service disconnection for third party charges so the pilots will feature line item billing. In the non-residential sector, some stakeholders argued that the charge should be structured as a tariff while others argued that the charge should be treated like a loan. The loan versus tariff treatment may have significant implications for the ultimate “value” of OBF to consumers and financial institutions alike. At their core, the key difference between loans and tariffs is that loans are debt of the customer or the customer’s property, whereas the obligation to repay tariffs is attached to the utility meter. Ultimately, the California Public Utilities Commission (CPUC) opted not to authorize a program that relies on the on-bill tariff structure out of concern that this structure might run afoul of federal bankruptcy or state property law.6 Instead, it authorized OBR pilots through which service disconnection is permitted in the event of customer non-payment of financing charges and the financing charge is transferable to subsequent owners and tenants with their express written consent. Customers and FIs may opt for additional security in addition to risk management tool provided by the threat of service disconnection and the CPUC has explicitly authorized a small business lease pilot, which may be combined with the on-bill offering.
6 California Public Utilities Commission Decision 13-09-044 (p. 56).

8 www.seeaction.energy.gov May 2014
Vacancy, Foreclosure and Transfer
On-bill charges may be transferred. FIs have the option of including transferability as an option for their customers or not upon consent of subsequent tenants or owners.
Split Incentives
Owners and tenants may participate (with consent from one another).
Underwriting
Utility bill-payer-funded OBF loans rely on utility bill payment history for underwriting. Roughly 5-15 percent of applicants are declined for financing depending on the utility. OBR underwriting criteria are not yet clear.
Bill Neutrality
Bill neutrality is required for utility bill-payer-funded OBF loans. It will not be required for privately-funded OBR loans. Instead, energy efficiency service providers will be required to provide customers with a disclosure of expected utility bill impacts from their projects.
Billing Systems
The IOUs have been authorized to spend up to $8 million on IT upgrades to accommodate the OBR Pilot.
Lending Regulations
The California Department of Financial Institutions exempts the IOUs from the Money Transmission Act licensing requirements that normally apply to financial institutions because the CPUC has broad regulatory oversight of the IOUs.
Results & Future Plans
In 2014, the OBR and modified OBF Pilots will launch, as CA policymakers seek to increase the leverage of limited utility bill-payer funds by leveraging capital from private financial institutions.
Resources
https://www.socalgas.com/for-your-business/rebates/zero-interest.shtml

May 2014 www.seeaction.energy.gov 9
Clean Energy Works Oregon Home Energy Efficiency Loan and PowerSaver Loan Program
Program administrator: Clean Energy Works Oregon (CEWO) and Craft3
Location: Oregon
Overview
Since 2009, Craft3, a Community Development Financial Institution (CDFI), and Clean Energy Works Oregon (CEWO), a non-profit organization dedicated to delivering energy savings in Oregon, have partnered on an on-bill program that has delivered over 2,300 loans, totaling over $30 million, to fund energy improvements. The program is notable for its alternative underwriting system, which has resulted in a low application decline rate while also achieving a low participant default rate.
Table A - 4. Key On-Bill Program Design Features
Disconnection and Meter Attachment Line Item Billing
Source of Capital On-Bill Repayment7
Underwriting Hybrid (a point system based on credit score, utility bill payment history, current utility bill status and length of utility service)
Eligible Measures Energy Efficiency measures, Non-energy measures
Program Basics
Craft3 and CEWO offer two on-bill repayment products in Oregon: the Home Energy Efficiency Loan (HEEL), secured by a fixture filing (UCC1-A), and the PowerSaver Loan (PSL), an unsecured consumer loan up to $7,500.89 Neither of these loan products includes the threat of utility service disconnection for non-payment. Craft3 manages CEWO’s on-bill program—it underwrites participant loans, provides the capital for financing, and takes on default risk. Craft3 offers loans up to $30,000 that can be paid on the utility bill at rates from 5.25-5.99 percent for up to 15 years (See Table A-5 for Program Summary).
7 This program does not fit neatly into any of the standard OBR program structures defined in the report, highlighting that multiple models are possible. In this case, the program has some characteristics of an open market model (in that a private lender makes loans directly to customers) but has only one financial institution partner. 8 A Deed of Trust is required for PowerSaver loans between $7,500 and $25,000. For more information on the national PowerSaver program, see: http://www.benefits.gov/benefits/benefit-details/5877. 9 A UCC-1A is a provision in the Universal Commercial Code that secures a lender’s right to collateral property in case of default.
Key Takeaways • Alternative underwriting criteria have driven a program applicant decline rate of just 12 percent
and appear to be doing so responsibly, as defaults have been less than one percent (even without the threat of disconnection of utility service for non-payment).
• Coupling rebates with its minimum energy savings (15 percent) requirement has enabled the program to drive program participation and deliver average savings of 30 percent per project.

10 www.seeaction.energy.gov May 2014
Although bill neutrality is not a requirement of the program, CEWO does require that any proposed project have a minimum projected energy savings of 15 percent. CEWO offers tiered, performance-based rebates to incentivize customers and contractors to seek deep energy savings. For projects achieving at least 15 percent energy savings, a participant receives a $500 rebate; for 20 percent savings, a $1,000 rebate; and 30 percent savings yields a $1,250 rebate. The strategy has proved effective, as about 85 percent of upgrades achieve at least 30 percent energy savings.
Table A - 5. CEWO On-Bill Program Summary (If loan product not specified, data refers to both products) Total loans over program life: ~2,300 loans for ~$30M
Total loans in 2012: 1,092 loans for $14.8 million
Default rate <1 percent
Application Decline Rate 12 percent
Average Project Savings ~30 percent energy savings
Penetration rate 0.40 percent (Approximately 600,000 homes in Oregon meet the eligibility criteria of single family homes in participating utility service areas, built before 1993—not on historic registry—in which applicants own and live on the property).
Market Served Single-family homeowners
Program Start/End date
2009 to present
Interest Rate & Term HEEL: 5.99 percent up to 15 years PSL: 5.25 percent up to 15 years
Max/Min Loan Amount HEEL: <$30,000 PSL: <$25,000 secured, <$7,500 unsecured
Rebates Available $500 to offset the cost of diagnostic assessments. Performance-based incentives offer $500 for 15 percent savings, $1,000 for 20 percent and $1,250 for >30 percent. CEWO periodically offers limited time bonus rebates (amounts vary)
Disconnection and Meter Attachment
HEEL: file a UCC1-A PSL: unsecured up to $7,500. For loans between $7,500-$25,000 a deed of trust is required
Transfers: Allowed? Process? Requirements?
Transfers are allowed but Craft3 has not had any to date. The borrower must pay an $850 transfer fee and the new homeowner must meet underwriting criteria, be on the utility bill and be the primary resident.
Property and Tenancy Changes Involving OBF
None

May 2014 www.seeaction.energy.gov 11
Total loans over program life: ~2,300 loans for ~$30M
Source of Capital Craft310
Underwriting Requirements
Point system based on utility bill length of service, current utility bill status, historical utility bill status and credit score
Eligible measures High performance attic, wall and floor insulation, energy efficient windows, high-efficiency home heating systems, air and duct sealing, high-tech water heating systems
On-Bill Issues and Findings
Disconnection and Meter Attachment
Disconnection is not an option in cases of non-payment. A UCC-1a is filed on all HEEL loans. PSL loans are unsecured up to $7,500 but require a deed of trust for loans over that amount.
In partial payment situations, all utility-related charges are paid first. Any residual money is applied to the loan repayment. If a customer is 90 days overdue, the loan payment is removed from the utility bill and collection becomes the responsibility of Craft3.
Vacancy, Foreclosure and Transfer
Craft3 handles situations of vacancy on a case-by-case basis. Generally, once the account is closed or changes hands, they deal with the original account holder “off-bill” to collect the loan balance. Craft3 has not had an instance of a transferred loan. The enacting legislation originally required that transferability be available as an option but the mandate was recently removed. Craft3 intends to continue offering transferability as an option. Their transfer guidelines stipulate that the borrower must pay an $850 transfer fee and the new homeowner must meet the program’s underwriting criteria.
Split Incentives
Tenants are not eligible to participate.
Underwriting: Alternative Underwriting Expands Access to Capital
Through an innovative underwriting process, the program has expanded the pool of applicants that can access loans that can be paid on the utility bill. The process relies on a points-based “Risk Rating” system. Craft3 scores applicants based on a range of factors, including:
• Credit score: scores below 660 begin to add points;
• Length of utility bill history: less than six months available history or unavailable history receives points;
• Current and historical utility bill delinquency: borrowers with any current delinquency more than 30 days are given points; they also have points added for one or more delinquencies in the past 12 months; and
• Mortgage repayment history: any first mortgage delinquency adds points.
CEWO sums these points to assess an applicant’s creditworthiness (Zimring 2012).11
10 Craft3 recently completed a secondary sale of a portion of its pool of loans that are paid back on the utility bill. More details on this sale will be available in a forthcoming policy brief in Spring 2014. 11 For more information on this scoring system, visit http://middleincome.lbl.gov/reports/mi-policybrief-4-4-2012c.pdf.

12 www.seeaction.energy.gov May 2014
CEWO’s Risk Rating system resulted in declines of just 12 percent of applicants. This decline rate is substantially lower than those programs that rely on “standard” underwriting criteria (e.g., credit score, debt-to-income ratio), which often have decline rates of 30-50 percent. Importantly, the system appears to be expanding access to capital responsibly the customer default rate on Craft3’s on-bill lending remains below one percent.
The participating utilities—Northwest Natural, Portland General Electric, and Pacific Power—do not allow power disconnection as recourse for loan non-payment. However, Adam Zimmerman, Craft3’s Executive Vice President, believes that disconnection would be only a minor credit/risk management tool because, in Oregon, loan charges are only paid after other utility charges in the case of partial payments. In addition to the subordination of the loan charge to other utility charges, disconnection for non-payment of utility charges takes so long that Craft3 would have already removed the loan from the customer’s utility bill and addressed it through their standard loan collection processes and/or written the loan off by the time shut-off became available as a potential default remedy.
Bill Neutrality
Bill neutrality is not required nor explicitly promoted. Zimmerman says Craft3 is not concerned with bill neutrality and does not think it is necessarily attainable given the goals of their program, energy prices in the region, and uncertainty of the behavior of the building occupants. He indicated that they try to encourage high levels of savings, but allow the customer and contractor to figure out the best options and pricing for that home.
Billing Systems
All three participating utilities had to upgrade their billing systems, which took approximately four months. The total amount paid for the original IT upgrades was $50,000 for all three utilities. They had to adjust bills so that each showed a line with a labeled loan payment charge. A billing note and toll-free number are included with the bills.
Lending Regulations
Lending regulations do not affect participating utilities since the loans are not held by the utility. Craft3 must comply with lending laws, and as a financial institution they are set up to do that already. Oregon’s HB 2626, the Energy Efficiency and Sustainable Technology Act of 2009, also explicitly authorizes on-bill programs.
Results & Future Plans
Clean Energy Works Oregon (CEWO) has made over $30 million in loans with a default rate under one percent. The program’s hybrid underwriting criteria has enabled it to maintain this low default rate while approving 88 percent of applications.
Resources • http://cleanenergyworksoregon.org/hello/
• http://www.craft3.org/Borrow/cewo

May 2014 www.seeaction.energy.gov 13
Georgia Environmental Finance Authority—Residential Energy Efficiency On-Bill Loan Programs
Program administrator: Electric Cities of Georgia, Municipal Gas Authority of Georgia and Oglethorpe Power Corporation
Location: Georgia
Overview
In 2010, Electric Cities of Georgia (ECG), Municipal Gas Authority of Georgia (MGAG) and Oglethorpe Power Corporation (OPC)—three organizations that assist electric and gas distribution utilities—won a $5 million American Recovery and Reinvestment Act (ARRA) grant, distributed by the Georgia Environmental Finance Authority (GEFA). ECG and MGAG used their grant money to capitalize revolving loan funds12, which their member utilities used to make zero percent interest, loans that can be paid back on utility bills for residential energy efficiency upgrades. OPC worked with a local credit union (CU) and used its grant money, to buy down the CU’s loans to zero percent interest, which participants then repay on their utility bills. The $5 million grant has supported the issuance of nearly $18 million of on-bill loans, to over 3,800 customers, across the three grantees. The default rate has been just 0.08 percent.
Table A - 6. GEFA Key On-Bill Program Design Features
Disconnection and Meter Attachment
Line Item Billing (for majority of loans; a small portion are on-bill loans with disconnection)
Source of Capital On-Bill Repayment--Warehouse (for majority of loans; remainder are On-Bill Finance)
Underwriting Hybrid (utility bill payment history and credit score)
Eligible Measures Energy efficiency measures, renewable energy measures
Program Basics
ECG & MGAG
Both ECG and MGAG set up revolving funds to provide their member utilities with capital to make loans to their customers that can be paid back on-bill. ECG and MGAG were awarded $1.1 million and $700 thousand respectively, based on the size of their customer bases. Georgia law prohibits public entities from making loans to their citizens, so ECG members, all city agencies, structured their programs as on-bill tariffs, which are debt of the
12 As customers repay loans funded through a revolving fund, those monies are then re-lent to new customers or projects.
Key Takeaways • Using a third-party lender can move default responsibility and underwriting, servicing and
origination costs to the lender, but it may deprive a program administrator of the ability to set inclusive underwriting criteria.
• Interest rate buy downs (IRBs) significantly leverage funding but deplete seed capital. They can be useful tools for driving initial program interest and then phased out through time while maintaining a base level of demand. Programs using IRBs must balance maximizing available capital and maximizing participation, when deciding a target interest rate for their product.

14 www.seeaction.energy.gov May 2014
utility meter rather than the utility customer (Bell 2011). MGAG program administrators say this was not an issue for them and indicated that their members make payments to the contractor, not the homeowner.
Participating MGAG and ECG utilities offer zero percent financing to customers with terms of up to five years. ECG participants must be current on all bills with the city for the last 12 months to qualify for the program; MGAG utilities require a consistent two-year utility bill payment history and a few also check applicants’ credit scores (minimum scores vary for each member). ECG utility customers are charged a $3-5 monthly fee that funds internal loan loss reserves (LLRs) designed to ensure the sustainability of the revolving funds.13 MGAG utility customers are charged a $3 per month administrative fee, which has been used to cover administration costs and loan defaults.
Three of ECG’s 52 members participated in the program: Thomasville, Monticello and Covington. Thomasville was very engaged—for example, the city advertised the program on TV and posted signs in participants’ yards—and ultimately did the bulk of OBF volume, approximately $750 thousand of the $1.1 million allocated to ECG. Program administrators attribute much of Thomasville’s success to momentum built through word of mouth advertising. By the time the Monticello and Covington programs began in earnest, there was more demand than remaining capital could meet. Wait lists have been set up since outstanding loans must be repaid before more capital is available for new loans. While the revolving loan funds may sustainably provide small pools of capital for lending through time, by their nature, they limit programs’ potential for short-term scale and administrators are concerned that these wait lists could reduce interest in the program.
MGAG’s members found the program so popular that its board voted to add $5 million in capital to their revolving loan fund in March 2012 to increase the program’s scale, after exhausting the initial grant money in four months.
Table A - 7. Program Loan Volumes (by administrator)
Program Administrator Loans ($ million) Loans (#)
ECG $ 1.4 334
MGAG $ 1.1 314
OPC $15.2 3,163
Total $17.7 3,811
Oglethorpe Power Corporation (OPC)
Oglethorpe Power Corporation is a non-profit generation and transmission company that supplies electricity to its 38 Electric Membership Corporations (EMC), 25 of which participated in the on-bill program. OPC distributed $3.2 million in grant money to its cooperative distribution utility members based on the size of each co-op’s customer base. The co-ops bought down five-year credit union loans from 8.5 percent interest to zero percent interest at a cost of approximately $750 per $5 thousand loan.
24 EMCs used the buy-down model with Federal Credit Union. They completed about 2,800 loans—using $1.9 million of grant money—for $13.9 million in total financing to utility customers. One EMC (Habersham) used $1.3 million in grant funds to seed a revolving loan program, completing about 300 loans.
13 LLRs for ECG’s three participating members are: Monticello—$1 thousand, Covington—$7 thousand and Thomasville—$20 thousand. The members have no limit or goal for their LLRs.

May 2014 www.seeaction.energy.gov 15
Jeff Pratt, OPC’s Director of Energy Efficiency, notes that the advantage of the interest rate buy-down model is that it allowed OPC to use limited funds, to leverage private capital and provide service to many more customers than it would have through a revolving fund. He points out that it also helps the utility maintain focus on its core business function while using the credit union to concentrate on its core function (i.e., its lending competency).
Since grant monies were exhausted, most participating co-ops have continued to offer credit union loan products, but at market interest rates of around eight percent.14 This has decreased uptake of the loans. Since IRB funds were exhausted, volume has dropped from about 175 loans per month to fewer than 25 per month.
Although the three programs used different underwriting criteria, the overall default rate was very low (less than 0.1 percent). Of approximately 3,800 participants, only three discontinued payment.
Table A - 8. GEFA Program Summary Total loans over program life: 3,811 loans, $17.7 million (2010-2013)
Total loans in 2012: Not available
Default rate: 0.08 percent
Application Decline Rate ECG: ~7 percent
MGAG: not available
OPC: ~10 percent
Average Project Savings ECG: not available
MGAG: not available
OCP: 6,326 kWh
Cumulative Penetration Rate Not available
Market Served Residential, single family, duplex, four-plex
Program Start/End date 2010 to present
Interest Rate & Term ECG: 0 percent, up to 5 years
MGAG: 0 percent, up to 5 years
OPC: 0 percent (with grant money); currently 7.9 percent for up to 5 years*
Max/Min Loan Amount ECG: up to $5 thousand
MGAG: up to $5 thousand
OPC: up to $7.5 thousand
Rebates Available Only with a few of OPC’s members
Disconnection and Meter Attachment
ECG: property lien
MGAG: natural gas disconnection, some members take out a property lien
14OPC and MGAG members lent out all grant money within 11 months of the program start date; ECG members lent out all grant money within 13 months.

16 www.seeaction.energy.gov May 2014
Total loans over program life: 3,811 loans, $17.7 million (2010-2013)
OPC: unsecured
Transfers: Allowed? Process? Requirements?
No transfers allowed
Property and tenancy changes involving OBF transfers
N/A
Source(s) of Capital ARRA Energy Efficiency and Conservation Block Grant, GEMC Federal Credit Union
Underwriting Requirements ECG: payment history with the city
MGAG: utility bill payment history, some members check credit as well
OPC: utility bill payment history and credit check
Eligible measures The purchase and installation of ENERGY STAR appliances, including refrigerators, dishwashers, freezers, washing machines, ENERGY STAR-qualified heating, ventilation, and air-conditioning (HVAC), home weatherization products, insulation, duct sealing and air sealing work, renewable energy products, solar hot-water heaters
*Co-op members that offer rebates have begun to use rebate money to partially buy down the 7.9 percent interest rate.
On-Bill Issues and Findings
Disconnection and Meter Attachment
ECG’s member utilities take out a property lien on participants’ homes. Applicants must not have any late payments to the city over the previous 12 months. GEFA’s overall default rate is 0.08 percent. Of 3,811 loans, just 3 have defaulted to date. In two cases the home burned down and in the remaining case the borrower died.
Vacancy, Foreclosure and Transfer
None of the participants allow transfers.
Split Incentives
Tenants are not eligible for the program.
Underwriting
MGAG member utilities check applicants’ two-year utility bill payment history or check credit history; most use bill payment history as their underwriting criteria. MGAG members may use natural gas disconnection in cases of non-payment. Some also take out a property lien.
OPC’s lending partner, GEMC Federal Credit Union, determines the program’s underwriting and security. Underwriting includes review of utility payment history and a credit check.

May 2014 www.seeaction.energy.gov 17
Bill Neutrality
For both ECG’s and MGAG’s programs, bill neutrality was neither promoted nor required. Although OPC administrators were concerned about bill neutrality, they felt that the grant deadline did not allow enough time to set up the evaluation, measurement and verification (EM&V) they believed would be needed to implement and enforce this provision.
Billing Systems
No upgrades were required to ECG’s members’ billing systems. MGAG had to build a loan tracking system, which cost approximately $10,000. Of OPC’s members, only Habersham EMC needed to upgrade their billing system. This was to do amortization calculations on the loans, which the credit union did for the other EMCs.
Lending Regulations
ECG’s members are government agencies and, as such, are prohibited from lending to citizens (Bell 2011). This drove the structure of their program—on-bill tariffs are tied to the property’s utility meter and not technically treated as loans to the customer. MGAG administrators say lending regulations were not an issue for them. OPC’s members only collect payments and third party lenders make the loans for OPC’s members; thus, the EMCs are not exposed to lending regulations.
Results and Future Plans As of fall 2013, ECG participants have lent out $1.4 million from initial seed money of $1.1 million—1.3 times the amount of their original grant. The leverage comes from $300 thousand in loans that have turned over. Unless additional capital is added, they must wait for outstanding loans to revolve to continue lending. ECG has no plans to add capital to the program. The advantage of using a revolving loan fund is that they can continue to lend indefinitely without additional funds, although slowly.
MGAG has lent out $1.1 million to date, 1.6 times the amount of their original grant. It has infused an additional $5 million of capital into its revolving loan fund for its members to meet the growing demand for on-bill financing.
OPC has been able to leverage their $3.2 million in grant funding into over $15.2 million in loans—nearly five times the amount of initial funding. OPC’s members are continuing their on-bill programs, although, with no more capital left to buy down interest rates, the loans must now be offered at near-market rates. This has slowed program uptake significantly, although lending remains steady. Habersham EMC’s revolving loan program continues to lend using repaid capital to fund additional loans at a low interest rate. The default rate for all three programs is less than 0.1 percent.
Program administrators note they have heard from customers that the ability to finance efficiency improvements on-bill is valuable to them. Administrators indicated that on-bill financing is a valuable customer service that their member utilities can offer.
Resources
http://gefa.georgia.gov/residential-energy-efficiency-loans \

18 www.seeaction.energy.gov May 2014
Illinois Energy Efficiency Loan Program (IEEL)
Program administrator: AFC First Financial Corporation on behalf of five participating utilities
Location: Illinois
Overview
In 2009, the Illinois legislature passed SB 1918, a law requiring that all of the state’s investor-owned utilities, with more than 100,000 residential customers, develop an on-bill repayment (OBR) program for single family customers (Bell 2011). Since its launch in 2011, customers have financed over 1,300 projects ($6.5 million), through the Illinois Energy Efficiency Loan (IEEL) on-bill program. IEEL is operated on behalf of the five participating utilities—Ameren, Commonwealth Edison (ComEd), Nicor Gas, North Shore Gas and Peoples Gas—by AFC First Financial (a program manager, loan originator and servicer), with the capital provided by National Penn Bank, which is, in turn, provided an Assurance of Payments by the utilities.15
Table A - 9. IEEL Key On-Bill Program Design Features Disconnection and Meter Attachment
On-Bill Loan with disconnection
Source of Capital On-Bill Repayment--Warehouse
Underwriting Traditional (credit score, debt-to-income ratio, income verification)
Eligible Measures Energy efficiency measures
Program Basics
SB 1918 required that for three years, beginning in 2012, each utility must provide an Assurance of Payments on up to $2.5 million in on-bill loans (a $12.5 million total potential guarantee across the five utilities), for customers to upgrade the efficiency of their homes (Bell 2011). At the end of the three years, the Illinois Commerce Commission will decide whether or not to extend the program.
15 State legislation obligates utilities to make payments to investors on on-bill loans when they are due, regardless of whether the customer has made that payment to the utility. This “Assurance of Payments” is, effectively, a utility guarantee that on-bill investors will be re-paid should customers default on their loans.
Key Takeaways • The selection of eligible EE measures can dramatically impact on-bill program success – nearly
half of the loan volume in the Illinois Energy Efficiency Loan (IEEL) Program has come through a single utility with a broad list of eligible measures. IL’s on-bill legislation required cost-effectiveness tests that limited some utilities’ ability to offer a broad range of measures.
• The on-bill initiative is operated by a single program administrator on behalf of five utilities to streamline and simplify contractor and customer access to the program.
• A private financial partner is provided an assurance of payments by the utilities, which guarantees repayment of loans and has yielded low-cost capital from the bank.

May 2014 www.seeaction.energy.gov 19
AFC First administers the program for all five participating utilities. AFC First confirms project eligibility, originates loans, services them throughout their lives and warehouses them before repackaging and selling them to National Penn Bank in bundles of approximately $3 million. Customers are offered the choice of 3, 5 or 10-year loan terms at 4.99 percent interest, for amounts from $500 to $20,000. This relatively low interest rate is driven by SB 1918’s requirement that utilities shoulder customer default risk; pricing from National Penn Bank was derived from public debt costs of the utilities plus a small risk premium. The program relies on traditional underwriting metrics of minimum 640 credit score, income verification for loans above $4,000 and debt-to-income ratios (DTI) below 50 percent.16 Applicants must also be current on their utility bills. In the event that customers fail to make on-bill loan payments, the same processes and customer protections are triggered as non-payment of any other utility bill charge, which may ultimately lead to disconnection of power. The loan payment is treated on a pari-passu basis with the utility charge.17
Eligible Measures Impact Program Participation
IL’s original on-bill legislation required utilities to permit customers to finance only measures that passed a modified Total Resource Cost (TRC) test, which included the measure’s full cost.18 This full cost treatment is stricter than the more common cost-effectiveness methodology of examining the incremental cost of the high-efficiency measure compared to the minimum permissible efficiency measure. Few measures passed this rigorous standard and, in 2012, the legislation was altered to permit electricity utilities to finance any measure included in the utility’s DSM portfolio. In August 2013, the legislature passed SB 2350, which allows natural gas utilities to follow similar practices on defining eligible measures as electric utilities.
The limits on measures that utilities can offer have limited the loan volume that they have done: the one utility with the most available measures, Ameren, has done far more volume than the other utilities ($2.5 million). Ameren, which is an electricity and natural gas distributor, was able to qualify more measures than any other participating utility because, as a combined utility, it could include measures that save gas and/or electricity. Ameren has done nearly double the average volume of the remaining utilities that are offering programs.19
When ComEd, an electric utility serving Chicago and Northern Illinois, launched its on-bill program using the full cost TRC, the only measures that qualified were ENERGY STAR® refrigerators costing $1,250 or less. This highly restricted list of improvements both limited customer adoption of the program and raised questions about whether the up-front costs of high-efficiency refrigerators are even a barrier that program-sponsored financing needs to overcome. In addition, small refrigerator loans are unprofitable to originate and service for the program administrator.
After the 2012 amendment allowing DSM portfolio measures for electric utilities, ComEd added central air conditioning (AC) as an eligible measure for the on-bill pilot. However, AC systems can only be financed if they were completed as part of a combined gas & electric system replacement. While customers are required to undertake furnace replacements to qualify their new AC systems for the financing program, the furnace may not be financed on ComEd’s bill since it is a gas measure. The area gas provider, Nicor Gas, did not launch its on-bill program until the beginning of 2014 since, until the SB 2350, it was still subject to the full-cost TRC methodology. ComEd customers have been left to seek alternative financing for high-efficiency furnaces, which program administrators suggest has hurt program participation.
16 Customers with DTIs >50 percent that meet all other underwriting criteria can borrow up to $2,500. 17 Pari passu treatment is defined by each charge being paid at the same percentage as the overall bill. For example, if 40 percent of the overall bill was paid, 40 percent of the utility charge will be paid and 40 percent of the loan payment will be paid. 18 The Total Resource Cost test (TRC) is a cost-effectiveness evaluation tool that seeks to include all costs and benefits associated with the energy savings. Costs generally include incremental measure costs and program administration costs. Benefits usually include avoided energy, capacity, transmission/gas transportation and distribution system costs. 19 Loan volume data for the five utilities was not available. However the IEEL program website for Ameren notes that the utility has reached the mandated loan limit ($2.5 million) and has stopped accepting applications. The program is on hold for now. Nicor, a natural gas utility was not able to qualify any measures until SB 2350 passed. It will initiated its on-bill program at the beginning of 2014.

20 www.seeaction.energy.gov May 2014
SB 2350 also streamlines loans that include electric and natural gas measures for customers in service areas served by separate gas and electric utilities. It requires electric utilities to permit customers to finance measures eligible for gas utility on-bill programs on their electric bills when the majority of the project costs are for electric efficiency measures and vice versa. In its absence, customers would have to take out two different on-bill loans (i.e., one re-paid on the electric utility bill and one on the gas utility bill), which would present challenges to program participation and billing system coordination. Program managers expect this streamlined approach to dramatically increase program participation.
Table A - 10. IEEL Program Summary Total loans over program life: 1,318 loans for $6.5 million
Total loans in 2012: 490 loans for $2.2 million
Default rate 0 percent
Application Decline Rate 49 percent
Average Project Savings Not available
Cumulative Penetration Rate 0.03 percent
Market Served Homeowners, duplex owners, condominium owners and residential building owners (<4 units)
Program Start/End date 2011 to present
Interest Rate & Term 4.99 percent for 3, 5 or 10 years
Max/Min Loan Amount $500 to $20,000
Rebates Available ACs & heat pumps: $150-$600; furnaces $200-$1000; refrigerator $50 plus transport and disposal of replaced unit (from the participating utilities)
Disconnection and Meter Attachment
Unsecured, but carries the ability to disconnect power
Transfers: Allowed? Process? Requirements?
No. Loan must be paid in full if participant moves
Ownership and tenancy changes involving OBF transfers
Not applicable
Source(s) of Capital AFC First Financial, National Penn Bank, utilities cover default costs and use cost recovery for program administration
Underwriting Requirements Credit score of > 640, must be current on utility bill, income verification for loans over $4,000; if DTI is greater than 50 percent a cap of $2,500 on loan amount
Eligible measures Dependent on utility; examples include Insulation, air source heat pump, central AC, furnaces, heat pump water heater and EnergyStar qualified refrigerators

May 2014 www.seeaction.energy.gov 21
On-Bill Issues and Findings
Disconnection and Meter Attachment
The consumer loans are unsecured, but carry the penalty of disconnection of power for nonpayment. This does not concern AFC First or National Penn Bank since they are statutorily assured of monthly payment receipt regardless of a loan’s performance.
Vacancy, Foreclosure and Transfer
The IEEL program does not allow transfers. The enacted legislation obligates utilities to make payments on OBF loans when due, whether or not the customer has made that payment to the utility (“Assurance of Payments”); thus, participating utilities bear all default risk and address that risk through coverage afforded them through their Bad Debt Riders.20 Thus, delinquency, nonpayment, vacancy and foreclosure do not impact AFC First, as the third-party administrator, nor National Penn Bank, as the third-party lender.
Split Incentives
Tenants are not eligible to participate.
Underwriting
AFC First conducts the underwriting for the program using conventional underwriting protocols. For approval, applicants must have a Transunion credit score of 640 or higher. Loans greater than $4,000 require income verification in addition to credit score qualification. Applicants with debt to income ratios higher than 50 percent are only eligible for loans of $2,500 or less.
Bill Neutrality
Bill neutrality is not required in the IEEL program.
Billing Systems
In order to implement the program, AFC First had to build an account detail and billing information platform, to enable its IT systems to interact with each of the five participating utilities’ systems. The coordination of account and billing systems was a challenge for AFC First and the participating utilities. Each utility finances different measures and has distinct billing systems. Streamlining the systems cost more than AFC First expected and slowed down the implementation process.
Lending Regulations/Enacting Legislation
Illinois’ 2009 SB 1918 mandates that IL’s five utilities with more than 100,000 residential customers each guarantee up to $2.5 million in on-bill loans. In 2013, SB 2350, amended cost effectiveness requirements which has allowed utilities to offer on-bill financing for a broader range of measures.
Results and Future Plans
As of October 2013, IEEL had made 1,318 residential loans, totaling $6.5 million. The average loan was $4,932 with a default rate of zero percent. Nicor began its program at the beginning of 2014.
SB 2350 also allows electric utilities to coordinate with gas utilities, to streamline loans made for measures that reduce gas and electric consumption, in service areas where a separate utility supplies each. Customers will be able to pay off a loan on either the gas bill or the electric bill. SB 2350 also permits utilities to make loans to multi-family and mixed-use building owners.
20 Bad Debt Riders allow utilities to recover prudently incurred costs increasing customers’ energy rates.

22 www.seeaction.energy.gov May 2014
At the end of the three-year pilot, the Illinois Commerce Commission will decide the program’s future.
Resources
http://www.ilenergyloan.com

May 2014 www.seeaction.energy.gov 23
How$mart® Kansas On-Bill Program
Program administrator: Midwest Energy (MWE)
Location: Kansas
Overview
Kansas’ Midwest Energy (MWE) cooperative utility has run operated the How$mart® program since 2007, which offers home energy upgrades that can be paid back on participants’ utility bill. How$mart® Kansas has funded just over 1,000 upgrades to date, at an average financed project cost of $5,700.21 The utility has relied on utility capital and, when available, low-interest monies from federal or state entities to fund the up-front costs of participant improvements. The program stresses bill neutrality, committing only to projects that trained program staff estimate will result in lower total electricity bills for participants. For Midwest Energy, an important aspect of How$mart® is that projects are tied to the meter, which allows the debt to transfer with occupancy. Customers only need to pay for upgrades while they are benefiting from them.
Program Basics
How$mart® Kansas is based on the Pay As You Save® (PAYS) program model.22 Eligible measures include anything permanently attached to a home that yields utility bill savings, including electric, gas and water efficiency measures. Residential customers currently pay a three percent interest rate for the lesser of 15 years or three-quarters of the expected life of the measure. Business customers pay 4.5 percent for a 10-year term. Renters are eligible to participate since the repayment obligation is tied to the utility meter, not the individual customer.
Table A - 11. How$mart Kansas Key On-Bill Program Design Features
Disconnection and Meter Attachment
On-bill tariff
Source of Capital On-Bill Financing (Utility, state and federal monies)
Underwriting Alternative
Eligible Measures Energy efficiency measures
Midwest Energy is a cooperative utility that uses its own capital to fund the on-bill program. It typically marks up interest by 1.5-2 percent above its own borrowing costs to partially cover program administration costs. When
21 All but 25 loans were provided to residential customers. Midwest Energy considers the energy upgrades to be “utility service” for coop members, and thus they do not consider the capital provided to be a loan. 22 The PAYS model ties loans to the meter, allows power shut-off for non-payment (an On-Bill Tariff model) and requires bill neutrality.
Key Takeaways • Program expenses to ensure bill neutrality are significant but give the customer and utility
confidence that net costs to customers will be reduced through participation in How$mart.® • Attaching upgrade costs to the meter enables renters to participate and pay for benefits they
receive, without obligating them to pay project costs if they move. • Non-traditional underwriting expands who can participate in this program. Midwest Energy only
requires that customers be current on their bills and have potential for savings based on an in-home audit.

24 www.seeaction.energy.gov May 2014
available, low-cost federal and state capital is utilized to keep the customer’s embedded interest rate low. For example, the Kansas Housing Resources Corporation provided zero percent capital for several years. More recently, Midwest Energy has been using zero percent interest rate USDA capital to cover about half of the loan amounts, with its own capital covering the remainder (Bell 2011).
As of June 2013, defaults on financing offered to customers have been less than one percent, which is comparable to the non-payment rate of MWE’s standard utility bills.
Program administrative costs are significant: $1,100 to $1,500 per completed project. These costs cover the pre-work audit, the conservation plan created by program staff, the post-upgrade audit, and the cost of capital. These costs are recovered through the interest rate premium charged to participants over the life of the loan and program fees. Midwest Energy adds a charge of five percent of the total loan amount to the project costs that are financed.
Tariff Structure and Transferability
Transfers are allowed and are handled by having retrofit costs tied to the meter. This is an important part of the program for Midwest Energy. The payment stays with the property and is transferred much like an outdoor light that is “tied to the premise.” Written disclosure to subsequent tenants/owners is required, which involves filling out a form provided by MWE (or other acceptable document signed by the incoming MWE customer).
This arrangement allows renters to participate and addresses the problem of current owners paying for improvements from which future owners will benefit. For renters to participate, the landlord must give consent. For tenancy changes, MWE considers language in the lease as “written consent”. Most landlords have added language to their leases to reflect How$mart® obligations.
MWE has found transfers difficult to track but estimates that approximately16 percent (150) of properties with How$mart® loans have changed hands. About 75 loans have had repayment taken over by a subsequent owner or tenant. The other half paid off the on-bill charge before moving.
Program administrators have received feedback that owners value the upgrades. However, they also note that owners often pay off the loans before they sell, implying that owners believe the on-bill debt may negatively impact the home sales process and prefer to clear the lien before a home sale.
Bill Neutrality
One tradeoff of the program’s bill neutrality requirement is that it limits projects to dollar amounts that can be paid back without increasing the borrower’s electricity bill. The How$mart® program stipulates that payments on retrofit projects must be limited to no more than 90 percent of projected energy savings, allowing for the overall bill to go down (Bell 2011). The goal is not just bill neutrality, but rather reduced utility bills.
Several program design characteristics are designed to achieve bill neutrality. First, administrators pre-screen applicants to ensure that their properties are good candidates for cost-saving energy improvements. For the project to qualify, improvements must provide energy savings that more than cover the on-bill payments. Second, the utility offers a low interest rate and long terms, reducing monthly payments, to increase the number of projects that can meet the bill neutrality threshold. Third, MWE allows customers to buy down any amount beyond the amount that meets the bill neutrality savings threshold, which many customers choose to do.
Midwest Energy has compared estimated savings to realized savings on completed projects and finds that most bills end up net neutral. The difference on utility bills due to the program is only about plus or minus $5 on a given bill. Because of this, staff does not believe that the program affects bill payment rates since it does not significantly impact a customer’s cash flow either positively or negatively.

May 2014 www.seeaction.energy.gov 25
Table A - 12. How$mart Kansas Program Summary
Total projects since inception
1,014 projects completed for over $6 million (989 residential at $6,000 per project and 25 non-residential projects at $7,800 per project)
Total projects in 2012 176 projects completed for over $1 million (168 residential at $5,700 per project and 8 non-residential projects at $7,300 per project). Average financed amount of ~$5,800 plus average $1,200 buy down from the customer
Default rate MWE has incurred “bad debt” as a result of nonpayment for this program that is comparable to their regular bad debt incurred from the nonpayment of standard utility bills (<1 percent).
Program Decline Rate Approximately one-quarter of initial calls do not result in an audit due to poor payment history or insufficient savings potential. About two-thirds of completed audits result in completed How$mart® projects
Average Project Savings Average annual savings of about 2,100 kWh and 270 therms of gas per project
Cumulative Penetration Rate
1.4 percent
Market Served Single Family, Multi Family, commercial
Program Start/End date
2007—present
Interest Rate & Term Residential: 3 percent for the lesser of 15 years or ¾ of expected measure life Commercial 4.5 percent for 10 years (except for lighting, 7 years) Geothermal heat pumps 30 years
Max/Min Loan Amount There is no minimum nor maximum loan amount. Loans are capped at the level where principal and interest costs do not exceed 90 percent of expected energy savings
Rebates Available None directly from MWE.
Disconnection and Meter Attachment
Ability to disconnect for non-payment. UCC-1 filed
Transfers: Allowed? Process? Requirements?
Yes. MWE provides a written disclosure form that is provided to subsequent tenants/owners. MWE considers language written into leases to be ‘written consent’ for tenants. Most landlords have added language to their leases to reflect How$mart® obligations
Ownership and tenancy changes involving OBF
Approximately 150 participants have left their improved properties. About half have paid the balance of the program costs and half have transferred them to the new occupant
Source(s) of Capital Utility internal funds marked up at 1.5-2 percent above the cost of those funds (including available low-cost capital targeted for energy efficiency application).
Underwriting Requirements
MWE screens customers as follows: being current on their utility bill and electricity usage that is high enough to justify the investment
Eligible measures Insulation, air sealing, new heating and cooling systems, thermal shell improvements, HVAC, anything attached to the permanent foundation that yields utility bill savings (including water, electric, gas, propane, fuel oil, etc.), C&I lighting and residential ground source heat pumps.

26 www.seeaction.energy.gov May 2014
On-Bill Issues and Findings
Disconnection and Meter Attachment
A UCC-1 is filed with each project. The utility retains the right to disconnect power in cases of delinquency. Midwest Energy treats these projects as the provision of an energy service. Bad debt for the program is less than one percent of capital invested. In partial payment situations, the repayment is subordinate to utility charges.
Vacancy, Foreclosure and Transfer
Sellers must fill out a form provided by Midwest Energy for disclosure. For renters, landlords must include disclosure language in the lease. The new tenant gives written consent by signing a lease with this language in it. Michael Volker (Midwest Energy’s Director of Energy and Regulatory Services) indicated that they have had very few problems with transfers.
The balances on project investments survive foreclosures in some cases. In a foreclosure the remaining balance on the upgrade is subordinate to the primary mortgage.
Underwriting
Midwest Energy underwriting requirements only stipulate participants be current on their utility bill at the time of a preliminary audit and when the project is complete; project development process typically takes an average of six months.
Bill Neutrality
Loan principal and interest payments may be no more than 90 percent of projected energy savings, allowing for the overall bill to go down (Bell 2011).
Billing Systems
Adding monthly project cost repayments onto utility bills required no changes to the MWE billing systems.
Lending Regulations
State financial regulations were amended, by the Kansas legislature, exempting Midwest Energy from consumer credit law that would otherwise prohibit them from lending to customers.
Results and Future Plans
In 2013, Midwest Energy conducted a process evaluation of the How$mart® program and is evaluating plans to expand the How$mart® service to offer loans that cover more comprehensive projects. For these loans, bill neutrality may not be possible. Only customers with very good payment histories will likely be accepted for such projects as they will be allowed to take loans with payments that surpass the 90 percent of savings requirement.
Midwest Energy staff indicated that they believe that How$mart® has been a successful program that allows them to offer additional value to their customers, beyond the traditional services of a utility company.
Resources
http://www.mwenergy.com/howsmart.aspx

May 2014 www.seeaction.energy.gov 27
National Grid On-Bill Loan Programs
Program administrator: National Grid (NG)
Location: Massachusetts, New York and Rhode Island
Overview
National Grid (NG) has run on-bill financing programs for small commercial and large commercial and industrial customers in Massachusetts and Rhode Island since 1993 (Bell 2011) and in Upstate New York starting in 2010.23 The programs generate significant loan volume. In 2012, NG made 9,800 loans that can be repaid on-bill, totaling over $21 million. Small business loans average between $2,000 and $2,500; average large commercial and industrial (C&I) loans are $65,000. NG staff attributes this success to the ease of the loan process for customers, the size of rebates, and the zero-interest loan that can be paid off on the utility bill. A long-term goal for NG is to sell a $50 million tranche of these loans.
Table A - 13. National Grid Key On-Bill Program Design Features
Disconnection and Meter Attachment Line Item Billing
Source of Capital On-Bill Financing (Utility bill-payer capital)
Underwriting Alternative (utility bill payment history)
Eligible Measures Energy efficiency measures
Program Basics
NG sponsors on-bill EE financing programs for two sectors through utility subsidiaries: a small business program in NY, MA and RI and a large commercial and industrial (C&I) program in MA and RI. The small business program offers up to a 70 percent rebate for efficiency upgrades and a two-year, zero percent loan that can be used to finance the balance of project costs (Bell 2011). The large C&I program offers rebates for up to 50 percent of project costs and enables customers to finance the remaining costs of the project at zero percent interest for up to two years. In 2012, the small business programs executed 9,800 loans for over $21.5 million, while the large C&I program made 154 loans for about $10 million. Overall the NG program is one of the highest-volume on-bill initiatives in the US.
23 National Grid recently sold its assets in New Hampshire, including its on-bill portfolio, to Unitil, including the small business on-bill program in that state.
Key Takeaways • National Grid (NG) has some of the longest-running and highest-volume on-bill programs in the
country; staff attributes success to ease of the loan process and to the significant incentives offered (rebates plus interest-free loans).
• Loan underwriting is minimal but the default rate has been consistently low (under three percent over the last 20 years), which may be partially attributable to the short tenor of the loans.

28 www.seeaction.energy.gov May 2014
The program does minimal underwriting, which may include a review of a customer’s payment history for their utility bill.24 These underwriting criteria allow many businesses that may have difficulty qualifying for attractive loans to make targeted EE improvements as the utility has approved all loan applicants to-date. Power disconnection is a possibility, although it has never been used. NG program administrators indicated that they would write off a loan before disconnecting a customer’s power. Thus far, the cumulative default rate is less than three percent. NG is currently working to create a loan loss reserve.
Participating customers have the option of paying the loan back early without penalty and are offered a ~five percent discount off of the total loan balance for doing so in the first month. Approximately 40 percent to 50 percent of loans are paid off up-front, which suggests some participants are only participating in on-bill to access additional incentives.
Tapping Private Capital to Increase Scale
NG uses funds from a public benefits charge to offer the program rebates and to cover any customer financing defaults. NG funds the cost of buying down the zero-interest loans from their energy efficiency budget, which is collected from distribution utility rates. NG re-lends the capital once it is repaid but customer demand for the program has outstripped capital availability.
NG program administrators noted that selling its existing on-bill portfolio of loans would enable it to access sufficient capital to sustain the program’s growing demand. However, a potential sale raises practical challenges for the program. Potential investors want high interest rates (based on preliminary conversations, NG believes 8-10 percent) and rigorous underwriting, while NG staff believes that low interest rates and minimal underwriting are two keys to the popularity of the program (i.e., large financing volume). Bill Codner, NG’s Large Commercial and Industrial program coordinator, estimates that the cost to do credit checks would exceed the current cost of writing off defaults. Although defaults are currently covered with public benefits funds, secondary market lenders have expressed concerns that regulators could change the rules that allow this, leaving the banks to cover defaults. Codner also indicated that banks have asked for parity in partial payment situations (e.g., if 60 percent of a utility bill were paid, 60 percent of the loan repayment would be paid). Currently utility bill delinquency protocols call for utility charges to be covered before any money is allocated to loan payment.
24 Technically, utilities can review bill payment history. Bill Codner, the Large Commercial and Industrial and Energy Efficiency Financing Program Administrator for National Grid, does not believe that many, if any, do so.

May 2014 www.seeaction.energy.gov 29
Table A - 14. National Grid Program Summary
Total loans over program life: 20,000 loans have been provided to small business since 1993 About 400 loans totaling $25 million have been provided to large C&I customers since 2010
Total loans in 2012: Small business: 9,800 loans, $21.6 million Large C&I: approximately 154 loans, approximately $10 million
Default rate In 2012: 1.72 percent. Cumulative: <3 percent
Application Decline Rate Zero percent, all loans approved
Average Project Savings Savings vary considerably given the diverse needs of different businesses
Cumulative Penetration Rate Not available
Market Served Small business, large commercial & industrial
Program Start/End date Small business in MA and RI: 1993-present (NY since 2010) Large commercial and industrial (C&I): 2010-present
Interest Rate & Term 0 percent, up to 2 years for small business and for large C&I
Max/Min Loan Amount Average small business is $2,000-$2,500. Average C&I is 65,000. No maximum, loans are made on a case by case basis
Rebates Available Yes; NG offers rebates up to 70 percent of project costs for small businesses and up to 50 percent of project costs for large C/I customer projects
Disconnection and Meter Attachment
Power disconnection is allowed but has never been used. NG would write the loan off before disconnecting power
Transfers: Allowed? Process? Requirements?
No, loans are tied to the customer, not to the meter
Ownership and tenancy changes involving OBF
Not applicable
Source(s) of Capital National Grid’s Energy Efficiency Program budget and funds from a public benefits charge
Underwriting Requirements Bill history can be taken into account but is not required
Eligible measures MA: High performance T8 lamps and electronic ballasts; retrofit reflector kits; high efficiency fluorescent fixtures; compact fluorescent lamps (CFL); LED exit signs; occupancy sensors; high efficiency spray valves; pipe insulation; walk-in cooler/refrigeration controls and LED lighting upgrades; programmable thermostats; and site-specific customer projects
RI: have prescriptive measures, large C&I can participate with custom projects if it passes a benefit cost ratio (can receive an incentive and CHP is eligible)

30 www.seeaction.energy.gov May 2014
On-Bill Issues and Findings
Disconnection and Meter Attachment
NG has the ability to cut power for non-payment, although they never have taken this action. Defaults can be written off and are covered by public benefits funds. In partial payment situations, the utility is the first to recover money (i.e., the electric distribution utility charge is paid before the loan payment). Initially, the program only tracked accounts if they were written off. Recently NG has begun to track delinquencies because banks want to know when NG is getting paid.
The default rate for the small business program has fluctuated moderately with the overall economy, but has stayed below three percent since the program’s launch. In 2012, the default rate was 1.72 percent. The program gives a discount for loans paid back in the first month and 40-50 percent of loans are paid back this way. In the C&I program there has only been one default over its 3-year history out of approximately 400 loans.
Vacancy, Foreclosure and Transfer
Transfers are not allowed under the program. Loans do not survive foreclosure.
Split Incentives
Tenants may participate contingent on landlord approval. The two-year payback period for the small business program may address the barrier for tenants who plan to stay in the building for at least two years.
Underwriting
National Grid’s programs do not require credit checks. Although utility bill payment history may be used in underwriting, most utilities do not conduct any underwriting. Generally, any business that applies for a loan is approved. NG believes that formal underwriting costs would exceed default costs.
Bill Neutrality
Bill neutrality is not formally required or promoted. However, NG aims to pay enough incentives to achieve a two-year payback on each loan and they generally are able to do so. Because of the variation in size and operations of participant businesses, savings vary greatly between participants.
Billing Systems
Because of acquisitions, NG has five different billing systems among its utilities. Although most of NG’s subsidiaries already had the capacity for adding an extra line item to bills to recoup loan payments, NG had to refine their systems, which was expensive. This was due to two complicating factors: first, the utilities in MA and RI want to extend terms up to seven years for large C&I customers; and second, the NY utilities had to ensure that their systems could communicate with the systems of the New York State Energy Research and Development Authority (NYSERDA), which oversees on-bill lending in NY.
NG has also acquired a utility in southern New York whose billing system currently does not support collecting loan payments on-bill. The expense to upgrade the system was large enough to be a factor in NG’s decision not to offer the program in this service area.25
25 This is also due to NYSERDA’s reluctance to add another loan pool to their existing programs in this geographical area.

May 2014 www.seeaction.energy.gov 31
Lending Regulations
The participating utilities believe that one key to not being regulated as a lender is the fact that they do not perform credit checks or charge interest.
Results and Plans
National Grid has achieved substantial loan volume with their on-bill financing programs, extending over $31.5 million in loans in 2012 alone. Over 20 years, the program’s default rate has remained under three percent. Over the long term, NG believes that the growth in demand for this loan product will necessitate selling its portfolio to the secondary market to make it sustainable. The utility’s long-term goal is to sell a $50 million pool of its loans. NG is working on creating a loan loss reserve and they also plan to expand loans to include gas end-uses. Gas projects will require larger loans and longer terms.
Resources
https://www.nationalgridus.com/masselectric/business/energyeff/3_small.asp

32 www.seeaction.energy.gov May 2014
NYSERDA Green Jobs-Green New York On-Bill Recovery Program
Program Administrator: New York State Energy Research and Development Authority (NYSERDA)
Location: New York
Overview
In 2012, NYSERDA launched a legislatively-authorized On-Bill Recovery Finance (OBRF) Loan as an on-bill complement to its existing off-bill, unsecured Smart Energy Loan (SEL) offering for single-family residential property owners and tenants.26 NYSERDA has issued $11.5 million of loans through the OBRF product and $38.4 million overall for residential energy efficiency improvements ($26.9 million through the SEL product). The OBRF loan pilot includes a bill neutrality requirement, which has limited customer participation. The OBRP pilot allows disconnection in cases of non-payment and has a default rate of 0.5 percent. OBRF and SEL both use two-tiered underwriting protocols, relying on utility bill repayment history to increase loan application approvals by approximately 10 percent relative to standard underwriting.
Table A - 15. NYSERDA On-Bill Recovery Finance Key On-Bill Program Design Features
Disconnection and Meter Attachment On-Bill Tariff
Source of Capital On-Bill Repayment—Warehouse
Underwriting Hybrid (Two-tiered system using credit score, debt-to-income ratio, utility bill payment history, mortgage payment history and other criteria)
Eligible Measures Energy efficiency measures, Non-energy measures
Program Basics
NYSERDA’s residential customers have two options for financing energy efficiency upgrades: 1) the On-Bill Recovery Finance (OBRF) loan, through which participants repay financing on their utility bills, and 2) the Smart Energy Loan (SEL), for which loan payments are made off-bill (see Table A - 16). Both products deliver capital to fund energy efficiency improvements completed through NYSERDA’s Home Performance with ENERGY STAR®
26SEL has been offered since December 2010.
Key Takeaways • NYSERDA uses customer utility bill repayment history as part of its underwriting process to
responsibly increase its loan application approval rate. • NYSERDA’s On-Bill Recovery Finance Loans include the risk of utilities disconnection for non-
payment of financing charges, but program administrators do not yet know whether this feature will improve customer repayment trends.
• The on-bill product’s bill neutrality requirement has limited the number of projects that qualify for financing.

May 2014 www.seeaction.energy.gov 33
program. The revolving loan fund, through which both OBRF and SEL loans are made, was initially funded with New York State’s Regional Greenhouse Gas Initiative (RGGI) monies (Bell 2011).27
OBRF Credit Enhancement Impacts Uncertain
The OBRF enabling legislation in New York specified that the OBRF charges be subordinate to other utility charges in the event of customer partial utility bill payment. However, the utilities are still contractually obligated to treat OBRF charge underpayment in the same manner as they would treat underpayment of other utility charges, which may ultimately result in disconnection of a customer’s power. While the threat of disconnection may enhance customer financing repayment trends, Jeff Pitkin (NYSERDA Treasurer) indicated that it is still too early to know whether shut-off rights will have a significant impact on default rates.
With a limited amount of history, NYSERDA is actually seeing slightly higher delinquency and default levels on its OBRF loans compared to loans made under the SEL program. Program administrators indicated that these higher delinquency and default levels are being caused primarily by two factors:
• Deferred Payment Arrangements. The OBRF program permits customers who have entered into deferred payment arrangements with the utility (to avoid shutoff) to access OBRF. Since the OBRF charge is subordinated to utility service charges, all utility bill payments from these customers are being applied to satisfy utility arrearages. NYSERDA’s policy is to charge off loans once they are more than 120 days past due, so this is resulting in increased loan charge-offs.
• Timing Issues. A range of timing issues related to disjoints between when financing payments are due and when consumers receive and are required to pay utility bills.28
The average age of the OBRF portfolio is still relatively young in comparison to the SEL portfolio. Thus, additional time and history will be needed before more meaningful conclusions can be drawn on the portfolio’s performance.
Table A - 16. Comparison of Key OBRF and SEL Features
Financial Product Feature OBRF SEL
2012 Loans (Total Number/Total $/Average $ Loan Size)
473 / $4.9 million / $10,500 1,143 / $11.0 million / $9,600
Repayment Mechanism Utility Bill Repaid to NYSERDA’s loan servicer through non-utility statement billing or automated payment
Maximum Loan Amount $13,000 (up to $25,000 if simple payback period is less than 15 years)
$13,000 (up to $25,000 if simple payback period is less than 15 years)
Interest Rate 3.49 percent (2.99 percent for loan applications prior to January 2013)
3.99 percent (3.49 percent if customers sign up to make payments via automatic bank withdrawals)
27NYSERDA recently completed a $24.3 million AAA-rated bond issuance, structured with a guarantee from the New York State Environmental Facilities Corporation Clean Water State Revolving Fund program. The bond is secured by repayments from a portion of the loan pool, and structured with federal Qualified Energy Conservation Bond interest subsidies to achieve a net bond interest cost of less than one-half percent. NYSERDA will use the sale proceeds to replenish the revolving loan fund and make additional loans. https://www.nyserda.ny.gov/About/Newsroom/2013-Announcements/2013-08-13-Residential-Energy-Efficiency-Financing-Bonds-through-GJGNY.aspx. 28 These disjoints arise from several factors, including uncertainty as to when approved financing charges will be initially placed on a consumer’s bill due to processing time, timing of billing cycles relative to monthly remittance processes, potential for utility consumer billing cycle timing to change (which can give rise to a short billing cycle with no installment billing but would be reported as a missed payment) and issues associated with bi-monthly billing.

34 www.seeaction.energy.gov May 2014
Financial Product Feature OBRF SEL
Term 5, 10 or 15 years at borrower’s option provided that term does not exceed useful life of measures and that the loan payments meet cost bill neutrality/cost effectiveness screening requirements
Underwriting Two-tiered (see The Tier 2 underwriting has increased financing approvals by 10 percent. Default trends on loans originated using Tier 2 underwriting standards are in-line with Tier 1 loans (0.59 percent and 0.5 percent respectively as a percentage of loans issued). However, NYSERDA plans to hold the Tier 2 loans until a sufficient performance track record (likely at least three years) has been established before attempting to sell them to investors; only Tier 1 loans were sold in the agency’s initial secondary market sale.
Table A - 17 below for more details)
Two-tiered (see The Tier 2 underwriting has increased financing approvals by 10 percent. Default trends on loans originated using Tier 2 underwriting standards are in-line with Tier 1 loans (0.59 percent and 0.5 percent respectively as a percentage of loans issued). However, NYSERDA plans to hold the Tier 2 loans until a sufficient performance track record (likely at least three years) has been established before attempting to sell them to investors; only Tier 1 loans were sold in the agency’s initial secondary market sale.
Table A - 17 below for more details)
Disconnection and Meter Attachment
Utility Service Disconnection (subject to standard utility bill non-payment processes & protections)
Unsecured
Bill Neutrality Required? Yes; Annual savings must exceed annual loan payments during the loan term. The customer’s average bill should remain the same as before the addition of the loan (i.e. bill neutral)29
No; The cost effectiveness screening rule requires lifetime savings exceed total loan principal plus interest, although this does not mean that a customer’s bill will be the same as or less than before the addition of the loan during the loan term (i.e., bill neutral)
OBRF may offer additional security enhancement relative to SEL through its tariff structure. Technically, OBRF is debt of the participating property’s electric (or gas) meter rather than the participating customer or property. This tariff structure may lead to the financing charge surviving a customer bankruptcy or property foreclosure and be repaid by a subsequent property owner.30 While New York law states that the tariff structure survives property transfer (which could be interpreted to include transfer through bankruptcy), outside counsel advised NYSERDA that bankruptcy courts have traditionally taken a narrow view of what constitutes borrower dischargeable
29OBRF enabling legislation specified that a project’s expected annual energy savings (from all fuel sources) must exceed annual OBRF interest and principal payments (i.e., the financed project must be “bill neutral”). For customers with different electric and gas providers, payment installments are placed on the electric bill unless the majority of energy savings are natural gas in which case loan payments are charged on the natural gas bill. 30A loan would typically be left to recover any remaining value once senior lenders have recovered their investments in a foreclosure or bankruptcy proceeding.

May 2014 www.seeaction.energy.gov 35
indebtedness during legal proceedings and the court could discharge any OBRF arrears or could discharge the entire unpaid OBRF obligation. As such, uncertainty remains about the ultimate credit enhancement that the tariff structure will provide to lenders and investors. Two OBRF participants are in the early stages of bankruptcy, so some of this uncertainty may be resolved in coming months.
OBRF Transferability May Be Attractive to Customers
If an OBRF participant sells their property, the OBRF debt may transfer with the property (as it is attached to the property’s meter) (Bell 2011).31 This transferability feature may be attractive to consumers that anticipate selling a property before they realize the full benefits of their efficiency improvements. Because the subsequent owner would benefit from the installed EE improvements, they may be willing to assume the OBRF obligation as part of a property transfer.32
To ensure that prospective homebuyers are aware that an OBRF obligation is attached to a property’s utility meter, New York legislation requires the filing of a Program Declaration (PD), which is a non-lien notification that is recorded in the county clerk’s office where the participating property is located.33 The PD is included in the disclosures that all homebuyers receive as part of the home sales process. Pitkin noted that while the PD provides a high level of confidence that homebuyers will be aware that a tariff has been placed on a property’s meter, this protection has a significant administrative cost. NYSERDA uses a title company to perform a property ownership search (to confirm that the borrower owns the property) and to sign the PD (this requires an in-person visit to the county/city recording office); the fee for this is funded from the interest charged on the loan.34 To date, three OBRF participants have transferred loans to new occupants.
Bill Neutrality Requirement Limits OBRF Participation
OBRF enabling legislation specified that a project’s expected annual energy savings (from all fuel sources) must exceed annual OBRF interest and principal payments (i.e., the financed project must be “bill neutral”).35 About 55 percent of program applicants request a loan that can be paid back on-bill. However, only 50 percent of completed projects are financed using the on-bill product because some projects fail to meet OBRFs stricter annual bill neutrality threshold. Applicants that are declined for the on-bill product may opt for off-bill Smart Energy Loans. Of applicants pre-approved for OBRF based on creditworthiness, 14 percent participate in SEL instead, almost always because the project does not meet OBRF’s bill neutrality criteria.
Contractors and customers have noted that the strict OBRF bill neutrality requirement limits their ability to leverage the program for all the improvements they want to make.36 Nonetheless, the higher on-bill application rate, and NYSERDA discussions with contractors, suggests that customers value the ability to repay financing on-bill and it makes the contractor sales process easier.
Alternative Underwriting Criteria Expand Customer Access to Capital
Both OBRF and SEL rely on a two-tiered underwriting process designed to responsibly expand customer access to capital (Bell 2011). Tier 1 underwriting relies on “traditional underwriting” metrics to qualify applicants for
31Smart Energy Loans are not eligible for transfer. 32In practice, the value of transferability in driving customer adoption of EE (or investment in deeper EE improvements with longer paybacks) remains uncertain. If subsequent property owners value the improvements, it would be reasonable to assume that this value would be reflected in a property’s sale price and reduce the need for, and value of, transferability. That is, if consumers expect that investing in EE will increase their property value, realizing the full lifetime savings of installed EE improvements may be less important to them. 33OBRF loans were originally secured by a mortgage that was subordinate to current or future mortgages but a program change was made after utilities expressed concern that this feature might expose them to violation of Federal SAFE Act, which requires mortgage loan originators to be registered with the Nationwide Mortgaging and Licensing System and Registry. The Program Declaration resolved these concerns. 34 Counties also charge varying fees that NYSERDA pays and is funded from the interest charge on the loan. 35 The calculation of energy savings allows inclusion of an escalation factor, currently set at 0.8% per year (based on EIA estimates). 36 Despite the challenges of “bill neutrality” requirements, OBRF loans have supported slightly larger projects than SEL loans to date ($10,500 OBRF versus $9,200 SEL).

36 www.seeaction.energy.gov May 2014
financing. Those customers that do not qualify for financing using Tier 1 standards may still qualify through alternative Tier 2 criteria that rely heavily on a customer’s utility and mortgage bill repayment history (see The Tier 2 underwriting has increased financing approvals by 10 percent. Default trends on loans originated using Tier 2 underwriting standards are in-line with Tier 1 loans (0.59 percent and 0.5 percent respectively as a percentage of loans issued). However, NYSERDA plans to hold the Tier 2 loans until a sufficient performance track record (likely at least three years) has been established before attempting to sell them to investors; only Tier 1 loans were sold in the agency’s initial secondary market sale.
Table A - 17 for a comparison of Tier 1 & Tier 2 underwriting criteria).
The Tier 2 underwriting has increased financing approvals by 10 percent. Default trends on loans originated using Tier 2 underwriting standards are in-line with Tier 1 loans (0.59 percent and 0.5 percent respectively as a percentage of loans issued). However, NYSERDA plans to hold the Tier 2 loans until a sufficient performance track record (likely at least three years) has been established before attempting to sell them to investors; only Tier 1 loans were sold in the agency’s initial secondary market sale.
Table A - 17. Summary of NYSERDA’s Two-Tiered Underwriting Criteria
Underwriting Metric Tier 1 Tier 2
Minimum Credit Score 640 Not considered
Maximum Debt-to-Income (DTI) Ratio
Less than 50 percent Up to 55 percent (up to 70 percent if FICO is above 680; up to 100% for applicants who qualify for Assisted Home Performance with ENERGY STAR)
Utility Bill Repayment History
Not considered Current for two consecutive months during each of the last two years. No payments over 60 days late in last two years37
Mortgage Repayment History
Not considered Current on payments over last 12 months. No payments over 60 days late in last two years
Allowable Outstanding Collections, Judgments or Tax Liens
Up to $2,500 Up to $2,500
Bankruptcy & Other Restrictions
No bankruptcy, repossession or foreclosure in last 7 years
No bankruptcy, repossession or foreclosure in last 7 years
On-Bill Issues and Findings
Disconnection and Meter Attachment
Utilities may disconnect power, subject to existing protections and protocols, in the case of non-payment. Loan payments are subordinated to the utility charge, but utilities are required to treat customer partial payment of the loan in the same manner as they would partial payment of any other utility bill charge.
37 This utility bill underwriting criteria is designed to accommodate a common practice in cold climates—many NYSERDA customers “smooth” their annual utility bill repayment—they make all necessary payments on an annual basis, but tend to overpay in spring and fall months, when bills are lowest, and underpay in winter months, when bills are highest.

May 2014 www.seeaction.energy.gov 37
Vacancy, Foreclosure and Transfer
Transfers are allowed under the program. Although technically the tariff should survive foreclosure, it is the court’s decision and it is uncertain whether or not they would absolve a debtor of the obligation. Bankruptcy is the only situation in which loan charges are suspended. There is uncertainty about whether transferability will be viewed favorably by investors, due to the potential for them to assume the credit risk of a borrower, for whom the loan was not underwritten, without certainty that the tariff structure will survive events of foreclosure or bankruptcy.
Table A - 18. On-Bill Recovery Finance Program Summary
Total loans over program life: OBRF: 1,096 loans for $11.5 million
Total loans in 2012: 473 loans for $4.9 million
Default rate Seven loans totaling $58,370 (0.5 percent of loan principal issued) have been charged off as the loans were more than 120 days past due. Most of these loans are still being collected by the utility through a deferred payment arrangement with the customer, but due to the subordination of the OBRF charges, collection will be delayed until after the utility arrearages are satisfied. Pitkin believes the overall default rate will end up around 6 percent based on the experiences of Fannie Mae and Keystone HELP.
Application Decline Rate 31 percent
Average Project Savings $677 per year (2012)
Cumulative Penetration Rate <0.01 percent (Originally limited to 0.5 percent of customer base but NYSERDA was directed to petition to increase this (Bell 2011))
Market Served Owners of 1-4-unit residential buildings; commercial borrowers; Program administrators are still considering whether or not to offer a multi-family product
Program Start/End date February 2012-present
Interest Rate & Term 3.49 percent (2.99 percent prior to Jan 2013) for 5, 10 or 15 years (not to exceed useful life of improvements)
Max/Min Loan Amount Min: $3,000 (or $1,500 if income eligible) Max: $13,000 (or $25,000 if simple payback is <15 years)
Rebates Available 10 percent cash back incentive on eligible measures; 50 percent for income-eligible households through Assisted Subsidy (may not be combined with other incentives)
Disconnection and Meter Attachment
Disconnection is allowed in cases of non-payment
Transfers: Allowed? Process? Requirements?
Transfers are allowed. If a balance remains on the loan at time of sale, the seller must provide notice to the purchaser. The seller pays until the date of the transfer and is responsible for any arrears.
Ownership and tenancy changes involving OBF transfers
3 loans have been transferred to a successor utility account customer
Source(s) of Capital NY’s share of proceeds from the Regional Greenhouse Gas Initiative (RGGI), issuance of Qualified Energy Conservation Bonds (QECBs)
Underwriting Requirements See The Tier 2 underwriting has increased financing approvals by 10 percent. Default trends on loans originated using Tier 2 underwriting standards are in-line with Tier 1 loans (0.59 percent and 0.5 percent respectively as a percentage of

38 www.seeaction.energy.gov May 2014
Total loans over program life: OBRF: 1,096 loans for $11.5 million loans issued). However, NYSERDA plans to hold the Tier 2 loans until a sufficient performance track record (likely at least three years) has been established before attempting to sell them to investors; only Tier 1 loans were sold in the agency’s initial secondary market sale. Table A - 17 above
Eligible measures Primary heating and cooling systems, building shell, water heater, appliances and lighting, conservation measures. (Ancillary health and safety measures allowed up to 15 percent of the project cost, not to exceed $2,000)
Split Incentives
Tenants in non-residential buildings may participate with the owner’s consent. In residential housing, the NY legislation requires that a borrower own the improved property and is named on the utility account.
Underwriting
NYSERDA uses a two-tier, hybrid underwriting system. The second tier, which is more flexible and considers utility bill and mortgage repayment history, has increased application approvals by 10 percent.
Bill Neutrality
The enabling legislation mandates monthly payments not exceed 1/12th of the upgrade’s estimated average annual energy cost savings over the loan term (Bell 2011). While the majority of applicants request the on-bill OBRF loans over the off-bill Smart Energy Loans, ultimately, the on-bill neutrality requirement limits the number of projects that qualify, and applicants switch to the off-bill SELs.
Billing Systems
Initially, utilities were concerned about the potential costs of billing system upgrades. NYSERDA set aside $500,000 to help utilities with billing system costs and gave an additional $400,000 to its initial pilot partner, National Grid (Bell 2011). Long Island Power Authority spent $800,000 on system upgrades, but previous billing systems modifications initiated by utilities in order to accommodate third party ESCO contract payments helped to minimize overall system upgrade costs. The systems were ready within five months of Governor Cuomo signing the on-bill enabling legislation.
Lending Regulations
NYSERDA has dealt with lending regulations primarily through billing services agreements with the utilities. The utilities’ role is to collect payment, not to provide credit. Thus, on-bill activities do not fall under state and federal lending legislation.
Results and Future Plans
As of October 2013, NYSERDA has extended over 1,000 OBRF loans for over $11.5 million. Overall, NYSERDA has issued over 4,000 loans for $38.4 million while maintaining a total annualized default rate of less than 0.5 percent through the OBRF and SEL initiatives.
Resources
http://www.nyserda.ny.gov/Statewide-Initiatives/On-Bill-Recovery-Financing-Program.aspx

May 2014 www.seeaction.energy.gov 39
Central Electric Power Cooperative Help My House On-Bill Pilot Program
Program administrators: Central Electric Power Cooperative and the Electric Cooperatives of South Carolina
Location: South Carolina
Overview
Between 2011 and 2012, South Carolina’s Central Electric Power Cooperative (Central) and the Electric Cooperatives of South Carolina (ECSC) ran the Help My House on-bill financing pilot.38 The pilot delivered $968,000 in low-interest loans to 125 co-op members with high energy bills39 and used in-home preliminary energy assessments to increase confidence that participating customers would see their utility bills go down. There were no defaults over the course of the pilot. Participating co-ops approved homes based on their potential for energy savings, tied loans to the meter rather than individuals (Bell 2011), allowed power disconnection in cases of non-payment and underwrote the loans by reviewing utility bill payment history to broaden customer access to the pilot in a region where customer incomes are significantly below the national average. The Help My House pilot earned high customer satisfaction marks and has led to several new on-bill efforts. Scaling the program will require overcoming challenges such as upgrading billing systems, updating legislation regarding consumer lending laws and accessing additional low-cost capital.40
Table A - 19. Help My House Pilot Key On-Bill Program Design Features
Disconnection and Meter Attachment On-bill tariff
Source of Capital On-bill financing (utility capital and public monies)
Underwriting Alternative (utility bill payment history)
Eligible Measures Energy efficiency measures
Program Basics
There is significant need for efficiency upgrades in South Carolina. More than a quarter of homes in the co-ops’ service areas are manufactured (mobile) housing, which tend to use more electricity per square foot than site-built homes (Bell 2011). The Help My House (HMH) pilot was designed to test whether an on-bill financing (OBF) initiative could achieve significant energy efficiency (EE) savings at full-scale. Administrator goals include offsetting
38 A rural electric cooperative (co-op) is an independent, not-for-profit provider of electricity that is owned by the customers (members) it serves. 39 Those buying electricity from cooperatives are members since they are part owners of the cooperative. The word member is used in place of customer. 40 Additional challenges include the state’s current surplus generation and recovery of co-ops’ fixed costs since large-scale energy efficiency would reduce sales.
Key Takeaways • Relying on utility bill payment history for underwriting can broaden customer access to
financing. • Targeting customers with higher-than-average energy consumption can yield significant energy
savings, and positively impact customer satisfaction. • Successful pilots can give utilities the confidence to launch full-scale programs.

40 www.seeaction.energy.gov May 2014
the need to build new power plants, reducing the co-ops’ collective carbon footprint and impacting communities where many families lack the cash available to cover upfront costs for comprehensive efficiency improvements.41
The Help My House program offered 2.5 percent loans for EE measures including air sealing, duct leakage reduction, attic insulation, converting electric furnaces to heat pumps or replacing heat pumps. The pilot had no maximum loan amount as long as the loan met the bill neutrality requirement. The program tied loans to electric meters and used disconnection as a possible recourse for nonpayment. Central used a $740 thousand, zero-percent interest loan from the U.S. Department of Agriculture loan along with $223 thousand of its own capital to provide capital to member co-ops in South Carolina for offering loans to their customers/members that could be paid off on their utility bills.42
The pilot included multiple features that administrators believe made the pilot successful:
• Rural electric cooperatives were encouraged to rely on customer utility bill repayment history rather than credit scores (none examined credit scores). Utilities did not reject a single customer for financial reasons despite the prevalence of low income, low credit score customers in the co-ops’ service territories.43
• Eligibility was based on bill neutrality, to ensure the member’s total utility bill, including loan payments, goes down. Thus, households did not need to come up with additional cash to participate.
• Marketing was focused on high-consuming members and those who complained about expensive electric bills and stood to gain the most from the program.
• Low interest rates and long terms reduce monthly financing charges, making it easier for projects to achieve bill neutrality.
41 Comprehensive efficiency improvements for a home address multiple end uses from improving envelope integrity (e.g., air sealing, insulation) to installing high-efficiency equipment (e.g., replacing an electric furnace with a heat pump). 42 KW Savings Co., a nonprofit group formed to administer the program, extended the loans to customers on behalf of participating rural electric coops (Bell 2011). 43 Some projects were declined for other reasons; see the Application Decline Rate row of the Program Overview table.

May 2014 www.seeaction.energy.gov 41
Table A - 20. Help My House Pilot Program Summary
During the pilot, participants saw an average net bill savings of $288 per year (including the on-bill payments) and 96 percent reported being satisfied with the program. HMH experienced no defaults. The average participating household consumed 34 percent less energy than the previous year after completing the program.44 On average, actual savings realized were 93 percent of estimated savings (Keegan 2013).
44 Only customers with high energy use were targeted with the pilot, many of whom lived in manufactured housing. The average annual electricity use in the participating homes was 31,000 kWh, almost double the average 17,000 kWh annual electricity use across the broader customer base.
Total loans (2011-2012) $968 thousand, 125 loans; Average loan size = $7.7 thousand
Default rate 0 percent after one year
Application Decline Rate No applicants were rejected based on bill payment history. However, of the initial 215 applicants, reasons for non-participation were: audit revealed insufficient savings opportunity (14), unresolved Health & Safety issues (36), owner’s decision (30), and other (10)
Average Project Savings 10,809 kWh/year, $1157/year (gross), $288/year (net of payments) (Keegan 2013)
Cumulative Penetration Rate <0.01 percent
Market Served Residential homeowners or tenants
Program Start / End date 2011-2012 (one year)
Interest Rate & Term 2.5 percent, up to 10 years
Max/Min Loan Amount Minimum: $1,000; No maximum (largest loan was over $15,000)
Disconnection and Meter Attachment
Disconnection and UCC-1 filing (optional - see Disconnection and Meter Attachment section below)
Transfers: Allowed? Process? Requirements?
Transferability allowed; Must file a Notice of Meter Conservation Charge as disclosure
Property and tenancy transfers involving OBF
No transfers to date
Source(s) of Capital $740,000 loan from USDA at 0 percent interest (Bell 2011). Central Electric Power Cooperative provided $223,000. Together the USDA and Central money served as capital for the loans
Underwriting Requirements Up to the discretion of the participating co-ops. Most used only bill payment history
Eligible measures Measures had to pass cost-effectiveness screening. 99 percent of projects included air sealing, 98 percent employed duct leakage reduction, 91 percent involved attic insulation, 47 percent converted electric furnaces to heat pumps, 41 percent replaced heat pumps, 31 percent installed floor insulation, 3 percent tuned up HVAC equipment, and 3 percent made other miscellaneous upgrades

42 www.seeaction.energy.gov May 2014
On-Bill Issues and Findings
Disconnection and Meter Attachment
Program administrators felt that because loans were tied to electricity meters and disconnection was allowed in cases of non-payment, the main threat to performance was vacancy. Even in the event of a foreclosure, loan repayment could resume once a new occupant began utility service. During periods of vacancy, the program forgave the financing costs of suspending the payments and readjusted the schedule for paying of the remaining principal (Bell 2011). Two participating co-ops decided to use UCC-1 filings as an additional form of security for projects that included equipment. Transfers were allowed as long as disclosure was provided.
When loans were originated, participants were required to file a Notice of Meter Conservation Charge (NMCC) with the appropriate county office where the property was listed. The NMCC is included in the property’s closing package when a home is sold with a NMCC on it.
Transfers
No transfers occurred during the course of the pilot, although HMH did experience one bankruptcy and the destruction of one participant house due to fire (unrelated to the retrofit measures).45 All participants are required to have insurance to cover potential losses. In the case of the fire, insurance paid off the loan.
Bill Neutrality
The Pilot Program Team made it a priority to ensure that participant savings exceeded loan payments. The team set the interest rate low enough and loan term long enough to make it easy to meet loan payments with the savings from efficiency improvements. A pre-audit had to show that any measures undertaken would achieve savings that could cover both principal and interest payments. The program marketed to high-consuming members and to those who had complained of expensive bills (Bell 2011). Finally, HMH focused on cost-effective measures (e.g., air duct sealing and attic insulation) with shorter payback periods than the loan term. This strategy appears to have worked. Before their retrofits, participants’ electricity usage was nearly twice as high as the average for co-op members.
Billing Systems
Though eight co-ops offered on-bill tariff loans, none upgraded its billing systems. Co-ops declined to upgrade due to cost (i.e., approximately $30,000, which was relatively expensive for these co-ops), time constraints (the upgrades would not have been ready in time for the pilot program), and low pilot volume (the goal for the pilot was 100 participants). Consequently, loan information was entered manually. Staff volunteered their time to manage this manual billing.
Lending Regulations
In March 2010, state legislation passed that released co-ops running prescribed on-bill financing programs from many state consumer lending law requirements. The statute also authorized co-ops to disconnect service in cases of loan nonpayment. The legislation only covers loans that are a maximum of four percent above the stated yield
45 In the case of the bankruptcy, the primary mortgage holder has sued all other lien holders claiming primacy in collections. Once all is settled and the home sells to another buyer, the co-op will have the option to resume collecting payments on the loan. Given that the loan was made under a pilot program, the co-op and Central may just write it off, although that is still in deliberation.

May 2014 www.seeaction.energy.gov 43
for one-year treasury bills.46 Central and ECSC stated that the interest rate required on loans for a full-scale program would push up against this limit.
Results and Future Plans
The HMH pilot has led to a number of on-bill programs administered by individual distributor co-ops. Four of the participating co-ops, Black River Electric, Aiken Electric, Santee Electric and York Electric, have begun programs using their own funds. Aiken Electric has already issued 117 loans and Santee Electric has applied for a $1 million loan from the USDA to expand its initiative. Black River Electric is running its own loan program and is charging five percent interest on loans, which is beyond the statutory limit; thus, it cannot tie loans to electricity meters or disconnect service for nonpayment. Lynches River Electric, a rural coop that did not participate in the HMH pilot, is also taking steps to institute its own OBF program.
The South Carolina co-ops’ interest in on-bill financing helped lead to federal legislation introduced by Rep. James Clyburn (D-SC) and Sen. Jeff Merkley (D-OR) to create a national-scale USDA on-bill financing program for rural electric cooperatives. The legislation helped to catalyze USDA’s recently passed Energy Efficiency and Conservation Loan Program (EECLP) and led to the Rural Energy Savings Program (RESP), passed into law as part of the Farm Bill in February 2014.47 In 2014, the EECLP will make $250 million available to rural electric utilities for DSM programs, including on-bill financing programs. RESP will provide up to $75 million annually (from FY 2014 to FY 2018) in zero percent interest loans to rural electric cooperatives and municipal utilities to provide on-bill financing for energy efficiency upgrades. RESP is still unfunded and it is uncertain if and how EECLP and RESP will be coordinated.
Resources
http://www.helpmyhouse.org/
46 http://www.scstatehouse.gov/sess118_2009-2010/bills/1096.htm 47https://www.federalregister.gov/articles/2013/12/05/2013-29158/energy-efficiency-and-conservation-loan-program#h-81; Sec.2. Rural Energy Savings Program. https://agriculture.house.gov/sites/republicans.agriculture.house.gov/files/inside/Legislation/111/HR4785.pdf.

44 www.seeaction.energy.gov May 2014
Tennessee Valley Authority Energy Right Solutions Heat Pump and In-Home Energy
Evaluation On-Bill Program
Program administrator: Tennessee Valley Authority (TVA)
Location: Alabama, Georgia, Kentucky, Mississippi, North Carolina, Tennessee and Virginia
Overview
Tennessee Valley Authority (TVA), a federally-owned energy wholesaler, has offered the Energy Right Solutions on-bill repayment program, for over thirty years, to local power distributors (i.e., municipal and cooperative power distributors) for residential heat pump loans. In 2009, TVA added the In-Home Energy Evaluation (IHEE), which extends on-bill repayment to home weatherization improvements and energy assessments. Since 1997, these initiatives have financed over $500 million in residential energy improvements, with a default rate of approximately three percent.48 TVA’s programs are the longest running on-bill initiatives and have the largest annual loan volume of any program in this study. TVA believes the program has successfully transformed the market for heat pumps in the region, noting the large number of heat pump contractors and the fact that some customers are on their second or third heat pumps.
In partnership with a regional bank, TVA facilitates approximately $40 million in loans each year, primarily through the Energy Right Solutions Heat Pump Program.49 The regional bank delivers low-cost capital to program participants in exchange for a TVA guarantee that protects the bank from exposure to participant defaults.
Table A - 21. Energy Right Solutions Key On-Bill Program Design Features
Disconnection and Meter Attachment
On-bill loan with disconnection (also line item billing depending on the distribution company)
Source of Capital On-bill repayment (warehouse)
Underwriting Expanded (below standard FICO score. Distribution companies screen for bill payment history and whether an applicant has been a stable customer)
Eligible Measures Energy efficiency measures
48 Until 1997, TVA used its own capital to finance the heat pump loans. That year it sold its loan portfolio and switched to a third-party lender model for the program. The default rate includes both principal and interest of losses due to delinquent loans. 49 Based on calendar year 2012 activity.
Key Takeaways • Since 1997, TVA has facilitated over $500 million in residential loans that can be paid off on
customers’ utility bills through participating local power distributors, with a default rate of approximately three percent.
• A regional bank provides low-cost capital to fund the loans, and TVA provides a guarantee that protects the bank and local power distributors from losses in the event of participant defaults.
• The program drives participation through an extensive network of contractors and single measure eligibility (primarily heat pumps).

May 2014 www.seeaction.energy.gov 45
Program Basics
TVA sells power to 155 retail distributors; of which 131 currently participate in the Energy Right Solutions on-bill program. Distributors offer rebates and loans (that can be paid off on-bill) to their residential customers for eligible improvements. Approximately 95 percent of participants use the program to fund heat pumps and the remaining five percent to fund weatherization measures.50
Loans that can be paid on a customer’s utility bill are currently offered to consumers at six or eight percent interest (eight percent is for less efficient equipment). Over 85 percent of participants elect to install more efficient equipment (which means they get the lower interest rate) over a maximum term of 10 years and up to $20,000.51 TVA notes that market interest rates for similar loans in the region range between 12 to 18 percent, and that the program’s lower monthly interest payments are a particularly attractive feature for customers and contractors.
The regional bank provides the capital for the loans through direct deposit into contractors’ accounts (based on an assignment of the funds to contractors by participants). Contractually, TVA funds the loans up-front and then sells the rights to the receivables (e.g., borrower principal and interest payments) to the regional bank. The bank purchases these receivables at a discounted net present value (NPV) of the expected cash flow assuming a 60-month loan lifetime.52
A loan guarantee from TVA is the key to the bank providing low-cost capital. In the event of loan defaults, TVA re-purchases the receivables from the bank. There is no limit to the size of the TVA guarantee or the amount of loan funding available. All eligible consumer demand is funded each month. Any proceeds from the sale of the receivables is retained by TVA, which are sufficient to pay for program administration costs, cover any loan defaults and earn a small return.
Underwriting Criteria, Disconnection and Default Rate
The on-bill program uses more relaxed underwriting criteria than conventional loan products in order to enable more consumers to qualify for financing; approximately 75 percent of applicants are approved for financing.53 The program accepts applicants with credit scores as low as 625 and does not check debt-to-income (DTI) ratios or employment history.54 Utilities do check applicants’ payment history on utility bills. While the program permits credit scores as low as 625, the average participant credit score is 711.55 In 2011, the typical delinquency rate on unsecured loans for consumers with this credit score was 5 percent. The on-bill program’s three percent default rate suggests that there may be a credit enhancement from repaying loans on-bill. TVA attributes this enhanced loan performance to two key factors:
1. The threat of service disconnection for non-payment of the loan, which provides a powerful incentive for participants (although disconnection is up to the discretion of each distributor);
2. The fact that participating local power distributors take “ownership” of the financing program. These distributors see the program as a way to provide added value to their customers. Although these distributors do not bear the risk of defaults, they recognize that they would be likely to pay for these defaults, in the form of higher prices on their electricity purchases, from TVA in the long run. This perspective is manifested in the fact that several utilities have voluntarily subordinated energy payments to loan payments in the event that consumers make partial utility bill payments.
50 The Heat Pump program offers rebates and on-bill repayment for one or more heat pumps of 13 SEER efficiency or better. The IHEE program offers rebates and on-bill repayment for a range of home weatherization measures and EnergyStar qualifying heat pumps. Weatherization only loans are capped at three years. 51 Heat pump loans are based on the 5-year U.S. Treasury rate. IHEE loans are based on the 3-year U.S. Treasury rate. 52 In practice, the bank funds the loans and a monthly “true up” transaction is completed with TVA whereby the loans are transferred to TVA and the bank purchases the NPV of the receivables 53 Based on calendar year 2012 applicants 54 The majority of U.S. households have credit scores >625 (In 2011—73 percent of households had credit scores above 650) (Brown 2013). 55 Often programs that allow low credit scores still see applicant pools with higher credit scores.

46 www.seeaction.energy.gov May 2014
On-Bill Issues and Findings
Disconnection and Meter Attachment
Using disconnection is up to the local power distributor, there is no TVA program guideline to do so. Additionally, a UCC-1 is filed for equipment that is financed (heat pumps and HVAC equipment).
TVA does not specify partial payment protocols, allowing participating distributors the flexibility to determine their own protocols. Many of the largest distributors apply partial payments to loans and other outstanding obligations first, which contributes to the program’s low default rate, according to TVA program administrators.
Table A - 22. Energy Right Solutions Program Summary
Total loans over program life: Over $500 million since 1997 portfolio sale
Total loans in 2012: 6,173 loans for $44.5 million (HP and IHEE—the product volumes are not tracked separately)
Default rate Around 3 percent of loan volume
Application Decline Rate 2012 25 percent. A provision in the guidelines allows utilities to override bank declines, which happens ~2 percent of the time
Average Project Savings HP: approximately 2,000 kWh per unit IHEE: approximately 1,300 kWh per project (this counts projects that include heat pumps)
Cumulative Penetration Rate 2.03 percent
Market Served Residential
Program Start/End date Heat Pump (HP): 1979—present In-Home Energy Evaluation (IHEE): 2009—present
Interest Rate & Term HP and IHEE: currently 6 percent to 8 percent Term: HP—10-years; IHEE– 3-years if no HVAC equipment
Max/Min Loan Amount HP: no min, $12,500 max IHEE: min $1,500, max $20,000 (can include up to $12,500 for a heat pump)
Rebates Available HP: TVA pays a $175 rebate to distributors who keep a portion and distribute the rest to the contractor or the customer IHEE: Up to $500 paid to customer
Disconnection and Meter Attachment
HP: File UCC-1 with fixture filing, disconnection depending on distributor IHEE: File UCC-1 with fixture filing if HVAC equipment,
Transfers: Allowed? Process? Requirements?
Transfers take place occasionally. New owner must agree to assume loan and must meet standard underwriting criteria

May 2014 www.seeaction.energy.gov 47
Total loans over program life: Over $500 million since 1997 portfolio sale
Property and tenancy transfers involving OBF
Not tracked
Source(s) of Capital A regional bank provides loan capital for the program
Underwriting Requirements Bank partner does the underwriting. FICO >625—no income or employment history necessary. Utilities also screen for bill payment history and behavior as a customer (e.g., ensure applicant hasn’t opened and closed accounts multiple times)
Eligible measures HP: EnergyStar heat pumps (>13 SEER) IHEE: Storm windows, duct repair/replacement and sealing, minor rehabilitation work, heat pumps (including dual fuel models), attic insulation/ventilation, floor or perimeter insulation and vapor barrier, kneewall insulation (in attic), electric water heater insulation and pipe insulation, air sealing, central AC/heat pump tune-up
Vacancy, Foreclosure and Transfer
Most loans are cleared at the time a borrower sells or moves. When a customer with a loan disconnects service, the entire loan balance becomes due. Transfers are made on a case-to-case basis. Occasionally a new owner will assume an outstanding loan. Some utilities have transferred loans to the borrower’s new address to facilitate collection.
When a loan is involved in a bankruptcy, usually the local utility will receive a settlement as part of asset liquidation. If a loan is in default, depending on how the court rules, utilities will sometimes retrieve the heat pumps. Typically the courts allow utilities to do this, although many utilities prefer not to retrieve units due to the time/effort to disconnect/store/market and sell the units.
Split Incentives
Participants must own the dwelling where the heat pump in installed. Renters may participate if the owner is a co-party to the loan.
Underwriting
The bank conducts underwriting for the programs. TVA requires a credit score of 625 or greater and applicants must have a satisfactory utility bill payment history at the time of application. No income or employment history is necessary. The program allows utilities to override denials that the bank has made based on credit score; this happens in about two percent of applications. The proportion of overridden declines is going down. Because TVA guarantees these loans, the declines do not affect the risk that the bank takes.
Bill Neutrality
Bill neutrality is not a requirement of the program. By setting the term at 10 years for heat pumps, TVA attempts to bring most loans closer to bill neutral.
Billing Systems
TVA’s retail distributors have systems with the capacity to collect loan payments through utility bills.
Lending Regulations
Both programs operate in all seven states in which TVA has member distribution utilities. Because state lending regulations vary, TVA distributes forms and guidelines that utilities need to follow in order to comply with lending

48 www.seeaction.energy.gov May 2014
regulations (such as Fair Credit Equal Opportunity Act, Federal Fair Credit Reporting Act, and Fair Debt Collection Practices Act). For example, they suggest that utilities don’t charge “late fees” since this can violate state statutes. They also instruct utilities to inform declined applicants in writing of the reason for their denial in accordance with the Fair Credit Reporting Act. TVA also recommends that utilities talk to their legal counsel about certain aspects of their day-to-day loan procedures. Program administrators have not experienced any issues with lending regulations.
Results and Future Plans
Since 1997, TVA has extended over $500 million in loans repaid on-bill with a default rate of approximately three percent. Average loans in 2012 were $7,200. The interest rate offered to consumers is tied to US Treasury rates. Program administrators note that the program’s participation rates have dipped significantly in periods when Treasury rates are high and expanded when rates are lower.56
Resources
http://www.energyright.com/residential/
56 Once a loan is originated, the borrower's interest rate is fixed for the life of the loan. However, the program alters interest rates for new participants as U.S. Treasury rates change.

May 2014 www.seeaction.energy.gov 49
Connecticut Small Business Energy Advantage On-Bill Loan Program
Program administrator: United Illuminating (UI)
Location: Connecticut
Overview
Since the program’s launch in 2000, almost 30 percent of the eligible customer base has participated in the Small Business Energy Advantage (SBEA) loan program administered by United Illuminating. The program has done approximately 4,900 loans totaling close to $39 million, while maintaining a default rate below one percent. Disconnection is not allowed in cases of nonpayment. SBEA has succeeded in attracting customers by making participation easy, providing substantial incentives and zero percent interest financing, using non-traditional underwriting, and gaining trust through administrator responsiveness and an intimate knowledge of customer needs. SBEA targets deeper energy savings by structuring its incentives to facilitate more comprehensive energy efficiency (EE) improvements and requiring that participating contractors close at least one multi-end-use upgrade per month. As a result, the average energy savings per comprehensive project is approximately 20 percent.
Table A - 23. Small Business Energy Advantage Key On-Bill Program Design Features
Disconnection and Meter Attachment
Line item billing
Source of Capital On-Bill Financing (utility capital)
Underwriting Alternative (utility bill payment history)
Eligible Measures Energy efficiency measures, water efficiency measures
Program Basics
The design of the SBEA program allows UI to provide financial incentives (i.e. rebates) that cover up to 50 percent of project costs, depending on the depth of a project’s energy savings (Bell 2011). Fifteen program-authorized contractors promote the SBEA program, and these contractors approach small business owners directly to promote efficiency improvements. Tenants may participate in the program; 70 percent of participants are renters.
Key Takeaways • UI’s Small Business Energy Advantage loan program has reached nearly 30 percent of eligible
customers over 13 years. Program administrators attribute this success to substantial incentives, zero percent interest financing, and underwriting criteria that make it easy to qualify
• UI has used minimal, alternative underwriting, to serve this hard-to-reach market segment, while also avoiding significant customer defaults.

50 www.seeaction.energy.gov May 2014
Table A - 24. Small Business Energy Advantage Program Summary Total loans over program life: Approximately 4,900 for approximately $39 million (through 2012)
Total loans in 2012: Approximately 302 loans for approximately $4 million. Average loan $13,600
Default rate Less than 1percent default rate
Application Decline Rate Approximately 7 percent
Average Project Savings 20 percent (approximately 18 percent from electric end uses and 2 percent from gas end uses)
Cumulative Penetration Rate 28.9 percent
Market Served Commercial and industrial customers with an average 12-month peak demand between 10 kW and 200kW
Program Start/End date 2000-present
Interest Rate & Term 0 percent, up to 4 years
Max/Min Loan Amount $500-$100,000
Incentives Available Up to 40 percent of project costs, 50 percent if the project qualifies for a comprehensive bonus
Disconnection and Meter Attachment
None
Transfers: Allowed? Process? Requirements?
Yes, new owner/tenant must sign acknowledgement letter of transfer
Ownership and tenancy changes involving OBF transfers
1 or 2 transfers annually
Source(s) of Capital UI Holding Company funds (for financing capital) and bill-payer funds (Connecticut Energy Efficiency Fund for incentives, program administration costs, defaults and interest rate buy downs) Approximately $1.7 million is financed for every $1 million in incentive funding
Underwriting Requirements Utility bill repayment history only; customer must not have been over 39 days in arrears more than once in the previous 9 months
Eligible measures High performance fluorescent, induction and LED lighting, Occupancy sensors, Photocells, High efficiency HVAC, Programmable thermostats, Energy efficient refrigeration (anti-condensation door heater controls, evaporator fan controls, open case night covers, ECMs), air compressors, VFDs, premium-efficiency motors Energy efficient natural gas measures (e.g., spray nozzles, programmable thermostats, shower heads, pipe and duct insulation, aerators, energy management systems)

May 2014 www.seeaction.energy.gov 51
UI uses internal capital to fund the loans. The SBEA program budget, including the budgeted amount of loan dollars, is approximately $7.2 millions per year. UI earns a 6.4 percent rate of return on this loan capital. Customers are offered a zero percent interest rate for SBEA loans; interest rates are bought down using bill-payer funds (Bell 2011). In 2012, $2.3 million of bill-payer funds are allocated to the program as the overall operating budget: $1.8 million goes to incentives and the remaining funds cover administration costs and the interest rate buy down.
Over the life of the program, SBEA has reached nearly 30 percent of eligible customers by adapting their program design, primarily through three core program attributes:
• Meaningful Incentives that Encourage Multi-measure Projects • A single upgrade measure can qualify for rebates of up to 40 percent of project costs and
“comprehensive” upgrades that include two or more end uses are eligible for up to 50 percent in incentives (Bell 2011);
• SBEA requires that participating contractors must close at least one multi-comprehensive upgrade per month.
• Low Cost, Accessible Financing • Financing terms and conditions also matter. According to UI administrators, small business customers
value not having out-of-pocket costs. For proposals in which the business owner qualified for the rebate incentive only, 18 percent signed up for the offer, while 45 percent of customers signed up for proposals that qualified for the incentive and financing.
• The SBEA program reviews an applicant’s utility bill payment history rather than conducting a more traditional credit analysis. This allows the program to reach a wider pool of customers than would otherwise be possible; only about 7 percent of applicants are declined.
• Administrator Adaptability • SBEA administrators have put significant effort into understanding and responding to customer needs.
For example:
• Recognizing that many small business owners in their service area speak limited English, program administrators set up a translation hotline to enable contractors to better communicate with potential participants;
• When the SBEA program was launched, it declined applicants with arrears of more than 30 days in the previous 9 months. Dennis O’Connor (SBEA Program Manager) recognized that some small businesses maintain cash flow by withholding payment to utilities until they are 39 days in arrears (when UI can turn their power off). To address this, the program increased the arrears limit to 39 days, which expanded the number of eligible participants. Approval rates rose from 80 percent to 93 percent without increasing on-bill default rates;
• In 2007, the program raised the maximum loan term from 24 months to 48 months in order to enable customers to invest in deeper energy savings without increasing their monthly on-bill payments (Bell 2011). This strategy increased the conversion rate from project proposal to project installation from 35 percent to 45 percent.
On-Bill Issues and Findings
Disconnection and Meter Attachment
Loans are unsecured. The program does not allow disconnection in cases of non-payment of the loan obligation. UI decided that allowing disconnection in these situations would not be in keeping with its business practices.

52 www.seeaction.energy.gov May 2014
Vacancy, Foreclosure and Transfer
Transfers are allowed, but have occurred only one or two times per year. The distinct site needs and load profiles of different businesses may account for this (e.g., efficiency upgrades to a bookstore may not persist if a restaurant moves into and build out the space anew).
Split Incentives
Seventy percent of SBEA participants are tenants. Generally, these customers do not ask property owners for permission to make upgrades.
Underwriting
Generally, the only underwriting that SBEA performs is a review of utility bill payment history. Applicants cannot have arrears over 39 days, in the previous nine months, to qualify for financing. Over the 13-year life of the program the default rate has not exceeded one percent. Loans that exceed $45,000 require a Dunn & Bradstreet Credit review.
Bill Neutrality
The program has a bill neutrality requirement. UI sets the loan term as the expected simple payback period of the efficiency improvements plus one month.57 In the last two years, the SBEA program has only received three complaints about project savings. UI also requires that businesses with erratic consumption patterns sign a waiver acknowledging that bill neutrality is not guaranteed each month.
Billing Systems
This has been a non-issue for United Illuminating (UI), as their IT systems have existing capacity for collecting loan payments through utility bills.
Lending Regulations
After review, UI found that all aspects of the program are in compliance with state lending regulation. No problems with lending laws to date.
Results and Future Plans
UI’s Small Business Energy Advantage program has impacted a significant portion of the utility’s small business community–and it continues to expand. The program has executed nearly 4,900 loans over its life, totaling approximately $39 million, while maintaining a default rate below one percent. By the third quarter of 2013, the program was lending at an annualized rate of over 500 loans.58 Recently, Connecticut’s Department of Energy and Environmental Protection (DEEP) approved increasing the pool of bill-payer capital available to fund loans to be repaid on-bill/loan programs to $15 million for the 2013-2015 Conservation and Load Management Plan, up from $5 million just a few years ago. Approximately, two thirds of the funding pool will be dedicated to the Small Business Energy Advantage Program.59
57 The simple payback period is the period over which savings from efficiency improvements add up to equal the undiscounted loan amount. 58By the end of the third quarter, the program had extended or approved 320 loans and signed another 87. Assuming 93 percent of the signed loans will be approved—the program’s approval rate—it had originated approximately 400 loans in the first three quarters of the year. If lending continues at that pace, it will have extended over 500 loans by the end of the year. 59The remaining balance may be utilized for financing municipal projects.

May 2014 www.seeaction.energy.gov 53
Resources
United Illuminating SBEA website.

54 www.seeaction.energy.gov May 2014
Alliant Energy Shared Savings Wisconsin On-Bill Program
Program administrator: Alliant Energy Wisconsin
Location: Wisconsin
Overview
Starting in 1987, Alliant Energy’s Shared Savings Wisconsin commercial and industrial (C&I) on-bill financing program loaned over $500 million for over four thousand energy efficiency and renewable energy projects (average loan size approximately $125,000). The volume makes it the largest C&I program examined in this report. The large volume was driven by low interest rates, financial rebates (in the early years of the program), and industrial customers that pursued large on-bill projects. Between 2007 and 2009, a number of events eroded the program’s successful model. Some of the challenges were unique to the program, such as rule changes that made financed projects ineligible for rebates and increased security requirements, while others are common to many on-bill programs (e.g., low natural gas prices undercutting the economic value of efficiency, the economic downturn, and low market interest rates). In recent years, these combined challenges markedly reduced the program’s loan volume, and the program ended on December 31, 2013.
Table A - 25. Shared Savings Key On-Bill Program Design Features
Disconnection and Meter Attachment Line Item Billing
Source of Capital On-Bill Financing (utility shareholder funds)
Underwriting Hybrid (credit report and utility bill payment history)
Eligible Measures Energy efficiency measures, Renewable energy measures
Program Basics
Through the Shared Savings Wisconsin program, Alliant Energy offered commercial and industrial customers loans of up to five years that could be paid back on their utility bills with an administrative fee of zero to three percent.60 The loans were funded using utility shareholder funds—the cost of capital was 8.2 percent. Participants were permitted to finance a range of energy efficiency (EE) and renewable energy (RE) measures that had to be bill–
60 Shared Savings Wisconsin did not charge an interest rate but rather an administrative fee. Alliant sets administrative fees to promote certain target measures. For example, the administrative fee on LEDs was zero percent, because Alliant wanted to promote them. Jeffrey Adams, Alliant Energy Wisconsin’s Team Leader for Energy Efficiency, believes that, with a higher fee, the program would have distributed just a quarter of the LEDs that it was able to with no fee.
Key Takeaways • Alliant Energy’s Shared Savings Wisconsin on-bill program delivered over $500 million in
financing to commercial and industrial customers since 1987 – the highest of any non-residential program reviewed for this report
• Program changes in recent years coupled with a low-interest rate environment reduced program volume and the initiative was shuttered at the end of 2013

May 2014 www.seeaction.energy.gov 55
neutral over the maximum five-year term.61 Program administrators took the perspective that any kWh they didn’t need to produce—whether from EE or RE—represented savings on power generation.
As seen in other large volume programs surveyed in this report, single measures dominated the participating projects. The majority of projects were lighting only, although over 60 percent of energy savings came from efficient machine processes (see Figure A - 3).
Figure A - 3. Breakdown of projects by measure installed (1997-2013)
Source: Shared Savings measure data provided by Alliant Energy Wisconsin
Loan sizes and the borrower’s credit rating determined underwriting criteria. For loans to established businesses and for loans under $20,000, the program approved applicants based on utility bill repayment history exclusively. Applicants with investment grade credit ratings (S&P BBB- or higher) could borrow between $20,000 and $2 million with no outside financial review. Those with less than investment grade credit ratings or no credit rating were subject to a financial review consisting of two years of Dunn & Bradstreet (D&B) financial reports for loans in that range. (The program made the application process easier for small businesses by exempting loans under $20,000 from financial review). The vast majority of participants, 85 percent, were large, well-established commercial and industrial customers due, in part, to the more rigorous underwriting (and higher transaction costs) for loans above $20,000 (See Figure A - 4). Program Manager Jeffrey Adams noted that the financial stability of the participants (as measured by the fact that they had been in business for several years) contributed to both the program’s low lifetime default rate and it’s low application decline rate—just 10 percent.
61 This is a more restrictive definition of bill neutrality than that used by programs that require expected energy savings over the life of energy improvements to exceed project costs rather than just over the tenor of the loan. The program allowed participants to buy down project costs above the bill neutral amount.

56 www.seeaction.energy.gov May 2014
Figure A - 4. Breakdown of loan volume by sector (1997-2013)
Source: Shared Savings project level data provided by Alliant Energy Wisconsin
Challenging Program Changes and a Difficult Economic Environment: The Perfect Storm
In the late 2000s, changes to the program and a challenging economic environment eroded the program’s appeal to Alliant customers. Program volume declined, from approximately $40 million per year before 2007, to under $400,000 in 2012.
Two program changes appear to have had critical impacts on the program’s popularity:
• New Loan Security Requirements. After 2008, Alliant began to require a Purchase Money Security Interest (PMSI) on all loans in the program. A PMSI must be signed by all other lien holders and indicates their acknowledgement that Alliant has priority in the event of default to recover funds should another lender also have an interest in the improvements (for example, because the improvements are major pieces of equipment like boilers that are core to building operations and may be covered by a property mortgage). A PMSI effectively requires potential participants to get “consent” from their existing lenders, which dramatically increased the transaction costs of participating in the program. While Alliant had been able to recover against all defaults in rate cases, their counsel felt the additional security was necessary, to demonstrate that the utility had performed appropriate diligence and had robust protections in place should participants default.
• Participants Could No Longer Take BOTH Rebates and Financing. Before 2009, on-bill participants qualified for large rebates and were permitted to finance the balance of project costs (up to a bill-neutral level) through the on-bill program. After 2009,customers had to choose between either a rebate or financing. This made Shared Savings loans less attractive, particularly in light of the more stringent security requirements.
• In addition to these key programmatic changes, the economic downturn led some businesses to put off efficiency upgrades. The downturn has also led to a prolonged period of low market interest rates, making

May 2014 www.seeaction.energy.gov 57
Alliant’s 0-3 percent administrative fee relatively less attractive to customers versus other financing options—particularly given the programmatic changes described above. Adams says that participation in Shared Savings was a business decision for their customers: they would compare their costs to borrow with the administrative fee offered by Shared Savings to judge whether the efficiency improvement was a good investment. Another challenge to the Shared Savings program was the reduction in energy costs that low natural gas prices have catalyzed. These lower costs impaired the economics of EE projects overall and made it more difficult for potential program participants to meet the program’s bill neutrality requirement.
On-Bill Issues and Findings
Disconnection and Meter Attachment
Security depended on the loan size and the participant’s credit ratings. Power disconnection was not allowed in cases of loan non-payment. Until 2008, the program only required a UCC lien as security. After 2008, the program began to require a Purchase Money Security Interest (PMSI) or a first-position, unencumbered UCC lien for contracts under $100,000. For higher risk, higher value loans, other security—a third party guaranty or parent guaranty—may have been required.
Transfers and Split Incentives
Transfers were not allowed. Remaining balances had to be paid in full prior to a new tenant moving in.
Underwriting
Like security, underwriting criteria also depended on the size of the loan and the participant’s credit ratings. On loans under $20,000, customers with acceptable utility payment history were approved without external financial review. For borrowers with investment grade credit ratings, no financial review was required for loans of less than two million dollars. Those with a below investment grade credit rating or no credit rating were subject to financial review of two years of Dunn & Bradstreet (D&B) financial reports. All loans over two million dollars required a D&B review of the borrower.

58 www.seeaction.energy.gov May 2014
Table A - 26. Shared Savings Program Summary
Total loans over program life: 4,140 loans for $524,250,000
Total loans in 2012: 9 loans for $392,998
Default rate 2.7 percent
Application Decline Rate 10 percent
Average Project Savings Average savings were not tracked
Cumulative Penetration Rate 6.9 percent
Market Served Commercial and industrial
Program Start/End date 1987-2013
Interest Rate & Term (Administrative fee) 0 percent – 3 percent, up to 5-year term
Max/Min Loan Amount $5,000—$1.6 million
Rebates Available None since 2009
Disconnection and Meter Attachment
No disconnection allowed. Purchase Money Security Interest (PMSI) or a letter of credit; UCC lien filed in conjunction
Transfers: Allowed? Process? Requirements?
Not allowed
Ownership and tenancy changes involving OBF transfers
NA
Source(s) of Capital Utility shareholder funds, cost of capital 8.2 percent
Underwriting Requirements Credit report, 2 years of Dunn & Bradstreet financials (for new businesses) and utility repayment history
Eligible measures HVAC, lighting, motors, food-service equipment, farm equipment, renewable energy
Bill Neutrality
Projects had to meet a five-year payback period to qualify for financing. Participants were allowed to buy down any costs above those that met the five-year payback criteria.
Billing Systems
The Shared Savings program experienced no billing system issues.

May 2014 www.seeaction.energy.gov 59
Results and Future Plans
On December 31st, 2013, the Shared Savings Wisconsin program ended after 27 years. Alliant Energy will shift their current energy efficiency efforts to Wisconsin’s Focus on Energy initiative. Program administrators will file for a new program—the type of program is yet to be determined—to begin in 2015.
Resources
http://www.alliantenergy.com/SaveEnergyAndMoney/AdditionalWaysSave/FinancingOptions/029922
60 www.seeaction.energy.gov May 2014
APPENDIX B: International On-Bill Case Studies
The United Kingdom’s Green Deal: A Market Framework for Funding Energy Efficiency Improvements
Program Administrator: Department of Energy and Climate Change
Location: United Kingdom
Introduction
In January 2013, the United Kingdom’s (UK) Department of Energy and Climate Change (DECC) initiated the Green Deal (GD) program. The GD creates a ‘new market framework’ for the sale, installation and financing of energy efficiency (EE) measures in existing buildings. Central to the program is an On-Bill Repayment (OBR) financing structure in which loans for EE improvements are repaid on customers’ utility bills. Over the ten months since the GD was introduced, customers have shown strong interest in the initiative, completing 101,851 energy assessments. However, only 1,173 financing plans have been signed through the GD with an approximate value of $7.2 million (£4.5 million). This slow uptake of retrofit projects has led to stakeholder criticism and highlighted the delivery risk of new initiatives that require developing substantial program infrastructure and re-orienting market participants. This policy brief examines the design of the GD, implementation challenges and potential pathways to success. It is organized as follows:
• Green Deal Basics
• Green Deal Program Structure
• Green Deal and ECO: Complementary Strategies
• Green Deal Finance
• A Slow Start as the Market Re-Orientates
Green Deal Basics
The UK’s Energy Act (2011) established the GD as a new method for financing EE measures in existing residential and non-residential buildings. Consumers may sign up for Green Deal Plans (GD Plans), which are contracts
Key Takeaways • Program complexity and the need to re-orient market participants contributed to low program
participation in the nationwide program’s first year. • Bill-neutrality requirements necessitate substantial project cost buy downs to enable targeted
energy improvements to be financed without up-front customer contribution and the new incentive mechanisms intended to achieve these buy downs have been slow to materialize.
• There has been significant investment in program infrastructure by government, utilities, lenders, and market participants. Demand will need to increase significantly to justify the investment.
• EE building assessments have proven popular and effective in promoting the installation of improvements even in the absence of widespread uptake of financing

May 2014 www.seeaction.energy.gov 61
between a building occupant and a Green Deal Provider (GD Provider) through which installed EE improvements are repaid over up to 25 years on the participant’s electricity bill. GD Providers are both responsible for the installation of EE measures and are the counterparty to the financing agreement (i.e., the GD Plan).62 63 This program structure was designed to enable participants to interact with a single organization in obtaining both their EE improvements and financing under the GD. Over 100 organizations have been accredited to date as GD Providers, including large energy companies, social housing providers, local governments, organizations in the EE supply chain (e.g., organizations that manufacture, sell, and install insulation) and start up organizations seeking to take advantage of the new market.
The program was developed in coordination with policies that placed a new carbon abatement obligation on the UK’s large retail gas and electric suppliers (i.e., the Energy Company Obligation (ECO). The obligation requires energy companies to meet carbon abatement targets through the installation of residential EE measures, and is anticipated to be delivered through a range of strategies including direct installation of EE measures and buying down customers’ costs to install EE measures through the GD. The ECO has been designed as the GD’s primary source of long-term financial incentives and a key driver of consumer EE adoption. DECC anticipates that energy companies will make incentive payments to GD Providers for delivering EE improvements to consumers and that those incentives will be passed through to consumers in the form of discounts on the full cost of installed EE measures.64 In addition to ECO funds, for the program’s first fifteen months, consumers were initially eligible for “Green Deal Cashback” rebates of up to $1,632 (£1020) funded by the UK Treasury.65,66,67
The UK Government’s primary motivations for launching the Green Deal and ECO programs are:
1. Reduce UK greenhouse gas (GHG) emissions. UK buildings are responsible for 43 percent of the country’s GHG emissions.68 Improving the energy efficiency of the UK’s building stock is therefore an important strategy for the UK in meeting its legally binding GHG emission reduction targets by 2022.69
2. Address the drivers of fuel poverty. 11.6 percent of households in England are in fuel poverty, defined as having income below the poverty line and energy costs higher than is typical for their property type.70 With average energy bills rising 45 percent from 2007-2012, and further increases in fuel costs anticipated, reducing energy usage through EE is a key strategy for the UK to reduce this financial stress.71 72 The Green Deal and ECO programs offer consumers an opportunity to both reduce energy costs today and reduce their exposure to future rises in energy bills.
3. Enhance the security of the UK energy supply. Natural gas is an important source of energy for domestic space heating in the UK with 84 percent of UK households relying on gas for heating.73 Imports account
62GD Providers must originate GD Plans but may assign the rights to the cash flows to a third party funder. See section 5 for more detail. This is analogous to “direct” or “dealer” loans in the United States, whereby a contractor is the immediate counterparty to a customer’s financing transaction before assigning the financial product to an investor based upon pre-arranged terms after the transaction has closed. 63 Green Deal Providers can contract out EE installations. However, the installer must also be accredited by DECC as a qualified installer. 64 GD Providers are not obligated to pass ECO incentives on to consumers, but DECC anticipates that market competition will drive them to do so in order to be price competitive. 65 The rebates may be extended beyond this period at the discretion of the government. 66 Exchange rate assumption is: 1.6 USD = 1.0 GBP 67 Subsequent changes to the rebates have lead to an increase in the amount available as a rebate against the cost of solid wall insulation from $1040 (£650) to $6400 (£4000) in response to slow demand for the measure. 68 Green Deal and ECO Final Stage Impact Assessment, DECC, 2012, Pg 13; Link 69 Through The Climate Act (2008) and The Carbon Budgets Order (2009), the UK established legally binding carbon budgets for the five year periods between 2008 and 2022. Budgets decline in each period with the budget for the 2018-2022 period (2544 MtCO2e) 15.7 percent below the budget for 2008-2012 (3018 MtCO2e). 70 Fuel Poverty: A Framework for Future Action, DECC, 2013; Link 19Quarterly Energy Prices September 2013, Department of Energy and Climate Change, Pg. 11, Link 72 DECC Fossil Fuel Price Projections, July 2013, Link 73 Pg 89-90 Great Britain’s energy fact file, DECC, 2011. Link

62 www.seeaction.energy.gov May 2014
for 48 percent of natural gas consumption in the U.K.,74 so decreasing domestic gas use through efficiency can reduce the UK’s exposure to the risk of international supply disruptions and price volatility.
Green Deal Program Structure
For households and businesses seeking EE improvements, Green Deal participation involves five key steps:
1. Assessment. Participants hire independent assessors to develop an ‘Energy Performance Certificate’, which ranks a property’s efficiency on a scale of A to G, details the property’s expected energy costs and highlights potential EE savings opportunities.75 The report is a necessary prerequisite to obtaining a GD Plan as customers may only finance measures on their utility bill that are identified in the report.76 Assessments are also required to access the GD Cashback incentives, whether or not a customer elects financing. To date, these assessments have largely been provided free of charge.77
2. The Green Deal Plan. After receiving an assessment, participants contact one or more GD Providers to get bids on some or all of the EE improvements identified in the EPC. GD Providers are free to price projects as they see fit. While GD providers are afforded some flexibility with the terms of GD Plans, all financial products must meet the following key conditions:78
• Bill-neutrality: GD Plans must comply with “The Golden Rule”, which requires that a consumer’s first year expected energy savings exceed the consumer’s first year on-bill charge;79
• Loans must be unsecured, with the threat of electricity service disconnection for GD Plan non-payment acting as an additional risk management tool;
• Warranties must be provided for the measures in accordance with normal industry standards for each measure;
• Maximum loan term of 25 years
• Cooling Off Period: Once consumers are signed up for a GD Plan, a cooling off period of 14 days occurs before the plan becomes live and the work can commence (and consumers may cancel the GD Plan without penalty during this cooling off period).
To date, all funded GD Plans have featured the same terms (6.96 percent interest) and have been re-sold by GD Providers after origination to The Green Deal Finance Company (GDFC), a private consortium set up to fund GD Plans that obtained investment from the UK Government and market participants (see Green Deal Finance section for more details on the GDFC).
3. Installation. Once the cooling off period has passed, the GD Provider uses accredited installers to implement the EE measures. Accreditation is designed to ensure quality work is performed and give assurance to the customer that they will realize the expected savings. In many cases, GD Providers use “in-house” installers to implement EE measures, but some rely on third party installers to complete the work.
74 For further information, see DECC, Historical gas data: production and consumption and fuel input 1920 to 2012. Link 75 EPCs are required by law whenever a property is bought, sold, or rented. A sample EPC is available here: Link 76 The report can be used as the basis for a GD plan with any GD Provider. 77 A DECC survey revealed that 80-85 percent of those surveyed had assessments provided free of charge or funded by energy companies, Green Deal Providers, or local authorities. For those that pay, the cost is typically ~$150 (£100). Green Deal Assessment Survey GfK NOP/DECC, September 2013, Link 78 Other requirements include only fixed interest rates are permitted for residential GD Plans and only nominal charges are permitted for early repayment of GD Plans less than 15 years of length. 79 Consumers may pay for any project costs above the bill-neutrality threshold off-bill.

May 2014 www.seeaction.energy.gov 63
4. Green Deal Plan Repayments. Once the installations have been completed, the GD Plan is placed on the participant’s utility meter and the participant begins repayment through their electricity bill.80 Energy suppliers collect the payment from the participant and transfer the payment to the GD Provider (or designated GD Plan revenue owner, otherwise called the “asset owner”).81 Partial payments of the total electricity bill (including the Green Deal charge) are distributed proportionately between the energy company and the asset owner. This program feature is designed to act as a credit enhancement for lenders, ensuring that the collecting energy company has aligned interests with the lender and should continue to pursue any arrears on the bill, including the Green Deal charge, until it is fully paid. Energy companies must use their full powers of collection in pursuit of the charge, which may include; fines, the installation of a prepayment meter82 and ultimately disconnection. These features are designed to create a secure income stream for the asset owners in order to attract the lowest cost capital possible to support the program.
5. Transferability. GD Plans are automatically transferrable from one building occupant to the next. There is a requirement for the outgoing occupant/landlord to disclose the charge, but consent of the home purchaser or subsequent tenant is not required. No new processes were necessary to ensure disclosure since the outgoing property occupants or owners were already required to provide an EPC at the point of property or tenancy transfer and the EPC identifies the existence of a GD Plan. The ability to automatically transfer the Green Deal Plan was designed to overcome two perceived barriers to property occupants adopting energy efficiency measures.
• Split incentives for rental properties.83 Creating a mechanism for landlords to overcome this barrier and access capital for these projects was important as DECC also passed legislation enabling it to require all privately-owned rental properties in the UK to have an EPC rating of D (on an A to G scale) or higher by 2016.84
• Lack of valuation of home energy performance during the sale of domestic properties. If property owners do not believe that energy improvements will be reflected in their home’s value at time of a property’s sale, they may be reluctant to invest in EE.85
It is uncertain whether the Green Deal will be effective in overcoming these barriers, as prospective purchasers or tenants could require the repayment of the GD Plan as a condition of the transaction, or take account of the existence of the debt at the time of making an offer. Figure B - 1 summarizes these five program participation steps.
80 The electricity bill was chosen for the Green Deal collection as nearly all UK homes are on the electricity grid, while only 84% of homes are on the gas grid. 81 The GD Provider can sell the repayment stream from the GD Plan to another party. In most cases, GD Providers are expected to sell the right to the cash flows to the Green Deal Finance Company immediately after a GD Plan has been executed. GD Providers can then use the proceeds of the sale to fund additional GD Plans. 82 The installation of a prepayment meter is a sanction available to UK energy suppliers, whereby the customer must purchase credit for the meter in advance in order to be supplied with gas or electricity. Operation of the meters can vary but typically credit for the meters is purchased at convenience stores or post offices in the form of tokens, charge cards or electronic keys. Arrears can be assigned to the meters, and DECC has ensured that this process will include the collection of Green Deal arrears. Approximately 5.9 million households (22%) in the UK use prepayment meters. 83Split incentives exist when the landlord is responsible for making improvements to the property but the tenant is responsible for paying for the energy bill (and thus benefits from reduced energy costs from the improvements). Because the owner does not benefit from the energy savings and the tenant’s occupancy of a property may be short in duration, neither party is incentivized to install energy efficiency measures with long payback periods. 84 Further legislation will be required to enforce this requirement and will need to be passed before 2016. 85 Energy Performance and Value Project – Royal Institute of Chartered Surveyors 2009

64 www.seeaction.energy.gov May 2014
Figure B - 1. Green Deal Program Participation Steps
The Green Deal Process has led to a long process for the sale of Green Deal Plans. The GDFC has publically complained that the many steps of the GD Process, which involve multiple home visits and documentation, mean it can take up to three weeks to agree to a GD Plan and that this has been a barrier to adoption. This adds cost to the process for those organizations wishing to sell Green Deals and program complexity risks customer attrition.
The Green Deal and Energy Company Obligation: Complementary Strategies
The energy company obligation (ECO) requires UK energy suppliers to save 27.8MtCO2 annually through the installation of EE measures in residential properties. DECC permits energy suppliers to take any approach to meeting the ECO targets that result in demonstrable energy savings as DECC seeks to rely on market competition and innovation to drive suppliers to find the most cost-effective ways to catalyze consumer EE adoption. The ECO has been divided into three parts for the first obligation period of 25 months from January 2013 to March 2015:
1. The Home Heating Cost Reduction (‘Affordable Warmth’) (HHCR): Under this obligation, energy companies are required to provide measures that will improve the ability of low income and vulnerable households to heat their homes. The obligation requires the installation of measures that will achieve
Assessment
- Independent
- Suitable measures recommended
- Paid for by consumer
Accredited Assessor
Green Deal Provider
Measures Installed
- Funded by GDP
- Installed by GDP/accredited installer
- Required for warranties measure lifetime
Green Deal Plan Agreed
- Bill neutral Requirement
- Contract for finance and measures
- ‘Cooling off period’ required
Third Party funder (The Green Deal Finance Company)
Energy Company
Repayment
- Through electricity Bill
- Transferable
- Pro-rata partial payments
- Disconnected if in
1. Measures funded by the GD Provider
4. Remits funds to asset owner 2. Purchases right to loan asset
3. Customer Repayment

May 2014 www.seeaction.energy.gov 65
$6.72 billion (£4.2 billion) of expected lifetime cost savings in this target market and is anticipated to cost $560 million (£350 million) to deliver annually.86
2. The Carbon Saving Community Obligation (CSCO): Under this target, energy companies must provide insulation and connection to district heating to households in low-income communities. The obligation is a carbon abatement obligation to save 6.8MtCO2 and is anticipated to cost $304 million (£190 million) per annum to deliver.87
3. The Carbon Emissions Reduction Obligation (CERO): Under this obligation, the energy companies must focus on the provision of measures that cannot meet the GD’s bill neutrality requirement on their own. The CERO is expected to be met primarily through the subsidy of solid wall insulation (SWI) and hard to treat cavity wall insulation (HTTCWI).88 The obligation is a carbon abatement obligation to save 20.9MtCO2 and is anticipated to cost $1.216 billion (£760 million).89
The GD is designed to reduce energy companies’ cost of compliance with the CERO by promoting greater consumer willingness to cost-share for EE improvements.90 Under the CERO, energy companies may claim the full carbon abatement of any eligible EE measure they can demonstrate they had a role in driving consumers to adopt, no matter how it is incentivized. For example, an energy company is eligible for the same ECO credit if they provide a 10 percent discount on an eligible EE project or pay for 100 percent of project costs through a direct install initiative.91
The ability of energy companies to meet their CERO obligations through GD Plan subsidies is critical to the success of both the GD and the UK’s carbon targets. For the GD, bill neutrality restrictions mean that few measures can actually be fully financed without subsidy or significant participant project cost buy downs. For example, an average of only 31 percent of external Solid Wall Insulation costs (SWI), 57 percent of external SWI and 45 percent of hard to treat cavity walls can be financed if participants are to meet the bill neutrality restriction (see Table B - 1).92
86 Green Deal and ECO Final Stage Impact Assessment, DECC, 2012 pg. 84 87 Ibid 88 DECC draws a distinction between Hard to treat cavity walls insulation (HTTCWI) and other cavity wall insulation (CWI). CWI is a cost effective EE measure and should be able to be fully financed under the Green Deal. HTTCWI is CWI in properties with narrow cavities, concrete construction, metal frame construction, random stone cavities, buildings over four storeys tall, and those exposed to extreme wind and rain. These projects are typically more expensive and less cost effective so are included within the ECO to enable discounts to be made to GD customers. 89 Green Deal and ECO Final Stage Impact Assessment, DECC, 2012 pg. 84 90 The CSCO and HHCR are expected to be met through free-to-participant direct installations by energy providers. 91 In practice, program managers expect that energy companies will pay most GD-related ECO incentives to GD Providers not directly to consumers and that the incentives will be reflected in the price consumers pay for their energy improvements. Whether GD Providers will, in fact, pass through these incentives to customers remains uncertain. 92 Green Deal and ECO Final Stage Impact Assessment, DECC, 2012, Pg. 138

66 www.seeaction.energy.gov May 2014
Table B - 1. Example of how Green Deal and ECO funding combine to provide bill-neutral measures at zero up-front cost93
Internal Solid Wall Insulation
Capital Cost of the measure $13,552 (£8,470)
Expected annual savings $875 (£547) p.a.
Maximum amount funded through the Green Deal loans at 7.5 percent interest over 20 years (i.e. maximizing the limit of £547 per year to meet the bill neutral requirement)
$8,922 (£5,576)
GD Cashback available for Internal SWI $1,040 (£650)
ECO incentive to make project bill neutral $3,590 (£2,244)
Substantial uncertainty remains as to whether energy companies will choose to meet their ECO targets by subsidizing GD Plans. There is no requirement for energy companies to offer subsidies alongside GD Plans, and it may be that they can find alternative strategies for delivering the measures at lower cost or with less risk to their ability to meet their targets. Meeting the ECO targets is a requirement of the license conditions of the energy companies in the UK. Under the terms of the license, a breach allows the UK Government to fine the company up to 10 percent of the company’s revenue, meaning that failure to meet targets under the ECO carries a large financial risk. Energy providers are required to meet ECO obligations whether the Green Deal is popular or not and there is risk that they will be unable to fulfill their obligations if they allocate substantial resources to supporting GD Plans and the GD fails to deliver sufficient consumer participation.
The certainty of using more costly, but tried and tested strategies (e.g., fully funding EE improvements in large social housing developments), may therefore be preferable to relying on an untested financing program. Early data suggests that energy providers are, in fact, responding to low early GD participation by pursuing alternative compliance channels that necessitate higher per-energy-unit-saved spending.
If energy companies choose not to satisfy CERO by partial subsidy of participant projects (i.e. if it is satisfied through direct installations where participants pay no costs), it will have a detrimental impact on the GD’s viability as customers will be faced with the unattractive proposition of only being able to finance a portion of project costs. It will also likely lead to substantially higher ECO compliance costs than DECC anticipated (as energy companies will be paying for all project costs through direct install initiatives rather than a portion of costs through the GD), which will ultimately result in higher energy prices for consumers.94
As of October 2013, only 1,173 GD plans have been signed. In contrast, 99,179 measures have been installed under the CERO alone95 96(see Table Table B - 2). Thus, it is clear that the energy companies have not been using the GD alongside ECO funding at material levels to date. It is not clear whether the energy companies have been waiting for GD Providers to enter the market or whether there have been strategic decisions by the Energy Companies to fulfill their ECO without the aid of consumer contributions under the Green Deal. For example, British Gas was anticipated to be a major participant in the GD as it has both the largest obligations under the ECO (British Gas has
93Adapted from, State aid SA.34611 (2012/N) – United Kingdom, Provision of public funds to a special purpose vehicle (SPV) in support of the UK Government's Green Deal policy (UK), European Commission, 2013 Link 94 ECO costs are anticipated to add $75 (£47) to consumers annual energy costs, Page 78, Estimated Impact of energy and climate change policies on energy prices and bill, DECC, 2013, Link 95 The CERO was anticipated to operate alongside the Green Deal. 96Data was not available on how many measures were installed through the 1,173 GD plans.

May 2014 www.seeaction.energy.gov 67
the largest retail energy market share) and a large energy services business. British Gas has been offering GD Plans since April but has yet to originate a significant volume.
Table B - 2. Measures installed under the Carbon Emissions Reduction Obligations
(January - October 2013) Measure Volume
Hard to Treat Cavity Wall Insulation 71,699
Loft Insulation 15,625
Solid Wall Insulation 11,236
Other 721
Total 99,179
The majority of measures delivered under ECO CERO have so far has been HTTCWI (Table B - 2). This is a relatively cost-effective measure that can be delivered cheaply by energy companies. While other highly cost-effective measures were excluded from ECO CERO qualification (i.e., CWI and loft insulation) in order to drive demand for the GD, the energy companies’ ability to fulfill their CERO obligation through the installation of HTTCWI may have inadvertently made delivering ECO through direct installation more attractive to energy companies than through the GD (with its higher transaction costs and risk that sufficient customer participation will not materialize).
DECC has actually recently proposed changes to the CERO in which DECC would reduce this obligation by thirty three percent. The proposed changes were made in response to rising public concern over the impact of ‘green levies’ (i.e. carbon and renewable obligations placed on energy companies, that ultimately lead to higher energy costs) on consumer energy bills. The changes, however, may also indicate an admission that the energy companies are unlikely to be able to meet CERO targets with a slow start to the Green Deal program and demand for Solid Wall Insulation. DECC announced alongside the changes that they would also increase the rebates available for solid wall insulation from $1040 (£650) to $4000 (£6400). This change will both make it easier for Green Deal Providers to access subsidies to make solid wall insulation which DECC hopes will unlock demand for the measure.
Green Deal Finance
Few GD Providers have experience accessing capital to deliver financing to households and businesses for EE improvements. In response to this challenge, a consortium of prospective GD Providers established a non-profit financing entity, the Green Deal Finance Company (GDFC), to act as the purchaser of GP Plan “assets” (i.e., revenue streams from participant repayment of GDs) from GD Providers once these plans are originated.97 The GDFC also provides administration services for the plans to GD Providers, including underwriting, arrangement of the collection of GD Plan repayments from the respective energy companies, and providing annual statements to participants to ensure conformity with national regulations pertaining to consumer lending. While GD Providers are permitted to provide the long-term funding from their own balance sheets or source other funding sources, the GDFC has been the only organization to date to fund GD Plans.
The GDFC raised $310 million (£194 million) to purchase and administer GD Plan assets, including $110 million (£69 million) of subordinated funding from DECC ($40 million (£25 million)), $70 million (£44 million) from the GDFC’s members and $200 million (£125 million) of senior debt from the Green Investment Bank (GIB).98 99 The GDFC will
97The Energy Act requires that the GD provider remain the counterparty to the financing agreement for the lifetime of the plan, so only a sale of the cash flows is permitted. The sale of the cash flows does not obviate the Green Deal Provider of regulatory responsibilities as a consumer lender. 98 The Green Investment Bank is a for profit development bank set up by the UK government targeting investments with a green impact (Link). The bank was formed as a public company in 2012 with an investment of $4.8Bn (£3Bn) from the UK’s treasury. It has been set up to become an

68 www.seeaction.energy.gov May 2014
use this funding to aggregate GD Plan assets, and once it has aggregated sufficient volume, the GDFC plans to issue debt securities to other investors to replenish its ability to purchase additional GD Plan assets.
The GDFC offers financing at rates of 6.96 percent plus fixed up-front administration fees of $100 (£63), and annual administration fees of $29 (£18). This means that annual percentage rates (APRs) for GD Plans funded with capital from the GDFC will be between 7.5 percent and 10 percent depending on the size of the plan.100 Underwriting is based on consumer credit scores along with basic requirements for energy bill payment history. The GDFC claim that the credit score threshold they have chosen allows ~83 percent of UK consumers to qualify for credit.101
A Slow Start as the Market Reorients
DECC has come under significant criticism due to the low participation in the GD’s first nine months. Of the 101,851 assessments completed, only 1,173 GD Plans have been signed with an approximate value of $7.2 million (£4.5 million) through October 2013. This is far below the UK government’s projection of $485 million (£303 million) in annual volume.102
In order to ensure the program was positioned to handle these high anticipated participation levels, there has been a significant upfront initial investment in infrastructure to establish the program:
• Energy companies making the required changes to adapt their collection systems to accommodate the program. This was forecast to cost between $12.6 million and $24.2 million (£7.9 million-(£15.1 million);103
• DECC administration and marketing costs of over $20.2 million (£12.7 million);104
• Costs incurred by GD Providers and other market participants preparing for the program (over 5,000 organizations have been accredited to participate); and
• Costs to the GDFC developing an administration system and securing investment.
Low early participation has raised questions about the efficacy of the program; particularly given that it was touted as a major central government initiative to address a salient political issue. DECC has responded to this criticism by calling for patience to allow the program, which relies on private organizations entering the market, to establish itself. DECC’s comments may have merit as there is some evidence that low participation rates may be due, primarily, to lack of GD Providers offering EE improvements & GD Plan financing rather than a lack of interest in the program.
1. Participation in GD assessments is high, while participation in finance is low. Over 101,851 assessments have performed through the program as of October 2013. 81 percent of surveyed participants indicated
enduring financial institution independent of government, and obtained the approval from European Commission to make investments only on commercial terms. 99 The members of GDFC range from large gas and electric providers to start-up organizations established to participate in the market. For a membership list see GDFC website (link) 100 For example an $8,000 (£5,000) plan over 20 years attracts an interest of 7.9%, a $4,000 (£2,500) plan over ten years attracts an interest rate of 9.1%. 101 A normal commercial lender may only service less than 50% of the population with affordable unsecured credit. 102 Final Stage Green Deal and ECO Impact Assessment, Pg. 51 103 Ibid. , pg. 74 104 April 2011 to July 2013 - Freedom of Information Act request 13/0940, August 2013 (link)

May 2014 www.seeaction.energy.gov 69
that they had installed, or intended to install, EE measures following the assessment.105 The strong interest in energy assessments and potential interest among customers in adopting measures suggests that there is an interest and demand for energy efficiency products. However, it remains uncertain whether this interest will translate to a desire for financing for the measures under the GD Plan. Even with active GD Providers available to provide access to the GD program, it is not clear the extent to which customers want, or require, financing. While the DECC survey into assessments revealed high levels of participation in the installation of measures following assessment, 62 percent had managed to, or were in the process of installing measures without the widespread availability of GD finance. Ultimately, if customers choose to install measures outside of the GD framework then this is a positive outcome in respect of the motivations of the program design. However, if GD Plan participation remains low or customers that install measures only install low-cost measures that fail to deliver substantial energy savings, it will raise questions as to whether building the infrastructure to enable GD finance represents good value in delivering substantial energy savings in existing residential buildings.
2. GD Providers have been slow to come to market. There were 112 accredited GD Providers by summer 2013 (see Figure B - 2). However, the GDFC indicated that just three GD Providers had completed the GDFC’s due diligence processes and were able to offer GD Plans that the GDFC would, in turn, purchase. This due diligence is primarily intended to ensure that GD Providers are well positioned to comply with consumer lending regulations. This due diligence has added an important control for the marketplace to ensure responsible lending, but it also appears to have substantially delayed the availability of the on-bill program. The reality of consumer lending being far from the core competency of the organizations who will be acting as lenders has become apparent as these organizations have taken time to meet the GDFC’s requirements.
Several GD Providers have now been through the GDFC’s due diligence process, with more on the way, so the program may be well-positioned to scale as it closes out its first year.
Figure B - 2. Number of Green Deal Provider organizations offering Green Deal Plans in 2013
3. DECC needs to pass further legislation to enable GD Providers access to rental markets. In drafting GD Plan terms and conditions, GD Providers identified an ambiguity in UK consumer credit regulation that could mean that GD Plans in the rental sector are unenforceable. This has meant that GD Providers have
105Green Deal Assessment Survey GfK NOP/DECC, September 2013, pg.5 Link. The Survey does not provide detail of what was installed and could be anything from low value measure such as lighting or draft proofing and high value measures such as SWI. In the U.S., survey participants often indicate that they intend to install EE measures but do not move forward to installation.

70 www.seeaction.energy.gov May 2014
been unwilling to write GD plans in the rental market until the ambiguity has been resolved. The rental market is anticipated to generate a significant level of demand for the program given the potential for impending minimum efficiency standards on landlords in 2016. DECC is in the process of seeking legislative amendments, but until this legislation is passed GD Providers may be unable to access this key market.106
Conclusions
DECC has adopted an innovative strategy to re-orientate the EE market around the GD and ECO programs. By relying heavily on market forces, and commercially sustainable ventures, DECC hopes to create an effective and sustainable way of delivering EE upgrades to the UK building stock at lowest public and energy system cost. Despite the early challenges, it is too early to evaluate whether the Green Deal and ECO will be successful in the long term.
In 2013, elements of the program were relatively successful with GD assessments proving popular and effective in informing customers about energy savings opportunities in their residences. In the short term, by relinquishing control of the program to market participants, DECC has been forced to wait until GD Providers are ready to enter the market for the program to scale in a meaningful way. Adopting a strategy that relies heavily on private organizations stepping into new roles may prove to be justified in the long-term, but the “market re-orientation clearly played a significant role in the initiative’s slow start;
1. The single contract for measures and finance: this requirement was designed to ensure that consumers only deal with one organization. However, it has led to organizations with no history or expertise in the provision of consumer finance becoming regulated consumer lenders. The learning curve for these organizations to be able to provide consumer finance has led to a slow ramp up in the availability of GD Plans.
2. A novel financial tool: the novel features of the program such as the automatic transfer of the GD Plan, the long-term fixed rate funding terms, and the single contract for measures and finance led to traditional financial institutions being unwilling to participate in lending from the outset. As a result, market participants developed their own finance company (the GDFC). Without these novel features, the program may have been able to better leverage existing financial institutions and infrastructure. However, DECC believed that these features were essential to long-term program success and was willing to take on the task of building a new market infrastructure.
3. Bill neutrality requirements have restricted the level of funding: It is clear that the essential coordination between ECO incentive provision and GD Plans has yet to occur in a meaningful way. Until this occurs, the GD proposition is likely to be unattractive to customers if they are unable to fully finance improvements due to the bill-neutrality restriction.
2014 promises to be a critical year for the Green Deal program as many of the barriers that have delayed the program from operating as designed are removed, and DECC continue to make adjustments to the program to attempt to stimulate its success. If customer participation and adoption of efficiency projects that involve GD financing continues to be low, then it will raise questions about the amount invested in infrastructure to support this finance mechanism.
106 Public Consultation is a required step in the law making or amendment process in the UK

May 2014 www.seeaction.energy.gov 71
Manitoba Hydro Power Smart Residential Loan Program, Energy Finance Plan and Pay As You
Save (PAYS) Financing
Program administrator: Manitoba Hydro (MH)
Location: Manitoba Province, Canada
Overview
Manitoba Hydro (MH) offers a range of loan products that can be paid on the customer’s utility bill: since 2001, the Power Smart Residential Loan (PSRL) and, since 2002, the Energy Finance Plan (EFP) and the Residential Earth Power Loan (REPL) initiatives. Since their launch, over 17 percent of residential homeowners have participated in the PSRL, EFP or REPL programs. This is the highest market penetration of any residential on-bill program included in this LBNL study. The programs have supported over $350 million since inception, with cumulative default rates that are less than 0.5 percent. Non-payment can lead to service disconnection for all of these products. In 2012, MH funded over $35 million in loans, to over eight thousand residential customers. This case study focuses on PSRL, which was responsible for the majority of this volume ($29 million), and compares it to the newest initiative, Power Smart Pay As You Save (PAYS), which was launched at the end of 2012.107
PAYS targets customers that are unlikely to participate in MH’s other programs due, to creditworthiness challenges or financial hardship. PAYS requires that projects’ expected utility bill savings be greater than the financing payment, which program implementers expect to increase customers’ ability to repay their on-bill obligation. This new initiative yielded $250,000 in loans, to 52 participating households, in its first year.
107REPL targets only Geothermal heat pump systems, and EFP targets energy efficiency upgrades and non-energy measures.
Key Takeaways • Over the past 12 years, Manitoba Hydro has delivered over $350 million in financing to its
residential and commercial customers through loans to be paid on-bill, funded with internal capital.
• MH relies primarily on utility bill repayment history for underwriting, approving approximately 95 percent of applicants and has maintained an extremely low default rate (0.5 percent) over the life of the program.
• MH recently introduced PAYS, which currently faces uptake challenges due to a bill neutrality requirement and low natural gas rates.

72 www.seeaction.energy.gov May 2014
Table B - 3. Manitoba Hydro Key On-Bill Program Design Features
Disconnection and Meter Attachment On-Bill Loan with disconnection (all products)
Source of Capital On-Bill Finance (utility capital)
Underwriting Hybrid, all products except PAYS, which uses alternative underwriting (utility bill payment history, employment verification and credit check)
Eligible Measures
PSRL: Energy efficiency measures EFP: Energy efficiency measures and non-energy measures PAYS: Energy efficiency measures and water efficiency measures REPL: Renewable energy measure
Program Basics
On-bill loans made through all four programs are funded with internal MH capital. Manitoba Hydro is owned by the Province of Manitoba. MH also receives full cost recovery on program administration costs from utility bill-payers. There is no cap on the funds that MH may lend out; all program demand is filled each year. As a state-owned entity, the Province of Manitoba guarantees a preferential borrowing rate for MH that is included in MH’s cost of capital. Partial payments first cover older arrears, if there are any. Any remaining payment is split by percentage owing among the utility charge, the loan charge and any other charges.
Table B - 4. Summary of Key On-Bill Program Features for Manitoba Hydro programs
Program Target customers Interest rate Max Term Max loan Transfers Bill neutrality
PSRL Residential 4.8 percent for first 5 years
5 years (15 for gas furnaces)
$7,500
$5,500 for gas furnaces
Not allowed Not required
PAYS Residential 3.9 percent for first 5 years
Useful life of equipment
Limited to bill savings generated
Allowed for owners and tenants
Required
A number of factors likely contribute to the popularity of the PSRL initiative, including the broad range of eligible measures, and the programs’ high customer application approval rates. Participants in the PSRL initiative may finance a range of energy-related measures. Window, furnace or door replacements account for about 95 percent of projects financed through PSRL (see Figure B - 3).
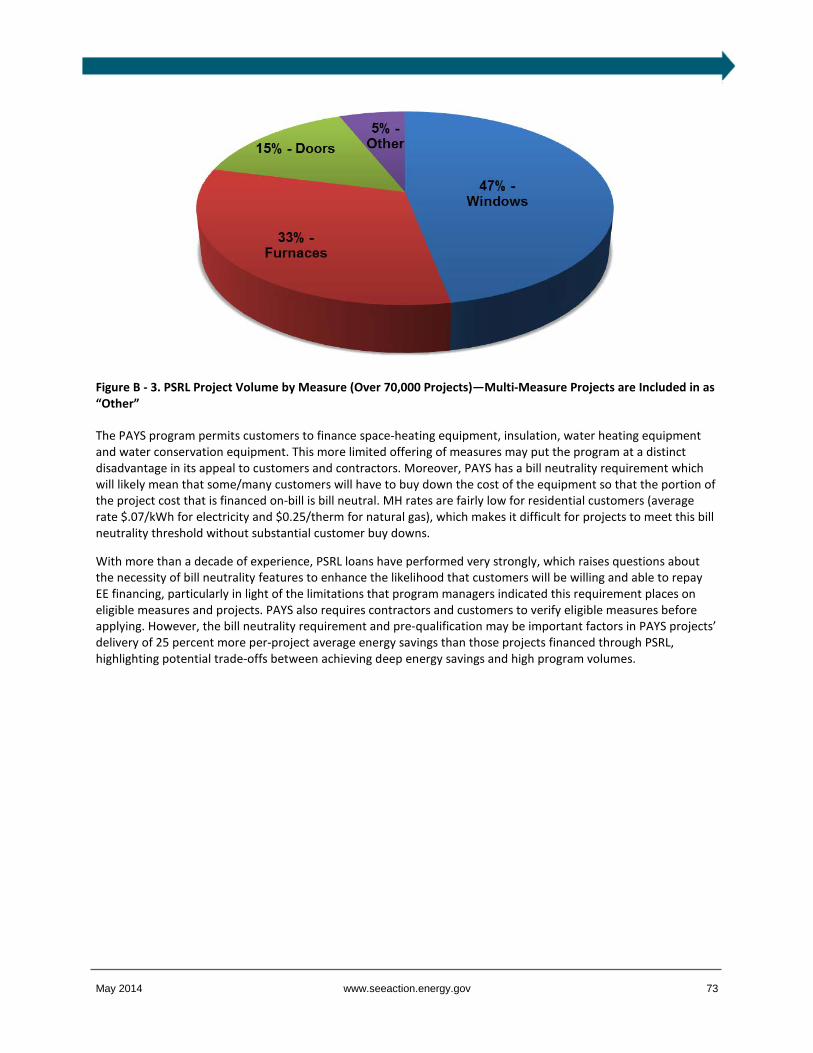
May 2014 www.seeaction.energy.gov 73
Figure B - 3. PSRL Project Volume by Measure (Over 70,000 Projects)—Multi-Measure Projects are Included in as “Other”
The PAYS program permits customers to finance space-heating equipment, insulation, water heating equipment and water conservation equipment. This more limited offering of measures may put the program at a distinct disadvantage in its appeal to customers and contractors. Moreover, PAYS has a bill neutrality requirement which will likely mean that some/many customers will have to buy down the cost of the equipment so that the portion of the project cost that is financed on-bill is bill neutral. MH rates are fairly low for residential customers (average rate $.07/kWh for electricity and $0.25/therm for natural gas), which makes it difficult for projects to meet this bill neutrality threshold without substantial customer buy downs.
With more than a decade of experience, PSRL loans have performed very strongly, which raises questions about the necessity of bill neutrality features to enhance the likelihood that customers will be willing and able to repay EE financing, particularly in light of the limitations that program managers indicated this requirement places on eligible measures and projects. PAYS also requires contractors and customers to verify eligible measures before applying. However, the bill neutrality requirement and pre-qualification may be important factors in PAYS projects’ delivery of 25 percent more per-project average energy savings than those projects financed through PSRL, highlighting potential trade-offs between achieving deep energy savings and high program volumes.

74 www.seeaction.energy.gov May 2014
Table B - 5. Manitoba Hydro PSRL and PAYS Program Summaries
108 EFP’s lifetime volume from July 2002 – March 31, 2013 was 16,781 for $41,346,681. REPL’s lifetime volume from (2002 – December 1, 2013 was 1,160 for $19,500,000. 109 EFP’s 2012 volume was 1,983 for $5,461,460 and REPL’s was 24 for $474,408
PSRL PAYS
Total loans over program life108
(March 2001—March 31, 2013): 70,358 for $290 million
(Nov 2012—March 31 2013): 52 for $224,947
Total loans in 2012109 6,202 for $29 million 52 for $224,947
Default rate 0.48 percent 0 percent--too new for meaningful data
Application Decline Rate 5 percent 6 percent Most declines due to inclusion of ineligible technologies in application. If declined for delinquent payments, applicant can pay off debt and be approved.
Average Project Savings PSRL: 825 kWh Not available
Cumulative Penetration Rate
15 percent 0.01 percent
Market Served Home owners Home owners and tenants
Program Start/End date 2001 November 2012
Interest Rate & Term 4.8 percent fixed for first 5 years. At the end of the term, customer can pay remaining balance or refinance at available market rates. The max term is 5 years except for high efficiency gas furnaces, where it is up to 15 years
3.9 percent fixed for first 5 years. At the end of the term, customer can pay remaining balance or refinance at available market rates. The max term is up to 25 years.
Max/Min Loan Amount $500-$7,500 per residence (max $5,500 for high efficient natural gas furnaces
Limited to bill savings generated
Rebates Available Home Insulation Rebates available - average rebate $900
Home Insulation Rebates available - average rebate $900
Disconnection and Meter Attachment
Loans are subject to the Manitoba Hydro standard collection procedures, including disconnection. Manitoba Hydro will not disconnect service during the winter
Loans are subject to the Manitoba Hydro standard collection procedures, including disconnection. Manitoba Hydro will not disconnect service during the winter
Manitoba Hydro also registers a lien on the property

May 2014 www.seeaction.energy.gov 75
On-Bill Issues and Findings
Disconnection and Meter Attachment
PAYS registers a lien on the property while all others rely on the threat of utility service termination.
In case of non-payment, MH can disconnect a customer’s power, although it is the decision of the collections department. Program administrators are not involved. At 60 days in arrears, an account goes to collections. Thus, delinquency in paying a loan payment means delinquency on the overall utility bill and puts the customer at risk of having their power shut off, although Manitoba Hydro will not shut off power in the winter.
Vacancy, Foreclosure and Transfer
PAYS allows transfers. Only a few have taken place. MH does not track tenancy transfers. The program is still working through some aspects of transfers.
Transfers: Allowed? Process? Requirements?
Not allowed. Property and tenancy transfers allowed.
Property owners must sign a PAYS Owner Assignment and Novation Agreement and the buyer and seller must confirm sale information with program staff. For tenancy transfers, owners are responsible for notifying incoming tenants.
Property and tenancy changes involving OBF transfers
Not applicable The PAYS program does not track tenancy changes
Source(s) of Capital Internally borrowed funds Internally borrowed funds
Underwriting Requirements
• 10 out of 12 of the previous monthly energy bills have been paid in full
• No disconnect notices • No checks returned for insufficient
funds • No record of bankruptcy • Applicant has been fully employed
for a year • Monthly payments associated with
other financial obligations do not exceed 40 percent of the gross family income
• Building is insured
• Utility bill payment history • Customer is not currently in arrears • No record of bankruptcy in the last
36 months • Building is insured
Eligible measures Windows and doors, space heating equipment natural gas furnace, insulation, air leakage sealing, ventilation, water heating equipment.
Space heating equipment, insulation and water heating & water conservation

76 www.seeaction.energy.gov May 2014
For tenancy transfers, building owners are responsible for notifying incoming tenants of the loan. Other than requiring notification, MH is not involved the process. Only one incoming tenant has complained of not being notified. MH intake staff explained the situation to the customer’s satisfaction. In cases of vacancy, whoever assumes utility account responsibility assumes loan repayment responsibility.
For property transfers, owners must fill out a PAYS Owner Assignment and Novation Agreement, the seller and buyer must confirm sale information with MH, and loan staff verifies buyer/seller names and legal possession date. Because the lien placed on the property is subordinate only to the first mortgage, the buyer must obtain a postponement to ensure a new mortgage is senior to the lien. The buyer must pay an $80 fee to postpone the lien.
Staff notes that real estate listings are beginning to advertise efficiency improvements. However, MH’s energy rates are relatively low and annual savings from upgrades are modest as a consideration in a home purchase. Most participants clear their loans before sale.
Split Incentives
In sub-metered buildings, owners can take out loans to be paid by tenants but must obtain tenant consent.
Underwriting
PSRL, EFP and REPL use the same underwriting criteria, which is primarily bill payment with additional criteria as backup.110 For PAYS, applicants with an insured building, no bankruptcies in the previous 3 years and no current arrears qualify.
Bill Neutrality
Enacting legislation requires PAYS loans be bill neutral. MH does not track realized savings to compare with estimated savings.
Staff acknowledges that the bill neutrality requirement combined with low natural gas and electricity prices limits the amount that can be financed. Participants have the ability to buy down any costs beyond the amount that MH will finance, although PAYS participants generally don’t have the cash to do that.
Billing Systems
PSRL did not require billing system upgrades. PAYS required many small, incremental changes that, except for one, MH made over the 5-month launch period. Nonetheless, program managers note that the costs of the incremental IT upgrades were significant.
Lending Regulations
Not applicable.
Results and Future Plans
Since 2001, MH’s on-bill programs have extended nearly 90,000 loans for over $350 million, with PSRL maintaining a low default rate (less than 0.5 percent). PAYS started in November 2012 and has since completed over 50 loans extending under $250,000.
110 Applicants must have paid 10 of the previous 12 months of utility bills in full, be employed full-time for a year, have a DTI <40 percent, have their building insured and have no disconnections, bankruptcies or checks returned for insufficient funds.

May 2014 www.seeaction.energy.gov 77
In September 2013, Manitoba Hydro launched an on-bill financing program for the commercial sector: the Power Smart for Business PAYS Financing Program. It offers 5.6 percent interest rate loans for ten to 25 years for efficiency upgrades such as efficient lighting, boilers and includes water efficiency measures such as efficient toilets. This is MH’s first financing product targeted to the commercial sector and is open to government building administrators, too.
Resources • Power Smart Residential
Loan: http://www.hydro.mb.ca/your_home/power_smart/residential_loan/index.shtml
• Energy Finance Plan: http://www.hydro.mb.ca/customer_services/financial_programs/energy_finance_plan.shtml
• Pay As You Save program: http://www.hydro.mb.ca/your_home/power_smart/pays/index.shtmlResidential Earth Power Loan Program: http://www.hydro.mb.ca/your_home/geothermal_heat_pumps/loan.shtml

This document was developed as a product of the State and Local Energy Efficiency Action Network (SEE Action), facilitated by the U.S. Department of Energy/U.S. Environmental Protection Agency. Content does not imply an endorsement by the individuals or organizations that are part of SEE Action working groups, or reflect the views, policies, or otherwise of the federal government.