financing catastrophe losses amid a financial catastrophe a growing challenge robert p. hartwig,...
TRANSCRIPT

Financing Catastrophe Losses Amid a Financial
Catastrophe A Growing Challenge
Robert P. Hartwig, Ph.D., CPCU, PresidentInsurance Information Institute 110 William Street New York, NY 10038
Tel: (212) 346-5520 [email protected] www.iii.org
National Hurricane Center Conference Austin, TXDownload:
http://www.iii.org/media/presentations/nhccats/April 10, 2009

Presentation Outline
• Top 10 Changes Facing Catastrophe Financing Due Financial Crisis
• Financial Crisis & The Weakening Global Economy: Insurance Impacts
• Capital & Capacity• Financial Strength & Ratings: Recent Trends & Changes• Banks & Insurers: Key Differences in Risk Management• P/C Insurance Industry Overview & Outlook
• Profitability• Premium Growth• Underwriting Performance• Financial Market Impacts
• Regulatory Response to Crisis• Systemic Risk & the Emerging Blueprint of Regulatory Overhaul
• Investment in Mitigation: A Way to Preserve Capital

Top 10 Changes in the Financing of Catastrophic Loss
1. Capital Has Become Much More Scarce• Though still adequate, existing US p/c capital base shrank by an estimated 16% as of year-
end 2008 from Q3:07 peak; Global (re)insurance impacted as well as recent deal with Buffett deal with Swiss Re indicates.
• Speed with which any given amount of capital can be raised has slowed
2. Capital Has Become More Expensive• Scarcity and volatility have driven cost of capital higher• More competition on the open market for the limited amount of capital available
3. Investment Earnings Can Offset Only a Smaller Share of Catastrophe Losses• Low interest rates, poor equity market performance, write downs eat into returns
4. Alternative Sources of Capital Have Dried-Up• E.g., hedge fund, private equity money is far less available
5. Catastrophe Bonds Cannot Be Assumed to Be Uncorrelated With Tradition Financial Market Risk• Example of Willow Re (failed to fully meet Feb. 2 interest payment due to Lehman’s failure
which caused a total return swap to become worthless, exposing investor principal and interest to market risk); A.M. Best concerned about 3 other Lehman-backed bonds from Ajax Re , Newton Re & Carillon Re
• Will result in changes in how such instruments are funded and investments held

Top 10 Changes in the Financing of Catastrophic Loss
6. State Run Residual Markets Are More Vulnerable Due to Shaky Financing Arrangements• FL’s situation is more precarious than ever & growing; Threatens state’s finances• States using assessment mechanism as zero cost lines of credit (e.g., Texas) creating a high
opportunity cost for insurers without fixing state’s fiscal exposure
7. Economics of Start-Ups and Take-Out Companies in CAT Zones Becomes Less Compelling Due to Higher Cost of Capital• Harder to raise cash• Tougher to meet target ROI as cost of capital rises
8. Financial Services Regulatory Overhaul Will Change How the Business of Insurance Is Regulated• Unclear how this will affect how cat loss is financed• Nat Cat legislation is not (currently) part of the overhaul discussion• Systemic Risk Regulator: What are p/c systemic risk points? (CAT exposure?; Guaranty Funds?)• Will be impacts on sources of capital as well (e.g., hedge funds)
9. Federal Government is Fiscally Constrained Can/would federal play a bigger role in financing CAT risk? Fed backstops to be sought?
10. Return on Investment for Mitigation is Greatly Increased Investments in mitigation provide a guaranteed high rate of return: up to 500% Mitigation preserves and conserves scarce private capital and government resources

THE ECONOMIC STORM
What a Weakening Economy and Financial Crisis Mean for the
Insurance Industry
Macroeconomic Forces Not a Major Influence

3.7
%
0.8
% 1.6
% 2.5
% 3.6
%
3.1
%
2.9
%
0.1
%
4.8
%
4.8
%
0.9
%
2.8
%
-0.5
%
-2.0
%
0.5
% 1.8
%
2.3
%
2.8
%
2.9
%
3.1
%
-5.3%-6.3%
-0.2%
-8%
-6%
-4%
-2%
0%
2%
4%
6%
2
00
0
2
00
1
2
00
2
2
00
3
2
00
4
2
00
5
2
00
6
07
:1Q
07
:2Q
07
:3Q
07
:4Q
08
:1Q
08
:2Q
08
:3Q
08
:4Q
09
:1Q
09
:2Q
09
:3Q
09
:4Q
10
:1Q
10
:2Q
10
:3Q
10
:4Q
US Real GDP Growth*
*Yellow bars are Estimates/Forecasts from Blue Chip Economic Indicators.Source: US Department of Commerce, Blue Economic Indicators 3/09; Insurance Information Institute.
Recession began in December 2007. Economic toll of credit crunch, housing
slump, labor market contraction is growing
The Q4:2008 decline was the steepest since the
Q1:1982 drop of 6.4%

Real GDP By Market 2007-2010F(% change from previous year)
2.6%
2.0%
2.0% 3.
0%
11.9
%
0.7% 1.0%
-0.7
%
1.3%
0.7%
9.0%
-2.1
%
-2.5
%
-4.1
% -2.6
%
-2.7
%
6.8%
0.9%
1.0%
0.9% 1.
9%
0.8%
8.0%
2.6%
-6%
-4%
-2%
0%
2%
4%
6%
8%
10%
12%
14%
Euro Area Germany Japan US UK China
2007 2008E 2009F 2010F
Source: Blue Chip Economic Indicators, 3/10/09 edition.
All major economies except China and Brazil are in recession.
Steep declines in GDP will negatively impact exposure growth on a global scale

Length of US Recessions,1929-Present*
43
13
811 10
810 11
16
6
16
8 8
17
0
5
10
15
20
25
30
35
40
45
50
Aug.1929
May1937
Feb.1945
Nov.1948
July1953
Aug.1957
Apr.1960
Dec.1969
Nov.1973
Jan.1980
Jul.1981
Jul.1990
Mar.2001
Dec.2007
* As of April 2009, inclusive
Sources: National Bureau of Economic Research; Insurance Information Institute.
Current recession began in Dec. 2007 and is already the longest since 1981. If is now tied for the longest recession since the Great Depression.
Months in Duration
“We will rebuild. We will recover.”
--President Barack Obama addressing a joint session
of Congress
February 24, 2009

5.2%
-0.9
%-7
.4%
-6.5
%-1
.5%
1.8%
4.3%
18.6
%20
.3%
5.8%
0.3%
-1.6
%-1
.0%
-1.8
%-1
.0%
3.1%
1.1%
0.8%
0.4%
0.6%
-0.4
%-0
.3%
1.6%
5.6%
13.7
%7.
7%1.
2%-2
.9% -0
.5%
-3.8
%-4
.2%
1.7%
-10%
-5%
0%
5%
10%
15%
20%
25%7
87
98
08
18
28
38
48
58
68
78
88
99
09
19
29
39
49
59
69
79
89
90
00
10
20
30
40
50
60
70
8E
09
F
Rea
l N
WP
Gro
wth
-4%
-2%
0%
2%
4%
6%
8%
Rea
l G
DP
Gro
wth
Real NWP Growth Real GDP
Real GDP Growth vs. Real P/C Premium Growth: Modest Association
P/C insurance industry’s growth is influenced modestly by growth
in the overall economy
Sources: A.M. Best, US Bureau of Economic Analysis, Blue Chip Economic Indicators, 2/09; Insurance Information Inst.

Capital/Policyholder
Surplus
Shrinkage, but Capital is Within Historic Norms

$0
$50
$100
$150
$200
$250
$300
$350
$400
$450
$500
$550
75 76 77 78 79 80 81 82 83 84 85 86 87 88 89 90 91 92 93 94 95 96 97 98 99 00 01 02 03 04 05 06 07 08
U.S. Policyholder Surplus: 1975-2008*
Source: A.M. Best, ISO, Insurance Information Institute. *As of 12/31/08
$ B
illi
ons
“Surplus” is a measure of underwriting capacity. It is analogous to “Owners Equity” or “Net Worth” in non-insurance organizations
Actual capacity as of 12/31/08 was $455.6, down 12.0% from 12/31/07 at $517.9B, but still 60% above its 2002 trough. Recent peak was $521.8 as of 9/30/07. Surplus
as of 12/31/08 is 12.7% below 2007 peak.
The premium-to-surplus ratio stood at $0.95:$1 at year end 2008, up from
near record low of $0.85:$1 at year-end 2007
13

Policyholder Surplus, 2006:Q4 – 2008:Q4
$ Billions
$487.1$496.6
$512.8$521.8
$478.5
$455.6
$505.0$515.6
$517.9
$420
$440
$460
$480
$500
$520
$540
06:Q4 07:Q1 07:Q2 07:Q3 07:Q4 08:Q1 08:Q2 08:Q3 08:Q4
Source: ISO.
Declines Since 2007:Q3 Peak
Q2: -$16.6B (-3.2%) Q3: -$43.3B (-8.3%)
Q4: -$66.2 (-12.0%)
Capacity peaked at $521.8 as of 9/30/07
14

Premium-to-Surplus Ratios Before Major Capital Events*
$1.65
$1.42 $1.40
$1.03$0.95$0.88
$1.05$1.15
$0.5
$0.7
$0.9
$1.1
$1.3
$1.5
$1.7
$1.9
6/3
0/1
98
9H
urr
ica
ne
Hu
go
6/3
0/1
99
2H
urr
ica
ne
An
dre
w
12
/31
/93
No
rth
rid
ge
Ea
rth
qu
ak
e
6/3
0/0
1S
ep
t. 1
1A
tta
ck
s
6/3
0/0
4F
lori
da
Hu
rric
an
es
6/3
0/0
5H
urr
ica
ne
Ka
trin
a
6/3
0/0
7F
ina
nc
ial
Cri
sis
As
of
12
/31
/08
**
*Ratio is for end of quarter immediately prior to event. Date shown is end of quarter prior to event. **Latest availableSource: PCS; Insurance Information Institute.
P/C insurance industry was better capitalized going into the
financial crisis than before any “capital event” in recent history
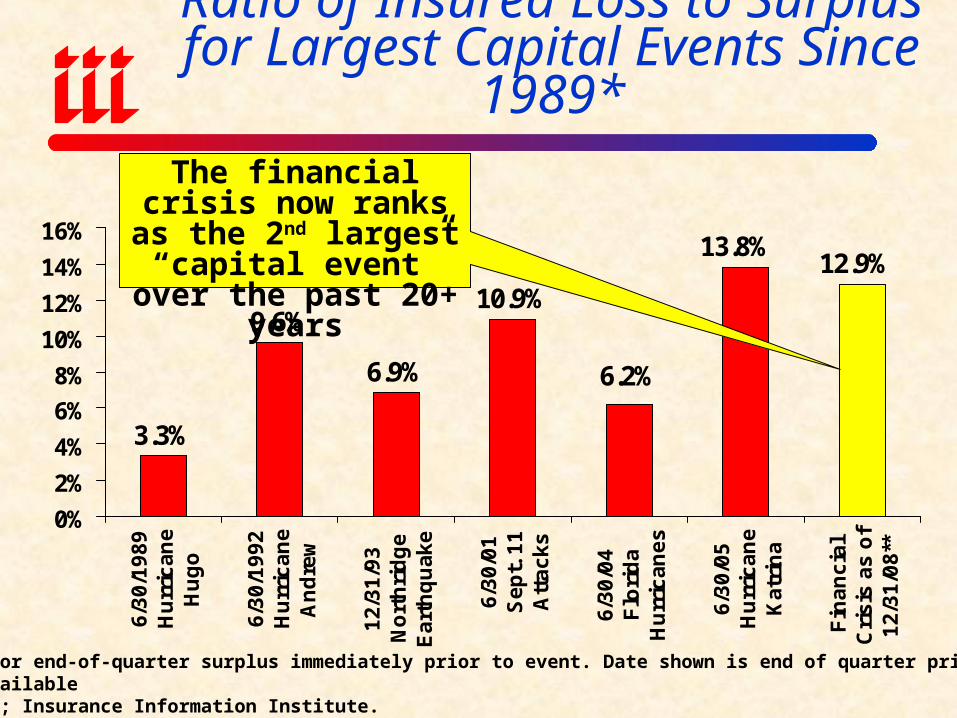
Ratio of Insured Loss to Surplus for Largest Capital Events Since 1989*
3.3%
9.6%
6.9%
10.9%12.9%
13.8%
6.2%
0%
2%
4%
6%
8%
10%
12%
14%
16%
6/3
0/1
98
9H
urr
ica
ne
Hu
go
6/3
0/1
99
2H
urr
ica
ne
An
dre
w
12
/31
/93
No
rth
rid
ge
Ea
rth
qu
ak
e
6/3
0/0
1S
ep
t. 1
1A
tta
ck
s
6/3
0/0
4F
lori
da
Hu
rric
an
es
6/3
0/0
5H
urr
ica
ne
Ka
trin
a
Fin
an
cia
lC
ris
is a
s o
f1
2/3
1/0
8**
*Ratio is for end-of-quarter surplus immediately prior to event. Date shown is end of quarter prior to event. **Latest availableSource: PCS; Insurance Information Institute.
The financial crisis now ranks as the 2nd largest “capital event” over the
past 20+ years

New Funds Contributing to US Policyholder Surplus, 2005-2008
$ Billions
$14.4
$3.8 $3.2
$11.2
$0.0
$2.0
$4.0
$6.0
$8.0
$10.0
$12.0
$14.0
$16.0
05 06 07 08*
*Through Q4 2009 (latest available).Source: ISO; Insurance Information Institute
New funds entering the p/c insurance industry is up in 2008, but swamped by amount eroded away

FINANCIAL STRENGTH &
RATINGS Industry Has Weathered
the Storms Well

P/C Insurer Impairments,1969-2008
81
51
27
11
93
49
13
12
19
91
61
41
33
64
93
1 34
50
48
55
60
58
41
29
16
12
31
18 19
49 50
47
35
18
14 15
75
0
10
20
30
40
50
60
70
69
70
71
72
73
74
75
76
77
78
79
80
81
82
83
84
85
86
87
88
89
90
91
92
93
94
95
96
97
98
99
00
01
02
03
04
05
06
07
08
The number of impairments varies significantly over the p/c insurance cycle,
with peaks occurring well into hard markets
Source: A.M. Best; Insurance Information Institute

P/C Impairment Frequency vs. Catastrophe Points in Combined Ratio, 1977-2008
0
2
4
6
8
10
12
14
16
77 78 79 80 81 82 83 84 85 86 87 88 89 90 91 92 93 94 95 96 97 98 99 00 01 02 03 04 05 06 07 08
Cat
astr
op
he
Po
ints
on
Co
mb
ined
Rat
io
0.0
0.2
0.4
0.6
0.8
1.0
1.2
1.4
1.6
1.8
2.0
Imp
airm
ent R
ate
Catastrophe Points in Combined RatioP/C Impairment Frequency
Impairment rates are highly
correlated with underwriting
performance and reached record lows in 2007/08
Source: A.M. Best, PCS; Insurance Information Institute
2008 impairment rate was a record low 0.23%, second only to the 0.17% record low in 2007 and barely one-fourth the 0.82% average since 1969

P/C Insurer Impairment Frequency vs. Combined Ratio, 1969-2008
90
95
100
105
110
115
120
69 70 71 72 73 74 75 76 77 78 79 80 81 82 83 84 85 86 87 88 89 90 91 92 93 94 95 96 97 98 99 00 01 02 03 04 05 06 07
Co
mb
ined
Rat
io
0.0
0.2
0.4
0.6
0.8
1.0
1.2
1.4
1.6
1.8
2.0
Imp
airm
ent R
ate
Combined Ratio after DivP/C Impairment Frequency
Impairment rates are highly
correlated with underwriting
performance and reached record lows in 2007/08
Source: A.M. Best; Insurance Information Institute
2008 impairment rate was a record low 0.23%, second only to the 0.17% record low in 2007 and barely one-fourth the 0.82% average since 1969

Number of Impairments by State, 1969-2008
22 22 21 20 17 15 15 15 15 14 14 13 11 10 9 9 8 8 6 6 6 6 6 5 5 5 5 5 5 5 4 4 4 3 3 3 2 2 2 2 1 1 0
4166
22242533
63
9691
73
140
0
20
40
60
80
100
120
140
160
TX FL CA IL NY
PA LA MO
OK
OH AZ IN NJ
GA NE
WI
DE
MA
MD
SC
CO TN PR RI
HI
KY MI
NC
WV AL
DC UT
VA
WA IA KS
MN
MS
MT
NM OR
SD VI
WY
AR CT
VT
AK
ME
NH
NV
GU ID ND
No.
of I
mpa
irmen
ts
TX, FL and CA have the largest number of impairments.
Catastrophe risk plays a big role. Other factors influencing
impairments include the political environment and business mix
Source: A.M. Best; Insurance Information Institute

Summary of A.M. Best’s P/C Insurer Ratings Actions in 2008*
Under Review, 63 , 4.3%
Upgraded, 59 , 4.0%
Initial, 41 , 2.8%
Other, 59 , 4.0%
Affirm, 1,183 , 81.0%
Downgraded, 55 , 3.8%
*Through December 19.Source: A.M. Best.
30
Despite financial market turmoil, high cat losses and a soft market in 2008, 81% of ratings actions by A.M. Best
were affirmations; just 3.8% were downgrades
and 4.0% upgrades
P/C insurance is by design a resilient in business. The dual threat of financial
disasters and catastrophic losses are
anticipated in the industry’s risk
management strategy.

Historical Ratings Distribution,US P/C Insurers, 2008 vs. 2005 and 2000
Source: A.M. Best: Rating Downgrades Slowed but Outpaced Upgrades for Fourth Consecutive Year, Special Report, November 8, 2004 for 2000; 2006 and 2009 Review & Preview. *Ratings ‘B’ and lower.
A/A-48.4%
D0.2%C++/C+
1.9%
E/F2.3% A++/A+
11.5%
C/C-0.6%
B++/B+28.3%
B/B-6.9%
2008 2005
P/C insurer financial strength has improved since 2005 despite financial crisis
A/A-52.3%
A++/A+9.2%
B++/B+26.4%
Vulnerable*12.1%
A/A-60.0%
A++/A+10.8%
B++/B+21.3%
Vulnerable*7.9%
2000A++/A+ and A/A- gains

Reasons for US P/C Insurer Impairments, 1969-2008
Source: A.M. Best: 1969-2008 Impairment Review, Special Report, Apr. 6, 2008
Deficient loss reserves and inadequate
pricing are the leading cause of
insurer impairments,
underscoring the importance of
discipline. Investment
catastrophe losses play a much smaller role.
Reinsurance Failure3.7%
Rapid Growth14.3%
Misc.9.1%
Affiliate Impairment
7.9%
Sig. Change in Business
4.2%
Deficient Loss
Reserves/In-adequate Pricing38.1%
Investment Problems
7.0%
Alleged Fraud8.1%
Catastrophe Losses7.6%
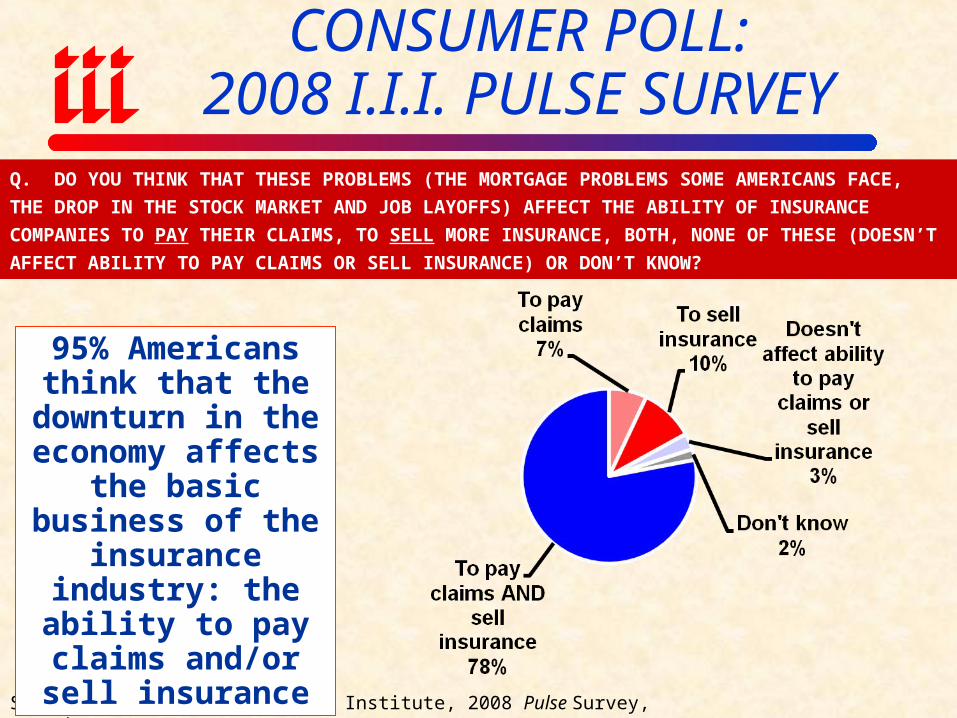
CONSUMER POLL:2008 I.I.I. PULSE SURVEY
Source: Insurance Information Institute, 2008 Pulse Survey, November 2008.
Q. DO YOU THINK THAT THESE PROBLEMS (THE MORTGAGE PROBLEMS SOME AMERICANS FACE,
THE DROP IN THE STOCK MARKET AND JOB LAYOFFS) AFFECT THE ABILITY OF INSURANCE
COMPANIES TO PAY THEIR CLAIMS, TO SELL MORE INSURANCE, BOTH, NONE OF THESE (DOESN’T
AFFECT ABILITY TO PAY CLAIMS OR SELL INSURANCE) OR DON’T KNOW?
95% Americans think that the downturn in the economy affects the basic business of
the insurance industry: the ability to pay claims and/or
sell insurance

Critical Differences Between P/C
Insurers and BanksSuperior Risk Management Model
& Low Leverage Makea Big Difference

How Insurance Industry Stability Has Benefitted Consumers
BOTTOM LINE:• Insurance Markets—Unlike Banking—Are Operating
Normally• The Basic Function of Insurance—the Orderly Transfer
of Risk from Client to Insurer—Continues Uninterrupted• This Means that Insurers Continue to:
Pay claims (whereas 43 banks have gone under as of 3/31) The Promise is Being Fulfilled
Renew existing policies (banks are reducing and eliminating lines of credit)
Write new policies (banks are turning away people who want or need to borrow)
Develop new products (banks are scaling back the products they offer)
Source: Insurance Information Institute36

• Emphasis on Underwriting Matching of risk to price (via experience and modeling) Limiting of potential loss exposure Some banks sought to maximize volume and fees and disregarded risk
• Strong Relationship Between Underwriting and Risk Bearing Insurers always maintain a stake in the business they underwrite, keeping “skin in the game”
at all times Banks and investment banks package up and securitize, severing the link between risk
underwriting and risk bearing, with (predictably) disastrous consequences—straightforward moral hazard problem from Econ 101
• Low Leverage Insurers do not rely on borrowed money to underwrite insurance or pay claimsThere is no
credit or liquidity crisis in the insurance industry• Conservative Investment Philosophy
High quality portfolio that is relatively less volatile and more liquid• Comprehensive Regulation of Insurance Operations
The business of insurance remained comprehensively regulated whereas a separate banking system had evolved largely outside the auspices and understanding of regulators (e.g., hedge funds, private equity, complex securitized instruments, credit derivatives—CDS’s)
• Greater Transparency Insurance companies are an open book to regulators and the public
Source: Insurance Information Institute37
Reasons Why P/C Insurers Have Fewer Problems Than Banks:
A Superior Risk Management Model
P/C INSURANCE FINANCIAL
PERFORMANCE
A Resilient Industry in Challenging Times
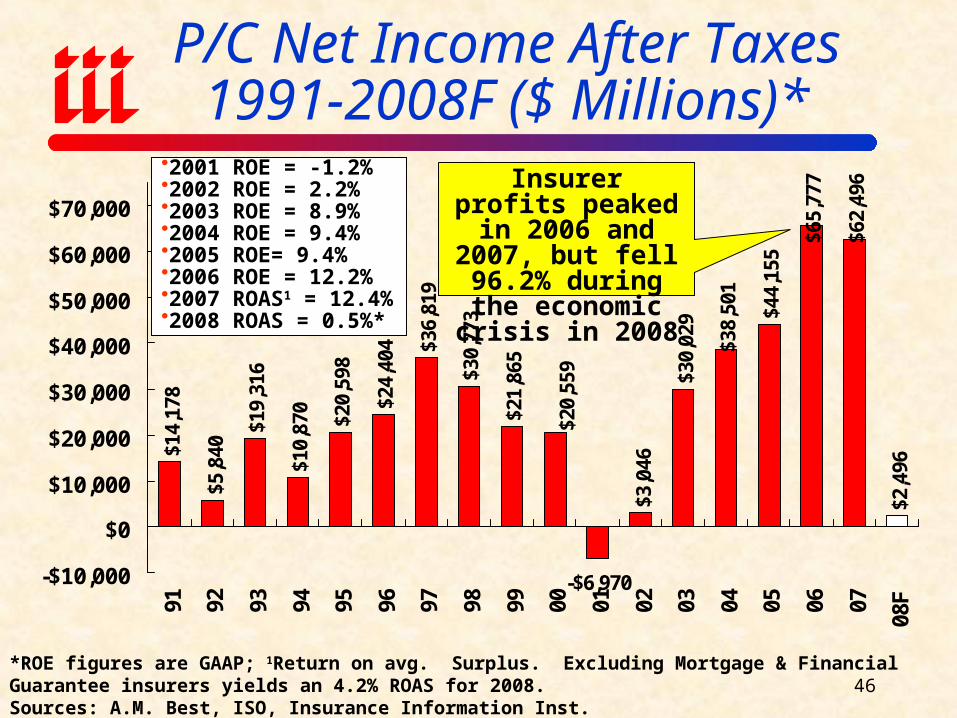
P/C Net Income After Taxes1991-2008F ($ Millions)*
$14,
178
$5,8
40
$19,
316
$10,
870
$20,
598
$24,
404 $3
6,81
9
$30,
773
$21,
865
$3,0
46
$30,
029
$62,
496
$2,4
96
-$6,970
$65,
777
$44,
155
$20,
559
$38,
501
-$10,000
$0
$10,000
$20,000
$30,000
$40,000
$50,000
$60,000
$70,000
91 92 93 94 95 96 97 98 99 00 01 02 03 04 05 06 07
08F
*ROE figures are GAAP; 1Return on avg. Surplus. Excluding Mortgage & Financial Guarantee insurers yields an 4.2% ROAS for 2008.Sources: A.M. Best, ISO, Insurance Information Inst.
2001 ROE = -1.2%2002 ROE = 2.2%2003 ROE = 8.9%2004 ROE = 9.4%2005 ROE= 9.4%2006 ROE = 12.2%2007 ROAS1 = 12.4%2008 ROAS = 0.5%*
Insurer profits peaked in 2006 and 2007, but fell 96.2% during the economic
crisis in 2008
46

-2%
0%
2%
4%
6%
8%
10%
12%
14%
16%
18%
20%
22%
24%
1971
1972
1973
1974
1975
1976
1977
1978
1979
1980
1981
1982
1983
1984
1985
1986
1987
1988
1989
1990
1991
1992
1993
1994
1995
1996
1997
1998
1999
2000
2001
2002
2003
2004
2005
2006
2007
2008
2009
F
Sources: A.M. Best (historical and forecast), ISO, Insurance Information Institute
Strength of Recent Hard Marketsby NWP Growth
1975-78 1984-87 2000-03Shaded areas denote “hard
market” periods
Net written premiums fell 1.0%
in 2007 (first decline since 1943)
and by 1.4% in 2008, the first back-
to-back decline since 1930-33
50

Investment Performance
Investments are the Principle Source of Declining
Profitability

Property/Casualty Insurance Industry Investment Gain:1994- 20081
$ Billions
$35.4
$42.8$47.2
$52.3
$44.4
$36.0
$45.3$48.9
$59.4$55.7
$64.0
$31.4
$56.9$51.9
$57.9
$0
$10
$20
$30
$40
$50
$60
1Investment gains consist primarily of interest, stock dividends and realized capital gains and losses. 2006 figure consists of $52.3B net investment income and $3.4B realized investment gain. *2005 figure includes special one-time dividend of $3.2B.Sources: ISO; Insurance Information Institute.
Investment gains fell by 51% in 2008 due to lower yields, poor
equity market conditions
55

P/C Insurer Net Realized Capital Gains, 1990-2008
$2.88$4.81
$9.89
$1.66
$6.00
$9.24$10.81
$13.02
$16.21
$6.63
-$1.21
$6.61$8.92
-$19.80
$18.02
$3.52
$9.70$9.13$9.82
-$20-$18-$16-$14-$12-$10-$8-$6-$4-$2$0$2$4$6$8
$10$12$14$16$18$20
90 91 92 93 94 95 96 97 98 99 00 01 02 03 04 05 06 07 08
Sources: A.M. Best, ISO, Insurance Information Institute.
Realized capital losses hit a record $19.8 billion in 2008 due to financial market turmoil, a $27.7 billion swing
from 2007. This is the primary cause of 2008’s large drop in profits and ROE.
$ Billions
56
Underwriting Trends
Financial Crisis Does Not Directly Impact Underwriting
Performance: Cycle, Catastrophes Were 2008’s Drivers

115.8
107.5
100.198.4
100.8
92.6
101
105.1
101.0
95.7
90
100
110
120
2001 2002 2003 2004 2005 2006 2007 2008 2008* 2009F
P/C Insurance Industry Combined Ratio, 2001-2009E
*Includes Mortgage & Financial Guarantee insurers. Sources: A.M. Best.
Best combined ratio since 1949
(87.6)
As recently as 2001, insurers paid out nearly $1.16 for every
$1 in earned premiums
Relatively low CAT
losses, reserve releases
Including Mortgage
& Fin. Guarantee insurers
Cyclical Deterioration
61
2005 ratio benefited from heavy use of reinsurance which lowered net losses

-55-50-45-40-35-30-25-20-15-10-505
101520253035
75
76
77
78
79
80
81
82
83
84
85
86
87
88
89
90
91
92
93
94
95
96
97
98
99
00
01
02
03
04
05
06
07
08
Source: A.M. Best, ISO; Insurance Information Institute * Includes mortgage & finl. guarantee insurers
$ B
illi
ons
Insurers earned a record underwriting profit of $31.7B in 2006 and $19.3B in 2007, the largest ever but only the 2nd and 3rd since 1978. Cumulative underwriting deficit from
1975 through 2008 is $442B.
Underwriting Gain (Loss)1975-2008*
$19.799 Bill underwriting loss in 2008
incl. mort. & FG insurers
62

Catastrophe Losses
Impacting Underwriting Results and the Bottom Line

U.S. Insured Catastrophe Losses*$7
.5
$2.7
$4.7
$22.
9
$5.5 $1
6.9
$8.3
$7.4
$2.6 $1
0.1
$8.3
$4.6
$26.
5
$5.9 $1
2.9 $2
7.5
$6.7
$26.
0$1
00.0
$61.
9
$9.2
$0
$20
$40
$60
$80
$100
$120
89 90 91 92 93 94 95 96 97 98 99 00 01 02 03 04 05 06 07
08**
20??
*Excludes $4B-$6b offshore energy losses from Hurricanes Katrina & Rita.**Based on PCS data through Dec. 31. PCS $2.1B loss of for Gustav. $10.655B for Ike of 12/05/08.Note: 2001 figure includes $20.3B for 9/11 losses reported through 12/31/01. Includes only business and personal property claims, business interruption and auto claims. Non-prop/BI losses = $12.2B.Source: Property Claims Service/ISO; Insurance Information Institute
$ Billions2008 CAT losses exceeded
2006/07 combined. 2005 was by far the worst year ever for
insured catastrophe losses in the US, but the worst has yet to come.
$100 Billion CAT year is coming soon
70

Number of PCS Catastrophe Events, 1998-2008*
$ Billions
37
27
24
20
24
33
23
37
2221
25
15
20
25
30
35
40
98 99 00 01 02 03 04 05 06 07 08*PCS defines a catastrophe as an even that caused at least $25 million in insured property damage andaffects and significant number of policyholders and insurers.Source: PCS; Insurance Information Institute
The number of catastrophe events
reached a 10-year high in 2008

Share of Losses Paid by Reinsurers, by Disaster*
30%25%
60%
20%
45%40%
0%
10%
20%
30%
40%
50%
60%
70%
Hurricane Hugo(1989)
HurricaneAndrew (1992)
Sept. 11 TerrorAttack (2001)
2004 HurricaneLosses
2005 HurricaneLosses
Hurricane Ike*(2008)
*Excludes losses paid by the Florida Hurricane Catastrophe Fund, a FL-only windstorm reinsurer, which was established in 1994 after Hurricane Andrew. FHCF payments to insurers are estimated at $3.85 billion for 2004 and $4.5 billion for 2005. Ike share is an estimate as of 2/9/09.Sources: Wharton Risk Center, Disaster Insurance Project; Insurance Information Institute.
Reinsurance is playing an increasingly important role in the financing of mega-CATs

Number of U.S. Significant Natural Catastrophes*,1950 –
2008$1 billion economic loss and/or 50 fatalities
Sources: Munich Re NatCatSERVICE *$1 billion economic loss and/or 50 fatalities.
There is a clear upward trend in the number of
significant natural catastrophes in the US

Natural Catastrophes in 2008 by Type and Location
Geophysical (earthquake, tsunami, volcanic)
Meteorological (storm)
Hydrological (flood, mass movement)
Climatological (extreme temperature, drought, wildfire)
Significant loss events
750 natural hazard losses events
Great natural catastrophesHurricane Ike ( Sept. 6-14, 2008) Caribbean, USACyclone Nargis (May 2-5, 2008) Myanmar
Earthquake (May 12, 2008) China
Winter damage (Jan 10–Feb 13, 2008) China
Source: 2009 Münchener Rückversicherungs-Gesellschaft, Geo Risk Research, NatCatSERVICE As of January 2009
Energy sector was impacted significantly by catastrophes in 2008: Ike, European
Wind/Winter Storms, China Earthquake

200
400
600
800
1 000
1 200
1980 1982 1984 1986 1988 1990 1992 1994 1996 1998 2000 2002 2004 2006 2008
Number of Natural Catastrophes Worldwide, 1980 - 2008
Number of events
Nu
mb
er
Climatological events (Extreme temperature, drought, forest fires)
Hydrological events (Flood, mass movement)
Meteorological events(Storm)
Geophysical events (Earthquake, tsunami, volcanic eruption)
Source: 2009 Münchener Rückversicherungs-Gesellschaft, Geo Risk Research, NatCatSERVICE As of January 2009
The number of natural catastrophes is rising globally. This has significant ramifications for the
energy sector and its insurers

Rising Number of U.S. Landfalling Tropical Cyclones Has Been Very
Costly for Insurers
Source: Munich Re from NOAA
Six tropical cyclones made landfall in the
US in 2008

Total Value of Insured Coastal Exposure (2007, $ Billions)
$2,378.9$895.1
$772.8$635.5
$479.9$224.4
$191.9$158.8$146.9$132.8
$92.5$85.6
$60.6$55.7$51.8$54.1
$14.9
$2,458.6
$0 $500 $1,000 $1,500 $2,000 $2,500 $3,000
FloridaNew York
TexasMassachusetts
New JerseyConnecticut
LouisianaS. Carolina
VirginiaMaine
North CarolinaAlabamaGeorgia
DelawareNew Hampshire
MississippiRhode Island
Maryland
Source: AIR Worldwide
In 2007, Florida still ranked as the #1 most exposed state to hurricane loss, with $2.459 trillion exposure, an increase of $522B or 27% from
$1.937 trillion in 2004.
The insured value of all coastal property was $8.9 trillion in 2007, up 24% from $7.2 trillion in 2004.
$522B increase since 2004, up 27%
87

State Residual Markets
States Are Piling Up Enormous Liabilities to Subsidize Coastal
Development

U.S. Residual Market Exposure to Loss (Billions of Dollars)
Source: PIPSO; Insurance Information Institute
$54.7
$150.0
$281.8$244.2
$292.0
$372.3$430.5
$684.8$656.7
$221.3
$419.5
$0
$100
$200
$300
$400
$500
$600
$700
$800
1990 1995 1999 2000 2001 2002 2003 2004 2005 2006 2007
Exposure to Loss
Between 1990 and 2007, total exposure to loss in the residual
market (FAIR & Beach/Windstorm) Plans surged from $54.7bn in 1990 to
$684.8bn in 2007.
Investment in Mitigation Offers a Proven High ROI Mitigation is a Means of
Capital Preservation

Institute for Business and Home Safety Fortified Homes
Bolivar Peninsula, Texas, after Hurricane Ike
Photo: Munich Re America 101© 2009 Munich Re Group
Insurance Information Institute On-Line
THANK YOU FOR YOUR TIME AND
YOUR ATTENTION!
Download: http://www.iii.org/media/presentations/nhccats/
114