financiamiento salud global 2011
TRANSCRIPT


This report was prepared by the Institute for Health Metrics and Evaluation (IHME) through core funding from the Bill & Melinda Gates Foundation. The views expressed are those of the authors.
The contents of this publication may be reproduced and redistributed in whole or in part, provided the intended use is for noncommercial purposes, the contents are not altered, and full acknowledgment is given to IHME. This work is licensed under the Creative Commons Attribution-NonCommercial-NoDerivs 3.0 Unported License. To view a copy of this license, please visit http://creativecommons.org/licenses/by-nc-nd/3.0/.
For any usage that falls outside of these license restrictions, please contact IHME Communications at [email protected].
Citation: Institute for Health Metrics and Evaluation. Financing Global Health 2011: Continued Growth as MDG Deadline Approaches. Seattle, WA: IHME, 2011.
Institute for Health Metrics and Evaluation2301 Fifth Ave., Suite 600Seattle, WA 98121USAwww.healthmetricsandevaluation.org
To request copies of this report, please contact:Telephone: +1-206-897-2800Fax: +1-206-897-2899Email: [email protected]
Printed in the United States of America
ISBN 978-0-9840910-4-1
© 2011 Institute for Health Metrics and Evaluation

FINANCING GLOBAL HEALTH 2011: CONTINUED GROWTH AS MDG DEADLINE APPROACHES
PAGE CONTENTS
3 About IHME3 About Financing Global Health 20114 Research team4 Acknowledgments5 Acronyms6 List of figures and tables7 Executive summary9 Introduction
PART ONE: DEVELOPMENT ASSISTANCE FOR HEALTH
12 Chapter 1: Tracking development assistance for health26 Chapter 2: Distribution of development assistance for health
PART TWO: GOVERNMENT HEALTH EXPENDITURE
42 Chapter 3: Spending on health by developing country governments48 Chapter 4: Impact of development assistance for health on country government spending
52 Conclusion54 References63 Statistical annex


ABOUT IHME
The Institute for Health Metrics and Evaluation (IHME) is an independent global health research center at the University of Washington that provides rigorous and comparable measurement of the world’s most impor-tant health problems and evaluates the strategies used to address them. IHME makes this information freely
available so that policymakers have the evidence they need to make informed decisions about how to allocate resources to best improve population health.
For more information, please visit http://www.healthmetricsandevaluation.org.
To help local, national, and international policymakers deploy scarce resources to best improve population health, IHME provides objective, comparable, and comprehensive information in an annual report on the state of global health financing. Now in its third year, Financing Global Health is a key component of IHME’s mission to measure health conditions, assess the performance of societies in meeting health chal-lenges, and maximize the impact of health policies and interventions.
In this year’s report, we analyze two core elements of global health financing, development assistance for health (DAH) and government health expenditure, in the context of the approaching 2015 deadline to reach the Millennium Development Goals (MDGs), eight targets agreed to by the world’s countries and leading development institutions. The MDGs range from halving extreme poverty to halting the spread of HIV/AIDS and providing universal primary education.
��Development assistance for health: IHME tracked every available financial stream to update our esti-mates of DAH from 1990 to 2011. We used data that are current as of 2009. Preliminary estimates for 2010 and 2011 were generated from models and preliminary financial statements obtained directly from some channels of assistance. As with last year’s report, we estimate aggregate flows by source and channel. This year, we improved our estimates of DAH flowing through US-based
non-governmental organizations (NGOs) by collecting additional health expenditure data from some of the largest NGOs. For our analysis of DAH for different health issues, we improved the accuracy of these estimates by incorporating more detailed data about projects’ intended purposes from the World Bank. In addition, we began tracking the Bloomberg Family Foundation’s investments in tobacco reduction initia-tives, which has caused us to revise our estimates of DAH for noncommunicable diseases.
��Government health expenditure: Using data provided by the World Health Organization from 1995 to 2009, we analyzed how much money govern-ments allocate to health, how health sector budgets have changed over time, and how DAH influences government spending on health. Understanding how country spending on health is affected by DAH is particularly important to funders, civil society orga-nizations, and citizens and ministries of health in developing countries.
IHME’s work in global health financing emphasizes the importance of transparency in health funding and the value of sharing data. This report also points out the need to more closely examine disparities in global health funding. In future years, we intend to expand the scope of our research to further examine the relation-ship between DAH and government health spending at the country level, as well as include tracking of out-of-pocket payments by households.
ABOUT FINANCING GLOBAL HEALTH 2011
3

ACKNOWLEDGMENTS
We extend our deepest appreciation to current and former members of the Health Financing Advisory Panel who have provided valuable guidance to our research efforts. The feedback and advice offered by panel chair Sir Richard Feachem and current panel members Peter Berman, Stephen Gloyd, Sanjeev Gupta, Daniel Kress, Simon Scott, Devi Sridhar, and Chunling Wu were critical in shaping our research approach and refining our findings as this series has evolved.
We are grateful to past authors of this report for developing and refining the analytical and theoretical foundation upon which this report is based.
We would like to acknowledge the staff members of the numerous development agencies, public-private partner-ships, international organizations, non-governmental organizations, and foundations who responded to our data requests and questions. We greatly appreciate their time and assistance.
The IHME community contributed greatly from the inception to the completion of this year’s report. In particular, we thank IHME’s Board for their continued leadership, Jill Oviatt and William Heisel for their editorial guidance, Patricia Kiyono and Kate Muller for editing and managing production, Brent Anderson for program coordination, and Rouselle Lavado for her feedback and assistance.
Finally, we would like to extend our gratitude to the Bill & Melinda Gates Foundation for generously funding IHME and for its consistent support of this research and report.
4 INSTITUTE FOR HEALTH METRICS AND EVALUATION
Benjamin PC Brooks, BSPost-Bachelor FellowIHME
David Chou, BAPost-Bachelor FellowIHME
Joseph Dieleman, MAResearch AssistantIHME
Michael Hanlon, PhDLecturerIHME
RESEARCH TEAM(Listed alphabetically)
Katherine Leach-Kemon, MPHData Development ManagerIHME
Christopher JL Murray, MD DPhilInstitute Director and Professor, Global HealthIHME
Matthew Schneider, MPH Post-Bachelor FellowIHME
Annette Tardif, BAData AnalystIHME

5
ADB Asian Development Bank
AfDB African Development Bank
BMGF Bill & Melinda Gates Foundation
DAH Development assistance for health
DAH-G Development assistance for health channeled to governments
DAH-NG Development assistance for health channeled to non-governmental sectors
DALY Disability-adjusted life year
EC European Commission
GAVI GAVI Alliance (formerly the Global Alliance for Vaccines and Immunisation)
GDP Gross domestic product
GFATM Global Fund to Fight AIDS, Tuberculosis and Malaria
GGE General government expenditure
GHE-A Government health expenditure as agent
GHE-S Government health expenditure as source
HIV/AIDS Human immunodeficiency virus/acquired immune deficiency syndrome
IBRD International Bank for Reconstruction and Development
IDA International Development Association
IDB Inter-American Development Bank
IGO Intergovernmental organization
IHME Institute for Health Metrics and Evaluation
IHP+ International Health Partnership and Related Initiatives
IMF International Monetary Fund
MDGs Millennium Development Goals
MNCH Maternal, newborn, and child health
NCD Noncommunicable disease
NGO Non-governmental organization
NHA National Health Accounts
OECD Organisation for Economic Co-operation and Development
OECD-DAC Organisation for Economic Co-operation and Development’s Development Assistance Committee
OECD-CRS Organisation for Economic Co-operation and Development’s Creditor Reporting System
PAHO Pan American Health Organization
PEPFAR US President’s Emergency Plan for AIDS Relief
PMI President’s Malaria Initiative
PPP Public-private partnership
TB Tuberculosis
UK United Kingdom
UN United Nations
UNAIDS Joint United Nations Programme on HIV/AIDS
UNFPA United Nations Population Fund
UNICEF United Nations Children’s Fund
US United States
USAID United States Agency for International Development
VA Verbal autopsy
WHO World Health Organization
ACRONYMS

PAGE FIGURE
12 1 Resource flows for DAH
15 2 DAH by channel of assistance, 1990-2011
18 3 Change in DAH by channel of assistance, 2010-2011
18 4 DAH by source of funding, 1990-2011
20 5 DAH by country of origin, 1990-2011
20 6 DAH as a percentage of gross domestic product, 2009
21 7 Public sector DAH (donor country specific) by channels of assistance, 2009
22 8 Public sector DAH by channels of assistance, 1990-2009
23 9 Bill & Melinda Gates Foundation global health disbursements and commitments, 1999-2011
23 10 Total overseas health expenditure channeled through US NGOs, 1990-2011
26 11 DAH by focus region, 1990-2011
28 12 Top 10 recipients of DAH by percentage received from channels of assistance, 2004-2009
29 13 Total DAH per all-cause DALY, 2004-2009
30 14 Top 30 country recipients of DAH, 2004-2009, compared with top 30 countries by all-cause burden of disease, 2004
31 15 DAH for HIV/AIDS; maternal, newborn, and child health; malaria; health sector support; tuberculosis; and noncommunicable diseases, 1990-2011
32 16 DAH for HIV/AIDS by channel of assistance, 1990-2009
32 17 DAH for HIV/AIDS per related DALY, 2004-2009
34 18 DAH for maternal, newborn, and child health by channel of assistance, 1990-2009
34 19 DAH for maternal, newborn, and child health per related DALY, 2004-2009
35 20 DAH for malaria by channel of assistance, 1990-2009
36 21 DAH for malaria per related DALY, 2004-2009
36 22 DAH for health sector support by channel of assistance, 1990-2009
38 23 DAH for tuberculosis by channel of assistance, 1990-2009
39 24 DAH for tuberculosis per related DALY, 2004-2009
39 25 DAH for noncommunicable diseases by channel of assistance, 1990-2009
40 26 DAH for noncommunicable diseases per related DALY, 2004-2009
45 27 GHE-S by Global Burden of Disease developing region, 1995-2009
46 28 DAH-G by Global Burden of Disease developing region, 1995-2009
47 29 DAH-NG by Global Burden of Disease developing region, 1995-2009
49 30 Relationship between GHE-S and DAH-G in East sub-Saharan Africa, 2006-2007
50 31 Relationship between GHE-S and DAH-G in East sub-Saharan Africa, 2008-2009
PAGE TABLE
14 1 Sources of DAH data
24 2 US NGOs with the highest cumulative overseas health expenditures, 2005-2008
25 3 Summary of health spending by non-US NGOs, 1998-2009
44 4 Data sources used to estimate GHE-S
LIST OF FIGURES AND TABLES
6 INSTITUTE FOR HEALTH METRICS AND EVALUATION

EXECUTIVE SUMMARY
Three years into a worldwide economic slowdown that has threatened the solvency of some governments, it remains uncertain when sustained growth will return to many national economies. In 2010, the Institute for Health Metrics and Evaluation reported there were concerns that the economic crisis would make it even more difficult for developed countries to meet their commitments to fund health programs in developing countries, and perhaps hurt the ability of developing countries to achieve the Millennium Development Goals (MDGs) for improving health in their populations. While there are signs that some donors and countries have started to pull back, overall development assis-tance for health (DAH) and total country spending on health continue to grow.
As with last year’s report, Financing Global Health 2010: Development Assistance and Country Spending in Economic Uncertainty, this year’s edition offers a comprehensive view of trends in public and private financing of health assistance with preliminary esti-mates for health financing in the most recent years. We also detail the trends in spending on health by devel-oping countries and examine how DAH affects that spending.
Key findings of Financing Global Health 2011: Continued Growth as MDG Deadline Approaches include:
Development assistance for health
�� ���� ���� �� �� ��� � ������� ������ ��� �� �� ��slower rate than prior to the recession, to a total of $27.73 billion. DAH from some channels of assis-tance has dropped or stagnated, but other channels showed encouraging signs of faster growth.
�� ���� ��� � ��� ����� �� �� ��� � � � � ����� ���2008. Following the recession, DAH increased 3% from 2008 to 2009, and 4% each year between 2009 and 2011.
�� �� ���������!"��# ���������!�'���* ������-tion and Development accounted for the largest share ($796.77 million) of the expansion in total DAH between 2010 and 2011.
�� �� � ����� ������ �� ���� '���� � � <� �� =� ��over the past decade has slowed to 2% between 2010 and 2011.
�� >�����������? �����'�� ��� ����������Q��X �-mental organizations saw an increase in funding of 8% from 2010 to 2011.
�� =��Q=������ �'����� � � �X �� � � ���� �� �����of DAH ($7.61 billion, or 30%) in 2009, followed by South Asia ($1.85 billion, or 7.2%) and East Asia and the Pacific ($1.48 billion, or 5.8%).
�� ���� � ���� � ����?� ������ ���� � � ����� �� ���have the most significant disease burdens, 12 of the countries with the highest disease burdens, including Russia, Sudan, Myanmar, and Egypt, are not among the countries that receive the most DAH.
�� Z�����������'����#[\�#�=���� �������������� ����sector support slowed between 2008 and 2009. DAH for malaria continued to grow rapidly, increasing by about 50% two years in a row, and growth in DAH for maternal, newborn, and child health and for noncommunicable diseases accelerated between 2008 and 2009.
Government health expenditure
�� �� � ������� '������� ������� �� �� �� �]] ��� �� ��X �slowed total public domestic spending on health. Spending accelerated between 2008 and 2009, increasing from $368.46 billion to $410.50 billion, 16 times the total amount of DAH spent.
�� ^��� ����� �] � � � ���� �� ����� �'� ��� ���resources on health in 2009 (28% of total domestic health spending by developing country governments globally, or $113.85 billion), followed by North Africa/Middle East and Tropical Latin America.
�� >��� X �?�_���'����������X �� ��� � �X ��� ?�redirect $0.56 on average from the health sector to other spending priorities.
This report documents continued growth of DAH, despite concerns about cutbacks in foreign assis-tance. It also demonstrates continued strong growth in country expenditure on health, as well as the ongoing effects of DAH on spending for health by governments. With the MDG deadline rapidly approaching in 2015, it is important for policymakers to carefully assess the trends in these resource flows to decide where and how spending can have the maximum impact on popu-lation health.
7


9
Global health advocates and funders have been watching two trends closely over the past year. The first is progress toward the Millennium Development Goals (MDGs). The second trend is the funding – both from donors and from the countries themselves – that is driving some of that progress.
A series of analyses were published this past year by universities, advocacy organizations, and United Nations (UN) agencies examining different aspects of the MDGs. The UN, for example, found in July 2011 that “the proportion of people going hungry has plateaued at 16%, despite reductions in poverty,” making it unlikely that countries will meet the 2015 target of halving the number of people suffering from hunger worldwide.1
Dr. Rafael Lozano from the Institute for Health Metrics and Evaluation (IHME) and colleagues reported in September that only nine countries are on pace to achieve both MDG 4, which calls for a two-thirds reduction in the child mortality rate between 1990 and 2015, and MDG 5, which sets a goal of a three-fourths reduction in the maternal mortality ratio over the same period. They also found, though, that most countries in the world showed signs of accelerated progress in reducing both child and maternal mortality.2 Studies credited the acceleration in the reduction of child mortality to a range of factors, including expanded use of insecticide-treated bed nets to prevent malaria and rising education levels among women.3,4
The last goal on the MDG list – MDG 8 – has received less attention than most of the other goals. It calls on developed countries to devise specific steps to raise the standard of living in developing countries. This goal builds on a series of agreements that started in 1970 with a UN General Assembly Resolution that said, “In recognition of the special importance of the role that can be fulfilled only by official development assistance, a major part of financial resource transfers to the developing countries should be provided in the form of official development assistance. Each economically advanced country will progressively increase its official development assistance to the developing countries and will exert its best efforts to reach a minimum net amount of 0.7 percent of its gross national product at market prices by the middle of the decade.”5
At the 1992 UN Conference on Environment and Devel-opment, held in Rio de Janeiro, Brazil, and at the 2002 UN International Conference on Financing for Devel-opment in Monterrey, Mexico, this agreement was reaffirmed. It also became one of the underpinnings of MDG 8.6 Since then, few countries managed to reach the aid target of 0.7% of their gross domestic product. In 2005, only five countries achieved that goal: Denmark, Luxembourg, the Netherlands, Norway, and Sweden.7 Five years later, in 2010, the same five countries were the only ones meeting the target.8
Achieving aid targets is increasingly difficult for coun-tries because of the ongoing global economic crisis. Even in countries where budgets are relatively stable, the high rate of unemployment and the loss of earning power among average workers have helped create a climate of suspicion about development assistance.
In the United Kingdom (UK), there has been repeated criticism from the public and from conservative politi-cians over Prime Minister David Cameron’s insistence that the country’s development assistance remain protected from budget cuts. One headline declared, “Foreign aid budget to cost every family �500: How 17 foreign aid fat cats are earning more than �90,000.”9 In the United States (US), key political leaders – including several candidates for the US presidency – argued that the US Congress should greatly reduce the amount of development assistance it provides each year in light of the country’s historic debt levels.10,11
Debates about the future of development assistance come at a time when the world is recognizing the twin threat of the continuing high rate of infectious diseases in developing countries and the growing burden of noncommunicable diseases (NCDs). Earlier this year, IHME reported that cases and deaths from breast and cervical cancer are shifting to developing countries and to younger women in those countries.12
Reports this year also documented the rise in heart disease and increases in significant risk factors for disease, including obesity and high blood pressure.13-15 In September, global leaders at the UN High-Level Meeting on Noncommunicable Diseases pledged to find new ways to combat NCDs, but there were no funding targets or specific goals set.
INTRODUCTION

10 INSTITUTE FOR HEALTH METRICS AND EVALUATION
Tracking what spending was dedicated to NCDs and other health focus areas continues to be a challenge for IHME and other researchers. Data collection can lag by several years, making it nearly impossible to provide policymakers with timely analyses. For some coun-tries, the data are sparse, creating a great amount of uncertainty around the estimates. Moreover, for some channels, little to no detail is available on how funding was allocated across health focus areas.
We were able to overcome some of those challenges for this year’s report by gathering a broader array of data than was possible in previous years. We devel-oped new analytical methods to generate more precise estimates of DAH and country spending on health from 1990 to 2009. These new methods strengthen our ability to make preliminary estimates for DAH in 2010 and 2011. In the future, we hope to produce estimates for country spending that are just as current as for DAH, as more and better data are gathered.
In Part One, we present a new time series of DAH for the years 1990 to 2009, with preliminary estimates for 2010 and 2011. We then analyze the trends in funding by channel, by source, by country of origin, and by type. We also examine the distribution of DAH by focus region, by recipient country, and by health focus area, including HIV/AIDS; tuberculosis; malaria; maternal, newborn, and child health; NCDs; and health sector support. In Part Two, we show the trends in developing country spending on health programs from 1990 to 2009. We also explore the relationship between DAH and health spending by developing countries. This full report can be accessed online at http://www.healthmetricsandevaluation.org/publications/policy-report/financing_global_health_2011_IHME.

PART ONE:
DEVELOPMENT ASSISTANCE FOR HEALTH

12 INSTITUTE FOR HEALTH METRICS AND EVALUATION
TRACKING DEVELOPMENT ASSISTANCE FOR HEALTH
CHAPTER 1:
Since 2009, the Institute for Health Metrics and Evalua-tion (IHME) has published an annual report containing high-quality estimates of development assistance for health (DAH) for policymakers, researchers, and the global health community. This report provides a picture of donations and spending and the intricate relation-ship between the two. Figure 1 shows how DAH comes from sources such as national treasuries, private donors in multiple countries, and from loan repayments by governments in developing countries. These funds flow through channels of assistance such as United Nations agencies, bilateral development agencies, non-govern-
mental organizations, and development banks. DAH’s final destinations are institutions in the governmental or non-governmental sectors of developing countries that implement programs to improve health. In reality, tracking DAH is much more complex than this diagram indicates. Measurement of DAH is complicated by the fact that channels of assistance often transfer DAH to each other. Also, these channels sometimes imple-ment programs directly. For example, the World Bank transfers DAH in the form of loans and grants to imple-menting institutions in developing countries, but it also provides technical assistance to these countries.
FIGURE 1: Resource flows for DAH
FUNDING SOURCES
National treasuries
Debt repayments to international financial institutions
Private philanthropists
Corporate donations
CHANNELS OF ASSISTANCE
Bilateral development assistant agencies
The European Commission
UN agencies: PAHO, UNAIDS, UNFPA, UNICEF, WHO
The World Bank and regional development banks
The Global Fund to Fight AIDS, Tuberculosis and Malaria
The GAVI Alliance
Foundations
International NGOs
IMPLEMENTING INSTITUTIONS
Governmental programs
– National ministries of health
– National disease control programs
Non-governmental programs
– National NGOs
– Private sector contractors
– Universities and research institutions

TRACKING DEVELOPMENT ASSISTANCE FOR HEALTH 13
BOX 1:Financing Global Health 2010 main findings for development assistance for health
���� ��������� � ������]] �� ����� ������������������������� ��������� ��'��������������������?�more than half from an annual average of 13% between 2004 and 2008 to 6% annually between 2008 and 2010.
��� ��� ����]��X� ��������� ������� �� �� �������'��������������Q��X �� ���������������������dropped to their lowest level since 2004.
��#�]��X �����]�� �?�������������X �� ���������'������ ������� � ��������'����{�|'�]������� ����DAH, 65% could not be traced to its primary recipients in 1990, but this percentage dropped to 1% in 2008.
����'' � �� ����'������� ���� � �X ������������?���'' � ��������'�'����{�����'����#[\�#�=� }] �� � ��strong growth and received the most money of any health focus area. The area of maternal, newborn, and child health obtained half as much funding as HIV/AIDS in 2008. Tuberculosis DAH grew steadily, while malaria spending exhibited the fastest growth rate of any health focus area between 2007 and 2008. Health sector support grew slowly since 2006 despite substantial focus on the need for increased funding in this area. Noncom-municable diseases received less funding than any of the other focus areas.
The full 2010 report can be accessed online at: http://www.healthmetricsandevaluation.org/publications/policy-report /financing_global_health_2010_IHME
For last year’s report, Financing Global Health 2010: Development Assistance and Country Spending in Economic Uncertainty, we developed methods to esti-mate DAH in a timely manner. Prior to this, estimates of DAH suffered from a two-year time lag. Key findings from last year’s report are outlined in Box 1.16
This year, as we updated estimates of DAH for 1990 through 2011, we incorporated new data and refined our methodological approaches to improve the quality of the estimates.
��� � ���� � �� �� ���� �� � ���� }] ���� � '����some of the largest non-governmental organizations (NGOs) in the US, which allowed us to improve our estimates of DAH flowing through these channels.
������� �'?��������������'���������'' � �� ����issues, we incorporated additional data from the World Bank. As a result, we have a better under-standing of how this channel invests its money.
��|��� ���� ���'�����'�������������� ���� �� ��(NCDs) are more complete now that we have begun tracking efforts by the Bloomberg Family Foundation to fight tobacco use.
The sources we used to estimate DAH are summarized in Table 1.
Part One examines DAH by channel of assistance, by source, by country of origin, as a percentage of gross domestic product (GDP), by region and country, and by health focus area. All estimates in this report are presented in 2009 US dollars. Growth rates reported in this publication are compound annual growth rates.
By channel of assistance
Many experts have predicted that foreign assistance would shrink in the wake of the global financial crisis that occurred in 2008.17,18 Despite these forecasts, we found that DAH continued to rise through 2011. Funding is growing at a much slower rate than it did prior to the recession, however. DAH from some chan-nels of assistance has dropped or stagnated, but other channels showed encouraging signs of faster growth. While more money is flowing into developing countries to help them attain the Millennium Development Goals (MDGs) by 2015, it is unclear if the current growth rate of DAH is sufficient to meet these targets.
In last year’s Financing Global Health report, we noted that DAH is driven largely by financial contributions from governments that are spread over multiple years and committed in the past.16

14 INSTITUTE FOR HEALTH METRICS AND EVALUATION
TABLE 1: Sources of DAH data
Bilateral agencies in 23 OECD-DAC member countries and the EC
UN agencies: PAHO, UNAIDS, UNFPA, UNICEF, WHO
World Bank, ADB, AfDB, IDB
GAVI
GFATM
NGOs registered in the US*
BMGF
Other private US foundations*
OECD-DAC aggregate database and the Creditor Reporting System (CRS), budget documents, annual reports, and correspondence
Financial reports and audited financial statements, annual reports, budget documents, and correspondence
Online project databases and compendium of statistics
GAVI annual reports, country fact sheets, OECD-CRS, and correspondence
Online grant database and pledges
USAID Report of Voluntary Agencies, tax filings, financial statements, annual reports, RED BOOK Drug Reference, WHO’s Model List of Essential Medicines, and correspondence
Online grant database, tax filings, and correspondence
Foundation Center’s grants database and tax filings
Source Data
*Non-US private foundations and NGOs were not included due to lack of comprehensive data.
Notes: For more information about these sources, please visit our online Methods Annex at: http://www.healthmetricsandevaluation.org/publications/financing_global_health_2011_methods_IHME.pdf
BOX 2:Methods
��� ����! ����� � �]������ ������� ���Q� �� ��������������� X ��]�������� ����� ��������]���������private channels of assistance for each year between 1990 and 2009.
��� �� X� � ������� � ���� ���� }] ���� �����'��� �����'�� � ���� ��{��� �������� �'���������reports, government documents, audited financial statements, tax forms, and datasets provided by public and private donors.
�������! ���� �� ������������ Q����� ���� �������������'�������������� X ������� ����� ������� ��transfers between channels tracked by our study.
��� �� ]��� ���������������������'�������� ������ �������?] ���'�'����{
��� ����� � ������'��������� �������������� ������ ��������� �]�� � ������ �������������]� ����-nary estimates of DAH by channel of assistance for years 2010 and 2011.
��>��������� ��'����������� �� � ���� ������ ��]��� �Q� X ��������X�?Q� X ���'������{�<����� � ������ we analyzed the composition of DAH by health focus area and by recipient country.
��>������ ��'����������������� ��������! ?�� '�������]� �� �X����������� �� ������ }���� http://www.healthmetricsandevaluation.org/publications/financing_global_health_2011_methods_IHME.pdf

TRACKING DEVELOPMENT ASSISTANCE FOR HEALTH 15
For this reason, we concluded that it was perhaps not surprising that DAH continued to rise.16 Our findings that DAH continued to grow after the economic crisis occurred are not without historical precedent. Some researchers have found that health assistance did not drop during previous recessions.19,20 While this may be good news for global health advocates, economic trou-bles and looming budget cuts in donor countries such as the US threaten to make these gains short lived.21 The impact of the unfolding European financial crisis on other major donors such as France and Germany adds to the uncertainty surrounding future levels of DAH.22,23
The growth rate of DAH seems to have been affected by the recession. Between 1990 and 2000, DAH increased gradually, but more than doubled in size between 2001 and 2008. From 2007 to 2008 – immediately before the world felt the full impact of the recession – DAH’s growth rate was 17%. In the aftermath of the recession, its rate of growth was much slower. DAH increased only 3% from 2008 to 2009 and 4% each year between 2009 and 2011. Another hypothesis is that the exceptional
era of growth in DAH that began in 2002 has ended, and growth patterns in DAH are returning closer to historic levels. The annual growth rate of DAH was 7% between 1990 and 1995, and 6% between 1995 and 2000. It is important to keep in mind that, in order to avoid double counting, the estimates of DAH by channel exclude any transfers to other channels that we also track.
DAH from many channels of assistance continued to grow despite the recession, although some other chan-nels experienced declines or stagnation. The World Bank’s International Bank for Reconstruction and Development (IBRD) stands out as a channel that expe-rienced dramatic growth between 2010 and 2011.
IBRD has played a key role in the continued growth of DAH in recent years. Over the period of 1997 to 2004, DAH from IBRD fluctuated around $1 billion, then declined steadily starting in 2005 and continued to drop through 2008. However, IBRD’s growth rate began to rise in 2009 and increased through 2011 according to our preliminary estimates of DAH, described in Box 3. This channel accounted for the largest share ($796.77 million) of the expansion in total DAH between 2010
Bill
ions
of
2009
US
dolla
rs
28
26
24
22
20
18
16
14
12
10
8
6
4
2
0
5.82 5.676.29
6.76
8.067.82 8.158.63 8.94
9.8710.86 10.82
12.3213.23
15.00
16.86
18.41
21.20
24.88
25.6926.66
27.73NGOs
Other foundations
BMGF
GFATM
GAVI
European Commission
WHO, UNICEF, UNFPA, UNAIDS, PAHO
World Bank – IBRD
World Bank – IDA
Regional development banks
Bilateral agencies:
Other
Sweden
Germany
France
Japan
United Kingdom
United States
Source: IHME DAH Database 2011
*2010 and 2011 are preliminary estimates based on information from the above organizations, including budgets, appropria-tions, and correspondence.
1990
1991
1992
1993
1994
1995
1996
1997
1998
1999
2000
2001
2002
2003
2004
2005
2006
2007
2008
2009
2010
2011
* *
FIGURE 2: DAH by channel of assistance, 1990-2011

BOX 3:Preliminary estimates of DAH
A major challenge in tracking DAH comes from the significant time lag between disbursements of funds and publi-cation of data about these disbursements. Few channels of assistance that we track provided disbursement data for the years 2010 and 2011.
We overcame this challenge by using data sources, such as budget documents and correspondence with donors, to produce preliminary estimates of DAH for these years. Despite an inevitable margin of error, our previous prelimi-nary estimate of DAH for 2009 from last year’s Financing Global Health report was quite close to our updated analysis of the actual DAH estimate for 2009 based on reported disbursement data (our preliminary estimate was 0.6% lower than our actual estimate). IHME’s preliminary estimates of DAH are valuable, as they supply policy-makers with access to timely data.
Improvements to this year’s preliminary estimates include the incorporation of budget data on foreign assistance from South Korea and the Netherlands into our dataset, which were not included in our estimates last year. In addition, IHME strengthened its preliminary estimates of DAH for 2010 by incorporating revised expenditure data from channels such as the GAVI Alliance and the Bill & Melinda Gates Foundation.
16 INSTITUTE FOR HEALTH METRICS AND EVALUATION
and 2011. This scale-up in IBRD financing appears to be part of the World Bank’s response to the global economic crisis, in the effort to help developing coun-tries stimulate their economies and provide social safety nets to their citizens.24,25
The large increase in IBRD from 2010 to 2011 indi-cates that the global health landscape is changing with respect to the purpose and beneficiaries of funds. This type of DAH differs from other forms of DAH that we are also tracking, as IBRD provides DAH in the form of loans instead of grants, which many other channels tend to provide. There is debate in the global health commu-nity about whether IBRD loans should be counted as development assistance. While IHME includes loans in its definition of DAH, other researchers have excluded them.26 National Health Accounts of the World Health Organization (WHO) do not count loans to developing countries as external resources for health, since these countries’ governments are required to pay them back.27 Furthermore, IBRD loans are primarily targeted toward middle-income instead of low-income coun-tries for the purpose of not only health improvement but also economic stimulus.28
The trend in DAH from the other lending arm of the World Bank, the International Development Asso-ciation (IDA), differs greatly from IBRD. In contrast to IBRD, IDA primarily provides zero- or low-interest loans and grants to the poorest countries.29 Since 2006, DAH
from IDA has been shrinking. Given IDA’s fundraising success at its 16th replenishment in 2010,30 however, it will be important to follow the replenishment’s impact on DAH from IDA in future iterations of this research.
Over the past decade, bilateral agencies have been the main drivers of increases in total DAH, but their rate of growth slowed in the aftermath of the recession. In 2002, bilateral agencies’ DAH began to rise quickly and continued to expand dramatically through 2008. As rich countries saw their GDP decline between 2008 and 2009, however, growth slowed. From 2010 to 2011, DAH from bilateral agencies grew by only 4% ($444.08 million). The last time DAH increased at a rate this low was prior to 2002 when the scale-up began. In spite of reduced growth, bilateral channels were the second-largest contributors to growth in total DAH from 2010 to 2011.
Many bilateral agencies in Figure 2 appear smaller than they would if transfers to other channels such as the Global Fund to Fight AIDS, Tuberculosis and Malaria (GFATM), the GAVI Alliance (GAVI), and multilateral agencies were not subtracted.
A massive expansion in DAH from the US since 2002 has fueled the trend in overall DAH, but its growth slowed to just 2% between 2010 and 2011. This slow growth reflects the difficulties of expanding DAH in a country that is facing persistent unemployment, rising
TRACKING DEVELOPMENT ASSISTANCE FOR HEALTH 17
foreclosure rates, and a ballooning national debt.31-33 Furthermore, foreign aid is a popular target for cuts as many Americans believe that it makes up around 25% of the total US budget, while in reality it is just 1% of the total.34
Slow growth in US DAH has been somewhat mitigated by increasing generosity from other bilateral agencies. The UK, whose DAH has grown substantially over the last decade, increased its DAH by 14% between 2010 and 2011. The UK has continued to expand its levels of foreign assistance despite cutting other areas of government spending.35 Its decision to protect foreign aid spending from cuts has proved highly controver-sial.36 The UK’s approach differs starkly from other countries such as the Netherlands, Spain, and Italy that have cut foreign assistance along with other parts of the budget. During a period of time where the UK govern-ment’s cuts to domestic spending have inspired much opposition, increasing its DAH is a continual struggle.37
Germany’s DAH began to expand in 2006, and then shrank amid concerns about the impact of the financial crisis. Over the last year, however, DAH from Germany started to grow once again.
Private channels of assistance have played an increas-ingly important role in channeling DAH over the last decade. Last year, we noted that they suffered more than any other channel as a result of the recession. This year, private channels showed signs of recovering from the negative impact of the economic downturn.
NGOs experienced sustained growth over the period 1997 to 2008. Their growth became especially pronounced in 2004 when the US President’s Emer-gency Plan for AIDS Relief (PEPFAR) began disbursing funds and channeling large amounts of DAH through these organizations. From 2008 to 2010, however, NGOs were one of the channels most adversely impacted by the recession, in part due to declining contribu-tions from private sources. DAH flowing through NGOs expanded by 25% from 2007 to 2008, but their DAH declined by 15% and 22% in the following two years. The period 2010 to 2011 seemingly marked a change in fortunes for NGOs, which rebounded and grew 8%.
US foundations, excluding the Bill & Melinda Gates Foundation (BMGF), experienced negative growth rates in the early 2000s but began to grow again in 2005. This growth continued until the period of 2008 to 2009, when DAH from this channel dropped by 4%. Our preliminary estimates show that DAH from US
foundations (excluding BMGF) started to increase again from 2009 to 2010 and grew 11% between 2010 and 2011.
Our estimates of DAH channeled through NGOs and private foundations do not include private donations from countries outside of the US due to the lack of stan-dardized and complete data. Studies of philanthropic contributions from countries in the Organisation for Economic Co-operation and Development’s Develop-ment Assistance Committee (OECD-DAC), excluding the US, have indicated that these funds were 60% smaller than private DAH from the US in 2008.38 As the quality, comparability, and availability of data for private DAH outside of the US improves, IHME aspires to track these important yet little understood contributions aimed at addressing health problems in developing countries.
DAH from BMGF, the largest foundation involved in global health, increased over time. Its rate of growth was particularly fast between 2007 and 2008 (61%). At this time, BMGF’s DAH expanded at the fastest rate since it first began disbursing money. Its DAH has fluc-tuated up and down since 2008, however. Historically, DAH from BMGF rose and fell due to peaks from large grants.
GAVI, a newer channel of assistance compared to more traditional institutions such as UN agencies, experi-enced sustained growth since its establishment early in the last decade. The amount of DAH flowing through GAVI became especially pronounced starting in 2007. Despite the recession, DAH from GAVI continued to grow. Our preliminary estimates indicate that its growth rate increased 31% between 2010 and 2011, rising from $893.84 million to $1.17 billion.
As seen in Figure 3, the growth rate of DAH from UN agencies has been slower than less traditional channels such as GAVI. Since 2002, the growth rate of DAH from UN agencies was 5%. From 2010 to 2011, their DAH decreased by 1%. Among these different agencies, the only one that did not experience a decline in DAH was the Pan American Health Organization.
Declines in the value of the US dollar pose challenges to UN agencies such as WHO. WHO receives its revenue in US dollars but pays its headquarters staff in Swiss francs.39 One US dollar was worth 1.20 Swiss francs in 2007 but was worth only 0.92 Swiss francs in 2011. Therefore, the number of headquarter staff hours that WHO can purchase with its revenue has declined over time.

18 INSTITUTE FOR HEALTH METRICS AND EVALUATION
FIGURE 4: DAH by source of funding, 1990-2011
Bill
ions
of
2009
US
dolla
rs
28
26
24
22
20
18
16
14
12
10
8
6
4
2
0
1990
1991
1992
1993
1994
1995
1996
1997
1998
1999
2000
2001
2002
2003
2004
2005
2006
2007
2008
2009
2010
2011
Funds from channels for which we were unable to find disaggregated revenue information as well as interagency transfers from non-DAH institutions are included in “unallocable.” “Other” refers to interest income, currency exchange adjustments, and other miscellaneous income.
Unallocable
Other
Debt repayments (IBRD)
Private philanthropy:
Other
Corporate donations
BMGF
National treasuries:
Other governments
Italy
Norway
Sweden
Canada
Netherlands
France
Germany
Japan
United Kingdom
United States
Preliminary estimates
Source: IHME DAH Database 2011
Notes: 2010 and 2011 are preliminary estimates based on information from channels of assistance, including budgets, appropriations, and correspondence. Data were unavailable to show total DAH by source of funding for 2010 and 2011.
5.82 5.676.29
6.76
8.067.82 8.158.63 8.94
9.8710.86 10.82
12.3213.23
15.00
16.86
18.41
21.20
24.88
25.6926.66
27.73
FIGURE 3: Change in DAH by channel of assistance, 2010-2011
-500 0
500
1,00
0
IBRD
Bilateral development agencies
GAVI
NGOs
European Commission
US founda�ons
UN agencies
Regional development banks and IDA
GFATM
Change (millions of 2009 US dollars)
-70
0 70 140
Percent change
Source: IHME DAH Database 2011
Notes: The bars represent changes in DAH in absolute and percentage terms from 2010 to 2011. On the vertical axis, channels are ordered by the magnitude of their contribution to the total change in DAH.
Percent change
Change (millions of 2009 US dollars)

TRACKING DEVELOPMENT ASSISTANCE FOR HEALTH 19
Since its beginning in 2002, DAH from GFATM exhibited double-digit or greater yearly growth rates, increasing from $16.28 million in its first year to $3.22 billion in 2010. Between 2010 and 2011, however, our prelimi-nary estimates show that GFATM’s DAH declined by 16% ($529.33 million).
In the wake of the economic crisis, donors did not give GFATM as much money as they had pledged. Prior to the recession, donors’ disbursements to GFATM were approximately the same as commitments. By 2009, however, donors disbursed 94% of commitments, and this percentage decreased to just 78% of commitments in 2010. Preliminary data from GFATM, current as of August 2011, seem to indicate that donors’ commit-ments and disbursements decreased again.
Declines in GFATM’s revenue may partially explain why its disbursements also shrank in 2011. This may also reflect an institutional shift in focus from prioritizing the speed and volume of disbursements to ensuring the accountability for and effectiveness of these disbursements.40
Figure 3 provides a detailed look at changes in DAH among different channels of assistance over the past year. Each green bar represents a channel’s change in percentage, while the blue bars capture changes in volume. On the vertical axis, channels are ordered by the magnitude of their contribution to the total change in DAH. For example, the percentage change from bilat-eral channels was relatively small, but its contribution was the second largest in absolute terms.
As we have noted in previous studies, the arrival of less-traditional organizations such as GAVI and GFATM in the last decade as well as slower DAH growth led to increased competition between channels of assistance for public and private funds. In this environment, the newer global health actors GAVI and GFATM acquired a growing share of DAH. GAVI’s share of total DAH grew from 1% in 2002 to 3% in 2010 to 4% in 2011. GFATM’s share of total DAH grew from 2% of total DAH in 2003, the first year of its existence, to 12% in 2010 and 10% in 2011.
As GAVI and GFATM’s influence expanded, more tradi-tional institutions such as the UN, World Bank IDA, and the regional development banks controlled less of total DAH. For example, the UN saw its share of overall DAH decline from 21% in 2002 to 14% in 2011. Likewise, the World Bank IDA and regional development banks’ shares have declined from 9% to 2% and from 4% to
2%, respectively, over the same period. The World Bank’s IBRD is an exception to this trend as its DAH has grown in recent years.
As a larger number of players compete for uncer-tain DAH support, fundraising efforts have greatly expanded. Examples of this include the proliferation of calls for disease-specific funding, such as HIV/AIDS, tuberculosis, malaria, NCDs, and swine flu.41-43
Alternative perspectives on DAH
To view the different sources that have contributed money to channels of assistance, please see Figure 4. Some channels of assistance, such as BMGF, are also sources of funding. In the source figure, the amount of DAH from BMGF reflects all of the funds that it disburses as a channel as well as the money that it transferred to other channels. Figures 5 and 6 provide alternative assessments of the amount of DAH donated by different countries. We were unable to produce esti-mates past 2009 due to lack of data.
Public sector DAH
Donors have very different preferences when it comes to the channels they choose to fund. This is shown in Figure 7. The donors who provide the largest amount of DAH tend to dominate the global health landscape through their choices about which channels to finance, as can be seen in Figure 8. Over time, public donors’ funding decisions led to greater amounts of DAH flowing to NGOs, other private channels, and public-private partnerships (PPPs) than to UN agencies. Time lags in the publication of DAH data from bilateral agen-cies prevented us from including data from years 2010 and 2011.
The US, the largest public donor, channeled 55% of its DAH through NGOs and other private actors in 2009. As a result, this sector has become the dominant recipient of DAH. The US PEPFAR program is a prime example of a publicly funded program that relies mainly on NGOs as implementing partners. Many members of the inter-national community have tried to promote the use of recipient countries’ financial systems to channel aid according to the principles of the Paris Declaration for Aid Effectiveness.44 Despite their efforts, a large portion of US DAH continues to be channeled through NGOs.
When it comes to giving money to multilaterals, the US government’s preferences differed greatly from smaller donors such as the Netherlands, Finland, and

20 INSTITUTE FOR HEALTH METRICS AND EVALUATION
Bill
ions
of
2009
US
dolla
rs
28
26
24
22
20
18
16
14
12
10
8
6
4
2
0
1990
1991
1992
1993
1994
1995
1996
1997
1998
1999
2000
2001
2002
2003
2004
2005
2006
2007
2008
2009
2010
2011
Unspecified
Unallocable
Other
Australia and New Zealand
Canada
South Korea
Japan
United Kingdom
Europe, excluding UK
United States
Preliminary estimates
Source: IHME DAH Database 2011
Notes: 2010 and 2011 are preliminary es�mates based on informa�on from channels of assistance, including budgets, appropria�ons, and correspon-dence. Data were unavailable to show total DAH by source of funding for 2010 and 2011.
“Unallocable” includes funds such as interagency transfers from non-DAH institutions, interest income, and miscellaneous income that could not be attributed to countries. Channels for which we had no revenue information are included under “unspecified.”
5.82 5.676.29
6.76
8.067.82 8.158.63 8.94
9.8710.86 10.82
12.3213.23
15.00
16.86
18.41
21.20
24.88
25.6926.66
27.73
FIGURE 5: DAH by country of origin, 1990-2011
Perc
ent
.2
.15
.1
.05
0
.186
.144
.123
.091
.075
.090
.074 .073 .071
.056.053
.041.037 .036 .033 .032
.017 .017
.029
.015 .013 .011 .010
AUS = AustraliaAUT = AustriaBEL = BelgiumCAN = CanadaCHE = SwitzerlandDEU = GermanyDNK = DenmarkESP = SpainFIN = FinlandFRA = FranceGBR = United KingdomGRC = GreeceIRL = IrelandITA = ItalyJPN = JapanKOR = South KoreaLUX = LuxembourgNLD = the NetherlandsNOR = NorwayNZL = New ZealandPRT = PortugalSWE = SwedenUSA = United States
Sources: IHME DAH Database 2011 and World Bank World Development Indicators
NO
R
LUX
SWE
USA
GBR BE
L
NLD IR
L
DN
K
CAN
ESP
FIN
FRA
AU
S
CHE
DEU NZL
AU
T
KOR
JPN
ITA
GRC PR
T
The countries included are the 23 members of the OECD-DAC.
FIGURE 6: DAH as a percentage of gross domestic product, 2009

TRACKING DEVELOPMENT ASSISTANCE FOR HEALTH 21
Perc
ent
100
90
80
70
60
50
40
30
20
10
0
KOR
GRC BE
L
DEU
GBR JP
N
LUX
PRT
USA IT
A
IRL
NZL
AU
T
AU
S
ESP
NLD FR
A
SWE
NO
R
CAN
FIN
CHE
DN
K
ALL
ALL = All-country averageAUS = AustraliaAUT = AustriaBEL = BelgiumCAN = CanadaCHE = SwitzerlandDEU = GermanyDNK = DenmarkESP = SpainFIN = FinlandFRA = FranceGBR = United KingdomGRC = GreeceIRL = IrelandITA = ItalyJPN = JapanKOR = South KoreaLUX = LuxembourgNLD = the NetherlandsNOR = NorwayNZL = New ZealandPRT = PortugalSWE = SwedenUSA = United States
The composition of DAH from the 23 member countries of the OECD-DAC is shown.
Source: IHME DAH Database 2011
Notes: “Unspecified” indicates donor country did not report the specific channel that would first receive its DAH.
Unspecified
IDA
Public-private partnerships (PPPs):
GAVI
GFATM
Multilaterals:
EC
UNICEF
UNAIDS
UNFPA
WHO
Other:
NGOs, other PPPs, other channels
Bilateral:
Governments
FIGURE 7: Public sector DAH (donor country specific) by channels of assistance, 2009
Denmark, who tend to favor multilateral mechanisms. The US government gave only 5% of its aid to multilat-eral institutions in 2009, while these three European nations gave amounts ranging from 36% to 65% of their DAH to multilaterals.
Many public donors choose to channel their funding through bilateral mechanisms. In Figure 7, these flows include direct transfers to recipient country govern-ments as well as to other governmental agencies located in the donor’s country.45 Starting in reporting year 2010, the OECD-DAC issued directives for donor countries to use a new coding scheme that will differentiate between these two types of government-to-government transfers. This will allow us to better understand how DAC countries are channeling their aid, and will be discussed in the 2012 edition of Financing Global Health.46 The governments of the UK, Japan, and Germany channel more than 35% of their DAH through bilateral channels, while South Korea directs 60% of its DAH via government-to-government trans-fers. Previous studies have suggested that channeling
assistance bilaterally may indicate a preference for more control over the use of funds than if this support was routed through other channels.47
This analysis also reveals how public donors as a whole increasingly preferred to direct their funds through the PPPs GFATM and GAVI instead of through UN agencies. Figure 8 shows that the total amount of public DAH given to GFATM and GAVI combined was $3.24 billion in 2009, while UN agencies received $2.11 billion.
Until its drop in 2011, GFATM continued to fare rela-tively well through 2009 and 2010 compared to more traditional institutions. Part of this was due to continued support from donors such as France, which is GFATM’s second-largest donor after the US.48 GFATM was France’s preferred channel of assistance in 2009, indicated by the fact that it directed the largest portion of its DAH (34%) through this PPP.
Both GFATM and GAVI count another major donor, the UK, as one of their primary supporters. The UK plans to cut back on HIV/AIDS funding to expand its support

22 INSTITUTE FOR HEALTH METRICS AND EVALUATION
Bill
ions
of
2009
US
dolla
rs
18
16
14
12
10
8
6
4
2
0
4.30 4.124.44 4.59
5.835.40
5.80 5.785.51
6.016.48 6.71
7.89
8.88
9.67
11.00
12.78
14.66
17.24
18.18
Source: IHME DAH Database 2011
Notes: See Figure 6 for list of OECD-DAC countries. 19
90
1991
1992
1993
1994
1995
1996
1997
1998
1999
2000
2001
2002
2003
2004
2005
2006
2007
2008
2009
Unspecified
IDA
Public-private partnerships (PPPs):
GAVI
GFATM
Multilaterals:
EC
UNICEF
UNAIDS
UNFPA
WHO
Other:
NGOs, other PPPs, other channels
Bilateral:
Governments
Bilateral assistance from the 23 member countries of the OECD-DAC are further disaggregated into aid going to recipient governments and flows to NGOs, PPPs excluding GAVI and GFATM, and other miscellaneous channels. Disbursements for which the channel was not specified in OECD-DAC's database are labeled “unspecified.”
FIGURE 8: Public sector DAH by channels of assistance, 1990-2009
for maternal, newborn, and child health, which could affect the amount the UK contributes to GFATM in the future.49
Our discussion about the different channels of assis-tance that donors decide to fund underscores the importance of transparent DAH data. Public donors have made major improvements in the transparency of DAH data, such as the progress made by the US in releasing data on all of the primary recipients of US DAH, as we noted in last year’s report.16 Since the US is the largest DAH donor, this progress led to profound changes in the transparency of DAH data as a whole.
When sources of funding and channels of assistance fail to provide information about the recipients of their aid, it impairs our ability to analyze DAH. In 2009, for example, 29% of Denmark’s DAH could not be traced to the primary recipients, which is indicated by the “unspecified” category in Figure 7. In 2008, Denmark reported primary recipients for 100% of its aid.16
In contrast, Canada and Japan both improved the transparency of their DAH data in 2009 compared to
2008 and now report primary recipients for 100% of their DAH. Countries such as France, Italy, and Spain still have room for improving the completeness of their DAH data. Since last year’s Financing Global Health report, the other nations listed in Figure 7 consistently reported aid flows in a transparent manner. This infor-mation is crucial for researchers, policymakers and planners, and advocacy organizations.
Private philanthropy and DAH
Next, we examine the largest private donor of DAH, BMGF, and the ways in which this foundation channels its funding. BMGF’s giving patterns make it unique among the other major donors in global health. It has helped reshape the global health architecture by funding new global health institutions and the development of tech-nology. Research institutions and universities were the largest beneficiaries of grants from BMGF in 2010 ($448.61 million, or 30%). These funds go to projects such as efforts to develop HIV vaccines and other types of drugs as well as public health research studies. The second-largest share ($418.93 million, or 28%) went to

TRACKING DEVELOPMENT ASSISTANCE FOR HEALTH 23
Bill
ions
of
2009
US
dolla
rs
2.5
2
1.5
1
.5
0
.43
1.44
.69
.86
.47
1.02
.60
.73.65
.52 .49
.76
.91
1.35
.94
2.08
1.45
1.29
1.82
2.33
1.81
1.34
1.47
1.23
1.38
1999
2000
2001
2002
2003
2004
2005
2006
2007
2008
2009
2010
2011
Country governments and IGOs (excluding UN)
United Nations
World Bank
GAVI
GFATM
PPPs (excluding GAVI and GFATM)
Universities and research institutions
NGOs, foundations, and corporations
Commitments
Preliminary disbursements
Source: IHME DAH Database (BMGF) 2011
Notes: 2011 data are based on preliminary es�mates obtained from BMGF. Final data were unavailable to show BMGF's commitments and recipients of disbursements for 2011.
The multicolored bars represent disburse-ments, and the blue bars show commitments. “Universities and research institutions” include universities, NGOs, foundations, and government institutions in low-, middle-, and high-income countries with a research focus. “Country governments” include all nonresearch-oriented government agencies.
FIGURE 9: Bill & Melinda Gates Foundation global health disbursements and commitments, 1999-2011
FIGURE 10: Total overseas health expenditure channeled through US NGOs, 1990-2011
Bill
ions
of
2009
US
dolla
rs
4
3
2
1
0
.53
.71.85 .90
.971.01
.85.94
1.06
1.291.43
1.65
1.82
2.00
2.36
2.77
2.92 2.97
2.49
3.72
3.18
2.69
1990
1991
1992
1993
1994
1995
1996
1997
1998
1999
2000
2001
2002
2003
2004
2005
2006
2007
2008
2009
2010
2011
* * *
Total health spending is disaggregated by shares of revenue received from the US government, other public sources of funding and international organizations, BMGF, financial donations from private sources, and in-kind donations from private sources.
Source: IHME DAH Database (NGOs) 2011
*Data for 2009 to 2011 are based on preliminary estimates.
Notes: Data reflect US-based NGOs registered with USAID.
US public
Other public and international organizations
BMGF
Private financial contributions
Private in-kind donations

TABLE 2: US NGOs with the highest cumulative overseas health expenditures, 2005-2008
Percent of Percent of Overseas health Overseas health Overseas revenue revenue expenditure, expenditure, expenditure, from from in-kind Rank NGO adjusted unadjusted unadjusted private sources contributions
1 Population Services International 1,265.14 1,265.21 1,347.93 14 0
2 Food For The Poor 706.83 2,557.64 4,196.77 97 89
3 Catholic Relief Services 665.51 670.36 2,306.70 40 1
4 Management Sciences for Health 581.94 581.94 585.98 0 0
5 PATH 501.23 505.97 518.54 90 1
6 United Nations Foundation 466.08 497.42 637.84 91 8
7 World Vision 355.80 472.89 3,178.42 76 30
8 Pathfinder International 324.45 325.97 325.99 23 1
9 Elizabeth Glaser Pediatric AIDS Foundation 318.02 319.47 322.54 18 1
10 MAP International 293.96 1,398.24 1,398.67 100 97
11 Brother’s Brother Foundation 274.88 1,460.07 2,011.33 100 99
12 Academy for Educational Development 265.03 267.44 1,060.58 12 1
13 Save the Children 246.24 254.86 1,428.72 53 4
14 CARE 241.20 241.92 2,370.40 27 0
15 Project HOPE 229.16 547.28 595.38 91 71
16 The Clinton Foundation 216.72 222.57 347.91 100 3
17 The Carter Center 205.17 328.35 476.38 95 46
18 Catholic Medical Mission Board 184.42 766.43 789.68 100 93
19 Population Council 180.71 191.14 257.03 37 7
20 ChildFund International 180.24 180.59 700.15 90 0
Source: IHME DAH Database (NGOs) 2011
Notes: Overseas health expenditure for 2009-2011 is not included because of data limitations. Data reflect NGOs registered with USAID. Adjusted overseas health expenditure reflects deflated overseas health expenditure from private in-kind donations plus unadjusted overseas health expenditure from all other revenue sources (private financial contributions, BMGF, US public, and other public). Unadjusted overseas health expenditure differs from adjusted overseas health expenditure due to the fact that overseas health expenditure from private in-kind donations is not deflated for this quantity.
Expenditures shown in millions of 2009 US dollars.
NGOs, foundations, and corporations. The third-largest portion ($315.49 million, or 21%) of BMGF’s grants in 2010 went to UN agencies. PPPs, including GFATM and GAVI, accounted for 17% of BMGF’s grants. Only 1% ($16.08 million) of BMGF’s disbursements went to intergovernmental institutions (IGOs) and developing-country governments in 2010.
Non-governmental organizations
Examining the revenue sources of US-based NGOs provides additional insight into the ways that private and public donors are influencing how DAH is channeled to
developing countries, as seen in Figure 10. Both public and private donors play key roles in financing NGOs. This year, we enhanced the quality of our estimates of DAH from US NGOs by collecting more information about health expenditures than we have in previous years.
According to our preliminary estimates for 2011, 40% of NGOs’ expenditure came from cash donations from corporations, individuals, and foundations other than BMGF (labeled as “private financial contributions” in the figure). Our estimates of the top 20 NGOs ranked by overseas health expenditure from 2005 to 2008
24 INSTITUTE FOR HEALTH METRICS AND EVALUATION

TRACKING DEVELOPMENT ASSISTANCE FOR HEALTH 25
TABLE 3: Summary of health spending by non-US NGOs, 1998-2009
Number of non-US NGOs Number of non-US NGOs for which Combined health expenditures by largest Year in USAID report we found health expenditure data non-US NGOs* (millions of 2009 US$)
Prior to 1998 0 – –
1998 44 3 –
1999 0 – –
2000 50 6 150.32
2001 51 7 153.93
2002 58 7 151.35
2003 54 7 205.52
2004 55 9 212.35
2005 59 9 229.30
2006 67 8 239.22
2007 68 10 422.15
2008 78 11 503.17
2009 – 12 524.94
*Ranking determined by amount of overseas expenditure.
Notes: Data reflect non-US-based NGOs registered with USAID. USAID data for 2009 were not available at the time of the analysis, so we used rankings from 2008.Dashes indicate inapplicable.
include NGOs whose work is financed by these private donors (see Table 2). We were unable to extend the analysis of the top 20 NGOs past 2008 due to lack of data. Donations from individuals and groups wishing to sponsor a child are an important source of revenue for World Vision and ChildFund International. Donations from a single individual, media mogul Ted Turner, are the major funding source of the United Nations Foun-dation. The United Nations Foundation is recognized by the US Internal Revenue Service as a tax-exempt orga-nization, not a private foundation, and is thus included in our NGO database. Private in-kind donations of phar-maceuticals and medical supplies represented 11% of NGOs’ overseas health expenditure in 2011. These donations are the primary source of revenue for many NGOs among the top 20, such as Food For The Poor, MAP International, and Brother’s Brother Foundation.
According to our preliminary estimates for 2011, US government funding to NGOs eclipsed non-BMGF private funding as the largest source of revenue for the US NGOs tracked in our study. Major recipients
of US government funds such as Population Services International, Management Sciences for Health, and the Academy for Educational Development appear on the list of top 20 NGOs ranked by overseas health expenditure. Since US government DAH is a key source of revenue for many of the top NGOs, budget cuts made by lawmakers in the US could cause the rankings shown here to change substantially.
Due to lack of comparable and complete data, US-based NGOs that do not appear in the data from USAID’s annual Report of Voluntary Agencies and those based outside of the US were not included in our DAH esti-mates. Table 3 shows that 12 of the top international NGOs ranked by overseas spending for which we could find data spent $524.94 million on health in 2009, whereas a single US NGO, Management Sciences for Health, spent a greater amount ($581.94 million) over a period of four years. This table does not include data past 2009 due to significant time lags in the publication of these data.

DISTRIBUTION OF DEVELOPMENT ASSISTANCE FOR HEALTH
CHAPTER 2:
In this chapter, we will explore how much development assistance for health (DAH) is allocated to different regions, countries, and health problems. As we have explained in previous Financing Global Health reports, we found that DAH generally goes to impoverished areas of the world and to countries with the largest disease burdens. However, there are countries that receive DAH for reasons driven by political, economic, and security interests. We were only able to analyze data through 2009 due to time lags in the publication of data from the majority of donors.
In 2009, sub-Saharan Africa received the largest amount of DAH ($7.61 billion, or 30%) compared to other regions. The regions receiving the next largest amount of DAH were South Asia ($1.85 billion, or 7.2%) and East Asia and the Pacific ($1.48 billion, or 5.8%). North Africa/Middle East received the smallest amount among the regions, $554.98 million, or 2.2% of DAH. Growth in DAH to sub-Saharan Africa, however, slowed to 8% from 2008 to 2009, its lowest rate of growth since 2001 to 2002. This slowdown is largely due to the reduced growth of HIV/AIDS funding. Other regions
FIGURE 11: DAH by focus region, 1990-2011
Bill
ions
of
2009
US
dolla
rs
28
26
24
22
20
18
16
14
12
10
8
6
4
2
0
Unallocable
Global
Latin America and Caribbean
Europe and Central Asia
East Asia and Pacific
South Asia
North Africa / Middle East
Sub-Saharan Africa
Preliminary estimates
1990
1991
1992
1993
1994
1995
1996
1997
1998
1999
2000
2001
2002
2003
2004
2005
2006
2007
2008
2009
2010
2011
Health assistance for which we have no recipient country or region information is coded as “unallocable.”
Sources: IHME DAH Database 2011 and IHME DAH Database (Country and Regional Recipient Level) 2011
Notes: 2010 and 2011 are preliminary es�mates based on informa�on from channels of assistance, including budgets, appropria�ons, and correspondence. Data were unavailable to show total DAH by focus region for 2010 and 2011.
5.82 5.676.29
6.76
8.067.82 8.158.63 8.94
9.8710.86 10.82
12.3213.23
15.00
16.86
18.41
21.20
24.88
25.6926.66
27.73
26 INSTITUTE FOR HEALTH METRICS AND EVALUATION

DISTRIBUTION OF DEVELOPMENT ASSISTANCE FOR HEALTH 27
experienced stagnating or declining DAH from 2008 to 2009 with the exception of East Asia and the Pacific and Latin America. DAH increased 10% in East Asia and the Pacific, while it increased 4% in Latin America during this period. DAH targeted toward improving health at a global level, such as HIV/AIDS vaccine research and the development of new drugs to treat multidrug-resistant tuberculosis (TB), represented 13% of DAH in 2009.
Next, we will examine spending by country and by health focus area. The figures and maps that present data at the country level only include DAH that can be traced to a specific recipient country. Most notably, they do not include DAH channeled through non-governmental organizations (NGOs) and the World Health Organization (WHO), since most of these orga-nizations do not provide standardized and complete data on country-specific expenditure. For 2009, 35% of DAH could not be traced to recipient countries due to missing data.
Our analysis of the top 10 recipients of DAH shows the countries that are driving the regional trends seen in Figure 12. This figure only presents results through 2009 due to lack of data for years 2010 and 2011. Appearing on the list of top 10 recipients of aid are some of the world’s most populous countries as well as those with high HIV/AIDS prevalence. Among the 10 largest recipients of DAH are eight sub-Saharan African countries, all of whom received a large fraction of their aid from the US through programs such as the US Presi-dent’s Emergency Plan for AIDS Relief (PEPFAR). All countries except India, South Africa, Nigeria, and China were focus countries of the US President’s Malaria
Initiative (PMI) as of 2009.51 Among the top 10 are two countries that are foreign aid donors: China and India.52 Although these countries give away foreign aid, massive health disparities still exist within these nations. India received most of its aid (29%) in the form of loans and grants from development banks, primarily the World Bank, while the largest portion (29%) of China’s DAH came from the Global Fund to Fight AIDS, Tuberculosis and Malaria (GFATM). While each of the top 10 countries received DAH from GFATM, Ethiopia, Tanzania, and India are the top GFATM recipients on this list. Out of the 10 countries shown here, the GAVI Alliance (GAVI) granted nearly three times more DAH to Ethiopia than to the next largest recipient, Kenya. The influence of the Bill & Melinda Gates Foundation (BMGF) in India is also captured on this figure. One of BMGF’s major initiatives in India is Avahan, a program designed to lower the transmission of HIV. In a study published in October 2011, Avahan was estimated to have averted over 100,000 HIV infections.53,54
Figure 12 sheds light on ways that spending cuts and shifting priorities may impact these countries in years to come. For example, the UK was India’s second-largest funder of DAH from 2004 to 2009, representing 23% ($873.62 million) of total DAH received by India. In 2011, the UK decided it would only commit to sending aid to India until 2015,55 and pressure is mounting on its government to cut off aid to India entirely.56,57 Other examples include the case of the African countries shown on this figure that receive the majority of their DAH from the US. The combined effects of budget cuts in the US and the uncertainty of PEPFAR funding after
BOX 4:Non-governmental organizations’ expenditures in developing countries
How much do NGOs spend in total in Uganda? In El Salvador? The answer is very hard to determine. NGOs gener-ally do not make country-specific expenditures publicly available. This limits researchers’ ability to analyze the distribution of DAH and measure its impact. Policymakers and planners in developing countries are also interested in tracking these funds.50 Donors do not require this type of reporting, and conversations between NGOs and IHME have revealed that few seem to have tracking systems in place that would make reporting country-specific expenditures feasible. Unless donors include requirements and provide additional funding to track and publicly report country-specific expenditures in grant agreements, NGOs will probably have little incentive to invest time and money into establishing more sophisticated tracking mechanisms and making these important data available.

28 INSTITUTE FOR HEALTH METRICS AND EVALUATION
India$3.75
Nigeria $2.88
Tanzania $2.43
Ethiopia $2.29
Kenya $2.06
Uganda $1.97
South Africa $1.94
Mozambique $1.70
Zambia $1.65
China $1.50
Percent
0 10 20 30 40 50 60 70 80 90 100
Source: IHME DAH Database (Country and Regional Recipient Level) 2011
Billions of 2009 US dollars
United States
United Kingdom
Japan
South Korea
Germany
France
Netherlands
Canada
Sweden
Norway
Italy
Other governments
European Commission
GFATM
GAVI
BMGF
World Bank
Regional development banks
The amount of DAH received by each country in billions of 2009 US dollars is shown below the name of the country. Only DAH allocable by country is reflected in the figure.
FIGURE 12: Top 10 recipients of DAH by percentage received from channels of assistance, 2004-2009
201358 could lead to large declines in DAH funding to these countries. Furthermore, the Dutch government announced in 2011 plans to stop providing foreign aid to Zambia and 12 other countries.59 The Dutch contrib-uted $118.00 million to Zambia in 2009, or 7% of Zambia’s total DAH.
Calculating DAH per disability-adjusted life year (DALY), a measure of years lost due to premature death and disability, is one way to assess how much DAH a country is getting relative to its health needs. The map shown in Figure 13 puts into perspective the country rankings of Figure 12. We were unable to extend this analysis to years 2010 and 2011 due to incomplete data on trans-fers from channels to recipient countries during this period. While Ethiopia was the fourth-highest recip-ient of DAH, it only received $8.93 of DAH per DALY from 2004 to 2009. Argentina, a more prosperous and healthier country and the thirteenth-largest recipient of DAH in 2010, received $32.22 per DALY. Argentina obtained 84% of its DAH from the World Bank from 2004 to 2009. In response to the Argentinian financial crisis in 2001 to 2002, the World Bank issued a large
portfolio of loans, including health loans, to the country as part of an economic stimulus package.60 Low-income countries in sub-Saharan Africa such as Chad and Sierra Leone received $4.28 and $6.21 dollars per DALY, respectively, while Botswana, an upper-middle-income country, received $95.07 per DALY. Botswana is a PEPFAR Partnership Framework country and received 92% of its DAH from the US between 2004 and 2009, while Chad and Sierra Leone are not PEPFAR Partner-ship Framework countries.61
To further understand the relationship between DAH and DALYs, we compare the top 30 recipients of DAH from 2004 to 2009 to countries ranked by total DALYs for 2004 in Figure 14. We were unable to present esti-mates for more recent years due to lack of data. South Africa, an upper-middle-income country that ranks 11th for total DALYs, is the seventh-largest recipient of DAH largely thanks to US grants from PEPFAR. Niger, a low-income country, ranks 29th for disease burden but does not appear on the list of top 30 recipients of DAH. In addition to Botswana, other PEPFAR Partnership Framework countries are among the top 30 recipients

DISTRIBUTION OF DEVELOPMENT ASSISTANCE FOR HEALTH 29
of DAH, including Nigeria, Tanzania, and Ethiopia, which appear at the top of the list, and Rwanda, which ranks 22nd.61
While DAH tends to go to countries with higher disease burden, there are a number of examples where factors such as focus on particular diseases (HIV/AIDS and malaria), efforts to bolster a country experiencing a financial crisis, and security interests can also influence where DAH is allocated.
DAH by health focus area
This section includes the amount of DAH that chan-nels of assistance earmarked for specific health issues. In addition, we quantify the amount of DAH for HIV/AIDS; maternal, newborn, and child health (MNCH); TB; and noncommunicable diseases (NCDs) that different countries received relative to each country’s burden of disease caused by these conditions. Due to lack of data on the specific health focus areas that donors are funding, we were unable to identify the amount of DAH going to these different areas for years beyond 2009.
To identify the amount of DAH going to different health focus areas, we used project codes, titles, and descriptions reported by channels of funding. We also classified all DAH from the Joint United Nations Programme on HIV/AIDS (UNAIDS) as DAH for HIV/AIDS and expenditures by GAVI and the United Nations Population Fund (UNFPA) as going to MNCH. When showing the channels that are funding different focus areas, we subtract any transfers between channels to avoid double counting. For example, funds that the UK gave to GFATM appear in the figures as coming from GFATM, making the UK’s contribution appear smaller than it actually was. Also, for those projects targeted toward multiple health focus areas (such as a project for both HIV/AIDS and TB), we assume those projects are divided equally among these areas. Another issue is that our estimates of the US’s allocation of DAH by health focus area between 2002 and 2004 are likely underestimated due to missing and abbreviated project descriptions.
We used DALY data for 2004 as a proxy for burden in all subsequent years. Countries that received no DAH over the study period and countries with zero or missing burden data are not shown. DAH received is shown in real 2009 US dollars.
$0 to $3.94
$3.94 to $8.47
$8.47 to $17.68
$17.68 to $29.57
$29.57 to $3,964.10
Dollars per DALY
Source: IHME DAH Database (Country and Regional Recipient Level) 2011
FIGURE 13: Total DAH per all-cause DALY, 2004-2009
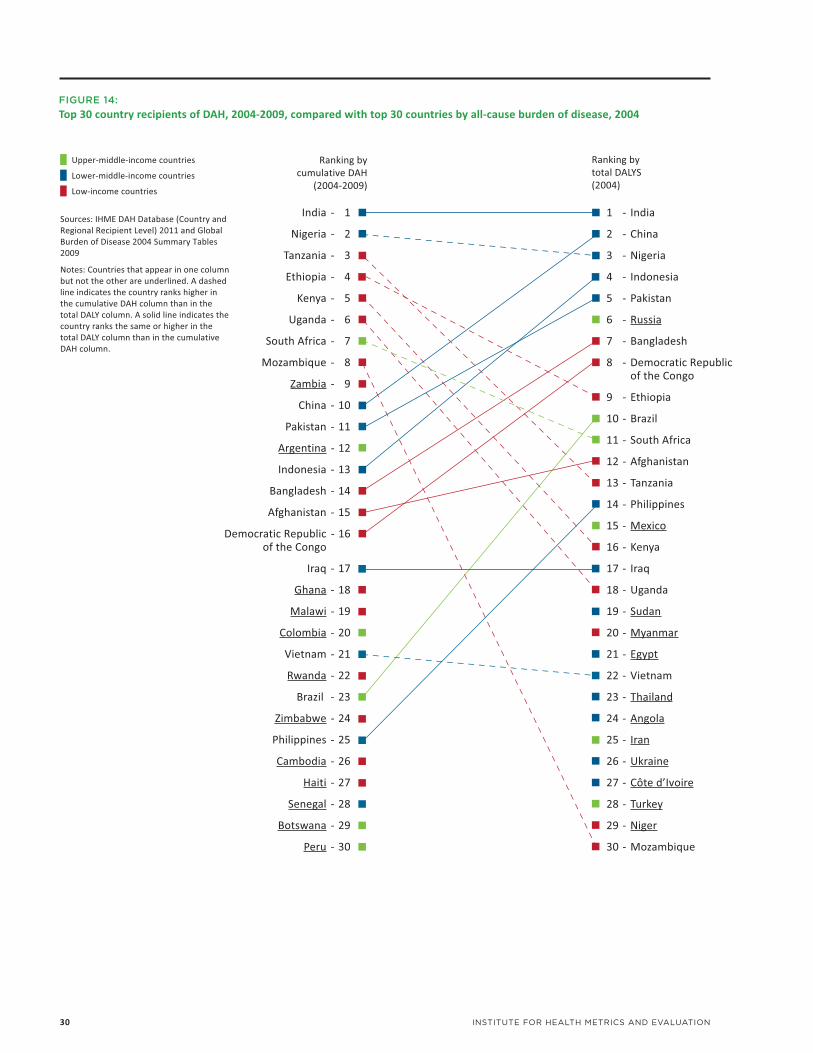
30 INSTITUTE FOR HEALTH METRICS AND EVALUATION
FIGURE 14: Top 30 country recipients of DAH, 2004-2009, compared with top 30 countries by all-cause burden of disease, 2004
Upper-middle-income countries
Lower-middle-income countries
Low-income countries
Ranking by cumulative DAH
(2004-2009)
Ranking by total DALYS(2004)
India - 1
Nigeria - 2
Tanzania - 3
Ethiopia - 4
Kenya - 5
Uganda - 6
South Africa - 7
Mozambique - 8
Zambia - 9
China - 10
Pakistan - 11
Argentina - 12
Indonesia - 13
Bangladesh - 14
Afghanistan - 15
Democratic Republic - 16 of the Congo
Iraq - 17
Ghana - 18
Malawi - 19
Colombia - 20
Vietnam - 21
Rwanda - 22
Brazil - 23
Zimbabwe - 24
Philippines - 25
Cambodia - 26
Haiti - 27
Senegal - 28
Botswana - 29
Peru - 30
1 - India
2 - China
3 - Nigeria
4 - Indonesia
5 - Pakistan
6 - Russia
7 - Bangladesh
8 - Democratic Republic of the Congo
9 - Ethiopia
10 - Brazil
11 - South Africa
12 - Afghanistan
13 - Tanzania
14 - Philippines
15 - Mexico
16 - Kenya
17 - Iraq
18 - Uganda
19 - Sudan
20 - Myanmar
21 - Egypt
22 - Vietnam
23 - Thailand
24 - Angola
25 - Iran
26 - Ukraine
27 - Côte d’Ivoire
28 - Turkey
29 - Niger
30 - Mozambique
Sources: IHME DAH Database (Country and Regional Recipient Level) 2011 and Global Burden of Disease 2004 Summary Tables 2009
Notes: Countries that appear in one column but not the other are underlined. A dashed line indicates the country ranks higher in the cumulative DAH column than in the total DALY column. A solid line indicates the country ranks the same or higher in the total DALY column than in the cumulative DAH column.

DISTRIBUTION OF DEVELOPMENT ASSISTANCE FOR HEALTH 31
FIGURE 15: DAH for HIV/AIDS; maternal, newborn, and child health; malaria; health sector support; tuberculosis; and noncommunicable diseases, 1990-2011
Bill
ions
of
2009
US
dolla
rs
28
26
24
22
20
18
16
14
12
10
8
6
4
2
0
1990
1991
1992
1993
1994
1995
1996
1997
1998
1999
2000
2001
2002
2003
2004
2005
2006
2007
2008
2009
2010
2011
Unallocable
Other
Noncommunicable diseases
Tuberculosis
Health sector support
Malaria
Maternal, newborn, and child health
HIV/AIDS
Preliminary estimates
Sources: IHME DAH Database 2011 and IHME DAH Database (Country and Regional Recipient Level) 2011
Notes: 2010 and 2011 are preliminary estimates based on information from channels of assistance, including budgets, appropriations, and correspondence. Data were unavailable to show total DAH by health focus area for 2010 and 2011.
“Unallocable” corresponds to DAH for which we did not have information on disease focus. “Other” represents DAH for other health focus areas not yet tracked by IHME.
5.82 5.676.29
6.76
8.067.82 8.158.63 8.94
9.8710.86 10.82
12.3213.23
15.00
16.86
18.41
21.20
24.88
25.6926.66
27.73
We have made changes that improved our estimates of DAH devoted to different health issues. We incor-porated more detailed data from the World Bank (a variable called “theme codes”) into our analysis to gain further insight into the projects it is funding. Furthermore, we identified and solved two technical challenges. One challenge resulted in the underesti-mation of health sector support from bilateral donors prior to 1999. Another prevented us from completely identifying health focus areas for European Commis-sion (EC) projects, which caused underestimation of the EC’s contribution to certain health issues. As a result of these subsequent changes, our research contains better information about how the World Bank and EC are allocating their DAH.
From 2008 to 2009, growth in DAH for some health issues slowed but sped up for others. Between 2008 and 2009, the growth rate of DAH for HIV/AIDS slowed to 5% from 21% between 2007 and 2008. Growth in DAH for TB and health sector support was also slower in comparison to the previous year. In contrast, DAH for malaria continued its rapid rise, increasing by around
50% for the second year in a row. While DAH for MNCH and NCDs barely increased from 2007 to 2008, their growth rate sped up to 9% and 17%, respectively, between 2008 and 2009.
Funding for HIV/AIDS by channel of assistance
As shown in Figure 16, between 2001 and 2002, DAH for HIV/AIDS started to expand to levels never seen before. It grew by $919.48 million between 2001 and 2003. Once PEPFAR began disbursing funds for HIV/AIDS in 2004, levels of funding shot up by $3.76 billion between 2004 and 2008. Between 2008 and 2009, year-to-year growth slowed to its lowest rate since 1997 to 1998. This is largely due to trends in HIV/AIDS expenditures from the largest channels, GFATM and the US. Between 2008 and 2009, GFATM’s HIV/AIDS expenditure decreased by 4%, while disbursements from the US did not increase as much as they have in the past (14% growth from 2008 to 2009 compared to 41% from 2007 to 2008). Lack of data from most chan-nels hindered us from estimating total DAH for HIV/AIDS past 2009. However, a recent study by the Kaiser

32 INSTITUTE FOR HEALTH METRICS AND EVALUATION
Mill
ions
of
2009
US
dolla
rs
7,000
6,000
5,000
4,000
3,000
2,000
1,000
0
198 214 234 244371365 426 448459 555
738897
1,397
1,816
2,471
3,160
4,076
6,544
6,228
5,151
1990
1991
1992
1993
1994
1995
1996
1997
1998
1999
2000
2001
2002
2003
2004
2005
2006
2007
2008
2009
Regional development banks
World Bank – IDA
World Bank – IBRD
BMGF
GFATM
United Nations and European Commission:
EC
UNAIDS
WHO
Bilateral agencies:
Other
United Kingdom
United States
* * *
Sources: IHME DAH Database 2011 and IHME DAH Database (Country and Regional Recipient Level) 2011
*2002-2004 US project descriptions lack detail, and thus DAH totals for those years may be incomplete.
FIGURE 16: DAH for HIV/AIDS by channel of assistance, 1990-2009
$0 to $25.25
$25.25 to $67.07
$67.07 to $179.48
$179.48 to $995.24
$995.24 to $159,179.50
Dollars per DALY
Source: IHME DAH Database (Country and Regional Recipient Level) 2011
We used DALY data for 2004 as a proxy for burden in all subsequent years. Countries that received no DAH over the study period and countries with zero or missing burden data are not shown. DAH received is shown in real 2009 US dollars.
FIGURE 17: DAH for HIV/AIDS per related DALY, 2004-2009

DISTRIBUTION OF DEVELOPMENT ASSISTANCE FOR HEALTH 33
Family Foundation and UNAIDS estimated that PEPFAR funding to countries declined 10% between 2009 and 2010.62 Our analysis of GFATM’s up-to-date financial data shows that its HIV/AIDS disbursements rose 20% from 2009 to 2010. For our 2012 Financing Global Health report, we will be able to use new data to eval-uate overall trends in HIV/AIDS DAH up to 2010.
As seen in Figure 12, low-income countries such as Kenya, Uganda, and Zambia figured high on the list of top recipients of DAH, largely due to HIV/AIDS DAH that they received. However, the map in Figure 17 shows that the HIV/AIDS DAH they received per HIV/AIDS DALY between 2004 and 2009 was much smaller than that received by richer countries such as Botswana and Chile. Countries that are of strategic interest to the US and their NATO allies such as Afghanistan and Jordan received some of the highest amounts of HIV/AIDS DAH per HIV/AIDS DALY, amounting to $5,172 and $1,083 per DALY, respectively. Cuba, which receives the majority of its money from GFATM, received $1,438 per HIV/AIDS DALY from 2004 to 2009. Small island nations in the South Pacific are outliers in this analysis and received the largest amounts of DAH for HIV/AIDS per HIV/AIDS DALY.
Funding for maternal, newborn, and child health by channel of assistance
MNCH has garnered much policy attention, given developing countries’ efforts to reach Millennium Development Goals (MDGs) 4 and 5, which include the reduction of child and maternal mortality rates by two-thirds and three-quarters, respectively, between 1990 and 2015.63
Our understanding of the amount of DAH allocated to MNCH has improved thanks to the use of additional data from the World Bank’s International Bank for Reconstruction and Development (IBRD) and Interna-tional Development Association (IDA). Last year, we did not track any DAH for MNCH coming from the World Bank. This year, we have a better understanding of contributions from this source. As a result, total DAH for MNCH is estimated to be greater than we reported last year (see Figure 18). The growth rate of DAH for MNCH has fluctuated greatly over time, increasing by 34% from 2006 to 2007, stagnating from 2007 to 2008, and then expanding again by 9% in 2009. From 2006 to
2009, GAVI’s dominance in the field of MNCH grew as it controlled an increasing share of the total. In contrast, DAH for MNCH from the United Nations Children’s Fund (UNICEF) as a share of total DAH has declined substan-tially. Also, the dominance of IBRD and IDA, measured by the percent of total DAH for MNCH that they spend, shrank from 24% of total DAH in 2006 to 8% in 2009. UNFPA’s contribution to MNCH as a share of total DAH has maintained its share of the total DAH, which was 20% in both 2006 and 2009. This contrasts with other traditional institutions, whose dominance in MNCH has declined in recent years. US DAH for MNCH grew at the end of the George W. Bush administration, increasing by 50% from 2007 to 2008. The US contribution to MNCH also jumped by 51% from 2008 to 2009 under Barack Obama’s administration. Future updates of this research will assess the impact of the current adminis-tration’s continued prioritization of MNCH through the Global Health Initiative on funding levels.64
DAH for MNCH is likely to increase in future years if donors honor commitments made in 2010. Donor governments at the Group of Eight summit in Muskoka, Canada, pledged to give $5.6 billion to the cause. Developing and developed country governments, as well as donors from the private sector, pledged $40 billion for the next five years to save mothers’ and children’s lives.65,66
As was reported last year, the range of MNCH dollars received by countries per MNCH DALY as shown in Figure 19 is much smaller than the extreme values seen in the map of DAH for HIV/AIDS per HIV/AIDS DALY. The country that received the largest amount per DALY ($314) is Argentina, whose largest donor was the World Bank. Overall, countries in South America receive some of the highest amounts of MNCH DAH per MNCH DALY, which contrasts starkly with poorer countries in sub-Saharan Africa, who receive lower amounts and have higher MNCH disease burden. A study by the Institute of Health Metrics and Evaluation (IHME) of progress toward MDGs 4 and 52 found that countries receiving more DAH for this health focus area such as Peru, Mongolia, and Egypt are on track to meet both MDGs, while other countries who are also expected to attain MDGs 4 and 5 (such as China, Libya, Maldives, Syria, and Tunisia) received around $1 of MNCH DAH or less per MNCH DALY.

34 INSTITUTE FOR HEALTH METRICS AND EVALUATION
FIGURE 18: DAH for maternal, newborn, and child health by channel of assistance, 1990-2009
Mill
ions
of
2009
US
dolla
rs
4,000
3,500
3,000
2,500
2,000
1,500
1,000
500
0
999 1,044
1,2841,393
2,0191,989
1,762 1,8351,836
2,213
2,523
2,837
2,165
2,360
2,837
3,199
2,699
3,987
3,6463,641
1990
1991
1992
1993
1994
1995
1996
1997
1998
1999
2000
2001
2002
2003
2004
2005
2006
2007
2008
2009
Regional development banks
World Bank – IDA
World Bank – IBRD
BMGF
GAVI
United Nations and European Commission:
EC
UNFPA
UNICEF
WHO
Bilateral agencies:
Other
United Kingdom
United States
* * *
Sources: IHME DAH Database 2011 and IHME DAH Database (Country and Regional Recipient Level) 2011
*2002-2004 US project descriptions lack detail, and thus DAH totals for those years may be incomplete.
$0 to $0.01
$0.01 to $2.03
$2.03 to $4.55
$4.55 to $12.13
$12.13 to $313.72
Dollars per DALY
Source: IHME DAH Database (Country and Regional Recipient Level) 2011
We used DALY data for 2004 as a proxy for burden in all subsequent years. Countries that received no DAH over the study period and countries with zero or missing burden data are not shown. DAH received is shown in real 2009 US dollars.
FIGURE 19: DAH for maternal, newborn, and child health per related DALY, 2004-2009

DISTRIBUTION OF DEVELOPMENT ASSISTANCE FOR HEALTH 35
Funding for malaria by channel of assistance
DAH for malaria experienced the fastest rate of growth from 2008 to 2009 (49%) among all the health focus areas that we tracked, and received nearly $2 billion in 2009. This stunning growth trend in malaria DAH began between 2007 and 2008, driven largely by dona-tions channeled through GFATM. Malaria DAH from GFATM increased by 44% from 2007 to 2008 and 96% between 2008 and 2009. It is important to keep in mind that channels such as the US and UK governments and BMGF actually contribute more to malaria than is shown in this figure since their contributions to GFATM are subtracted.
Following the Abuja Declaration in 2001 in Nigeria, where African leaders pledged to halve malaria deaths by 2010 and requested $1 billion per year from donors, malaria DAH rose slowly.67 In 2007, Bill and Melinda Gates held a meeting in Seattle and invited key global health players to join them in their quest to eradicate malaria, lending new energy to the cause.68 BMGF’s contributions to the fight against malaria have grown
over time. Excluding funds that it granted to other channels, shown in Figure 20, malaria DAH from BMGF grew 45% annually between 2006 and 2009. Funds from PMI, which started in 2005, and the 2008 Lantos-Hyde Act contributed to the growth of malaria DAH from the US.69 According to our estimates, only in 2008 did malaria DAH finally reach the $1 billion mark that African leaders originally requested in 2001 to meet the Abuja Declaration malaria mortality target.
The map of malaria DAH per related DALY in Figure 21 shows that the two countries that account for the largest number of malaria DALYs in the world, Nigeria and the Democratic Republic of the Congo, receive small sums of money per malaria DALY ($6 and $8 respectively) compared to other high-burden countries in Africa. For example, Ethiopia and Tanzania received $29 and $34 each per malaria DALY from 2004 to 2009. Nigeria and the Democratic Republic of the Congo became focus countries for PMI in 2011, joining other African countries such as Ethiopia, Tanzania, Mada-gascar, and Kenya. In general, PMI focus countries tended to receive larger sums of malaria DAH per DALY,
FIGURE 20: DAH for malaria by channel of assistance, 1990-2009
Mill
ions
of
2009
US
dolla
rs
2,000
1,500
1,000
500
037 40 29 28 50 47 53
127108158
239 230 218272
501
840793
1,338
1,999
892
1990
1991
1992
1993
1994
1995
1996
1997
1998
1999
2000
2001
2002
2003
2004
2005
2006
2007
2008
2009
Regional development banks
IDA
BMGF
GFATM
United Nations and European Commission:
EC
WHO
Bilateral agencies:
Other
United Kingdom
United States
* * *
Source: IHME DAH Database (Country and Regional Recipient Level) 2011
*2002-2004 US project descriptions lack detail, and thus DAH totals for those years may be incomplete.

36 INSTITUTE FOR HEALTH METRICS AND EVALUATION
$0 to $0.01
$0.01 to $11.82
$11.82 to $35.20
$35.20 to $303.94
$303.94 to $28,464.37
Dollars per DALY
Source: IHME DAH Database (Country and Regional Recipient Level) 2011
We used DALY data for 2004 as a proxy for burden in all subsequent years. Countries that received no DAH over the study period and countries with zero or missing burden data are not shown. DAH received is shown in real 2009 US dollars.
FIGURE 21: DAH for malaria per related DALY, 2004-2009
FIGURE 22: DAH for health sector support by channel of assistance, 1990-2009
Mill
ions
of
2009
US
dolla
rs
1,200
1,000
800
600
400
200
09 2
26 19 3514
83 7197
178
144
43
121160
267
542
907
1,234
1,166
1,021
1990
1991
1992
1993
1994
1995
1996
1997
1998
1999
2000
2001
2002
2003
2004
2005
2006
2007
2008
2009
Regional development banks
World Bank – IDA
World Bank – IBRD
EC
Bilateral agencies:
Other
Spain
Sweden
Denmark
Netherlands
Norway
United Kingdom
United States
* * *
Source: IHME DAH Database (Country and Regional Recipient Level) 2011
*2002-2004 US project descriptions lack detail, and thus DAH totals for those years may be incomplete.
Notes: For search terms used to define health sector support, please visit our online Methods Annex at: http://www.healthmetricsandevaluation.org/publications/financing_global_health_2011_methods_IHME.pdf

DISTRIBUTION OF DEVELOPMENT ASSISTANCE FOR HEALTH 37
due in part to their inclusion in this program. In future updates of this research, the status of Nigeria and the Democratic Republic of the Congo as PMI focus coun-tries may translate to higher levels of malaria funding per DALY. Overall, countries in Central and South-east Asia receive much larger sums of malaria DAH per malaria DALY than sub-Saharan Africa, where the greatest levels of malaria burden exist.
Funding for health sector support by channel of assistance
Health sector support includes grants that a recipient country government can use to fund any area of the health sector. Health sector support is related to the principle of alignment established by the Paris Decla-ration on Aid Effectiveness, in which donors pledged to provide aid that corresponds with countries’ priori-ties and channel assistance through the treasuries of developing countries.44 Tracking DAH for health sector support reveals that the Paris Declaration has fueled increases of DAH for this area since 2005, but it remains much smaller than DAH for HIV/AIDS and MNCH. Health sector support was 5% of total DAH in 2009 compared to 25% for HIV/AIDS and 16% for MNCH.
We have revised our estimates of DAH for health sector support due to some key improvements described earlier, resulting in slightly larger esti-mates of DAH for health sector support from the EC and of total DAH for health sector support prior to 1999. Also, methodological changes have led to better assessment of the World Bank’s contribution to health sector support (see Methods Annex: http://www.healthmetricsandevaluation.org/publications/financing_global_health_2011_methods_IHME.pdf).
European bilateral agencies and the EC have been the main drivers of the increase in DAH for health sector support. Combined, the six largest bilateral donors of health sector support in Europe increased their contri-bution at a rate of 39% from 2005 to 2009, with the UK contributing the largest amount. Five of the six European donors are part of the International Health Partnership and Related Initiatives (IHP+), an organiza-tion that aims to work together to implement the Paris Declaration and Accra Agenda for Action, endorsed in Ghana in 2008.70 DAH for health sector support from the EC peaked in 2006 at $284.77 million and shrank to $164.14 million in 2009. Although the US signed the Paris Declaration, the amount of DAH that it provides for health sector support has decreased from $158.65 million in 2005 to $54.36 million in 2009.
Funding for tuberculosis by channel of assistance
The global health community has recently paid more attention to TB since the HIV/AIDS epidemic caused a large increase in the number of cases. The likelihood of people with HIV/AIDS developing active TB is 50 times greater than those without HIV/AIDS.71 As some people being treated for TB have failed to complete the six-month antibiotic treatment regimen, strains of multidrug-resistant and extremely drug-resistant TB have developed.72 These conditions are more expensive to treat and require longer treatments.72 In addition to the growing number of TB cases and the emergence of drug-resistant strains of the disease, TB poses a threat across borders as increasing numbers of people emigrate or travel to other countries.
To address the challenge of fighting TB, the Stop TB Part-nership led by WHO estimates that $47 billion would be required from 2011 to 2015.73 Our estimates show that TB funding surpassed $1 billion for the first time in 2009 (see Figure 23). Furthermore, growth in DAH for TB began to slow between 2008 and 2009. While donors such as the US government and BMGF have pledged to expand TB funding,74,75 it seems unlikely that DAH for TB will attain the Stop TB target funding levels should the current pace of funding continue.
GFATM, BMGF, and WHO are the channels of assistance that have contributed the largest amounts of resources to TB. Since 2004, BMGF and GFATM have experienced some of the most rapid growth rates among the chan-nels, growing by 34% and 24%, respectively, over each year from 2004 to 2009. DAH channeled through WHO grew 7% annually during this period. From 2004 to 2009, DAH from the World Bank IDA and IBRD shrank by 9% annually. DAH for TB from the UK expanded greatly (21%) from 2008 to 2009.
In Figure 24 the map of TB DAH per related DALY shows that some low-income countries with among the highest TB burdens such as Ethiopia, Kenya, and Uganda receive little DAH per TB DALY compared to wealthier countries such as Botswana and Peru. From a different perspective, it is interesting to examine DAH per DALY amounts flowing to countries that have some of the highest levels of multidrug-resistant TB, such as India, China, and Russia. Russia receives $21 per TB DALY, while China and India receive $9 and $5 per DALY, respectively. Given that multidrug-resistant TB poses a serious threat to public health in these countries and other nations, it is surprising to see the substantially lower funding levels of DAH per TB DALY in India and China compared to Russia, a richer country.

38 INSTITUTE FOR HEALTH METRICS AND EVALUATION
Funding for noncommunicable diseases by channel of assistance
NCDs recently generated worldwide attention at the September 2011 UN High-Level Meeting on Noncom-municable Diseases. NCDs such as cancer, heart disease, and diabetes have long been viewed as health issues that plague rich countries. Research has shown, however, that NCDs disproportionately affect the developing world. According to Dr. Ala Alwan of the WHO, premature death (mortality before age 60) from NCDs in poor countries is three times higher than in rich countries.76 New research from IHME reported that breast cancer deaths in developing regions are over two times higher than in developed regions.77 For cervical cancer, IHME found that developing regions account for 76% of new cases.77 While risk factors such as tobacco, harmful alcohol use, and overweight and obesity that drive increases in NCDs are similar across developed and developing countries, developing coun-tries have fewer resources to treat and prevent them. In its 2010 Global Risks report, the World Economic Forum noted that NCDs pose a major threat to the world economy, as they will strain national budgets by
raising health care costs and reducing economic growth and worker productivity.78
At the High-Level Meeting on Noncommunicable Diseases, the summit’s declaration noted that current levels of local, national, and international funding are insufficient to deal with the size of the problem posed by NCDs. The declaration called for increased and long-term funding for NCDs, but no specific funding target was announced at the summit. Future updates of this research will assess the amount of additional resources mobilized for NCDs as a result of this high-level meeting.79
While NCDs represent 45% of the overall disease burden in developing regions,80 DAH for NCDs was just 1% of total DAH in 2009. While NCDs represent the smallest amount of DAH compared to the other health focus areas we are tracking, our updated estimates show that it was slightly higher than we reported in last year’s Financing Global Health report.16 This is due to our new methods for estimating DAH from the World Bank as well as the addition of data from another channel, the Bloomberg Family Foundation. Bloomberg
Mill
ions
of
2009
US
dolla
rs
1,000
800
600
400
200
0
49 59 5975 67 75
102 8886108
156
188223
288
468
508
633
936
1,021
777
1990
1991
1992
1993
1994
1995
1996
1997
1998
1999
2000
2001
2002
2003
2004
2005
2006
2007
2008
2009
Regional development banks
World Bank – IDA
World Bank – IBRD
BMGF
GFATM
United Nations and European Commission:
EC
WHO
Bilateral agencies:
Other
United Kingdom
United States
* * *
Source: IHME DAH Database (Country and Regional Recipient Level) 2011
*2002-2004 US project descriptions lack detail, and thus DAH totals for those years may be incomplete.
FIGURE 23: DAH for tuberculosis by channel of assistance, 1990-2009

DISTRIBUTION OF DEVELOPMENT ASSISTANCE FOR HEALTH 39
FIGURE 25: DAH for noncommunicable diseases by channel of assistance, 1990-2009
Regional development banks
World Bank:
IDA
IBRD
US foundations:
BMGF
Bloomberg Family Foundation
United Nations and European Commission:
EC
WHO
Bilateral agencies:
Other
United Kingdom
United States
Mill
ions
of
2009
US
dolla
rs
300
250
200
150
100
50
0
31 3137
101108
59
72
61
8583
139
117
143
130
105
160
140
226
268
228
1990
1991
1992
1993
1994
1995
1996
1997
1998
1999
2000
2001
2002
2003
2004
2005
2006
2007
2008
2009
* * *
Source: IHME DAH Database (Country and Regional Recipient Level) 2011
*2002-2004 US project descriptions lack detail, and thus DAH totals for those years may be incomplete.
$0 to $0.01
$0.01 to $8.95
$8.95 to $21.54
$21.54 to $56.12
$56.12 to $25,042.08
Dollars per DALY
Source: IHME DAH Database (Country and Regional Recipient Level) 2011
We used DALY data for 2004 as a proxy for burden in all subsequent years. Countries that received no DAH over the study period and countries with zero or missing burden data are not shown. DAH received is shown in real 2009 US dollars.
FIGURE 24: DAH for tuberculosis per related DALY, 2004-2009

40 INSTITUTE FOR HEALTH METRICS AND EVALUATION
$0 to $0.01
$0.01 to $0.05
$0.05 to $0.25
$0.25 to $174.93
Dollars per DALY
We used DALY data for 2004 as a proxy for burden in all subsequent years. Countries that received no DAH over the study period and countries with zero or missing burden data are not shown. DAH received is shown in real 2009 US dollars.
Source: IHME DAH Database (Country and Regional Recipient Level) 2011
FIGURE 26: DAH for noncommunicable diseases per related DALY, 2004-2009
Family Foundation, the largest donor to NCDs in 2009, funds tobacco reduction initiatives around the world. Other large contributors include WHO and the World Bank (IDA and IBRD). Between 2004 and 2009, the World Bank’s contribution to NCDs has grown by 21% annually, while DAH for NCDs channeled through WHO has decreased by 1% annually. BMGF’s funding of DAH for NCDs, which funds cervical cancer prevention as well as tobacco control, grew by 49% annually over this period.
Will the global health community’s efforts to increase both awareness and DAH for NCDs succeed in raising its funding to levels that other heath focus areas have reached? Some experts, such as David Fidler from Indiana University, argue that NCDs generate less of a “human dignity pull” than communicable diseases such as malaria, since many cases can be linked to behavior such as poor diet and smoking.81 Devi Sridhar and colleagues noted the difficulty of garnering support for NCDs from donors in the current economic climate.82 Recent pledges to increase funding for breast and cervical cancer prevention, screening, and treatment
from the US government via PEPFAR may translate to more DAH for NCDs in future years, particularly among people living with HIV/AIDS.83
It is difficult to trace all NCD-specific DAH to the country level, and we were unable to trace DAH flowing through WHO and the Bloomberg Family Foundation to countries, as country-specific disbursement data are not available. For DAH that we could trace to the country level, the map of DAH for NCDs per related DALY in Figure 26 shows that many countries receive relatively few dollars per NCD DALY. With the exception of Tonga, which receives nearly $200 per NCD DALY, no country received more than $7 per NCD DALY. In low-income countries that face the challenge of addressing both noncommunicable and communicable diseases, these extremely low levels of funding paint a picture of places where HIV-positive women may have access to antiretroviral therapy funded by foreign donors, while women with breast cancer likely have very few treat-ment options.84

PART TWO:
GOVERNMENT HEALTH EXPENDITURE
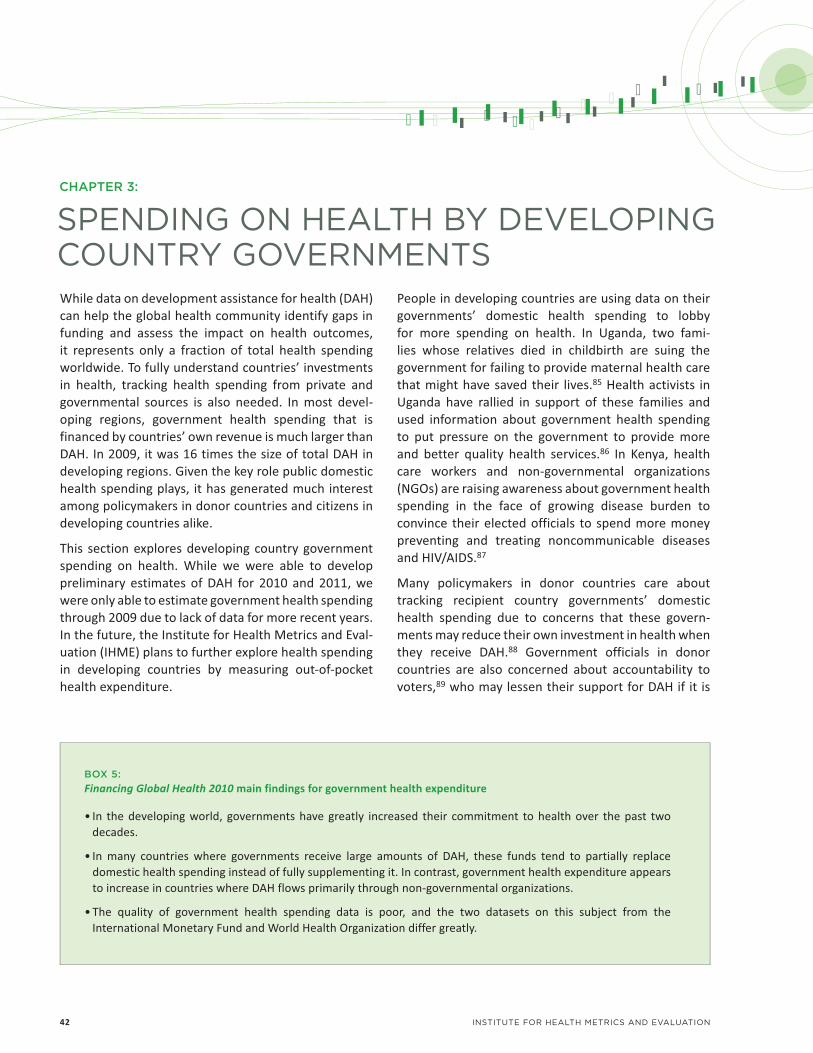
42 INSTITUTE FOR HEALTH METRICS AND EVALUATION
SPENDING ON HEALTH BY DEVELOPING COUNTRY GOVERNMENTS
CHAPTER 3:
While data on development assistance for health (DAH) can help the global health community identify gaps in funding and assess the impact on health outcomes, it represents only a fraction of total health spending worldwide. To fully understand countries’ investments in health, tracking health spending from private and governmental sources is also needed. In most devel-oping regions, government health spending that is financed by countries’ own revenue is much larger than DAH. In 2009, it was 16 times the size of total DAH in developing regions. Given the key role public domestic health spending plays, it has generated much interest among policymakers in donor countries and citizens in developing countries alike.
This section explores developing country government spending on health. While we were able to develop preliminary estimates of DAH for 2010 and 2011, we were only able to estimate government health spending through 2009 due to lack of data for more recent years. In the future, the Institute for Health Metrics and Eval-uation (IHME) plans to further explore health spending in developing countries by measuring out-of-pocket health expenditure.
People in developing countries are using data on their governments’ domestic health spending to lobby for more spending on health. In Uganda, two fami-lies whose relatives died in childbirth are suing the government for failing to provide maternal health care that might have saved their lives.85 Health activists in Uganda have rallied in support of these families and used information about government health spending to put pressure on the government to provide more and better quality health services.86 In Kenya, health care workers and non-governmental organizations (NGOs) are raising awareness about government health spending in the face of growing disease burden to convince their elected officials to spend more money preventing and treating noncommunicable diseases and HIV/AIDS.87
Many policymakers in donor countries care about tracking recipient country governments’ domestic health spending due to concerns that these govern-ments may reduce their own investment in health when they receive DAH.88 Government officials in donor countries are also concerned about accountability to voters,89 who may lessen their support for DAH if it is
BOX 5:Financing Global Health 2010 main findings for government health expenditure
��#� � � � X ��]��� ������� ��X �� �� ��X � �� ��?� ��� �� �� � ��� ������ � �� � ���� �X �� � � ]��� ���decades.
��#� ��?� ����� �� �� � � ��X �� �� � � �X � ���� � ������ �'� ����� � � � '���� �� �� ]������?� � ]��� �domestic health spending instead of fully supplementing it. In contrast, government health expenditure appears to increase in countries where DAH flows primarily through non-governmental organizations.
���� � �����?� �'� ��X �� � � ���� �] ���� ���� ��� ]����� ��� � � ��� ���� �� �� ���� ���� �� '���� � � International Monetary Fund and World Health Organization differ greatly.

SPENDING ON HEALTH BY DEVELOPING COUNTRY GOVERNMENTS 43
not fully supplementing what they perceive to be inad-equate levels of health spending in poor countries.
While DAH may help speed up developing countries’ efforts to meet the Millennium Development Goals (MDGs) by 2015, countries’ own spending often plays a much larger role. The importance of public domestic health spending in fighting infectious diseases was acknowledged by African leaders in 2001 when they pledged to spend 15% of their total budget on health, known as the Abuja targets.90 African leaders recently reaffirmed this commitment at the 15th African Union Summit in 2010.91
Furthermore, governments’ domestic health spending funds essential elements that form the backbone of health systems, such as the construction of hospi-tals, electricity or gas to power the refrigerators to prevent vaccines from spoiling, and the salaries of health workers. In contrast, much of DAH is earmarked by donors to combat diseases such as HIV/AIDS and malaria. While it may be vital for developing coun-tries who find themselves struggling to fight specific diseases, DAH cannot adequately substitute for core health system funding provided by governments.89
Despite many different stakeholders’ demands for public domestic health spending data, few organi-zations are pushing for increased transparency and improved quality in this area. Some organizations are drawing attention to the importance of transparency in budget and expenditure data in developing countries, such as the International Budget Partnership,92 but they are not as numerous as the multiple organizations that monitor spending data on the donor side. In contrast, many academics, policymakers, NGOs, and advocacy organizations focus on the volume and transparency of development assistance from public and private donors. For example, organizations such as ONE, which advocates for poverty reduction and disease preven-tion around the world, track foreign assistance and monitor donors’ fulfillment of their aid targets, while others such as the International Aid Transparency Initiative and Publish What You Fund encourage donors to put timely, detailed, and comparable aid data in the public domain.93-95
Measuring government health expenditure from domestic sources
It is challenging for many reasons to measure govern-ment health expenditure as source (GHE-S), referring to public spending on health that comes only from domestic financing. The World Health Organization
(WHO) is the only organization to regularly publish estimates of government health expenditure in their National Health Accounts (NHA) database.96 In the past, IHME obtained data on government health expen-diture from the International Monetary Fund (IMF), but updated estimates for recent years are not currently available.97 Having more than one data source is useful because it allows us to compare the consistency of our findings across different sources. In Financing Global Health 2010, our overall conclusions were similar across datasets. For certain countries, however, the two datasets yielded conflicting results. The availability of multiple datasets serves as an additional means to test the strength of our findings.
In addition to having only one regularly updated data source to work with, another challenge lies in the large quantity of data (53%) that were either partially or fully created by WHO using modeling techniques that could not easily be replicated by others, or were unre-alistically high or low compared to trends we observed within and across countries. A small portion of obser-vations in the dataset (7%) were not reported by WHO.
In order to produce the best possible dataset of public domestic health spending, we used only portions of the government health expenditure data that were derived from sources such as consultations with ministries of health, publications from governments, the IMF, the World Bank, and NHA reports. We also improved the NHA dataset by using a widely used method that could be replicated by other researchers to estimate data not derived from cited sources (for more information, see the online Methods Annex at http://www.healthmetricsandevaluation.org/publica-tions/financing_global_health_2011_methods_IHME.pdf). While IHME can use rigorous scientific methods to compensate for gaps in the data, the most important improvements in the data need to be made by donors and organizations involved in the collection of these data. Given the relevance of government health expen-diture data to policymaking and planning, increased investment in the collection of this information is urgently needed.
Another issue that we highlighted in Financing Global Health 2010 is that the data provided by WHO include government health expenditure as agent (GHE-A), which is government health spending financed by both domestic taxpayers and foreign donors. In order to obtain GHE-S from the WHO data, IHME subtracts its estimates of DAH channeled to governments (DAH-G) from GHE-A provided by WHO.

44 INSTITUTE FOR HEALTH METRICS AND EVALUATION
TABLE 4: Data sources used to estimate GHE-S
*Covariates include government health expenditure as agent as a fraction of national GDP (GHE-A/GDP) and government health expenditure as agent as a fraction of general government expenditure (GHE-A/GGE) from IMF; DAH channeled through a country’s government as a fraction of national GDP (DAH-G/GDP); DAH channeled through non-governmental sectors as a fraction of national GDP (DAH-NG/GDP); debt relief received by government as a fraction of national GDP (debt relief/GDP) from the IMF; national GDP per capita from the IMF with a one-year lead and lag; HIV prevalence as a percentage of national population; average per capita income over the past 10 years; GDP per capita growth rate; general government expenditure as a fraction of national GDP (GGE/GDP) from the World Bank and WHO; and current as well as three-year leads and lags of government health expenditure as source as a fraction of national GDP (GHE-S/GDP) from WHO NHA data. “Lags” and “leads” refer to using previous and future values of a given variable to impute a value for a given year.
†Covariates and Bayesian priors based on plausible WHO NHA data were used to refine our estimates of government health expenditure as source.
‡WHO NHA data were not used because data points were missing from WHO NHA database.
Percentage of data points
AllData sources used 1995 1996 1997 1998 1999 2000 2001 2002 2003 2004 2005 2006 2007 2008 2009 years
WHO NHA 40% 38% 38% 43% 43% 42% 40% 41% 41% 43% 53% 45% 42% 37% 29% 41% database
WHO NHA 52% 54% 54% 49% 49% 50% 53% 52% 52% 51% 50% 48% 52% 57% 65% 53%database plus covariates*†
Covariates*‡ 7% 7% 7% 7% 7% 7% 7% 7% 7% 7% 7% 7% 7% 7% 7% 7%
BOX 6:Acronyms
DAH-G Development assistance for health channeled to government
DAH-NG Development assistance for health channeled to non-governmental sectors
GDP Gross domestic product
GGE General government expenditure
GHE-A Government health expenditure as agent, domestic- and donor-funded financing
GHE-S Government health expenditure as source, domestic-only financing

Trends in country spending on health programs in developing regions
This section explores trends in three different types of health spending in developing countries, public domestic health spending, DAH flowing to governmental sectors, and DAH channeled to non-governmental sectors, over the period 1995 to 2009.
Our findings show that governments’ domestic health expenditure has increased over time in developing regions, growing at a rate of 5% between 2000 and 2003 and 9% from 2003 to 2006. As global financial woes spread to world economies during the period 2008 to 2009, many global health leaders and devel-opment organizations predicted that the recession would lead to reduced government health spending in developing countries due to declines in gross domestic product (GDP) and donors slashing foreign aid budgets.18,98 Instead of slowing as a result of the global financial crisis, our estimates indicate that the growth rate of public domestic health spending actu-ally sped up between 2008 and 2009, increasing from $368.46 billion to $410.50 billion. These findings bode well for the attainment of the MDG targets by 2015.
The East Asia region, which is driven by China’s health spending, accounted for 44% of this increase from 2008 to 2009, while the regions of Tropical and South Latin America were also responsible for this upward trend, accounting for 15% and 10% of the increase in GHE-S, respectively.
Trends in governments’ domestic health spending have shifted over the last decade. Back in 2001, public domestic health spending from North Africa/Middle East and Tropical Latin America represented a greater share of the total than East Asia. That year, North Africa/Middle East and Tropical Latin America repre-sented 19% ($39.64 billion) and 18% ($37.20 billion) of total GHE-S, respectively, while East Asia represented 17% of total GHE-S ($36.08 billion). Similar to what we reported last year, the region that spent the largest amount of its own resources on health in 2009 was East Asia (28% of total GHE-S, or $113.85 billion), followed by North Africa/Middle East and Tropical Latin America, each of which represented 16% of total GHE-S in 2009 ($67.69 billion and $65.34 billion, respectively).
The regions where governments spent the smallest amounts of their own resources on health were
SPENDING ON HEALTH BY DEVELOPING COUNTRY GOVERNMENTS 45
Bill
ions
of
2009
US
dolla
rs
400
350
300
250
200
150
100
50
0
150.53158.25
173.08182.77
199.22192.46208.87
219.32228.77
248.69264.20
296.07
331.72
368.46
410.50
Sub−Saharan Africa, West
Sub−Saharan Africa, South
Sub−Saharan Africa, East
Sub−Saharan Africa, Central
Oceania
North Africa / Middle East
Latin America, Tropical
Latin America, South
Latin America, Central
Latin America, Andean
Caribbean
Asia, Southeast
Asia, South
Asia, East
Asia, Central
Source: IHME Government Health Spending Database (Developing Countries) 2011
1995
1996
1997
1998
1999
2000
2001
2002
2003
2004
2005
2006
2007
2008
2009
FIGURE 27: GHE-S by Global Burden of Disease developing region, 1995-2009

Bill
ions
of
2009
US
dolla
rs
11
10
9
8
7
6
5
4
3
2
1
0
1.721.84
2.282.12
2.58
4.05 4.183.83
4.47
5.074.72 4.65
Sub−Saharan Africa, West
Sub−Saharan Africa, South
Sub−Saharan Africa, East
Sub−Saharan Africa, Central
Oceania
North Africa / Middle East
Latin America, Tropical
Latin America, South
Latin America, Central
Latin America, Andean
Caribbean
Asia, Southeast
Asia, South
Asia, East
Asia, Central
Source: IHME DAH Database 2011
1995
1996
1997
1998
1999
2000
2001
2002
2003
2004
2005
2006
2007
2008
2009
1.71
2.92
1.611.99
2.26
2.762.52
3.17
4.65
5.35
6.75
8.14
8.91
9.93
11.06
2.05
3.34
The upper-most number in each column is the sum of DAH-G and DAH-NG for each year.
1.45
FIGURE 28: DAH-G by Global Burden of Disease developing region, 1995-2009
46 INSTITUTE FOR HEALTH METRICS AND EVALUATION
Oceania, the Caribbean, and East and Central sub-Saharan Africa. GHE-S from each of these regions made up approximately 1% or less of total GHE-S from 1995 to 2009. In 2009, these regions spent $358.13 million, $2.91 billion, $3.26 billion, and $4.31 billion, respectively.
Yet another way to quantify levels of government investment in health is to measure dollars spent per person. Measured this way, governments in South, Tropical, and Central Latin America and South sub-Saharan Africa ranked highest for dollars of domestic health spending per person during the period 2000 to 2009. These regions spent $452, $327, $241, and $169 per person in 2009, respectively. East and West sub-Saharan Africa and Southeast and South Asia ranked among the lowest five regions in terms of public domestic health spending per person over the period 2000 to 2009, and spent the following amounts per person in 2009, respectively: $10, $17, $41, and $12.
While some of the poorest areas in the world, such as East, Central, and West sub-Saharan Africa, spend very little on health compared to wealthier regions,
public investment in health continues to grow in these regions. For example, in East sub-Saharan Africa, GHE-S was $1.69 billion in 2000. In this region, governments’ domestic health spending nearly doubled over the last decade, reaching $3.26 billion in 2009.
To better understand what was happening at the regional and country level in terms of external invest-ment in health, we tracked DAH through different channels of assistance to governmental (DAH-G) and non-governmental (DAH-NG) sectors in countries and subtracted loans from these estimates. In most regions, DAH was much smaller than public domestic health spending. In Southeast Asia in 2009, for example, GHE-S was 30 times greater than DAH to governmental and non-governmental sectors combined. The only developing region where DAH flowing to governmental and non-governmental sectors is greater than govern-ments’ domestic health spending is East sub-Saharan Africa, where it was 11% larger in 2009.
DAH to governments has generally increased over time. Its growth rate was 57% from 2002 to 2003 ($2.58 billion to $4.05 billion), which represented its

SPENDING ON HEALTH BY DEVELOPING COUNTRY GOVERNMENTS 47
largest single increase during the entire period of 1995 to 2009. DAH-G continued to grow at a slower rate through 2007, with the exception of an 8% decrease between 2004 and 2005 ($4.18 billion to $3.83 billion). From 2007 to 2008 and 2008 to 2009, however, it actu-ally declined by 7% ($5.07 billion to $4.72 billion) and 1% ($4.72 billion to $4.65 billion), respectively.
In 2009, three regions stood out as receiving large shares of total DAH-G: East sub-Saharan Africa received 30% ($1.38 billion), South Asia received 19% ($880.28 million), and West sub-Saharan Africa received 17% ($771.36 million). South Asia’s share may be explained by the fact it includes some of the most populous coun-tries such as India, Pakistan, and Bangladesh. The fact that two sub-Saharan African regions are among the top recipients of DAH-G recipients tells us that much of this assistance is flowing to some of the poorest areas of the world. In contrast, three Latin American regions received the lowest amounts of DAH in 2009: Tropical Latin America, Andean Latin American, and South Latin America combined receive only 1.6% of total DAH-G.
Trends in DAH to non-governmental sectors differed markedly from DAH to governmental sectors. DAH
received by non-governmental sectors grew much more dramatically during the last decade compared to DAH-G. Its rapid increase is largely due to the US President’s Emergency Plan for AIDS Relief (PEPFAR) program that began disbursing funds for HIV/AIDS in 2004. DAH-NG increased nearly 10-fold from $601.62 million in 2003 to $6.41 billion in 2009.
The non-governmental sectors in regions receiving some of the largest shares of DAH since 2002 were located in sub-Saharan African regions (East, West, and South) and South Asia. In 2009, these regions received $2.23 billion, $1.16 billion, $805.32 million, and $689.39 million, respectively. Similar to DAH received by governmental sectors, the largest amounts of DAH-NG went to East sub-Saharan Africa in 2009 and represented 35% of the total. Oceania and Tropical and South Latin America have consistently obtained some of the smallest amounts of DAH to non-governmental sectors over time. In 2009, these regions received less than 1% of total DAH-NG ($72.29 million, $33.31 million, and $1.70 million, respectively).
Bill
ions
of
2009
US
dolla
rs
11
10
9
8
7
6
5
4
3
2
1
0
Sub−Saharan Africa, West
Sub−Saharan Africa, South
Sub−Saharan Africa, East
Sub−Saharan Africa, Central
Oceania
North Africa / Middle East
Latin America, Tropical
Latin America, South
Latin America, Central
Latin America, Andean
Caribbean
Asia, Southeast
Asia, South
Asia, East
Asia, Central
Source: IHME DAH Database 2011
1995
1996
1997
1998
1999
2000
2001
2002
2003
2004
2005
2006
2007
2008
2009
The upper-most number in each column is the sum of DAH-G and DAH-NG for each year.
0.16 0.270.42 0.480.40
0.59 0.60
1.18
2.92
3.673.84
5.21
6.41
0.34 0.42
1.611.99
2.26
2.762.52
3.17
4.65
5.35
6.75
8.14
8.91
9.93
11.06
2.05
3.34
FIGURE 29: DAH-NG by Global Burden of Disease developing region, 1995-2009

48 INSTITUTE FOR HEALTH METRICS AND EVALUATION
IMPACT OF DEVELOPMENT ASSISTANCE FOR HEALTH ON COUNTRY GOVERNMENT SPENDING
CHAPTER 4:
Given the urgency of attaining the Millennium Devel-opment Goals (MDGs) by 2015, it has become even more important to identify the factors that influence governments’ domestic health spending in addition to measuring its volume. A review of the scientific literature revealed multiple factors: total government spending (also known as general government expen-diture, or GGE), gross domestic product (GDP), forgiveness of debt incurred by the government, the percentage of people living with HIV, and development assistance for health (DAH).99-107
Since DAH has risen rapidly over the past decade, we were particularly interested in studying how it affects government health expenditure as source (GHE-S). For over 30 years, many economists have concluded that sector-specific foreign assistance to govern-ments tends to cause recipient countries to shift their own spending away from the sector that receives the aid.102,108-112 Similarly, recent studies have found that recipient governments, on average, spend less of their own money on health if they receive health assistance.89,103,113,114 DAH that goes to the non-govern-mental sector (DAH-NG) in a country is another factor that influences GHE-S.89
Last year, we studied the relationship between DAH and public domestic health spending. We found that for every $1 of DAH channeled through government (DAH-G) that flowed to a country, governments on average took $0.43 to $1.14 of their own money away from the health sector. We call this phenomenon “subadditionality,” which occurs when DAH to govern-ment partially or fully substitutes for public domestic health spending. The opposite phenomenon, or “addi-tionality,” happens when DAH-G fully supplements GHE-S.
This year, we updated our research and reached similar findings. We used the baseline methods from Financing Global Health 2010 and incorporated minor improve-ments such as including time trends and employing two-step estimation process.115,116 Our results indicate that subadditionality continued to occur when govern-ments in developing countries received DAH. After adding data for years 2007 through 2009 to our dataset, we found that as a whole, governments tend to take $0.56 out of the health sector for every $1 of DAH that they receive with a 95% confidence interval of $0.34 to $0.78. The fact that we obtained similar results with the addition of new data suggests that governments, on average, react to DAH in a manner that is consistent over time. This does not mean that these findings apply to all nations, as averages mask important variations across countries.16 We are in the process of updating country-level estimates of additionality, which we plan to publish in the future.
Other factors that we found to be significantly related to governments’ domestic health spending in our analysis included DAH to non-governmental sectors and government size. Since government size is rela-tively constant over time, DAH-G and DAH-NG have unique roles as primary determinants of fluctuations in GHE-S. This allows us to observe the impact of DAH to governmental and non-governmental sectors on public domestic health spending over time.
To illustrate the important and dynamic effects of DAH to governmental and non-governmental sectors on public domestic health spending, we consider the region that received more DAH-G and DAH-NG than any other, East sub-Saharan Africa. As shown in Figure 30, from 2006 to 2007, DAH to governmental sectors increased

IMPACT OF DEVELOPMENT ASSISTANCE FOR HEALTH ON COUNTRY GOVERNMENT SPENDING 49
324
204
-182
57
Sources: IHME Government Health Spending Database (Developing Countries) 2011, IHME DAH Database (Country and Regional Recipient Level) 2011, and covariates (GDP, general government expenditure, debt relief, and HIV prevalence)
Notes: DAH and GHE-S regional relationship based on all-region analysis.
DAH-G
DAH-NG
Effect of DAH-G on GHE-S
Effect of DAH-NG on GHE-S
Mill
ions
of
2009
US
dolla
rs
Mill
ions
of
2009
US
dolla
rs
Changes in DAH Effects of changes in DAH on GHE-S
FIGURE 30: Relationship between GHE-S and DAH-G in East sub-Saharan Africa, 2006-2007
by $324.44 million, while DAH to non-governmental sectors rose by $204.22 million. These two forms of DAH had opposite effects on public domestic health spending during this period: DAH-G led to decreases in GHE-S, while increases in DAH-NG led to increases in GHE-S. Still, the upward pressure that DAH to non-governmental sectors has on governments’ domestic health spending is smaller in magnitude than the downward pressure of DAH to governmental sectors. Estimates show that it takes an increase of $2 in DAH to non-governmental sectors to balance out the down-ward impact that $1 of DAH to governmental sectors has on governments’ domestic spending on health.
Our statistical analysis suggests that governments in this region reacted to inflows of DAH-G by shifting money away from the health sector into other sectors, resulting in a $182.36 million decrease in GHE-S. As these funds are shifted away from the health sector, it is important for the global health community to under-stand where these funds end up. Does the money go to health-enhancing sectors such as education, water
and sanitation, or food security, or does it go to expen-ditures that may not improve health, such as military spending? Unfortunately, lack of detailed government spending data by sector prevents us from answering this question.
On the other hand, increasing DAH to non-govern-mental sectors partially counteracted the decreases caused by DAH to governmental sectors by putting upward pressure on public domestic health spending. We estimated the effect of the increase in DAH-NG on GHE-S to be $57.20 million in East sub-Saharan Africa.
The reasons why increases in DAH-NG cause GHE-S to rise are not well understood. As noted in The Lancet last year, many researchers believe that the high salaries that non-governmental organizations (NGOs) tend to pay drive up wages,117-119 putting pressure on govern-ments to raise the salaries of civil servants in order to retain them. On the other hand, some have hypoth-esized that this is evidence that NGOs’ efforts to lobby governments to spend more on health is working.120 Cautious interpretation of this finding is warranted.

50 INSTITUTE FOR HEALTH METRICS AND EVALUATION
Sources: IHME Government Health Spending Database (Developing Countries) 2011, IHME DAH Database (Country and Regional Recipient Level) 2011, and covariates (GDP, general government expenditure, debt relief, and HIV prevalence)
Notes: DAH and GHE-S regional relationship based on all-region analysis.
103
Mill
ions
of
2009
US
dolla
rs
Mill
ions
of
2009
US
dolla
rs
Changes in DAH Effects of changes in DAH on GHE-S
-183
408
114
DAH-G
DAH-NG
Effect of DAH-G on GHE-S
Effect of DAH-NG on GHE-S
FIGURE 31: Relationship between GHE-S and DAH-G in East sub-Saharan Africa, 2008-2009
Furthermore, few rigorous studies of the overall health benefits of providing DAH to NGOs versus governments have been done. Further research should be conducted to elucidate the reasons why DAH-NG increases GHE-S before drawing the simplistic conclusion that more DAH should be given to NGOs to increase govern-ments’ domestic health spending. Researchers should also study the health impact of providing DAH through NGOs.
As discussed in Chapter 2, NGOs generally do not make country-level expenditure data available to the public. This limits researchers’ abilities to assess the effective-ness of health interventions that NGOs deliver relative to those delivered by the government. Greater trans-parency of financial data from NGOs is needed for research that could lead to informed policymaking.
Examining changes in DAH to governmental and non-governmental sectors from 2008 to 2009 in East sub-Saharan Africa, as seen in Figure 31, reveals clues about the relationship between these factors and GHE-S. Similar to 2006 to 2007, DAH-NG continued to
rise from 2008 to 2009 and contributed to an increase in GHE-S. Unlike the previous period, however, DAH-G declined in East sub-Saharan Africa between 2008 and 2009. These declines in DAH-G have occurred alongside increases in public domestic spending. It is plausible that governments in the region may be responding to decreases in DAH-G by channeling more money into the health sector.
Based on the finding that governments may be reacting to declines in the DAH that they receive by increasing their domestic health spending, some may conclude the logical strategy for donors is to cut DAH-G and give the funds to NGOs instead. Pursuing the exclusive objective of increasing GHE-S without considering other factors could be unwise, however. Further studies should be done to fully understand how the provision of DAH-G and DAH-NG and their effect on GHE-S impacts health in developing countries. Otherwise, donors could spend much time and effort trying to influence govern-ments’ domestic health spending while losing sight of the most important issue at stake, which is saving lives.

IMPACT OF DEVELOPMENT ASSISTANCE FOR HEALTH ON COUNTRY GOVERNMENT SPENDING 51
Policy implications
More transparent and high-quality data on govern-ments’ domestic health spending are needed to inform the scientific and policy debate on this subject. Citi-zens of developing countries as well as donors who are sending assistance to these countries would benefit from knowing how much governments are spending on health as well as other sectors. These data are also critical for monitoring the implementation of the Abuja targets. Public expenditure management systems in developing countries need to be strengthened so that countries can produce these data. Furthermore, as the primary provider of data on government health expenditure, the World Health Organization should invest more resources to collect these data through visits to countries. The global health community’s understanding of governments’ investment in health could be improved by other parties’ investment in data collection. Finally, better quality data on govern-ment spending in all sectors would help identify which sectors within the government receive additional funding if ministries of finance shift money away from the health budget in response to DAH-G.
A second concern generated by these findings relates to implications for developing countries’ efforts to meet MDGs 4 and 5 to reduce maternal and child mortality. Our findings that governments tend to react to receiving DAH by shifting their own resources away from the health sector are worrisome. As we noted last year, it is problematic if governments react to DAH flowing into their treasuries by taking money away from their core health budgets. DAH is not an adequate substitute for government health spending, since donors often earmark these funds for disease-specific programs such as HIV/AIDS. If ministries of finance respond to increased DAH-G by redirecting GHE-S to areas such as water and sanitation, education, or conditional cash transfers to the poor, however, then these funds could complement efforts by ministries of health to meet the MDGs. If domestic funds are freed up by DAH to government for increasing expenditures in other sectors that may not improve health, this could impair a country’s ability to attain the MDGs. These findings point to the need for recipient countries and donors to gain a better understanding of each other’s priorities as well as the intended objectives of DAH.
Ultimately, while increasing governments’ domestic health spending is an important part of attaining the MDGs, additional studies should be done to deter-mine which form of DAH, DAH to governmental or non-governmental sectors, has the greatest impact on health. While DAH to non-governmental sectors increases governments’ domestic health spending, it is not clear that this is a positive outcome, as the under-lying causal mechanisms have not yet been identified. In addition, it is essential to consider both the short- and long-term health impacts that result from channeling DAH through governmental versus non-governmental sectors. For example, investment in governments may have a longer-lasting impact on health, as it may be used to strengthen the health system, build health facilities, or train staff.121 In contrast, DAH channeled through NGOs may be used for interventions that have a short-term impact, as NGOs’ health work may end when project funding ends or the organizations cease to operate in a particular country.122,123 Given the complex relationship between public domestic health spending and DAH to governmental and non-governmental sectors, it is necessary to enhance our understanding of how DAH can be delivered in a way that maximizes its impact on health. This research represents an important step toward attaining that goal.

52 INSTITUTE FOR HEALTH METRICS AND EVALUATION
CONCLUSION
The global economic crisis has, thus far, had little more than a slowing effect on the growth of development assistance for health (DAH) and country spending on health. Most DAH donors increased funding modestly since the Institute for Health Metrics and Evalua-tion (IHME) published Financing Global Health 2010. Country governments, similarly, continued to spend more of their own resources in the most recent years captured in the available data.
When examined over the full two decades covered by this report, DAH appears to be returning to the single-digit growth rates that were seen throughout the 1990s. Global health advocates became accustomed to the huge increases in funding that began in 2002, with annual increases in DAH of over 10% through 2008.
Within developing countries, governments continued to show a growing commitment to health. Between 2006 and 2009, country spending has grown at a rate higher than 10% every year, while DAH spending has only increased at a double-digit rate twice during that span.
The trend in countries shifting their own health spending to other priorities when receiving large sums of DAH invites further scrutiny. Reports by IHME and others show that most countries are not on track to reach the Millennium Development Goals (MDGs) for reducing child and maternal mortality by 2015.2 There are, however, signs that reductions in child mortality and maternal mortality are accelerating. To take advan-tage of that momentum, countries need to ascertain the right balance of donor and domestic funds.
Looking ahead, policymakers in donor countries and in developing countries need to plan wisely for a future of more moderate funding growth as well as the possi-bility of a delayed effect from the economic crisis causing funds to drop.
With the possibility of a more austere future in mind, identifying how best to target limited resources will require both better data gathering and more thorough impact evaluations.
First, the paucity of data continues to hinder efforts to measure health challenges globally. When speaking at the Bill & Melinda Gates Foundation’s Malaria Forum in October 2011, World Health Organization (WHO) Director-General Margaret Chan lamented the small number of countries that have full vital registration systems to track births, deaths, and causes of death. “Good malaria surveillance means knowing where the enemy lies,” she told the audience.124
Creating full vital registration systems throughout the world should be part of the agenda for health sector support, and as can be seen in this report, the funding for this sector has remained low for most of the past two decades. Part of the solution can be found in the emerging consensus around verbal autopsy (VA) methods to assign cause of death in regions without vital registration systems.
In February 2011, IHME, the University of Queensland School of Population Health, and the journal Popula-tion Health Metrics co-hosted the Global Congress on Verbal Autopsy: State of the Science.125 The conference brought together researchers and those who work with VA data to discuss instrument design, analysis methods, and the use of VA in national health information systems. Those discussions led to Population Health Metrics publishing a thematic series dedicated to VA in September 2011 that explored new VA tools that are more reliable, more cost-effective and, perhaps most important, faster than those previously used.126
Developing countries urgently need these new tools to better evaluate and address the ongoing burden of infectious diseases, such as HIV, malaria, and tubercu-losis, and the increasing burden of noncommunicable diseases (NCDs). In September 2011, WHO and the World Economic Forum proposed that countries address the burden of NCDs by introducing “a core set of NCD ‘best buy’ intervention strategies” that include counseling and drug therapy for cardiovas-cular disease, measures to prevent cervical cancer, and prevention programs for tobacco use and obesity. “On

CONCLUSION 53
a per-person basis, the annual investment ranges from under US$1 in low-income countries to US$3 in upper middle-income countries,” the report said.5
While an investment of that magnitude seems quite low, it can quickly climb into the billions in countries with significant disease burdens, such as India and China. The evidence for some intervention strategies, such as prevention programs for HIV/AIDS in certain settings, is strong, but there remains much work to be done to evaluate the impact and cost effectiveness of a range of programs.54
Countries will have a new opportunity to assess national and subnational health priorities in the coming years with the series of publications and events planned around the Global Burden of Diseases (GBD), Inju-ries, and Risk Factors Study 2010. This will be the first systematic assessment of all health burden data using a unified and replicable method since the GBD study published in 1996. It will generate comprehensive and comparable estimates of the burden of diseases, inju-ries, and risk factors for the years 1990, 2005, and 2010 for 21 regions in the world, and is expected to cover more than 400 diseases, risk factors, and nonfatal health consequences. Led by IHME in collaboration with Harvard University, Johns Hopkins University, the University of Queensland, and WHO, the GBD Study 2010 brings together experts and leaders in health research from around the world.127
With new GBD estimates, new VA tools, and continued strength in DAH and country spending, policymakers, global health advocates, and concerned citizens in all countries have a new window to push for progress toward international health targets. Those on the side-lines can debate whether dates such as the 2015 MDG
deadline are realistic when countries have such large variation in their disease burdens and economic capac-ities. To make the world a healthier place for all, we need to put our energies into identifying the programs that are having the strongest impact. We need to develop the innovations that have the potential for significant health improvements. Finally, we need to carefully measure both health challenges and health solutions to keep existing programs and future inter-ventions on track.

54 INSTITUTE FOR HEALTH METRICS AND EVALUATION
REFERENCES
1. The Millennium Development Goals Report 2011. New York: United Nations; 2011. http://www.un.org/millenniumgoals/11_MDG%20Report_EN.pdf.
2. Lozano R, Wang H, Foreman K, Rajaratnam J, Naghavi M, Marcus J, et al. Progress towards Millennium Development Goals 4 and 5 on maternal and child mortality: an updated systematic analysis. The Lancet. 2011; 378(9797):1139-1165.
3. Lim S, Fullman N, Stokes A, Ravishankar N, Masiye F, Murray CJL, et al. Net benefits: a multicountry analysis of observational data examining associations between insecticide-treated mosquito nets and health outcomes. PLoS Medicine. 2011; 8(9):1-13.
4. Gakidou E, Cowling K, Lozano R, Murray C. Increased educational attainment and its effect on child mortality in 175 countries between 1970 and 2009: a systematic analysis. The Lancet. 2010; 376(9745):959-974.
5. From burden to “best buys”: reducing the economic impact of non-communicable diseases in low- and middle-income countries. Geneva: World Economic Forum; 2011. http://www.who.int/nmh/publications/best_buys_summary.pdf.
6. Report of the International Conference on Financing for Development. New York: United Nations; 2002. http://www.unmillenniumproject.org/documents/07_aconf198-11.pdf.
7. Mulama J. Development-Africa: that elusive target of 0.7 percent. Terraviva Europe. 2005 May 30. http://www.un.org/special-rep/ohrlls/News_flash2005/30%20May%20Dev%20Africa-Target%200.7%20percent.htm.
8. Millennium Development Goal 8 - The global partnership for development: time to deliver. New York: United Nations; 2011. http://www.un.org/millenniumgoals/2011_Gap_Report/11-38394%20(E)%20MDG%20Gap%20Report%202011_WEB.pdf.
9. Groves J. Foreign aid budget to cost every family £500: how 17 foreign aid fat cats are earning more than £90,000. Daily Mail. 2010 Oct. 22; http://www.dailymail.co.uk/news/article-1322745/Foreign-aid-budget-cost-family-500-Fat-cats-earning-90k.html.
10. Morris D. Cut foreign aid budget now. The Hill. 2011 March 29. http://thehill.com/opinion/columnists/dick-morris/152597-cut-foreign-aid-budget-now.
11. U.S. presidential candidate Perry wants to slash foreign aid, UN funding. RIA Novosti. 2011 Oct. 19; http://en.ria.ru/world/20111019/167852562.html.
12. Forouzanfar M, Foreman K, Delossantos A, Lozano R, Lopez A, Murray CJL, et al. Breast and cervical cancer in 187 countries between 1980 and 2010: a systematic analysis. The Lancet. 2011; 378(9801):1461-1484.
13. Engelgau M, El-Saharty S, Kudesia P, Rajan V, Rosenhouse S, Okamoto K. Capitalizing on the demographic transition: tackling noncommunicable diseases in South Asia. Washington, DC: The World Bank; 2011. http://siteresources.worldbank.org/SOUTHASIAEXT/Resources/223546-1296680097256/ 7707437-1296680114157/NCDs_South_Asia_February_2011.pdf.
14. Finucane M, Stevens G, Cowan M, Danaei G, Lin J, Paciorek C, et al. National, regional, and global trends in body-mass index since 1980: systematic analysis of health examination surveys and epidemiological studies with 960 country-years and 9.1 million participants. The Lancet. 2011; 377(9765):557-567.

REFERENCES 55
15. Danaei G, Finucane M, Lin J, Singh G, Paciorek C, Cowan M, et al. National, regional, and global trends in systolic blood pressure since 1980: systematic analysis of health examination surveys and epidemiological studies with 786 country-years and 5.4 million participants. The Lancet. 2011; 377(9765):568-577.
16. Institute for Health Metrics and Evaluation. Financing Global Health 2010: Development Assistance and Country Spending in Economic Uncertainty. Seattle, Washington: IHME; 2010. http://www.healthmetrics andevaluation.org/sites/default/files/policy_report/2010/FGH_2010_REPORT_FINAL_051111.pdf.
17. Roodman D. History says financial crisis will suppress aid. Washington, DC: Center for Global Development; 2008. http://blogs.cgdev.org/globaldevelopment/2008/10/history-says-financial-crisis.php.
18. Tordjman J. Recession weighs heavily on aid to poor countries. Paris: AFP. 2009. http://www.google.com/hostednews/afp/article/ALeqM5hY14IxrmIxoV3DzUEtd2wAo9_LoQ.
19. Stuckler D, Basu S, Wang S, McKee M. Does recession reduce global health aid? Evidence from 15 high-income countries, 1975-2007. Bulletin of the World Health Organization. 2011 Feb. 25; 89(4):252-257.
20. Over M. How will the financial crisis affect aid to the health sector? Washington, DC: Center for Global Development. 2009 June 12. http://blogs.cgdev.org/globalhealth/2009/06/how-will-the-financial-crisis-affect-aid-to-the-health-sector.php.
21. Warrick J, Sheridan M. House subcommittee approves foreign-aid cuts. The Washington Post National. 2011 July 27. http://www.washingtonpost.com/blogs/checkpoint-washington/post/house-subcommittee-approves-foreign-aid-cuts/2011/07/27/gIQAtD6WdI_blog.html.
22. Bawden T. France feels the economic force of the credit ratings agencies. The Guardian. 2011 Aug. 12. http://www.guardian.co.uk/business/2011/aug/12/france-economy-credit-rating-agencies.
23. Barkin N, Rohan B. Booming German firms cast nervous eye to euro crisis. Reuters. 2011 Sep. 30. http://www.reuters.com/article/2011/09/30/us-germany-economy-idUSTRE78T0QF20110930.
24. Chopra G, Theis D. World Bank Group: Record US$100 billion response lays foundation for recovery from global economic crisis. Washington, DC: The World Bank. 2010 Apr. 7. http://web.worldbank.org/WBSITE/EXTERNAL/COUNTRIES/LACEXT/0,,contentMDK:22531867~menuPK:2246555~pagePK:2865106~piPK: 2865128~theSitePK:258554,00.html.
25. World Bank Group continued to support a sustainable recovery in Latin America and the Caribbean in 2011. Washington, DC: The World Bank; 2011 July 1. http://web.worldbank.org/WBSITE/EXTERNAL/COUNTRIES/LACEXT/0,,contentMDK:22954060~menuPK:2246555~pagePK:2865106~piPK:2865128~theSitePK: 258554,00.html.
26. McCoy D, Chand S, Sridhar D. Global health funding: how much, where it comes from and where it goes. Health Policy and Planning. 2009 July 1; 24:407-417.
27. Guide to producing national health accounts with special application for low-income and middle-income countries. Geneva: World Bank, World Health Organization, The United States Agency for International Development; 2003. http://www.who.int/nha/docs/English_PG.pdf.
28. International Bank for Reconstruction and Development. The World Bank. http://web.worldbank.org/WBSITE/EXTERNAL/EXTABOUTUS/EXTIBRD/0,,menuPK:3046081~pagePK:64168427~piPK:64168435~ theSitePK:3046012,00.html.

56 INSTITUTE FOR HEALTH METRICS AND EVALUATION
29. What is International Development Association (IDA)? The World Bank. http://web.worldbank.org/WBSITE/EXTERNAL/EXTABOUTUS/IDA/0,,contentMDK:21206704~menuPK:83991~pagePK:51236175~piPK:437394~ theSitePK:73154,00.html.
30. International Development Association (IDA) Replenishments. The World Bank. http://web.worldbank.org/WBSITE/EXTERNAL/EXTABOUTUS/IDA/0,,contentMDK:21021125~menuPK:2842661~pagePK:51236175~piPK:437394~theSitePK:73154,00.html.
31. Global health experts discuss legislative landscape of 112th Congress at Kaiser Family Foundation panel. The Henry J. Kaiser Family Foundation; 2011. http://globalhealth.kff.org/Daily-Reports/2011/April/22/GH-042211-KFF-Panel.aspx.
32. US adds 103,000 jobs in September. Reuters news wires; 2011 July 10. http://www.france24.com/en/20111007-usa-unemployment-september-economy-financial-crisis-obama.
33. Chadbourn M. Analysis: new wave of foreclosures to push prices lower. Reuters. 2011 Oct. 13. http://www.reuters.com/article/2011/10/13/us-usa-housing-foreclosures-idUSTRE79C7JQ20111013.
34. American public vastly overestimates amount of U.S. foreign aid. World Public Opinion. 2011 Nov. 9. http://www.worldpublicopinion.org/pipa/articles/brunitedstatescanadara/670.php?nid=&id=&pnt=670&lb=.
35. Helm T, McVeigh T. David Cameron defends international aid rise with vaccine pledge. Global Development. 2011 June 11. http://www.guardian.co.uk/global-development/2011/jun/11/david-cameron-international- aid-vaccine.
36. Shipman T. UK doles out more aid than any other G8 country despite the savage cutbacks at home. Daily Mail. 2011 May 26. http://www.dailymail.co.uk/news/article-1391334/Britain-doles-aid-country-despite-savage-cutbacks-home.html.
37. Should UK re-think foreign aid in age of austerity? BBC News. 2010 July 20. http://www.bbc.co.uk/news/uk-politics-10700383.
38. Hudson Institute Center for Global Prosperity. The index of global philanthropy and remittances 2011 . Washington, D.C.: Hudson Institute; 2011. http://www.hudson.org/files/documents/2011%20Index%20of%20Global%20Philanthropy%20and%20Remittances%20downloadable%20version.pdf.
39. Butler D. Revamp for WHO. Nature. 2011 May 24; 430-431.
40. High Level Independent Review Panel. The Global Fund. http://www.theglobalfund.org/en/highlevelpanel/.
41. United Nations seeks $1.5 billion for swine flu. Associated Press. 2009 Sep. 24. http://www.msnbc.msn.com/id/33005574/ns/health-cold_and_flu/t/united-nations-seeks-billion-swine-flu/#.Tqg6Pt5-1GQ.
42. Non-communicable diseases deemed development challenge of “epidemic proportions” in political declaration adopted during landmark General Assembly Summit. United Nations General Assembly. 2011 Sep. 19. http://www.un.org/News/Press/docs/2011/ga11138.doc.htm.
43. Kahn T. More money needed to fight AIDS, TB. Business Day. 2010 Sep. 27. http://www.businessday.co.za/articles/Content.aspx?id=122002.
44. Organisation for Economic Co-operation and Development. Paris Declaration on aid effectiveness and the Accra Agenda for Action. 2005. http://www.oecd.org/dataoecd/11/41/34428351.pdf.
45. Reporting directives for the creditor reporting system. Organisation for Economic Co-operation and Development. 2007. http://www.oecd.org/dataoecd/16/53/1948102.pdf.

REFERENCES 57
46. Reporting directives for the creditor reporting system. Paris: Organisation for Economic Co-operation and Development. 2010. http://www.oecd.org/dataoecd/31/23/45917818.pdf.
47. Martens B. Why do agencies exist? Development Policy Review. 2005 Oct. 24; 23(6):643-663.
48. The Global Fund to Fight AIDS, Tuberculosis and Malaria. Pledges and contributions. 2011. http://www.theglobalfund.org/en/.
49. Tran M, Provost C. HIV/Aids overseas budget to be cut back by almost a third. The Guardian. 2011 Oct. 4. http://www.guardian.co.uk/global-development/2011/oct/04/hiv-aids-overseas-budget-cut.
50. Global Economic Governance Programme. Setting a developing country agenda for global health. Oxford: Oxford College; 2008. http://www.globaleconomicgovernance.org/wp-content/uploads/Working%20Group%20Report%20May%202008.pdf.
51. President’s Malaria Initiative. PMI Saving Lives in Africa; Countries. http://www.pmi.gov/countries/index.html.
52. Charity begins abroad. The Economist. 2011 Aug. 13. http://www.economist.com/node/21525836.
53. Bill & Melinda Gates Foundation. Avahan: India AIDS initiative. http://www.gatesfoundation.org/avahan/Pages/overview.aspx.
54. Ng M, Gakidou E, Levin-Rector A, Khera A, Murray C, Dandona L. Assessment of population-level effect of Avahan, an HIV-prevention initiative in India. The Lancet. 2011; 378(9803):1643-1652. http://www.thelancet.com/journals/lancet/article/PIIS0140-6736(11)61390-1/fulltext.
55. Department for International Development. India Overview. http://www.dfid.gov.uk/Where-we-work/Asia-South/India/.
56. MPs question future of aid money for India. BBC News. 2011 June 14. http://www.bbc.co.uk/news/uk-politics-13768374.
57. Suroor H. Tory MPs protest against decision to continue aid for India. The Hindu. 2011 Feb. 16; http://www.thehindu.com/news/international/article1459331.ece.
58. The United States President’s Emergency Plan for AIDS Relief. Reauthorizing PEPFAR. 2009 Sep. http://www.pepfar.gov/press/107735.htm.
59. Tyler J. Dutch government cuts development aid. Radio Netherlands Worldwide. 2011 March 18. http://www.rnw.nl/english/article/dutch-government-cuts-development-aid.
60. The World Bank. Social Impact of the Argentine Crisis. http://web.worldbank.org/WBSITE/EXTERNAL/COUNTRIES/LACEXT/ARGENTINAEXTN/0,,contentMDK:20190524~pagePK:141137~piPK:141127~ theSitePK:316024,00.html.
61. The United States President’s Emergency Plan for AIDS Relief. Partnership Frameworks. http://www.pepfar.gov/frameworks/index.htm.
62. Kates J, Wexler A, Lief E, Avila C, Gobet B. Financing the response to AIDS in low- and middle-income countries: international assistance from donor governments in 2010. The Henry J. Kaiser Family Foundation, Joint United Nations Programme on HIV/AIDS. Menlo Park, California/New York; 2011. http://www.kff.org/hivaids/upload/7347-07.pdf.
63. Millennium Project. Goals, targets and indicators. http://www.unmillenniumproject.org/goals/gti.htm.

58 INSTITUTE FOR HEALTH METRICS AND EVALUATION
64. The United States Agency for International Development. Implementation of the Global Health Initiative: Consultation Document. 2010. http://www.usaid.gov/our_work/global_health/home/Publications/docs/ghi_consultation_document.pdf.
65. Ki-moon B. Global strategy for women’s and children’s health. New York: United Nations; 2010. http://www.un.org/sg/hf/Global_StategyEN.pdf.
66. Worsnip P, Wroughton L. UN to boost poverty goals in $40 billion plan. Reuters Africa. 2010 Sep. 22; http://af.reuters.com/article/topNews/idAFJOE68L0I620100922?pageNumber=1&virtualBrandChannel=0.
67. The Abuja Declaration and the plan of action. Abuja: Roll Back Malaria. 2011. http://www.rollbackmalaria.org/docs/abuja_declaration_final.htm.
68. Roberts L, Enserink M. Malaria: did they really say... eradication? Science. 2007 Dec.; 318(5856):1544-1545.
69. The President’s Malaria Initiative. About The President’s Malaria Initiative; PMI Saving Lives in Africa, http://www.pmi.gov/about/index.html.
70. International Health Partnership and Related Initiatives. Overview. http://www.internationalhealth partnership.net/en/about.
71. Rio communities’ declaration at the 3rd stop TB partners forum. 2009 March. http://www.stoptb.org/assets/documents/events/meetings/partners_forum/2009/rio_communities_declaration.doc.
72. Multidrug- and extensively drug-resistant TB (M/XDR-TB): 2010 global report on surveillance and response. Geneva: World Health Organization; 2010.
73. The global plan to stop TB 2011-2015: Transforming the fight towards elimination of tuberculosis. Geneva: World Health Organization; http://www.stoptb.org/assets/documents/global/plan/TB_GlobalPlanToStop TB2011-2015.pdf.
74. PEPFAR Funding: Investments that Save Lives and Promote Security. The United States President’s Emergency Plan for AIDS Relief. http://www.pepfar.gov/documents/organization/80161.pdf.
75. Bill & Melinda Gates Foundation. Tuberculosis: Strategy overview. http://www.gatesfoundation.org/global-health/Documents/tuberculosis-strategy.pdf.
76. Alwan A. WHO official Ala Alwan cites risk to poorer nations global health, noncommunicable diseases. The Washington Post National. 2011 Sep. 19. http://www.washingtonpost.com/national/health-science/global-health-noncommunicable-diseases-who-official-cites-risk-to-poorer-nations/2011/09/08/gIQAULNJgK_story.html.
77. Institute for Health Metrics and Evaluation. The Challenge Ahead: Progress and Setbacks in Breast and Cervical Cancer. Seattle, Washington: IHME; 2011. http://www.healthmetricsandevaluation.org/sites/default/files/policy_report/2011/The_Challenge_Ahead_IHME_Policy_Report_0911.pdf.
78. Global risks 2010: A global risk network report. Cologne/Geneva: World Economic Forum; 2010. http://www3.weforum.org/docs/WEF_GlobalRisks_Report_2010.pdf.
79. Political declaration of the High-level Meeting of the General Assembly on the Prevention and Control of Non-communicable Diseases. United Nations. 2011. http://www.un.org/ga/search/view_doc.asp?symbol=A%2F66%2FL.1&Lang=E.
80. World Health Organization. Global Burden of Disease 2004 estimates for WHO member states. Persons, all ages. 2008. http://www.who.int/healthinfo/global_burden_disease/estimates_country/en/index.html.

REFERENCES 59
81. Fidler D. Rise and fall of global health as a foreign policy issue. Global Health Governance. 2011 Spring; 4(2):1-12.
82. Sridhar D, Morrison S, Piot P. Getting the politics right for the September 2011 UN High-Level Meeting on Noncommunicable Diseases. Washington, D.C.: Center for Strategic and International Studies; 2011. http://csis.org/files/publication/110215_Sridhar_GettingPoliticsRight_Web.pdf.
83. U.S. Department of State. Pink Ribbon Red Ribbon Overview. 2011 Sep. 13. http://www.state.gov/r/pa/prs/ps/2011/09/172244.htm.
84. Olson D. Cancer Rises in Africa, a continent unequipped to deal with it. Huffington Post World. 2011 Sep. 20. http://www.huffingtonpost.com/david-j-olson/cancer-africa_b_967605.html.
85. Birungi M. Two families sue government for child birth deaths. Uganda RadioNetwork. 2011 May 27. http://ugandaradionetwork.com/a/story.php?s=34005.
86. Dugger C. Maternal deaths focus harsh light on Uganda. The New York Times. 2011 July 29. http://www.nytimes.com/2011/07/30/world/africa/30uganda.html?_r=2&pagewanted=all.
87. Kenya: NCDs and HIV fight for limited resources. IRIN Humanitarian News and Analysis. 2011 Sep. 20; http://www.irinnews.org/report.aspx?reportid=93766.
88. Cameron D. Our aid will hit the spot. The Guardian. 2010 June 3. http://www.guardian.co.uk/commentisfree/2010/jun/03/aid-developing-world-targeted-money.
89. Lu C, Schneider M, Gubbins P, Leach-Kemon K, Jamison D, Murray C. Public financing of health in developing countries: a cross-national systematic analysis. The Lancet. 2010; 375(9723):1375-1387.
90. Abuja Declaration on HIV/AIDS, tuberculosis and other related infectious diseases. Abuja, Nigeria: Heads of State and Government of the Organisation of African Unity (OAU); 2001. http://www.un.org/ga/aids/pdf/abuja_declaration.pdf.
91. Decisions, declarations, resolution. Kampala, Uganda: African Union; 2010. http://www.au.int/en/sites/default/files/ASSEMBLY_EN_25_27_July_2010_BCP_ASSEMBLY_OF_THE_AFRICAN_UNION_Fifteenth_Ordinary_Session.pdf.
92. IBP’s open budget initiative shines light on off-budget activities in 5 new transparency guides! International Budget Partnership. http://internationalbudget.org/.
93. Drought in an act of nature. Famine is man-made. Let’s put an end to famine. ONE. http://one.org/us/actnow/fword_splash.html?source=hungry_no_more_ussplash.
94. The International Aid Transparency Initiative. http://www.aidtransparency.net/.
95. The Global Campaign for Aid Transparency. Publish What You Fund. http://www.publishwhatyoufund.org/.
96. World Health Organization. National Health Accounts. http://www.who.int/nha/en/.
97. Gupta S. Personal correspondence. 2011 Jan. 3.
98. Health amid a financial crisis: a complex diagnosis. World Health Organization. http://www.who.int/bulletin/volumes/87/1/09-010109/en/.
99. Gupta S, Clements B, Guin-Siu M, Leruth L. Debt relief and public health spending in heavily indebted poor countries. Bulletin of the World Health Organization. 2002; 80(2):151-157.

60 INSTITUTE FOR HEALTH METRICS AND EVALUATION
100. Mishra P, Newhouse D. Health aid and infant mortality. International Monetary Fund. 2007. http://www.imf.org/external/pubs/ft/wp/2007/wp07100.pdf.
101. Baldacci E, Clements B, Gupta S, Cui Q. Social spending, human capital, and growth in developing countries. World Development. 2008 Aug; 36(8):1317-1341.
102. Devarajan S, Rajkumar A, Swaroop V. What does aid to Africa finance? Washington, D.C.: The World Bank; 1999. http://ideas.repec.org/p/wbk/wbrwps/2092.html.
103. Farag M, Nandakumar A, Wallack S, Gaumer G, Hodgkin D. Does funding from donors displace government spending for health in developing countries? Health Affairs. 2009;28(4):1045-1055.
104. Arndt C. The macro implications of HIV/AIDS in South Africa: a preliminary assessment. South African Journal of Economics. 2000; 68:856-8567.
105. Haacker M. The impact of HIV/AIDS on government finance and public services. The macroeconomics of HIV/AIDS. Washington, DC: International Monetary Fund. 2004:198-258.
106. Kaddar M, Furrer E. Are current debt relief initiatives an option for scaling up health financing in beneficiary countries? Bulletin of the World Health Organization. 2008; 86:877-883. http://www.who.int/bulletin/volumes/86/11/08-053686.pdf.
107. Stover J, Bollinger L. The economic impact of AIDS. Washington, DC: The Futures Group International. 1999. http://www.policyproject.com/pubs/SEImpact/SEImpact_Africa.pdf.
108. Feyzioglu T, Swaroop V, Zhu M. A panel data analysis of the fungibility of foreign aid. World Bank Economic Review. 1998; 12(1):29-58.
109. Heller P. A model of public fiscal behavior in developing countries: aid, investment, and taxation. The American Economic Review. 1975 June; 65(3):429-445.
110. Pack H, Pack J. Foreign aid and the question of fungibility. The Review of Economics and Statistics. 1993 May; 75(2):258-265.
111. Pettersson J. Foreign sectoral aid fungibility, growth and poverty reduction. Journal of International Development. 2007 June 27; 19:1074-1098.
112. Swaroop V, Jha S, Rajkumar A. Fiscal effects of foreign aid in a federal system of governance: the case of India. Journal of Public Economics. 2000 Sep.; 77(3):307-330.
113. Masud N, Yontcheva B. Does foreign aid reduce poverty? Empirical evidence from nongovernmental bilateral aid. IMF Working Paper. 2005. http://ssrn.com/abstract=887969.
114. Gottret P, Schieber G. Health financing revisited: a practitioner’s guide. Washington, DC: The World Bank. 2006. http://siteresources.worldbank.org/INTHSD/Resources/topics/Health-Financing/HFRFull.pdf.
115. Roodman D. How to do XTABOND2: an introduction to difference and system GMM in Stata. Stata Journal. 2009 March; 9(1):86-136.
116. Roodman D. XTABOND2: Stata module to extend XTABOND dynamic panel data estimator. Statistical Software Components S435901, Boston College Department of Economics. 2011 Aug. 5.
117. Huddart J, Furth R, Lyons J. The Zambia HIV/AIDS workforce study: preparing for scale-up. Operations research results. Bethesda, MD: University Research Co.; 2004. http://www.hciproject.org/sites/default/files/ORMZambiaWorkforcel.pdf.

118. Davey G, Fekade D, Parry E. Must aid hinder attempts to reach the Millennium Development Goals? The Lancet. 2006; 367(9511):629-631.
119. Fontagné L, Limardi M. The outcome of NGOs’ activism in developing countries under visibility constraint. 2011 Aug. 27. http://lionel.fontagne.free.fr/papers/Fontagne_Limardi_Aug2011.pdf.
120. Institute for Health Metrics and Evaluation. IHME co-hosts symposium on public financing of global health in developing countries. http://www.healthmetricsandevaluation.org/news-events/event/ihme-co-hosts-symposium-public-financing-global-health-developing-countries.
121. De Renzio P. Aid effectiveness and absorptive capacity: which way aid reform and accountability? London: Overseas Development Institute; 2007. http://www.odi.org.uk.offcampus.lib.washington.edu/resources/download/1527.pdf.
122. Pfeiffer J. International NGOs and primary health care in Mozambique: the need for a new model of collaboration. Social Sciences & Medicine. 2003 Feb.; 56(4):725-738.
123. Richmond O, Carey H. Subcontracting peace: the challenges of NGO peacebuilding. Burlington, Vermont: Ashgate Publishing Company; 2005.
124. Using information systems to track a killer parasite. PATH MACEPA. 2011 Oct. 18. http://macepadiary.wordpress.com/2011/10/18/using-information-systems-to-track-a-killer-parasite/.
125. Institute for Health Metrics and Evaluation. IHME co-hosts Global Congress on Verbal Autopsy: State of the Science. http://www.healthmetricsandevaluation.org/news-events/event/ihme-co-hosts-global-congress-verbal-autopsy-state-science.
126. Institute for Health Metrics and Evaluation. Verbal autopsy: innovations, applications, opportunitites. http://www.healthmetricsandevaluation.org/publications/verbal-autopsy-series.
127. Institute for Health Metrics and Evaluation. Global Burden of Diseases, Injuries, and Risk Factors Study 2010 . http://www.healthmetricsandevaluation.org/research/project/global-burden-diseases-injuries-and-risk- factors-study-2010.
REFERENCES 61


STATISTICAL ANNEX
PAGE TABLE
64 1 DAH by channel of assistance, 1990-2011
66 2 DAH by source of funding, 1990-2009
68 3 DAH by country of origin, 1990-2009
70 4 DAH by target region, 1990-2009
72 5 DAH by target country, 1990-2009
80 6 DAH by health focus area, 1990-2009
81 7 DAH by type of transfer, 1990-2009
82 8 Bilateral commitments and disbursements, 1990-2009
84 9 World Bank financial and in-kind DAH, 1990-2009
85 10 Regional development banks financial and in-kind DAH, 1990-2009
85 11 Financial and in-kind contributions by GFATM and GAVI, 2000-2009
86 12 WHO, regular and extrabudgetary income and expenditure, 1990-2009
87 13 UNFPA, regular and extrabudgetary income and expenditure, 1990-2009
88 14 UNICEF, regular and extrabudgetary income and expenditure, 1990-2009
89 15 UNAIDS, regular and extrabudgetary income and expenditure, 1996-2009
90 16 PAHO, regular and extrabudgetary income and expenditure, 1990-2009
92 17 US NGO expenditures, 1990-2011
92 18 Bill & Melinda Gates Foundation global health commitments, disbursements, and in-kind contributions, 1999-2010
94 19 Government health expenditure as source, 1995-2009
94 20 DAH allocated to government or non-government recipients, 1995-2009
The Statistical Annex includes tables related to the figures presented in Financing Global Health 2011: Continued Growth as MDG Deadline Approaches.
STATISTICAL ANNEX 63

64 INSTITUTE FOR HEALTH METRICS AND EVALUATION
TABLE 1: DAH by channel of assistance, 1990-2011
Channel 1990 1991 1992 1993 1994 1995 1996 1997
Bilateral development agencies
United States 909.31 779.40 671.35 626.72 922.29 1,035.18 928.87 927.78
United Kingdom 51.64 62.61 172.94 162.74 168.95 177.71 208.50 222.08
Japan 275.48 308.87 328.12 442.62 474.67 482.84 552.06 561.65
France 586.16 398.63 331.06 259.89 307.60 373.39 343.99 287.72
Germany 95.07 112.16 154.35 186.92 285.33 372.47 311.95 351.05
Sweden 242.95 212.64 241.83 224.11 186.44 186.66 178.43 156.72
Other bilaterals 628.37 578.29 758.96 691.74 612.59 754.25 938.40 863.96
Regional development banks
African Development Bank (AfDB) 65.89 63.64 62.16 60.82 94.76 73.20 74.72 93.24
Asian Development Bank (ADB) 35.12 34.06 49.37 72.43 71.76 52.18 57.20 59.54
Inter-American Development Bank (IDB) 89.64 81.95 54.23 63.75 87.00 86.69 112.08 176.25
World Bank
International Development Association (IDA) 31.29 99.53 291.39 473.22 595.75 649.20 670.74 699.23
International Bank for Reconstruction and Development (IBRD) 62.36 97.45 183.57 402.89 446.73 350.54 542.20 909.36
United Nations
Joint United Nations Programme on HIV/AIDS (UNAIDS) – – – – – – 78.10 76.73
United Nations Population Fund (UNFPA) 360.92 348.56 300.45 293.99 426.02 417.36 397.56 390.63
United Nations Children’s Fund (UNICEF) 224.33 216.65 279.16 273.16 291.17 285.25 256.84 252.36
World Health Organization (WHO) 1,181.54 1,141.09 1,116.22 1,092.24 1,224.03 1,199.15 1,007.00 989.46
Pan American Health Organization (PAHO) 276.29 266.83 274.03 268.14 284.49 278.71 263.31 258.72
European Commission (EC)1 52.04 39.54 28.43 101.12 174.42 180.23 198.33 242.34
Public-private partnerships
GAVI Alliance (GAVI) – – – – – – – –
Global Fund to Fight AIDS, Tuberculosis and Malaria (GFATM) – – – – – – – –
Bill & Melinda Gates Foundation (BMGF) – – – – – – – –
Other foundations 2 117.82 114.48 139.68 172.23 149.97 140.18 172.82 166.20
Non-governmental organizations (NGOs) 2 533.34 712.41 854.29 895.30 1,011.15 967.00 853.51 941.54
Total 5,819.55 5,668.78 6,291.56 6,764.05 7,815.13 8,062.20 8,146.58 8,626.57
Preliminary estimates based on information from channel of assistance, including budgets, appropriations, and correspondence.
Source: IHME DAH Database 2011
Notes: In millions US$, 2009. Development assistance for health (DAH) includes both financial and in-kind contributions for activities aimed at improving health in low- and middle-income countries. This table disaggregates DAH by the institutional channel through which DAH flowed to low- and middle-income countries. Dashes indicate inapplicable.
1 Includes funds from the European Development Fund and the European Commission budget 2 Only includes organizations incorporated in the United States

STATISTICAL ANNEX 65
1998 1999 2000 2001 2002 2003 2004 2005 2006 2007 2008 2009 2010 2011
922.77 993.95 957.21 1,029.33 1,571.96 1,737.55 1,870.57 2,270.92 2,981.07 4,113.15 5,459.32 5,875.96 7,456.21 7,577.57
273.30 362.81 540.88 485.25 562.31 614.46 614.31 767.44 967.25 1,182.55 1,108.40 1,203.05 1,099.28 1,255.86
532.93 509.02 487.19 450.38 437.63 424.01 537.80 446.47 346.53 318.37 306.95 282.89 264.82 278.89
298.60 261.88 203.83 212.29 245.41 244.64 342.41 342.39 355.93 255.75 376.84 372.92 304.84 312.42
296.65 269.95 196.32 191.47 236.76 257.48 275.11 251.12 440.72 388.34 466.93 516.99 441.66 502.25
137.12 130.81 114.16 89.58 104.82 118.98 140.98 211.76 245.54 257.50 238.81 203.01 196.55 235.47
781.01 966.08 912.72 825.76 993.11 1,064.14 1,143.68 1,200.61 1,428.87 1,676.20 1,911.46 2,386.78 2,334.02 2,378.99
62.59 61.68 45.13 42.37 81.43 42.43 90.51 149.18 91.04 88.32 104.42 103.45 106.67 107.59
120.31 224.70 388.82 164.89 164.96 141.59 139.12 130.22 131.76 137.56 138.82 455.80 266.17 267.25
188.03 189.44 219.32 202.36 212.72 184.98 374.40 383.89 133.42 159.92 145.91 137.33 106.27 65.69
683.10 858.54 889.70 940.73 1,092.27 1,157.41 1,224.81 1,220.71 1,051.30 994.63 929.50 712.80 512.47 486.54
930.75 856.23 957.36 843.12 933.71 735.49 1,121.26 854.43 717.18 706.18 444.61 485.46 622.71 1,419.48
86.52 85.27 132.40 129.46 112.89 110.50 179.31 173.52 234.98 227.20 263.93 261.54 231.54 228.56
411.82 405.87 382.53 374.05 415.58 406.81 483.88 468.26 529.55 593.41 691.00 778.69 826.59 813.60
266.47 262.62 322.02 461.75 435.14 429.50 500.00 671.47 401.07 539.47 500.78 524.98 580.93 567.53
1,087.15 1,071.45 1,312.11 1,283.02 1,354.59 1,326.01 1,654.89 1,601.49 1,643.78 1,589.32 1,906.46 1,889.16 2,009.97 1,989.38
291.40 287.19 286.32 279.97 273.57 267.80 271.75 262.98 357.53 345.69 380.49 377.04 338.95 344.50
303.25 346.00 363.69 426.29 437.99 661.65 102.34 442.15 527.19 538.80 570.41 363.54 363.11 370.81
– – 2.78 145.46 117.90 206.72 217.17 281.48 446.95 1,016.18 822.01 847.25 893.84 1,174.74
– – – – 16.28 307.67 769.36 1,236.03 1,494.61 1,860.09 2,431.67 2,907.48 3,215.90 2,686.58
– 162.37 371.23 274.97 410.88 541.51 342.99 469.04 671.72 872.57 1,406.51 1,298.33 1,471.28 1,381.98
212.14 271.36 344.76 324.37 286.05 250.30 241.54 255.60 293.42 372.20 548.47 527.71 534.08 590.40
1,058.03 1,293.10 1,428.59 1,646.23 1,819.42 1,995.42 2,362.79 2,769.53 2,917.97 2,968.73 3,722.51 3,178.43 2,485.41 2,693.70
8,943.94 9,870.34 10,859.06 10,823.10 12,317.40 13,227.04 15,000.99 16,860.69 18,409.37 21,202.11 24,876.21 25,690.59 26,663.26 27,729.78

Funding source 1990 1991 1992 1993 1994 1995 1996 1997
National treasuries
Australia 28.44 31.12 61.71 73.39 116.53 113.68 171.92 138.80
Austria 35.93 15.24 12.24 13.73 19.20 15.69 18.24 70.11
Belgium 78.08 104.25 116.67 119.92 116.13 121.98 120.30 110.42
Canada 133.24 133.75 123.25 126.21 167.50 170.76 146.50 153.65
Denmark 97.47 110.32 139.46 151.73 159.88 155.54 234.67 197.37
Finland 101.74 102.94 69.96 58.27 54.59 49.24 51.63 44.91
France 642.99 456.05 398.07 354.49 469.70 503.77 508.89 408.09
Germany 207.64 226.43 281.87 348.28 561.34 644.06 535.59 552.03
Greece 1.88 1.82 1.74 1.70 2.43 9.68 15.94 17.59
Ireland 4.29 4.43 5.91 2.52 13.07 30.29 31.62 6.77
Italy 289.72 272.31 245.72 233.34 218.48 191.36 217.90 126.89
Japan 433.19 473.18 529.09 703.33 683.52 850.80 737.26 913.21
Korea 1.21 2.49 5.03 6.44 7.83 11.37 12.27 41.32
Luxembourg 1.50 1.44 9.40 9.44 4.07 18.42 19.40 29.54
Netherlands 166.70 145.64 240.05 248.58 179.71 222.96 283.97 284.44
New Zealand 1.59 2.58 3.20 4.00 56.15 53.43 4.78 4.51
Norway 122.53 115.37 125.08 117.29 99.99 93.06 154.54 148.08
Portugal 1.46 1.42 3.24 3.57 9.32 11.18 14.72 19.82
Spain 19.36 35.52 106.55 118.83 103.00 170.03 247.34 213.17
Sweden 360.69 327.52 362.07 348.04 286.24 283.51 272.19 243.48
Switzerland 84.75 77.02 65.39 62.68 87.50 71.77 67.87 84.96
United Kingdom 146.55 155.93 266.94 258.21 310.26 318.49 339.18 394.95
United States 1,412.08 1,402.41 1,500.69 1,444.11 1,841.45 1,865.69 1,753.77 1,753.38
Other 147.97 142.90 189.81 185.73 230.17 225.49 132.10 129.70
Private philanthropy
Bill & Melinda Gates Foundation (BMGF) – – – – – – – –
Corporate donations 43.51 46.74 63.05 77.63 94.86 87.35 101.25 109.87
Other1 453.14 463.63 568.39 624.14 635.05 611.85 630.05 657.11
Debt repayments (IBRD) 78.86 122.19 221.71 473.40 612.12 532.96 714.36 1,092.25
Other 354.20 342.07 229.60 224.67 277.97 272.32 186.00 182.76
Unallocable 368.83 352.07 345.68 370.36 397.06 355.49 422.33 497.38
Total 5,819.55 5,668.78 6,291.56 6,764.05 7,815.13 8,062.20 8,146.58 8,626.57
Source: IHME DAH Database 2011
Notes: In millions US$, 2009. Development assistance for health (DAH) includes both financial and in-kind contributions for activities aimed at improving health in low- and middle-income countries. This table disaggregates DAH by the primary funding source.
For preliminary estimates of DAH for 2010 and 2011, refer to Table 1 of the Statistical Annex. Dashes indicate inapplicable.
1 Includes private contributions through foundations and NGOs
66 INSTITUTE FOR HEALTH METRICS AND EVALUATION
TABLE 2: DAH by source of funding, 1990-2009

STATISTICAL ANNEX 67
1998 1999 2000 2001 2002 2003 2004 2005 2006 2007 2008 2009
120.07 165.11 187.05 164.11 151.07 149.65 166.82 225.73 196.06 226.02 297.70 331.37
34.19 101.96 66.25 39.61 41.07 53.01 45.13 55.52 51.99 63.48 76.58 65.55
113.17 120.33 132.54 137.70 190.56 179.03 206.40 172.58 209.75 227.20 302.29 304.41
131.10 151.73 171.42 152.24 243.94 284.54 379.58 508.00 420.41 543.86 581.79 741.47
135.41 133.49 131.19 110.60 121.49 139.00 164.11 184.34 183.75 202.26 190.50 219.53
47.40 49.16 49.61 52.56 64.99 70.43 75.03 77.34 87.68 86.30 93.37 95.75
415.65 394.21 346.35 385.91 460.53 619.70 521.69 696.33 1,000.88 842.88 1,119.52 969.45
508.91 517.31 495.52 492.76 577.37 603.54 522.88 589.84 739.69 795.83 974.56 1,026.23
18.56 12.93 14.98 18.26 17.87 42.57 33.82 50.73 53.32 53.75 34.48 35.61
30.54 29.53 41.38 52.13 115.39 145.21 155.43 172.75 254.78 273.79 222.00 165.96
161.36 175.34 156.18 210.06 226.70 338.86 216.63 423.15 391.84 424.02 482.46 278.99
812.42 859.03 892.01 849.08 653.48 797.52 936.91 847.87 828.13 617.42 690.50 737.98
48.80 112.35 92.31 60.26 67.63 40.48 85.52 99.25 73.82 86.76 94.90 140.86
31.64 24.45 34.36 42.73 49.48 48.54 56.20 50.66 68.08 76.37 79.71 75.21
294.93 294.48 420.91 411.22 398.39 407.26 394.75 437.40 589.01 515.83 701.28 577.19
6.03 6.84 7.23 9.52 12.34 13.40 16.81 19.90 26.11 26.59 34.77 36.99
119.85 140.25 155.62 215.18 280.31 315.02 360.78 363.65 378.01 557.51 554.96 708.23
18.51 18.22 18.99 18.53 22.07 25.24 18.81 24.08 23.90 25.59 22.99 22.70
200.50 228.55 177.54 187.04 194.45 224.13 219.65 255.05 342.88 442.11 681.17 769.84
212.79 210.70 192.79 163.01 192.67 216.32 331.04 463.86 484.26 510.46 541.71 490.73
54.19 131.05 63.51 65.57 79.79 146.79 83.33 74.13 111.59 84.33 96.41 145.29
463.09 499.55 843.71 838.65 868.86 1,095.53 1,023.36 1,354.77 1,630.79 2,102.69 1,751.81 1,946.32
1,741.56 1,893.52 2,029.13 2,210.32 3,018.94 3,051.26 3,823.66 4,032.31 4,705.70 5,939.21 7,687.83 8,372.03
345.78 341.25 113.93 113.84 92.64 96.34 149.74 163.35 199.43 239.24 263.44 238.14
– 173.16 435.12 500.84 548.98 624.02 450.05 723.29 867.46 1,161.99 1,939.55 1,766.32
119.71 131.70 123.50 184.68 211.58 254.10 361.56 434.60 392.40 453.43 694.06 494.03
897.00 1,055.94 1,220.76 1,239.18 1,183.89 1,259.74 1,338.91 1,650.22 1,837.41 2,025.34 2,440.74 2,361.72
1,086.24 1,033.10 1,185.74 1,064.39 1,288.78 1,086.87 1,466.88 1,335.19 982.53 1,102.62 704.83 764.12
217.69 214.55 233.49 233.79 253.22 283.13 333.35 337.88 508.58 682.69 691.06 638.83
556.87 650.57 825.95 599.36 688.90 615.80 1,062.16 1,036.92 769.17 812.56 828.92 1,169.42
8,943.94 9,870.34 10,859.06 10,823.10 12,317.40 13,227.04 15,000.98 16,860.69 18,409.37 21,202.11 24,875.88 25,690.25

68 INSTITUTE FOR HEALTH METRICS AND EVALUATION
TABLE 3:DAH by country of origin, 1990-2009
Country 1990 1991 1992 1993 1994 1995 1996 1997
Australia 28.93 31.58 63.02 74.67 119.56 116.65 174.59 141.43
Austria 36.23 15.53 12.75 14.24 19.67 16.15 18.64 70.50
Belgium 78.83 104.97 118.03 121.25 117.27 123.09 120.89 111.00
Canada 138.27 138.61 128.24 131.10 173.31 176.45 150.41 157.50
Denmark 97.61 110.47 139.67 151.93 160.03 155.69 234.93 197.62
Finland 102.98 104.13 70.86 59.15 55.26 49.90 52.14 45.41
France 644.28 457.29 399.47 355.86 472.44 506.45 511.08 410.24
Germany 211.77 230.41 290.11 356.35 571.19 653.71 546.92 563.17
Greece 1.99 1.92 1.93 1.88 2.56 9.80 16.03 17.69
Ireland 4.34 4.48 5.95 2.56 13.21 30.43 31.62 6.77
Italy 291.48 274.00 249.05 236.59 221.35 194.17 220.08 129.03
Japan 447.54 487.03 543.55 717.48 705.71 872.54 759.85 935.40
Korea 1.29 2.57 5.07 6.47 8.07 11.60 12.63 41.68
Luxembourg 1.53 1.47 9.52 9.55 4.20 18.55 19.52 29.66
Netherlands 173.17 151.89 250.69 258.99 189.65 232.69 288.74 289.13
New Zealand 1.65 2.64 3.43 4.22 56.29 53.57 4.93 4.67
Norway 122.69 115.52 125.22 117.42 100.06 93.12 154.80 148.33
Portugal 1.58 1.53 3.37 3.70 9.40 11.25 14.76 19.86
Spain 22.72 38.76 110.77 122.96 108.35 175.27 253.64 219.36
Sweden 360.74 327.57 362.31 348.28 286.73 283.99 272.40 243.68
Switzerland 87.47 79.65 69.67 66.86 90.37 74.58 71.84 88.86
United Kingdom 149.32 158.61 271.26 262.45 314.99 323.12 342.79 398.50
United States 1,844.15 1,850.41 2,034.22 2,050.08 2,460.93 2,456.69 2,378.01 2,415.17
Other countries 136.15 131.49 179.09 175.24 222.27 217.75 129.38 127.02
Unallocable by country1 354.20 342.07 230.19 225.24 277.97 272.32 186.00 182.76
Unspecified2 478.65 504.16 614.13 889.51 1,054.31 932.67 1,179.94 1,632.13
Total 5,819.55 5,668.78 6,291.56 6,764.05 7,815.13 8,062.20 8,146.58 8,626.57
Source: IHME DAH Database 2011
Notes: In millions US$, 2009. Development assistance for health (DAH) includes both financial and in-kind contributions for activities aimed at improving health in low- and middle-income countries. This table disaggregates all DAH from both public and private sources by origin country of DAH.
1 Unallocable includes funds such as interagency transfers from non-DAH institutions, interest income, and miscellaneous income that could not be attributed to countries.2 Channels for which we had no revenue information are included under unspecified.
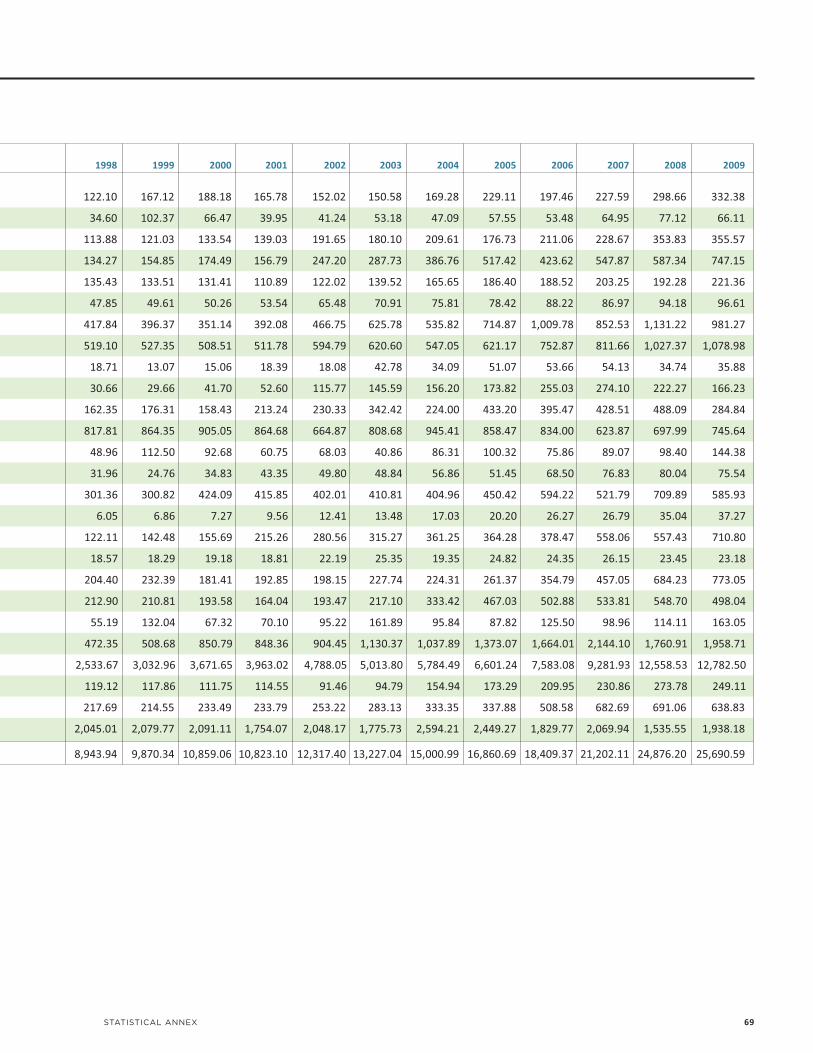
1998 1999 2000 2001 2002 2003 2004 2005 2006 2007 2008 2009
122.10 167.12 188.18 165.78 152.02 150.58 169.28 229.11 197.46 227.59 298.66 332.38
34.60 102.37 66.47 39.95 41.24 53.18 47.09 57.55 53.48 64.95 77.12 66.11
113.88 121.03 133.54 139.03 191.65 180.10 209.61 176.73 211.06 228.67 353.83 355.57
134.27 154.85 174.49 156.79 247.20 287.73 386.76 517.42 423.62 547.87 587.34 747.15
135.43 133.51 131.41 110.89 122.02 139.52 165.65 186.40 188.52 203.25 192.28 221.36
47.85 49.61 50.26 53.54 65.48 70.91 75.81 78.42 88.22 86.97 94.18 96.61
417.84 396.37 351.14 392.08 466.75 625.78 535.82 714.87 1,009.78 852.53 1,131.22 981.27
519.10 527.35 508.51 511.78 594.79 620.60 547.05 621.17 752.87 811.66 1,027.37 1,078.98
18.71 13.07 15.06 18.39 18.08 42.78 34.09 51.07 53.66 54.13 34.74 35.88
30.66 29.66 41.70 52.60 115.77 145.59 156.20 173.82 255.03 274.10 222.27 166.23
162.35 176.31 158.43 213.24 230.33 342.42 224.00 433.20 395.47 428.51 488.09 284.84
817.81 864.35 905.05 864.68 664.87 808.68 945.41 858.47 834.00 623.87 697.99 745.64
48.96 112.50 92.68 60.75 68.03 40.86 86.31 100.32 75.86 89.07 98.40 144.38
31.96 24.76 34.83 43.35 49.80 48.84 56.86 51.45 68.50 76.83 80.04 75.54
301.36 300.82 424.09 415.85 402.01 410.81 404.96 450.42 594.22 521.79 709.89 585.93
6.05 6.86 7.27 9.56 12.41 13.48 17.03 20.20 26.27 26.79 35.04 37.27
122.11 142.48 155.69 215.26 280.56 315.27 361.25 364.28 378.47 558.06 557.43 710.80
18.57 18.29 19.18 18.81 22.19 25.35 19.35 24.82 24.35 26.15 23.45 23.18
204.40 232.39 181.41 192.85 198.15 227.74 224.31 261.37 354.79 457.05 684.23 773.05
212.90 210.81 193.58 164.04 193.47 217.10 333.42 467.03 502.88 533.81 548.70 498.04
55.19 132.04 67.32 70.10 95.22 161.89 95.84 87.82 125.50 98.96 114.11 163.05
472.35 508.68 850.79 848.36 904.45 1,130.37 1,037.89 1,373.07 1,664.01 2,144.10 1,760.91 1,958.71
2,533.67 3,032.96 3,671.65 3,963.02 4,788.05 5,013.80 5,784.49 6,601.24 7,583.08 9,281.93 12,558.53 12,782.50
119.12 117.86 111.75 114.55 91.46 94.79 154.94 173.29 209.95 230.86 273.78 249.11
217.69 214.55 233.49 233.79 253.22 283.13 333.35 337.88 508.58 682.69 691.06 638.83
2,045.01 2,079.77 2,091.11 1,754.07 2,048.17 1,775.73 2,594.21 2,449.27 1,829.77 2,069.94 1,535.55 1,938.18
8,943.94 9,870.34 10,859.06 10,823.10 12,317.40 13,227.04 15,000.99 16,860.69 18,409.37 21,202.11 24,876.20 25,690.59
STATISTICAL ANNEX 69

70 INSTITUTE FOR HEALTH METRICS AND EVALUATION
TABLE 4:DAH by target region, 1990-2009
Year Sub-Saharan Africa Middle East and North Africa South Asia
1990 564.68 119.62 301.42
1991 588.57 163.91 320.00
1992 697.85 161.04 514.66
1993 700.57 202.91 598.46
1994 700.15 213.98 674.15
1995 767.35 210.82 578.37
1996 976.03 204.10 643.19
1997 985.99 262.82 618.47
1998 981.45 229.78 659.80
1999 1,070.76 297.24 681.91
2000 1,114.94 309.02 711.02
2001 1,611.27 318.46 772.90
2002 1,691.20 279.56 881.01
2003 2,419.42 326.85 974.24
2004 3,279.55 397.36 970.92
2005 3,887.14 818.73 1,252.86
2006 4,598.70 813.60 1,227.67
2007 5,334.61 653.14 1,442.57
2008 7,022.10 646.44 1,816.69
2009 7,607.26 554.98 1,854.46
Sources: IHME DAH Database 2011 and IHME DAH Database (Country and Regional Recipient Level) 2011
Notes: In millions US$, 2009. Development assistance for health (DAH) includes both financial and in-kind contributions for activities aimed at improving health in low- and middle-income countries. This table disaggregates DAH by region intended to benefit from the assistance. World Bank regional groupings are used.
For preliminary estimates of DAH for 2010 and 2011, refer to Table 1 of the Statistical Annex.
1 Global denotes contributions made toward health research or the creation of public goods for multiple regions or projects that donors categorized as benefiting the entire world.

STATISTICAL ANNEX 71
East Asia and Pacific Europe and Central Asia Latin America and Caribbean Global1 Unallocable by region Total
300.79 15.21 357.83 44.43 4,115.57 5,819.55
257.74 15.13 400.50 56.44 3,866.50 5,668.78
269.05 57.26 383.84 72.56 4,135.30 6,291.56
422.17 147.38 483.47 178.49 4,030.61 6,764.05
394.55 196.42 470.30 483.39 4,682.18 7,815.13
321.51 118.01 562.30 632.34 4,871.50 8,062.20
410.89 141.17 759.01 462.34 4,549.86 8,146.58
452.86 236.15 1,178.57 528.44 4,363.29 8,626.57
467.03 247.64 1,176.51 450.95 4,730.77 8,943.94
677.53 369.58 1,155.24 548.43 5,069.65 9,870.34
967.74 307.82 1,217.16 654.35 5,577.00 10,859.06
758.38 292.62 1,100.25 697.41 5,271.80 10,823.10
611.21 241.68 1,194.63 1,307.82 6,110.29 12,317.40
836.39 310.27 1,160.16 1,764.00 5,435.72 13,227.04
996.14 367.76 1,743.01 1,186.21 6,060.04 15,000.99
1,053.99 664.05 1,538.34 1,526.29 6,119.29 16,860.69
1,235.79 595.93 1,235.63 1,895.42 6,806.63 18,409.37
1,316.76 656.79 1,265.72 2,859.60 7,672.94 21,202.11
1,347.58 653.48 1,181.61 3,203.09 9,005.23 24,876.21
1,478.61 632.06 1,232.68 3,324.98 9,005.56 25,690.58

72 INSTITUTE FOR HEALTH METRICS AND EVALUATION
TABLE 5:DAH by target country, 1990-2009
1990 1991 1992 1993 1994 1995 1996 1997 1998
DAH per DAH per DAH per DAH per DAH per DAH per DAH per DAH per DAH per Region/Country DAH capita DAH capita DAH capita DAH capita DAH capita DAH capita DAH capita DAH capita DAH capita
East Asia and Pacific
Cambodia 0.00 0.00 1.64 0.16 6.04 0.58 7.94 0.74 37.67 3.40 56.05 4.92 56.40 4.82 46.83 3.91 33.81 2.76
China 43.01 0.04 33.45 0.03 53.54 0.05 48.73 0.04 63.85 0.05 82.99 0.07 111.41 0.09 102.56 0.08 103.67 0.08
Cook Islands 0.00 0.00 0.00 0.00 0.00 0.01 0.01 0.01 0.01
Fiji 0.76 1.05 5.20 7.12 11.66 15.78 18.70 24.97 1.69 2.23 1.53 1.99 1.05 1.35 1.19 1.52 0.71 0.90
Indonesia 99.99 0.55 58.07 0.31 47.24 0.25 74.55 0.39 49.39 0.25 50.59 0.26 61.86 0.31 99.19 0.49 118.46 0.58
Kiribati 5.25 2.44 0.01 2.49 0.10 0.10 0.22 0.21 0.19
Laos 0.10 0.02 0.55 0.13 2.27 0.53 0.88 0.20 1.90 0.42 2.35 0.50 7.36 1.53 5.97 1.21 6.21 1.24
Malaysia 42.12 2.33 42.60 2.29 38.60 2.02 36.51 1.86 41.99 2.09 30.88 1.50 42.39 2.01 31.66 1.46 11.51 0.52
Marshall Islands 0.00 0.00 0.00 0.07 0.07 1.06 1.04 1.02 0.94
Micronesia 0.00 0.00 0.00 0.00 3.87 38.15 0.63 6.07 0.46 4.37 0.34 3.17 0.25 2.32 0.18 1.71 0.00 0.00
Mongolia 1.94 0.87 2.07 0.92 2.99 1.30 1.99 0.85 3.08 1.30 3.31 1.38 3.09 1.28 3.42 1.41 6.53 2.68
Myanmar 2.89 0.07 2.17 0.05 0.09 0.00 0.10 0.00 0.12 0.00 0.19 0.00 0.26 0.01 0.27 0.01 0.56 0.01
Nauru 0.00 0.00 0.00 0.00 0.00 0.00 0.00 0.00 0.00
New Caledonia 0.00 0.00 0.00 0.00 0.00 0.00 0.00 0.00 0.00 0.00 0.00 0.00 0.00 0.00 0.00 0.00 0.00 0.00
Niue 0.00 0.00 0.00 0.00 0.00 0.00 0.00 0.00 0.00
North Korea 0.00 0.00 0.00 0.00 0.00 0.00 0.00 0.00 0.01 0.00 0.01 0.00 0.00 0.00 0.00 0.00 0.26 0.01
Northern Mariana Islands 0.14 2.62 0.48 0.36 0.26 0.00 0.00 0.00 0.00
Palau 0.00 0.00 0.00 0.00 0.00 0.00 0.00 0.00 0.00
Papua New Guinea 16.76 4.06 18.71 4.41 24.93 5.73 27.88 6.24 13.70 2.99 9.93 2.11 41.66 8.61 22.92 4.61 42.93 8.41
Philippines 44.30 0.72 50.03 0.80 44.75 0.70 36.02 0.55 42.36 0.63 45.83 0.67 46.47 0.66 49.14 0.69 73.65 1.01
Samoa 0.00 0.01 0.00 0.00 0.00 0.00 0.39 2.37 0.64 3.83 0.32 1.89 0.37 2.16 0.33 1.92 1.18 6.80
Solomon Islands 1.26 4.02 1.39 4.32 2.59 7.81 2.11 6.18 2.72 7.73 2.22 6.12 2.48 6.66 1.66 4.34 1.24 3.16
South Korea 28.79 0.67 16.00 0.37 0.00 0.00 105.53 2.39 97.07 2.18 0.00 0.00 0.00 0.00 0.00 0.00 0.00 0.00
Thailand 2.55 0.05 1.52 0.03 0.80 0.01 13.58 0.24 3.81 0.07 2.77 0.05 9.50 0.16 22.74 0.39 2.04 0.03
Timor-Leste 0.00 0.00 0.00 0.00 0.00 0.00 0.00 0.00 0.00 0.00 0.00 0.00 0.00 0.00 0.00 0.00 0.00 0.00
Tokelau 0.00 0.00 0.00 0.00 0.00 0.00 0.00 0.00 0.00
Tonga 0.07 0.78 0.07 0.72 0.05 0.49 0.13 1.39 0.33 3.39 0.24 2.50 0.18 1.87 1.49 15.20 0.15 1.55
Tuvalu 0.00 0.00 0.00 0.00 0.00 0.09 0.06 0.08 0.13
Vanuatu 0.31 2.08 0.70 4.55 0.34 2.15 0.46 2.83 0.60 3.59 0.45 2.61 0.37 2.11 0.83 4.63 1.13 6.19
Vietnam 3.57 0.05 11.77 0.17 19.99 0.29 28.50 0.40 16.88 0.23 15.71 0.21 17.15 0.23 43.02 0.57 54.15 0.70
Wallis and Futuna 0.00 0.00 0.00 0.00 0.00 0.00 0.00 0.00 0.00
Europe and Central Asia
Albania 0.00 0.00 0.00 0.00 2.88 0.88 0.91 0.28 2.73 0.86 2.91 0.92 4.32 1.38 3.44 1.11 7.01 2.27
Armenia 0.00 0.00 0.00 0.00 0.00 0.00 0.00 0.00 14.11 4.28 2.60 0.80 3.21 1.01 2.49 0.79 5.42 1.74
Azerbaijan 0.00 0.00 0.00 0.00 0.00 0.00 0.00 0.00 5.89 0.77 0.96 0.12 0.90 0.11 0.58 0.07 0.52 0.07
Belarus 0.00 0.00 0.00 0.00 0.00 0.00 0.00 0.00 0.00 0.00 0.00 0.00 0.00 0.00 0.00 0.00 0.00 0.00
Bosnia and Herzegovina 0.00 0.00 0.00 0.00 0.00 0.00 0.38 0.10 0.99 0.28 0.61 0.18 2.18 0.64 22.06 6.37 23.94 6.70
Bulgaria 0.00 0.00 0.00 0.00 0.00 0.00 0.00 0.00 0.00 0.00 0.00 0.00 0.00 0.00 4.95 0.60 4.89 0.60
Croatia 0.00 0.00 0.00 0.00 0.00 0.00 0.00 0.00 0.72 0.15 7.09 1.52 14.39 3.09 13.59 2.94 13.35 2.92
Estonia 0.00 0.00 0.00 0.00 0.00 0.00 0.00 0.00 0.00 0.00 0.00 0.00 0.53 0.38 0.52 0.37 0.52 0.37
Georgia 0.00 0.00 0.00 0.00 0.00 0.00 0.00 0.00 7.93 1.55 1.53 0.30 1.88 0.38 4.43 0.91 7.12 1.48
Gibraltar 0.00 0.00 0.00 0.00 0.00 0.00 0.00 0.00 0.00
Hungary 0.00 0.00 0.00 0.00 0.00 0.00 0.00 0.00 7.01 0.68 6.87 0.66 6.74 0.65 6.62 0.64 6.55 0.64
Kazakhstan 0.00 0.00 0.00 0.00 0.00 0.00 0.00 0.00 4.79 0.30 3.72 0.23 4.48 0.29 5.16 0.33 7.83 0.51
Kosovo 0.00 0.00 0.00 0.00 0.00 0.00 0.00 0.00 0.00
Kyrgyzstan 0.00 0.00 0.00 0.00 0.00 0.00 0.10 0.02 1.56 0.34 0.30 0.07 8.39 1.80 8.60 1.82 9.00 1.87

STATISTICAL ANNEX 73
1999 2000 2001 2002 2003 2004 2005 2006 2007 2008 2009
DAH per DAH per DAH per DAH per DAH per DAH per DAH per DAH per DAH per DAH per DAH perDAH capita DAH capita DAH capita DAH capita DAH capita DAH capita DAH capita DAH capita DAH capita DAH capita DAH capita
30.58 2.44 38.15 2.99 42.99 3.30 34.73 2.62 76.31 5.66 81.54 5.94 115.11 8.25 110.02 7.75 120.35 8.33 127.22 8.66 148.81 9.95
93.31 0.07 140.61 0.11 129.51 0.10 125.85 0.10 143.69 0.11 222.47 0.17 183.10 0.14 244.22 0.18 300.40 0.23 251.08 0.19 296.94 0.22
0.00 0.14 0.14 0.30 1.51 1.91 0.52 1.45 0.68 0.39 0.51
11.64 14.63 8.11 10.11 4.09 5.06 5.31 6.54 13.56 16.58 6.15 7.47 2.84 3.43 6.17 7.41 7.41 8.84 5.93 7.03 5.88 6.92
139.68 0.67 394.20 1.86 255.27 1.19 163.76 0.75 209.36 0.95 228.01 1.02 186.20 0.82 231.40 1.01 208.82 0.90 228.98 0.98 248.34 1.05
0.15 0.29 0.17 0.20 0.19 0.15 2.06 2.77 4.42 7.52 4.40
12.02 2.34 22.23 4.25 15.39 2.89 13.84 2.56 31.93 5.82 24.53 4.40 35.13 6.20 33.87 5.88 39.70 6.78 41.11 6.89 33.34 5.49
13.82 0.61 11.45 0.49 8.87 0.37 1.20 0.05 2.77 0.11 1.41 0.06 1.51 0.06 0.87 0.03 0.76 0.03 0.70 0.03 0.53 0.02
3.44 2.61 2.44 2.04 3.93 10.43 15.40 7.46 7.86 8.46 9.42
5.87 54.77 1.06 9.89 0.77 7.14 0.00 0.00 4.47 41.17 17.66 161.44 19.40 176.25 17.64 159.43 18.14 163.29 18.24 163.46 23.89 213.14
12.99 5.29 7.66 3.10 17.61 7.08 5.97 2.38 9.04 3.57 6.14 2.40 7.45 2.89 7.28 2.79 15.15 5.76 14.24 5.37 16.91 6.31
2.08 0.05 3.13 0.07 3.47 0.07 10.01 0.21 27.08 0.57 25.44 0.53 39.17 0.82 21.50 0.44 35.19 0.72 47.30 0.96 48.36 0.97
0.00 0.00 0.00 0.00 0.00 0.00 0.41 1.81 4.01 2.65 2.07
0.00 0.00 0.00 0.00 0.00 0.00 0.00 0.00 0.00 0.00 0.00 0.00 0.00 0.00 0.00 0.00 0.00 0.00 0.00 0.00 0.00 0.00
0.00 0.00 0.00 0.12 0.03 0.30 4.79 0.79 1.45 0.41 0.35
0.21 0.01 0.07 0.00 0.00 0.00 1.29 0.06 1.32 0.06 2.02 0.09 3.54 0.15 2.45 0.10 2.04 0.09 2.61 0.11 5.68 0.24
0.00 0.00 0.00 0.00 0.00 0.00 0.00 0.00 0.00 0.00 0.00
1.68 0.27 0.20 0.00 1.32 1.20 1.33 0.96 0.10 0.79 0.98
45.17 8.62 31.36 5.83 44.82 8.12 52.52 9.28 51.74 8.92 54.92 9.25 56.97 9.39 59.77 9.64 56.90 8.99 69.40 10.75 84.93 12.90
87.65 1.17 76.93 1.01 87.48 1.12 43.56 0.55 78.88 0.97 81.69 0.99 121.50 1.44 118.85 1.38 142.68 1.62 117.64 1.31 127.75 1.40
0.62 3.54 0.46 2.61 2.17 12.12 2.48 13.75 3.66 20.20 3.54 19.40 3.30 17.97 4.76 25.69 2.90 15.49 2.96 15.69 3.01 15.80
2.14 5.28 2.65 6.38 6.42 15.04 7.28 16.63 10.89 24.23 12.21 26.50 10.39 22.00 10.53 21.75 11.72 23.65 16.57 32.66 18.27 35.20
0.06 0.00 0.00 0.00 0.00 0.00 0.00 0.00 0.00 0.00 0.00 0.00 0.00 0.00 0.00 0.00 0.00 0.00 0.00 0.00 0.00 0.00
121.91 2.03 134.88 2.22 17.22 0.28 19.15 0.31 33.49 0.54 53.95 0.86 36.29 0.58 80.92 1.28 59.58 0.93 68.72 1.07 51.57 0.80
0.28 0.34 0.51 0.62 2.56 3.02 0.73 0.81 2.36 2.47 4.00 3.95 8.95 8.38 15.97 14.34 17.42 15.08 23.10 19.37 19.66 15.98
0.00 0.00 0.00 0.07 0.26 0.06 0.00 0.00 0.00 0.00 0.00
0.08 0.85 0.92 9.33 0.93 9.48 0.95 9.67 2.04 20.65 4.57 46.15 11.72 117.94 4.46 44.68 2.84 28.27 2.97 29.48 3.22 31.77
0.00 0.14 0.14 5.02 2.07 0.06 0.44 0.13 0.14 0.14 0.38
1.70 9.14 1.60 8.46 2.89 14.86 2.34 11.75 3.51 17.16 3.62 17.23 3.51 16.30 2.86 12.94 3.08 13.60 4.98 21.50 8.13 34.28
76.46 0.98 73.83 0.93 79.09 0.99 82.67 1.02 97.09 1.17 113.49 1.35 145.73 1.71 189.83 2.20 179.38 2.05 216.07 2.44 238.17 2.66
0.00 0.00 17.06 15.68 6.66 3.36 1.02 1.00 3.52 0.86 0.19
12.19 3.95 12.42 4.03 21.39 6.93 11.07 3.57 20.64 6.63 20.16 6.43 25.43 8.06 27.38 8.63 20.39 6.39 22.05 6.88 11.94 3.70
6.80 2.19 12.31 3.99 5.28 1.72 11.86 3.89 7.32 2.41 4.40 1.45 20.73 6.87 17.48 5.81 18.83 6.27 25.27 8.43 23.20 7.76
9.48 1.17 11.77 1.45 3.87 0.47 4.69 0.57 2.78 0.34 2.45 0.29 9.28 1.11 13.61 1.62 14.40 1.70 14.26 1.67 16.97 1.97
0.00 0.00 0.00 0.00 0.00 0.00 0.00 0.00 0.00 0.00 1.42 0.14 4.56 0.47 4.65 0.48 7.87 0.81 14.26 1.48 14.03 1.46
46.96 12.71 18.62 4.92 16.23 4.22 13.13 3.38 13.51 3.47 9.97 2.55 10.58 2.70 26.18 6.67 22.74 5.78 18.05 4.58 24.56 6.23
11.69 1.45 11.44 1.43 14.87 1.87 10.09 1.28 12.63 1.61 14.20 1.82 29.78 3.85 30.67 3.99 17.43 2.28 58.85 7.76 28.60 3.80
12.84 2.83 5.53 1.23 5.48 1.22 7.79 1.73 9.12 2.02 5.51 1.21 7.79 1.71 21.22 4.66 0.52 0.11 0.00 0.00 0.00 0.00
0.51 0.37 0.50 0.37 0.00 0.00 0.00 0.00 1.17 0.86 2.03 1.51 2.54 1.89 0.00 0.00 0.00 0.00 0.00 0.00 0.00 0.00
11.00 2.30 18.49 3.92 14.84 3.18 17.01 3.69 13.92 3.05 14.45 3.20 31.72 7.09 29.56 6.67 39.57 9.00 22.64 5.19 22.68 5.24
0.00 0.00 0.00 0.00 0.00 0.00 0.00 0.00 0.00 0.00 0.00
6.45 0.63 6.32 0.62 0.00 0.00 0.00 0.00 0.00 0.00 0.00 0.00 0.00 0.00 0.00 0.00 0.00 0.00 0.00 0.00 0.00 0.00
17.65 1.17 20.92 1.40 17.64 1.18 13.14 0.88 17.71 1.18 13.39 0.89 10.44 0.69 15.47 1.01 9.81 0.64 19.19 1.24 20.21 1.29
0.00 0.00 0.00 0.00 0.00 0.12 0.12 0.24 0.24 0.28 0.28
8.85 1.82 17.32 3.50 8.39 1.68 12.90 2.55 23.79 4.66 16.68 3.24 28.16 5.41 31.42 5.98 36.19 6.81 42.65 7.93 29.52 5.43
(continued on next page)

74 INSTITUTE FOR HEALTH METRICS AND EVALUATION
Table 5: DAH by target country, 1990-2009, continued
1990 1991 1992 1993 1994 1995 1996 1997 1998
DAH per DAH per DAH per DAH per DAH per DAH per DAH per DAH per DAH per Region/Country DAH capita DAH capita DAH capita DAH capita DAH capita DAH capita DAH capita DAH capita DAH capita
Latvia 0.00 0.00 0.00 0.00 0.00 0.00 9.11 3.55 8.93 3.53 0.00 0.00 0.00 0.00 0.00 0.00 0.00 0.00
Lithuania 0.00 0.00 0.00 0.00 0.00 0.00 6.88 1.87 6.73 1.84 6.60 1.82 0.00 0.00 0.00 0.00 0.00 0.00
Macedonia 0.00 0.00 0.00 0.00 0.00 0.00 0.00 0.00 0.00 0.00 0.00 0.00 6.67 3.38 6.64 3.35 4.19 2.10
Malta 0.00 0.00 0.00 0.00 0.00 0.00 0.00 0.00 0.02 0.04 0.01 0.02 0.00 0.01 0.00 0.00 0.00 0.00
Moldova 0.00 0.00 0.00 0.00 0.00 0.00 0.00 0.00 0.00 0.00 0.00 0.00 0.00 0.00 0.55 0.13 1.05 0.25
Montenegro 0.00 0.00 0.00 0.00 0.00 0.00 0.00 0.00 0.00 0.00 0.00 0.00 0.00 0.00 0.00 0.00 0.00 0.00
Poland 0.00 0.00 0.00 0.00 0.00 0.00 12.46 0.32 12.20 0.32 11.96 0.31 11.73 0.30 11.53 0.30 11.40 0.30
Romania 0.00 0.00 0.00 0.00 25.65 1.11 25.09 1.09 24.57 1.08 24.07 1.06 23.62 1.05 23.21 1.03 22.95 1.03
Russia 0.00 0.00 0.00 0.00 0.00 0.00 71.57 0.48 70.09 0.47 0.00 0.00 0.00 0.00 66.73 0.45 71.99 0.49
Serbia 0.00 0.00 0.00 0.00 0.00 0.00 0.00 0.00 0.00 0.00 0.00 0.00 0.00 0.00 0.00 0.00 0.48 0.05
Slovakia 0.00 0.00 0.00 0.00 0.00 0.00 0.00 0.00 0.00 0.00 0.00 0.00 0.00 0.00 0.00 0.00 0.00 0.00
Tajikistan 0.00 0.00 0.00 0.00 0.00 0.00 0.00 0.00 5.26 0.92 1.75 0.30 1.68 0.29 2.18 0.37 1.38 0.23
Turkey 12.97 0.23 12.15 0.21 26.07 0.44 19.16 0.32 16.23 0.26 37.09 0.59 35.01 0.55 29.89 0.46 27.39 0.41
Turkmenistan 0.00 0.00 0.00 0.00 0.00 0.00 0.00 0.00 1.37 0.34 1.86 0.44 1.05 0.24 1.31 0.30 6.45 1.47
Ukraine 0.00 0.00 0.00 0.00 0.00 0.00 0.00 0.00 0.00 0.00 0.00 0.00 0.00 0.00 0.00 0.00 0.00 0.00
Uzbekistan 0.00 0.00 0.00 0.00 0.00 0.00 0.00 0.00 1.47 0.07 2.80 0.12 11.59 0.50 7.47 0.32 7.36 0.31
Yugoslavia 0.00 0.00 0.87 0.37 1.87 2.05 1.14 0.60 0.07
Latin America and Caribbean
Anguilla 0.00 0.00 0.33 0.34 0.38 0.32 0.26 0.19 0.06
Antigua and Barbuda 0.00 0.00 0.00 0.00 0.00 0.00 0.00 0.00 0.00
Argentina 14.74 0.45 24.52 0.74 55.45 1.66 16.25 0.48 31.81 0.92 74.06 2.13 83.71 2.37 303.37 8.50 350.16 9.70
Barbados 3.84 14.17 0.00 0.01 0.12 0.45 0.12 0.44 0.12 0.43 0.12 0.42 0.11 0.41 0.11 0.40 0.11 0.39
Belize 2.82 15.18 2.55 13.35 2.06 10.49 1.80 8.91 1.10 5.27 1.13 5.28 0.89 4.07 0.63 2.77 0.80 3.44
Bolivia 17.03 2.55 20.18 2.96 34.87 4.99 32.73 4.58 38.08 5.21 34.90 4.67 39.69 5.19 44.33 5.67 53.97 6.76
Brazil 48.55 0.32 43.10 0.28 48.34 0.31 44.85 0.29 80.07 0.50 79.25 0.49 77.07 0.47 146.60 0.88 124.59 0.74
Chile 9.68 0.73 30.56 2.28 27.78 2.03 39.31 2.82 29.33 2.07 32.00 2.22 26.20 1.79 25.47 1.72 19.52 1.30
Colombia 5.00 0.14 5.60 0.16 4.43 0.12 18.08 0.49 17.92 0.48 15.64 0.41 39.92 1.03 42.86 1.08 23.21 0.58
Costa Rica 1.62 0.53 0.93 0.30 1.41 0.44 6.25 1.89 8.92 2.63 8.74 2.52 9.01 2.53 8.38 2.29 9.20 2.45
Cuba 0.04 0.00 0.02 0.00 0.25 0.02 0.36 0.03 0.26 0.02 0.53 0.05 0.33 0.03 0.93 0.08 0.63 0.06
Dominica 3.45 1.02 0.10 1.00 0.35 0.18 0.07 0.38 0.35
Dominican Republic 5.49 0.75 4.52 0.61 4.42 0.58 10.29 1.33 6.94 0.88 6.51 0.81 19.81 2.43 16.29 1.96 34.43 4.07
Ecuador 10.48 1.02 7.66 0.73 8.01 0.75 17.67 1.61 16.94 1.51 15.55 1.36 15.77 1.36 18.14 1.54 27.34 2.28
El Salvador 26.88 5.26 37.31 7.17 40.52 7.64 26.21 4.85 19.13 3.47 17.96 3.19 11.21 1.95 15.84 2.70 23.95 4.01
Falkland Islands 0.00 0.00 0.00 0.00 0.00 0.00 0.00 0.00 0.00
Grenada 2.90 30.29 1.69 17.61 0.34 3.52 0.00 0.03 0.00 0.00 0.00 0.00 0.00 0.00 0.14 1.45 0.15 1.51
Guatemala 11.45 1.29 8.72 0.96 10.26 1.10 26.89 2.82 13.96 1.43 14.11 1.41 20.71 2.02 86.92 8.30 34.25 3.20
Guyana 4.32 5.91 4.17 5.71 4.07 5.57 5.19 7.06 4.65 6.30 4.55 6.16 4.47 6.05 4.58 6.20 3.42 4.64
Haiti 20.22 2.84 27.13 3.74 20.08 2.71 33.66 4.46 34.86 4.53 83.84 10.70 30.21 3.78 29.10 3.58 35.15 4.25
Honduras 23.25 4.75 20.61 4.10 18.37 3.56 31.15 5.87 19.26 3.54 15.08 2.71 27.22 4.78 43.89 7.54 20.21 3.40
Jamaica 20.28 8.56 18.74 7.85 17.10 7.09 14.29 5.87 14.08 5.72 10.89 4.38 13.35 5.33 14.05 5.55 15.06 5.91
Mexico 60.01 0.71 57.66 0.67 10.32 0.12 4.33 0.05 0.86 0.01 0.74 0.01 155.73 1.67 147.75 1.55 148.93 1.54
Montserrat 0.00 0.00 0.00 0.00 1.09 1.57 1.17 0.96 4.13
Netherlands Antilles 0.19 0.99 0.07 0.36 0.04 0.18 0.12 0.63 0.00 0.00 0.00 0.00 0.00 0.00 0.00 0.00 0.00 0.00
Nicaragua 9.62 2.32 19.55 4.61 15.20 3.50 31.22 7.01 29.06 6.37 26.28 5.64 33.78 7.09 37.84 7.79 36.59 7.40
Panama 0.37 0.15 4.43 1.80 0.80 0.32 3.97 1.55 11.26 4.30 10.95 4.10 20.52 7.53 16.52 5.94 13.90 4.90
Paraguay 0.56 0.13 0.28 0.07 0.22 0.05 0.12 0.03 0.08 0.02 0.06 0.01 0.07 0.01 3.44 0.69 22.06 4.30
Peru 15.27 0.70 12.96 0.58 13.66 0.60 51.12 2.22 40.42 1.72 50.51 2.12 61.23 2.53 52.69 2.14 64.33 2.58
St. Helena 0.00 0.00 0.72 0.49 0.57 0.45 0.36 1.62 1.23
St. Kitts and Nevis 0.03 0.02 0.00 0.01 0.01 0.45 0.00 0.11 0.00
St. Lucia 1.00 7.26 0.83 5.94 0.31 2.22 0.16 1.11 0.70 4.85 0.24 1.63 1.01 6.84 0.71 4.77 0.72 4.78
St. Vincent and the Grenadines 0.18 1.67 0.16 1.42 0.17 1.51 0.01 0.10 0.04 0.31 0.18 1.55 0.06 0.49 0.65 5.73 1.20 10.46

STATISTICAL ANNEX 75
1999 2000 2001 2002 2003 2004 2005 2006 2007 2008 2009
DAH per DAH per DAH per DAH per DAH per DAH per DAH per DAH per DAH per DAH per DAH perDAH capita DAH capita DAH capita DAH capita DAH capita DAH capita DAH capita DAH capita DAH capita DAH capita DAH capita
1.92 0.80 1.88 0.79 1.83 0.78 1.81 0.77 1.77 0.76 1.72 0.74 0.00 0.00 0.00 0.00 0.00 0.00 0.00 0.00 0.00 0.00
0.00 0.00 3.30 0.94 3.23 0.93 3.18 0.92 3.11 0.90 3.02 0.88 2.93 0.85 2.83 0.83 0.00 0.00 0.00 0.00 0.00 0.00
24.03 12.00 7.44 3.70 11.06 5.49 3.65 1.81 4.81 2.37 3.61 1.78 13.93 6.85 10.31 5.06 10.31 5.06 13.00 6.37 5.71 2.80
0.00 0.00 0.00 0.00 0.00 0.00 0.00 0.00 0.00 0.00 0.00 0.00 0.00 0.00 0.00 0.00 0.00 0.00 0.00 0.00 0.00 0.00
11.11 2.64 13.77 3.32 9.50 2.32 6.06 1.50 6.52 1.64 9.63 2.45 16.28 4.20 11.72 3.06 16.52 4.35 19.38 5.16 38.55 10.33
0.00 0.00 0.00 0.00 0.00 0.00 0.00 0.00 0.00 0.00 0.00 0.00 3.19 5.25 5.81 9.67 6.13 10.25 4.29 7.18 2.91 4.86
11.23 0.29 11.00 0.29 10.75 0.28 10.58 0.28 0.00 0.00 0.00 0.00 0.00 0.00 0.00 0.00 0.00 0.00 0.00 0.00 0.00 0.00
22.62 1.02 0.00 0.00 11.35 0.52 11.17 0.51 17.56 0.80 28.56 1.31 21.35 0.99 16.74 0.78 20.81 0.97 19.73 0.92 14.88 0.70
71.83 0.49 70.52 0.48 68.75 0.47 14.21 0.10 13.91 0.10 44.59 0.31 56.85 0.39 84.78 0.59 107.27 0.75 99.83 0.70 83.44 0.59
13.49 1.32 11.25 1.11 12.25 1.22 7.54 0.75 34.01 3.42 36.37 3.67 22.50 2.28 20.62 2.09 13.60 1.38 18.48 1.87 26.40 2.67
0.00 0.00 0.00 0.00 0.00 0.00 0.00 0.00 0.00 0.00 16.66 3.09 16.13 2.99 15.62 2.90 0.00 0.00 0.00 0.00 0.00 0.00
4.08 0.67 4.37 0.71 4.03 0.65 6.60 1.05 10.65 1.67 18.23 2.82 16.28 2.49 20.45 3.08 27.64 4.10 37.03 5.41 42.76 6.15
27.48 0.41 18.31 0.27 13.08 0.19 17.73 0.25 17.81 0.25 17.41 0.24 17.82 0.24 53.50 0.72 129.25 1.73 25.82 0.34 57.54 0.75
2.80 0.63 2.18 0.48 1.92 0.42 1.91 0.41 2.18 0.46 1.72 0.36 1.76 0.36 1.70 0.35 1.81 0.37 2.02 0.40 1.77 0.35
0.00 0.00 0.00 0.00 0.00 0.00 2.98 0.06 16.02 0.34 17.97 0.38 42.43 0.90 61.40 1.32 56.21 1.22 69.91 1.52 60.49 1.33
23.04 0.95 13.28 0.54 20.97 0.84 30.78 1.21 25.77 1.00 33.38 1.27 33.26 1.25 30.60 1.13 33.50 1.22 36.70 1.32 36.06 1.28
0.10 0.20 0.12 3.38 0.35 7.65 0.48 2.13 1.43 0.03 0.08
0.21 0.13 0.36 0.19 0.02 0.25 0.72 0.00 0.00 0.00 0.00
0.17 1.28 0.10 0.00 0.02 0.09 0.00 0.00 0.00 0.00 0.02
101.90 2.79 89.95 2.44 70.18 1.88 123.84 3.29 128.90 3.39 315.08 8.21 278.86 7.20 267.29 6.83 264.40 6.69 122.40 3.07 102.10 2.53
0.11 0.38 0.00 0.00 0.10 0.36 0.00 0.00 2.94 10.14 2.88 9.91 3.02 10.34 0.00 0.00 0.00 0.00 0.00 0.00 0.00 0.00
0.68 2.84 1.48 6.03 3.89 15.50 2.76 10.73 2.59 9.85 2.65 9.83 2.60 9.42 0.82 2.90 0.65 2.27 0.45 1.54 2.17 7.25
43.78 5.37 71.99 8.66 59.69 7.03 54.51 6.29 75.98 8.60 81.21 9.01 55.78 6.08 73.16 7.82 62.09 6.52 67.74 6.99 51.25 5.20
133.46 0.78 216.15 1.24 155.32 0.88 154.82 0.86 173.86 0.96 352.56 1.91 123.94 0.66 107.92 0.57 101.16 0.53 55.18 0.28 87.05 0.44
6.28 0.41 2.54 0.17 3.06 0.20 1.15 0.07 7.59 0.48 15.77 0.98 17.01 1.04 7.58 0.46 9.01 0.54 3.32 0.20 1.71 0.10
20.87 0.51 19.34 0.46 23.38 0.55 80.63 1.87 124.63 2.85 303.63 6.85 331.22 7.37 88.68 1.95 107.06 2.32 108.51 2.32 147.87 3.13
17.93 4.67 20.66 5.26 10.45 2.60 9.95 2.43 8.70 2.08 11.31 2.66 5.43 1.25 6.26 1.42 5.72 1.28 7.15 1.58 6.06 1.32
4.81 0.43 3.29 0.30 3.81 0.34 4.42 0.39 12.25 1.09 12.40 1.10 7.67 0.68 8.00 0.71 14.37 1.28 9.52 0.85 17.87 1.59
0.00 0.00 0.00 0.00 0.16 0.10 0.16 0.17 0.11 0.13 0.20
49.00 5.70 31.30 3.58 25.62 2.88 28.06 3.11 38.56 4.20 42.29 4.54 80.44 8.49 38.91 4.05 40.52 4.15 45.66 4.61 39.15 3.90
24.94 2.05 27.31 2.22 25.78 2.07 11.26 0.89 14.40 1.13 33.09 2.56 26.36 2.02 29.48 2.23 74.53 5.59 71.88 5.33 59.84 4.39
24.36 4.00 22.38 3.61 34.39 5.46 50.14 7.84 47.97 7.40 54.53 8.29 57.09 8.56 54.33 8.03 28.81 4.20 27.61 3.97 32.10 4.55
0.00 0.00 0.00 0.00 0.00 0.00 0.00 0.00 0.00 0.00 0.00
0.00 0.00 0.00 0.00 0.00 0.00 0.00 0.00 0.28 2.68 0.39 3.72 0.81 7.73 0.80 7.53 0.70 6.60 0.68 6.47 0.68 6.41
46.47 4.24 33.53 2.99 48.31 4.20 33.35 2.83 46.31 3.83 30.97 2.50 30.72 2.42 35.98 2.76 49.04 3.67 72.64 5.31 59.69 4.26
3.79 5.15 0.76 1.03 1.55 2.10 2.54 3.44 10.83 14.68 24.39 33.01 21.48 29.04 28.74 38.89 26.28 35.62 31.84 43.25 27.93 38.06
47.15 5.60 42.98 5.01 37.56 4.31 27.63 3.12 53.20 5.91 61.03 6.67 67.62 7.27 114.84 12.16 130.57 13.60 145.14 14.88 138.72 14.00
66.97 11.03 66.77 10.78 31.15 4.93 25.83 4.01 41.44 6.30 58.69 8.76 46.75 6.84 47.97 6.88 56.63 7.97 60.83 8.40 52.94 7.17
18.51 7.20 16.54 6.39 14.66 5.62 28.25 10.75 9.83 3.71 11.36 4.26 10.42 3.88 13.01 4.82 12.61 4.65 16.18 5.93 12.02 4.38
259.44 2.64 278.34 2.79 306.04 3.04 329.52 3.24 74.86 0.73 60.83 0.59 57.97 0.56 58.41 0.55 57.71 0.54 52.43 0.49 53.56 0.49
2.05 2.41 2.81 2.21 1.80 0.18 0.38 0.20 0.00 0.31 0.43
0.00 0.00 0.00 0.00 0.00 0.00 0.00 0.00 0.00 0.00 0.00 0.00 0.00 0.00 0.00 0.00 0.00 0.00 0.00 0.00 0.00 0.00
70.39 14.00 56.78 11.12 42.25 8.15 48.52 9.23 58.21 10.93 53.67 9.95 67.05 12.27 70.27 12.70 75.86 13.54 79.32 13.97 81.82 14.22
13.33 4.61 11.19 3.79 9.21 3.07 14.23 4.65 8.69 2.79 8.18 2.57 6.69 2.07 5.86 1.78 5.49 1.64 6.21 1.83 9.20 2.66
30.01 5.73 19.38 3.62 10.73 1.97 6.72 1.21 12.27 2.16 12.73 2.20 9.83 1.66 10.54 1.75 15.95 2.60 20.67 3.31 21.56 3.40
57.49 2.27 80.27 3.13 77.05 2.96 43.23 1.64 98.15 3.68 100.09 3.71 114.15 4.19 65.32 2.37 53.41 1.91 92.34 3.27 133.78 4.69
0.59 1.11 1.05 1.27 2.20 2.06 1.94 2.03 2.87 3.58 1.16
0.09 0.99 3.61 1.41 0.02 0.46 0.44 0.43 0.42 0.41 0.47
0.03 0.18 0.07 0.48 0.15 1.00 0.10 0.63 0.26 1.67 0.22 1.41 0.46 2.82 0.44 2.72 0.44 2.67 0.94 5.65 1.07 6.35
0.71 6.11 0.12 1.00 0.00 0.00 0.00 0.00 0.00 0.00 0.05 0.43 0.24 2.03 0.37 3.11 0.32 2.63 0.32 2.61 0.37 3.02
(continued on next page)

76 INSTITUTE FOR HEALTH METRICS AND EVALUATION
Table 5: DAH by target country, 1990-2009, continued
1990 1991 1992 1993 1994 1995 1996 1997 1998
DAH per DAH per DAH per DAH per DAH per DAH per DAH per DAH per DAH per Region/Country DAH capita DAH capita DAH capita DAH capita DAH capita DAH capita DAH capita DAH capita DAH capita
Suriname 4.65 11.55 9.25 22.83 11.42 28.02 6.30 15.36 5.61 13.60 11.59 27.86 7.43 17.71 5.18 12.24 15.81 36.94
Trinidad and Tobago 0.01 0.01 0.01 0.01 1.01 0.82 1.06 0.85 1.02 0.81 1.01 0.80 0.96 0.75 35.73 27.83 35.36 27.41
Turks and Caicos Islands 0.18 0.27 0.19 0.15 0.14 0.12 0.08 0.01 0.00
Uruguay 0.16 0.05 0.24 0.08 0.34 0.11 15.98 5.04 4.00 1.25 1.12 0.35 4.05 1.25 1.02 0.31 0.98 0.30
Venezuela 0.00 0.00 10.07 0.50 9.84 0.48 21.91 1.04 21.58 1.00 30.20 1.37 36.72 1.63 36.05 1.57 35.66 1.52
Middle East and North Africa
Algeria 0.00 0.00 0.00 0.00 1.67 0.06 1.91 0.07 1.42 0.05 0.88 0.03 0.27 0.01 0.08 0.00 0.57 0.02
Bahrain 0.00 0.00 0.00 0.00 0.00 0.00 0.00 0.00 0.00 0.00 0.00 0.00 0.00 0.00 0.00 0.00 0.02 0.03
Djibouti 1.63 2.91 2.05 3.53 6.40 10.81 1.44 2.39 0.86 1.42 1.58 2.53 1.62 2.53 6.23 9.39 7.80 11.36
Egypt 54.98 1.00 63.33 1.13 58.30 1.02 78.78 1.35 86.45 1.45 84.66 1.40 72.61 1.18 71.75 1.14 61.23 0.95
Iran 0.00 0.00 0.83 0.01 0.66 0.01 0.43 0.01 16.84 0.27 16.45 0.26 15.78 0.25 15.50 0.24 15.48 0.24
Iraq 1.03 0.06 0.00 0.00 0.10 0.01 0.32 0.02 0.67 0.03 2.76 0.13 2.53 0.11 1.04 0.05 0.37 0.02
Jordan 2.53 0.78 5.25 1.52 2.29 0.62 5.21 1.33 18.06 4.38 11.68 2.71 15.61 3.52 12.40 2.73 18.60 4.03
Lebanon 3.06 1.03 4.16 1.36 2.29 0.72 0.58 0.18 0.88 0.26 10.79 3.09 7.42 2.08 7.89 2.17 7.10 1.93
Libya 0.00 0.00 0.00 0.00 0.00 0.00 0.00 0.00 0.00 0.00 0.00 0.00 0.00 0.00 0.00 0.00 0.01 0.00
Morocco 8.33 0.34 26.35 1.04 25.04 0.97 61.68 2.36 30.41 1.15 33.72 1.25 25.66 0.94 36.24 1.31 44.44 1.58
Oman 0.00 0.00 0.00 0.00 0.00 0.00 0.00 0.00 0.00 0.00 0.00 0.00 0.00 0.00 0.00 0.00 0.01 0.00
Palestinian Territory, Occupied 0.08 0.04 0.04 0.02 0.02 0.01 0.05 0.02 8.85 3.51 5.71 2.18 13.47 4.96 35.71 12.66 26.44 9.03
Saudi Arabia 0.00 0.00 0.00 0.00 0.00 0.00 0.00 0.00 0.00 0.00 0.00 0.00 0.00 0.00 0.00 0.00 0.14 0.01
Syria 0.02 0.00 0.14 0.01 0.07 0.01 0.90 0.07 0.20 0.01 0.18 0.01 0.06 0.00 4.53 0.30 2.52 0.16
Tunisia 0.98 0.12 0.41 0.05 11.03 1.29 10.71 1.23 10.76 1.22 10.35 1.15 10.20 1.12 9.80 1.06 10.11 1.08
Yemen 3.18 0.26 12.90 1.00 17.08 1.26 16.53 1.16 13.75 0.92 18.23 1.17 19.54 1.21 26.45 1.59 9.40 0.55
South Asia
Afghanistan 29.87 2.36 24.04 1.78 13.77 0.94 11.15 0.70 5.23 0.30 3.53 0.19 3.99 0.21 4.16 0.21 2.21 0.11
Bangladesh 69.41 0.61 75.83 0.66 174.43 1.47 128.60 1.06 178.18 1.44 115.02 0.91 110.27 0.86 130.56 0.99 134.64 1.00
Bhutan 4.45 8.12 3.63 6.66 2.19 4.09 1.29 2.47 1.01 1.97 0.21 0.42 0.21 0.41 2.04 3.95 5.00 9.45
India 101.46 0.12 130.80 0.15 243.16 0.27 355.80 0.39 408.60 0.44 326.36 0.34 363.44 0.37 299.89 0.30 369.99 0.37
Maldives 0.00 0.00 0.00 0.00 0.26 1.14 9.35 39.70 0.00 0.00 0.00 0.00 0.00 0.00 0.69 2.66 0.00 0.00
Nepal 15.59 0.82 22.10 1.13 20.48 1.02 13.67 0.66 8.23 0.39 14.65 0.68 19.45 0.88 22.74 1.00 31.91 1.37
Pakistan 57.44 0.51 37.57 0.32 36.41 0.31 53.86 0.44 57.41 0.46 104.50 0.82 131.63 1.00 122.04 0.91 74.94 0.54
Sri Lanka 20.97 1.23 23.05 1.33 22.18 1.27 23.38 1.32 13.53 0.76 10.86 0.60 12.57 0.69 23.70 1.29 36.34 1.96
Sub-Saharan Africa
Angola 17.44 1.66 14.94 1.38 21.16 1.89 12.97 1.12 12.26 1.02 20.09 1.63 53.57 4.24 38.06 2.94 14.88 1.12
Benin 8.91 1.72 4.98 0.93 10.41 1.87 8.97 1.55 7.86 1.31 6.41 1.03 13.00 2.03 12.63 1.91 16.28 2.39
Botswana 8.25 6.04 1.96 1.39 2.69 1.86 3.27 2.20 5.23 3.42 8.69 5.55 5.36 3.34 5.93 3.62 1.95 1.16
Burkina Faso 8.78 0.99 8.71 0.95 8.24 0.88 8.92 0.92 12.33 1.24 46.61 4.54 20.19 1.91 21.26 1.96 20.85 1.86
Burundi 1.57 0.28 0.95 0.16 4.52 0.76 14.75 2.44 9.27 1.51 11.05 1.77 9.61 1.52 5.59 0.88 5.46 0.85
Cameroon 10.54 0.86 15.79 1.25 13.48 1.04 12.77 0.96 7.76 0.57 5.30 0.38 10.85 0.75 12.14 0.82 12.93 0.85
Cape Verde 0.29 0.82 0.18 0.50 0.11 0.30 0.42 1.09 0.44 1.14 0.37 0.92 0.59 1.44 1.97 4.69 0.95 2.20
Central African Republic 2.30 0.76 2.11 0.68 3.33 1.05 3.09 0.95 3.11 0.92 4.30 1.25 1.69 0.48 2.75 0.76 3.53 0.95
Chad 14.16 2.32 7.21 1.14 9.61 1.48 9.45 1.41 6.12 0.88 9.50 1.33 16.64 2.25 17.07 2.24 20.02 2.54
Comoros 0.27 0.50 0.16 0.30 0.08 0.15 0.04 0.07 1.50 2.54 2.69 4.43 1.76 2.82 2.84 4.42 5.45 8.24
Congo 7.40 3.06 2.99 1.20 1.16 0.45 1.78 0.68 3.05 1.12 3.34 1.20 4.09 1.42 3.60 1.22 2.63 0.87
Congo, The Democratic Republic of the 16.18 0.43 13.73 0.35 7.61 0.19 4.16 0.10 7.95 0.18 8.22 0.18 16.28 0.35 17.39 0.37 21.86 0.45
Côte d’Ivoire 11.49 0.90 13.69 1.04 51.71 3.78 40.77 2.89 33.13 2.28 37.11 2.48 56.37 3.66 31.61 1.99 24.23 1.49
Equatorial Guinea 0.20 0.58 0.09 0.26 0.13 0.35 0.71 1.96 1.48 3.97 0.89 2.33 1.85 4.73 1.27 3.17 1.12 2.72

STATISTICAL ANNEX 77
1999 2000 2001 2002 2003 2004 2005 2006 2007 2008 2009
DAH per DAH per DAH per DAH per DAH per DAH per DAH per DAH per DAH per DAH per DAH perDAH capita DAH capita DAH capita DAH capita DAH capita DAH capita DAH capita DAH capita DAH capita DAH capita DAH capita
9.84 22.77 4.94 11.31 6.90 15.67 7.92 17.86 9.31 20.84 9.25 20.58 11.02 24.35 4.58 10.06 7.08 15.46 8.10 17.60 17.68 38.18
34.62 26.72 33.40 25.68 32.70 25.05 0.24 0.19 0.32 0.25 3.20 2.42 3.11 2.35 0.00 0.00 0.00 0.00 0.00 0.00 0.00 0.00
0.18 0.17 0.02 0.02 0.00 0.08 0.22 0.00 0.00 0.00 0.00
1.16 0.35 0.88 0.26 1.01 0.30 46.36 13.94 44.29 13.32 8.02 2.41 8.00 2.41 31.95 9.59 7.03 2.10 0.87 0.26 1.08 0.32
35.10 1.47 26.28 1.08 14.85 0.60 15.41 0.61 8.81 0.34 8.27 0.31 9.41 0.35 1.59 0.06 1.63 0.06 1.55 0.05 2.68 0.09
1.49 0.05 0.83 0.03 1.47 0.05 0.78 0.02 0.36 0.01 2.64 0.08 2.62 0.08 3.06 0.09 3.33 0.10 4.69 0.14 1.86 0.05
0.03 0.04 0.02 0.03 0.00 0.00 0.00 0.00 0.00 0.00 0.00 0.00 0.00 0.00 0.00 0.00 0.00 0.00 0.00 0.00 0.00 0.00
8.94 12.60 3.98 5.46 0.76 1.01 1.25 1.63 4.61 5.93 7.61 9.63 15.66 19.47 12.85 15.70 16.88 20.27 12.65 14.92 9.75 11.30
80.21 1.23 88.39 1.33 83.44 1.23 65.34 0.95 54.37 0.77 66.64 0.93 69.86 0.96 105.39 1.42 97.30 1.29 127.90 1.66 61.45 0.79
15.43 0.24 15.11 0.23 27.09 0.41 12.34 0.18 12.16 0.18 11.90 0.17 13.33 0.19 13.24 0.19 13.35 0.19 19.37 0.27 12.16 0.17
1.76 0.07 1.17 0.05 0.39 0.02 0.38 0.01 23.43 0.87 66.95 2.44 431.13 15.40 333.21 11.69 212.94 7.34 75.74 2.57 73.96 2.46
38.74 8.24 34.79 7.25 36.91 7.50 50.87 10.06 41.35 7.94 37.63 7.01 12.79 2.31 14.15 2.47 10.72 1.81 24.79 4.05 30.37 4.82
9.65 2.59 8.31 2.20 7.71 2.02 6.11 1.58 6.84 1.75 3.97 1.00 3.39 0.84 3.76 0.93 7.91 1.93 8.47 2.05 6.50 1.55
0.00 0.00 0.00 0.00 0.00 0.00 0.00 0.00 0.00 0.00 0.00 0.00 0.22 0.04 0.51 0.08 1.61 0.26 31.09 4.95 18.61 2.91
31.78 1.12 33.80 1.17 33.78 1.16 32.29 1.09 47.82 1.60 35.22 1.17 48.09 1.58 66.19 2.15 36.55 1.17 44.19 1.40 71.61 2.24
0.01 0.00 0.01 0.01 0.01 0.00 0.01 0.00 0.05 0.02 0.05 0.02 0.04 0.01 0.00 0.00 0.00 0.00 0.00 0.00 0.00 0.00
23.69 7.80 29.40 9.34 28.12 8.61 24.67 7.28 41.60 11.85 62.93 17.31 56.15 14.93 50.74 13.05 66.44 16.54 63.20 15.24 43.92 10.27
0.24 0.01 0.04 0.00 0.07 0.00 0.13 0.01 0.26 0.01 0.00 0.00 0.00 0.00 0.00 0.00 0.00 0.00 0.00 0.00 0.00 0.00
0.11 0.01 0.13 0.01 0.06 0.00 3.17 0.18 2.35 0.13 5.44 0.30 14.52 0.77 3.97 0.20 7.25 0.36 14.79 0.72 27.05 1.29
17.35 1.83 12.24 1.28 15.61 1.61 13.29 1.36 14.61 1.48 4.69 0.47 4.07 0.40 28.82 2.82 7.55 0.73 33.12 3.17 4.76 0.45
14.12 0.80 13.68 0.75 18.49 0.99 19.19 0.99 29.56 1.49 22.57 1.10 47.83 2.27 34.27 1.58 46.92 2.10 50.38 2.18 44.02 1.85
4.00 0.20 3.92 0.19 4.16 0.19 19.08 0.86 27.47 1.19 105.75 4.39 148.81 5.94 147.00 5.63 176.56 6.50 196.38 6.96 462.42 15.78
149.30 1.09 150.90 1.08 183.15 1.29 149.56 1.03 159.79 1.08 164.94 1.10 167.55 1.09 227.98 1.46 193.34 1.22 276.40 1.71 222.91 1.36
2.93 5.39 5.03 9.01 4.42 7.70 2.93 4.96 7.20 11.85 5.74 9.22 9.38 14.72 4.75 7.32 6.00 9.11 5.89 8.83 2.99 4.43
406.86 0.40 445.16 0.43 457.17 0.43 513.66 0.47 503.44 0.46 473.64 0.42 629.78 0.56 508.26 0.44 668.31 0.57 771.74 0.65 700.61 0.58
0.10 0.38 0.39 1.44 0.20 0.73 0.11 0.38 0.09 0.33 0.02 0.08 0.33 1.13 0.39 1.29 1.80 5.90 0.64 2.07 1.57 4.96
32.93 1.38 30.65 1.26 43.83 1.76 42.99 1.69 48.96 1.88 66.00 2.49 72.39 2.67 77.90 2.82 71.15 2.52 111.35 3.87 89.71 3.06
61.61 0.44 55.21 0.38 56.25 0.38 125.13 0.83 196.35 1.29 128.37 0.83 170.51 1.08 220.18 1.37 261.82 1.60 388.58 2.33 300.10 1.76
14.10 0.76 7.08 0.38 10.95 0.58 16.59 0.88 11.21 0.59 11.61 0.61 20.20 1.06 19.23 1.00 23.86 1.24 32.29 1.66 31.21 1.60
24.21 1.78 19.33 1.39 27.55 1.92 28.74 1.95 38.27 2.52 51.11 3.27 103.28 6.42 51.59 3.12 60.79 3.57 87.29 4.99 75.07 4.17
19.00 2.71 16.28 2.25 18.83 2.52 20.82 2.70 33.06 4.15 42.04 5.11 56.84 6.69 61.87 7.06 49.29 5.46 67.57 7.26 74.86 7.81
0.43 0.25 0.36 0.21 2.14 1.22 10.23 5.76 13.92 7.76 34.57 19.04 20.58 11.21 30.69 16.52 47.14 25.06 238.42 125.12 223.45 115.81
18.54 1.61 22.49 1.89 28.53 2.33 32.42 2.56 39.25 3.00 63.67 4.71 68.94 4.95 69.69 4.85 89.10 6.03 97.18 6.39 99.28 6.34
3.46 0.53 4.19 0.63 8.16 1.19 15.10 2.14 21.33 2.92 25.13 3.32 28.89 3.68 40.19 4.92 35.67 4.19 56.90 6.42 69.45 7.54
15.64 1.01 9.32 0.59 12.24 0.75 15.12 0.91 25.83 1.52 43.92 2.52 44.96 2.53 54.06 2.97 68.89 3.71 54.79 2.90 66.71 3.46
1.54 3.50 1.09 2.42 7.04 15.26 1.73 3.66 7.71 15.95 6.80 13.73 9.17 18.09 13.48 26.00 11.32 21.34 11.19 20.62 7.21 13.01
11.44 3.02 4.04 1.04 5.82 1.48 11.32 2.83 7.41 1.82 18.90 4.58 16.70 3.98 18.30 4.29 6.20 1.43 28.46 6.43 8.65 1.92
19.40 2.37 16.58 1.96 23.25 2.65 27.10 2.97 21.63 2.29 42.49 4.33 36.08 3.56 30.77 2.94 17.35 1.61 26.16 2.36 23.47 2.06
4.07 5.98 3.56 5.09 2.27 3.16 2.89 3.91 2.27 2.99 3.66 4.70 3.47 4.35 1.53 1.87 1.51 1.80 1.44 1.67 3.56 4.04
0.43 0.14 0.55 0.17 0.69 0.21 2.27 0.68 3.66 1.06 9.40 2.66 8.67 2.40 9.51 2.58 9.25 2.46 15.75 4.09 12.32 3.14
20.81 0.42 26.15 0.52 34.22 0.66 43.08 0.80 78.80 1.43 95.35 1.68 140.41 2.39 184.20 3.04 160.82 2.57 283.77 4.39 353.75 5.29
20.60 1.23 15.26 0.89 18.39 1.06 28.97 1.64 44.75 2.49 43.91 2.40 46.32 2.49 65.44 3.46 64.85 3.37 122.23 6.23 95.36 4.77
2.52 5.99 4.21 9.77 3.77 8.56 2.17 4.81 3.05 6.61 3.97 8.39 7.91 16.34 10.68 21.56 0.00 0.00 0.00 0.00 0.00 0.00
(continued on next page)

78 INSTITUTE FOR HEALTH METRICS AND EVALUATION
Table 5: DAH by target country, 1990-2009, continued
1990 1991 1992 1993 1994 1995 1996 1997 1998
DAH per DAH per DAH per DAH per DAH per DAH per DAH per DAH per DAH per Region/Country DAH capita DAH capita DAH capita DAH capita DAH capita DAH capita DAH capita DAH capita DAH capita
Eritrea 0.00 0.00 0.00 0.00 0.00 0.00 0.00 0.00 5.25 1.65 4.63 1.44 7.43 2.28 5.41 1.62 11.92 3.47
Ethiopia 33.08 0.65 20.19 0.38 26.66 0.49 13.76 0.24 24.89 0.43 36.83 0.61 38.60 0.62 39.70 0.62 31.87 0.48
Gabon 1.56 1.70 0.59 0.62 0.95 0.97 4.85 4.85 2.53 2.46 1.48 1.40 2.28 2.11 3.55 3.20 4.81 4.24
Gambia 3.94 4.09 3.00 3.00 4.91 4.73 6.38 5.92 2.93 2.62 3.11 2.69 2.47 2.06 2.03 1.63 1.56 1.20
Ghana 4.73 0.30 22.62 1.41 15.90 0.96 31.66 1.87 27.16 1.56 24.14 1.35 22.50 1.23 38.78 2.06 25.10 1.30
Guinea 1.57 0.26 7.83 1.25 6.85 1.05 7.72 1.13 7.82 1.10 8.92 1.22 12.87 1.71 17.44 2.26 15.54 1.97
Guinea-Bissau 5.00 4.92 5.12 4.89 4.48 4.14 2.80 2.51 4.82 4.17 9.23 7.75 5.10 4.16 3.82 3.03 4.92 3.80
Kenya 51.72 2.21 46.45 1.92 53.54 2.14 46.85 1.82 41.26 1.55 51.16 1.87 80.12 2.85 73.39 2.54 76.38 2.57
Lesotho 6.88 4.29 5.61 3.45 4.77 2.90 3.34 2.00 2.64 1.56 9.45 5.49 8.76 4.99 8.58 4.80 2.03 1.11
Liberia 2.42 1.13 1.15 0.55 1.07 0.51 0.71 0.34 0.58 0.28 0.29 0.13 0.18 0.08 1.60 0.65 1.67 0.62
Madagascar 4.58 0.38 8.64 0.70 18.09 1.42 15.84 1.21 17.53 1.29 19.12 1.37 22.48 1.56 21.97 1.48 24.96 1.64
Malawi 28.04 2.97 13.25 1.37 28.96 2.96 35.00 3.55 26.26 2.64 33.38 3.31 44.01 4.27 47.25 4.45 34.70 3.17
Mali 14.49 1.89 19.60 2.49 15.23 1.89 18.42 2.22 26.09 3.07 29.93 3.43 19.30 2.15 25.03 2.72 19.19 2.03
Mauritania 14.65 7.53 4.87 2.44 7.09 3.46 9.27 4.40 3.97 1.83 3.49 1.57 8.41 3.68 6.66 2.83 6.21 2.56
Mauritius 0.06 0.06 0.04 0.03 0.02 0.02 0.02 0.02 0.48 0.43 0.20 0.18 0.61 0.54 0.45 0.39 0.31 0.27
Mayotte 0.00 0.00 0.00 0.00 0.00 0.00 0.00 0.00 0.00
Mozambique 45.63 3.37 67.66 4.88 59.84 4.18 42.86 2.88 65.57 4.25 49.75 3.12 88.70 5.40 72.62 4.30 63.78 3.68
Namibia 1.75 1.23 4.14 2.82 5.95 3.92 13.20 8.43 13.64 8.47 9.83 5.94 14.36 8.43 9.57 5.47 6.44 3.58
Niger 7.46 0.95 11.85 1.47 18.42 2.20 12.80 1.48 12.49 1.39 13.08 1.41 13.01 1.35 19.52 1.96 22.52 2.18
Nigeria 27.80 0.29 25.04 0.26 20.30 0.20 34.34 0.33 21.86 0.21 19.85 0.18 17.94 0.16 16.58 0.14 13.90 0.12
Rwanda 8.20 1.12 8.14 1.16 11.25 1.70 7.36 1.20 7.77 1.35 11.17 1.98 11.76 2.00 17.17 2.70 19.99 2.85
Sao Tome and Principe 1.25 10.74 0.42 3.51 0.20 1.63 1.87 15.21 2.33 18.58 1.82 14.26 1.57 12.06 1.58 11.87 1.50 11.10
Senegal 12.23 1.55 12.29 1.51 14.15 1.69 15.79 1.84 14.39 1.63 13.88 1.53 10.64 1.14 19.76 2.07 31.09 3.17
Seychelles 0.08 0.05 0.52 0.35 0.37 0.73 0.39 0.74 0.65
Sierra Leone 0.42 0.10 0.11 0.03 0.69 0.17 4.67 1.13 1.24 0.30 1.09 0.26 1.87 0.45 4.23 1.00 3.59 0.84
Somalia 15.54 2.31 4.43 0.67 2.26 0.35 3.57 0.56 4.17 0.66 3.00 0.48 2.60 0.41 2.22 0.34 3.39 0.51
South Africa 1.41 0.04 0.00 0.00 2.86 0.07 3.83 0.10 12.14 0.30 10.18 0.25 19.21 0.45 24.29 0.56 38.43 0.87
Sudan 8.25 0.32 3.80 0.14 5.35 0.20 15.99 0.57 1.83 0.06 3.75 0.13 7.19 0.24 5.07 0.16 7.08 0.22
Swaziland 3.32 3.83 3.59 4.04 2.02 2.23 1.19 1.29 7.36 7.82 3.07 3.21 1.05 1.07 1.21 1.21 5.06 4.96
Tanzania 41.50 1.63 48.48 1.84 55.18 2.03 57.68 2.05 41.14 1.42 39.65 1.33 61.82 2.01 66.50 2.11 93.95 2.91
Togo 1.46 0.37 5.33 1.31 7.79 1.87 1.88 0.44 3.38 0.77 3.23 0.72 3.25 0.70 7.10 1.47 8.37 1.66
Uganda 19.63 1.10 44.25 2.39 44.16 2.30 45.12 2.27 45.93 2.23 52.21 2.46 81.89 3.74 71.04 3.15 82.61 3.55
Zambia 7.74 0.95 4.73 0.57 19.16 2.23 30.43 3.46 35.69 3.95 49.41 5.34 58.67 6.18 48.61 4.99 30.09 3.01
Zimbabwe 11.69 1.11 14.33 1.33 41.34 3.74 44.62 3.94 54.11 4.68 48.97 4.15 49.12 4.09 52.41 4.30 58.95 4.77
Source: IHME DAH Database (Country and Regional Recipient Level) 2011
Notes: Development assistance for health (DAH) is in millions of US$, 2009, and DAH per capita is in US$, 2009. DAH includes both financial and in-kind contribu-tions for activities aimed at improving health in low- and middle-income countries. This table disaggregates financial DAH transfers by the country receiving funds or intended to benefit from research or technical assistance activities. Population data were obtained from the United Nations Population Division. DAH per capita values are missing where population data were not available for the country. This table only reflects financial DAH from channels of assistance providing project-level detail, specifically: bilateral development agencies, World Bank (IDA and IBRD), ADB, AfDB, IDB, GFATM, GAVI, and BMGF.

STATISTICAL ANNEX 79
1999 2000 2001 2002 2003 2004 2005 2006 2007 2008 2009
DAH per DAH per DAH per DAH per DAH per DAH per DAH per DAH per DAH per DAH per DAH perDAH capita DAH capita DAH capita DAH capita DAH capita DAH capita DAH capita DAH capita DAH capita DAH capita DAH capita
15.87 4.47 18.65 5.06 24.97 6.51 24.76 6.19 29.86 7.15 28.69 6.59 21.95 4.85 22.06 4.70 20.55 4.24 22.59 4.51 18.92 3.67
54.38 0.81 56.21 0.81 85.47 1.20 81.36 1.11 178.45 2.38 136.03 1.77 247.98 3.14 349.97 4.32 541.27 6.51 496.14 5.82 516.35 5.91
2.32 2.00 4.29 3.63 4.87 4.04 2.74 2.23 3.27 2.62 6.91 5.44 7.55 5.85 10.51 8.02 7.55 5.68 5.96 4.41 10.40 7.59
5.55 4.15 7.45 5.38 7.76 5.43 10.40 7.04 9.23 6.06 12.23 7.79 17.96 11.10 11.61 6.98 13.63 7.98 13.48 7.68 15.77 8.76
49.22 2.50 36.11 1.79 78.50 3.81 81.70 3.87 79.14 3.67 164.35 7.45 171.90 7.63 189.02 8.22 201.63 8.59 202.85 8.47 237.73 9.74
20.48 2.55 19.89 2.43 22.74 2.72 28.21 3.31 24.44 2.82 26.36 2.98 25.62 2.85 26.33 2.87 19.59 2.09 24.13 2.52 24.16 2.47
4.14 3.11 4.96 3.62 7.59 5.37 8.31 5.71 7.95 5.29 10.14 6.55 11.58 7.25 11.50 6.99 14.61 8.62 12.04 6.90 15.10 8.40
74.34 2.44 51.15 1.64 111.00 3.46 106.64 3.24 150.42 4.45 201.90 5.82 214.08 6.01 327.38 8.96 330.41 8.80 437.46 11.35 548.99 13.87
0.31 0.17 2.07 1.10 4.13 2.16 4.58 2.37 8.90 4.56 12.52 6.37 13.37 6.75 14.14 7.09 20.90 10.41 38.74 19.18 38.37 18.88
3.37 1.16 7.09 2.31 4.77 1.50 3.46 1.07 5.96 1.81 12.68 3.79 14.97 4.35 16.74 4.68 18.50 4.93 50.54 12.82 70.12 16.96
29.52 1.88 35.30 2.18 37.69 2.26 33.63 1.96 53.81 3.05 52.03 2.87 75.36 4.04 75.72 3.95 70.09 3.56 70.17 3.47 73.33 3.53
46.20 4.09 56.87 4.89 64.80 5.43 72.76 5.93 91.18 7.25 120.38 9.34 112.17 8.48 158.11 11.65 225.37 16.18 268.61 18.80 247.42 16.88
32.15 3.31 28.04 2.80 45.53 4.42 18.56 1.75 47.96 4.39 46.20 4.10 74.32 6.40 76.14 6.36 83.68 6.78 107.41 8.45 123.30 9.41
10.91 4.38 10.37 4.04 11.81 4.47 7.61 2.80 8.84 3.16 10.90 3.78 6.09 2.05 6.71 2.20 10.41 3.33 16.88 5.27 10.01 3.05
0.54 0.46 0.91 0.77 0.25 0.21 0.00 0.00 0.16 0.13 0.19 0.15 0.33 0.27 0.56 0.45 0.83 0.66 0.00 0.00 0.86 0.67
0.00 0.00 20.46 18.41 13.22 21.83 0.57 0.40 6.52 14.03 8.62
68.43 3.86 74.36 4.09 100.02 5.36 116.41 6.08 135.46 6.91 208.28 10.37 193.49 9.42 223.79 10.67 310.51 14.51 393.86 18.06 374.22 16.84
11.27 6.12 13.41 7.13 10.20 5.33 10.11 5.21 18.52 9.41 29.87 14.98 34.33 17.00 76.75 37.50 93.66 45.16 83.73 39.83 131.87 61.91
14.81 1.38 15.10 1.36 16.67 1.45 20.28 1.70 31.03 2.51 48.34 3.77 33.13 2.50 56.48 4.11 55.32 3.89 85.68 5.82 64.95 4.26
22.95 0.19 45.09 0.36 72.97 0.57 84.95 0.65 154.74 1.15 291.19 2.11 304.72 2.16 370.26 2.56 430.62 2.91 640.96 4.23 839.19 5.42
21.57 2.82 22.07 2.70 30.59 3.59 37.69 4.30 42.29 4.74 75.10 8.30 107.92 11.69 147.18 15.55 159.31 16.38 233.79 23.36 251.84 24.44
4.98 36.15 5.26 37.51 4.85 34.01 4.21 29.03 3.66 24.82 4.33 28.87 4.37 28.66 4.13 26.60 3.10 19.64 5.39 33.67 4.01 24.66
41.54 4.13 37.03 3.58 61.98 5.84 46.60 4.28 95.72 8.56 90.76 7.91 107.18 9.11 121.94 10.10 71.91 5.81 102.37 8.07 106.67 8.21
0.52 0.09 0.22 0.35 1.16 1.16 1.25 0.16 0.08 0.06 0.15
6.39 1.46 5.39 1.19 9.75 2.07 8.77 1.78 19.53 3.78 24.66 4.57 27.91 5.00 26.72 4.65 32.56 5.55 43.99 7.37 37.49 6.18
3.13 0.46 2.91 0.41 3.14 0.43 4.35 0.58 4.10 0.53 13.87 1.74 15.93 1.94 20.31 2.40 22.74 2.61 23.16 2.59 20.30 2.20
23.08 0.52 27.08 0.60 51.17 1.11 48.27 1.04 110.21 2.34 123.20 2.59 178.20 3.72 202.17 4.19 331.02 6.81 490.84 10.05 615.70 12.55
7.25 0.22 8.05 0.24 6.53 0.19 16.44 0.47 14.94 0.42 33.15 0.92 61.30 1.66 71.79 1.90 67.23 1.74 112.93 2.86 149.99 3.72
1.18 1.14 2.24 2.12 1.03 0.96 0.87 0.80 9.49 8.61 5.31 4.77 24.72 21.98 14.09 12.43 20.89 18.30 28.94 25.21 33.88 29.35
95.86 2.90 66.90 1.98 100.77 2.90 122.56 3.44 124.54 3.41 225.55 6.01 294.19 7.65 320.49 8.12 432.83 10.70 621.68 14.99 537.40 12.65
3.82 0.73 2.06 0.38 2.98 0.53 2.00 0.35 9.01 1.53 14.51 2.39 17.13 2.75 13.75 2.15 23.98 3.64 28.05 4.15 32.39 4.67
80.32 3.35 80.99 3.28 98.93 3.88 123.98 4.72 188.33 6.94 264.07 9.42 289.82 10.01 273.95 9.16 356.25 11.54 371.41 11.64 416.63 12.64
34.39 3.36 48.74 4.66 72.09 6.76 87.11 8.01 160.12 14.47 200.87 17.82 247.08 21.53 215.95 18.46 266.34 22.34 390.02 32.09 327.92 26.47
46.02 3.67 30.87 2.44 28.81 2.26 33.56 2.61 47.56 3.68 61.29 4.71 104.22 7.94 101.48 7.67 150.45 11.27 97.78 7.25 198.32 14.56

80 INSTITUTE FOR HEALTH METRICS AND EVALUATION
TABLE 6:DAH by health focus area, 1990-2009
Maternal, newborn, and Health Noncommunicable Year HIV/AIDS child health Malaria sector support Tuberculosis diseases Unallocable Other Total
1990 0.20 1.00 0.04 0.01 0.05 0.03 2.31 2.19 5.82
1991 0.21 1.04 0.04 0.00 0.06 0.03 2.08 2.20 5.67
1992 0.23 1.28 0.03 0.03 0.06 0.04 2.35 2.27 6.29
1993 0.24 1.39 0.03 0.02 0.08 0.10 2.26 2.65 6.76
1994 0.36 1.99 0.05 0.01 0.07 0.11 2.59 2.64 7.82
1995 0.37 2.02 0.05 0.03 0.07 0.07 2.79 2.65 8.06
1996 0.43 1.76 0.05 0.08 0.10 0.06 2.72 2.94 8.15
1997 0.46 1.84 0.11 0.10 0.09 0.06 2.54 3.44 8.63
1998 0.45 1.84 0.13 0.07 0.09 0.08 2.76 3.53 8.94
1999 0.56 2.21 0.16 0.18 0.11 0.09 3.01 3.56 9.87
2000 0.74 2.52 0.24 0.14 0.16 0.14 3.10 3.82 10.86
2001 0.90 2.84 0.23 0.04 0.19 0.12 2.66 3.85 10.82
2002 1.40 2.16 0.22 0.12 0.22 0.14 3.38 4.67 12.32
2003 1.82 2.36 0.27 0.16 0.29 0.13 2.77 5.43 13.23
2004 2.47 2.84 0.50 0.27 0.47 0.11 2.67 5.68 15.00
2005 3.16 3.20 0.84 0.54 0.51 0.14 2.49 5.99 16.86
2006 4.08 2.70 0.79 0.91 0.63 0.16 3.10 6.05 18.41
2007 5.15 3.64 0.89 1.02 0.78 0.23 3.62 5.87 21.20
2008 6.23 3.65 1.34 1.17 0.94 0.23 4.69 6.65 24.88
2009 6.54 3.99 2.00 1.23 1.02 0.27 4.40 6.24 25.69
Sources: IHME DAH Database 2011 and DAH Database (Country and Regional Recipient Level) 2011
Notes: In billions US$, 2009. Development assistance for health (DAH) includes both financial and in-kind contributions for activities aimed at improving health in low- and middle-income countries. This table dissagregates financial DAH earmarked for HIV/AIDS; maternal, newborn, and child health; malaria; health sector support; tuberculosis; and noncommunicable diseases. We were able to allocate flow from the following channels of assistance by their health focus areas: bilateral development agencies, World Bank (IDA and IBRD), regional development banks, GFATM, GAVI, WHO, UNICEF, UNAIDS, UNFPA, and BMGF. Contributions from remaining channels are shown as unallocable by disease.
For preliminary estimates of DAH for 2010 and 2011, refer to Table 1 of the Statistical Annex.

TABLE 7:DAH by type of transfer, 1990-2009
In-kind: services, management, Year Financial: grants and loans research, and technical assistance In-kind: drugs and commodities
1990 2,999.92 2,776.11 43.51
1991 2,965.51 2,656.54 46.74
1992 3,489.25 2,739.26 63.05
1993 3,939.93 2,746.49 77.63
1994 4,555.06 3,165.20 94.86
1995 4,870.66 3,104.18 87.35
1996 5,138.31 2,907.02 101.25
1997 5,599.04 2,917.66 109.87
1998 5,640.31 3,183.92 119.71
1999 6,398.01 3,340.63 131.70
2000 6,921.15 3,814.41 123.50
2001 6,614.85 3,892.29 315.95
2002 7,832.21 4,172.00 313.19
2003 8,456.14 4,341.13 429.77
2004 9,421.80 5,087.74 491.44
2005 10,740.16 5,491.35 629.18
2006 11,960.93 5,873.82 574.62
2007 14,129.23 6,218.43 854.45
2008 16,580.90 7,219.70 1,075.60
2009 16,867.00 8,016.52 807.06
Source: IHME DAH Database 2011
Notes: In millions US$, 2009. Development assistance for health (DAH) includes both financial and in-kind contributions for activites aimed at improving health in low- and middle-income countries. This table disaggregates DAH by type of transfer. Financial DAH transfers include grants and loans from channels of assistance. In-kind contributions in the form of health services delivered, management, research, and technical assistance include all United Nations health-related expenditures and the management and administrative component involved in grant- and loan-making activities. In-kind contributions in the form of drugs and commodities represent donations by corporations through US NGOs as well as vaccine procurement through GAVI’s new and under-used vaccine and injection safety support programs.
For preliminary estimates of DAH for 2010 and 2011, refer to Table 1 of the Statistical Annex.
STATISTICAL ANNEX 81

TABLE 8:Bilateral commitments and disbursements, 1990-2009
82 INSTITUTE FOR HEALTH METRICS AND EVALUATION
Observed/
1990 1991 1992 1993 1994 1995 1996 1997 1998
Donor Estimated1 Comm2 Disb3 Comm2 Disb3 Comm2 Disb3 Comm2 Disb3 Comm2 Disb3 Comm2 Disb3 Comm2 Disb3 Comm2 Disb3 Comm2 Disb3
Australia Observed 13.40 0.00 17.72 0.00 28.25 0.00 61.70 0.00 74.74 0.00 25.10 0.00 166.04 0.00 70.01 0.00 69.64 29.45 Australia Estimated 13.40 9.11 17.72 11.75 68.93 36.94 63.23 43.83 91.60 63.74 94.57 74.40 166.04 114.87 73.73 89.98 69.94 85.82
Austria Observed 17.38 1.29 2.96 0.18 0.00 0.00 0.00 0.64 0.00 12.36 0.00 1.13 8.25 5.78 4.83 5.23 8.61 5.04 Austria Estimated 40.79 27.53 4.67 8.80 0.00 3.31 0.00 2.69 0.00 2.10 0.00 0.21 11.18 7.54 64.75 45.27 14.39 19.64
Belgium Observed 3.82 0.00 2.41 2.41 0.00 0.00 0.00 0.00 57.89 0.00 64.07 0.00 75.82 0.00 67.01 0.00 72.33 0.00 Belgium Estimated 99.67 54.74 91.27 77.70 97.13 88.43 93.01 92.94 72.55 80.75 64.07 70.33 75.82 72.23 74.56 72.87 75.83 74.08
Canada Observed 50.08 0.00 54.41 0.00 27.40 28.92 20.29 26.78 69.81 27.83 116.79 37.88 61.52 51.66 37.14 29.05 42.11 31.69 Canada Estimated 54.68 51.50 54.41 51.83 34.47 41.43 36.58 40.03 70.51 55.06 118.52 79.94 61.52 61.40 37.14 49.79 46.24 52.44
Denmark Observed 49.05 0.00 109.43 0.00 142.56 0.00 126.66 0.00 45.93 0.00 111.82 0.00 300.77 0.00 37.91 92.42 7.81 69.37 Denmark Estimated 49.05 34.03 114.92 47.92 171.74 70.82 126.66 78.89 57.74 64.16 111.82 66.12 306.76 111.34 40.78 85.33 8.19 54.31
European Commission Observed 16.34 0.00 44.04 0.00 227.31 0.00 227.88 0.00 67.64 0.00 273.84 0.00 348.04 77.23 241.75 60.52 393.36 80.65
European Commission Estimated 16.34 47.96 44.04 36.44 227.31 26.19 227.88 93.19 67.64 160.73 273.84 166.08 348.04 182.76 241.75 223.32 393.36 279.45
Finland Observed 56.04 40.37 52.69 41.87 34.04 30.13 6.61 20.87 21.18 21.46 28.02 0.00 15.18 17.51 9.17 13.88 26.95 10.83 Finland Estimated 56.86 42.47 52.69 44.35 34.04 41.26 6.90 31.19 21.25 23.91 28.02 19.83 15.18 15.74 9.28 12.08 33.74 15.54
France Observed 145.81 41.88 76.68 26.11 94.23 29.67 75.67 60.57 85.47 30.46 104.80 35.27 102.79 20.33 142.73 23.81 145.67 38.71 France Estimated 761.88 519.44 283.46 353.26 242.50 293.38 201.95 230.31 298.38 272.59 372.03 330.90 293.90 304.84 226.49 254.97 270.61 264.61
Germany Observed 52.12 6.88 30.01 7.07 82.64 54.22 82.59 13.23 212.67 118.03 183.83 84.08 91.05 82.92 314.94 80.35 226.49 113.60 Germany Estimated 118.97 84.25 126.26 99.39 173.85 136.78 198.62 165.64 324.37 252.86 420.19 330.07 275.84 276.44 314.94 311.09 226.49 262.89
Greece Observed 0.00 0.00 0.00 0.00 0.00 0.00 0.00 0.00 0.00 0.00 0.00 0.00 0.00 0.00 0.00 0.00 0.00 0.00 Greece Estimated 0.00 0.00 0.00 0.00 0.00 0.00 0.00 0.00 0.00 0.00 6.46 6.46 6.34 6.34 8.50 8.50 9.60 9.60
Ireland Observed 0.00 0.00 0.00 0.00 0.00 0.00 0.00 0.00 0.00 0.00 0.00 0.00 0.00 0.00 0.00 0.00 0.00 0.00 Ireland Estimated 2.54 2.54 2.70 2.70 3.54 3.54 0.00 0.00 7.05 7.05 22.25 22.25 21.84 21.84 0.00 0.00 20.91 20.91
Italy Observed 149.21 4.96 163.31 1.18 100.65 5.41 71.75 11.44 9.44 3.95 39.54 0.87 55.02 0.27 28.13 0.44 17.25 0.00 Italy Estimated 162.19 211.57 189.58 190.71 135.01 157.31 100.25 133.46 45.75 90.85 48.63 68.41 74.04 64.20 28.13 45.68 17.25 35.90
Japan Observed 152.61 0.00 127.35 0.00 191.06 130.02 374.44 310.79 228.12 93.81 216.32 22.40 387.81 208.52 277.90 249.50 281.80 269.75 Japan Estimated 325.45 244.12 311.69 273.71 308.98 290.78 562.85 392.24 429.45 420.64 476.24 427.89 598.37 489.23 473.79 497.72 469.53 472.27
Luxembourg Observed 0.00 0.00 0.00 0.00 0.00 0.00 0.00 0.00 0.00 0.00 0.00 0.00 0.00 0.00 0.00 0.00 0.00 0.00 Luxembourg Estimated 0.00 0.00 0.00 0.00 6.28 6.28 6.30 6.30 0.00 0.00 12.43 12.43 12.19 12.19 21.46 21.46 24.63 24.63
Netherlands Observed 62.95 2.00 68.82 0.00 133.44 0.00 111.66 0.00 117.44 0.00 168.39 0.00 232.53 0.00 140.19 0.00 166.40 59.74 Netherlands Estimated 133.38 69.09 68.82 52.28 231.46 120.71 111.66 89.75 117.44 86.76 173.68 110.23 232.53 137.05 140.19 110.11 166.40 117.40
New Zealand Observed 0.00 0.00 0.00 0.00 0.00 0.00 0.00 0.00 0.00 0.00 2.44 0.00 0.00 0.00 0.00 0.00 0.00 0.00 New Zealand Estimated 0.00 0.00 3.55 0.86 2.62 1.21 2.02 1.70 2.84 2.78 2.79 2.46 0.00 1.76 0.00 1.57 5.93 2.37
Norway Observed 28.42 0.00 24.41 0.00 88.11 0.00 9.49 0.00 40.78 0.00 75.69 0.00 39.79 0.00 38.83 0.00 46.50 0.00 Norway Estimated 28.43 30.96 24.41 26.49 88.11 45.01 9.49 37.09 40.78 44.84 75.69 44.18 39.79 46.99 38.83 50.13 46.50 43.60
Portugal Observed 0.00 0.00 0.00 0.00 0.00 0.00 0.00 0.00 0.03 0.00 0.27 0.03 0.99 0.40 0.15 0.63 0.64 0.57 Portugal Estimated 0.00 0.00 0.00 0.00 2.84 1.49 0.00 0.84 6.03 3.65 9.15 6.60 11.27 9.64 13.72 12.08 9.14 10.79
South Korea Observed 0.00 0.00 0.00 0.00 0.00 0.00 0.00 0.00 0.00 0.00 0.00 0.00 0.00 0.00 0.00 0.00 0.00 0.00 South Korea Estimated 0.00 0.00 1.79 1.32 3.38 2.95 4.80 4.41 0.00 1.24 6.66 4.91 0.00 1.72 46.44 34.20 31.12 35.02
Spain Observed 6.98 0.00 18.89 0.00 86.32 0.00 63.61 21.63 24.24 12.46 155.40 47.27 180.85 0.00 146.96 103.28 127.90 90.52 Spain Estimated 6.98 4.81 28.13 20.17 120.12 85.26 94.44 92.16 49.85 62.97 155.40 123.51 235.37 197.46 146.96 163.22 128.77 139.46
Sweden Observed 248.91 129.52 74.47 125.22 272.77 150.45 55.70 104.57 100.87 91.45 184.28 119.09 80.84 109.35 62.74 90.54 108.78 57.46 Sweden Estimated 248.91 215.30 141.19 188.44 272.77 214.30 168.88 198.61 134.72 165.22 184.28 165.41 167.45 158.12 107.20 138.89 108.78 121.51
Switzerland Observed 65.41 0.00 43.47 0.00 26.83 0.00 19.86 0.00 40.03 0.00 18.70 0.00 27.22 0.00 55.72 0.00 31.45 0.00 Switzerland Estimated 65.42 44.83 43.48 39.01 26.83 29.33 20.70 20.44 40.03 25.89 18.70 19.57 27.22 21.29 55.72 33.45 31.45 29.66
United Kingdom Observed 100.23 0.00 64.73 0.00 446.64 0.00 129.41 0.00 151.52 0.00 150.52 0.00 278.40 0.00 263.43 0.00 451.30 206.41
United Kingdom Estimated 139.36 47.65 93.66 57.77 446.64 159.57 140.17 150.16 151.52 155.89 171.46 163.98 278.40 192.38 263.43 204.91 451.30 252.17
United States Observed 504.38 11.90 634.77 9.43 541.21 10.37 697.37 1.75 1,273.01 0.00 1,262.59 0.00 655.12 0.00 1,164.80 0.00 1,028.15 0.00 United States Estimated 1,069.23 884.44 1,048.59 923.54 966.29 907.69 891.55 878.16 1,331.65 1,179.22 1,449.96 1,310.51 1,093.44 1,114.79 1,164.80 1,153.95 1,114.00 1,126.22
Source: IHME DAH Database 2011
Notes: In millions US$, 2009. This table presents commitments from bilateral development agencies net of identifiable contributions through multilateral channels of assistance (GFATM, GAVI, United Nations agencies, etc.).
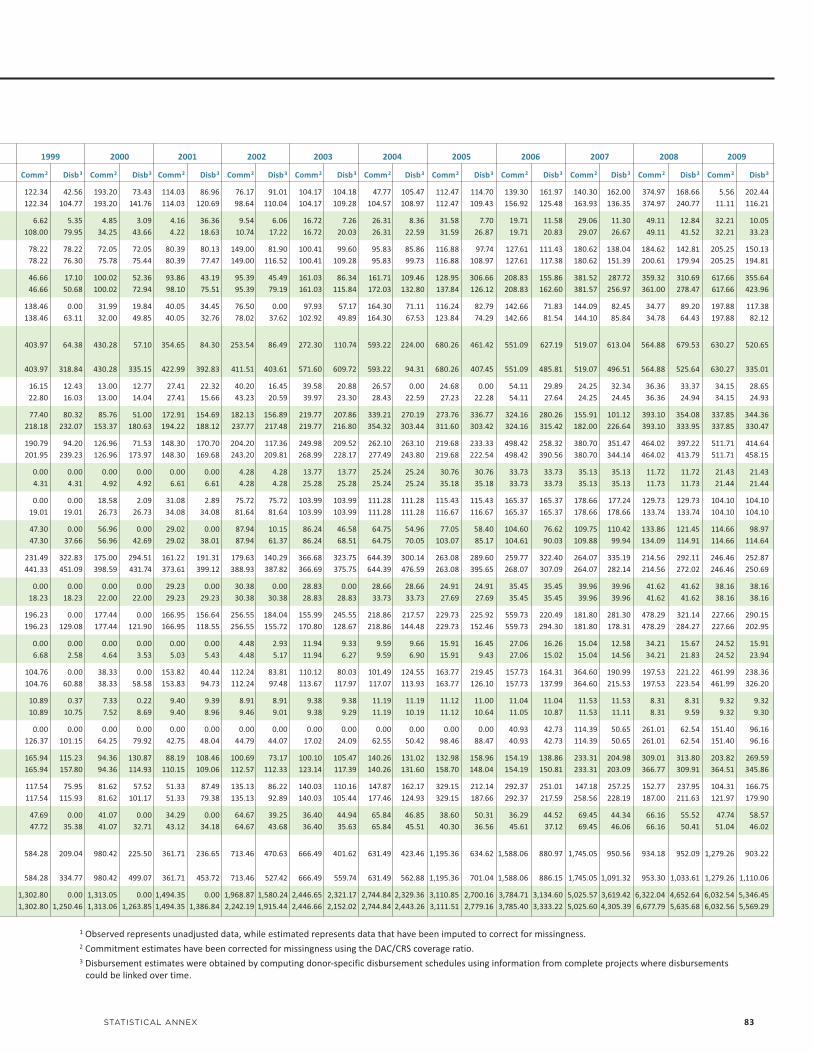
STATISTICAL ANNEX 83
1 Observed represents unadjusted data, while estimated represents data that have been imputed to correct for missingness.2 Commitment estimates have been corrected for missingness using the DAC/CRS coverage ratio. 3 Disbursement estimates were obtained by computing donor-specific disbursement schedules using information from complete projects where disbursements could be linked over time.
1999 2000 2001 2002 2003 2004 2005 2006 2007 2008 2009
Comm2 Disb3 Comm2 Disb3 Comm2 Disb3 Comm2 Disb3 Comm2 Disb3 Comm2 Disb3 Comm2 Disb3 Comm2 Disb3 Comm2 Disb3 Comm2 Disb3 Comm2 Disb3
122.34 42.56 193.20 73.43 114.03 86.96 76.17 91.01 104.17 104.18 47.77 105.47 112.47 114.70 139.30 161.97 140.30 162.00 374.97 168.66 5.56 202.44 122.34 104.77 193.20 141.76 114.03 120.69 98.64 110.04 104.17 109.28 104.57 108.97 112.47 109.43 156.92 125.48 163.93 136.35 374.97 240.77 11.11 116.21
6.62 5.35 4.85 3.09 4.16 36.36 9.54 6.06 16.72 7.26 26.31 8.36 31.58 7.70 19.71 11.58 29.06 11.30 49.11 12.84 32.21 10.05 108.00 79.95 34.25 43.66 4.22 18.63 10.74 17.22 16.72 20.03 26.31 22.59 31.59 26.87 19.71 20.83 29.07 26.67 49.11 41.52 32.21 33.23
78.22 78.22 72.05 72.05 80.39 80.13 149.00 81.90 100.41 99.60 95.83 85.86 116.88 97.74 127.61 111.43 180.62 138.04 184.62 142.81 205.25 150.13 78.22 76.30 75.78 75.44 80.39 77.47 149.00 116.52 100.41 109.28 95.83 99.73 116.88 108.97 127.61 117.38 180.62 151.39 200.61 179.94 205.25 194.81
46.66 17.10 100.02 52.36 93.86 43.19 95.39 45.49 161.03 86.34 161.71 109.46 128.95 306.66 208.83 155.86 381.52 287.72 359.32 310.69 617.66 355.64 46.66 50.68 100.02 72.94 98.10 75.51 95.39 79.19 161.03 115.84 172.03 132.80 137.84 126.12 208.83 162.60 381.57 256.97 361.00 278.47 617.66 423.96
138.46 0.00 31.99 19.84 40.05 34.45 76.50 0.00 97.93 57.17 164.30 71.11 116.24 82.79 142.66 71.83 144.09 82.45 34.77 89.20 197.88 117.38 138.46 63.11 32.00 49.85 40.05 32.76 78.02 37.62 102.92 49.89 164.30 67.53 123.84 74.29 142.66 81.54 144.10 85.84 34.78 64.43 197.88 82.12
403.97 64.38 430.28 57.10 354.65 84.30 253.54 86.49 272.30 110.74 593.22 224.00 680.26 461.42 551.09 627.19 519.07 613.04 564.88 679.53 630.27 520.65
403.97 318.84 430.28 335.15 422.99 392.83 411.51 403.61 571.60 609.72 593.22 94.31 680.26 407.45 551.09 485.81 519.07 496.51 564.88 525.64 630.27 335.01
16.15 12.43 13.00 12.77 27.41 22.32 40.20 16.45 39.58 20.88 26.57 0.00 24.68 0.00 54.11 29.89 24.25 32.34 36.36 33.37 34.15 28.65 22.80 16.03 13.00 14.04 27.41 15.66 43.23 20.59 39.97 23.30 28.43 22.59 27.23 22.28 54.11 27.64 24.25 24.45 36.36 24.94 34.15 24.93
77.40 80.32 85.76 51.00 172.91 154.69 182.13 156.89 219.77 207.86 339.21 270.19 273.76 336.77 324.16 280.26 155.91 101.12 393.10 354.08 337.85 344.36 218.18 232.07 153.37 180.63 194.22 188.12 237.77 217.48 219.77 216.80 354.32 303.44 311.60 303.42 324.16 315.42 182.00 226.64 393.10 333.95 337.85 330.47
190.79 94.20 126.96 71.53 148.30 170.70 204.20 117.36 249.98 209.52 262.10 263.10 219.68 233.33 498.42 258.32 380.70 351.47 464.02 397.22 511.71 414.64 201.95 239.23 126.96 173.97 148.30 169.68 243.20 209.81 268.99 228.17 277.49 243.80 219.68 222.54 498.42 390.56 380.70 344.14 464.02 413.79 511.71 458.15
0.00 0.00 0.00 0.00 0.00 0.00 4.28 4.28 13.77 13.77 25.24 25.24 30.76 30.76 33.73 33.73 35.13 35.13 11.72 11.72 21.43 21.43 4.31 4.31 4.92 4.92 6.61 6.61 4.28 4.28 25.28 25.28 25.24 25.24 35.18 35.18 33.73 33.73 35.13 35.13 11.73 11.73 21.44 21.44
0.00 0.00 18.58 2.09 31.08 2.89 75.72 75.72 103.99 103.99 111.28 111.28 115.43 115.43 165.37 165.37 178.66 177.24 129.73 129.73 104.10 104.10 19.01 19.01 26.73 26.73 34.08 34.08 81.64 81.64 103.99 103.99 111.28 111.28 116.67 116.67 165.37 165.37 178.66 178.66 133.74 133.74 104.10 104.10
47.30 0.00 56.96 0.00 29.02 0.00 87.94 10.15 86.24 46.58 64.75 54.96 77.05 58.40 104.60 76.62 109.75 110.42 133.86 121.45 114.66 98.97 47.30 37.66 56.96 42.69 29.02 38.01 87.94 61.37 86.24 68.51 64.75 70.05 103.07 85.17 104.61 90.03 109.88 99.94 134.09 114.91 114.66 114.64
231.49 322.83 175.00 294.51 161.22 191.31 179.63 140.29 366.68 323.75 644.39 300.14 263.08 289.60 259.77 322.40 264.07 335.19 214.56 292.11 246.46 252.87 441.33 451.09 398.59 431.74 373.61 399.12 388.93 387.82 366.69 375.75 644.39 476.59 263.08 395.65 268.07 307.09 264.07 282.14 214.56 272.02 246.46 250.69
0.00 0.00 0.00 0.00 29.23 0.00 30.38 0.00 28.83 0.00 28.66 28.66 24.91 24.91 35.45 35.45 39.96 39.96 41.62 41.62 38.16 38.16 18.23 18.23 22.00 22.00 29.23 29.23 30.38 30.38 28.83 28.83 33.73 33.73 27.69 27.69 35.45 35.45 39.96 39.96 41.62 41.62 38.16 38.16
196.23 0.00 177.44 0.00 166.95 156.64 256.55 184.04 155.99 245.55 218.86 217.57 229.73 225.92 559.73 220.49 181.80 281.30 478.29 321.14 227.66 290.15 196.23 129.08 177.44 121.90 166.95 118.55 256.55 155.72 170.80 128.67 218.86 144.48 229.73 152.46 559.73 294.30 181.80 178.31 478.29 284.27 227.66 202.95
0.00 0.00 0.00 0.00 0.00 0.00 4.48 2.93 11.94 9.33 9.59 9.66 15.91 16.45 27.06 16.26 15.04 12.58 34.21 15.67 24.52 15.91 6.68 2.58 4.64 3.53 5.03 5.43 4.48 5.17 11.94 6.27 9.59 6.90 15.91 9.43 27.06 15.02 15.04 14.56 34.21 21.83 24.52 23.94
104.76 0.00 38.33 0.00 153.82 40.44 112.24 83.81 110.12 80.03 101.49 124.55 163.77 219.45 157.73 164.31 364.60 190.99 197.53 221.22 461.99 238.36 104.76 60.88 38.33 58.58 153.83 94.73 112.24 97.48 113.67 117.97 117.07 113.93 163.77 126.10 157.73 137.99 364.60 215.53 197.53 223.54 461.99 326.20
10.89 0.37 7.33 0.22 9.40 9.39 8.91 8.91 9.38 9.38 11.19 11.19 11.12 11.00 11.04 11.04 11.53 11.53 8.31 8.31 9.32 9.32 10.89 10.75 7.52 8.69 9.40 8.96 9.46 9.01 9.38 9.29 11.19 10.19 11.12 10.64 11.05 10.87 11.53 11.11 8.31 9.59 9.32 9.30
0.00 0.00 0.00 0.00 0.00 0.00 0.00 0.00 0.00 0.00 0.00 0.00 0.00 0.00 40.93 42.73 114.39 50.65 261.01 62.54 151.40 96.16 126.37 101.15 64.25 79.92 42.75 48.04 44.79 44.07 17.02 24.09 62.55 50.42 98.46 88.47 40.93 42.73 114.39 50.65 261.01 62.54 151.40 96.16
165.94 115.23 94.36 130.87 88.19 108.46 100.69 73.17 100.10 105.47 140.26 131.02 132.98 158.96 154.19 138.86 233.31 204.98 309.01 313.80 203.82 269.59 165.94 157.80 94.36 114.93 110.15 109.06 112.57 112.33 123.14 117.39 140.26 131.60 158.70 148.04 154.19 150.81 233.31 203.09 366.77 309.91 364.51 345.86
117.54 75.95 81.62 57.52 51.33 87.49 135.13 86.22 140.03 110.16 147.87 162.17 329.15 212.14 292.37 251.01 147.18 257.25 152.77 237.95 104.31 166.75 117.54 115.93 81.62 101.17 51.33 79.38 135.13 92.89 140.03 105.44 177.46 124.93 329.15 187.66 292.37 217.59 258.56 228.19 187.00 211.63 121.97 179.90
47.69 0.00 41.07 0.00 34.29 0.00 64.67 39.25 36.40 44.94 65.84 46.85 38.60 50.31 36.29 44.52 69.45 44.34 66.16 55.52 47.74 58.57 47.72 35.38 41.07 32.71 43.12 34.18 64.67 43.68 36.40 35.63 65.84 45.51 40.30 36.56 45.61 37.12 69.45 46.06 66.16 50.41 51.04 46.02
584.28 209.04 980.42 225.50 361.71 236.65 713.46 470.63 666.49 401.62 631.49 423.46 1,195.36 634.62 1,588.06 880.97 1,745.05 950.56 934.18 952.09 1,279.26 903.22
584.28 334.77 980.42 499.07 361.71 453.72 713.46 527.42 666.49 559.74 631.49 562.88 1,195.36 701.04 1,588.06 886.15 1,745.05 1,091.32 953.30 1,033.61 1,279.26 1,110.06
1,302.80 0.00 1,313.05 0.00 1,494.35 0.00 1,968.87 1,580.24 2,446.65 2,321.17 2,744.84 2,329.36 3,110.85 2,700.16 3,784.71 3,134.60 5,025.57 3,619.42 6,322.04 4,652.64 6,032.54 5,346.45 1,302.80 1,250.46 1,313.06 1,263.85 1,494.35 1,386.84 2,242.19 1,915.44 2,446.66 2,152.02 2,744.84 2,443.26 3,111.51 2,779.16 3,785.40 3,333.22 5,025.60 4,305.39 6,677.79 5,635.68 6,032.56 5,569.29

84 INSTITUTE FOR HEALTH METRICS AND EVALUATION
TABLE 9:World Bank financial and in-kind DAH, 1990-2009
International Development Association International Bank for Reconstruction and DevelopmentYear Financial In-kind Financial In-kind
1990 28.70 2.60 60.20 2.12
1991 92.80 6.75 92.80 4.60
1992 269.00 22.40 174.00 9.15
1993 432.00 41.10 383.00 19.90
1994 542.00 53.50 418.00 29.10
1995 590.00 59.10 329.00 21.60
1996 617.00 53.30 514.00 28.30
1997 653.00 46.50 869.00 40.70
1998 656.00 26.80 895.00 35.40
1999 808.00 50.90 818.00 38.10
2000 817.00 73.20 894.00 63.20
2001 873.00 67.90 785.00 57.60
2002 1,010.00 86.50 866.00 68.00
2003 1,030.00 126.00 684.00 51.10
2004 1,070.00 157.00 1,030.00 95.60
2005 1,090.00 126.00 773.00 81.50
2006 935.00 116.00 658.00 58.70
2007 877.00 117.00 644.00 62.10
2008 820.00 110.00 403.00 41.60
2009 628.00 85.30 455.00 30.50
Source: IHME DAH Database 2011
Notes: In millions US$, 2009. For preliminary estimates of DAH for 2010 and 2011, refer to Table 1 of the Statistical Annex.

African Development Bank Asian Development Bank Inter-American Development BankYear Financial In-kind Financial In-kind Financial In-kind
1990 60.80 5.08 32.40 2.71 82.70 6.91
1991 58.70 4.90 31.40 2.63 75.60 6.32
1992 57.40 4.79 45.60 3.80 50.10 4.18
1993 56.10 4.69 66.80 5.58 58.80 4.91
1994 87.50 7.30 66.20 5.53 80.30 6.71
1995 67.60 5.64 48.20 4.02 80.00 6.68
1996 69.00 5.76 52.80 4.41 103.00 8.64
1997 86.10 7.19 55.00 4.59 163.00 13.60
1998 57.80 4.82 111.00 9.27 174.00 14.50
1999 56.90 4.75 207.00 17.30 175.00 14.60
2000 41.70 3.48 359.00 30.00 202.00 16.90
2001 39.10 3.27 152.00 12.70 187.00 15.60
2002 75.20 6.28 152.00 12.70 196.00 16.40
2003 39.20 3.27 131.00 10.90 171.00 14.30
2004 83.50 6.98 128.00 10.70 346.00 28.90
2005 138.00 11.50 120.00 10.00 354.00 29.60
2006 84.00 7.02 122.00 10.20 123.00 10.30
2007 81.50 6.81 127.00 10.60 148.00 12.30
2008 96.40 8.05 128.00 10.70 135.00 11.20
2009 95.50 7.97 421.00 35.10 127.00 10.60
Source: IHME DAH Database 2011
Notes: In millions US$, 2009. For preliminary estimates of DAH for 2010 and 2011, refer to Table 1 of the Statistical Annex.
TABLE 10:Regional development banks’ financial and in-kind DAH, 1990-2009
STATISTICAL ANNEX 85
TABLE 11:Financial and in-kind contributions by GFATM and GAVI, 2000-2009
GFATM GAVI Year Financial In-kind Financial In-kind
2000 – – 2.46 0.32
2001 – – 142.00 3.77
2002 1.07 15.20 109.00 8.72
2003 270.00 38.00 202.00 5.21
2004 712.00 57.60 169.00 47.90
2005 1,160.00 80.90 250.00 31.20
2006 1,400.00 92.10 425.00 21.70
2007 1,780.00 80.80 954.00 62.30
2008 2,270.00 159.00 744.00 77.60
2009 2,750.00 157.00 530.00 317.00
Source: IHME DAH Database 2011
Notes: In millions US$, 2009. For preliminary estimates of DAH for 2010 and 2011, refer to Table 1 of the Statistical Annex. Dashes indicate inapplicable.
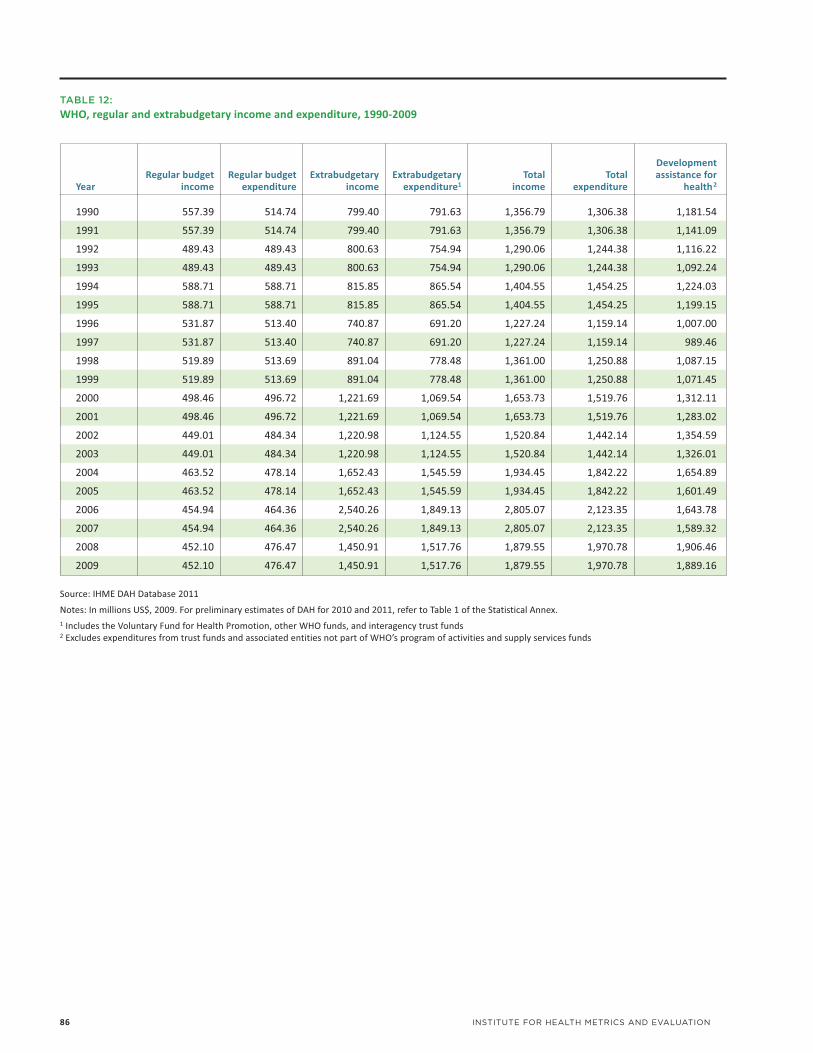
86 INSTITUTE FOR HEALTH METRICS AND EVALUATION
TABLE 12:WHO, regular and extrabudgetary income and expenditure, 1990-2009
Development Regular budget Regular budget Extrabudgetary Extrabudgetary Total Total assistance for Year income expenditure income expenditure1 income expenditure health2
1990 557.39 514.74 799.40 791.63 1,356.79 1,306.38 1,181.54
1991 557.39 514.74 799.40 791.63 1,356.79 1,306.38 1,141.09
1992 489.43 489.43 800.63 754.94 1,290.06 1,244.38 1,116.22
1993 489.43 489.43 800.63 754.94 1,290.06 1,244.38 1,092.24
1994 588.71 588.71 815.85 865.54 1,404.55 1,454.25 1,224.03
1995 588.71 588.71 815.85 865.54 1,404.55 1,454.25 1,199.15
1996 531.87 513.40 740.87 691.20 1,227.24 1,159.14 1,007.00
1997 531.87 513.40 740.87 691.20 1,227.24 1,159.14 989.46
1998 519.89 513.69 891.04 778.48 1,361.00 1,250.88 1,087.15
1999 519.89 513.69 891.04 778.48 1,361.00 1,250.88 1,071.45
2000 498.46 496.72 1,221.69 1,069.54 1,653.73 1,519.76 1,312.11
2001 498.46 496.72 1,221.69 1,069.54 1,653.73 1,519.76 1,283.02
2002 449.01 484.34 1,220.98 1,124.55 1,520.84 1,442.14 1,354.59
2003 449.01 484.34 1,220.98 1,124.55 1,520.84 1,442.14 1,326.01
2004 463.52 478.14 1,652.43 1,545.59 1,934.45 1,842.22 1,654.89
2005 463.52 478.14 1,652.43 1,545.59 1,934.45 1,842.22 1,601.49
2006 454.94 464.36 2,540.26 1,849.13 2,805.07 2,123.35 1,643.78
2007 454.94 464.36 2,540.26 1,849.13 2,805.07 2,123.35 1,589.32
2008 452.10 476.47 1,450.91 1,517.76 1,879.55 1,970.78 1,906.46
2009 452.10 476.47 1,450.91 1,517.76 1,879.55 1,970.78 1,889.16
Source: IHME DAH Database 2011
Notes: In millions US$, 2009. For preliminary estimates of DAH for 2010 and 2011, refer to Table 1 of the Statistical Annex. 1 Includes the Voluntary Fund for Health Promotion, other WHO funds, and interagency trust funds 2 Excludes expenditures from trust funds and associated entities not part of WHO’s program of activities and supply services funds
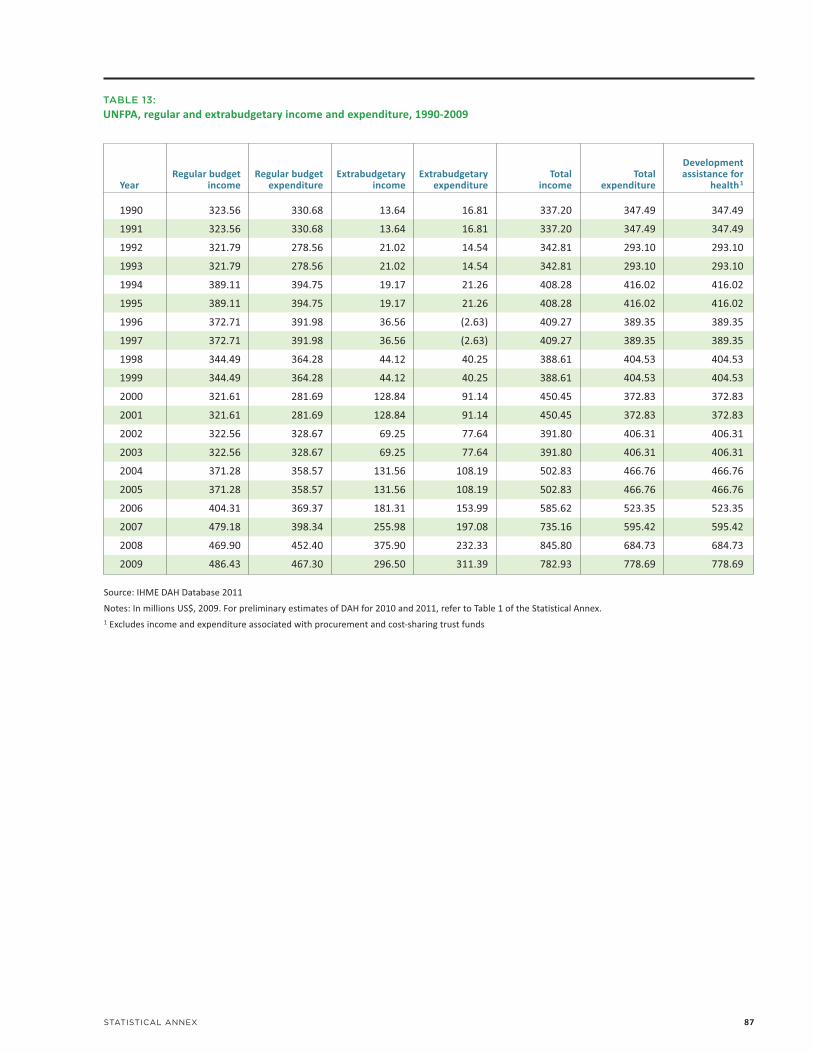
STATISTICAL ANNEX 87
TABLE 13:UNFPA, regular and extrabudgetary income and expenditure, 1990-2009
Development Regular budget Regular budget Extrabudgetary Extrabudgetary Total Total assistance for Year income expenditure income expenditure income expenditure health1
1990 323.56 330.68 13.64 16.81 337.20 347.49 347.49
1991 323.56 330.68 13.64 16.81 337.20 347.49 347.49
1992 321.79 278.56 21.02 14.54 342.81 293.10 293.10
1993 321.79 278.56 21.02 14.54 342.81 293.10 293.10
1994 389.11 394.75 19.17 21.26 408.28 416.02 416.02
1995 389.11 394.75 19.17 21.26 408.28 416.02 416.02
1996 372.71 391.98 36.56 (2.63) 409.27 389.35 389.35
1997 372.71 391.98 36.56 (2.63) 409.27 389.35 389.35
1998 344.49 364.28 44.12 40.25 388.61 404.53 404.53
1999 344.49 364.28 44.12 40.25 388.61 404.53 404.53
2000 321.61 281.69 128.84 91.14 450.45 372.83 372.83
2001 321.61 281.69 128.84 91.14 450.45 372.83 372.83
2002 322.56 328.67 69.25 77.64 391.80 406.31 406.31
2003 322.56 328.67 69.25 77.64 391.80 406.31 406.31
2004 371.28 358.57 131.56 108.19 502.83 466.76 466.76
2005 371.28 358.57 131.56 108.19 502.83 466.76 466.76
2006 404.31 369.37 181.31 153.99 585.62 523.35 523.35
2007 479.18 398.34 255.98 197.08 735.16 595.42 595.42
2008 469.90 452.40 375.90 232.33 845.80 684.73 684.73
2009 486.43 467.30 296.50 311.39 782.93 778.69 778.69
Source: IHME DAH Database 2011
Notes: In millions US$, 2009. For preliminary estimates of DAH for 2010 and 2011, refer to Table 1 of the Statistical Annex. 1 Excludes income and expenditure associated with procurement and cost-sharing trust funds

88 INSTITUTE FOR HEALTH METRICS AND EVALUATION
Regular Regular Regular Development budget budget Extrabudgetary Extrabudgetary Total Total budget health assistance for Year income expenditure income expenditure income expenditure expenditure1 health2
1990 761.16 695.63 433.90 395.07 1,195.06 1,090.71 90.43 224.33
1991 761.16 695.63 433.90 395.07 1,195.06 1,090.71 90.43 216.65
1992 740.62 814.74 523.78 522.50 1,264.40 1,337.24 105.92 279.16
1993 740.62 814.74 523.78 522.50 1,264.40 1,337.24 105.92 273.16
1994 721.48 770.47 639.09 577.70 1,360.57 1,348.17 100.16 291.17
1995 721.48 770.47 639.09 577.70 1,360.57 1,348.17 100.16 285.25
1996 712.92 681.55 485.37 509.26 1,198.29 1,190.82 88.60 256.84
1997 712.92 681.55 485.37 509.26 1,198.29 1,190.82 88.60 252.36
1998 733.60 670.44 586.45 548.45 1,320.05 1,218.88 87.16 266.47
1999 733.60 670.44 586.45 548.45 1,320.05 1,218.88 87.16 262.62
2000 665.20 713.06 761.00 700.66 1,426.21 1,413.72 92.70 322.02
2001 665.20 713.06 761.00 700.66 1,426.21 1,413.72 119.84 461.75
2002 831.14 703.34 992.56 892.52 1,823.71 1,595.86 95.58 435.14
2003 831.14 703.34 992.56 892.52 1,823.71 1,595.86 99.10 429.50
2004 866.20 749.37 1,721.78 1,331.10 2,587.98 2,080.47 98.98 500.00
2005 866.20 749.37 1,721.78 1,331.10 2,587.98 2,080.47 122.29 671.47
2006 1,102.29 901.65 2,009.46 1,735.68 3,111.75 2,637.33 66.02 401.07
2007 1,102.29 901.65 2,009.46 1,735.68 3,111.75 2,637.33 121.00 539.47
2008 1,057.19 1,043.88 2,247.81 2,118.01 3,305.01 3,161.89 109.19 500.78
2009 1,057.19 1,043.88 2,247.81 2,118.01 3,305.01 3,161.89 115.84 524.98
Source: IHME DAH Database 2011
Notes: In millions US$, 2009. For preliminary estimates of DAH for 2010 and 2011, refer to Table 1 of the Statistical Annex. 1 Data are derived from financial reports and audited financial statements as well as information about health expenditure obtained via correspondence.2 As UNICEF’s activities are not limited to the health sector, we used the fraction of total expenditure attributable to health for 2001-2009 to obtain estimates for development assistance for health.
TABLE 14:UNICEF, regular and extrabudgetary income and expenditure, 1990-2009

STATISTICAL ANNEX 89
TABLE 15:UNAIDS, regular and extrabudgetary income and expenditure, 1996-2009
Development Regular budget Regular budget Extrabudgetary Extrabudgetary Total assistance for Year income expenditure income expenditure income health1
1996 69.02 66.23 13.16 9.04 82.18 75.27
1997 69.02 66.23 13.16 9.04 82.18 75.27
1998 82.28 71.15 14.34 14.53 96.62 85.68
1999 82.28 71.15 14.34 14.53 96.62 85.68
2000 104.51 118.00 12.21 13.14 116.72 131.14
2001 104.51 118.00 12.21 13.14 116.72 131.14
2002 127.14 93.34 25.36 18.95 152.50 112.29
2003 127.14 93.34 25.36 18.95 152.50 112.29
2004 177.39 145.45 29.37 27.87 206.76 173.31
2005 177.39 145.45 29.37 27.87 206.76 173.31
2006 236.19 193.47 43.85 34.37 280.04 227.84
2007 236.19 193.47 43.85 34.37 280.04 227.84
2008 255.56 227.10 33.02 34.92 288.58 262.02
2009 255.56 227.10 33.02 34.92 288.58 262.02
Source: IHME DAH Database 2011
Notes: In millions US$, 2009. For preliminary estimates of DAH for 2010 and 2011, refer to Table 1 of the Statistical Annex. 1 No adjustments were made to UNAIDS total expenditures to obtain development assistance for health.

90 INSTITUTE FOR HEALTH METRICS AND EVALUATION
TABLE 16:PAHO, regular and extrabudgetary income and expenditure, 1990-2009
Year Regular budget income Regular budget expenditure Income from WHO Expenditure of WHO funds
1990 200.32 187.58 80.11 80.11
1991 200.32 187.58 80.11 80.11
1992 216.41 206.38 71.44 71.44
1993 216.41 206.38 71.44 71.44
1994 204.28 215.69 74.08 74.08
1995 204.28 215.69 74.08 74.08
1996 239.66 208.89 61.33 61.33
1997 239.66 208.89 61.33 61.33
1998 353.34 330.04 62.21 62.21
1999 353.34 330.04 62.21 62.21
2000 333.90 347.09 58.06 58.06
2001 333.90 347.09 58.06 58.06
2002 392.23 373.20 50.47 50.47
2003 392.23 373.20 50.47 50.47
2004 389.20 382.71 53.18 53.18
2005 389.20 382.71 53.18 53.18
2006 542.99 449.44 61.90 61.90
2007 542.99 449.44 61.90 61.90
2008 672.29 619.92 72.19 72.19
2009 672.29 619.92 72.19 72.19
Source: IHME DAH Database 2011
Notes: In millions US$, 2009. For preliminary estimates of DAH for 2010 and 2011, refer to Table 1 of the Statistical Annex. 1 Excludes expenditure associated with the rotating fund for the procurement of drugs, as these are funded by the recipient countries.

STATISTICAL ANNEX 91
Income centers Expenditure centers Total income Total expenditure Rotating fund expenditure Development assistance for health1
12.27 12.07 292.70 279.76 14.68 265.07
12.27 12.07 292.70 279.76 14.68 265.07
11.82 11.88 299.67 289.70 23.50 266.20
11.82 11.88 299.67 289.70 23.50 266.20
9.36 8.61 287.72 298.38 19.53 278.85
9.36 8.61 287.72 298.38 19.53 278.85
22.77 10.24 323.76 280.45 25.91 254.55
22.77 10.24 323.76 280.45 25.91 254.55
8.52 8.50 424.07 400.76 117.54 283.22
8.52 8.50 424.07 400.76 117.54 283.22
9.40 8.58 401.37 413.73 129.55 284.18
9.40 8.58 401.37 413.73 129.55 284.18
11.16 10.35 447.47 427.63 169.02 258.61
11.16 10.35 447.47 427.63 169.02 258.61
11.51 11.12 438.45 431.57 172.43 259.14
11.51 11.12 438.45 431.57 172.43 259.14
11.34 11.85 598.25 505.21 193.19 312.02
11.34 11.85 598.25 505.21 193.19 312.02
7.15 8.55 724.60 673.64 314.26 359.38
7.15 8.55 724.60 673.64 314.26 359.38

1999 2000 2001 2002
Commitments 1,442.10 857.89 469.98 733.19
Disbursements 430.51 686.80 1,016.97 598.08
Country governments and IGOs (excluding UN) 12.65 8.67 7.27 6.34
UN agencies 81.12 58.65 30.54 48.25
World Bank 0.00 45.20 12.79 83.41
GAVI 221.39 185.74 514.64 0.00
GFATM – – – 59.58
Public-private partnerships 2.02 35.91 21.57 157.20 (excluding GAVI and GFATM)
Universities and 64.92 202.55 143.64 113.71 research institutions
NGOs1 and corporations 48.39 150.08 286.53 129.59
In-kind 0.92 37.20 45.70 35.70
Source: IHME DAH Database (BMGF) 2011
Notes: In millions US$, 2009. Data were unavailable to show BMGF in-kind contributions for 2010.
For preliminary estimates of DAH for 2011, refer to Table 1 of the Statistical Annex. Dashes indicate inapplicable. Blank cells indicate missing values.
1 Includes nonresearch-focused NGOs and foundations based in low-, middle-, and high-income countries
92 INSTITUTE FOR HEALTH METRICS AND EVALUATION
TABLE 18:Bill & Melinda Gates Foundation global health commitments, disbursements, and in-kind contributions, 1999-2010
1990 1991 1992 1993 1994 1995 1996 1997
Total overseas health expenditure 533.34 712.41 854.29 895.30 1,011.15 967.00 853.51 941.54
Amount of overseas health expenditure financed from:
Revenue from US government 209.25 326.68 421.79 422.46 490.04 475.06 350.99 400.70
Revenue from other governments 29.71 71.41 70.40 70.17 82.07 70.95 81.05 74.68
BMGF grants – – – – – – – –
Private financial revenue 250.87 267.58 299.06 325.04 344.18 333.63 320.22 356.29
Private in-kind revenue 43.51 46.74 63.05 77.63 94.86 87.35 101.25 109.87
Average percent of revenue from:
US government 19.82 17.52 18.27 19.78 20.62 20.79 20.27 20.13
Private financial contributions 60.36 62.89 61.01 58.99 56.99 56.82 54.86 54.70
Private in-kind contributions 15.33 14.46 15.61 16.09 16.83 16.24 18.49 18.74
Average health fraction 0.23 0.22 0.22 0.23 0.23 0.23 0.23 0.24
Number of US NGOs 267.00 339.00 390.00 418.00 438.00 429.00 434.00 439.00
Source: IHME DAH Database (NGOs) 2011
Notes: Dashes indicate inapplicable.
Total overseas health expenditure (in millions US$, 2009) is the sum of the product of each US NGO’s overseas expenditure multipled by the actual or estimated health expenditures as a fraction of total expenditure.
Amount of overseas health expenditure (in millions US$, 2009) financed by revenue from each source is the sum of the product of each US NGO’s fraction of revenue from a given source and the overseas health expenditure. Overseas health expenditure financed by private in-kind revenue reflects deflation to 18.3% of original value to compensate for exaggerated market valuation of in-kind drugs and commodities.
TABLE 17:US NGO expenditures, 1990-2011
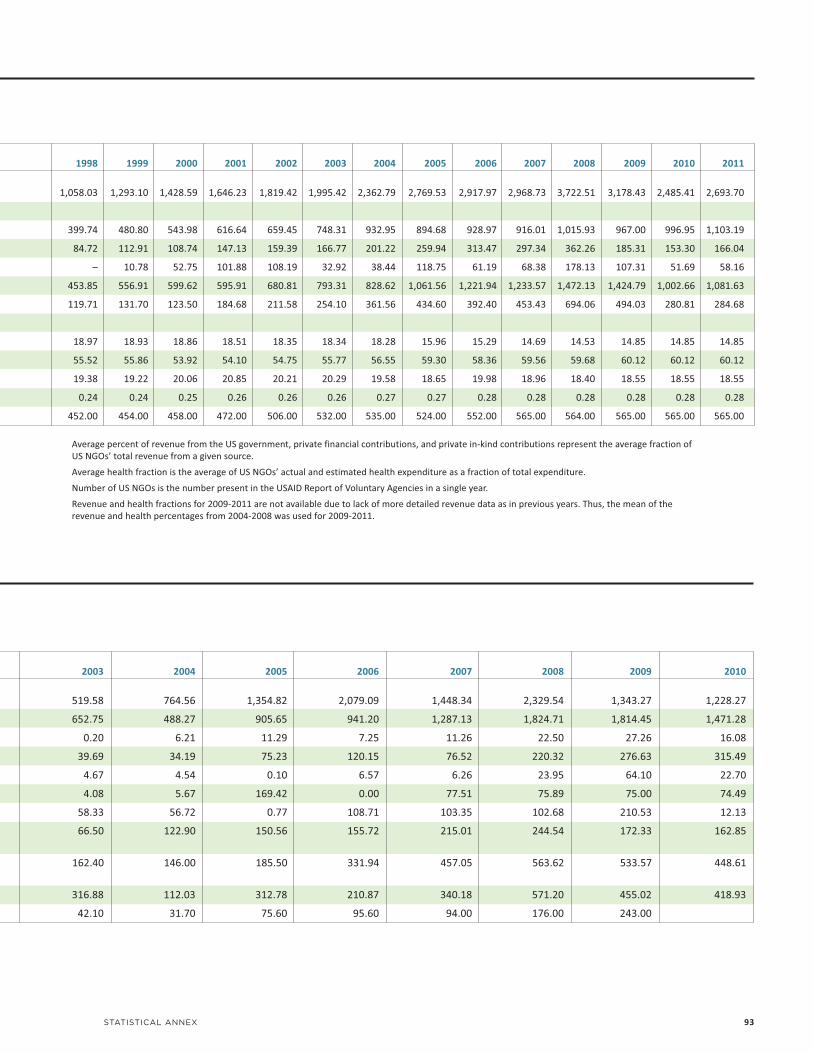
2003 2004 2005 2006 2007 2008 2009 2010
519.58 764.56 1,354.82 2,079.09 1,448.34 2,329.54 1,343.27 1,228.27
652.75 488.27 905.65 941.20 1,287.13 1,824.71 1,814.45 1,471.28
0.20 6.21 11.29 7.25 11.26 22.50 27.26 16.08
39.69 34.19 75.23 120.15 76.52 220.32 276.63 315.49
4.67 4.54 0.10 6.57 6.26 23.95 64.10 22.70
4.08 5.67 169.42 0.00 77.51 75.89 75.00 74.49
58.33 56.72 0.77 108.71 103.35 102.68 210.53 12.13
66.50 122.90 150.56 155.72 215.01 244.54 172.33 162.85
162.40 146.00 185.50 331.94 457.05 563.62 533.57 448.61
316.88 112.03 312.78 210.87 340.18 571.20 455.02 418.93
42.10 31.70 75.60 95.60 94.00 176.00 243.00
STATISTICAL ANNEX 93
1998 1999 2000 2001 2002 2003 2004 2005 2006 2007 2008 2009 2010 2011
1,058.03 1,293.10 1,428.59 1,646.23 1,819.42 1,995.42 2,362.79 2,769.53 2,917.97 2,968.73 3,722.51 3,178.43 2,485.41 2,693.70
399.74 480.80 543.98 616.64 659.45 748.31 932.95 894.68 928.97 916.01 1,015.93 967.00 996.95 1,103.19
84.72 112.91 108.74 147.13 159.39 166.77 201.22 259.94 313.47 297.34 362.26 185.31 153.30 166.04
– 10.78 52.75 101.88 108.19 32.92 38.44 118.75 61.19 68.38 178.13 107.31 51.69 58.16
453.85 556.91 599.62 595.91 680.81 793.31 828.62 1,061.56 1,221.94 1,233.57 1,472.13 1,424.79 1,002.66 1,081.63
119.71 131.70 123.50 184.68 211.58 254.10 361.56 434.60 392.40 453.43 694.06 494.03 280.81 284.68
18.97 18.93 18.86 18.51 18.35 18.34 18.28 15.96 15.29 14.69 14.53 14.85 14.85 14.85
55.52 55.86 53.92 54.10 54.75 55.77 56.55 59.30 58.36 59.56 59.68 60.12 60.12 60.12
19.38 19.22 20.06 20.85 20.21 20.29 19.58 18.65 19.98 18.96 18.40 18.55 18.55 18.55
0.24 0.24 0.25 0.26 0.26 0.26 0.27 0.27 0.28 0.28 0.28 0.28 0.28 0.28
452.00 454.00 458.00 472.00 506.00 532.00 535.00 524.00 552.00 565.00 564.00 565.00 565.00 565.00
Average percent of revenue from the US government, private financial contributions, and private in-kind contributions represent the average fraction of US NGOs’ total revenue from a given source.
Average health fraction is the average of US NGOs’ actual and estimated health expenditure as a fraction of total expenditure.
Number of US NGOs is the number present in the USAID Report of Voluntary Agencies in a single year.
Revenue and health fractions for 2009-2011 are not available due to lack of more detailed revenue data as in previous years. Thus, the mean of the revenue and health percentages from 2004-2008 was used for 2009-2011.

94 INSTITUTE FOR HEALTH METRICS AND EVALUATION
TABLE 19:Government health expenditure as source, 1995-2009
GBD region 1995 1996 1997 1998 1999 2000
Asia
Central 2,389.16 2,342.40 2,355.95 2,269.49 2,116.95 2,185.56
East 23,144.85 25,158.63 27,973.99 30,935.75 34,046.45 36,106.30
South 6,954.64 7,611.46 8,128.07 8,803.63 9,245.02 9,452.02
Southeast 9,288.83 10,243.81 11,295.18 10,580.09 10,672.73 11,394.51
Caribbean 888.89 1,073.53 1,215.43 1,264.43 1,307.33 1,498.72
Latin America
Andean 2,822.01 3,026.37 2,952.53 2,908.79 3,189.50 3,024.35
Central 25,199.73 25,863.99 29,029.95 31,691.73 35,132.99 35,224.70
South 13,466.52 13,636.01 14,638.71 15,682.07 16,697.59 16,581.83
Tropical 30,942.11 30,724.16 33,421.36 32,892.68 34,750.40 34,588.87
North Africa / Middle East 24,208.05 26,957.87 30,011.39 33,387.79 32,984.82 36,283.79
Oceania 237.68 231.14 246.66 275.44 287.59 270.17
Sub-Saharan Africa
Central 805.93 447.03 600.70 677.63 597.53 738.29
East 1,090.14 1,259.53 1,389.85 1,537.79 1,543.77 1,691.45
South 7,533.33 8,185.20 8,196.65 8,056.02 7,820.03 7,899.94
West 1,555.45 1,490.83 1,625.29 1,809.85 2,064.82 2,281.14
Source: IHME Government Health Spending Database (Developing Countries) 2011
Notes: In millions US$, 2009. Government health expenditure as source (GHE-S) includes funds raised by recipient country governments from internal resources. This table disaggregates GHE-S by Global Burden of Disease developing regions from base data sources of the WHO National Health Accounts.
1995 1996 1997 1998 1999 2000
DAH DAH DAH DAH DAH DAH DAH DAH DAH DAH DAH DAH to to to to to to to to to to to to GBD region gov non-gov gov non-gov gov non-gov gov non-gov gov non-gov gov non-gov
Asia
Central 32.20 0.10 40.97 0.25 33.89 1.07 47.88 5.35 116.73 3.78 112.64 27.93
East 10.89 4.04 23.23 7.47 33.77 3.32 49.37 2.47 15.94 13.73 47.26 31.00
South 187.85 20.28 202.35 84.20 193.94 73.96 301.22 86.05 255.28 93.05 254.33 145.15
Southeast 152.09 22.47 165.12 27.56 206.53 62.64 275.69 92.20 298.77 36.81 396.29 39.11
Caribbean 164.64 1.59 74.01 6.17 59.73 4.87 72.62 19.24 94.34 12.58 66.61 10.46
Latin America
Andean 49.92 11.86 71.84 5.36 69.16 10.00 90.47 20.99 96.81 6.35 147.03 4.83
Central 78.56 1.80 106.71 7.13 220.47 4.78 113.68 7.98 164.63 7.28 145.76 5.02
South 39.49 0.32 30.90 0.31 21.75 0.19 15.06 0.13 8.79 0.10 3.89 0.06
Tropical 3.24 0.09 2.24 0.18 2.31 1.02 25.25 2.50 30.02 14.23 20.09 5.60
North Africa / Middle East 122.44 19.35 113.62 15.46 84.57 30.11 102.54 10.07 146.78 22.95 136.68 6.23
Oceania 6.70 0.00 34.31 0.00 21.86 0.00 13.78 0.42 19.67 12.31 43.97 7.83
Sub-Saharan Africa
Central 79.48 0.64 173.53 1.82 120.42 8.83 74.67 13.58 114.03 18.80 94.54 12.83
East 311.16 20.83 429.01 37.49 357.56 51.32 364.13 60.58 428.13 60.03 448.34 65.57
South 54.87 38.35 73.88 50.51 79.00 66.77 105.27 75.49 91.10 72.88 103.33 89.98
West 154.08 18.07 178.00 30.26 203.33 20.52 187.76 22.81 239.21 28.08 258.32 29.93
Source: IHME DAH Database (Country and Regional Recipient Level) 2011
Notes: In millions US$, 2009. Development assistance for health (DAH) includes both financial and in-kind contributions, excluding loans, for activities aimed at improving health in low- and middle-income countries. This table disaggregates financial DAH transfers by the recipient sector and Global Burden of Disease developing regions.
TABLE 20:DAH allocated to government or non-government recipients, 1995-2009

STATISTICAL ANNEX 95
2001 2002 2003 2004 2005 2006 2007 2008 2009
2,305.76 2,341.30 2,600.90 3,075.97 3,600.16 3,819.24 3,648.28 4,455.00 5,375.32
36,079.34 41,345.23 46,095.89 52,108.14 57,439.69 65,653.85 80,728.02 95,532.47 113,848.00
9,807.76 10,164.37 10,054.50 9,951.78 10,301.10 13,655.92 15,520.66 18,142.45 18,544.87
12,302.20 13,530.39 15,721.44 16,073.08 16,515.96 19,094.20 21,776.92 23,311.10 24,533.29
1,395.31 1,650.50 1,531.34 1,740.80 1,958.09 2,276.15 2,308.33 2,415.70 2,905.59
3,174.86 3,606.11 3,526.80 3,769.44 4,119.69 4,340.17 4,556.56 4,978.81 5,270.81
36,641.75 36,753.19 38,106.63 40,680.27 42,643.51 45,283.17 49,861.11 51,448.99 54,212.19
16,648.98 14,282.24 13,740.96 14,568.67 16,217.13 17,821.34 20,306.29 23,141.65 27,398.77
37,201.95 39,857.53 39,055.37 44,412.24 44,870.65 50,251.57 52,912.67 58,890.62 65,339.78
39,635.41 42,226.33 44,652.66 47,220.39 49,881.18 55,723.90 60,339.27 64,140.87 67,688.06
250.70 242.20 249.78 288.08 299.22 292.59 323.69 325.65 358.13
1,063.30 872.23 973.87 918.13 1,029.66 1,454.46 1,813.38 2,470.14 4,314.14
1,678.38 1,729.01 1,512.22 1,653.05 1,821.71 2,104.03 2,271.91 2,886.27 3,264.81
8,156.13 8,248.60 8,198.66 8,724.93 9,551.16 9,989.97 10,728.75 11,141.80 11,805.76
2,531.18 2,470.39 2,746.15 3,506.81 3,948.11 4,313.69 4,626.14 5,181.69 5,638.10
2001 2002 2003 2004 2005 2006 2007 2008 2009
DAH DAH DAH DAH DAH DAH DAH DAH DAH DAH DAH DAH DAH DAH DAH DAH DAH DAHto to to to to to to to to to to to to to to to to to
gov non-gov gov non-gov gov non-gov gov non-gov gov non-gov gov non-gov gov non-gov gov non-gov gov non-gov
113.68 3.01 121.50 12.82 145.23 7.03 124.67 12.10 91.30 85.09 78.34 87.70 122.51 54.28 100.15 68.46 113.46 69.23
48.71 15.66 74.72 9.56 120.08 14.23 222.19 17.27 184.42 15.65 246.54 35.61 291.10 43.07 193.75 60.92 239.17 62.77
308.47 90.98 350.91 62.65 462.25 61.13 506.67 106.89 498.34 356.61 483.09 566.81 813.57 491.02 799.84 712.40 880.28 689.39
444.52 43.01 257.69 43.06 496.94 51.78 525.79 101.11 479.55 272.53 522.47 339.77 474.06 329.84 445.27 351.46 453.48 375.04
71.28 4.41 45.47 17.77 108.24 36.73 81.99 51.30 49.57 101.95 51.39 157.85 69.47 153.89 63.08 169.44 75.32 202.81
132.24 28.16 62.03 36.75 122.38 31.83 124.99 37.45 75.11 69.64 98.88 70.66 97.56 62.68 53.64 101.26 39.54 103.36
144.27 6.85 92.57 29.08 151.63 16.50 138.20 51.99 100.76 77.74 99.86 92.26 120.98 112.94 99.12 168.74 72.35 147.24
5.31 0.17 3.38 1.48 14.09 10.65 9.91 19.73 20.64 16.35 29.43 5.16 22.67 12.24 3.00 35.47 20.36 1.70
37.00 0.40 37.50 3.13 61.25 0.41 50.71 7.36 29.50 24.54 26.44 12.13 23.25 13.07 15.18 29.11 12.84 33.31
145.03 8.69 140.81 18.45 168.96 14.01 221.22 34.27 207.67 435.43 405.21 290.56 390.15 113.66 286.10 126.56 135.56 145.70
66.44 0.00 99.42 0.14 103.38 0.52 94.29 3.52 83.77 6.63 37.07 56.19 46.67 42.18 56.34 38.81 40.35 72.29
109.73 25.88 106.70 35.29 145.79 31.52 164.89 57.60 130.20 176.99 98.52 159.82 75.49 153.33 101.88 264.94 107.27 314.64
709.76 51.95 716.87 168.75 1,235.06 145.16 1,153.91 387.13 1,243.11 794.37 1,390.89 1,164.25 1,715.34 1,368.47 1,564.02 1,823.88 1,381.01 2,231.53
118.34 109.07 154.95 78.83 219.32 114.96 155.09 133.32 189.89 159.43 225.77 246.75 296.66 374.77 306.10 538.27 303.39 805.32
465.50 35.27 316.53 70.97 497.19 65.14 601.71 157.47 446.36 326.58 673.91 383.17 512.16 512.97 631.75 723.88 771.36 1,155.14
