financial year 2013/14 - sse irelandireland.sse.com/media/8713/sse eia ireland fy14 20150601.pdf ·...
TRANSCRIPT

SSE’s Economic Contributionto the Republic of Ireland
Financial Year 2013/14
January 2015

Contents
Foreword 3
Executive summary 4
1 Introduction 5
2 SSE’s contribution to Irish GDP and employment 8
3 Appendix 14
Front cover picture source: SSE

Draft
Foreword
The core purpose of SSE Airtricity is to provide the energy that people andbusinesses need to thrive and prosper across the island of Ireland. We have aresponsibility to ensure this need is met in a reliable and sustainable way, bothnow and for the long term. While I am clear that is our mission and purpose, Ialso want to be sure that we are achieving it.
So the strategy for SSE Airtricity includes a determination to increasetransparency of the impacts our business activities make on society, theenvironment and the economy. If we know what the impacts are then we can domore to maximise positive impacts whilst minimising any adverse outcomes. Inorder to progress further in this journey we’ve asked PwC to undertake economiccontribution studies across the SSE business– across the different regions,countries and business segments which enable our business to operatesuccessfully within the UK and Ireland.
SSE’s operations in Ireland are significant and growing. We directly employ 800people and made a direct contribution of €183m to the Irish economy in financialyear 2014. And, of course, this direct contribution generates a great deal ofadditional economic activity in the wider Irish economy. This report tells us thata further 5,150 jobs are supported and €773m contributed to the Irish economythrough our supply chain and employee spending. This means that SSE and SSEAirtricity’s business operations supported the equivalent of 0.3% of total Irishemployment and 0.6% of Irish GDP in FY14.
I have always understood that SSE’s impacts are not simply about the creation ofjobs and wealth. There are many areas where SSE’s business activities generate animpact on both society and the environment. By starting to understand what oureconomic impacts are we can better define how our business can increasingly be aforce for good. Ultimately that’s SSE’s aim: to be responsible in all that we do, sowe can make a positive impact on people’s lives whilst doing so. This new report issimply the next step in our journey to deliver exactly that.
Gregor Alexander, Finance Director, SSE
PwC 3

Draft
Executive summary
Purpose
This is a PwC study commissioned by SSE plc, amajor energy company operating in the UK andRepublic of Ireland (“Ireland”). It is an update of areport we produced for SSE in July 2014, whichassessed the company’s economic and employmentcontributions in financial years 2011/12 (FY12) and2012/13 (FY13). The purpose of the current reportis to continue building awareness within SSE andamongst its stakeholders of the value that thecompany brings to society.
Scope of analysis
This study covers the economic contribution bySSE Group in Ireland. The indicators we haveassessed are SSE’s contribution to Irish GDP andemployment. These indicators are measured ingross terms and do not take into account whatwould have happened in the absence of SSE. Othereconomic, social and environmental impacts areoutside of the scope of the study.
Methodology
To estimate SSE’s direct contribution to the Irisheconomy, we used the company’s financialaccounts and other management information.
We applied economic input-output modelling toSSE’s financial and procurement data to estimateSSE’s contribution to GDP and jobs in SSE’s Irishsupply chain.
Key findings – in FY14 SSE:
• Contributed €956m to Irish GDP (equivalentto 0.6% of Irish GDP), bringing its totalcontribution over the past three years to€2,502m (in FY14 prices).
• Supported 5,950 jobs in Ireland (equivalentto 0.3% of total employment in the country),resulting in a yearly average of 5,670 jobssupported over the past three years.
• SSE’s average employee productivity of€227,800 is 2.8 times the national average.
• For every direct SSE employee in Ireland, SSEsupports another 6.4 Irish jobs.
4PwC

Introduction
PwC 5

Draft
Purpose and scope of this study
In July 2014 we produced a study for SSE which estimated the company’seconomic contribution to Ireland in FY12 and FY13. The report covered estimatesof SSE’s gross contribution to the Irish GDP and employment – both directly andindirectly in its supply chain and the wider economy. The report’s aim was tosupport SSE and its stakeholders in their understanding of the economicsignificance of the company for Ireland.
After the publication of the first report, SSE asked us to update the analysis toestimate its contribution to the Irish economy in FY14 (see table 1.1). The analysiscovers the contribution of the entire SSE Group to the Irish economy through itsprocurement of goods and services. The SSE Group consolidates SSE Airtricity, itsbusiness in the Island of Ireland, and the rest of its UK business. It excludesjointly controlled entities in which SSE has a minority share.
This report presents the results for FY14 and incorporates those from theprevious report to show SSE’s contribution to the economy over the past threeyears.
Limitations
This study of SSE’s contribution to GDP and employment represents a grossanalysis and does not take into account the extent to which part of thesecontributions might have happened anyway in the absence of SSE. The currentreport does not look at any other economic, social and environmental impactscreated by SSE’s direct operations or value chains. Indirect and inducedcontributions are estimated using an input-output model. Data used for thisanalysis were provided by SSE and have not been audited by PwC.
6PwC
Section 1 – Introduction
Note: This report has been prepared solely for the benefit of SSE. The information contained in this report should not be relied on by anyone else. For a full disclaimer, please refer to the back cover of this report.
Indicator covered in thestudy Measured as Methodology
Contributionto GDP
Gross Value Added (GVA),which is the company-levelequivalent of GDP
Input-Outputmodelling – see theappendix for a moredetailed discussion
Employment supported Headcount Input-Outputmodelling
Table 1.1: Indicators assessed for this report

Draft
About SSE
SSE plc (‘SSE’ or ‘the company’) is one of the largest companies in the UK, part ofthe FTSE100, and the only major energy provider which is both UKheadquartered and operates exclusively in the UK and Republic of Ireland. Itscore purpose is to “provide the energy people need in a reliable and sustainableway”1 through its involvement predominantly in the generation, transmission,distribution and supply of electricity. SSE’s business is organised into threesegments: Networks, Wholesale and Retail. In FY14, SSE’s reported profit beforetax was £575m and it employed a total of 19,894 people across the UK andRepublic of Ireland.
7PwC
Section 1 – Introduction
Table 1.2: SSE’s business in the Republic of Ireland
SSE in Ireland
• Revenue: €1,097 m
• Profit before tax and interest: €104m
• Employment: 800 employees2
Wholesale
Generation of electricity and energy portfolio management:
• Total electricity generation capacity of over 1.52 GW
• 30% of total capacity is from renewable sources (wind)
• Owns and operates Meentycat Wind Farm in Donegal, the largest wind farm inIreland with 84MW capacity
Retail
Supply of electricity and gas to business and household customers:
• 500,000 household and business customer accounts throughout the Republic ofIreland
• One single brand in Ireland: SSE Airtricity
Other services
Provides street light services for Ireland’s local authorities:
• SSE Airtricity Utility Solutions maintains 250,000 street lights for 19 local authorities,covering two thirds of all public lighting in Ireland
Source: SSE
Picture source: SSE
1 Source: SSE. 2 Rounded for presentational purposes.

SSE’s contribution to Irish GDP andemployment
PwC 8

Draft
Measuring economic contribution
We have estimated SSE’s economic contribution to Ireland using two indicators:
• Contribution to GDP: Measured in terms of Gross Value Added (GVA)
• Employment supported: Expressed as number of jobs (headcount)
GVA is a measure of the value generated in the economy and represents thedifference between the value of goods and services sold and the goods andservices used as an input to their production. Hence, it is the company-levelequivalent of GDP: adding up the GVA of all individual companies in the economyis equivalent to a country’s GDP.3
GVA is distributed as profits (before interest, taxes, depreciation andamortisation) and wages. SSE’s direct contribution to GDP can, therefore, becalculated from its financial statements by adding earnings before interest, tax,depreciation and amortisation (EBITDA) and employee compensation.
The contribution to GDP and employment is divided into three tiers:
1. Direct contribution: The increase in GDP and employment as a result ofthe supply of SSE’s goods and services;
2. Supply chain spend contribution (indirect): The increase in GDP andemployment from SSE’s demand for goods and services from its suppliers andtheir suppliers. What is often known as the ‘indirect contribution’;
3. Employee spend contribution (induced): The increase in GDP andemployment in the wider economy as a result of wages being spent by theemployees of SSE and its suppliers. What is often known as the ‘inducedcontribution.’
Both the supply chain and employee spend contributions to GDP andemployment have been estimated using economic input-output modelling. Forthis we have collected data from SSE on how much it spends on goods andservices for both its operating and capital expenditure.
A more detailed explanation of our methodology can be found in the appendix ofthis report.
Figure 2.1: The relation between the three levels ofeconomic contribution
Section 2 – SSE’s contribution to Irish GDP and employment
Source: PwC3 After adjusting for taxes and subsidies on products, a component of GDP which is notincluded in the calculation of GVA.
9PwC
1
IndirectSupply chain spend
2
Direct
Employment
Gross Value added
Wages Profit
Employment
Gross Value added
Wages Profit
InducedEmployee spend
3
Employment
Gross Value added
Wages Profit
Supplierexpenditure
Employeespending of
wages
Draft
Direct contribution to the Irish economy
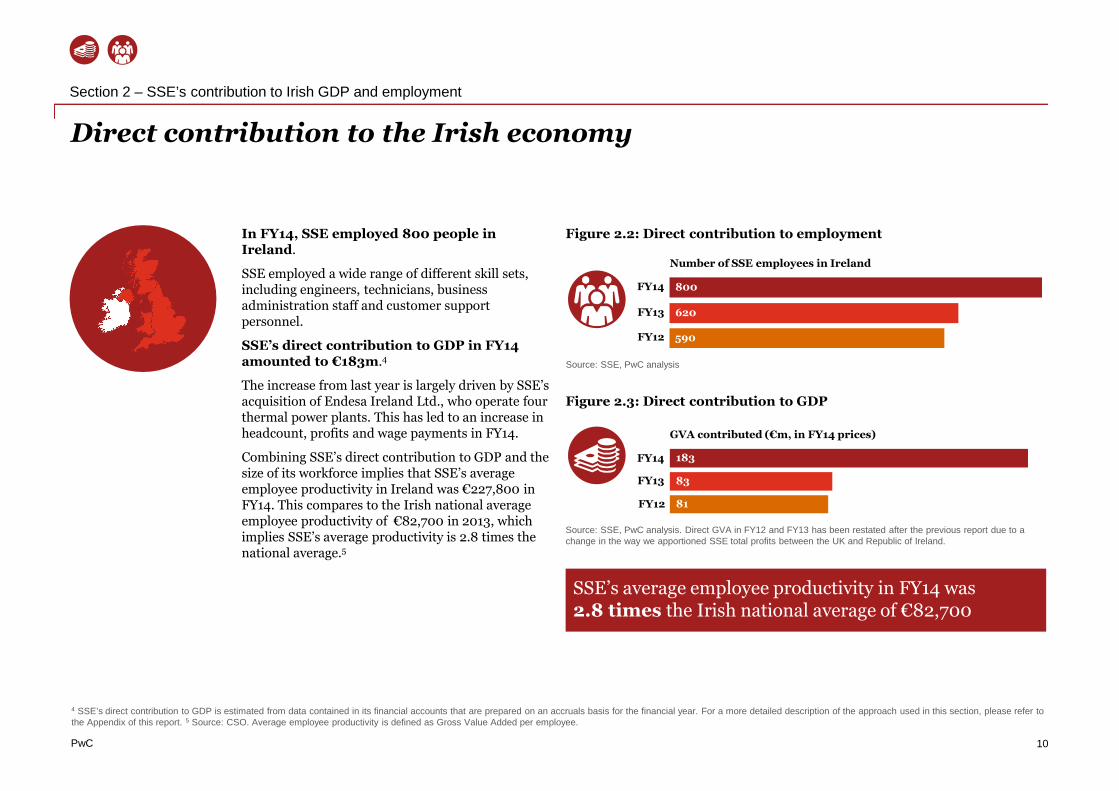
In FY14, SSE employed 800 people inIreland.
SSE employed a wide range of different skill sets,including engineers, technicians, businessadministration staff and customer supportpersonnel.
SSE’s direct contribution to GDP in FY14amounted to €183m.4
The increase from last year is largely driven by SSE’sacquisition of Endesa Ireland Ltd., who operate fourthermal power plants. This has led to an increase inheadcount, profits and wage payments in FY14.
Combining SSE’s direct contribution to GDP and thesize of its workforce implies that SSE’s averageemployee productivity in Ireland was €227,800 inFY14. This compares to the Irish national averageemployee productivity of €82,700 in 2013, whichimplies SSE’s average productivity is 2.8 times thenational average.5
Figure 2.2: Direct contribution to employment
Figure 2.3: Direct contribution to GDP
10
Section 2 – SSE’s contribution to Irish GDP and employment
SSE’s average employee productivity in FY14 was2.8 times the Irish national average of €82,700
4 SSE’s direct contribution to GDP is estimated from data contained in its financial accounts that are prepared on an accruals basis for the financial year. For a more detailed description of the approach used in this section, please refer tothe Appendix of this report. 5 Source: CSO. Average employee productivity is defined as Gross Value Added per employee.
PwC
FY13 83
81FY12
GVA contributed (€m, in FY14 prices)
Source: SSE, PwC analysis. Direct GVA in FY12 and FY13 has been restated after the previous report due to achange in the way we apportioned SSE total profits between the UK and Republic of Ireland.
183FY14
Source: SSE, PwC analysis
639FY13 620
590FY12
Number of SSE employees in Ireland
639FY14 800

Draft
FY14 36.4
Employee compensation
An important component of SSE’s direct contributionto GDP is employee compensation, which includeswages and salaries, social security costs, pensioncontributions and share-based remunerations.
In FY14, SSE paid out a total of €36.4m in totalemployee compensation in Ireland. Of this €31.5mwas paid as wages and salaries. Dividing this equallybetween SSE’s employees in Ireland shows that SSEpaid an average wage of €39,200 that year.
SSE’s average wage was above the Irish mean averageof €35,800 in 2013 while it is below that of theelectricity, water supply and waste managementsector.
Figure 2.4: Total employee compensation
Section 2 – SSE’s contribution to Irish GDP and employment
FY13 29.7
FY12 20.9
Employee compensation (€m, in FY14 prices)
Figure 2.5: Comparing SSE’s mean average wage against Irishmean averages in FY14
Electricity , gas, steam and air conditioning
SSE
Ireland
Administrative and support service
52,900
39,200
35,800
25,300
Source: SSE, PwC analysis
Source: CSO, SSE, PwC analysis
11PwC

Draft
Total contribution to Irish GDP
PwC 12
Section 2 – SSE’s contribution to Irish GDP and employment
Table 2.1: Key sectors in terms of supply chain GDP contribution
SectorGVA contributed (€m)
FY14
Electricity and gas supply 474
Mining, quarrying, and extraction 26
Wholesale trade 22
Repair/installation of machinery & equipment 19
Financial intermediation services 12
All other sectors 91
Total 644
Source: SSE, PwC analysis.
6 We have inflated results from the FY13 report using the GDP deflator. As a result, the values appear slightly higher than reported in our May 2014 report, as they are expressed in FY14 prices rather than current prices.7 Source: CSO. GDP measured at factor cost.
In FY14, the sector benefitting most from SSE’s supply chain spendwas the electricity and gas supply sector, where we estimate SSEsustained €474m of GVA. This reflects SSE’s core role in electricityand gas supply in Ireland, as well as its payments to grid operatorssuch as EirGrid, ESB Networks and Gas Networks Ireland.
The second largest beneficiary from SSE’s supply chain spending wasthe mining, quarrying and extraction sector with €26m, due in partto procurement of energy and fuel in Ireland.
We estimate that, in FY14, SSE’s total contribution to Irish GDPwas €956m. This is equivalent to 0.6% of Irish GDP in 2013. Thisbrings SSE’s total contribution between FY12 and FY14 to€2,502m when expressed in FY14 prices.6 On average, 19% of thiscontribution was from SSE’s direct operations, 67% resulted fromits supply chain spend and 14% resulted from spending by itsemployees and those of its suppliers. The supply chaincontribution is partially a result of spending in Ireland by SSE’sUK business.
Source: SSE, PwC analysis
Figure 2.6: Total contribution to GDP(€m, in FY14 prices)
183 644 129 956
FY14
FY12738
FY13808
FY14956
2,502
Total over past three years
Direct Supply chain Employee spend
Equivalent to 0.6% ofIreland’s GDP in 20137
Draft
Total contribution to Irish employment
PwC 13
Section 2 – SSE’s contribution to Irish GDP and employment
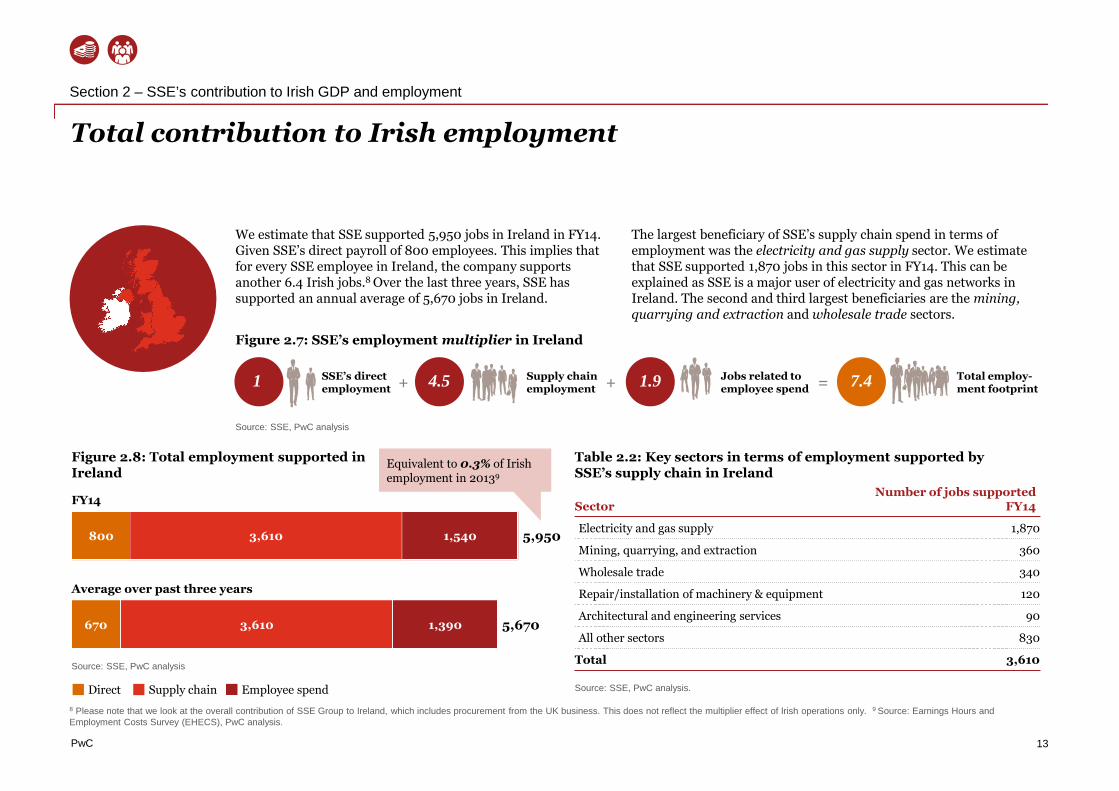
Table 2.2: Key sectors in terms of employment supported bySSE’s supply chain in Ireland
SectorNumber of jobs supported
FY14
Electricity and gas supply 1,870
Mining, quarrying, and extraction 360
Wholesale trade 340
Repair/installation of machinery & equipment 120
Architectural and engineering services 90
All other sectors 830
Total 3,610
Source: SSE, PwC analysis.
Source: SSE, PwC analysis
+1 SSE’s directemployment
4.5 Supply chainemployment
1.9+Jobs related toemployee spend
7.4 Total employ-ment footprint=
Figure 2.7: SSE’s employment multiplier in Ireland
8 Please note that we look at the overall contribution of SSE Group to Ireland, which includes procurement from the UK business. This does not reflect the multiplier effect of Irish operations only. 9 Source: Earnings Hours andEmployment Costs Survey (EHECS), PwC analysis.
The largest beneficiary of SSE’s supply chain spend in terms ofemployment was the electricity and gas supply sector. We estimatethat SSE supported 1,870 jobs in this sector in FY14. This can beexplained as SSE is a major user of electricity and gas networks inIreland. The second and third largest beneficiaries are the mining,quarrying and extraction and wholesale trade sectors.
We estimate that SSE supported 5,950 jobs in Ireland in FY14.Given SSE’s direct payroll of 800 employees. This implies thatfor every SSE employee in Ireland, the company supportsanother 6.4 Irish jobs.8 Over the last three years, SSE hassupported an annual average of 5,670 jobs in Ireland.
Figure 2.8: Total employment supported inIreland
Source: SSE, PwC analysis
670 3,610 1,390 5,670
Average over past three years
800 3,610 1,540 5,950
FY14
Equivalent to 0.3% of Irishemployment in 20139
Direct Supply chain Employee spend

Appendix
PwC 14

Draft
Appendix: Economic contribution approach (1/4)
Overview
SSE’s economic contribution is defined in terms of its contribution to GDPand employment supported.
Contribution to GDP is measured in terms of Gross Value Added (GVA).GVA is a monetary measure of the value a company adds during its productionprocess. Hence, it is the difference between the price of its products (outputs) andthe price of the inputs it uses in producing these (or intermediate consumption).GVA is an alternative term for GDP at factor cost, which is GDP without taxes andsubsidies on products. As such, GVA is the company-level equivalent of GDP.
The contribution to GDP and employment are estimated at the direct, indirectand induced levels. Direct contribution results from the company’s ownoperations: it includes the people employed directly by a company and theeconomic value the company creates. Indirect contribution is generated in acompany’s supply chain through the procurement of inputs. Induced contributionis generated through wage spend by employees throughout the value chain, botha company’s own employees and those in its supply chain. In the report thesecontributions have been called direct, supply chain spend and employee spend tomake it easier for readers not familiar with economic terminology.
Approach to estimating direct economic contribution
We estimate SSE’s direct contribution to GDP using an income approach fromdata contained in its financial accounts that are prepared on an accruals basis forthe financial year (rather than relating to the cash spent during the year). Thefollowing equation is used:
Direct contribution to GDP= profit before interest and taxation + employee costs
+ depreciation + amortisation.
Direct employment is taken directly from SSE’s human resources data, whichcontain information on each employee by country in which he/she is based.
Section 3 – Appendix
15PwC
Draft

Draft
Appendix: Economic contribution approach (2/4)
Approach to estimating indirect and induced economic contribution
Indirect and induced economic contribution are estimated using an Input-Outputmodel. This enables us to understand how industries relate to each other. On thisbasis we estimate how activity by one company stimulates economic activityelsewhere in the economy.
The indirect (or supply chain) contribution is estimated using SSE’s procurementdata. We analysed SSE’s purchase ledger to identify the sectors of the economythe company spends money on in order to purchase inputs. The Input-Outputtable provides information on what the typical business in the supplier’s sectorrequires for producing one unit of output. Equally, we can model the supplier’sinput requirements from other sectors to produce its own unit of output. In thisway we can trace back the input requirements through the entire supply chain,and calculate the total value of production stimulated. This process of onecompany stimulating economic activity in other companies is referred to as themultiplier effect.
In addition to the above, an Input-Output table provides data on the share ofrevenue that constitutes profit and wages for each sector. We can apply this ratioto the total production value stimulated, and hence estimate the total GVA in thesupply chain by sector associated to this. Additional statistics on employmentprovide information on the number of people that work in any particular sector.As we know the output stimulated in each sector, we can estimate the productionvalue to job ratio. We can then apply this to the total production value stimulatedin the supply chain. This allows us to estimate the number of jobs supported inthe supply chain – the indirect employment.
These steps get repeated for calculating the induced contribution, but throughusing wage data to estimate how much production is stimulated in the supplychain that supports the products employees buy, e.g. accommodation, food andentertainment.
Figure A.1: A simplified version of an Input-Output table, the basis foran Input-Output model
16PwC
Section 3 – Appendix Draft

Draft
Appendix: Economic contribution approach (3/4)
Model data sources
The Input-Output models for each geography are based on Input-Output tablesprovided by the relevant statistics offices. Input-Output tables are based on datacollected through business surveys undertaken by national statistics offices on anannual basis. We have combined data from the Input-Output tables withemployment data for the relevant years to obtain employment to output ratios.These have been updated using estimates for labour productivity and inflation toreflect the years of our assessment. It should be noted that this type of adjustmentdoes not sufficiently capture structural changes in the economy that occurbetween the input-output table year and the year of analysis.
Figure A.2: A simplified representation of the relation between SSEand its supply chain (note: hypothetical numbers used below)
Section 3 – Appendix
Source
Input-Output table CSO. Input-Output Tablesfor Ireland, 2010
Employment data CSO. Earnings Hours andEmployment Costs Survey(EHECS)
Inflation IMF World EconomicOutlook database - GDPdeflators
Labour productivity OECD Statistics
Table A.1: Key data sources for our Input-Output model
€100m
(constructioncontractor)
€50m
(financialservices provider)
€20m
(distributionnetwork provider)
€xm
Suppliers financialservices provider
€xm
Suppliers distributionnetwork provider
€xm
Suppliers toconstruction contractor
€xm
Suppliers to this supplier
€xm
Suppliers to this supplier
€xm
Suppliers to this supplier
€170m
SSE plc
17PwC
Draft

Draft
Appendix: Economic contribution approach (4/4)
Key notes and assumptions
• All financial data presented are in FY14 prices, unless indicated otherwise.
• All analysis is done in gross terms and we have not assessed the netcontribution of SSE to the Irish economy.
• Where we have used data directly provided by SSE, we have not audited thedata.
• SSE mapped over 95% of its supplier expenditure to the relevant sector andcountry. We extrapolated the remainder of the expenditure in the sameproportion as the mapped expenditure to obtain total expenditure by sectorand country.
• A significant share of SSE’s purchases is related to commodity trading. Wehave modelled SSE’s net expenditure on energy commodities, as thisrepresents the real contribution of the company to the economy. For financialinstruments we have only modelled the commission paid by SSE.
• SSE is a group of companies. We have excluded any transactions between theindividual companies that make up the group to avoid double countingcontributions.
• Our analysis does not cover jointly controlled entities in which SSE has astake of 50% or less, unless they are suppliers to SSE group in which case theyare treated as any other supplier in the analysis. Jointly controlled entities inwhich SSE has a majority stake are included.
• Our model estimates the total impact of SSE Group in Ireland. Apart from thecontribution of SSE’s operations in Ireland, it also includes the contribution ofits business in the UK through its procurement from Ireland.
• To contextualise the contribution that SSE makes to the Irish economy wehave presented economic data from the CSO and other statistics agencies. Itshould be noted that these data generally refer to calendar years as opposed tofinancial years. We have referred to financial year data as FY[yy] and calendaryear data as 20[yy]. When comparing calendar to financial years, we use 2011for FY12, 2012 for FY13, and 2013 for FY14.
Section 3 – Appendix
18PwC
Draft


.
www.pwc.comThis document has been prepared for and only for SSE Plc in accordance with the terms of our contract dated 17 September 2014. We do not accept or assume anyliability or duty of care for any other purpose or to any other person to whom this report is shown or into whose hands it may come save where expressly agreed byour prior consent in writing.
© 2014 PricewaterhouseCoopers LLP. All rights reserved. In this document, ‘PwC’ refers to PricewaterhouseCoopers LLP (a limited liability partnership in theUnited Kingdom) which is a member firm of PricewaterhouseCoopers International Limited, each member firm of which is a separate legal entity.