financial supplement fourth quarter 2005 - american …€¦ · · 2018-05-21financial supplement...
TRANSCRIPT

This report should be read in conjunction with AIG's Annual Report on Form 10-K for the year ended December 31, 2005 filed with the Securities and Exchange Commission.
American International Group, Inc.
Financial Supplement
Fourth Quarter 2005

American International Group, Inc. Financial Supplement
Table of Contents
Consolidated Consolidated Statement of Income..............................................................................................................................1
Consolidated Statement of Segment Operations.................................................................................................... 2 - 4
Consolidated Balance Sheet ........................................................................................................................................5
Book Value..................................................................................................................................................................6
General Insurance General Insurance Operating Statistics.................................................................................................................. 7 - 9
General Insurance Reconciliation of Net Loss Reserves ...........................................................................................10
Domestic Brokerage Group Insurance Operating Statistics.......................................................................................11
Personal Lines Insurance Operating Statistics ...........................................................................................................12
Mortgage Guaranty (UGC) Insurance Operating Statistics .......................................................................................13
Transatlantic Holdings, Inc. Insurance Operating Statistics ......................................................................................14
Foreign General Insurance Operating Statistics.........................................................................................................15
Foreign General Insurance Gross Premiums Written ................................................................................................16
Life Insurance & Retirement Services Life Insurance & Retirement Services Operating Statistics.......................................................................................17
Domestic Life Insurance & Retirement Services Operating Statistics.......................................................................18
Domestic Life Insurance & Retirement Services Product Statistics ..........................................................................19
Domestic Life Insurance & Retirement Services Other Data ............................................................................ 20 - 21
Foreign Life Insurance & Retirement Services Operating Statistics..........................................................................22
Foreign Life Insurance & Retirement Services Product Statistics .............................................................................23
Foreign Life Insurance & Retirement Services Other Data .......................................................................................24
Life Insurance & Retirement Services Statutory Surplus and Net Income ................................................................25
Financial Services Financial Services Operating Statistics......................................................................................................................26
International Lease Finance Corporation Aircraft Leases, Orders and Options.........................................................27
Asset Management Asset Management Operating Statistics ....................................................................................................................28
Asset Management Other Data..................................................................................................................................29
Other Income (Deductions) - net Other Income (Deductions) - net ...............................................................................................................................30 Investments Cash and Invested Assets by Segment............................................................................................................... 31 - 34
Worldwide Insurance and Asset Management Bond Portfolio Ratings.....................................................................35
Domestic Insurance and Asset Management Bond Portfolio Ratings........................................................................36
Comment on Regulation G........................................................................................................... 37 Notice – Restatement. American International Group, Inc. (AIG) has restated its financial statements for the years ended December 31, 2004, 2003 and 2002, along with 2001 and 2000 for purposes of preparation of the Selected Consolidated Financial Data for 2001 and 2000, and quarterly financial information for 2004 and 2003 and the first three quarters of 2005. AIG, however, did not amend its quarterly report on Form 10-Q for the quarter ended September 30, 2005 because the adjustments were not material to those financial statements. Please see Restated Financial Supplement for details.
American International Group, Inc.
Investor Relations Charlene M. Hamrah, Vice President and Director
(212)770-6293

2005 2004 2005 2004(Restated) (Restated)
Revenues:
Premiums and other considerations $ 17,750 $ 17,190 $ 70,209 $ 66,625Net investment income 5,952 4,815 22,165 18,465Realized capital gains (losses) 252 119 341 44Other revenues (1) 3,438 2,917 16,190 12,532
Total revenues 27,392 25,041 108,905 97,666
Benefits and expenses:
Incurred policy losses and benefits 18,054 16,073 63,711 58,360Insurance acquisition and other operating expenses 9,022 6,670 29,981 24,461
Total benefits and expenses 27,076 22,743 93,692 82,821
Income before income taxes, minority interest and cumulative effect of an accounting change (2) 316 2,298 15,213 14,845
Income taxes (benefits):Current 214 (45) 2,569 2,593Deferred (493) 593 1,689 1,814
Total income tax (279) 548 4,258 4,407
Income before minority interest and cumulative effect of an accounting change 595 1,750 10,955 10,438
Minority interest (151) (138) (478) (455)
Income before cumulative effect of anaccounting change 444 1,612 10,477 9,983
Cumulative effect of an accounting change, net of tax (3) - - - (144)
Net income $ 444 $ 1,612 $ 10,477 $ 9,839
Earnings per common share: Basic $ 0.17 $ 0.62 $ 4.03 $ 3.77Diluted (4) $ 0.17 $ 0.62 $ 3.99 $ 3.73
Average outstanding shares:Basic 2,597 2,601 2,597 2,606Diluted (4) 2,626 2,632 2,627 2,637
Note: (1) Includes the effect of hedging activities that do not qualify for hedge accounting treatment under FAS 133 "Accounting for Derivative Instruments and Hedging Activities", including the related foreign exchange gains and losses.
(2) Includes catastrophe losses of $841 million and $3.280 billion for the three months and twelve months ended December 31, 2005, respectively; and $341 million and $1.155 billion for the three months and twelve months ended December 31, 2004, respectively.
(3) Represents the cumulative effect of an accounting change, net of tax, related to SOP 03-1 "Accounting and Reporting by Insurance Enterprises for Certain Nontraditional Long-Duration Contracts and for Separate Accounts".
(4) Assumes conversion of contingently convertible bonds due to the adoption of EITF Issue No. 04-8 "Accounting Issues Related to Certain Features of Contingently Convertible Debt and the Effect on Diluted Earnings per share."
Three Months Ended December 31, Twelve Months Ended December 31,
American International Group, Inc.Consolidated Statement of Income
(in millions, except per share data)
1

American International Group, Inc.Consolidated Statement of Segment Operations
(in millions, except per share data)
2005 2004 %(Restated) Chg
General insuranceNet premiums written (1) $ 10,126 $ 10,078 0.5 %Net premiums earned (1) 10,303 10,165 1.4Losses and loss expenses incurred (1) (2) 9,729 8,794 10.6Underwriting expenses (1) 2,704 2,500 8.2Underwriting loss (1) (2) (3) (2,130) (1,129) NM Net investment income 969 753 28.7Loss before realized capital gains (losses) (1) (2) (1,161) (376) NM Realized capital gains (losses) 86 46 87.0Operating loss (1) (2) (1,075) (330) NM
Life insurance & retirement services GAAP premiums 7,447 7,025 6.0Deposits and other considerations not included in
revenues under GAAP 8,014 9,266 (13.5)Premiums, deposits and other considerations 15,461 16,291 (5.1)Net investment income 4,983 4,062 22.7Pricing net investment gains (4) 75 49 53.1Income before realized capital gains (losses) 2,332 1,946 19.8Realized capital gains (losses) (4) (169) 290 NM Operating income 2,163 2,236 (3.3)
Financial services Operating income excluding FAS 133 553 650 (14.9)FAS 133 (6) 240 (740) NM Operating income (loss) (7) 793 (90) NM
Asset management Operating income excluding FIN46R and FAS 133 477 480 (0.6)FIN46R 72 48 NM FAS 133 (6) 22 72 NM Operating income 571 600 (4.8)
Other realized capital gains (losses) 260 (266) NM Other income (deductions) - net (9) (2,396) 148 NM
Income before income taxes and minority interest 316 2,298 (86.2)
Income taxes (benefits) (279) 548 NM
Income before minority interest 595 1,750 (66.0)
Minority interest, after tax:Income before realized capital gains (losses) (152) (130) NM Realized capital gains (losses) 1 (8) NM
Net income 444 1,612 (72.5)
Realized capital gains (losses), net of tax (11) 182 123 NM FAS 133 gains (losses), excluding realized capital
gains (losses), net of tax (114) (240) NM Adjusted net income (12) 376 1,729 (78.3)
Effect of settlement charge, net of tax (13) 1,147 53
Effect of General Insurance reserve charge, net of tax (2) 1,186 553
Effect of catastrophe related losses, net of tax 540 217
Per share - diluted (14):Net income 0.17 0.62 (72.6)Adjusted net income (12) 0.14 0.66 (78.8) %Effect of settlement charge, net of tax 0.44 0.02
Effect of General Insurance reserve charge, net of tax 0.45 0.21
Effect of catastrophe related losses, net of tax $ 0.20 $ 0.08
Average outstanding shares - diluted (14) 2,626 2,632
Effective tax rate:Net income - 23.8%Adjusted net income (12) - 25.7%
(See Accompanying Notes on Page 4)
Three Months Ended December 31,
2

American International Group, Inc.Consolidated Statement of Segment Operations
(in millions, except per share data)
2005 2004 %(Restated) Chg
General insuranceNet premiums written (1) $ 41,872 $ 40,623 3.1 %Net premiums earned (1) 40,809 38,537 5.9Losses and loss expenses incurred (1) (2) 33,091 30,357 9.0Underwriting expenses (1) 9,768 8,427 15.9Underwriting loss (1) (2) (3) (2,050) (247) NM Net investment income 4,031 3,196 26.1Income before realized capital gains (losses) (1) (2) 1,981 2,949 (32.8)Realized capital gains (losses) 334 228 46.5Operating income (1) (2) 2,315 3,177 (27.1)
Life insurance & retirement services GAAP premiums 29,400 28,088 4.7Deposits and other considerations not included in
revenues under GAAP 37,048 38,756 (4.4)Premiums, deposits and other considerations 66,448 66,844 (0.6)Net investment income 18,134 15,269 18.8Pricing net investment gains (4) 344 225 52.9Income before realized capital gains (losses) (5) 9,406 8,105 16.1Realized capital gains (losses) (4) (562) (182) NM Operating income (5) 8,844 7,923 11.6
Financial services Operating income excluding FAS 133 2,296 2,329 (1.4)FAS 133 (6) 1,980 (149) NM Operating income (7) 4,276 2,180 96.1
Asset management Operating income excluding FIN46R and FAS 133 1,843 1,617 14.0FIN46R 261 195 NM FAS 133 (6) 149 313 NM Operating income (8) 2,253 2,125 6.0
Other realized capital gains (losses) 225 (227) NM Other income (deductions) - net (9) (2,700) (333) NM Income before income taxes, minority interest and
cumulative effect of an accounting change 15,213 14,845 2.5
Income taxes 4,258 4,407 NM
Income before minority interest and cumulativeeffect of an accounting change 10,955 10,438 5.0
Minority interest, after tax:Income before realized capital gains (losses) (465) (440) NM Realized capital gains (losses) (13) (15) NM
Income before cumulative effect of an accounting change 10,477 9,983 4.9Cumulative effect of an accounting change, net of tax (10) - (144) NM Net income 10,477 9,839 6.5
Realized capital gains (losses), net of tax (11) 201 85 NM FAS 133 gains (losses), excluding realized capital
gains (losses), net of tax 1,530 315 NM Cumulative effect of an accounting change, net of tax (10) - (144) NM Adjusted net income (12) 8,746 9,583 (8.7)
Effect of settlement charge, net of tax (13) 1,147 53
Effect of General Insurance reserve charge, net of tax (2) 1,186 553 Effect of catastrophe related losses, net of tax 2,109 729 Per share - diluted (14):
Net income 3.99 3.73 7.0Adjusted net income (12) 3.33 3.64 (8.5) %
Effect of settlement charge, net of tax 0.44 0.02
Effect of General Insurance reserve charge, net of tax 0.45 0.21
Effect of catastrophe related losses, net of tax $ 0.80 $ 0.27
Average outstanding shares - diluted (14) 2,627 2,637
Effective tax rate:Net income 28.0% 29.7%Adjusted net income (12) 26.8% 29.2%
Return on Equity (15) 12.3% 13.3%
Twelve Months Ended December 31,
(See Accompanying Notes on Page 4)
3
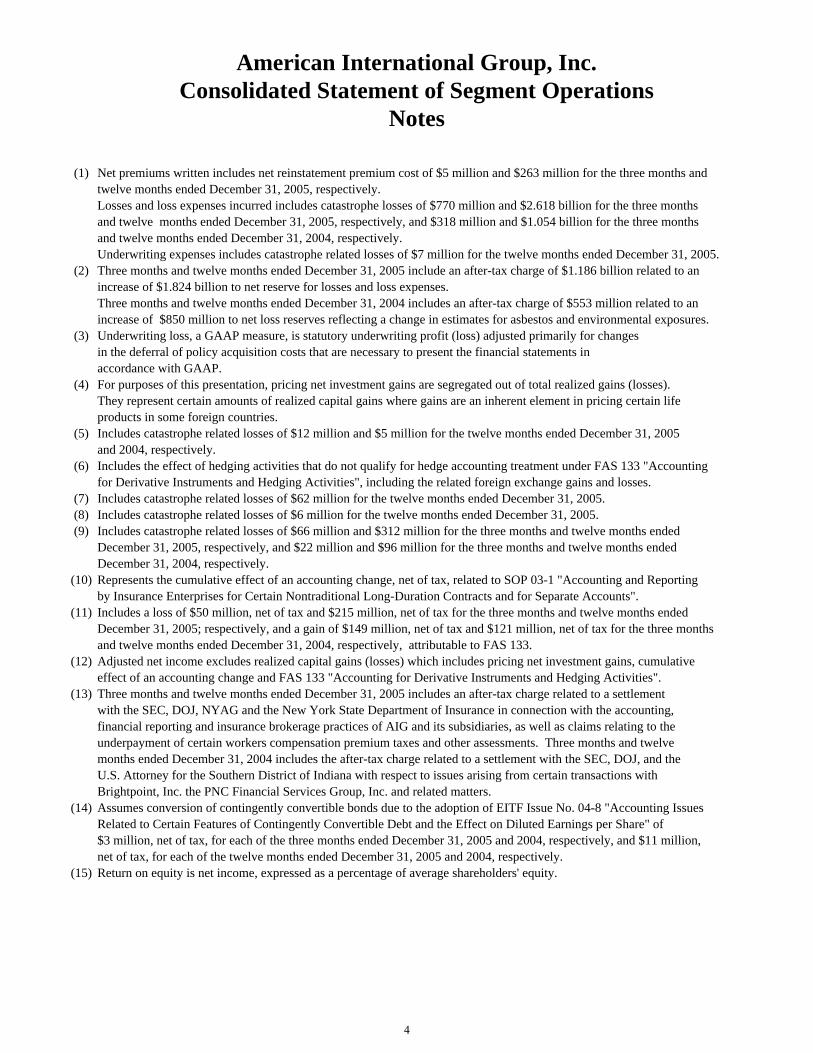
Net premiums written includes net reinstatement premium cost of $5 million and $263 million for the three months and twelve months ended December 31, 2005, respectively.Losses and loss expenses incurred includes catastrophe losses of $770 million and $2.618 billion for the three months and twelve months ended December 31, 2005, respectively, and $318 million and $1.054 billion for the three monthsand twelve months ended December 31, 2004, respectively. Underwriting expenses includes catastrophe related losses of $7 million for the twelve months ended December 31, 2005.Three months and twelve months ended December 31, 2005 include an after-tax charge of $1.186 billion related to an increase of $1.824 billion to net reserve for losses and loss expenses.Three months and twelve months ended December 31, 2004 includes an after-tax charge of $553 million related to an increase of $850 million to net loss reserves reflecting a change in estimates for asbestos and environmental exposures.Underwriting loss, a GAAP measure, is statutory underwriting profit (loss) adjusted primarily for changesin the deferral of policy acquisition costs that are necessary to present the financial statements in accordance with GAAP.For purposes of this presentation, pricing net investment gains are segregated out of total realized gains (losses). They represent certain amounts of realized capital gains where gains are an inherent element in pricing certain life products in some foreign countries. Includes catastrophe related losses of $12 million and $5 million for the twelve months ended December 31, 2005and 2004, respectively.Includes the effect of hedging activities that do not qualify for hedge accounting treatment under FAS 133 "Accountingfor Derivative Instruments and Hedging Activities", including the related foreign exchange gains and losses.Includes catastrophe related losses of $62 million for the twelve months ended December 31, 2005.Includes catastrophe related losses of $6 million for the twelve months ended December 31, 2005.Includes catastrophe related losses of $66 million and $312 million for the three months and twelve months ended December 31, 2005, respectively, and $22 million and $96 million for the three months and twelve months ended December 31, 2004, respectively.Represents the cumulative effect of an accounting change, net of tax, related to SOP 03-1 "Accounting and Reporting by Insurance Enterprises for Certain Nontraditional Long-Duration Contracts and for Separate Accounts".Includes a loss of $50 million, net of tax and $215 million, net of tax for the three months and twelve months ended December 31, 2005; respectively, and a gain of $149 million, net of tax and $121 million, net of tax for the three months and twelve months ended December 31, 2004, respectively, attributable to FAS 133. Adjusted net income excludes realized capital gains (losses) which includes pricing net investment gains, cumulative effect of an accounting change and FAS 133 "Accounting for Derivative Instruments and Hedging Activities".Three months and twelve months ended December 31, 2005 includes an after-tax charge related to a settlementwith the SEC, DOJ, NYAG and the New York State Department of Insurance in connection with the accounting,financial reporting and insurance brokerage practices of AIG and its subsidiaries, as well as claims relating to the underpayment of certain workers compensation premium taxes and other assessments. Three months and twelve months ended December 31, 2004 includes the after-tax charge related to a settlement with the SEC, DOJ, and the U.S. Attorney for the Southern District of Indiana with respect to issues arising from certain transactions with Brightpoint, Inc. the PNC Financial Services Group, Inc. and related matters.Assumes conversion of contingently convertible bonds due to the adoption of EITF Issue No. 04-8 "Accounting Issues Related to Certain Features of Contingently Convertible Debt and the Effect on Diluted Earnings per Share" of $3 million, net of tax, for each of the three months ended December 31, 2005 and 2004, respectively, and $11 million,net of tax, for each of the twelve months ended December 31, 2005 and 2004, respectively.Return on equity is net income, expressed as a percentage of average shareholders' equity.
(9)
(11)
American International Group, Inc.Consolidated Statement of Segment Operations
Notes
(4)
(3)
(2)
(15)
(14)
(12)
(1)
(5)
(6)
(13)
(10)
(7)(8)
4

American International Group, Inc.Consolidated Balance Sheet
(in millions)December 31, December 31,
2005 2004Assets: (Restated)
Investments and financial services assets:Fixed maturities $ 385,680 $ 365,677Equity securities 23,588 17,706Mortgage loans on real estate, policy, collateral and guaranteed loans - net of allowance 24,909 23,484Financial services assets:
Flight equipment primarily under operating leases, net of accumulated depreciation 36,245 32,130Securities available for sale, at market value 37,511 31,225Trading securities, at market value 6,499 2,746Spot commodities 92 534Unrealized gain on swaps, options and forward transactions 18,695 22,670Trading assets 1,204 3,433Securities purchased under agreements to resell, at contract value 14,547 26,272Finance receivables, net of allowance 27,995 23,574
Securities lending collateral, at market (which approximates cost) 59,471 49,169Other invested assets 27,267 23,559Short-term investments, at cost (approximates market value) 15,342 16,102
Total investments and financial services assets 679,045 638,2811,897 2,009
Investment income due and accrued 5,727 5,556 Premiums and insurance balances receivable, net of allowance 15,333 15,622 Reinsurance assets, net of allowance 24,978 19,613 Deferred policy acquisition costs 33,248 29,817 Investments in partially owned companies 1,158 1,495 Real estate and other fixed assets, net of accumulated depreciation 7,446 6,192 Separate and variable accounts 63,797 57,741 Goodwill 8,093 8,556 Income taxes receivable - current 319 138 Other assets 12,329 16,125
Total assets $ 853,370 $ 801,145Liabilities:
Reserve for losses and loss expenses $ 77,169 $ 61,878Reserve for unearned premiums 24,243 23,400Future policy benefits for life and accident and health insurance contracts 108,807 104,740Policyholders' contract deposits 227,027 216,474Other policyholders' funds 10,870 10,280Reserve for commissions, expenses and taxes 4,769 4,629Insurance balances payable 3,564 3,661Funds held by companies under reinsurance treaties 4,174 3,404Income taxes payable - deferred 6,607 6,588 Financial services liabilities:
Borrowings under obligations of guaranteed investment agreements 20,811 18,919Securities sold under agreements to repurchase, at contract value 11,047 23,581Trading liabilities 2,546 2,503Securities and spot commodities sold but not yet purchased, at market value 5,975 5,404Unrealized loss on swaps, options and forward transactions 12,740 15,985Trust deposits and deposits due to banks and other depositors 4,877 4,248Commercial paper 6,514 6,724Notes, bonds, loans and mortgages payable 71,313 61,296
Commercial paper 2,694 2,969Notes, bonds, loans and mortgages payable 7,126 5,502Liabilities connected to trust preferred stock 1,391 1,489Separate and variable accounts 63,797 57,741Minority interest 5,124 4,831Securities lending payable 60,409 49,972Other liabilities 23,273 25,055
Total liabilities 766,867 721,273Preferred shareholders' equity in subsidiary companies 186 199
Shareholders' equity:Common stock 6,878 6,878Additional paid-in capital 2,339 2,094Unrealized appreciation of investments, net of taxes 8,348 10,326Cash flow hedging activities, net of taxes (25) (53)Foreign currency translation adjustments, net of taxes (1,242) (683)Foreign currency translation adjustments hedging, net of taxes 1 (18)Retirement plan liabilities adjustment, net of taxes (115) (128)Retained earnings 72,330 63,468Treasury stock, at cost (2,197) (2,211)
Total shareholders' equity 86,317 79,673
Total liabilities, preferred shareholders' equity in subsidiary companies and shareholders' equity $ 853,370 $ 801,145
Cash
5

Shareholders'Book Value Equityexcluding Shareholders' excluding
Book Value URA Equity (1) URA (2)Per Share (1) Per Share (2) (in millions) (in millions)
December 31, 2000 $ 17.25 $ 17.28 $ 45,239 $ 45,320December 31, 2001 19.07 18.27 49,881 47,790December 31, 2002 22.34 19.99 58,303 52,154
March 31, 2003 23.56 20.61 61,462 53,750June 30, 2003 25.98 21.44 67,774 55,933September 30, 2003 25.54 22.17 66,612 57,807December 31, 2003 26.54 23.06 69,230 60,159
March 31, 2004 28.73 24.05 74,921 62,739June 30, 2004 27.08 25.07 70,544 65,304September 30, 2004 29.34 26.01 76,427 67,747December 31, 2004 30.69 26.71 79,673 69,347
March 31, 2005 31.45 27.96 81,608 72,561June 30, 2005 34.15 29.48 88,613 76,509September 30, 2005 34.03 29.95 88,333 77,729December 31, 2005 $ 33.24 (3) $ 30.03 $ 86,317 $ 77,969
Note: (1) Book values and shareholders' equity prior to December 31, 2005 have been restated.
(2) Unrealized appreciation of investments (URA), net of taxes.
(3) Total shareholders' equity
Total common shares issued - treasury shares
= $33.24
$86,316,906,958
2,751,327,476 - 154,680,704
American International Group, Inc.Book Value per Share
6

2005 2004 2005 2004(Restated) % Chg (Restated) % Chg
Gross premiums written $ 11,743 $ 12,087 (2.8) % $ 52,725 $ 52,046 1.3 %Ceded premiums written 1,617 2,009 (19.5) 10,853 11,423 (5.0)Net premiums written (1) 10,126 10,078 0.5 41,872 40,623 3.1Net premiums earned (1) 10,303 10,165 1.4 40,809 38,537 5.9
Paid losses 6,038 5,427 11.3 22,241 19,855 12.0Change in net loss reserves 3,417 3,800 (10.1) 10,222 11,026 (7.3)Less foreign exchange effect (274) 433 NM (628) 524 NM
Losses and loss expenses incurred (1)(2)(3)(4) 9,72 8,79 10. 33,09 30,35 9.0Statutory underwriting expenses (1) (5) 2,730 2,373 15.0 9,883 8,744 13.0Underwriting loss (1)(2)(3)(4)(5)(6) (2,130) (1,129) NM (2,050) (247) NMNet investment income (7)
Interest and dividends 924 727 27.1 3,388 2,651 27.8Partnership income 88 108 (18.5) 784 708 10.7Other investment income (8) 113 79 43.0 349 305 14.4Investment expense (156) (161) NM (490) (468) NM
Total 969 753 28.7 4,031 3,196 26.1Operating income (loss) before realized
capital gains (losses) (1) (2) (3) (4) (5) (7) (1,161) (376) NM 1,981 2,949 (32.8)Realized capital gains (losses) (7) 86 46 87.0 334 228 46.5Operating income (loss) (1)(2)(3)(4)(5)(7) $ (1,075) $ (330) NM % $ 2,315 $ 3,177 (27.1)Net loss and loss expense reserve $ 57,476 $ 47,254 21.6 %Underwriting ratios:
As reportedLoss ratio (1) (2) (3) (4) 94.43 86.52 81.09 78.78Expense ratio (1) (5) 26.96 23.54 23.60 21.52Combined ratio 121.39 110.06 104.69 100.30
Excluding catastrophe lossesLoss ratio (1) (2) (3) (4) 86.91 83.39 74.19 76.04Expense ratio (1) (5) 26.95 23.54 23.44 21.52Combined ratio 113.86 106.93 97.63 97.56
Excluding catastrophe losses and reserve charge
Loss ratio (1) (2) (3) (4) 69.21 75.03 69.75 73.83Expense ratio (1) (5) 26.95 23.54 23.44 21.52Combined ratio 96.16 98.57 93.19 95.35
Foreign exchange impact on growth of worldwide net premiums written:Growth in original currency 1.2 % 2.6 %Foreign exchange impact (0.7) 0.5 Growth as reported in U.S. $ 0.5 % 3.1 %
Note: (1) Net premiums written includes net reinstatement premium cost of $5 million and $263 million for the three months andtwelve months ended December 31, 2005, respectively. Losses and loss expenses incurred includes catastrophe lossesof $770 million and $2.618 billion for the three months and twelve months ended December 31, 2005, respectively, and$318 million and $1.054 billion for the three months and twelve months ended December 31, 2004, respectively. Statutory underwriting expenses includes catastrophe related losses of $7 million for the twelve months endedDecember 31, 2005.
(2) Includes $1.824 billion reserve charge increase for both the three months and twelve months ended December 31, 2005. Losses and loss expenses incurred includes a charge of $850 million reflecting the change in estimate for asbestos andenvironmental exposures for both the three months and twelve months ended December 31, 2004.
(3) Includes an increase of $232 million reflecting a change in estimate for salvage and subrogaton recoveries for boththe three months and twelve months ended December 31, 2004.
(4) Includes $40 million and $197 million of additional Domestic Brokerage Group losses incurred resulting from increasedlabor and material costs related to the 2004 Florida hurricanes in the three months and twelve months ended December 31, 2005, respectively.
(5) Includes $291 million of Domestic Brokerage Group expenses related to changes in estimates for uncollectible reinsuranceand other premium balances for both the three months and twelve months ended December 31, 2005, and $100 millionof accrued expenses in connection with certain workers compensation insurance policies written between 1985 and 1996for the twelve months ended December 31, 2005. These expenses increased the expense and combined ratios by 2.87and 0.93 in the three months and twelve months ended December 31, 2005, respectively
(6) Underwriting loss, a GAAP measure, is statutory underwriting profit (loss) adjusted primarily for changes in thedeferral of policy acquisition costs that are necessary to present the financial statements in accordance with GAAP.
(7) Total may not equal the sum of the individual group totals due to consolidating eliminations(8) Other investment income is comprised principally of real estate income, changes in market value associated
with trading portfolios and income from securities lending.
American International Group, Inc.General Insurance Operating Statistics
(dollars in millions)
Three Months Ended December 31, Twelve Months Ended December 31,
7

2005 2004 2005 2004(Restated) % Chg (Restated) % Chg
Gross premiums written $ 11,743 $ 12,087 (2.8) % $ 52,725 $ 52,046 1.3 %Ceded premiums written 1,612 2,009 (19.8) 10,590 11,423 (7.3)Net premiums written (1) 10,131 10,078 0.5 42,135 40,623 3.7Net premiums earned (1) 10,308 10,165 1.4 41,072 38,537 6.6Losses and loss expenses incurred (1)(2)(3)(4) 8,959 8,476 5.7 30,473 29,303 4.0Statutory underwriting expenses (1) (5) 2,730 2,373 15.0 9,876 8,744 12.9Underwriting profit (loss) (1)(2)(3)(4)(5)(6) (1,355) (811) NM 838 807 3.8Net investment income
Interest and dividends 924 727 27.1 3,388 2,651 27.8Partnership income 88 108 (18.5) 784 708 10.7Other investment income (7) 113 79 43.0 349 305 14.4Investment expense (156) (161) NM (490) (468) NM
Total 969 753 28.7 4,031 3,196 26.1Operating income (loss) before realized
capital gains (losses) (1) (2) (3) (4) (5) (386) (58) NM 4,869 4,003 21.6Realized capital gains (losses) 86 46 87.0 334 228 46.5Operating income (loss) (1) (2) (3) (4) (5) $ (300) $ (12) NM % $ 5,203 $ 4,231 23.0Net loss and loss expense reserve $ 54,858 $ 46,200 18.7 %
Underwriting ratios:Excluding catastrophe losses
Loss ratio (1) (2) (3) (4) 86.91 83.39 74.19 76.04Expense ratio (1) (5) 26.95 23.54 23.44 21.52Combined ratio 113.86 106.93 97.63 97.56
Excluding catastrophe losses and reserve charge
Loss ratio (1) (2) (3) (4) 69.21 75.03 69.75 73.83Expense ratio (1) (5) 26.95 23.54 23.44 21.52Combined ratio 96.16 98.57 93.19 95.35
Foreign exchange impact on growth of worldwide net premiums written:Growth in original currency 1.2 % 3.2 %Foreign exchange impact (0.7) 0.5 Growth as reported in U.S. $ 0.5 % 3.7 %
Note: (1) Net premiums written excludes net reinstatement premium cost of $5 million and $263 million for the three months and twelve months ended December 31, 2005, respectively. Losses and loss expenses incurred excludes catastrophe losses of $770 million and $2.618 billion for the three months and twelve months ended December 31, 2005, respectively, and $318 million and $1.054 billion for the three months and twelve months ended December 31, 2004, respectively. Statutory underwriting expenses excludes catastrophe related losses of $7 million for the twelve months ended December 31, 2005.
(2) Includes $1.824 billion reserve charge increase for both the three months and twelve months ended December 31, 2005. Losses and loss expenses incurred includes a charge of $850 million reflecting the change in estimate for asbestos and environmental exposures for both the three months and twelve months ended December 31, 2004.
(3) Includes an increase of $232 million reflecting a change in estimate for salvage and subrogaton recoveries for both the three months and twelve months ended December 31, 2004.
(4) Includes $40 million and $197 million of additional Domestic Brokerage Group losses incurred resulting from increasedlabor and material costs related to the 2004 Florida hurricanes in the three months and twelve months ended December 31, 2005, respectively.
(5) Includes $291 million of Domestic Brokerage Group expenses related to changes in estimates for uncollectible reinsurance and other premium balances for both the three months and twelve months ended December 31, 2005, and $100 million of accrued expenses in connection with certain workers compensation insurance policies written between 1985 and 1996 for the twelve months ended December 31, 2005. These expenses increased the expense and combined ratios by 2.87 and 0.93 in the three months and twelve months ended December 31, 2005, respectively.
(6) Underwriting profit (loss), a GAAP measure, is statutory underwriting profit (loss) adjusted primarily for changes in thedeferral of policy acquisition costs that are necessary to present the financial statements in accordance with GAAP.
(7) Other investment income is comprised principally of real estate income, changes in market value associated with trading portfolios and income from securities lending.
American International Group, Inc.General Insurance Operating Statistics
(dollars in millions)
Three Months Ended December 31, Twelve Months Ended December 31,
Excluding Catastrophe Losses
8

2005 2004 2005 2004(Restated) % Chg (Restated) % Chg
Gross premiums written $ 11,743 $ 12,087 (2.8) % $ 52,725 $ 52,046 1.3 %Ceded premiums written 1,612 2,009 (19.8) 10,590 11,423 (7.3)Net premiums written (1) 10,131 10,078 0.5 42,135 40,623 3.7Net premiums earned (1) 10,308 10,165 1.4 41,072 38,537 6.6Losses and loss expenses incurred (1)(2)(3)(4) 7,135 7,626 (6.4) 28,649 28,453 0.7Statutory underwriting expenses (1) (5) 2,730 2,373 15.0 9,876 8,744 12.9Underwriting loss (1)(2)(3)(4)(5)(6) 469 39 NM 2,662 1,657 60.7Net investment income
Interest and dividends 924 727 27.1 3,388 2,651 27.8Partnership income 88 108 (18.5) 784 708 10.7Other investment income (7) 113 79 43.0 349 305 14.4Investment expense (156) (161) NM (490) (468) NM
Total 969 753 28.7 4,031 3,196 26.1Operating income before realized
capital gains (losses) (1) (2) (3) (4) (5) 1,438 792 81.6 6,693 4,853 37.9Realized capital gains (losses) 86 46 87.0 334 228 46.5Operating income (1) (2) (3) (4) (5) $ 1,524 $ 838 81.9 % $ 7,027 $ 5,081 38.3Net loss and loss expense reserve $ 53,034 $ 45,350 16.9 %
Underwriting ratios:Excluding catastrophe losses and reserve charge
Loss ratio (1) (2) (3) (4) 69.21 75.03 69.75 73.83Expense ratio (1) (5) 26.95 23.54 23.44 21.52Combined ratio 96.16 98.57 93.19 95.35
Foreign exchange impact on growth of worldwide net premiums written:Growth in original currency 1.2 % 3.2 %Foreign exchange impact (0.7) 0.5Growth as reported in U.S. $ 0.5 % 3.7 %
Note: (1) Net premiums written excludes net reinstatement premium cost of $5 million and $263 million for the three months and twelve months ended December 31, 2005, respectively. Losses and loss expenses incurred excludes catastrophe losses of $770 million and $2.618 billion for the three months and twelve months ended December 31, 2005, respectively, and $318 million and $1.054 billion for the three months and twelve months ended December 31, 2004, respectively. Statutory underwriting expenses excludes catastrophe related losses of $7 million for the twelve months ended December 31, 2005.
(2) Excludes $1.824 billion reserve charge increase for both the three months and twelve months ended December 31, 2005. Losses and loss expenses incurred excludes a charge of $850 million reflecting the change in estimate for asbestos and environmental exposures for both the three months and twelve months ended December 31, 2004.
(3) Includes an increase of $232 million reflecting a change in estimate for salvage and subrogaton recoveries for both the three months and twelve months ended December 31, 2004.
(4) Includes $40 million and $197 million of additional Domestic Brokerage Group losses incurred resulting from increasedlabor and material costs related to the 2004 Florida hurricanes in the three months and twelve months ended December 31, 2005, respectively.
(5) Includes $291 million of Domestic Brokerage Group expenses related to changes in estimates for uncollectible reinsurance and other premium balances for both the three months and twelve months ended December 31, 2005, and $100 million of accrued expenses in connection with certain workers compensation insurance policies written between 1985 and 1996 for the twelve months ended December 31, 2005. These expenses increased the expense and combined ratios by 2.87 and 0.93 in the three months and twelve months ended December 31, 2005, respectively.
(6) Underwriting profit, a GAAP measure, is statutory underwriting profit (loss) adjusted primarily for changes in thedeferral of policy acquisition costs that are necessary to present the financial statements in accordance with GAAP.
(7) Other investment income is comprised principally of real estate income, changes in market value associated with trading portfolios and income from securities lending.
American International Group, Inc.General Insurance Operating Statistics
(dollars in millions)
Excluding Catastrophe Losses and Reserve Charge
Three Months Ended December 31, Twelve Months Ended December 31,
9
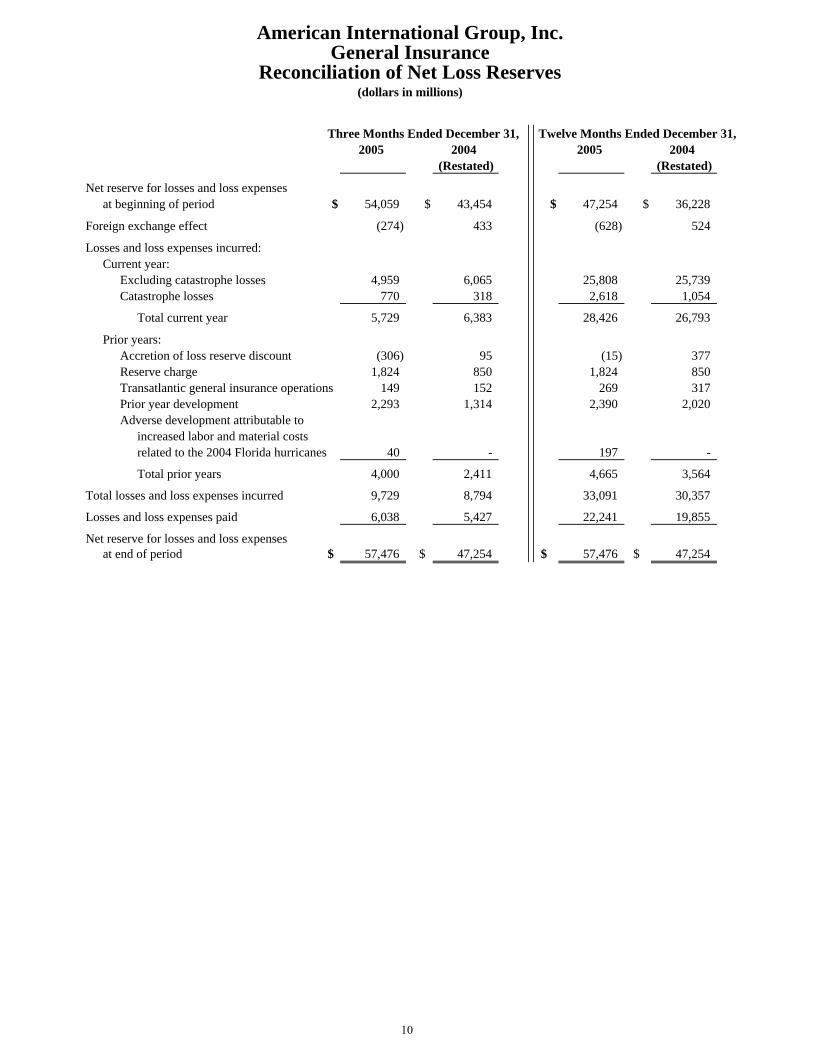
Twelve Months Ended December 31,2005 2004 2005 2004
(Restated) (Restated)
Net reserve for losses and loss expenses at beginning of period $ 54,059 $ 43,454 $ 47,254 $ 36,228
Foreign exchange effect (274) 433 (628) 524
Losses and loss expenses incurred:Current year:
Excluding catastrophe losses 4,959 6,065 25,808 25,739Catastrophe losses 770 318 2,618 1,054
Total current year 5,729 6,383 28,426 26,793
Prior years:Accretion of loss reserve discount (306) 95 (15) 377Reserve charge 1,824 850 1,824 850Transatlantic general insurance operations 149 152 269 317Prior year development 2,293 1,314 2,390 2,020Adverse development attributable to
increased labor and material costs related to the 2004 Florida hurricanes 40 - 197 -
Total prior years 4,000 2,411 4,665 3,564
Total losses and loss expenses incurred 9,729 8,794 33,091 30,357
Losses and loss expenses paid 6,038 5,427 22,241 19,855
Net reserve for losses and loss expenses at end of period $ 57,476 $ 47,254 $ 57,476 $ 47,254
Three Months Ended December 31,
Reconciliation of Net Loss Reserves
American International Group, Inc.General Insurance
(dollars in millions)
10

2005 2004 2005 2004(Restated) % Chg (Restated) % Chg
Net premiums written (1)(2) $ 6,057 $ 5,754 5.3 % $ 23,128 $ 22,506 2.8 %Net premiums earned (1) 5,829 5,672 2.8 22,602 21,215 6.5Losses and loss expenses incurred (1)(3)(4) 6,948 5,598 24.1 21,328 18,808 13.4Statutory underwriting expenses (5) 1,353 1,089 24.2 4,501 3,907 15.2Underwriting loss (1)(3)(4)(5)(6) (2,446) (1,116) NM (3,250) (1,340) NMNet investment income
Interest and dividends 580 420 38.1 2,055 1,495 37.5Partnership income 75 75 0.0 500 583 (14.2)Other investment income (7) 89 78 14.1 276 267 3.4Investment expense (144) (129) NM (428) (380) NM
Total 600 444 35.1 2,403 1,965 22.3Operating income (loss) before realized
capital gains (losses) (1)(3)(4)(5) (1,846) (672) NM (847) 625 NMRealized capital gains (losses) (35) 63 NM 201 152 32.2Operating income (loss) (1)(3)(4)(5) $ (1,881) $ (609) NM % $ (646) $ 777 NM %
Underwriting ratios:As reported
Loss ratio (1)(3)(4) 119.20 98.73 94.37 88.66Expense ratio (1)(2)(5) 22.33 18.94 19.46 17.36Combined ratio 141.53 117.67 113.83 106.02
Excluding catastrophe lossesLoss ratio (1)(3)(4) 110.67 95.61 86.18 85.91Expense ratio (1)(2)(5) 22.33 18.94 19.36 17.36Combined ratio 133.00 114.55 105.54 103.27
Excluding catastrophe losses and reserve charge
Loss ratio (1)(3)(4) 73.96 83.27 76.76 82.61Expense ratio (1)(2)(5) 22.33 18.94 19.36 17.36Combined ratio 96.29 102.21 96.12 99.97
Note: (1) Net premiums written and net premiums earned include net reinstatement premium cost of $122 million for the twelve months ended December 31, 2005. Losses and loss expenses incurred includes catastrophe losses of $497 million and $1.747 billion for the three months and twelve months ended December 31, 2005, respectively, and $176 million and $582 million for the three months and twelve months ended December 31, 2004, respectively.
(2) Includes an increase of approximately $300 million for both the three months and twelve months ended December 31, 2005, resulting from a portfolio transfer of Richmond unearned premiums reserves from Foreign General.
(3) Includes $2.140 billion reserve charge increase for both the three months and twelve months ended December 31, 2005. Losses and loss expenses incurred includes charge of $700 million attributable to the change in estimate for asbestos and environmental exposures for both the three months and twelve months ended December 31, 2004.
(4) Includes $40 million and $197 million of additional losses incurred resulting from increased labor and material costs related to the 2004 Florida hurricanes for the three months and twelve months ended December 31, 2005, respectively.
(5) Includes $291 million of expenses related to changes in estimates for uncollectible reinsurance and other premium balances for both the three months and twelve months ended December 31, 2005, and $100 million of accrued expenses in connection with certain workers compensation insurance policies written between 1985 and 1996 for the twelve months ended December 31, 2005. These expenses increased the expense and combined ratios by 4.80 and 1.69 in the three months and twelve months ended December 31, 2005, respectively.
(6) Underwriting loss, a GAAP measure, is statutory underwriting profit (loss) adjusted primarily for changes in the deferral of policy acquisition costs that are necessary to present the financial statements in accordance with GAAP.
(7) Other investment income is comprised principally of real estate income, changes in market value associated with trading portfolios and income from securities lending.
Twelve Months Ended December 31,Three Months Ended December 31,
American International Group, Inc.Domestic Brokerage Group Insurance Operating Statistics
(dollars in millions)
11
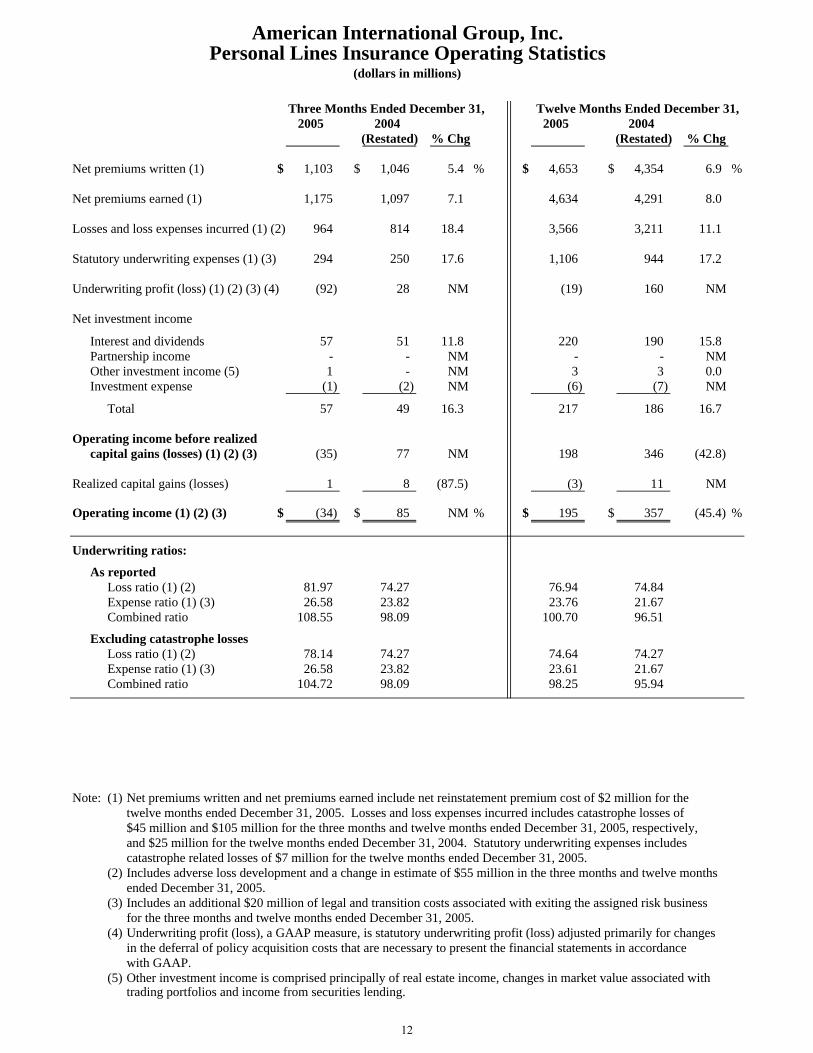
2005 2004 2005 2004(Restated) % Chg (Restated) % Chg
Net premiums written (1) $ 1,103 $ 1,046 5.4 % $ 4,653 $ 4,354 6.9 %
Net premiums earned (1) 1,175 1,097 7.1 4,634 4,291 8.0
Losses and loss expenses incurred (1) (2) 964 814 18.4 3,566 3,211 11.1
Statutory underwriting expenses (1) (3) 294 250 17.6 1,106 944 17.2
Underwriting profit (loss) (1) (2) (3) (4) (92) 28 NM (19) 160 NM
Net investment income
Interest and dividends 57 51 11.8 220 190 15.8Partnership income - - NM - - NMOther investment income (5) 1 - NM 3 3 0.0Investment expense (1) (2) NM (6) (7) NM
Total 57 49 16.3 217 186 16.7
Operating income before realizedcapital gains (losses) (1) (2) (3) (35) 77 NM 198 346 (42.8)
Realized capital gains (losses) 1 8 (87.5) (3) 11 NM
Operating income (1) (2) (3) $ (34) $ 85 NM % $ 195 $ 357 (45.4) %
Underwriting ratios:
As reportedLoss ratio (1) (2) 81.97 74.27 76.94 74.84Expense ratio (1) (3) 26.58 23.82 23.76 21.67Combined ratio 108.55 98.09 100.70 96.51
Excluding catastrophe lossesLoss ratio (1) (2) 78.14 74.27 74.64 74.27Expense ratio (1) (3) 26.58 23.82 23.61 21.67Combined ratio 104.72 98.09 98.25 95.94
Note: (1) Net premiums written and net premiums earned include net reinstatement premium cost of $2 million for the twelve months ended December 31, 2005. Losses and loss expenses incurred includes catastrophe losses of $45 million and $105 million for the three months and twelve months ended December 31, 2005, respectively, and $25 million for the twelve months ended December 31, 2004. Statutory underwriting expenses includes catastrophe related losses of $7 million for the twelve months ended December 31, 2005.
(2) Includes adverse loss development and a change in estimate of $55 million in the three months and twelve monthsended December 31, 2005.
(3) Includes an additional $20 million of legal and transition costs associated with exiting the assigned risk businessfor the three months and twelve months ended December 31, 2005.
(4) Underwriting profit (loss), a GAAP measure, is statutory underwriting profit (loss) adjusted primarily for changes in the deferral of policy acquisition costs that are necessary to present the financial statements in accordance with GAAP.
(5) Other investment income is comprised principally of real estate income, changes in market value associated with trading portfolios and income from securities lending.
Three Months Ended December 31,
American International Group, Inc.Personal Lines Insurance Operating Statistics
(dollars in millions)
Twelve Months Ended December 31,
12
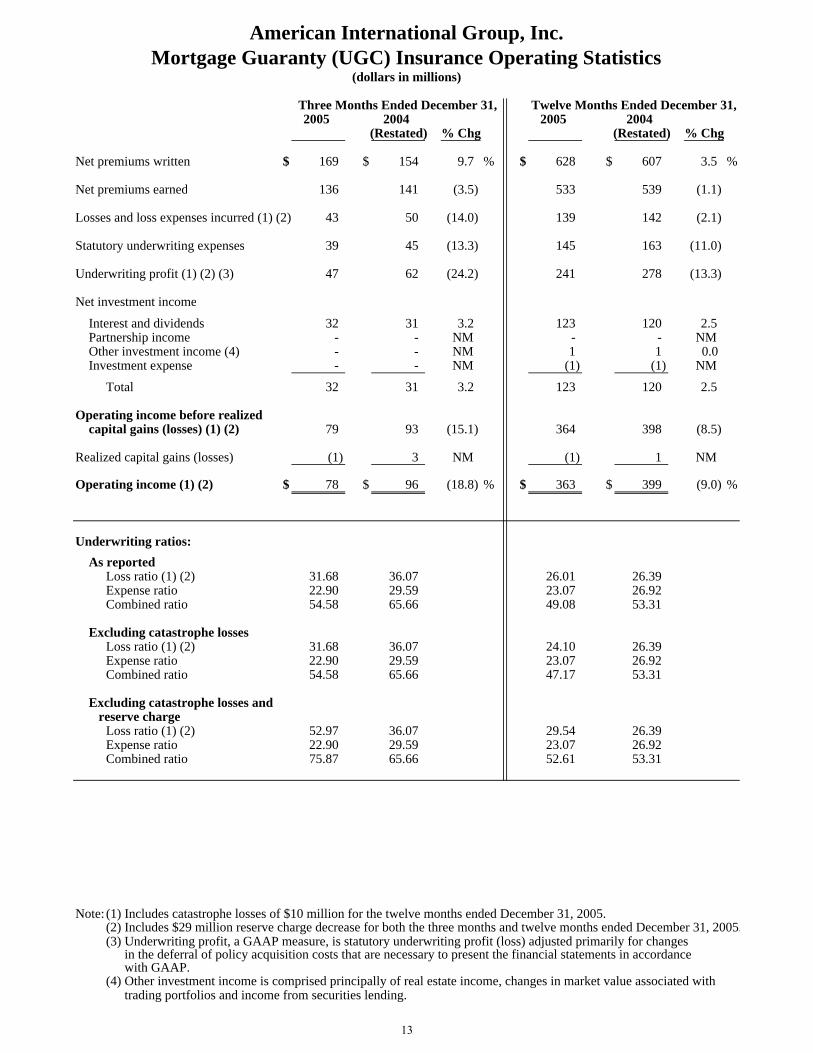
2005 2004 2005 2004(Restated) % Chg (Restated) % Chg
Net premiums written $ 169 $ 154 9.7 % $ 628 $ 607 3.5 %
Net premiums earned 136 141 (3.5) 533 539 (1.1)
Losses and loss expenses incurred (1) (2) 43 50 (14.0) 139 142 (2.1)
Statutory underwriting expenses 39 45 (13.3) 145 163 (11.0)
Underwriting profit (1) (2) (3) 47 62 (24.2) 241 278 (13.3)
Net investment income
Interest and dividends 32 31 3.2 123 120 2.5 Partnership income - - NM - - NMOther investment income (4) - - NM 1 1 0.0 Investment expense - - NM (1) (1) NM
Total 32 31 3.2 123 120 2.5
Operating income before realizedcapital gains (losses) (1) (2) 79 93 (15.1) 364 398 (8.5)
Realized capital gains (losses) (1) 3 NM (1) 1 NM
Operating income (1) (2) $ 78 $ 96 (18.8) % $ 363 $ 399 (9.0) %
Underwriting ratios:As reported
Loss ratio (1) (2) 31.68 36.07 26.01 26.39Expense ratio 22.90 29.59 23.07 26.92Combined ratio 54.58 65.66 49.08 53.31
Excluding catastrophe lossesLoss ratio (1) (2) 31.68 36.07 24.10 26.39Expense ratio 22.90 29.59 23.07 26.92Combined ratio 54.58 65.66 47.17 53.31
Excluding catastrophe losses and reserve charge
Loss ratio (1) (2) 52.97 36.07 29.54 26.39Expense ratio 22.90 29.59 23.07 26.92Combined ratio 75.87 65.66 52.61 53.31
Note: (1) Includes catastrophe losses of $10 million for the twelve months ended December 31, 2005. (2) Includes $29 million reserve charge decrease for both the three months and twelve months ended December 31, 2005.(3) Underwriting profit, a GAAP measure, is statutory underwriting profit (loss) adjusted primarily for changes
in the deferral of policy acquisition costs that are necessary to present the financial statements in accordance with GAAP.
(4) Other investment income is comprised principally of real estate income, changes in market value associated with trading portfolios and income from securities lending.
Three Months Ended December 31,
American International Group, Inc.Mortgage Guaranty (UGC) Insurance Operating Statistics
(dollars in millions)
Twelve Months Ended December 31,
13

2005 2004 % Chg 2005 2004 % Chg
Net premiums written (1) $ 839 $ 927 (9.5) % $ 3,466 $ 3,749 (7.5) %
Net premiums earned (1) 791 932 (15.1) 3,385 3,661 (7.5)
Losses and loss expenses incurred (1) 645 706 (8.6) 2,877 2,755 4.4
Statutory underwriting expenses 232 232 0.0 942 983 (4.2)
Underwriting loss (1)(2) (78) (1) NM (420) (47) NM
Net investment income
Interest and dividends 84 77 9.1 322 289 11.4Partnership income 2 8 (75.0) 12 14 (14.3)Other investment income (3) 3 4 (25.0) 18 13 38.5Investment expense (2) (2) NM (9) (9) NM
Total 87 87 0.0 343 307 11.7
Operating income (loss) before realizedcapital gains (losses) (1) 9 86 (89.5) (77) 260 NM
Realized capital gains (losses) 14 8 75.0 38 22 72.7
Operating income (loss) (1) $ 23 $ 94 (75.5) % $ (39) $ 282 NM %
Underwriting ratios:
As reportedLoss ratio (1) 81.53 75.67 84.99 75.24Expense ratio (1) 27.76 25.02 27.18 26.22Combined ratio 109.29 100.69 112.17 101.46
Excluding catastrophe lossesLoss ratio (1) 67.45 70.30 70.38 69.37Expense ratio (1) 27.59 25.02 26.83 26.22Combined ratio 95.04 95.32 97.21 95.59
Note: (1) Net premiums written and net premiums earned include net reinstatement premium cost of $5 million and $45 millionfor and the three months and twelve months ended December 31, 2005, respectively. Losses and loss expenses incurred includes catastrophe losses of $108 million and $463 million for the three months and twelve months ended December 31, 2005, respectively, and $50 million and $215 million for the three months and twelve months ended December 31, 2004, respectively.
(2) Underwriting loss, a GAAP measure, is statutory underwriting profit (loss) adjusted primarily for changes in the deferral of policy acquisition costs that are necessary to present the financial statements in accordance with GAAP.
(3) Other investment income is comprised principally of real estate income, changes in market value associated with trading portfolios and income from securities lending.
Three Months Ended December 31,
American International Group, Inc.Transatlantic Holdings, Inc. Insurance Operating Statistics
(dollars in millions)
Twelve Months Ended December 31,
14

2005 2004 2005 2004(Restated) % Chg (Restated) % Chg
Net premiums written (1) (2) $ 1,958 $ 2,197 (10.9) % $ 9,997 $ 9,407 6.3 %Net premiums earned (1) (3) 2,372 2,323 2.1 9,655 8,831 9.3Losses and loss expenses incurred (1) (4) 1,129 1,626 (30.6) 5,181 5,441 (4.8)Statutory underwriting expenses (5) 812 757 7.3 3,189 2,747 16.1Underwriting profit (loss) (1) (3) (4) (5) (6) 439 (102) NM 1,398 702 99.1Net investment income
Interest and dividends 171 148 15.5 668 557 19.9Partnership income 11 25 (56.0) 272 110 147.3Other investment income (7) 20 (3) NM 50 22 127.3Investment expense (9) (28) NM (46) (71) NM
Total 193 142 35.9 944 618 52.8Operating income before realized
capital gains (losses) (1) (4) 632 40 NM 2,342 1,320 77.4Realized capital gains (losses) 102 (32) NM 85 24 NMOperating income (1) (4) $ 734 $ 8 NM % $ 2,427 $ 1,344 80.6 %
Underwriting ratios:As reported
Loss ratio (1) (3) (4) 47.62 69.93 53.66 61.61Expense ratio (1) (2) (5) 41.49 34.38 31.90 29.20Combined ratio 89.11 104.31 85.56 90.81
Excluding catastrophe lossesLoss ratio (1) (3) (4) 42.56 65.98 50.14 58.98Expense ratio (1) (2) (5) 41.49 34.38 31.61 29.20Combined ratio 84.05 100.36 81.75 88.18
Excluding catastrophe losses and reserve charge
Loss ratio (1) (3) (4) 54.66 59.52 53.08 57.28Expense ratio (1) (2) (5) 41.49 34.38 31.61 29.20Combined ratio 96.15 93.90 84.69 86.48
Foreign exchange impact on growth of Foreign General net premiums written:
Growth in original currency (8.6) % 4.3 %Foreign exchange impact (2.3) 2.0 Growth as reported in U.S. $ (10.9) % 6.3 %
Note: (1) Net premiums written and net premiums earned include catastrophe related net reinstatement premium cost of $94 million for the twelve months ended December 31, 2005. Losses and loss expenses incurred includes catastrophe losses of $120 million and $293 million for the three months and twelve months ended December 31, 2005, respectively, and $92 million and $232 million for the three months and twelve months ended December 31, 2004, respectively.
(2) Includes a decrease of approximately $300 million for both the three months and twelve months ended December 31, 2005, resulting from a portfolio transfer of Richmond unearned premium reserves to the Domestic Brokerage Group.
(3) Income statement accounts expressed in non-functional currencies are translated into U.S. dollars using average exchange rates.
(4) Includes $287 million reserve charge decrease for both the three months and twelve months ended December 31, 2005. Losses and loss expenses includes a charge attributable to the change in estimate for asbestos and environmental exposures of $150 million for both the three months and twelve months ended December 31, 2004.
(5) Includes the results of wholly owned AIU agencies.(6) Underwriting profit, a GAAP measure, is statutory underwriting profit (loss) adjusted primarily for changes in the
deferral of policy acquisition costs that are necessary to present the financial statements in accordance with GAAP.
(7) Other investment income is comprised principally of real estate income, changes in market value associated with trading portfolios and income from securities lending.
American International Group, Inc.
Three Months Ended December 31, Twelve Months Ended December 31,
Foreign General Insurance Operating Statistics (dollars in millions)
15

American International Group, Inc.Foreign General InsuranceTwelve Months Ended December 31, 2005
Gross Premiums Written by Division
Gross Premiums Written by Region
Gross Premiums Written$15.8 billion
Personal Lines15.5%
Other / Service Business
3.2%
Ocean Marine3.5%
Accident & Health20.2%
Lloyd's5.6%
Property & Energy24.2%
Specialty Lines15.8%
Casualty12.0%
U.K. / Ireland29.5%
Asia / Australasia8.5%
Americas16.5%
Africa / Middle East /
Mediterranean / South Asia
4.0%
Europe19.6%
Far East21.9%
16

2005 2004 % 2005 2004 %(Restated) Chg (Restated) Chg
Premiums, deposits and other considerations (1) $ 15,461 $ 16,291 (5.1) % $ 66,448 $ 66,844 (0.6) %
Revenues:
GAAP premiums (2) $ 7,447 $ 7,025 6.0 % $ 29,400 $ 28,088 4.7 %
Net investment income Interest and dividends 4,323 3,837 12.7 16,557 14,824 11.7Partnership income:
Partnership excluding synfuels 56 126 (55.6) 416 313 32.9Synfuels (3) (28) (21) NM (143) (121) NMTotal partnership income 28 105 (73.3) 273 192 42.2
Other (4) 642 125 NM 1,340 271 NMIntercompany adjustments (10) (5) NM (36) (18) NM
Total net investment income 4,983 4,062 22.7 18,134 15,269 18.8
Pricing net investment gains (5) 75 49 53.1 344 225 52.9
Total revenues including pricing net investment gains and excluding realized capital gains (losses) 12,505 11,136 12.3 47,878 43,582 9.9
Benefits and expenses:Death and other benefits 3,589 3,665 (2.1) 13,963 13,522 3.3Increase in future policy benefits 4,736 3,614 31.0 16,657 14,481 15.0Acquisition and insurance expenses 1,848 1,911 (3.3) 7,852 7,474 5.1
Total benefits and expenses (6)(7)(8) 10,173 9,190 10.7 38,472 35,477 8.4
Operating income including pricing net investment gains and excluding realized capital gains (losses) (6)(7)(8) 2,332 1,946 19.8 9,406 8,105 16.1
Realized capital gains (losses) (5) (9) (169) 290 NM (562) (182) NM
Operating income (6)(7)(8) $ 2,163 $ 2,236 (3.3) % $ 8,844 $ 7,923 11.6 %
Foreign exchange impact on worldwide growth:GAAP premiums (2)
Growth in original currency 6.3 % 2.7 %Foreign exchange impact (0.3) 2.0Growth as reported in U.S. $ 6.0 4.7
Premiums, deposits and other considerations (1)Growth in original currency (4.6) (1.8)Foreign exchange impact (0.5) 1.2Growth as reported in U.S. $ (5.1) % (0.6) %
Life insurance in-force (10) $ 1,852,833 $ 1,858,094
Note: (1) Premiums, deposits and other considerations represent aggregate business activity during the respective periods presented on a non-GAAP basis.
(2) Includes approximately $640 million of a single premium from a reinsurance transaction involving terminal funding pension business, which is offset by a similar increase in benefit reserves, in the twelve months ended December 31, 2004.
(3) Investment in certain limited liability companies that invest in synthetic fuel production facilities as a means of generating income tax credits.
(4) Relates principally to trading and investment activity for certain variable life and annuity accounts in accordance with SOP 03-1. These amounts are offset by a similar change in increase in future policy benefits.
(5) For purposes of this presentation, pricing net investment gains are segregated out of total realized capital gains (losses). They represent certain amounts of realized capital gains where gains are an inherent element in pricing certain life products in some foreign countries.
(6) Incurred higher policyholder benefits of $137 million for both the fourth quarter and full year 2005 related to contributions to theparticipating policyholder fund in Singapore related to settlement of a long disputed tax issue.
(7) Includes a $178 million charge related to a workers' compensation quota share reinsurance agreement with Superior National Insurance Company in the fourth quarter and full year 2004. In addition, as part of the business review of Group life/health, approximately $68 million was incurred for reserve strengthening and allowances for receivables in 2004.
(8) Includes $12 million and $5 million of catastrophe related losses for the twelve months ended December 31, 2005 and 2004, respectively.(9) Includes loss of $85 million and $437 million for the three months and twelve months ended December 31, 2005, respectively, and
gain of $298 million and a loss of $140 million for the three months and twelve months ended December 31, 2004, respectively, relating to the effect of hedging activities that do not qualify for hedge accounting treatment under FAS 133 and the application of FAS 52.
(10) 2005 includes the effect of the non-renewal of a single large group life case of $36 billion. 2005 and 2004 includes the in-force ofTata AIG Life Insurance Company, Ltd. and foreign in-force is translated to U.S. dollars at the appropriate balance sheet exchange rate.
Three Months Ended December 31, Twelve Months Ended December 31,
American International Group, Inc.Life Insurance & Retirement Services Operating Statistics
(dollars in millions)
17

2005 2004 % 2005 2004 %(Restated) Chg (Restated) Chg
Premiums, deposits and otherconsiderations (1) $ 5,555 $ 6,062 (8.4) % $ 23,736 $ 26,978 (12.0) %
Revenues:
GAAP premiums $ 1,613 $ 1,530 5.4 % $ 6,384 $ 6,171 3.5 %
Net investment income: Interest and dividends 2,568 2,357 9.0 9,743 9,263 5.2Partnership income:
Partnership excluding synfuels 48 119 (59.7) 359 293 22.5Synfuels (2) (28) (21) NM (143) (121) NMTotal partnership income 20 98 (79.6) 216 172 25.6Total net investment income 2,588 2,455 5.4 9,959 9,435 5.6
Total revenues excluding realized capital gains (losses) 4,201 3,985 5.4 16,343 15,606 4.7
Benefits and expenses:Death and other benefits 967 1,180 (18.1) 3,861 4,057 (4.8)Increase in future policy benefits 1,426 1,314 8.5 5,614 5,423 3.5Acquisition and insurance expenses 753 751 0.3 2,967 2,722 9.0
Total benefits and expenses (3) (4) 3,146 3,245 (3.1) 12,442 12,202 2.0
Operating income before realizedcapital gains (losses) (3) (4) 1,055 740 42.6 3,901 3,404 14.6
Realized capital gains (losses) (5) (103) (168) NM (302) (329) NM
Operating income (3) (4) $ 952 $ 572 66.4 % $ 3,599 $ 3,075 17.0 %
Life insurance in-force (6) $ 825,151 $ 772,251
Note: (1) Premiums, deposits and other considerations represent aggregate business activity during the respective periods presented on a non-GAAP basis.
(2) Investment in certain limited liability companies that invest in synthetic fuel production facilities as a means of generating income tax credits.
(3) Includes $12 million and $5 million of catastrophe related losses for the twelve months ended December 31, 2005 and 2004, respectively.
(4) Includes a $178 million charge related to a workers' compensation quota share reinsurance agreement with Superior National Insurance Company in the three months and twelve months ended December 31, 2004.
(5) Includes gain of $13 million and $63 million for the three months and twelve months ended December 31, 2005, respectively, and loss of $61 million and $6 million for the three months and twelve months ended December 31, 2004, respectively, relating to the effect of hedging activities that do not qualify for hedge accounting treatment under FAS 133 and the application of FAS 52.
(6) Includes the effect of the non-renewal of a single large group life case of $36 billion as of December 31, 2005.
Three Months Ended December 31, Twelve Months Ended December 31,
American International Group, Inc.Domestic Life Insurance & Retirement Services Operating Statistics
(dollars in millions)
18
2005 2004 % 2005 2004 %(Restated) Chg (Restated) Chg
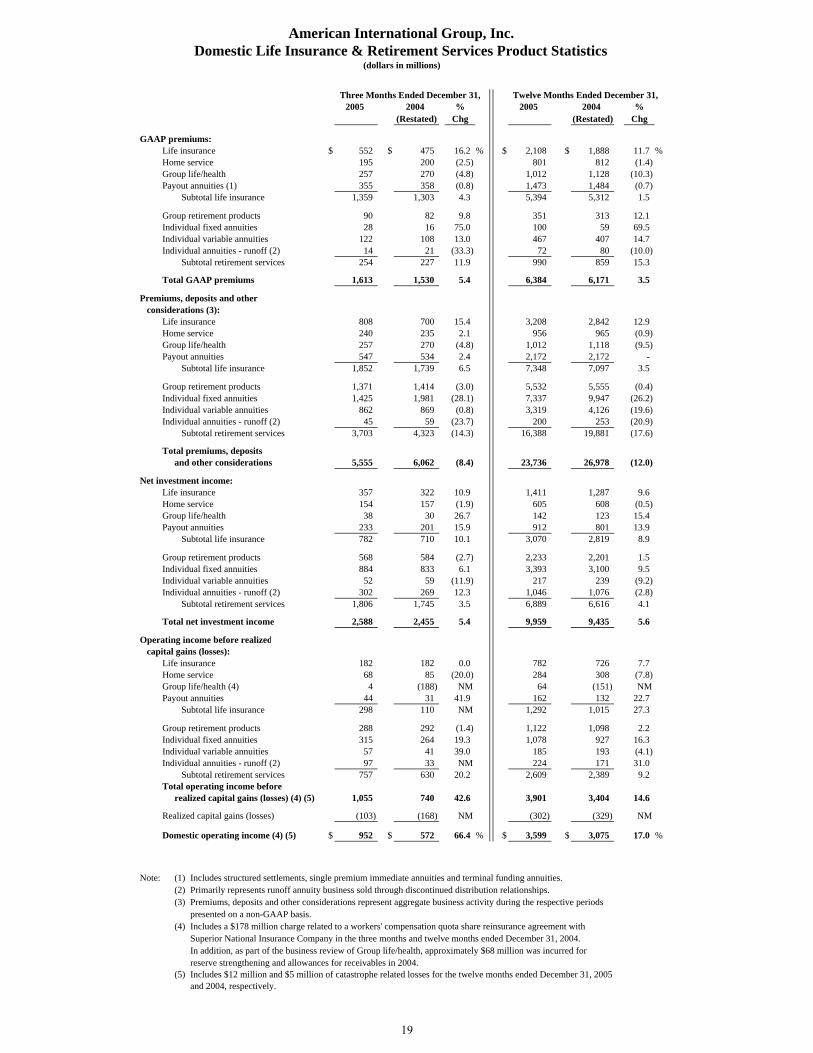
GAAP premiums:Life insurance $ 552 $ 475 16.2 % $ 2,108 $ 1,888 11.7 %Home service 195 200 (2.5) 801 812 (1.4)Group life/health 257 270 (4.8) 1,012 1,128 (10.3)Payout annuities (1) 355 358 (0.8) 1,473 1,484 (0.7)
Subtotal life insurance 1,359 1,303 4.3 5,394 5,312 1.5
Group retirement products 90 82 9.8 351 313 12.1Individual fixed annuities 28 16 75.0 100 59 69.5Individual variable annuities 122 108 13.0 467 407 14.7Individual annuities - runoff (2) 14 21 (33.3) 72 80 (10.0)
Subtotal retirement services 254 227 11.9 990 859 15.3
Total GAAP premiums 1,613 1,530 5.4 6,384 6,171 3.5
Premiums, deposits and other considerations (3):
Life insurance 808 700 15.4 3,208 2,842 12.9Home service 240 235 2.1 956 965 (0.9)Group life/health 257 270 (4.8) 1,012 1,118 (9.5)Payout annuities 547 534 2.4 2,172 2,172 -
Subtotal life insurance 1,852 1,739 6.5 7,348 7,097 3.5
Group retirement products 1,371 1,414 (3.0) 5,532 5,555 (0.4)Individual fixed annuities 1,425 1,981 (28.1) 7,337 9,947 (26.2)Individual variable annuities 862 869 (0.8) 3,319 4,126 (19.6)Individual annuities - runoff (2) 45 59 (23.7) 200 253 (20.9)
Subtotal retirement services 3,703 4,323 (14.3) 16,388 19,881 (17.6)
Total premiums, deposits and other considerations 5,555 6,062 (8.4) 23,736 26,978 (12.0)
Net investment income:Life insurance 357 322 10.9 1,411 1,287 9.6Home service 154 157 (1.9) 605 608 (0.5)Group life/health 38 30 26.7 142 123 15.4Payout annuities 233 201 15.9 912 801 13.9
Subtotal life insurance 782 710 10.1 3,070 2,819 8.9
Group retirement products 568 584 (2.7) 2,233 2,201 1.5Individual fixed annuities 884 833 6.1 3,393 3,100 9.5Individual variable annuities 52 59 (11.9) 217 239 (9.2)Individual annuities - runoff (2) 302 269 12.3 1,046 1,076 (2.8)
Subtotal retirement services 1,806 1,745 3.5 6,889 6,616 4.1
Total net investment income 2,588 2,455 5.4 9,959 9,435 5.6
Operating income before realized capital gains (losses):
Life insurance 182 182 0.0 782 726 7.7Home service 68 85 (20.0) 284 308 (7.8)Group life/health (4) 4 (188) NM 64 (151) NMPayout annuities 44 31 41.9 162 132 22.7
Subtotal life insurance 298 110 NM 1,292 1,015 27.3
Group retirement products 288 292 (1.4) 1,122 1,098 2.2Individual fixed annuities 315 264 19.3 1,078 927 16.3Individual variable annuities 57 41 39.0 185 193 (4.1)Individual annuities - runoff (2) 97 33 NM 224 171 31.0
Subtotal retirement services 757 630 20.2 2,609 2,389 9.2Total operating income before
realized capital gains (losses) (4) (5) 1,055 740 42.6 3,901 3,404 14.6
Realized capital gains (losses) (103) (168) NM (302) (329) NM
Domestic operating income (4) (5) $ 952 $ 572 66.4 % $ 3,599 $ 3,075 17.0 %
Note: (1) Includes structured settlements, single premium immediate annuities and terminal funding annuities.(2) Primarily represents runoff annuity business sold through discontinued distribution relationships.(3) Premiums, deposits and other considerations represent aggregate business activity during the respective periods
presented on a non-GAAP basis.(4) Includes a $178 million charge related to a workers' compensation quota share reinsurance agreement with
Superior National Insurance Company in the three months and twelve months ended December 31, 2004. In addition, as part of the business review of Group life/health, approximately $68 million was incurred for reserve strengthening and allowances for receivables in 2004.
(5) Includes $12 million and $5 million of catastrophe related losses for the twelve months ended December 31, 2005 and 2004, respectively.
Three Months Ended December 31, Twelve Months Ended December 31,
American International Group, Inc.Domestic Life Insurance & Retirement Services Product Statistics
(dollars in millions)
19

2005 2004 % 2005 2004 %(Restated) Chg (Restated) Chg
Life insurancePeriodic premium sales (1):
Individual/retail $ 151 $ 129 17.1 % $ 552 $ 481 14.8 %Institutional markets - 8 NM 4 33 (87.9)
Total periodic sales 151 137 10.2 556 514 8.2
Unscheduled and single deposits 86 63 36.5 499 365 36.7
Life insurance reserves 21,755 20,269 7.3
Home serviceLife/Accident & Health sales (1) 27 28 (3.6) 107 111 (3.6) Fixed annuity sales 27 22 22.7 104 105 (1.0)
Total insurance reserves 7,278 7,173 1.5
Group life/healthAnnualized earned premium 1,100 1,266 (13.1)
Payout annuitiesInsurance reserves 12,712 11,161 13.9
Group retirement productsDeposits (2) 1,598 1,572 1.7 6,436 6,502 (1.0)
Net flows (3)Group retirement products (2) 108 462 (76.6) 628 1,706 (63.2)Individual fixed annuities (87) 949 NM 1,759 6,169 (71.5)Individual variable annuities (127) 63 NM (336) 1,145 NM
Subtotal (106) 1,474 NM 2,051 9,020 (77.3)Individual annuities - runoff (651) (528) NM (2,508) (2,084) NM
Total $ (757) $ 946 NM % $ (457) $ 6,936 NM %
Surrender rates (4)Group retirement products (2) 9.8% 7.7% 9.8% 8.8%Individual fixed annuities 9.0% 6.4% 8.0% 5.9%Individual variable annuities 12.7% 10.9% 12.0% 10.4%
Note: (1) Life insurance sales represent premiums from new sales that are expected to be collected over a one year period. (2) Includes group retirement annuities and group mutual funds.(3) Net flows are defined as deposits received, less benefits, surrenders, withdrawals and death benefits.(4) Surrender rates are based upon all benefits, surrenders and withdrawals except for death benefits.
Three Months Ended December 31, Twelve Months Ended December 31,
American International Group, Inc.Domestic Life Insurance & Retirement Services Other Data
(dollars in millions)
20

2005 2004 2005 2004 Spread information
Group Retirement ProductsBase investment income $ 507 $ 505 $ 2,037 $ 1,995 Partnerships 15 43 89 95 Other enhancements 46 36 107 111 Total net investment income $ 568 $ 584 $ 2,233 $ 2,201
Base Yield 6.22% 6.23% 6.24% 6.33%Partnerships (1) -0.06% 0.39% 0.07% 0.16%Other enhancements (2) 0.54% 0.44% 0.32% 0.35% Total 6.70% 7.06% 6.63% 6.84%
Cost of funds 3.77% 3.82% 3.75% 3.83%
Net spread rate, as reported 2.93% 3.24% 2.89% 3.01%Net spread rate excluding partnerships and other enhancements 2.45% 2.41% 2.50% 2.50%
Individual Fixed AnnuitiesBase investment income $ 811 $ 743 $ 3,162 $ 2,853 Partnerships 21 64 135 147 Other enhancements 52 26 96 100 Total net investment income $ 884 $ 833 $ 3,393 $ 3,100
Base Yield 5.89% 5.90% 5.88% 6.01%Partnerships (1) -0.02% 0.36% 0.10% 0.16%Other enhancements (2) 0.38% 0.20% 0.18% 0.21% Total 6.25% 6.46% 6.16% 6.38%
Cost of funds 3.55% 3.67% 3.55% 3.73%
Net spread rate, as reported 2.70% 2.79% 2.60% 2.65%Net spread rate excluding partnerships and other enhancements 2.34% 2.23% 2.32% 2.28%
Individual Variable AnnuitiesBase investment income $ 50 $ 55 $ 207 $ 226 Other enhancements 2 4 10 13 Total net investment income $ 52 $ 59 $ 217 $ 239
Base Yield 5.47% 5.48% 5.46% 5.49%Other enhancements (2) 0.19% 0.38% 0.25% 0.30% Total 5.66% 5.86% 5.71% 5.79%
Cost of funds 3.11% 3.18% 3.10% 3.18%
Net spread rate, as reported 2.55% 2.69% 2.61% 2.62%Net spread rate excluding other enhancements 2.36% 2.31% 2.36% 2.32%
General and separate account reservesGroup retirement products (3) $ 59,312 $ 56,118 Individual fixed annuities 54,470 50,547 Individual variable annuities 28,267 26,846 Individual annuities - runoff 19,072 20,812 Total $ 161,121 $ 154,323
Note: (1) Includes incremental impact to base yield of investments in hedge funds and private equity funds.(2) Includes incremental impact to base yield of gains on calls, dollar roll income, prepayment fees and trading gains (losses).(3) Includes group retirement annuities and group mutual funds.
Twelve Months Ended December 31,
American International Group, Inc.Domestic Life Insurance & Retirement Services Other Data
(dollars in millions)
Three Months Ended December 31,
21

2005 2004 % 2005 2004 %(Restated) Chg (Restated) Chg
Premiums, deposits and other considerations (1) $ 9,906 $ 10,229 (3.2) % $ 42,712 $ 39,866 7.1 %
Revenues:
GAAP premiums (2) $ 5,834 $ 5,495 6.2 % $ 23,016 $ 21,917 5.0 %
Net investment income:Interest and dividends 1,755 1,480 18.6 6,814 5,561 22.5Partnership income 8 7 14.3 57 20 NMOther (3) 642 125 NM 1,340 271 NMIntercompany adjustments (10) (5) NM (36) (18) NM
Total net investment income 2,395 1,607 49.0 8,175 5,834 40.1
Pricing net investment gains (4) 75 49 53.1 344 225 52.9
Total revenues including pricing net investment gains and excluding realized 8,304 7,151 16.1 31,535 27,976 12.7
Benefits and expenses:Death and other benefits 2,622 2,485 5.5 10,102 9,465 6.7Increase in future policy benefits 3,310 2,300 43.9 11,043 9,058 21.9Acquisition and insurance expenses 1,095 1,160 (5.6) 4,885 4,752 2.8
Total benefits and expenses (5) 7,027 5,945 18.2 26,030 23,275 11.8
Operating income including pricing net investment gains and excludingrealized capital gains (losses) (5) 1,277 1,206 5.9 5,505 4,701 17.1
Realized capital gains (losses) (4) (6) (66) 458 NM (260) 147 NM
Operating income (5) $ 1,211 $ 1,664 (27.2) % $ 5,245 $ 4,848 8.2 %
Foreign exchange impact on foreign growth:
GAAP premiums (2)
Growth in original currency 6.6 % 2.5 %Foreign exchange impact (0.4) 2.5 Growth as reported in U.S. $ 6.2 5.0
Premiums, deposits and other considerations (1)
Growth in original currency (2.4) 5.1 Foreign exchange impact (0.8) 2.0 Growth as reported in U.S. $ (3.2) % 7.1 %
Life insurance in-force (7) $ 1,027,682 $ 1,085,843
Note: (1) Premiums, deposits and other considerations represent aggregate business activity during the respective periods presented on a non-GAAP basis.
(2) Includes approximately $640 million of a single premium from a reinsurance transaction involving terminal funding pension business, which is offset by a similar increase in benefit reserves, in the twelve months ended December 31, 2004.
(3) Relates principally to trading and investment activity for certain variable life and annuity accounts in accordance with SOP 03-1. These amounts are offset by a similar change in increase in future policy benefits.
(4) For purposes of this presentation, pricing net investment gains are segregated out of total realized capital gains (losses). They represent certain amounts of realized capital gains where gains are an inherent element in pricing certain life products in some foreign countries.
(5) Incurred higher policyholder benefits of $137 million for both the three months and twelve months ended December 31, 2005 related to increases in participating policyholders' dividends in Singapore as a result of a settlement of a long disputed tax issue.
(6) Includes loss of $98 million and $500 million for the three months and twelve months ended December 31, 2005, respectively, and gain of $359 million and loss of $134 million for the three months and twelve months ended December 31, 2004, respectively, relating to the effect of hedging activities that do not qualify for hedge accounting treatment under FAS 133 and the application of FAS 52.
(7) In-force includes Tata AIG Life Insurance Company, Ltd. and is translated to U.S. dollars at the appropriate balance sheetexchange rate.
Three Months Ended December 31, Twelve Months Ended December 31,
American International Group, Inc.Foreign Life Insurance & Retirement Services Operating Statistics
(dollars in millions)
22
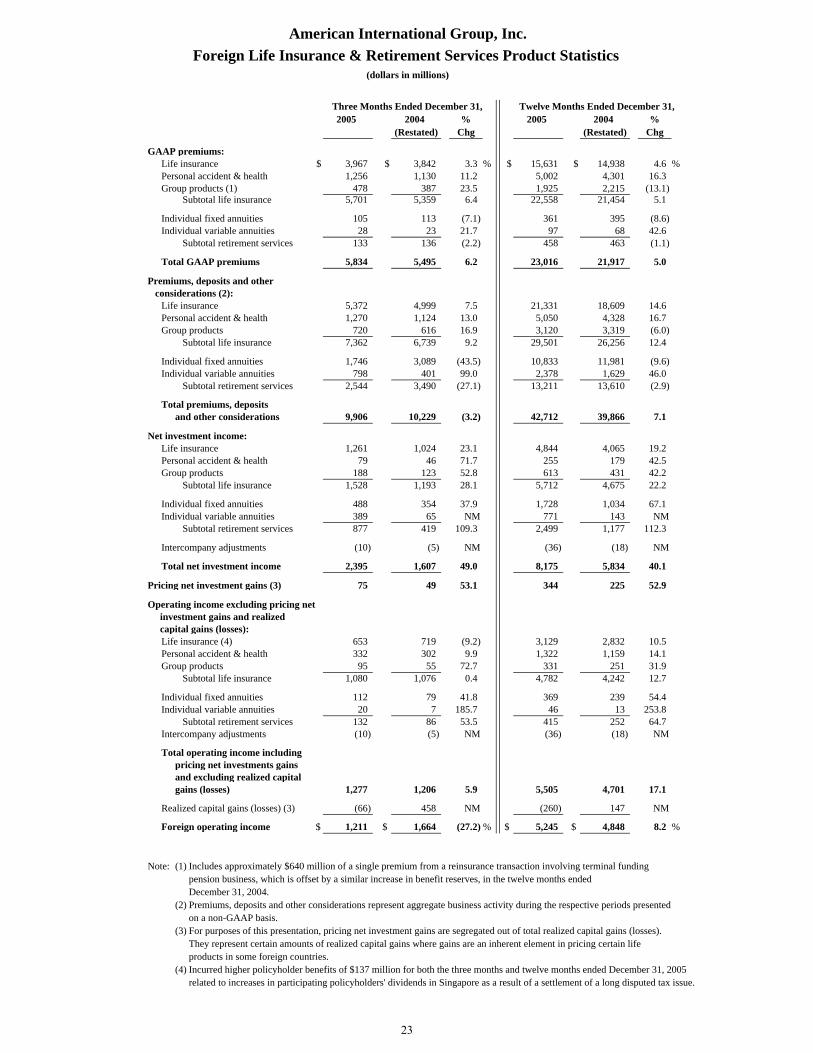
2005 2004 % 2005 2004 %(Restated) Chg (Restated) Chg
GAAP premiums:Life insurance $ 3,967 $ 3,842 3.3 % $ 15,631 $ 14,938 4.6 %Personal accident & health 1,256 1,130 11.2 5,002 4,301 16.3Group products (1) 478 387 23.5 1,925 2,215 (13.1)
Subtotal life insurance 5,701 5,359 6.4 22,558 21,454 5.1
Individual fixed annuities 105 113 (7.1) 361 395 (8.6)Individual variable annuities 28 23 21.7 97 68 42.6
Subtotal retirement services 133 136 (2.2) 458 463 (1.1)
Total GAAP premiums 5,834 5,495 6.2 23,016 21,917 5.0
Premiums, deposits and other considerations (2):
Life insurance 5,372 4,999 7.5 21,331 18,609 14.6Personal accident & health 1,270 1,124 13.0 5,050 4,328 16.7Group products 720 616 16.9 3,120 3,319 (6.0)
Subtotal life insurance 7,362 6,739 9.2 29,501 26,256 12.4
Individual fixed annuities 1,746 3,089 (43.5) 10,833 11,981 (9.6)Individual variable annuities 798 401 99.0 2,378 1,629 46.0
Subtotal retirement services 2,544 3,490 (27.1) 13,211 13,610 (2.9)
Total premiums, deposits and other considerations 9,906 10,229 (3.2) 42,712 39,866 7.1
Net investment income:Life insurance 1,261 1,024 23.1 4,844 4,065 19.2Personal accident & health 79 46 71.7 255 179 42.5Group products 188 123 52.8 613 431 42.2
Subtotal life insurance 1,528 1,193 28.1 5,712 4,675 22.2
Individual fixed annuities 488 354 37.9 1,728 1,034 67.1Individual variable annuities 389 65 NM 771 143 NM
Subtotal retirement services 877 419 109.3 2,499 1,177 112.3
Intercompany adjustments (10) (5) NM (36) (18) NM
Total net investment income 2,395 1,607 49.0 8,175 5,834 40.1
Pricing net investment gains (3) 75 49 53.1 344 225 52.9
Operating income excluding pricing net investment gains and realized capital gains (losses):
Life insurance (4) 653 719 (9.2) 3,129 2,832 10.5Personal accident & health 332 302 9.9 1,322 1,159 14.1Group products 95 55 72.7 331 251 31.9
Subtotal life insurance 1,080 1,076 0.4 4,782 4,242 12.7
Individual fixed annuities 112 79 41.8 369 239 54.4Individual variable annuities 20 7 185.7 46 13 253.8
Subtotal retirement services 132 86 53.5 415 252 64.7Intercompany adjustments (10) (5) NM (36) (18) NM
Total operating income including pricing net investments gainsand excluding realized capital gains (losses) 1,277 1,206 5.9 5,505 4,701 17.1
Realized capital gains (losses) (3) (66) 458 NM (260) 147 NM
Foreign operating income $ 1,211 $ 1,664 (27.2) % $ 5,245 $ 4,848 8.2 %
Note: (1) Includes approximately $640 million of a single premium from a reinsurance transaction involving terminal funding pension business, which is offset by a similar increase in benefit reserves, in the twelve months ended December 31, 2004.
(2) Premiums, deposits and other considerations represent aggregate business activity during the respective periods presented on a non-GAAP basis.
(3) For purposes of this presentation, pricing net investment gains are segregated out of total realized capital gains (losses).They represent certain amounts of realized capital gains where gains are an inherent element in pricing certain lifeproducts in some foreign countries.
(4) Incurred higher policyholder benefits of $137 million for both the three months and twelve months ended December 31, 2005 related to increases in participating policyholders' dividends in Singapore as a result of a settlement of a long disputed tax issue.
Three Months Ended December 31, Twelve Months Ended December 31,
American International Group, Inc.Foreign Life Insurance & Retirement Services Product Statistics
(dollars in millions)
23

2005 2004 % 2005 2004 %(Restated) Chg (Restated) Chg
First year premiums (1)
Life insurance Japan $ 220 $ 201 9.5 % $ 986 $ 714 38.1 % China 35 33 6.1 123 115 7.0 Asia excluding Japan and China (2) 447 516 (13.4) 1,966 1,686 16.6 All other regions 55 50 10.0 202 194 4.1 Total 757 800 (5.4) 3,277 2,709 21.0
Personal accident & health Japan 195 175 11.4 759 709 7.1 China 8 8 - 32 30 6.7 Asia excluding Japan and China 83 66 25.8 302 246 22.8 All other regions 27 26 3.8 109 103 5.8 Total 313 275 13.8 1,202 1,088 10.5
Group products Japan 3 3 0.0 13 20 (35.0) Asia excluding Japan and China 24 20 20.0 126 79 59.5 All other regions 158 122 29.5 661 607 8.9 Total 185 145 27.6 800 706 13.3
Total first year premiums Japan 418 379 10.3 1,758 1,443 21.8 China 43 41 4.9 155 145 6.9 Asia excluding Japan and China 554 602 (8.0) 2,394 2,011 19.0 All other regions 240 198 21.2 972 904 7.5 Total 1,255 1,220 2.9 5,279 4,503 17.2
Total annuity production
Japan 2,008 2,884 (30.4) 11,329 12,076 (6.2) China 2 19 (89.5) 68 19 257.9 Asia excluding Japan and China 154 358 (57.0) 416 710 (41.4) All other regions 380 229 65.9 1,398 805 73.7 Total $ 2,544 $ 3,490 (27.1) % 13,211 13,610 (2.9)
Life insurance reserves as of December 31,
Life insurance 92,393 87,085 6.1 Personal accident & health 5,804 5,123 13.3 Group products 7,855 7,587 3.5
Retirement services reserves as of December 31,
Individual fixed annuities 40,260 31,442 28.0 Individual variable annuities 5,979 4,024 48.6
Policy and contract claims reserves as of December 31,
Personal accident & health 413 438 (5.7) Group medical $ 94 $ 83 13.3 %
Note: (1) Represents premium recorded within the first policy year from new sales and generally includes 10 percent of singlepremium receipts for Life Insurance products and an equivalent amount for limited pay, short duration products.
(2) The majority of the increase is attributable to significant new sales generated by limited pay, short duration endowmentswritten in Nan Shan for the twelve months ended December 31, 2005.
Three Months Ended December 31, Twelve Months Ended December 31,
American International Group, Inc.Foreign Life Insurance & Retirement Services Other Data
(dollars in millions)
24

VALIC/AIG Annuity/ ALICO/ AIA/ Philamlife
AG Life and AIG SunAmerica AIG Star/ Nan Shan/ and IntercompanyYears Ended December 31, AGLA (1) (2) (1) (3) AIG Edison (4)(6) AIRCO (4)(5) All Other (4) Eliminations Total
2005Statutory Surplus $ 5,301 $ 11,101 $ 7,317 $ 9,565 $ 774 $ (3,319) $ 30,739Statutory Net Income 943 1,416 1,193 1,138 81 (9) 4,762
2004Statutory Surplus 5,058 11,223 5,592 8,328 642 (2,234) 28,609Statutory Net Income 805 1,700 718 1,203 54 (6) 4,474
2003Statutory Surplus 4,322 9,652 4,966 7,134 654 (1,227) 25,501Statutory Net Income $ 761 $ 1,075 $ 624 $ 964 $ 34 $ (5) $ 3,453
Note: (1) For U.S. domestic entities, fiscal period ends December 31st.(2) Includes the life operations of AIG Life Insurance Company, American International Life Assurance Company of New York, Delaware American
Life Insurance Company and Pacific Union Assurance Company and excludes AIG Annuity and VALIC.(3) AIG SunAmerica represents the annuity operations of AIG SunAmerica Life Assurance Company, as well as those of First SunAmerica Life Insurance
Company and SunAmerica Life Insurance Company.(4) Estimated regulatory surplus and net income as of November 30th. (5) AIRCO includes Life Division only. Net Income includes subsidiaries presented on a consolidated basis excluding AIG Edison Life.(6) Net income for ALICO includes subsidiaries presented on a consolidated basis.
(dollars in millions)
American International Group, Inc.Life Insurance & Retirement Services Statutory Surplus and Net Income
25

2005 2004 % 2005 2004 %(Restated) Chg (Restated) Chg
Revenues:
Aircraft Finance $ 917 $ 816 12.4 % $ 3,578 $ 3,136 14.1 %
Capital Markets (1) 291 371 (21.6) 1,246 1,400 (11.0)
Consumer Finance 949 800 18.6 3,613 2,978 21.3
Other 13 24 (45.8) 74 103 (28.2)
Total revenues before FAS 133 2,170 2,011 7.9 8,511 7,617 11.7
FAS 133 (2): AIGFP 215 (744) NM 2,014 (122) NM
Total revenues $ 2,385 $ 1,267 88.2 % $ 10,525 $ 7,495 40.4 %
Operating income:
Aircraft Finance $ 178 $ 172 3.5 % $ 713 $ 669 6.6 %
Capital Markets (1) 140 247 (43.3) 647 784 (17.5)
Consumer Finance (3) (4) 224 215 4.2 901 808 11.5
Other 11 16 (31.3) 35 68 (48.5)
Operating income before FAS 133 (3)(4) 553 650 (14.9) 2,296 2,329 (1.4)
FAS 133 (2): ILFC 25 4 NM (34) (27) NM AIGFP 215 (744) NM 2,014 (122) NM
Total FAS 133 240 (740) NM 1,980 (149) NM
Total operating income (loss) (3)(4) $ 793 $ (90) NM % $ 4,276 $ 2,180 96.1 %
Note (1) Certain transactions entered into by AIGFP generate tax credits and benefits which are included in income taxes on the consolidated statement of income. The amount of tax credits and benefits for the three months endedDecember 31, 2005 and 2004 are $4 million and $19 million respectively, and $67 million and $107 million for the twelve months ended December 31, 2005 and 2004 , respectively.
(2) Includes the the effect of hedging activities that do not qualifiy for hedge accounting treatment under FAS 133, including the related foreign exchange gains and losses.
(3) Includes $62 million of catastrophe related losses for the twelve months ended December 31, 2005.(4) Includes $14 million in additional loan loss provision in the fourth quarter 2005 for credit related losses in Taiwan.
Three Months Ended December 31, Twelve Months Ended December 31,
American International Group, Inc.Financial Services Operating Statistics
(dollars in millions)
26

Aircraft Type: In Fleet Orders Options
Airbus:A300-600R 6 0 0A310-300 7 0 0A319 86 61 0A320-200 113 71 0A321-100 12 0 0A321-200 42 31 0A330-200 47 21 0A330-300 18 7 0A340-300 15 0 0A340-600 9 6 0A350-800 0 16 0A380 0 5 0A380F 0 5 0
Boeing:737-300/400/500 58 0 0737-600/700/800 144 69 9747-300 2 0 0747-400 13 2 0747-400ERF 4 0 0757-200 64 0 0767-200 4 0 0767-300 53 0 0777-200B 33 9 0777-300 17 15 3787-800 0 20 4
McDonnell Douglas:MD-11 8 0 0MD-82/MD-83 8 0 0
Total 763 338 16
In fleet includes 17 finance leases.Orders include 2 used aircraft commitments.
Number of Aircraft
American International Group, Inc.International Lease Finance Corporation (ILFC)
Aircraft Leases, Orders and OptionsDecember 31, 2005
27

2005 2004 2005 2004(Restated) % Chg (Restated) % Chg
Revenues:
Guaranteed investment contractsDomestic $ 684 $ 749 (8.7) % $ 2,903 $ 2,728 6.4 %Foreign 156 170 (8.2) 644 464 38.8
Institutional asset management (2) 419 320 30.9 1,195 1,049 13.9
Brokerage service and mutual funds 65 64 1.6 257 249 3.2
Other 50 46 8.7 326 224 45.5Total $ 1,374 $ 1,349 1.9 % $ 5,325 $ 4,714 13.0 %
Operating income (3):
Guaranteed investment contractsDomestic $ 211 $ 287 (26.5) % $ 975 $ 972 0.3 %Foreign 13 12 8.3 61 43 41.9
Institutional asset management (2) 190 123 54.5 425 320 32.8
Brokerage service and mutual funds 16 16 0.0 66 70 (5.7)
Other 47 42 11.9 316 212 49.1
Total excluding FIN46R and FAS 133 477 480 (0.6) 1,843 1,617 14.0
FIN46R (4):Institutional asset management 72 48 NM 261 195 NM
FAS 133 (5):Guaranteed investment contracts 22 72 NM 149 313 NM
Total including FIN46R and FAS 133 $ 571 $ 600 (4.8) % $ 2,253 $ 2,125 6.0 %
Note: (1) AIG's third party assets under management, including mutual funds and institutional accounts, totaled over$62 billion at December 31, 2005, and over $51 billion at December 31, 2004.
(2) Includes AIG Global Investment Group and certain smaller asset management operations.(3) Includes $6 million of catastrophe related losses for the twelve months ended December 31, 2005.(4) Includes the results of certain AIG managed private equity and real estate funds that are consolidated effective
December 31, 2003 pursuant to FIN46R, "Consolidation of Variable Interest Entities". (5) Includes the effect of hedging activities that do not qualifiy for hedge accounting treatment under FAS 133,
including the related foreign exchange gains and losses.
Three Months Ended December 31, Twelve Months Ended December 31,
American International Group, Inc.Asset Management Operating Statistics (1)
(dollars in millions)
28

2005 2004 2005 2004Guaranteed investment contracts:
DepositsDomestic $ - $ 1,952 $ 2,255 $ 10,722Foreign 2,772 1,316 8,370 5,312
Total 2,772 3,268 10,625 16,034
Reserves Domestic 38,629 44,558Foreign 10,153 9,239
Total 48,782 53,797
Domestic Spread InformationBase investment income 529 563 2,211 2,212Partnerships 109 149 565 398Other enhancements 46 37 127 118
Total net investment income $ 684 $ 749 $ 2,903 $ 2,728
Base Yield 5.41% 5.19% 5.31% 5.33%Partnerships (1) 0.49% 0.89% 0.80% 0.53%Other enhancements (2) 0.48% 0.35% 0.30% 0.28%
Total 6.38% 6.43% 6.41% 6.14%
Spread Data Without Hedge Accounting (3)Cost of funds (3) 4.63% 3.51% 4.20% 3.33%
Net spread rate, as reported (3) 1.74% 2.92% 2.21% 2.81%Net spread rate excluding partnerships and other enhancements (3) 0.78% 1.69% 1.11% 2.01%
Spread Data Assuming Hedge Accounting (4)Cost of funds with effect of economic hedges (4) 4.73% 4.17% 4.49% 4.07%
Net spread rate with effect of economic hedges (4) 1.64% 2.26% 1.93% 2.07%Net economic spread rate excluding partnerships and other enhancements (4) 0.69% 1.03% 0.82% 1.27%
Note: (1) Includes incremental impact to base yield of investments in hedge funds, private equity funds and affordable multi-housing partnerships.
(2) Includes incremental impact to base yields of gains on calls, dollar roll income, prepayment fees and trading gains (losses). (3) Represents cost of funds without FAS 133 accounting for economic hedges where the effects of derivative transactions
are recorded in realized capital gains (losses).(4) Represents cost of funds on an economic basis including the effects of derivative transactions not accounted for under
FAS 133.
Three Months Ended December 31, Twelve Months Ended December 31,
American International Group, Inc.Asset Management Other Data
(dollars in millions)
29

2005 2004 2005 2004(Restated) (Restated)
Equity (loss) in unconsolidated subsidiaries $ (15) $ 73 $ (124) $ 157Compensation expense with respect to the SICO Plans (75) (20) (205) (62)Interest expense, including distributions on the liabilities
connected to trust preferred stock (150) (114) (509) (435)Unallocated corporate expenses and related (118) (76) (412) (299)FAS 133 adjustment (321) 301 340 322Regulatory settlement costs (1,644) (16) (1,644) (16) Other (73) - (146) -
Total other income (deductions) - net $ (2,396) $ 148 $ (2,700) $ (333)
Three Months Ended December 31, Twelve Months Ended December 31,
American International Group, Inc.Other Income (Deductions) - net
(dollars in millions)
30
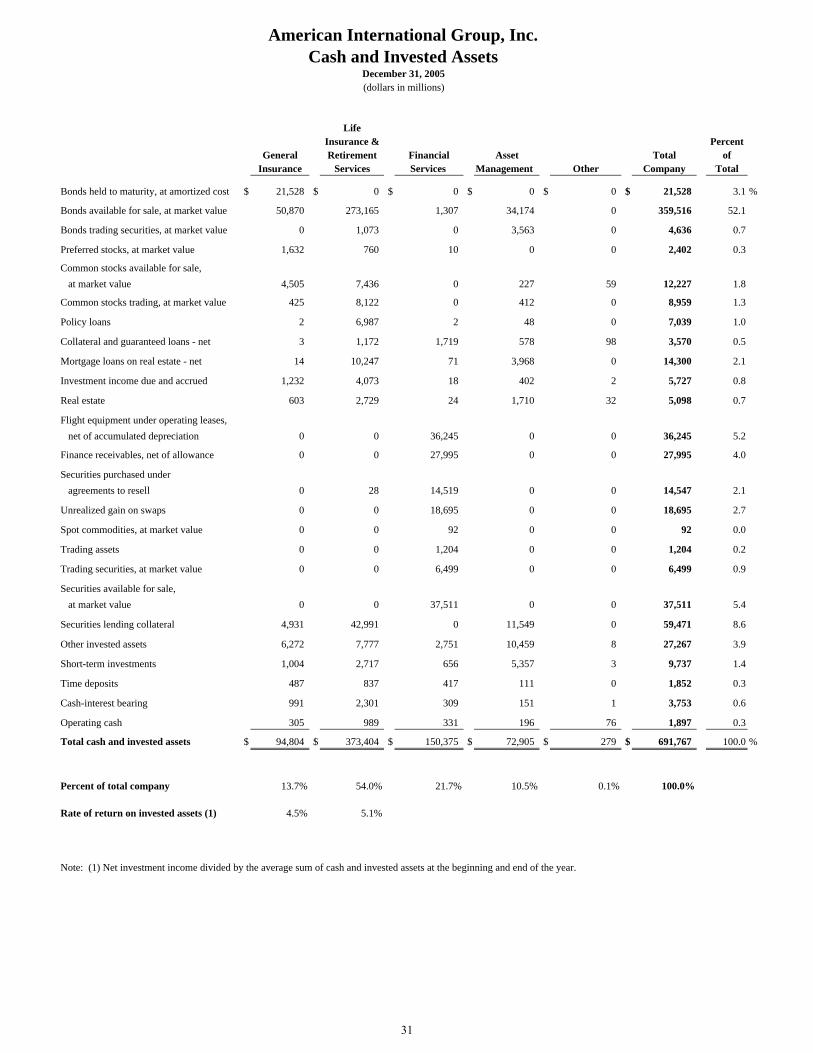
American International Group, Inc.Cash and Invested Assets
December 31, 2005(dollars in millions)
LifeInsurance & Percent
General Retirement Financial Asset Total ofInsurance Services Services Management Other Company Total
Bonds held to maturity, at amortized cost $ 21,528 $ 0 $ 0 $ 0 $ 0 $ 21,528 3.1 %
Bonds available for sale, at market value 50,870 273,165 1,307 34,174 0 359,516 52.1
Bonds trading securities, at market value 0 1,073 0 3,563 0 4,636 0.7
Preferred stocks, at market value 1,632 760 10 0 0 2,402 0.3
Common stocks available for sale, at market value 4,505 7,436 0 227 59 12,227 1.8
Common stocks trading, at market value 425 8,122 0 412 0 8,959 1.3
Policy loans 2 6,987 2 48 0 7,039 1.0
Collateral and guaranteed loans - net 3 1,172 1,719 578 98 3,570 0.5
Mortgage loans on real estate - net 14 10,247 71 3,968 0 14,300 2.1
Investment income due and accrued 1,232 4,073 18 402 2 5,727 0.8
Real estate 603 2,729 24 1,710 32 5,098 0.7
Flight equipment under operating leases, net of accumulated depreciation 0 0 36,245 0 0 36,245 5.2
Finance receivables, net of allowance 0 0 27,995 0 0 27,995 4.0
Securities purchased under agreements to resell 0 28 14,519 0 0 14,547 2.1
Unrealized gain on swaps 0 0 18,695 0 0 18,695 2.7
Spot commodities, at market value 0 0 92 0 0 92 0.0
Trading assets 0 0 1,204 0 0 1,204 0.2
Trading securities, at market value 0 0 6,499 0 0 6,499 0.9
Securities available for sale, at market value 0 0 37,511 0 0 37,511 5.4
Securities lending collateral 4,931 42,991 0 11,549 0 59,471 8.6
Other invested assets 6,272 7,777 2,751 10,459 8 27,267 3.9
Short-term investments 1,004 2,717 656 5,357 3 9,737 1.4
Time deposits 487 837 417 111 0 1,852 0.3
Cash-interest bearing 991 2,301 309 151 1 3,753 0.6
Operating cash 305 989 331 196 76 1,897 0.3
Total cash and invested assets $ 94,804 $ 373,404 $ 150,375 $ 72,905 $ 279 $ 691,767 100.0 %
Percent of total company 13.7% 54.0% 21.7% 10.5% 0.1% 100.0%
Rate of return on invested assets (1) 4.5% 5.1%
Note: (1) Net investment income divided by the average sum of cash and invested assets at the beginning and end of the year.
31

American International Group, Inc. Cash and Invested Assets
December 31, 2005 (dollars in millions)
PercentGeneral Insurance of
Domestic Foreign Total Total
Bonds held to maturity, at amortized cost $ 21,528 $ 0 $ 21,528 22.7 %
Bonds available for sale, at market value 34,688 16,182 50,870 53.7
Bonds trading securities, at market value 0 0 0 0.0
Preferred stocks, at market value 1,631 1 1,632 1.7
Common stocks available for sale, at market value 3,137 1,368 4,505 4.8
Common stocks trading, at market value 425 0 425 0.4
Policy loans 0 2 2 0.0
Collateral and guaranteed loans - net 0 3 3 0.0
Mortgage loans on real estate - net 9 5 14 0.0
Investment income due and accrued 927 305 1,232 1.3
Real estate 230 373 603 0.6
Flight equipment under operating leases, net of accumulated depreciation 0 0 0 0.0
Finance receivables, net of allowance 0 0 0 0.0
Securities purchased under agreements to resell 0 0 0 0.0
Unrealized gain on swaps 0 0 0 0.0
Spot commodities, at market value 0 0 0 0.0
Trading assets 0 0 0 0.0
Trading securities, at market value 0 0 0 0.0
Securities available for sale, at market value 0 0 0 0.0
Securities lending collateral 1,267 3,664 4,931 5.2
Other invested assets 5,402 870 6,272 6.6
Short-term investments 599 405 1,004 1.2
Time deposits 9 478 487 0.5
Cash-interest bearing 231 760 991 1.0
Operating cash 146 159 305 0.3
Total cash and invested assets $ 70,229 $ 24,575 $ 94,804 100.0 %
Percent of total company 10.1% 3.6% 13.7%
32

American International Group, Inc. Cash and Invested Assets
December 31, 2005 (dollars in millions)
Percent Life Insurance & Retirement Services of
Domestic Foreign Total Total
Bonds held to maturity, at amortized cost $ 0 $ 0 $ 0 0.0 %
Bonds available for sale, at market value 144,225 128,940 273,165 73.2
Bonds trading securities, at market value 154 919 1,073 0.3
Preferred stocks, at market value 494 266 760 0.2
Common stocks available for sale, at market value 132 7,304 7,436 2.0
Common stocks trading, at market value 1 8,121 8,122 2.2
Policy loans 2,963 4,024 6,987 1.9
Collateral and guaranteed loans - net 0 1,172 1,172 0.3
Mortgage loans on real estate - net 8,114 2,133 10,247 2.7
Investment income due and accrued 1,924 2,149 4,073 1.1
Real estate 375 2,354 2,729 0.7
Flight equipment under operating leases, net of accumulated depreciation 0 0 0 0.0
Finance receivables, net of allowance 0 0 0 0.0
Securities purchased under agreements to resell 0 28 28 0.0
Unrealized gain on swaps 0 0 0 0.0
Spot commodities, at market value 0 0 0 0.0
Trading assets 0 0 0 0.0
Trading securities, at market value 0 0 0 0.0
Securities available for sale, at market value 0 0 0 0.0
Securities lending collateral 39,094 3,897 42,991 11.5
Other invested assets 5,421 2,356 7,777 2.1
Short-term investments 528 2,189 2,717 0.7
Time deposits 0 837 837 0.2
Cash-interest bearing 774 1,527 2,301 0.6
Operating cash 53 936 989 0.3
Total cash and invested assets $ 204,252 $ 169,152 $ 373,404 100.0 %
Percent of total company 29.5% 24.5% 54.0%
33

American International Group, Inc.Cash and Invested Assets
December 31, 2005(dollars in millions)
Financial ServicesOther Percent
Aircraft Capital Consumer Financial ofFinance Markets Finance Services Total Total
Bonds held to maturity, at amortized cost $ 0 $ 0 $ 0 $ 0 $ 0 0.0 %
Bonds available for sale, at market value 0 0 1,307 0 1,307 0.9
Bonds trading securities, at market value 0 0 0 0 0 0.0
Preferred stocks, at market value 0 0 10 0 10 0.0
Common stocks available for sale, at market value 0 0 0 0 0 0.0
Common stocks trading, at market value 0 0 0 0 0 0.0
Policy loans 0 0 2 0 2 0.0
Collateral and guaranteed loans - net 191 1,528 0 0 1,719 1.1
Mortgage loans on real estate - net 0 0 61 10 71 0.0
Investment income due and accrued 0 0 18 0 18 0.0
Real estate 0 0 24 0 24 0.0
Flight equipment under operating leases, net of accumulated depreciation 36,245 0 0 0 36,245 24.1
Finance receivables, net of allowance 0 0 27,613 382 27,995 18.6
Securities purchased under agreements to resell 0 14,519 0 0 14,519 9.7
Unrealized gain on swaps 0 18,695 0 0 18,695 12.4
Spot commodities, at market value 0 92 0 0 92 0.1
Trading assets 0 1,204 0 0 1,204 0.8
Trading securities, at market value 0 6,499 0 0 6,499 4.3
Securities available for sale, at market value 0 37,511 0 0 37,511 24.9
Securities lending collateral 0 0 0 0 0 0.0
Other invested assets 325 1,846 501 79 2,751 1.9
Short-term investments 68 0 378 210 656 0.5
Time deposits 0 401 16 0 417 0.3
Cash-interest bearing 88 74 147 0 309 0.2
Operating cash 2 3 247 79 331 0.2
Total cash and invested assets $ 36,919 $ 82,372 $ 30,324 $ 760 $ 150,375 100.0 %
Percent of total company 5.3% 11.9% 4.4% 0.1% 21.7%
34

American International Group, Inc.Worldwide Insurance and Asset Management
Bond PortfolioDecember 31, 2005
Total Foreign Bond Portfolio Ratings *
* Ratings by nationally recognized rating agencies or similar foreign services. AIG reviews the credit quality of the foreign portfolio non-rated fixed income investments.
Total Domestic Bond Portfolio Ratings
Non-Rated 1% BBB
8%
A33%
AA36%
AAA19%
Lower3%
AA15%
AAA35%
Lower5% Non-Rated
1%
BBB20%
A24%
Foreign Bonds$150.8 billion
Domestic Bonds$233.6 billion
35

American International Group, Inc.Domestic Insurance and Asset Management
Bond PortfolioDecember 31, 2005
Domestic General Insurance
Bond RatingsAAA.............................. 74.8%
AA................................ 17.3%
A................................... 6.5%
BBB.............................. 0.7%
Non-Rated.................... 0.2%
Lower........................... 0.5%
Domestic General Insurance Bonds$56.2 billion
Domestic Life Insurance & Retirement Services and Asset Management
Bond RatingsAAA.............................. 22.7%
AA................................ 13.8%
A................................... 29.5%
BBB.............................. 26.7%
Non-Rated.................... 0.2%
Lower........................... 7.1%
Domestic Life Insurance &Retirement Services and
Asset Management Bonds $177.4 billion
Taxable16.3%
Tax Exempt83.7%
36

Comment on Regulation G
This financial supplement includes certain non-GAAP financial measures. The reconciliations of such measures to the most comparable GAAP figures in accordance with Regulation G are included within the relevant tables.
Throughout this financial supplement, AIG presents its operations in the way it
believes will be most meaningful and useful, as well as most transparent, to the investing public and others who use AIG’s financial information in evaluating the performance of AIG. That presentation includes the use of certain non-GAAP measures. In addition to the GAAP presentations, in some cases revenues, net income, operating income and related rates of performance are shown exclusive of realized capital gains (losses), cumulative effect of an accounting change in 2004, the effect of FIN46R, the effect of FAS 133 and the effect of the catastrophe related losses, settlement charges and the general insurance reserve charge.
Although the investment of premiums to generate investment income (or loss) and
realized capital gains or losses is an integral part of both life and general insurance operations, the determination to realize capital gains or losses is independent of the insurance underwriting process. Moreover, under applicable GAAP accounting requirements, losses can be created as the result of other than temporary declines in value without actual realization. In sum, investment income and realized capital gains or losses for any particular period are not indicative of business performance for such period.
AIG believes that a major part of the discipline of a successful general insurance
company is to produce an underwriting profit, and it evaluates the performance of and manages its operations on that basis. Providing only a GAAP presentation of net income and operating income makes it much more difficult for users of AIG’s financial information to evaluate AIG’s success or failure in its basic business, that of insurance underwriting, and may, in AIG’s opinion, lead to a less meaningful presentation of AIG’s operations. The equity analysts who follow AIG exclude the realized capital transactions in their analyses for the same reason, and consistently request that AIG provide the non-GAAP information.
Life and retirement services production (premiums, deposits and other
considerations), gross premiums written, net premiums written and combined ratios are presented in accordance with accounting principles prescribed or permitted by insurance regulatory authorities because these are standard measures of performance used in the insurance industry and thus allow for more meaningful comparisons with AIG’s insurance competitors.
37