financial statements - fortumapps.fortum.fi/gallery2/fortum_financials_2015.pdf · this report...
TRANSCRIPT

Financial Statements2015

Financials 2015 – Reader’s guideThis report consists of the operating and financial review and the consolidated financial statements of Fortum Group, including an extract of the parent company financial statements. Other parts of Fortum's reporting entity include corporate governance statement, remuneration statement as well as tax footprint, which are published at the same time on Fortum's webpage. Sustainability reporting is an integrated part of Fortum's annual reporting and additional information on sustainabilty operations can also be found on Forum's website in sustainability section.
Operating and financial reviewThis section includes description of Fortum's financial performance during 2015. Here you will also find a description of the risk management as well as information on Fortum share performance.
Proposal for the distribution of earningsThe Board of Directors proposal for the dividend in 2015 is disclosed in this section.
NotesThe notes to the consolidated financial statements are grouped to six sections based on their nature. Use the note number list on the right side of the notes pages to navigate in the financial statements.
Auditor’s reportThis section includes the audit report issued by Fortum Oyj's auditor, Deloitte & Touche Oy.
Primary statementsPrimary statements include Fortum's consolidated income statement, statement of comprehensive income, balance sheet, statement of changes in total equity and cash flow statement.
Quarterly financial informationLook here for quarterly financial information for the years 2014 and 2015. This section includes also quarterly sales and comparable operating profit by segments.
Parent company financial statementsRead here an extract of the parent company financial statements including the primary statements, information on changes in equity and management remuneration. Full set of parent company financial statements is available on www.fortum.com/investors.
Investor informationHere you will find information on Fortum's Annual General Meeting, dividend payment, basic share information as well as details of the financial information available to shareholders in 2016.
Notes are grouped to the following sections:
Key figuresKey figures consist of financial key figures, share key figures and operational key figures for 2006–2015. The financial key figures derive mainly from the primary statements. Operational key figures include information on volumes and segments.
3–4 RisksIn the Risks section you will find notes that disclose how Fortum manages financial risks and capital risks.
16–34 Balance sheetThese notes provide supporting information for the balance sheet.
41–43 Group structure and related partiesThis section includes information on events after balance sheet date, acquisition and disposals, related party transactions and the subsidiaries of Fortum group.
1–2 Basis of preparationThese notes describe the basis of preparing the consolidated financial statements and consist of the accounting policies and critical accounting estimates and judgements.
5–15 Income statementThese notes provide supporting information for the income statement.
35–40 Off balance sheet itemsThe notes in this section provide information on items that are not included in the balance sheet.
Proposal for the distribution of earnings Auditor’s reportPrimary statements Quarterly financial informationParent company financial statements Investor informationOperating and financial review Key figuresNotes
IS = Income statementBS = Balance sheetCF = Cash flow
The following symbols show which amounts in the notes reconcile to the items in income statement, balance sheets and cash flow statement.
1
Financials 2015Reader’s guide . . . . . . . . . . . . . . . . . . . . . . . . . . . . . . . . . . . . . . . . . . . . . . . . . . . . . . . . . . . 1
Operating and financial review . . . . . . . . . . . . . . . . . . . . . . . . . . . . . . . . . . . . . . 3Financial performance and position . . . . . . . . . . . . . . . . . . . . . . . . . . . . . . . . . . 3Risk management . . . . . . . . . . . . . . . . . . . . . . . . . . . . . . . . . . . . . . . . . . . . . . . . . . . . . . 18Fortum share and shareholders . . . . . . . . . . . . . . . . . . . . . . . . . . . . . . . . . . . . . . 23
Primary statements – Consolidated financial statements . . . . 26Consolidated income statement . . . . . . . . . . . . . . . . . . . . . . . . . . . . . . . . . . . . . 26Consolidated statement of comprehensive income . . . . . . . . . . . . . . . 27Consolidated balance sheet . . . . . . . . . . . . . . . . . . . . . . . . . . . . . . . . . . . . . . . . . . 28Consolidated statement of changes in total equity . . . . . . . . . . . . . . . . 29Consolidated cash flow statement . . . . . . . . . . . . . . . . . . . . . . . . . . . . . . . . . . . 30
Notes to the consolidated financial statements . . . . . . . . . . . . . . . . 32 1 Accounting policies . . . . . . . . . . . . . . . . . . . . . . . . . . . . . . . . . . . . . . . . . . . . . . 32 2 Critical accounting estimates and judgements . . . . . . . . . . . . . . . . 35 3 Financial risk management . . . . . . . . . . . . . . . . . . . . . . . . . . . . . . . . . . . . . . 35 4 Capital risk management . . . . . . . . . . . . . . . . . . . . . . . . . . . . . . . . . . . . . . . . 41 5 Segment reporting . . . . . . . . . . . . . . . . . . . . . . . . . . . . . . . . . . . . . . . . . . . . . . . 42 6 Items affecting comparability . . . . . . . . . . . . . . . . . . . . . . . . . . . . . . . . . . . 47 7 Effects from early closure of nuclear units in Sweden . . . . . . . . . 47 8 Fair value changes of derivatives and underlying items in income statement. . . . . . . . . . . . . . . . . . . . . . . . . . 48 9 Other income and other expenses . . . . . . . . . . . . . . . . . . . . . . . . . . . . . . 49 10 Materials and services. . . . . . . . . . . . . . . . . . . . . . . . . . . . . . . . . . . . . . . . . . . 49 11 Employee benefits . . . . . . . . . . . . . . . . . . . . . . . . . . . . . . . . . . . . . . . . . . . . . . . 50 12 Finance costs – net . . . . . . . . . . . . . . . . . . . . . . . . . . . . . . . . . . . . . . . . . . . . . . 54 13 Income tax expense . . . . . . . . . . . . . . . . . . . . . . . . . . . . . . . . . . . . . . . . . . . . . 55 14 Discontinued operations . . . . . . . . . . . . . . . . . . . . . . . . . . . . . . . . . . . . . . . . 56
15 Earnings and dividend per share . . . . . . . . . . . . . . . . . . . . . . . . . . . . . . 57 16 Financial assets and liabilities by categories . . . . . . . . . . . . . . . . . . . 57 17 Financial assets and liabilities by fair value hierarchy . . . . . . . . . 61 18 Intangible assets . . . . . . . . . . . . . . . . . . . . . . . . . . . . . . . . . . . . . . . . . . . . . . . . . 64 19 Property, plant and equipment . . . . . . . . . . . . . . . . . . . . . . . . . . . . . . . . . . 65 20 Participations in associated companies and joint ventures . . . 70 21 Other non-current assets . . . . . . . . . . . . . . . . . . . . . . . . . . . . . . . . . . . . . . . . 74 22 Long-term and short-term interest-bearing receivables . . . . . . . 74 23 Inventories . . . . . . . . . . . . . . . . . . . . . . . . . . . . . . . . . . . . . . . . . . . . . . . . . . . . . . . 75 24 Trade and other receivables . . . . . . . . . . . . . . . . . . . . . . . . . . . . . . . . . . . . . 75 25 Liquid funds . . . . . . . . . . . . . . . . . . . . . . . . . . . . . . . . . . . . . . . . . . . . . . . . . . . . . . 76 26 Share capital . . . . . . . . . . . . . . . . . . . . . . . . . . . . . . . . . . . . . . . . . . . . . . . . . . . . . 76 27 Non-controlling interests . . . . . . . . . . . . . . . . . . . . . . . . . . . . . . . . . . . . . . . . 77 28 Interest-bearing liabilities . . . . . . . . . . . . . . . . . . . . . . . . . . . . . . . . . . . . . . . . 77 29 Deferred income taxes . . . . . . . . . . . . . . . . . . . . . . . . . . . . . . . . . . . . . . . . . . 79 30 Nuclear related assets and liabilities . . . . . . . . . . . . . . . . . . . . . . . . . . . 81 31 Other provisions . . . . . . . . . . . . . . . . . . . . . . . . . . . . . . . . . . . . . . . . . . . . . . . . . 83 32 Pension obligations . . . . . . . . . . . . . . . . . . . . . . . . . . . . . . . . . . . . . . . . . . . . . . 84 33 Other non-current liabilities . . . . . . . . . . . . . . . . . . . . . . . . . . . . . . . . . . . . . 88 34 Trade and other payables . . . . . . . . . . . . . . . . . . . . . . . . . . . . . . . . . . . . . . . . 88 35 Pledged assets . . . . . . . . . . . . . . . . . . . . . . . . . . . . . . . . . . . . . . . . . . . . . . . . . . . 88 36 Lease commitments . . . . . . . . . . . . . . . . . . . . . . . . . . . . . . . . . . . . . . . . . . . . . 89 37 Capital commitments . . . . . . . . . . . . . . . . . . . . . . . . . . . . . . . . . . . . . . . . . . . . 89 38 Contingent liabilities . . . . . . . . . . . . . . . . . . . . . . . . . . . . . . . . . . . . . . . . . . . . . 90 39 Legal actions and official proceedings . . . . . . . . . . . . . . . . . . . . . . . . . 90 40 Events after the balance sheet date . . . . . . . . . . . . . . . . . . . . . . . . . . . . 92 41 Acquisitions and disposals . . . . . . . . . . . . . . . . . . . . . . . . . . . . . . . . . . . . . . 92 42 Related party transactions . . . . . . . . . . . . . . . . . . . . . . . . . . . . . . . . . . . . . . 93 43 Subsidiaries by segment on 31 December 2015 . . . . . . . . . . . . . . 94
Key figures . . . . . . . . . . . . . . . . . . . . . . . . . . . . . . . . . . . . . . . . . . . . . . . . . . . . . . . . . . . . . 96Financial key figures . . . . . . . . . . . . . . . . . . . . . . . . . . . . . . . . . . . . . . . . . . . . . . . . . . . 96Share key figures . . . . . . . . . . . . . . . . . . . . . . . . . . . . . . . . . . . . . . . . . . . . . . . . . . . . . . . 98Operational key figures . . . . . . . . . . . . . . . . . . . . . . . . . . . . . . . . . . . . . . . . . . . . . . . . 99Definitions of key figures . . . . . . . . . . . . . . . . . . . . . . . . . . . . . . . . . . . . . . . . . . . . .106
Extract of the parent company financial statements . . . . . . . . .108Income statement . . . . . . . . . . . . . . . . . . . . . . . . . . . . . . . . . . . . . . . . . . . . . . . . . . . . .108Balance sheet . . . . . . . . . . . . . . . . . . . . . . . . . . . . . . . . . . . . . . . . . . . . . . . . . . . . . . . . . .108Changes in shareholder’s equity . . . . . . . . . . . . . . . . . . . . . . . . . . . . . . . . . . . .108Cash flow statement . . . . . . . . . . . . . . . . . . . . . . . . . . . . . . . . . . . . . . . . . . . . . . . . . .109Management remuneration . . . . . . . . . . . . . . . . . . . . . . . . . . . . . . . . . . . . . . . . . .109
Proposal for the distribution of earnings . . . . . . . . . . . . . . . . . . . . . . . .110
Auditor’s report . . . . . . . . . . . . . . . . . . . . . . . . . . . . . . . . . . . . . . . . . . . . . . . . . . . . . .111
Quarterly financial information . . . . . . . . . . . . . . . . . . . . . . . . . . . . . . . . . . . .112
Investor information . . . . . . . . . . . . . . . . . . . . . . . . . . . . . . . . . . . . . . . . . . . . . . . . .114
Proposal for the distribution of earnings Auditor’s reportPrimary statements Quarterly financial informationParent company financial statements Investor informationOperating and financial review Key figuresNotes
2
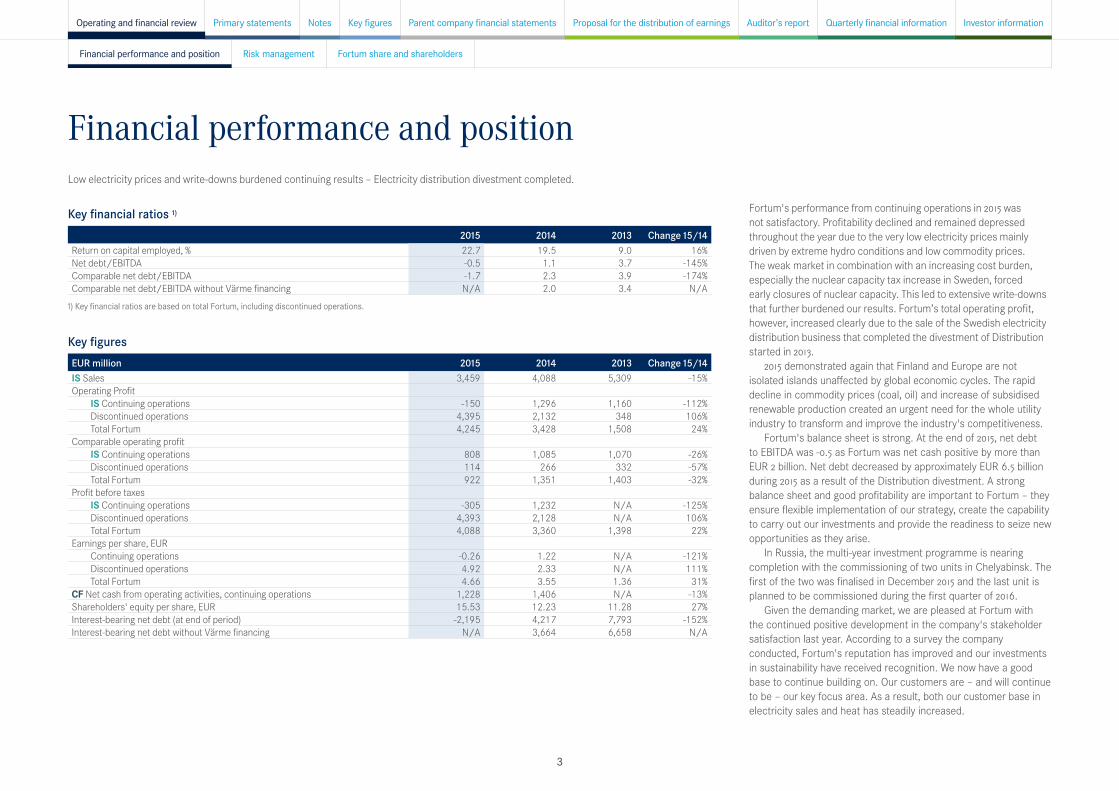
Key financial ratios 1)
2015 2014 2013 Change 15/14Return on capital employed, % 22.7 19.5 9.0 16%Net debt/EBITDA -0.5 1.1 3.7 -145%Comparable net debt/EBITDA -1.7 2.3 3.9 -174% Comparable net debt/EBITDA without Värme financing N/A 2.0 3.4 N/A
1) Key financial ratios are based on total Fortum, including discontinued operations.
Key figuresEUR million 2015 2014 2013 Change 15/14IS Sales 3,459 4,088 5,309 -15%Operating Profit
IS Continuing operations -150 1,296 1,160 -112%Discontinued operations 4,395 2,132 348 106%Total Fortum 4,245 3,428 1,508 24%
Comparable operating profitIS Continuing operations 808 1,085 1,070 -26%Discontinued operations 114 266 332 -57%Total Fortum 922 1,351 1,403 -32%
Profit before taxesIS Continuing operations -305 1,232 N/A -125%Discontinued operations 4,393 2,128 N/A 106%Total Fortum 4,088 3,360 1,398 22%
Earnings per share, EURContinuing operations -0.26 1.22 N/A -121%Discontinued operations 4.92 2.33 N/A 111%Total Fortum 4.66 3.55 1.36 31%
CF Net cash from operating activities, continuing operations 1,228 1,406 N/A -13%Shareholders' equity per share, EUR 15.53 12.23 11.28 27%Interest-bearing net debt (at end of period) -2,195 4,217 7,793 -152%Interest-bearing net debt without Värme financing N/A 3,664 6,658 N/A
Financial performance and positionLow electricity prices and write-downs burdened continuing results – Electricity distribution divestment completed.
Fortum's performance from continuing operations in 2015 was not satisfactory. Profitability declined and remained depressed throughout the year due to the very low electricity prices mainly driven by extreme hydro conditions and low commodity prices. The weak market in combination with an increasing cost burden, especially the nuclear capacity tax increase in Sweden, forced early closures of nuclear capacity. This led to extensive write-downs that further burdened our results. Fortum’s total operating profit, however, increased clearly due to the sale of the Swedish electricity distribution business that completed the divestment of Distribution started in 2013.
2015 demonstrated again that Finland and Europe are not isolated islands unaffected by global economic cycles. The rapid decline in commodity prices (coal, oil) and increase of subsidised renewable production created an urgent need for the whole utility industry to transform and improve the industry's competitiveness.
Fortum's balance sheet is strong. At the end of 2015, net debt to EBITDA was -0.5 as Fortum was net cash positive by more than EUR 2 billion. Net debt decreased by approximately EUR 6.5 billion during 2015 as a result of the Distribution divestment. A strong balance sheet and good profitability are important to Fortum – they ensure flexible implementation of our strategy, create the capability to carry out our investments and provide the readiness to seize new opportunities as they arise.
In Russia, the multi-year investment programme is nearing completion with the commissioning of two units in Chelyabinsk. The first of the two was finalised in December 2015 and the last unit is planned to be commissioned during the first quarter of 2016.
Given the demanding market, we are pleased at Fortum with the continued positive development in the company's stakeholder satisfaction last year. According to a survey the company conducted, Fortum's reputation has improved and our investments in sustainability have received recognition. We now have a good base to continue building on. Our customers are – and will continue to be – our key focus area. As a result, both our customer base in electricity sales and heat has steadily increased.
Financial performance and position Risk management Fortum share and shareholders
Proposal for the distribution of earnings Auditor’s reportPrimary statements Quarterly financial informationParent company financial statements Investor informationOperating and financial review Key figuresNotes
3

Sales, EUR million7,500
5,000
2,500
02011 2012 2013 2014 2015
Operating profit and comparable operating profit continuing operations, EUR million
Operating profit Comparable operating profit
2011 2012 2013 2014 2015
2,500
2,000
1,500
1,000
500
0
-500
Comparability of information presented in tables and graphsFinancial results discussed in this operating and financial review are for the continuing operations of Fortum Group. The Distribution segment has been reclassified as discontinued operations. As a result, continuing operations and discontinued operations are presented separately for Fortum Group. Comparative period information for 2014 has been restated accordingly and can be found in the stock exchange release published on 15 April 2015. Information in the tables and graphs presented for year 2013 or earlier is not
Return on shareholders’ equity total Fortum, %3530 25 20 1510
5 0
2011 2012 2013 2014 2015
Earnings per share total Fortum, EUR5.0
4.0
3.0
2.0
1.0
0.02011 2012 2013 2014 2015
Return on capital employed total Fortum, %
Return on capital employed, % Target % until 2015
25
20
15
10
5
02011 2012 2013 2014 2015
Fortum's Distribution divestment completed
In June 2015, Fortum completed the divestment of its Swedish electricity distribution business.
The total consideration was approximately SEK 60.6 billion on a debt- and cash-free basis, corresponding to approximately EUR 6.4 billion. Fortum booked a one-time sales gain of approximately EUR 4.3 billion, corresponding to EUR 4.82 per share, in the second-quarter 2015 results.
The transaction concluded the divestment of Fortum's Distribution business, a process that began in 2013. The total consideration from the divestments in Finland, Sweden and Norway is approximately EUR 9.3 billion on a debt- and cash-free basis and approximately EUR 6.2 billion in non-taxable sales gains booked during 2014 and 2015.
IFRS restatement relating to discontinued operations After the divestment of the Swedish electricity distribution business, Fortum has no electricity distribution operations. Therefore, as of the first-quarter 2015 interim report, the Distribution segment has been treated as discontinued operations, consistent with IFRS 5 "Non-current assets held for sale and Discontinued operations". The income statement, including other comprehensive income, cash flow statement and certain key ratios has been restated for the 2014 comparative period. In the segment information, the Distribution segment is reclassified as discontinued operations.
restated due to reclassification of discontinued operations. For further information, see Note 1.2.1.
Furthermore, information in the tables and graphs presented for year 2012 or earlier is not restated due to the adoption of IFRS 10 and IFRS 11. Adoption of standards influences treatment of Fortum’s holding in AB Fortum Värme samägt med Stockholms stad in the the consolidated financial statements.
In addition, as of 2014, presented figures have been rounded and consequently the sum of individual figures may deviate from the sum presented.
Figures in brackets refer to the comparison period unless otherwise stated.
Financial performance and position Risk management Fortum share and shareholders
Proposal for the distribution of earnings Auditor’s reportPrimary statements Quarterly financial informationParent company financial statements Investor informationOperating and financial review Key figuresNotes
4

Sales by segmentEUR million 2015 2014 Change 15/14Power and Technology 1,722 2,156 -20%Heat, Electricity Sales and Solutions 1,187 1,332 -11%Russia 893 1,055 -15%Other 114 58 97%Netting of Nord Pool transactions 1) -336 -422Eliminations -122 -91IS Total continuing operations 3,459 4,088 -15%Discontinued operations 274 751 -64%Eliminations -31 -89Total Fortum 3,702 4,751 -22%
1) Sales and purchases with Nord Pool are netted at the Group level on an hourly basis and posted either as revenue or cost depending on whether Fortum is a net seller or net buyer during any particular hour.
Comparable operating profit by segmentEUR million 2015 2014 Change 15/14Power and Technology 561 877 -36%Heat, Electricity Sales and Solutions 108 104 4%Russia 201 161 25%Other -63 -57 -11%IS Total continuing operations 808 1,085 -26%Discontinued operations 114 266 -57%Total Fortum 922 1,351 -32%
Operating profit by segmentEUR million 2015 2014 Change 15/14Power and Technology -396 855 -146%Heat, Electricity Sales and Solutions 105 337 -69%Russia 203 161 26%Other -62 -58 -7%IS Total continuing operations -150 1,296 -112%Discontinued operations 4,395 2,132 106%Total Fortum 4,245 3,428 24%
For further information see Note 5 Segment reporting.
Financial results
In 2015, sales were EUR 3,459 (4,088) million, the decrease was mainly due to weak power prices and the Russian rouble. Comparable operating profit totalled EUR 808 (1,085) million and the reported operating profit totalled EUR -150 (1,296) million. Fortum's operating profit for the period was affected by EUR -794 million impact from the early closure of Oskarshamn nuclear units 1 and 2 (O1 and O2) in Sweden (for further information see Note 7), other impairments and provisions EUR -124 (0) million as well as non-recurring items EUR 22 (305 million), an IFRS accounting treatment (IAS 39) of derivatives mainly used for hedging Fortum's power production and nuclear fund adjustments for continuing operations amounting to EUR -62 (-94 million). Total Fortum’s operating profit EUR 4,245 (3,428) million includes the sales gain from the divestment of the Swedish electricity distribution business, approximately EUR 4.3 billion (approximately EUR 1.9 billion from Finnish and Norwegian operations in 2014).
The share of profit from associates was EUR 20 (146) million, the negative impact came mainly from the write-down of Oskarshamn nuclear units 1 and 2, in Sweden. The impact on earnings per share from the early closure of nuclear units O1 and O2 was EUR -0.82 per share. Fortum Värme represented EUR 47 (67) million, the decrease was mainly due to Fortum Värme’s compensation to Fortum related to early prepayment of loans. The share of profit from Hafslund and TGC-1 are based on the companies' published third-quarter 2015 interim reports.
The net financial expenses were EUR -175 (-210) million. Net financial expenses include changes in the fair value of financial instruments of EUR -18 (-5) million.
Profit before taxes was EUR -305 (1,232) million.Taxes for the period totalled EUR 78 (-143) million. Taxes for the period are positive as the group is in
loss position. This is mainly due to the write-down related to early closure of nuclear units O1 and O2 units in Sweden. The tax rate according to the income statement was 25.4% (11.6%). The tax rate, excluding the impact of the share of profit from associated companies, joint ventures as well as non-taxable capital gains, was 23.5% (2014: 18.0%).
The profit for the period for continuing operations was EUR -228 (1,089) million. Earnings per share for continuing operations were EUR -0.26 (1.22), of which EUR -0.97 (0.26) per share relates to items affecting comparability, including total effect related to early closure of nuclear units O1 and O2. Earnings per share for total Fortum, including the effect from discontinued operations, were EUR 4.66 (3.55), including the EUR 4.82 gain from the sale of the Swedish electricity distribution business. Earnings per share for total Fortum in 2014 were impacted by EUR 2.08 per share from the sale of the Finnish electricity distribution business.
Financial performance and position Risk management Fortum share and shareholders
Proposal for the distribution of earnings Auditor’s reportPrimary statements Quarterly financial informationParent company financial statements Investor informationOperating and financial review Key figuresNotes
5

Financial position and cash flowEUR million 2015 2014 Change 15/14Interest expense -203 -249 18%Interest income 51 84 -39%Fair value gains and losses on financial instruments -18 -5 -260%Other financial expenses - net -4 -40 90%IS Finance costs - net -175 -210 17% Interest-bearing liabilities 6,007 6,983 -14%Less: Liquid funds 8,202 2,766 197%Interest-bearing net debt -2,195 4,217Interest-bearing net debt without Värme financing N/A 3,664
Cash flowIn 2015, net cash from operating activities from continuing operations decreased by EUR 178 million to EUR 1,228 (1,406) million, mainly due to lower EBITDA. Realised foreign exchange gains and losses of EUR 292 (352) million were related to the rollover of foreign exchange contract hedging loans to Fortum's Swedish and Russian subsidiaries. Total net cash from operating activities including discontinued operations amounted to EUR 1,381 (1,762) million.
Capital expenditures for continuing operations decreased by EUR 95 million to EUR 527 (622) million. Net cash from investing activities for total Fortum was EUR 6,268 (2,816) million, including the impact from discontinued operations amounting to EUR 6,303 (2,574) million. Cash flow before financing activities for total Fortum increased by EUR 3,072 million to EUR 7,650 (4,578) million, including the net impact of discontinued operations of EUR 6,457 (2,930) million.
Fortum paid dividends totalling EUR 1,155 million in April 2015. The net increase in liquid funds during the period was EUR 5,490 million.
Assets and capital employedTotal assets increased by EUR 1,392 million to EUR 22,767 (21,375) million.
Liquid funds increased by EUR 5,436 million to EUR 8,202 (2,766) million, and property, plant and equipment decreased by EUR 2,485 million, both arising mainly from the divestment of the Swedish distribution business. The long-term interest-bearing receivables decreased by EUR 1,268 million to EUR 773 (2,041) million mainly due to the early closure of Oskarshamn units 1 and 2 in Sweden and repayments by Fortum Värme. At the end of 2015 Fortum did not have any loan receivables from Fortum Värme.
Capital employed for total Fortum was EUR 19,870 (17,918) million, an increase of EUR 1,952 million.
EquityTotal equity attributable to owners of the parent company totalled EUR 13,794 (10,864) million.
The increase in equity attributable to owners of the parent company totalled EUR 2,930 million and was mainly from the gain on the divestment of Swedish distribution business of approximately EUR 4.3 billion, partly offset by the dividend payment of EUR -1,155 million for 2014.
Interest-bearing net debt, EUR million
Interest-bearing net debt Interest-bearing net debt without Värme financing
10,000
7,500
5,000
2,500
0
-2,5002011 2012 2013 2014 2015
Comparable net debt/EBITDA
2011 2012 2013 2014 2015
Comparable net debt/EBITDA total Fortum Comparable net debt/EBITDA without Värme financing Target, comparable net debt/EBITDA
4.03.0 2.0 1.0 0.0-1.0-2.0
4 217 -4 6403 390 -60 -71 635 -6 424
-480 1 155 83 -2 195
-6 412
Change in net debt during 2015, EUR million
Net debt 2014
CH in working
capital
CH in receivables
Non cashDivest
Fx and otherEBITDA
Capex & acqDividend
Net debt 2015
Finance cost and tax
4,217 -4,6403,390 -60 -71 635 -6,424
-480 1,155 83 -2,195
-6,412
Financial performance and position Risk management Fortum share and shareholders
Proposal for the distribution of earnings Auditor’s reportPrimary statements Quarterly financial informationParent company financial statements Investor informationOperating and financial review Key figuresNotes
6
FinancingFortum was net cash positive at the end of the period as net debt decreased by EUR 6,412 million during 2015 from net debt EUR 4,217 million to net cash EUR 2,195 million.
At the end of 2015, the Group’s liquid funds totalled EUR 8,202 (2,766) million. Liquid funds include cash and bank deposits held by OAO Fortum amounting to EUR 76 (134) million. In addition to liquid funds, Fortum had access to approximately EUR 2.2 billion of undrawn committed credit facilities (See Note 3 Financial risk management).
The net financial expenses were EUR -175 (-210) million of which net interest expenses were EUR -152 (-165) million. Net financial expenses include compensation from prepayment of loans by Fortum Värme EUR 37 million and changes in the fair value of financial instruments of EUR -18 (-5) million.
On 5 June 2015, Standard & Poor's downgraded Fortum’s long-term rating to BBB+ from A- and affirmed the A-2 short-term rating. The outlook is stable. The long-term corporate credit rating was removed from CreditWatch, where it had been placed since 18 March 2015. On 17 November 2015, Fitch Ratings downgraded Fortum’s long-term Issuer Default Rating (IDR) and senior unsecured rating to BBB+ from A-, while affirming the short-term IDR at F2 with a stable outlook.
Key figuresAt year-end 2015, net debt to EBITDA was -0.5 (1.1) and comparable net debt to EBITDA -1.7 (2.3). At year-end 2015, Fortum was no longer financing Fortum Värme.
Gearing was -16% (39%) and the equity-to-assets ratio 61% (51%). Equity per share was EUR 15.53 (12.23). For the year 2015, return on capital employed totalled 22.7% (19.5%).
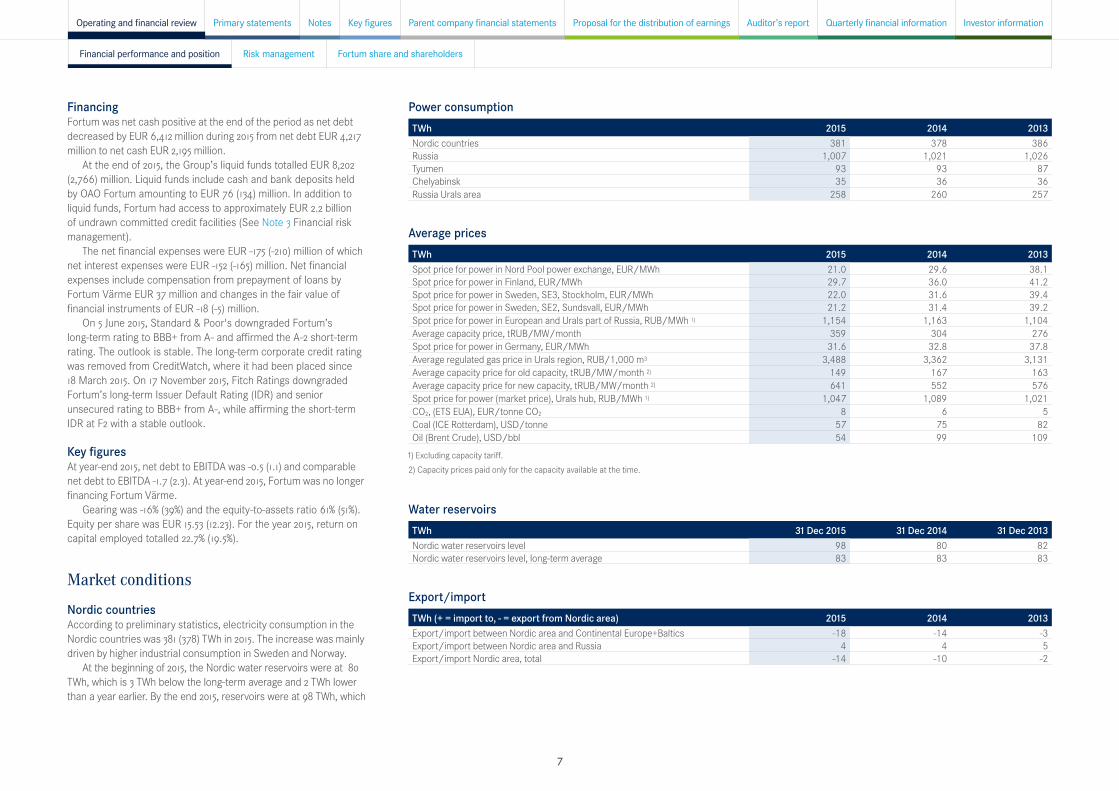
Market conditions
Nordic countriesAccording to preliminary statistics, electricity consumption in the Nordic countries was 381 (378) TWh in 2015. The increase was mainly driven by higher industrial consumption in Sweden and Norway.
At the beginning of 2015, the Nordic water reservoirs were at 80 TWh, which is 3 TWh below the long-term average and 2 TWh lower than a year earlier. By the end 2015, reservoirs were at 98 TWh, which
Power consumptionTWh 2015 2014 2013Nordic countries 381 378 386Russia 1,007 1,021 1,026Tyumen 93 93 87Chelyabinsk 35 36 36Russia Urals area 258 260 257
Average pricesTWh 2015 2014 2013Spot price for power in Nord Pool power exchange, EUR/MWh 21.0 29.6 38.1Spot price for power in Finland, EUR/MWh 29.7 36.0 41.2Spot price for power in Sweden, SE3, Stockholm, EUR/MWh 22.0 31.6 39.4Spot price for power in Sweden, SE2, Sundsvall, EUR/MWh 21.2 31.4 39.2Spot price for power in European and Urals part of Russia, RUB/MWh 1) 1,154 1,163 1,104Average capacity price, tRUB/MW/month 359 304 276Spot price for power in Germany, EUR/MWh 31.6 32.8 37.8Average regulated gas price in Urals region, RUB/1,000 m3 3,488 3,362 3,131Average capacity price for old capacity, tRUB/MW/month 2) 149 167 163Average capacity price for new capacity, tRUB/MW/month 2) 641 552 576Spot price for power (market price), Urals hub, RUB/MWh 1) 1,047 1,089 1,021CO2, (ETS EUA), EUR/tonne CO2 8 6 5Coal (ICE Rotterdam), USD/tonne 57 75 82Oil (Brent Crude), USD/bbl 54 99 109
1) Excluding capacity tariff. 2) Capacity prices paid only for the capacity available at the time.
Water reservoirsTWh 31 Dec 2015 31 Dec 2014 31 Dec 2013Nordic water reservoirs level 98 80 82Nordic water reservoirs level, long-term average 83 83 83
Export/import TWh (+ = import to, - = export from Nordic area) 2015 2014 2013Export/import between Nordic area and Continental Europe+Baltics -18 -14 -3Export/import between Nordic area and Russia 4 4 5Export/import Nordic area, total -14 -10 -2
Financial performance and position Risk management Fortum share and shareholders
Proposal for the distribution of earnings Auditor’s reportPrimary statements Quarterly financial informationParent company financial statements Investor informationOperating and financial review Key figuresNotes
7
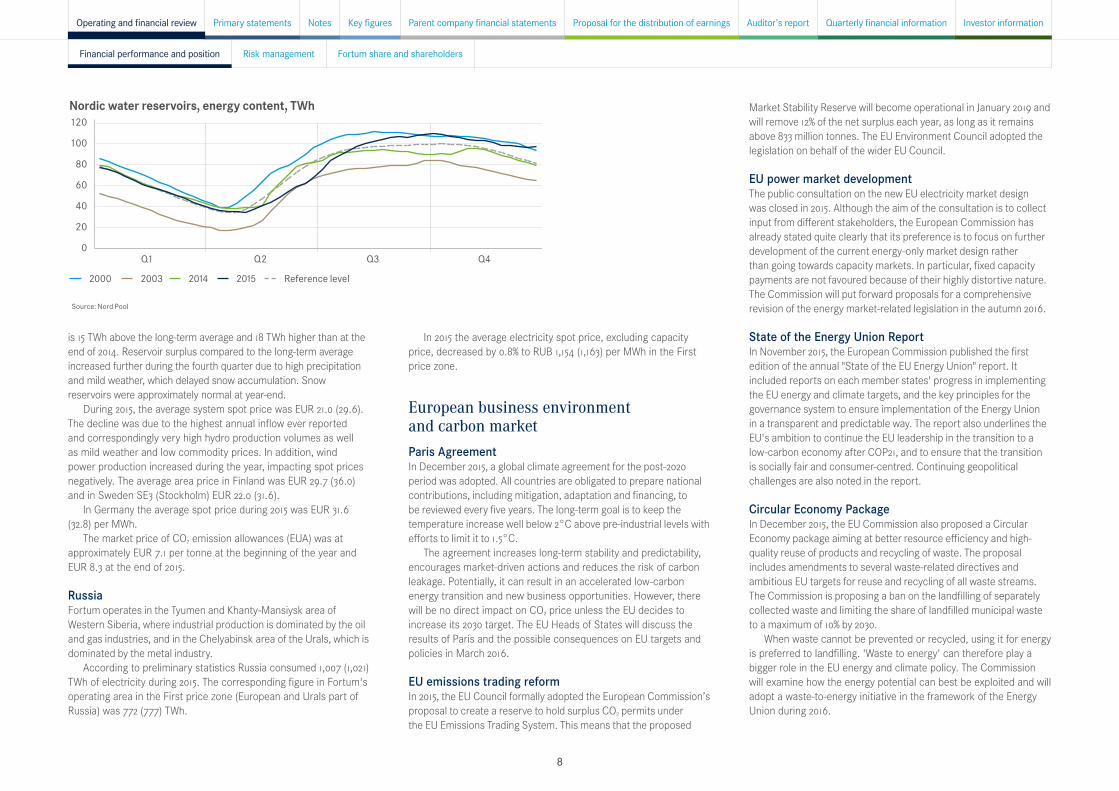
is 15 TWh above the long-term average and 18 TWh higher than at the end of 2014. Reservoir surplus compared to the long-term average increased further during the fourth quarter due to high precipitation and mild weather, which delayed snow accumulation. Snow reservoirs were approximately normal at year-end.
During 2015, the average system spot price was EUR 21.0 (29.6). The decline was due to the highest annual inflow ever reported and correspondingly very high hydro production volumes as well as mild weather and low commodity prices. In addition, wind power production increased during the year, impacting spot prices negatively. The average area price in Finland was EUR 29.7 (36.0) and in Sweden SE3 (Stockholm) EUR 22.0 (31.6).
In Germany the average spot price during 2015 was EUR 31.6 (32.8) per MWh.
The market price of CO2 emission allowances (EUA) was at approximately EUR 7.1 per tonne at the beginning of the year and EUR 8.3 at the end of 2015.
RussiaFortum operates in the Tyumen and Khanty-Mansiysk area of Western Siberia, where industrial production is dominated by the oil and gas industries, and in the Chelyabinsk area of the Urals, which is dominated by the metal industry.
According to preliminary statistics Russia consumed 1,007 (1,021) TWh of electricity during 2015. The corresponding figure in Fortum's operating area in the First price zone (European and Urals part of Russia) was 772 (777) TWh.
In 2015 the average electricity spot price, excluding capacity price, decreased by 0.8% to RUB 1,154 (1,163) per MWh in the First price zone.
European business environment and carbon marketParis AgreementIn December 2015, a global climate agreement for the post-2020 period was adopted. All countries are obligated to prepare national contributions, including mitigation, adaptation and financing, to be reviewed every five years. The long-term goal is to keep the temperature increase well below 2°C above pre-industrial levels with efforts to limit it to 1.5°C.
The agreement increases long-term stability and predictability, encourages market-driven actions and reduces the risk of carbon leakage. Potentially, it can result in an accelerated low-carbon energy transition and new business opportunities. However, there will be no direct impact on CO2 price unless the EU decides to increase its 2030 target. The EU Heads of States will discuss the results of Paris and the possible consequences on EU targets and policies in March 2016.
EU emissions trading reformIn 2015, the EU Council formally adopted the European Commission’s proposal to create a reserve to hold surplus CO2 permits under the EU Emissions Trading System. This means that the proposed
Nordic water reservoirs, energy content, TWh120
100
80
60
40
20
0Q1 Q2 Q3 Q4
2000 2003 2014 2015 Reference level
Source: Nord Pool
Market Stability Reserve will become operational in January 2019 and will remove 12% of the net surplus each year, as long as it remains above 833 million tonnes. The EU Environment Council adopted the legislation on behalf of the wider EU Council.
EU power market developmentThe public consultation on the new EU electricity market design was closed in 2015. Although the aim of the consultation is to collect input from different stakeholders, the European Commission has already stated quite clearly that its preference is to focus on further development of the current energy-only market design rather than going towards capacity markets. In particular, fixed capacity payments are not favoured because of their highly distortive nature. The Commission will put forward proposals for a comprehensive revision of the energy market-related legislation in the autumn 2016.
State of the Energy Union Report In November 2015, the European Commission published the first edition of the annual "State of the EU Energy Union" report. It included reports on each member states' progress in implementing the EU energy and climate targets, and the key principles for the governance system to ensure implementation of the Energy Union in a transparent and predictable way. The report also underlines the EU's ambition to continue the EU leadership in the transition to a low-carbon economy after COP21, and to ensure that the transition is socially fair and consumer-centred. Continuing geopolitical challenges are also noted in the report.
Circular Economy PackageIn December 2015, the EU Commission also proposed a Circular Economy package aiming at better resource efficiency and high-quality reuse of products and recycling of waste. The proposal includes amendments to several waste-related directives and ambitious EU targets for reuse and recycling of all waste streams. The Commission is proposing a ban on the landfilling of separately collected waste and limiting the share of landfilled municipal waste to a maximum of 10% by 2030.
When waste cannot be prevented or recycled, using it for energy is preferred to landfilling. 'Waste to energy' can therefore play a bigger role in the EU energy and climate policy. The Commission will examine how the energy potential can best be exploited and will adopt a waste-to-energy initiative in the framework of the Energy Union during 2016.
Financial performance and position Risk management Fortum share and shareholders
Proposal for the distribution of earnings Auditor’s reportPrimary statements Quarterly financial informationParent company financial statements Investor informationOperating and financial review Key figuresNotes
8

EUR million 2015 2014Change
15/14Sales 1,722 2,156 -20%- power sales 1,625 2,026 -20%of which Nordic power sales 1) 1,526 1,845 -17%- other sales 97 130 -25%Operating profit -396 855 -146%Comparable operating profit 561 877 -36%Comparable EBITDA 680 998 -32%Net assets (at period-end) 5,913 6,001 -1%Return on net assets, % -8.5 13.6 -163%Comparable return on net assets, % 9.5 14.2 -33%Capital expenditure and gross investments in shares 203 198 3%Number of employees 1,341 1,639 -18%
1) The Nordic power sales income and volume does not include thermal generation, market price-related purchases or minorities.
Power generation by source
TWh 2015 2014Change
15/14Hydro and windpower, Nordic 25.1 22.4 12%Nuclear power, Nordic 22.7 23.8 -5%Thermal power, Nordic 0.3 0.9 -67%Total in the Nordic countries 48.1 47.1 2%Thermal power in other countries 0.0 0.7 N/ATotal 48.1 47.9 0%
Nordic sales volume
TWh 2015 2014Change
15/14Nordic sales volume 50.5 48.6 4%of which Nordic Power sales volume 1) 46.3 44.6 4%
1) The Nordic power sales income and volume does not include thermal generation, market price-related purchases or minorities.
Sales price
EUR/MWh 2015 2014Change
15/14Power's Nordic power price 2) 33.0 41.4 -20%
2) Power and Technology's Nordic power price does not include sales income from thermal generation, market price-related purchases or minorities.
Power and Technology's achieved Nordic power price was EUR 33.0 (41.4) per MWh, EUR 8.4 per MWh lower than in the corresponding period in 2014. The system price and all area prices were clearly lower in 2015 compared to 2014. The average system spot price of electricity in Nord Pool was EUR 21.0 (29.6) per MWh. The average area price in Finland was EUR 29.7 (36.0) per MWh and in Sweden SE3 (Stockholm) EUR 22.0 (31.6) per MWh. The weather during the year was extraordinary and impacted the electricity price level: the first quarter of 2015 was exceptionally mild and the second quarter was characterised by among the highest precipitation in recent history. Mild weather in the fourth quarter reduced consumption and increased inflows. In addition, high wind-power generation limited the use of hydropower.
The segment's total power generation in the Nordic countries was 48.1 (47.1) TWh, 1.0 TWh higher than in 2014 due to very high hydro volumes. Thermal production totalled 0.3 (0.9) TWh in the Nordic countries. CO2 free production amounted to 99% (97%) of the total production.
.
Segment reviews
Power and TechnologyPower and Technology consists of Fortum's hydro, nuclear and thermal power generation, Power Solutions with expert services, portfolio management and trading, as well as technology and R&D functions. The segment incorporates two divisions: the Hydro Power and Technology Division and the Nuclear and Thermal Power Division.
In 2015, the Power and Technology segment's comparable operating profit was EUR 561 (877) million, i.e. EUR 316 million lower than in 2014 mainly due to a lower achieved power price. Hydro volumes were historically high, 2.7 TWh, higher than in 2014, while nuclear volumes were 0.9 TWh lower due to unplanned outages in Swedish co-owned nuclear power plants.
Operating profit, EUR -396 (855) million, was affected by write-downs and provisions regarding the closure of Oskarshamn nuclear plant units 1 and 2 in Sweden and of the Finnish coal-fired power plants Inkoo and Meri-Pori, as well as the cancelled Olkiluoto 4 nuclear power project in Finland totalling approximately EUR -915 (0) million, and by sales gains from the sale of property, plant and equipment totalling approximately EUR 18 (52) million, as well as by the IFRS accounting treatment (IAS 39) of derivatives, mainly used for hedging Fortum's power production, and nuclear fund adjustments amounting to EUR -60 (-73) million.
Power and Technology segment’s power generation in the Nordic area by source, TWh
Thermal power Nuclear power Hydro and wind power
60
45
30
15
02011 2012 2013 2014 2015
Power and Technology segment’s power generation by area, TWh
UK Sweden Finland
60
45
30
15
02011 2012 2013 2014 2015
Financial performance and position Risk management Fortum share and shareholders
Proposal for the distribution of earnings Auditor’s reportPrimary statements Quarterly financial informationParent company financial statements Investor informationOperating and financial review Key figuresNotes
9
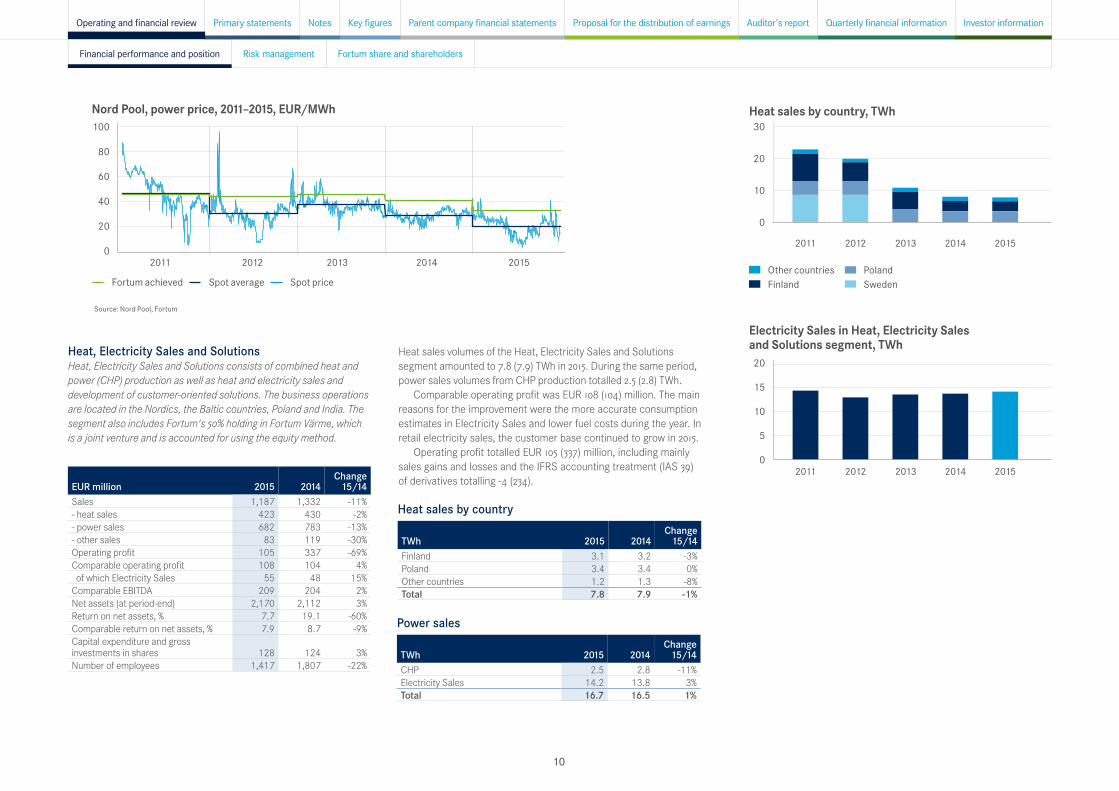
Nord Pool, power price, 2011–2015, EUR/MWh100
80
60
40
20
0
Fortum achieved Spot average Spot price
Source: Nord Pool, Fortum
2011 2012 2013 2014 2015
Heat, Electricity Sales and SolutionsHeat, Electricity Sales and Solutions consists of combined heat and power (CHP) production as well as heat and electricity sales and development of customer-oriented solutions. The business operations are located in the Nordics, the Baltic countries, Poland and India. The segment also includes Fortum's 50% holding in Fortum Värme, which is a joint venture and is accounted for using the equity method.
Heat sales by country
TWh 2015 2014Change
15/14Finland 3.1 3.2 -3%Poland 3.4 3.4 0%Other countries 1.2 1.3 -8%Total 7.8 7.9 -1%
Power sales
TWh 2015 2014Change
15/14CHP 2.5 2.8 -11%Electricity Sales 14.2 13.8 3%Total 16.7 16.5 1%
EUR million 2015 2014Change
15/14Sales 1,187 1,332 -11%- heat sales 423 430 -2%- power sales 682 783 -13%- other sales 83 119 -30%Operating profit 105 337 -69%Comparable operating profit 108 104 4% of which Electricity Sales 55 48 15%Comparable EBITDA 209 204 2%Net assets (at period-end) 2,170 2,112 3%Return on net assets, % 7.7 19.1 -60%Comparable return on net assets, % 7.9 8.7 -9%Capital expenditure and gross investments in shares 128 124 3%Number of employees 1,417 1,807 -22%
Heat sales volumes of the Heat, Electricity Sales and Solutions segment amounted to 7.8 (7.9) TWh in 2015. During the same period, power sales volumes from CHP production totalled 2.5 (2.8) TWh.
Comparable operating profit was EUR 108 (104) million. The main reasons for the improvement were the more accurate consumption estimates in Electricity Sales and lower fuel costs during the year. In retail electricity sales, the customer base continued to grow in 2015.
Operating profit totalled EUR 105 (337) million, including mainly sales gains and losses and the IFRS accounting treatment (IAS 39) of derivatives totalling -4 (234).
Heat sales by country, TWh30
20
10
0
2011 2012 2013 2014 2015
Other countries Poland Finland Sweden
Electricity Sales in Heat, Electricity Sales and Solutions segment, TWh20
15
10
5
02011 2012 2013 2014 2015
Financial performance and position Risk management Fortum share and shareholders
Proposal for the distribution of earnings Auditor’s reportPrimary statements Quarterly financial informationParent company financial statements Investor informationOperating and financial review Key figuresNotes
10

RussiaThe Russia Segment consists of power and heat generation and sales in Russia. The segment also includes Fortum's over 29% holding in TGC-1, which is an associated company and is accounted for using the equity method.
The liberalisation of the Russian wholesale power market was completed in the beginning of 2011. However, all generating companies continue to sell a part of their electricity and capacity – an amount equalling the consumption of households and a few special groups of consumers – under regulated prices. During 2015, Fortum sold approximately 83% of its power production in Russia at a liberalised electricity price.
All of Fortum's capacity was allowed to participate in the capacity selection for generation built prior to 2008 (CCS – "old capacity") for 2015, and the majority of Fortum's plants were also selected. The volume of Fortum’s installed capacity not selected in the auction totalled 195 MW (approximately 7% of Fortum’s total old capacity in Russia), for which Fortum has obtained forced mode status, i.e. it has received payments for the capacity.
The generation capacity built after 2007 under the Russian Government's capacity supply agreement (CSA – "new capacity") receives guaranteed payments for a period of 10 years. The period and the prices for capacity under CSA were defined to ensure a sufficient return on investments. At the time of the acquisition in 2008, Fortum made a provision, as penalty clauses are included in the CSA in case of possible delays. If the new capacity is delayed or if the agreed major terms of the capacity supply agreement are not
EUR million 2015 2014Change
15/14Sales 893 1,055 -15%- power sales 661 758 -13%- heat sales 228 285 -20%- other sales 4 11 -64%Operating profit 203 161 26%Comparable operating profit 201 161 25%Comparable EBITDA 267 304 -12%Net assets (at period-end) 2,561 2,597 -1%Return on net assets, % 8.3 5.6 48%Comparable return on net assets, % 8.2 5.6 46%Capital expenditure and gross investments in shares 285 367 -22%Number of employees 4,126 4,213 -2%
otherwise fulfilled, possible penalties can be claimed. The effect of changes in the timing of commissioning of new units is assessed at each balance sheet date and the provision is changed accordingly.
Received capacity payments vary depending on the age, location, type and size of the plant as well as seasonality and availability. The CSA payments can also vary somewhat annually because they are linked to the Russian Government long-term bonds with 8 to 10 years maturity. In addition, the regulator will review the guaranteed CSA payments by re-examining earnings from the electricity-only market three and six years after the commissioning of a unit and could revise the CSA payments accordingly.
In February 2015, the System Administrator of the wholesale market published data on the weighted average cost of capital (WACC) and the consumer price index (CPI) for 2014, which was used to calculate the capacity price on CSA in 2015. The CSA payments were revised upwards accordingly to reflect the higher bond rates.
In 2015 the Russia segment's power sales volumes amounted to 29.4 (26.5) TWh and heat sales volumes totalled 25.4 (26.0) TWh in 2015.
The Russia segment's comparable operating profit was EUR 201 (161) million. The positive effect from the new units receiving CSA payments amounted to approximately EUR 244 (165) million, including a EUR 52 (4) million CSA provision release. Lower heat volumes due to warm weather, lower income from heat connections and lower electricity prices impacted the result negatively compared to 2014. The weakened Russian rouble affected the Russia segment's 2015 result negatively by EUR 71 million.
Operating profit was EUR 203 (161) million. The third unit of Fortum's Nyagan power plant started
commercial operation at the end of 2014 and started receiving capacity payments under the Russian Government's capacity supply agreement for 418 megawatts (MW) as of 1 January 2015.
In November 2015, Fortum commissioned unit 1 of its Chelyabinsk GRES combined heat and power plant in Russia. Fortum started receiving capacity payments for Chelyabinsk 1 under the Russian Government's capacity supply agreement (CSA) as of 1 December 2015. Fortum’s extensive investment programme in Russia that started in 2008 is now nearly completed, as unit 2 of Chelyabinsk GRES is estimated to start commercial operation in early 2016. The slight postponement is due to delays in construction.
Key electricity, capacity and gas prices for Fortum Russia
2015 2014Change
15/14Electricity spot price (market price), Urals hub, RUB/MWh 1,047 1,089 -4%Average regulated gas price, Urals region, RUB/1,000 m3 3,488 3,362 4%Average capacity price for CCS "old capacity", tRUB/MW/month 1) 149 167 -11%Average capacity price for CSA "new capacity", tRUB/MW/month 1) 641 552 16%Average capacity price, tRUB/MW/month 359 304 18%Achieved power price for Fortum in Russia, RUB/MWh 1,555 1,508 3%Achieved power price for Fortum in Russia, EUR/MWh 2) 22.5 30.4 -26%
1) Capacity prices paid for the capacity volumes, excluding unplanned outages, repairs and own consumption. 2) Translated using average exchange rate.
Discontinued operations (Distribution)
EUR million 2015 2014Sales 274 751- distribution network transmission 40 590- regional network transmission 229 120- other sales 7 41Operating profit 4,395 2,132Comparable operating profit 114 266Comparable EBITDA 163 416Net assets (at period-end) - 2,615Capital expenditure and gross investments in shares 44 147Number of employees - 390
The table above includes Swedish electricity distribution business for January–May 2015, the Finnish electricity distribution business for January–March 2014, the Norwegian electricity distribution business for January–May 2014, as well as the Swedish electricity distribution business for the full-year 2014.
In June 2015, Fortum completed the divestment of its Swedish electricity distribution business.
The transaction concluded the divestment of Fortum's Distribution, a process that began in 2013. The total consideration from the divestments in Finland, Sweden and Norway is
Financial performance and position Risk management Fortum share and shareholders
Proposal for the distribution of earnings Auditor’s reportPrimary statements Quarterly financial informationParent company financial statements Investor informationOperating and financial review Key figuresNotes
11
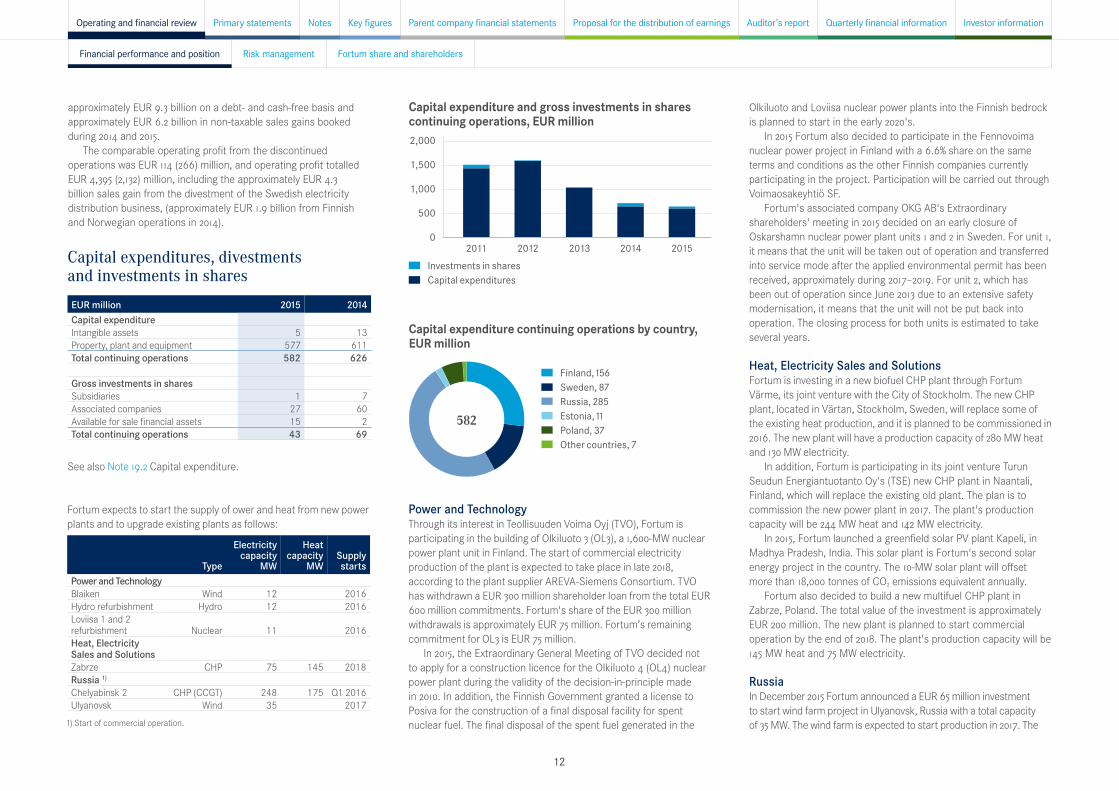
Capital expenditures, divestments and investments in sharesEUR million 2015 2014Capital expenditure Intangible assets 5 13Property, plant and equipment 577 611Total continuing operations 582 626
Gross investments in shares Subsidiaries 1 7Associated companies 27 60Available for sale financial assets 15 2Total continuing operations 43 69
See also Note 19.2 Capital expenditure.
approximately EUR 9.3 billion on a debt- and cash-free basis and approximately EUR 6.2 billion in non-taxable sales gains booked during 2014 and 2015.
The comparable operating profit from the discontinued operations was EUR 114 (266) million, and operating profit totalled EUR 4,395 (2,132) million, including the approximately EUR 4.3 billion sales gain from the divestment of the Swedish electricity distribution business, (approximately EUR 1.9 billion from Finnish and Norwegian operations in 2014).
Fortum expects to start the supply of ower and heat from new power plants and to upgrade existing plants as follows:
Type
Electricity capacity
MW
Heat capacity
MW Supply
startsPower and Technology Blaiken Wind 12 2016Hydro refurbishment Hydro 12 2016Loviisa 1 and 2 refurbishment Nuclear 11 2016Heat, Electricity Sales and SolutionsZabrze CHP 75 145 2018Russia 1) Chelyabinsk 2 CHP (CCGT) 248 175 Q1 2016Ulyanovsk Wind 35 2017
1) Start of commercial operation.
Power and TechnologyThrough its interest in Teollisuuden Voima Oyj (TVO), Fortum is participating in the building of Olkiluoto 3 (OL3), a 1,600-MW nuclear power plant unit in Finland. The start of commercial electricity production of the plant is expected to take place in late 2018, according to the plant supplier AREVA-Siemens Consortium. TVO has withdrawn a EUR 300 million shareholder loan from the total EUR 600 million commitments. Fortum's share of the EUR 300 million withdrawals is approximately EUR 75 million. Fortum’s remaining commitment for OL3 is EUR 75 million.
In 2015, the Extraordinary General Meeting of TVO decided not to apply for a construction licence for the Olkiluoto 4 (OL4) nuclear power plant during the validity of the decision-in-principle made in 2010. In addition, the Finnish Government granted a license to Posiva for the construction of a final disposal facility for spent nuclear fuel. The final disposal of the spent fuel generated in the
Capital expenditure and gross investments in shares continuing operations, EUR million2,000
1,500
1,000
500
02011 2012 2013 2014 2015
Investments in shares Capital expenditures
Capital expenditure continuing operations by country, EUR million
Finland, 156 Sweden, 87 Russia, 285 Estonia, 11 Poland, 37 Other countries, 7
582
Olkiluoto and Loviisa nuclear power plants into the Finnish bedrock is planned to start in the early 2020's.
In 2015 Fortum also decided to participate in the Fennovoima nuclear power project in Finland with a 6.6% share on the same terms and conditions as the other Finnish companies currently participating in the project. Participation will be carried out through Voimaosakeyhtiö SF.
Fortum's associated company OKG AB's Extraordinary shareholders' meeting in 2015 decided on an early closure of Oskarshamn nuclear power plant units 1 and 2 in Sweden. For unit 1, it means that the unit will be taken out of operation and transferred into service mode after the applied environmental permit has been received, approximately during 2017–2019. For unit 2, which has been out of operation since June 2013 due to an extensive safety modernisation, it means that the unit will not be put back into operation. The closing process for both units is estimated to take several years.
Heat, Electricity Sales and SolutionsFortum is investing in a new biofuel CHP plant through Fortum Värme, its joint venture with the City of Stockholm. The new CHP plant, located in Värtan, Stockholm, Sweden, will replace some of the existing heat production, and it is planned to be commissioned in 2016. The new plant will have a production capacity of 280 MW heat and 130 MW electricity.
In addition, Fortum is participating in its joint venture Turun Seudun Energiantuotanto Oy's (TSE) new CHP plant in Naantali, Finland, which will replace the existing old plant. The plan is to commission the new power plant in 2017. The plant's production capacity will be 244 MW heat and 142 MW electricity.
In 2015, Fortum launched a greenfield solar PV plant Kapeli, in Madhya Pradesh, India. This solar plant is Fortum's second solar energy project in the country. The 10-MW solar plant will offset more than 18,000 tonnes of CO2 emissions equivalent annually.
Fortum also decided to build a new multifuel CHP plant in Zabrze, Poland. The total value of the investment is approximately EUR 200 million. The new plant is planned to start commercial operation by the end of 2018. The plant's production capacity will be 145 MW heat and 75 MW electricity.
RussiaIn December 2015 Fortum announced a EUR 65 million investment to start wind farm project in Ulyanovsk, Russia with a total capacity of 35 MW. The wind farm is expected to start production in 2017. The
Financial performance and position Risk management Fortum share and shareholders
Proposal for the distribution of earnings Auditor’s reportPrimary statements Quarterly financial informationParent company financial statements Investor informationOperating and financial review Key figuresNotes
12
renewable generation capacity under Capacity Supply Agreement (CSA) receives guaranteed payments for 15 years in order to ensure sufficient return on investment.
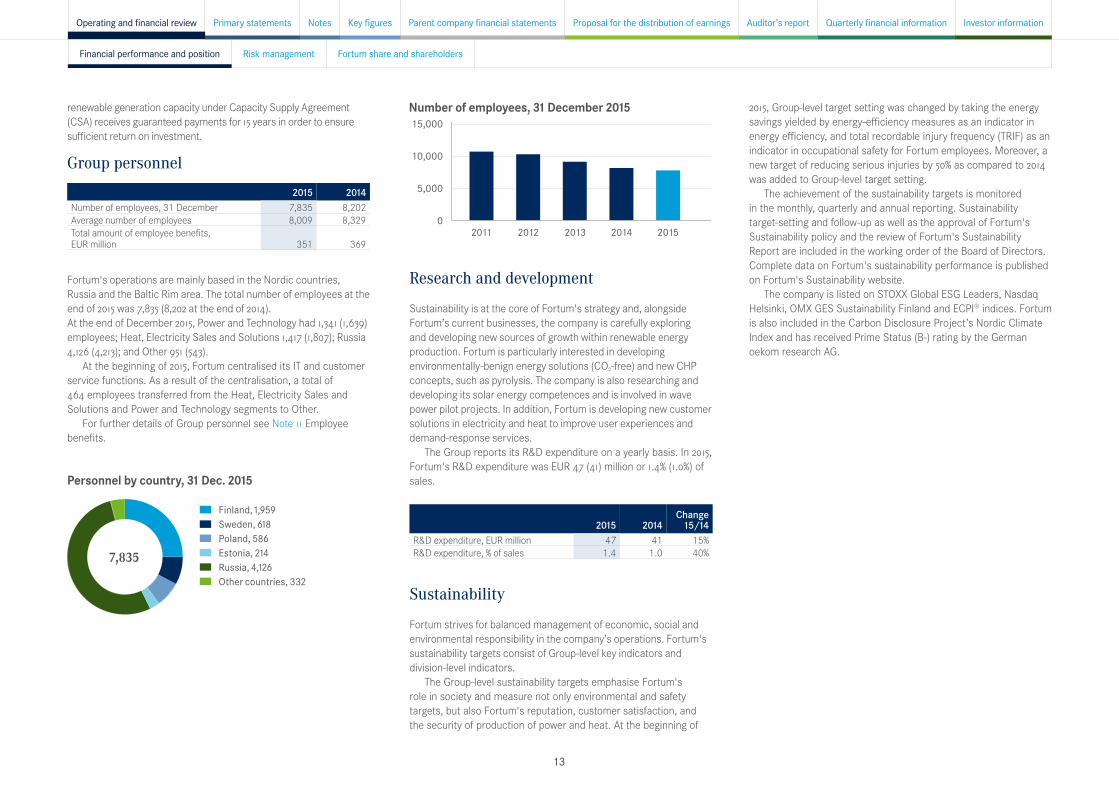
Group personnel
2015 2014Number of employees, 31 December 7,835 8,202Average number of employees 8,009 8,329Total amount of employee benefits, EUR million 351 369
Fortum's operations are mainly based in the Nordic countries, Russia and the Baltic Rim area. The total number of employees at the end of 2015 was 7,835 (8,202 at the end of 2014).At the end of December 2015, Power and Technology had 1,341 (1,639) employees; Heat, Electricity Sales and Solutions 1,417 (1,807); Russia 4,126 (4,213); and Other 951 (543).
At the beginning of 2015, Fortum centralised its IT and customer service functions. As a result of the centralisation, a total of 464 employees transferred from the Heat, Electricity Sales and Solutions and Power and Technology segments to Other.
For further details of Group personnel see Note 11 Employee benefits.
Research and development
Sustainability is at the core of Fortum's strategy and, alongside Fortum’s current businesses, the company is carefully exploring and developing new sources of growth within renewable energy production. Fortum is particularly interested in developing environmentally-benign energy solutions (CO2-free) and new CHP concepts, such as pyrolysis. The company is also researching and developing its solar energy competences and is involved in wave power pilot projects. In addition, Fortum is developing new customer solutions in electricity and heat to improve user experiences and demand-response services.
The Group reports its R&D expenditure on a yearly basis. In 2015, Fortum's R&D expenditure was EUR 47 (41) million or 1.4% (1.0%) of sales.
2015 2014Change
15/14R&D expenditure, EUR million 47 41 15%R&D expenditure, % of sales 1.4 1.0 40%
Sustainability
Fortum strives for balanced management of economic, social and environmental responsibility in the company’s operations. Fortum's sustainability targets consist of Group-level key indicators and division-level indicators.
The Group-level sustainability targets emphasise Fortum's role in society and measure not only environmental and safety targets, but also Fortum's reputation, customer satisfaction, and the security of production of power and heat. At the beginning of
Personnel by country, 31 Dec. 2015
Finland, 1,959 Sweden, 618 Poland, 586 Estonia, 214 Russia, 4,126 Other countries, 332
7,835
Number of employees, 31 December 201515,000
10,000
5,000
02011 2012 2013 2014 2015
2015, Group-level target setting was changed by taking the energy savings yielded by energy-efficiency measures as an indicator in energy efficiency, and total recordable injury frequency (TRIF) as an indicator in occupational safety for Fortum employees. Moreover, a new target of reducing serious injuries by 50% as compared to 2014 was added to Group-level target setting.
The achievement of the sustainability targets is monitored in the monthly, quarterly and annual reporting. Sustainability target-setting and follow-up as well as the approval of Fortum's Sustainability policy and the review of Fortum's Sustainability Report are included in the working order of the Board of Directors. Complete data on Fortum's sustainability performance is published on Fortum's Sustainability website.
The company is listed on STOXX Global ESG Leaders, Nasdaq Helsinki, OMX GES Sustainability Finland and ECPI® indices. Fortum is also included in the Carbon Disclosure Project’s Nordic Climate Index and has received Prime Status (B-) rating by the German oekom research AG.
Financial performance and position Risk management Fortum share and shareholders
Proposal for the distribution of earnings Auditor’s reportPrimary statements Quarterly financial informationParent company financial statements Investor informationOperating and financial review Key figuresNotes
13

Fortum sustainability targets and performance 1)
Target 2015 Five-year averageSpecific CO2 emissions from power generation in the EU as a five-year average, g/kWh < 80 21 50Specific CO2 emissions from total energy production (electricity and heat) as a five-year average, g/kWh < 200 181 191Energy Efficiency Improvement target, by year 2020, base line year 2012, GWh/a > 1,400 1,240 -Number of major EHS incidents 1) ≤ 27 18 -Energy availability of CHP plants, % > 95 96.4 -Total recordable injury frequency (TRIF) for own personnel 1) ≤ 2.5 1.6 -Lost workday injury frequency (LWIF) for own contractors 1) ≤ 3.2 2.7 -Number of serious accidents 1) ≤ 8 16 -
1) Includes the electricity distribution segment until divested
Targets for reputation and customer satisfaction are monitored annually. Company reputation among the key stakeholders in the One Fortum Survey in 2015 improved to 71.75 points (on a scale of 1–100 points) and was above the target of 70.8 points. Customer satisfaction improved, and the Group target (70–74 points) was achieved in all business areas except in electricity sales for business customers.
Economic responsibilityIn the area of economic responsibility, the focus is on competitiveness, performance excellence and market-driven production. The aim is to create long-term economic value and enable profitable growth and added value for shareholders, customers, employees, suppliers, and other key stakeholders in the company's operating areas. Fortum's goal is to achieve excellent financial performance in strategically selected core areas through strong competence and responsible ways of operating. In 2015, Fortum measured financial performance with return on capital employed (target: 12%) and capital structure (target: comparable net debt/EBITDA around 2.5). In addition, as of 1 January 2014, Fortum has used the applicable Global Reporting Initiative (GRI) G4 indicators for reporting economic responsibility.
Fortum as a tax payerFortum supports social development and well-being of the areas of operations by e.g. paying taxes. The tax benefits Fortum produces to society include not only corporate income taxes EUR -78 million (2014: 143) but also several other taxes. In 2015, Fortum's taxes borne were EUR 413 million (2014: 464). Taxes borne include corporate income taxes, production taxes, employment taxes, taxes on property and cost of indirect taxes. Production taxes include
also taxes paid through electricity purchased from associated companies.
In addition, Fortum administers and collects different taxes on behalf of governments and authorities. Such taxes include e.g. VAT, excise taxes on power consumed by customers, payroll taxes and withholding taxes. The amount of taxes collected by Fortum was EUR 352 million (2014: 336). See additional infomation in Fortum as a taxpayer.
Environmental responsibilityFortum's environmental responsibility emphasises mitigation of climate change, efficient use of resources as well as management of the impacts of its energy production and supply chain. The company’s know-how in carbon-free hydro and nuclear power production and in energy-efficient CHP production is highlighted in environmental responsibility. Fortum’s Group-level environmental targets are related to CO2 emissions, energy efficiency as well as major environmental, health and safety (EHS) incidents. At the end of 2015, ISO 14001 certification covered 99.9% of Fortum's power and heat production worldwide.
Fortum’s climate targets over the next five years are: specific CO2 emissions from power generation in the EU below 80 grams per kilowatt-hour (g/kWh) and total specific CO2 emissions from both electricity and heat production in all countries below 200 g/kWh. Both targets are calculated as a five-year average. At the end of 2015, the five-year average for specific CO2 emissions from power generation in the EU was at 50 (60) g/kWh and the total specific CO2 emissions from energy production were at 191 (198) g/kWh, both better than the target level.
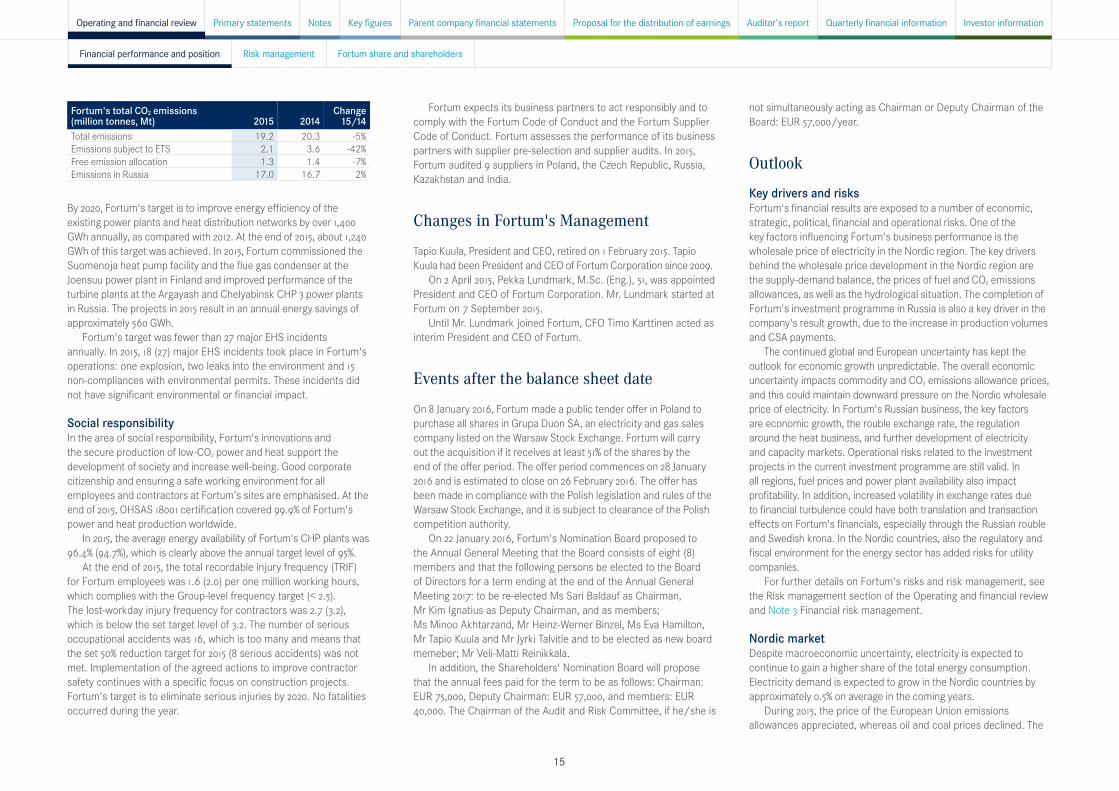
Fortum's total CO2 emissions in 2015 amounted to 19.2 (20.3) million tonnes (Mt), of which 2.1 (3.6) Mt were within the EU's emissions trading scheme (ETS). Since 2013, electricity production has not received free allowances in the EU ETS. The amount of free allowances for heat will also gradually decrease during 2013–2020. Fortum's free allowances 2015 were 1.3 Mt.
Effective income tax-rate break down30
25
20
15
10
5
0Finnish tax rate
Differ ences in tax rates and regula-
tions
Tax exempt capital gains
Associates’and jointventureprofits
Tax on dividend
distribution
Other Effective tax rate
20.0%
7.6% 0.7%1.7% -2.2%
-2.4%25.4%
250
200
150
100
50
02015 2014 2015 2014 2015 2014 2015 2014
Taxes borne by country, EUR million
Finland Sweden Russia Other countries
Corporate income tax Production taxes Employment taxes
Taxes on property Cost of indirect taxes
Financial performance and position Risk management Fortum share and shareholders
Proposal for the distribution of earnings Auditor’s reportPrimary statements Quarterly financial informationParent company financial statements Investor informationOperating and financial review Key figuresNotes
14
Fortum expects its business partners to act responsibly and to comply with the Fortum Code of Conduct and the Fortum Supplier Code of Conduct. Fortum assesses the performance of its business partners with supplier pre-selection and supplier audits. In 2015, Fortum audited 9 suppliers in Poland, the Czech Republic, Russia, Kazakhstan and India.
Changes in Fortum's Management
Tapio Kuula, President and CEO, retired on 1 February 2015. Tapio Kuula had been President and CEO of Fortum Corporation since 2009.
On 2 April 2015, Pekka Lundmark, M.Sc. (Eng.), 51, was appointed President and CEO of Fortum Corporation. Mr. Lundmark started at Fortum on 7 September 2015.
Until Mr. Lundmark joined Fortum, CFO Timo Karttinen acted as interim President and CEO of Fortum.
Events after the balance sheet date
On 8 January 2016, Fortum made a public tender offer in Poland to purchase all shares in Grupa Duon SA, an electricity and gas sales company listed on the Warsaw Stock Exchange. Fortum will carry out the acquisition if it receives at least 51% of the shares by the end of the offer period. The offer period commences on 28 January 2016 and is estimated to close on 26 February 2016. The offer has been made in compliance with the Polish legislation and rules of the Warsaw Stock Exchange, and it is subject to clearance of the Polish competition authority.
On 22 January 2016, Fortum's Nomination Board proposed to the Annual General Meeting that the Board consists of eight (8) members and that the following persons be elected to the Board of Directors for a term ending at the end of the Annual General Meeting 2017: to be re-elected Ms Sari Baldauf as Chairman, Mr Kim Ignatius as Deputy Chairman, and as members; Ms Minoo Akhtarzand, Mr Heinz-Werner Binzel, Ms Eva Hamilton, Mr Tapio Kuula and Mr Jyrki Talvitie and to be elected as new board memeber; Mr Veli-Matti Reinikkala.
In addition, the Shareholders' Nomination Board will propose that the annual fees paid for the term to be as follows: Chairman: EUR 75,000, Deputy Chairman: EUR 57,000, and members: EUR 40,000. The Chairman of the Audit and Risk Committee, if he/she is
not simultaneously acting as Chairman or Deputy Chairman of the Board: EUR 57,000/year.
Outlook
Key drivers and risksFortum's financial results are exposed to a number of economic, strategic, political, financial and operational risks. One of the key factors influencing Fortum's business performance is the wholesale price of electricity in the Nordic region. The key drivers behind the wholesale price development in the Nordic region are the supply-demand balance, the prices of fuel and CO2 emissions allowances, as well as the hydrological situation. The completion of Fortum's investment programme in Russia is also a key driver in the company's result growth, due to the increase in production volumes and CSA payments.
The continued global and European uncertainty has kept the outlook for economic growth unpredictable. The overall economic uncertainty impacts commodity and CO2 emissions allowance prices, and this could maintain downward pressure on the Nordic wholesale price of electricity. In Fortum's Russian business, the key factors are economic growth, the rouble exchange rate, the regulation around the heat business, and further development of electricity and capacity markets. Operational risks related to the investment projects in the current investment programme are still valid. In all regions, fuel prices and power plant availability also impact profitability. In addition, increased volatility in exchange rates due to financial turbulence could have both translation and transaction effects on Fortum's financials, especially through the Russian rouble and Swedish krona. In the Nordic countries, also the regulatory and fiscal environment for the energy sector has added risks for utility companies.
For further details on Fortum's risks and risk management, see the Risk management section of the Operating and financial review and Note 3 Financial risk management.
Nordic marketDespite macroeconomic uncertainty, electricity is expected to continue to gain a higher share of the total energy consumption. Electricity demand is expected to grow in the Nordic countries by approximately 0.5% on average in the coming years.
During 2015, the price of the European Union emissions allowances appreciated, whereas oil and coal prices declined. The
Fortum's total CO2 emissions (million tonnes, Mt) 2015 2014
Change 15/14
Total emissions 19.2 20.3 -5%Emissions subject to ETS 2.1 3.6 -42%Free emission allocation 1.3 1.4 -7%Emissions in Russia 17.0 16.7 2%
By 2020, Fortum's target is to improve energy efficiency of the existing power plants and heat distribution networks by over 1,400 GWh annually, as compared with 2012. At the end of 2015, about 1,240 GWh of this target was achieved. In 2015, Fortum commissioned the Suomenoja heat pump facility and the flue gas condenser at the Joensuu power plant in Finland and improved performance of the turbine plants at the Argayash and Chelyabinsk CHP 3 power plants in Russia. The projects in 2015 result in an annual energy savings of approximately 560 GWh.
Fortum's target was fewer than 27 major EHS incidents annually. In 2015, 18 (27) major EHS incidents took place in Fortum's operations: one explosion, two leaks into the environment and 15 non-compliances with environmental permits. These incidents did not have significant environmental or financial impact.
Social responsibilityIn the area of social responsibility, Fortum's innovations and the secure production of low-CO2 power and heat support the development of society and increase well-being. Good corporate citizenship and ensuring a safe working environment for all employees and contractors at Fortum’s sites are emphasised. At the end of 2015, OHSAS 18001 certification covered 99.9% of Fortum's power and heat production worldwide.
In 2015, the average energy availability of Fortum's CHP plants was 96.4% (94.7%), which is clearly above the annual target level of 95%.
At the end of 2015, the total recordable injury frequency (TRIF) for Fortum employees was 1.6 (2.0) per one million working hours, which complies with the Group-level frequency target (< 2.5). The lost-workday injury frequency for contractors was 2.7 (3.2), which is below the set target level of 3.2. The number of serious occupational accidents was 16, which is too many and means that the set 50% reduction target for 2015 (8 serious accidents) was not met. Implementation of the agreed actions to improve contractor safety continues with a specific focus on construction projects. Fortum's target is to eliminate serious injuries by 2020. No fatalities occurred during the year.
Financial performance and position Risk management Fortum share and shareholders
Proposal for the distribution of earnings Auditor’s reportPrimary statements Quarterly financial informationParent company financial statements Investor informationOperating and financial review Key figuresNotes
15
price of electricity for the upcoming twelve months declined in the Nordic area as well as in Germany.
In late-January 2016 the quotation for coal (ICE Rotterdam) for the rest of 2016 was around USD 42 per tonne, and for CO2 emission allowances for 2016 about EUR 6 per tonne. The Nordic system electricity forward price in Nasdaq Commodities for the rest of 2016 was around EUR 19 per MWh and for 2017 around EUR 18 per MWh. In Germany, the electricity forward price for the rest of 2016 was around EUR 25 per MWh and for 2017 around EUR 24 per MWh. Nordic water reservoirs were about 9 TWh above the long-term average and 8 TWh above the corresponding level of 2015.
Power and TechnologyThe Power and Technology segment’s (achieved) Nordic power price typically depends on such factors as hedge ratios, hedge prices, spot prices, availability and utilisation of Fortum's flexible production portfolio and currency fluctuations. Excluding the potential effects from changes in the power generation mix, a 1 EUR/MWh change in the Power and Technology segment’s Nordic power sales (achieved) price will result in an approximately EUR 45 million change in Fortum's annual comparable operating profit. In addition, the comparable operating profit of the Power and Technology segment will be affected by the possible thermal power generation volumes and its profits.
As a result of the nuclear stress tests in the EU, the Swedish nuclear safety authority (SSM) has decided to propose new regulations for Swedish nuclear reactors. The process is ongoing. Fortum emphasises that maintaining a high level of nuclear safety is the highest priority, but considers EU-level harmonisation of nuclear safety requirements to be of utmost importance.
In 2015, the Swedish Government increased the nuclear waste fund fee for the period 2015–2017 from approximately 0.022 to approximately 0.04 SEK/kWh. The estimated impact on Fortum is approximately EUR 25 million annually. The process to review the Swedish nuclear waste fees is done in a three-year cycle. However, as a result of the decision on early closure of nuclear power plants, the Swedish Radiation Safety Authority, SSM, recalculated the waste fees for the Oskarshamn and Ringhals power plants. The new assessment needs the approval of the Swedish Government.
In addition, the Swedish Parliament decided to approve the proposed tax increase of 17% on installed nuclear capacity. The tax was implemented as of 1 August 2015. The estimated impact on Fortum is approximately EUR 15 million in 2016, albeit corporate tax-
deductible. The future of the nuclear tax is subject to active political debate in Sweden.
In October 2015, OKG AB's extraordinary shareholders' meeting decided on the closure of Oskarshamn nuclear power plant units 1 and 2 in Sweden. For unit 1, it means that the unit will be taken out of operation and transferred into service mode after the applied environmental permit has been received, approximately during 2017–2019. For unit 2, which has been out of operation since June 2013 due to an extensive safety modernisation, it means that the unit will not be put back into operation. The closing process for both units is estimated to take several years.
In August 2015, Fortum decided to participate in the Fennovoima nuclear power project in Finland with a 6.6%-share and on the same terms and conditions as the other Finnish companies currently participating in the project. Participation will be carried out through Voimaosakeyhtiö SF.
RussiaThe Russia segment's new capacity generation built after 2007 under the Russian Government's capacity supply agreement (CSA) is a key driver for earnings growth in Russia, as it is expected to bring income from new volumes sold and also to receive considerably higher capacity payments than the old capacity. It receives guaranteed capacity payments currently for a period of 10 years. A draft regulation related to the time frame (in the future 10 or 15 years) regarding the calculation has been submitted for review to the federal executive authorities, and a decision is expected during first half of 2016. Prices for capacity under CSA are defined in order to ensure a sufficient return on investments. The received capacity payment will vary depending on the age, location, size and type of the plants as well as on seasonality and availability. The return on the new capacity is guaranteed, as regulated in the CSA. CSA payments can vary somewhat annually because they are linked to Russian Government long-term bonds with 8 to 10 years maturity. In addition, the regulator will review the earnings from the electricity-only market three years and six years after the commissioning of a unit and could revise the CSA payments accordingly.
In February 2016, the System Administrator of the wholesale market is planning to publish data on the weighted average cost of capital (WACC) and the consumer price index (CPI) for 2015, which is used to calculate the capacity price on CSA in 2016.
The value of the remaining part of Fortum's investment programme, calculated at the exchange rates prevailing at the end
of December 2015, is estimated to be approximately EUR 100 million, as of January 2016.
According to the new rules approved by the Russian Government in 2015, the competitive capacity selection for generation built prior to 2008 (CCS, without capacity supply agreements) takes place annually. At the end of 2015, the CCS for 2016 and the long-term CCS for 2017–2019 were held. The majority of Fortum’s plants were selected. The volume of Fortum’s installed capacity not selected in the auction totalled 195 MW for which Fortum has obtained forced mode status, i.e. it will receive payments for the capacity. In 2016, the CCS for year 2020 will take place.
The targeted operating profit (EBIT) level of RUB 18.2 billion in the Russia segment is targeted to be reached during 2017–2018. The segment’s profits are impacted by changes in power demand, gas prices and other regulatory development. The economic sanctions, currency crisis, oil price and the surge in inflation have impacted overall demand. As a result, gas prices and electricity prices have not developed favourably as expected. Previously, the run-rate operating profit level (EBIT) was targeted to be reached during 2015 after finalising the investment programme.
The euro-denominated result level will be volatile due to the translation effect. The income statements of non-euro subsidiaries are translated into the Group reporting currency using the average exchange rates. The Russia segment's result is also impacted by seasonal volatility caused by the nature of the heat business, with the first and last quarter being clearly the strongest.
In 2014, the new heat market model roadmap proposed by the Ministry of Energy was approved by the Russian Government; if implemented the reform should give heat market liberalisation by 2020 or, in some specific areas, by 2023.
As forecasted by the Russian Ministry of Economic Development, Russian annual average gas price growth is estimated to be 4.9% in 2016.
Restructuring of TGC-1 according to strategy in RussiaIn December 2014, Fortum, Gazprom Energoholding LLC and Rosatom State Corporation signed a protocol to start a restructuring process of the ownership of TGC-1 in Russia. The discussions have not yet come to a conclusion. It is not possible to estimate the timetable.
Financial performance and position Risk management Fortum share and shareholders
Proposal for the distribution of earnings Auditor’s reportPrimary statements Quarterly financial informationParent company financial statements Investor informationOperating and financial review Key figuresNotes
16

Capital expenditure and divestmentsFortum currently expects its capital expenditure for its continuing operations in 2016 to be approximately EUR 650 million. The annual maintenance capital expenditure is estimated to be about EUR 300–350 million in 2016, below the level of depreciation.
TaxationThe effective corporate income tax rate for Fortum in 2016 is estimated to be 19–21%, excluding the impact of the share of profits of associated companies and joint ventures, non-taxable capital gains and non-recurring items.
In August 2014, the Finnish Board of Adjustment of the Large Taxpayers' Office approved Fortum Corporation's appeal of the income tax assessment imposed on Fortum for the year 2007 in December 2013. The Tax Recipients' Legal Services Unit appealed the matter. In December 2014, Fortum received a non-taxation decision regarding its financing companies for the remaining years 2008−2011, based on the same audit. This is in line with the Supreme Administrative Court’s (SAC) precedent decision. The Tax Recipients' Legal Services Unit has appealed the decisions in February 2015, and the cases for years 2008−2011 are now pending the Board of Adjustment of the Large Taxpayers' Office decision. In line with the 2007 case, Fortum considers the claims unjustifiable.
In June, the Swedish Parliament approved the 17% increase on the tax on installed nuclear capacity, re-proposed by the Swedish Government. The tax was implemented as of 1 August 2015. The estimated impact on Fortum is approximately EUR 15 million in 2016, albeit corporate tax-deductible.
HedgingAt the end of December 2015, approximately 50% of Power and Technology's estimated Nordic power sales volume was hedged at approximately EUR 33 per MWh for the year 2016. The corresponding figures for the 2017 calendar year were approximately 20% at approximately EUR 30 per MWh.
The reported hedge ratios may vary significantly, depending on Fortum's actions on the electricity derivatives markets. Hedges are mainly financial contracts, most of them Nasdaq Commodities forwards.
Financial performance and position Risk management Fortum share and shareholders
Proposal for the distribution of earnings Auditor’s reportPrimary statements Quarterly financial informationParent company financial statements Investor informationOperating and financial review Key figuresNotes
17

• CEO
Approving body Reviewing Body
• Board of Directors
• COO, Division or Function Head
• Audit and Risk Committee
• CFO
• CRO
GroupRisk Policy
GroupRisk Instructions
Division/FunctionRisk manuals and Guidelines
Corporate Risk Policy StructureRisk managementRisk management framework and objectives
Fortum is continuously adapting its risk management capabilities to cope with prevailing market conditions, changing operations and the business environment. In 2015, the focus was on improving the framework for internal controls and compliance risk management and integrating them to the operational risk management framework.
Implementation of newly established processes for country and partner assessments, including sustainability and human rights impact assessments, has also continued.
Risk management objectiveThe objective of risk management in Fortum is to support the creation and execution of the Group strategy, to support the achievement of agreed business plans and to avoid unwanted operational events.
Group risk policy
Fortum's Board of Directors annually approves the Group Risk Policy, which defines the high-level objectives and principles, delegates responsibilities for risk management activities within the Group, and sets minimum requirements for risk management processes.
The CEO approves Group Risk Instructions covering commodity market risks, counterparty credit risks, currency, interest rate, liquidity and refinancing risks, and operational and compliance risks. The main principle is that risks are managed at source unless otherwise agreed by management. Corporate Treasury is responsible for managing the Group’s currency, interest rate, liquidity and refinancing risks as well as for insurance management. Corporate Credit is responsible for assessing and consolidating credit exposure, monitoring creditworthiness, and setting credit limits for the Group's largest counterparties. Corporate IT is responsible for managing IT information and security risks. There are also corporate functions dealing with risks related to human resources, laws and regulation, and sustainability.
Risk management organisation
The Audit and Risk Committee (ARC) is responsible for monitoring the efficiency of the company’s risk management systems. Corporate Risk Management, a function headed by the Chief Risk Officer (CRO) reporting to the CFO, is responsible for assessing and reporting the Group's risk exposures to the ARC and Group Management. In order to secure independency from line management, risk controllers conduct risk controlling tasks such as mandate sign-offs and risk model approvals.
Risk reporting is based on CRO approved models, templates and principles. The frequency of reporting is dependent on the materiality and volatility of the risks. For example, exposure to commodity market risks are followed-up and potential mandate breaches are reported daily whereas strategic and operational risks are reported as part of the annual business planning process and followed up in quarterly management reviews. Corporate Risk Management follows-up the Group's exposure to market and credit risk monthly and reports quarterly to Group Management.
Risk management process
The risk management process consists of event identification, risk assessment, risk response and risk control and reporting. Every unit is responsible for responding to risks by taking appropriate actions to avoid, mitigate, transfer or absorb the risk.
Financial performance and position Risk management Fortum share and shareholders
Proposal for the distribution of earnings Auditor’s reportPrimary statements Quarterly financial informationParent company financial statements Investor informationOperating and financial review Key figuresNotes
18
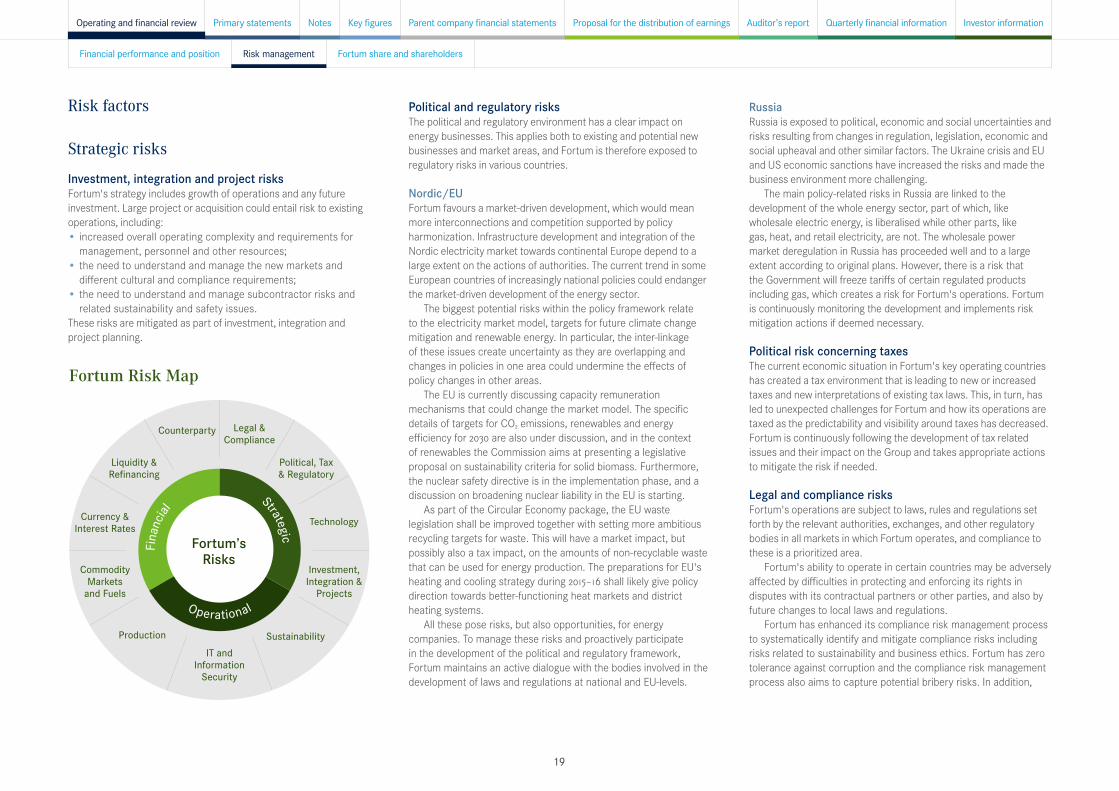
Fortum Risk Map
Legal &Compliance
Political, Tax& Regulatory
Technology
Investment, Integration &
Projects
SustainabilityIT and
Information Security
Production
CommodityMarkets
and Fuels
Currency & Interest Rates
Liquidity &Refinancing
Counterparty
Fortum’sRisks
Fin
ancia
l
Strategic
Operational
Political and regulatory risksThe political and regulatory environment has a clear impact on energy businesses. This applies both to existing and potential new businesses and market areas, and Fortum is therefore exposed to regulatory risks in various countries.
Nordic/EUFortum favours a market-driven development, which would mean more interconnections and competition supported by policy harmonization. Infrastructure development and integration of the Nordic electricity market towards continental Europe depend to a large extent on the actions of authorities. The current trend in some European countries of increasingly national policies could endanger the market-driven development of the energy sector.
The biggest potential risks within the policy framework relate to the electricity market model, targets for future climate change mitigation and renewable energy. In particular, the inter-linkage of these issues create uncertainty as they are overlapping and changes in policies in one area could undermine the effects of policy changes in other areas.
The EU is currently discussing capacity remuneration mechanisms that could change the market model. The specific details of targets for CO2 emissions, renewables and energy efficiency for 2030 are also under discussion, and in the context of renewables the Commission aims at presenting a legislative proposal on sustainability criteria for solid biomass. Furthermore, the nuclear safety directive is in the implementation phase, and a discussion on broadening nuclear liability in the EU is starting.
As part of the Circular Economy package, the EU waste legislation shall be improved together with setting more ambitious recycling targets for waste. This will have a market impact, but possibly also a tax impact, on the amounts of non-recyclable waste that can be used for energy production. The preparations for EU's heating and cooling strategy during 2015–16 shall likely give policy direction towards better-functioning heat markets and district heating systems.
All these pose risks, but also opportunities, for energy companies. To manage these risks and proactively participate in the development of the political and regulatory framework, Fortum maintains an active dialogue with the bodies involved in the development of laws and regulations at national and EU-levels.
RussiaRussia is exposed to political, economic and social uncertainties and risks resulting from changes in regulation, legislation, economic and social upheaval and other similar factors. The Ukraine crisis and EU and US economic sanctions have increased the risks and made the business environment more challenging.
The main policy-related risks in Russia are linked to the development of the whole energy sector, part of which, like wholesale electric energy, is liberalised while other parts, like gas, heat, and retail electricity, are not. The wholesale power market deregulation in Russia has proceeded well and to a large extent according to original plans. However, there is a risk that the Government will freeze tariffs of certain regulated products including gas, which creates a risk for Fortum's operations. Fortum is continuously monitoring the development and implements risk mitigation actions if deemed necessary.
Political risk concerning taxesThe current economic situation in Fortum's key operating countries has created a tax environment that is leading to new or increased taxes and new interpretations of existing tax laws. This, in turn, has led to unexpected challenges for Fortum and how its operations are taxed as the predictability and visibility around taxes has decreased. Fortum is continuously following the development of tax related issues and their impact on the Group and takes appropriate actions to mitigate the risk if needed.
Legal and compliance risksFortum's operations are subject to laws, rules and regulations set forth by the relevant authorities, exchanges, and other regulatory bodies in all markets in which Fortum operates, and compliance to these is a prioritized area.
Fortum's ability to operate in certain countries may be adversely affected by difficulties in protecting and enforcing its rights in disputes with its contractual partners or other parties, and also by future changes to local laws and regulations.
Fortum has enhanced its compliance risk management process to systematically identify and mitigate compliance risks including risks related to sustainability and business ethics. Fortum has zero tolerance against corruption and the compliance risk management process also aims to capture potential bribery risks. In addition,
Risk factors
Strategic risks
Investment, integration and project risksFortum's strategy includes growth of operations and any future investment. Large project or acquisition could entail risk to existing operations, including:• increased overall operating complexity and requirements for
management, personnel and other resources;• the need to understand and manage the new markets and
different cultural and compliance requirements;• the need to understand and manage subcontractor risks and
related sustainability and safety issues.These risks are mitigated as part of investment, integration and project planning.
Financial performance and position Risk management Fortum share and shareholders
Proposal for the distribution of earnings Auditor’s reportPrimary statements Quarterly financial informationParent company financial statements Investor informationOperating and financial review Key figuresNotes
19

Fortum has an established Code of Conduct to enhance the understanding of the importance of business ethics for all Fortum employees, contractors and partners. The supplier code of conduct sets sustainability requirements for suppliers of goods and services. Fortum maintains internal controls to minimise the possibilities of unauthorised activities.
The assessment of compliance risks is periodic and documented. Line management regularly reports on the business ethics to Group Management and further to the ARC.
Technology risksFortum's R&D activities focus on the development of the advanced technologies included in Fortum's existing energy system as well as new technologies and solutions supporting development of the energy system towards a future solar economy.
Fortum is, for example, developing solar and wave energy and bio-oil as well as innovative solutions for its customers. New technologies expose Fortum to new types of risks such as risks related to intellectual property rights and viability of technologies.
Financial Risks
Commodity markets and fuels riskCommodity market risk refers to the potential negative effects of market price movements or volume changes in electricity, fuels and environmental values. A number of different methods, such as Profit-at-Risk and Value-at-Risk, are used to quantify these risks and to take into account their interdependencies. Stress-testing is carried out in order to assess the effects of extreme price movements on Fortum's earnings.
Fortum hedges its exposure to commodity market risks in accordance with annually approved Hedging Guidelines. Risk taking is limited by risk mandates, including volumetric limits, Profit-at-Risk limits and stop-loss limits. The Profit-at-Risk measure is monitored quarterly by management.
All products and marketplaces used for hedging and trading are approved by the CRO.
For further information on hedge ratios, exposures, sensitivities and outstanding derivatives contracts, see Note 3 Financial risk management.
Electricity price and volume risksFortum is exposed to electricity market price movements and volume changes mainly through its power and heat generation and customer sales businesses. In competitive markets, such as in the Nordic region, the price is determined as the balance between supply and demand. The short-term factors affecting electricity prices on the Nordic market include hydrological conditions, temperature, CO2 allowance prices, fuel prices, economic development and the import/export situation.
In the Nordic business, power and heat generation and customer sales volumes are subject to changes in, for example, hydrological conditions and temperature. Uncertainty in nuclear production due to prolonged maintenance or delays in upgrades, especially in co-owned plants in Sweden, has also increased in recent years.
Electricity price and volume risks are hedged by entering into electricity derivatives contracts, primarily on the Nordic power exchange, Nasdaq Commodities (Nord Pool). The main objective of hedging is to reduce the effect of electricity price volatility on earnings. Hedging strategies cover several years in the short to medium term and are executed within approved mandates. These hedging strategies are continuously evaluated as electricity and other commodity market prices, the hydrological balance and other relevant parameters change.
In Russia, electricity prices and capacity sales are the main sources of market risk. Market deregulation has developed as planned and the electricity price is highly correlated with the gas price. Hedges are mainly done through regulated bilateral agreements.
Emission and environmental value risksThe European Union has established an emissions trading scheme to reduce the amount of CO2 emissions. The CO2 emissions trading scheme enhances the integration of the Nord Pool market with the rest of Europe. In addition to the emissions trading scheme, there are other trading schemes in environmental values in place in Sweden, Norway and Poland. There is currently no trading scheme in Russia for emissions or other environmental values. The main factor influencing the prices of CO2 allowances and other environmental values is the supply and demand balance.
Part of Fortum's power and heat generation is subject to requirements of these schemes. Fortum manages its exposure to these prices and volumes through the use of derivatives, such
as CO2 forwards, and by ensuring that the costs of allowances are taken into account during production planning.
Fuel price and volume risksHeat and power generation requires use of fuels that are purchased on global or local markets. The main fuels used by Fortum are uranium, coal, natural gas, oil, waste and various biomass-based fuels such as peat and wood pellets.
The main risk factor for fuels that are traded on global markets such as coal and oil, is the uncertainty in price. Prices are largely affected by demand and supply imbalances that can be caused by, for example, increased demand growth in developing countries, natural disasters or supply constraints in countries experiencing political or social unrest. The main fuel source for heat and power generation in Russia is natural gas. Natural gas prices are partially regulated, so the price risk exposure is limited. For fuels traded on local markets, such as bio-fuels, the volume risk in terms of availability of the raw material of appropriate quality is more significant as there may be a limited number of suppliers. Due to the sanctions and economic development in Russia, the risks related to imported fuels from Russia have increased. This might have an impact to Fortum’s fuel structure.
Exposure to fuel prices is limited to some extent due to Fortum's flexible generation capacity which allows for switching between different fuels according to prevailing market conditions. In some cases, the fuel price risk can even be transferred to the customer. The remaining exposure to fuel price risk is mitigated through fixed-price purchases based on forecasted consumption levels. Fixed-price purchases can be either for physical deliveries or in the form of financial hedges.
Liquidity and refinancing risksThe power and heat business is capital intensive. Consequently, Fortum has a regular need to raise financing.
In order to manage these risks, Fortum maintains a diversified financing structure in terms of debt maturity profile, debt instruments and geographical markets. Fortum manages liquidity and refinancing risks through a combination of cash positions and committed credit facility agreements with its core banks. Due to the volatile rouble development and sanctions imposed, special attention has been paid to ensure that Russia Division has sufficient liquidity to undertake committed investments.
Financial performance and position Risk management Fortum share and shareholders
Proposal for the distribution of earnings Auditor’s reportPrimary statements Quarterly financial informationParent company financial statements Investor informationOperating and financial review Key figuresNotes
20

After the Distribution divestments, Fortum has a large cash position. The credit risk of this position has been mitigated by diversifying the deposits.
Currency and Interest rate risksFortum's debt portfolio consists of interest- bearing assets and liabilities on a fixed- and floating-rate basis with differing maturity profiles. Fortum manages the duration of the debt portfolio through use of different types of financing contracts and interest rate derivative contracts such as interest rate swaps.
Fortum's currency exposures are divided into transaction exposures (foreign exchange exposures relating to contracted cash flows and balance sheet items where changes in exchange rates will have an impact on earnings and cash flows) and translation exposure (foreign exchange exposure that arises when profits and balance sheets in foreign entities are consolidated at the Group level). For transaction risks, the main principle is that all material exposures should be hedged while translation exposures are not hedged, or are hedged selectively. The rouble exposures are monitored continuously. The main translation exposures are EUR/RUB and EUR/SEK. The weak rouble is affecting Fortum's profit level and equity when translating the Russia Division results and net assets to euros.
Counterparty risksFortum is exposed to counterparty risk whenever there is a contractual arrangement with an external counterparty including customers, suppliers, partners, banks and trading counterparties.
Credit risk exposures relating to financial derivative instruments are often volatile. Although the majority of commodity derivatives are cleared through exchanges, derivatives contracts are also entered into directly with external counterparties. Such contracts are limited to high-credit-quality counterparties active on the financial or commodity markets.
Due to the financing needs and management of liquidity, Fortum has counterparty credit exposure to a number of banks and financial institutions. This includes exposure to the Russian financial sector in terms of deposits with financial institutions as well as to banks that provide guarantees for suppliers and contracting parties. Deposits in Russia have been concentrated to the most creditworthy state-owned or controlled banks. Limits with banks and financial institutions are monitored so that exposures can be adjusted as ratings or the financial situation changes, and Fortum is
following the development of economic sanctions against Russia as part of the monitoring process.
Credit risk exposures relating to customers is spread across a wide range of industrial counterparties, small businesses and private individuals over a range of geographic regions. The majority of exposure is to the Nordic market, Poland and Russia. The risk of non-payment in the electricity and heat sales business in Russia is higher than in the Nordic market.
In order to minimise counterparty credit risk, Fortum has routines and processes to identify, assess and control exposure. Credit checks are performed before entering into commercial obligations and creditworthiness is monitored through the use of internal and external sources to ensure that actions can be taken if changes occur.
Corporate Credit is responsible for setting exposure limits for all larger individual counterparty credit exposures and for monitoring and reporting credit exposures for banks, trading counterparties and the largest customers in relation to approved limits.
Each division and corporate unit is responsible for ensuring that exposures remain within approved limits and for taking mitigating actions when needed. Mitigating actions include demanding collateral, such as guarantees, managing payment terms and contract length, and the use of netting agreements.
Operational risks
Operational risks are defined as the negative effects resulting from inadequate or failed internal processes, people and systems or equipment, or from external events. The main objective of operational risk management is to reduce the risk of unwanted operational events. Quality, environmental and occupational health and safety as well as safety management systems are tools for achieving this objective. Fortum's operational activities are 100% ISO 14001 certified and the coverage of OHSAS 18001 certification is 74%. Equipment and system risks are primarily managed through maintenance planning and contingency plans are in place.
The objective of insurance management is to optimise loss prevention activities, self-retentions and insurance coverage in a long-term cost-efficient manner. Fortum has established Group-wide insurance programmes for risks related to property damages, business interruption and liability exposures.
Production Risks CHP CHP production involves the use, storage and transportation of fuels. Leakage of fuels and contamination of the surrounding environment could lead to clean-up costs and third-party liabilities. An explosion or fire at a production facility could cause damages to the plant or third-parties and lead to possible business interruption. These risks are mitigated by condition monitoring and other operational improvements as well as competence development of personnel operating the plants.
Hydro power Operational events at hydro power generation facilities can lead to physical damages, business interruptions, and third- party liabilities. A long-term programme is in place for improving the surveillance of the condition of dams and for securing the discharge capacity in extreme flood situations.
In Sweden, third-party liabilities from dam failures are strictly the plant owner's responsibility. Together with other hydro power producers, Fortum has a shared dam liability insurance programme in place that covers Swedish dam failure liabilities up to SEK 9,000 million.
Nuclear power Fortum owns the Loviisa nuclear power plant, and has minority interests in two Finnish and two Swedish nuclear power companies. At the Loviisa power plant, the assessment and improvement of nuclear safety is a continuous process performed under the supervision of the Radiation and Nuclear Safety Authority of Finland (STUK).
In Finland and Sweden, third-party liability relating to nuclear accidents is strictly the plant operator's responsibility and must be covered by insurance.
As the operator of the Loviisa power plant, Fortum has a statutory liability insurance policy of 600M SDR (Special Drawing Right). The same type of insurance policies are in place for the operators where Fortum has a minority interest.
Decisions have been made in both Finland and Sweden to renew the current nuclear liability legislation to align more with the Paris and Brussels convention, but it is not likely to come into force during 2016. The changes in the new national legislation consist of a liability on plant operators covering damages up to EUR 700
Financial performance and position Risk management Fortum share and shareholders
Proposal for the distribution of earnings Auditor’s reportPrimary statements Quarterly financial informationParent company financial statements Investor informationOperating and financial review Key figuresNotes
21
million in Finland and up to EUR 1,200 million per nuclear incident in Sweden. The liability should be covered by insurance or other form of financial guarantee, as well as a strict and unlimited liability for the plant operators in each respective country.
Under the Finnish law, Fortum bears full legal and financial responsibility for the management and disposal of nuclear waste produced bythe Loviisa power plant. In both Finland and Sweden, Fortum bears partial responsibility, proportionate to the ownership share, for the costs of the management and disposal of nuclear waste produced by co-owned nuclear power plants.
In both Finland and Sweden, the future costs of the final disposal of spent fuel, the management of low and intermediate-level radioactive waste and nuclear power plant decommissioning are provided for by a state-established fund to which nuclear power plant operators make annual contributions.
Sustainability risksThe Corporate Sustainability unit assesses sustainability risks related to the Group's operations. Risks identified by Corporate Sustainability are assessed by Divisions and mitigation actions for applicable risks are defined as part of the annual planning process. Assessment of environmental risks and preparedness to operate in exceptional and emergency situations follows the requirements set in ISO 14001 standard. The same approach based on the requirements set in OHSAS 18001 standard applies to risks related to occupational health and safety and actions in emergency situations.
Operating power and heat generation plants involves use, storage and transportation of fuels and materials that can have adverse effects on the environment and expose personnel to safety risks.
Environmental, health and safety (EHS) risks as well as social risks related to Fortum's activities are evaluated through supplier pre-selection, internal and external audits and risk assessments. Corrective and preventive actions are implemented when necessary. EHS related risks together with social risks arising in investments are evaluated in accordance with Fortum's Investment Evaluation and Approval Procedure. Environmental risks and liabilities in relation to past actions have been assessed and provisions have been made for future remedial costs.
IT and information security risksFortum is exposed to hardware and software risks including cyber-attacks. Information security risks are managed centrally by the Corporate Security and IT functions. Group IT instructions set procedures for reducing risks and managing IT and other information security incidents. The main objective is to ensure high availability and fast recovery of IT systems. Fortum’s IT community identifies the IT-related operational risks that might threaten business continuity, and the mitigating actions are planned accordingly. The management of these risks is coordinated by Corporate IT, headed by the CIO, who also manages the IT architecture and strategy.
Financial performance and position Risk management Fortum share and shareholders
Proposal for the distribution of earnings Auditor’s reportPrimary statements Quarterly financial informationParent company financial statements Investor informationOperating and financial review Key figuresNotes
22
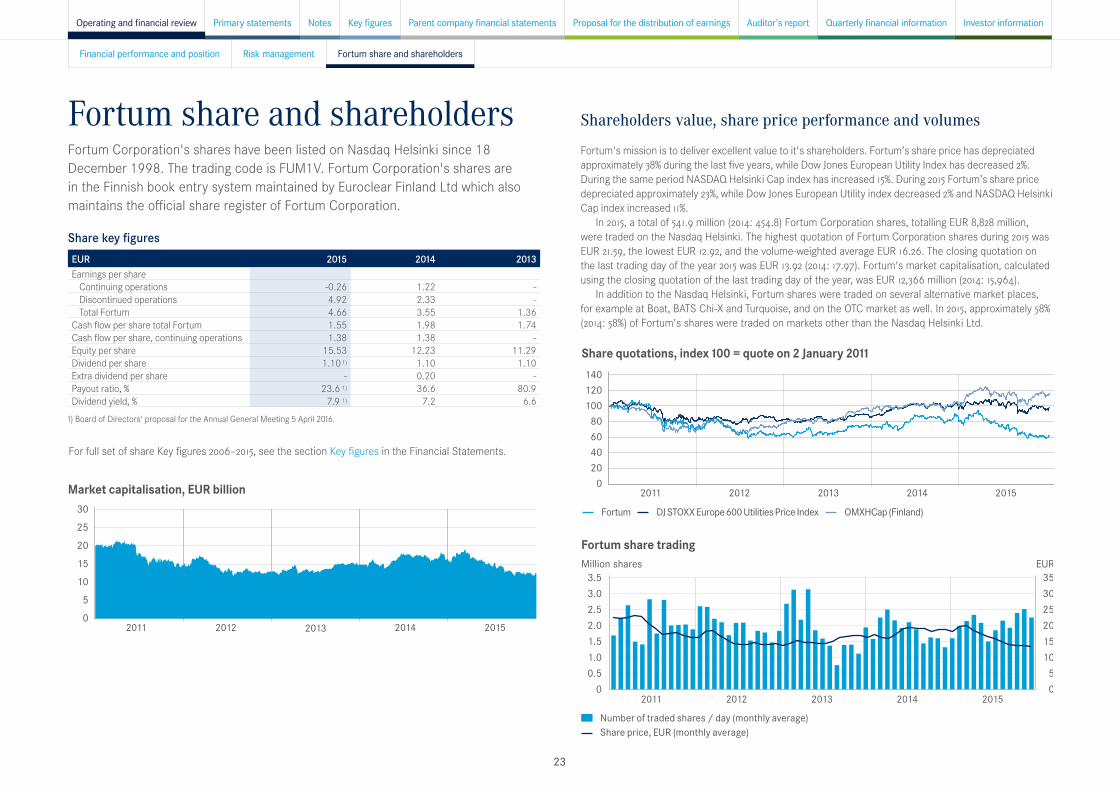
Fortum share and shareholdersFortum Corporation's shares have been listed on Nasdaq Helsinki since 18 December 1998. The trading code is FUM1V. Fortum Corporation's shares are in the Finnish book entry system maintained by Euroclear Finland Ltd which also maintains the official share register of Fortum Corporation.
Share key figuresEUR 2015 2014 2013Earnings per share
Continuing operations -0.26 1.22 -Discontinued operations 4.92 2.33 -Total Fortum 4.66 3.55 1.36
Cash flow per share total Fortum 1.55 1.98 1.74Cash flow per share, continuing operations 1.38 1.38 -Equity per share 15.53 12.23 11.29Dividend per share 1.10 1) 1.10 1.10Extra dividend per share - 0.20 -Payout ratio, % 23.6 1) 36.6 80.9Dividend yield, % 7.9 1) 7.2 6.6
1) Board of Directors' proposal for the Annual General Meeting 5 April 2016.
Shareholders value, share price performance and volumes
Fortum's mission is to deliver excellent value to it's shareholders. Fortum’s share price has depreciated approximately 38% during the last five years, while Dow Jones European Utility Index has decreased 2%. During the same period NASDAQ Helsinki Cap index has increased 15%. During 2015 Fortum’s share price depreciated approximately 23%, while Dow Jones European Utility index decreased 2% and NASDAQ Helsinki Cap index increased 11%.
In 2015, a total of 541.9 million (2014: 454.8) Fortum Corporation shares, totalling EUR 8,828 million, were traded on the Nasdaq Helsinki. The highest quotation of Fortum Corporation shares during 2015 was EUR 21.59, the lowest EUR 12.92, and the volume-weighted average EUR 16.26. The closing quotation on the last trading day of the year 2015 was EUR 13.92 (2014: 17.97). Fortum's market capitalisation, calculated using the closing quotation of the last trading day of the year, was EUR 12,366 million (2014: 15,964).
In addition to the Nasdaq Helsinki, Fortum shares were traded on several alternative market places, for example at Boat, BATS Chi-X and Turquoise, and on the OTC market as well. In 2015, approximately 58% (2014: 58%) of Fortum's shares were traded on markets other than the Nasdaq Helsinki Ltd.
140120 100
80604020
0
Share quotations, index 100 = quote on 2 January 2011
2011 2012 2013 2014 2015
Fortum DJ STOXX Europe 600 Utilities Price Index OMXHCap (Finland)
150
30
25
20
15
10
5
0
Market capitalisation, EUR billion
2011 2012 2013 2014 2015
For full set of share Key figures 2006–2015, see the section Key figures in the Financial Statements.
3.53.0 2.52.01.51.00.5
0
3530 25201510
5 0
Fortum share trading
2011
Million shares EUR
2012 2013 2014 2015
Number of traded shares / day (monthly average) Share price, EUR (monthly average)
Financial performance and position Risk management Fortum share and shareholders
Proposal for the distribution of earnings Auditor’s reportPrimary statements Quarterly financial informationParent company financial statements Investor informationOperating and financial review Key figuresNotes
23
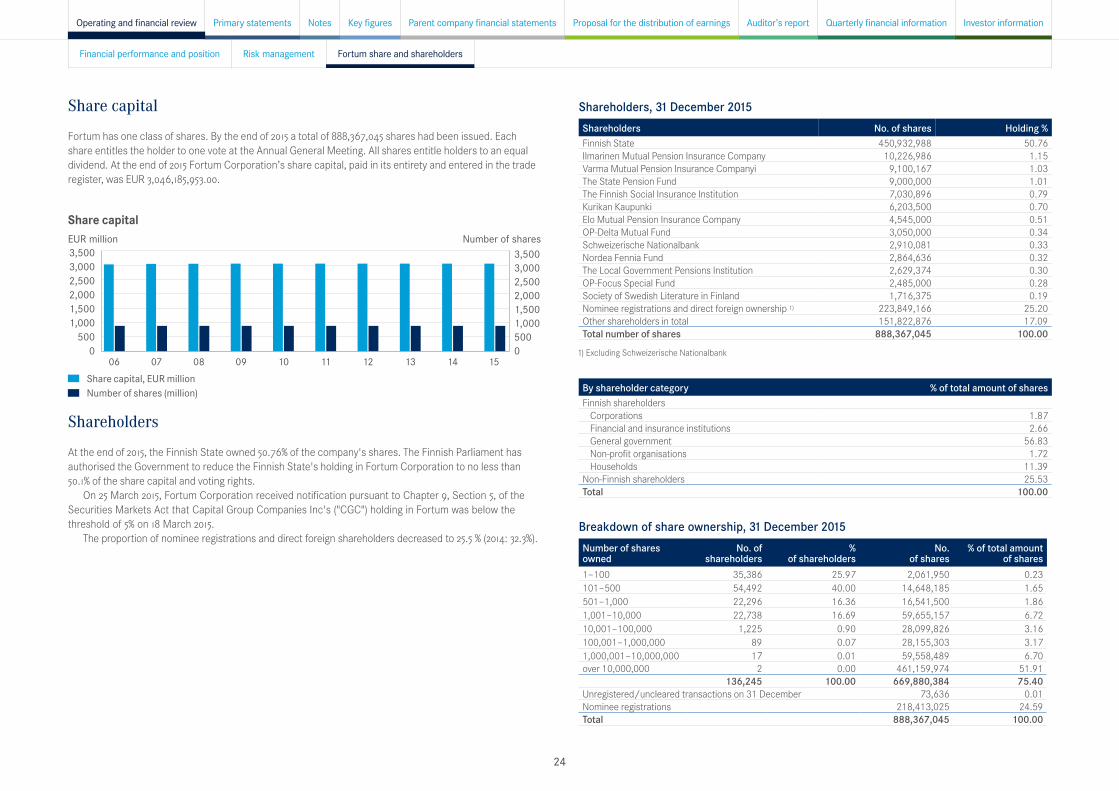
Share capital
Fortum has one class of shares. By the end of 2015 a total of 888,367,045 shares had been issued. Each share entitles the holder to one vote at the Annual General Meeting. All shares entitle holders to an equal dividend. At the end of 2015 Fortum Corporation’s share capital, paid in its entirety and entered in the trade register, was EUR 3,046,185,953.00.
Share capital
Share capital, EUR million Number of shares (million)
3,500 3,000 2,500 2,000 1,500 1,000
500 0
3,500 3,000 2,500 2,000 1,500 1,000 500 0
06 07 08 09 10 11 12 13 14 15
EUR million Number of shares
Shareholders
At the end of 2015, the Finnish State owned 50.76% of the company's shares. The Finnish Parliament has authorised the Government to reduce the Finnish State's holding in Fortum Corporation to no less than 50.1% of the share capital and voting rights.
On 25 March 2015, Fortum Corporation received notification pursuant to Chapter 9, Section 5, of the Securities Markets Act that Capital Group Companies Inc's ("CGC") holding in Fortum was below the threshold of 5% on 18 March 2015.
The proportion of nominee registrations and direct foreign shareholders decreased to 25.5 % (2014: 32.3%).
Shareholders, 31 December 2015Shareholders No. of shares Holding %Finnish State 450,932,988 50.76Ilmarinen Mutual Pension Insurance Company 10,226,986 1.15Varma Mutual Pension Insurance Companyi 9,100,167 1.03The State Pension Fund 9,000,000 1.01The Finnish Social Insurance Institution 7,030,896 0.79Kurikan Kaupunki 6,203,500 0.70Elo Mutual Pension Insurance Company 4,545,000 0.51OP-Delta Mutual Fund 3,050,000 0.34Schweizerische Nationalbank 2,910,081 0.33Nordea Fennia Fund 2,864,636 0.32The Local Government Pensions Institution 2,629,374 0.30OP-Focus Special Fund 2,485,000 0.28Society of Swedish Literature in Finland 1,716,375 0.19Nominee registrations and direct foreign ownership 1) 223,849,166 25.20Other shareholders in total 151,822,876 17.09Total number of shares 888,367,045 100.00
1) Excluding Schweizerische Nationalbank
By shareholder category % of total amount of sharesFinnish shareholders
Corporations 1.87Financial and insurance institutions 2.66General government 56.83Non-profit organisations 1.72Households 11.39
Non-Finnish shareholders 25.53Total 100.00
Breakdown of share ownership, 31 December 2015Number of shares owned
No. of shareholders
% of shareholders
No. of shares
% of total amount of shares
1–100 35,386 25.97 2,061,950 0.23101–500 54,492 40.00 14,648,185 1.65501–1,000 22,296 16.36 16,541,500 1.861,001–10,000 22,738 16.69 59,655,157 6.7210,001–100,000 1,225 0.90 28,099,826 3.16100,001–1,000,000 89 0.07 28,155,303 3.171,000,001–10,000,000 17 0.01 59,558,489 6.70over 10,000,000 2 0.00 461,159,974 51.91
136,245 100.00 669,880,384 75.40Unregistered/uncleared transactions on 31 December 73,636 0.01Nominee registrations 218,413,025 24.59Total 888,367,045 100.00
Financial performance and position Risk management Fortum share and shareholders
Proposal for the distribution of earnings Auditor’s reportPrimary statements Quarterly financial informationParent company financial statements Investor informationOperating and financial review Key figuresNotes
24

Management interests 31 December 2015
At the end of 2015, the President and CEO and other members of the Fortum Management Team owned 347,478 shares (2014: 430,457) representing approximately 0.04% (2014: 0.05%) of the total shares in the company.
A full description of the shareholdings and interests in long-term incentive schemes of the President and CEO and other members of the Fortum Executive Management Team is shown in Note 11 Employee benefits.
Authorisations from the Annual General Meeting 2015
Currently the Board of Directors has no unused authorisations from the Annual General Meeting of Shareholders to issue convertible loans or bonds with warrants to issue new shares or to buy Fortum Corporation's own shares.
Dividend policy
The dividend policy ensures that shareholders receive a fair remuneration for their entrusted capital, supported by the company's long-term strategy that aims at increasing earnings per share and thereby the dividend. When proposing the dividend, the Board of Directors looks at a range of factors, including the macro environment, balance sheet strength as well as future investment plans. Fortum Corporation's target is to pay a stable, sustainable and over time increasing dividend, in the range of 50–80% of earnings per share, excluding one-off items.
Dividend distribution proposal
The distributable funds of Fortum Oyj as at 31 December 2015 amounted to EUR 5,417,422,951.23 including the profit of the period of EUR 1,133,611,072.83. After the end of the financial period there have been no material changes in the financial position of the Company.
The Board of Directors proposes to the Annual General Meeting that a dividend of EUR 1.10 per share be paid for 2015.
Based on the number of registered shares as of 2 February 2016 the total amount of dividend proposed to be paid is EUR 977,203,749.50. The Board of Directors proposes, that the remaining part of the profit be retained in the shareholders’ equity.
The Annual General Meeting will be held on 5 April 2016 at 14:00 EET at Finlandia Hall in Helsinki.
Earnings per share total Fortum, EUR5.0
4.0
3.0
2.0
1.0
0.02011 2012 2013 2014 2015
Dividend per share, EUR1.5
1.0
0.5
0.02011 2012 2013 2014 2015
The dividend for 2015 represents the Board of Directors’ proposal for the Annual General
Meeting in April 2016.
Fortum paid extra dividend of EUR 0.20 per share for the financial year that ended 31 Dec 2014.
40
30
20
10
02011201020092008 2012 2013 2014 2015
Total shareholder return
Fortum’s total shareholder return, EUR 22.47 (dividends reinvested) Fortum’s share price, EUR 13.92
EUR
Financial performance and position Risk management Fortum share and shareholders
Proposal for the distribution of earnings Auditor’s reportPrimary statements Quarterly financial informationParent company financial statements Investor informationOperating and financial review Key figuresNotes
25

Consolidated income statementEUR million Note 2015 2014 Sales 5 3,459 4,088Other income 9 38 60Materials and services 10 -1,515 -1,825Employee benefits 11 -351 -369Depreciation and amortisation 5, 18, 19 -346 -377Other expenses 9 -477 -492Comparable operating profit 5 808 1,085Items affecting comparability 6, 7 -958 211Operating profit 5 -150 1,296Share of profit of associates and joint ventures 5, 20 20 146
Interest expense 12 -203 -249Interest income 12 51 84Fair value gains and losses on financial instruments 12 -18 -5Other financial expenses - net 12 -4 -40
Finance costs - net 12 -175 -210Profit before income tax -305 1,232Income tax expense 13 78 -143Profit for the period from continuing operations -228 1,089 Discontinued operations: Profit for the period from discontinuing operations 14 4,369 2,073Profit for the period 4,142 3,161
Attributable to:Owners of the parent 4,138 3,154Non-controlling interests 4 7
4,142 3,161 Earnings per share for profit attributable to the equity owners of the company (EUR per share) 1) 15Total Fortum 4.66 3.55Continuing operations -0.26 1.22Discontinued operations 4.92 2.33
1) As Fortum currently has no dilutive instruments outstanding, diluted earnings per share is the same as basic earnings per share.
EUR million Note 2015 2014Comparable operating profit 808 1,085Impairment charges 7 -918 0Non-recurring items (mainly capital gains) 22 305Changes in fair values of derivatives hedging future cash flow 8 -78 -91Nuclear fund adjustment 5 16 -3Items affecting comparability 5, 6 -958 211Operating profit -150 1,296
Discontinued operationsIn 2014 Fortum divested both the Finnish and Norwegian Distribution operations. The sale of the Swedish distribution business was completed in June 2015. After the divestment of these operations Fortum does not have any electricity distribution operations and therefore Distribution segment has been treated as discontinued operations since the first quarter 2015 according to IFRS 5 Non-current Assets held for Sale and Discontinued operations. Comparative period information for 2014 presented in these financial statements has been restated accordingly. See further information in Note 14 Discontinued operations and Note 41 Acquisitions and disposals.
Early closure of nuclear units in SwedenThe decision made by the Extraordinary shareholders' meeting of OKG AB to close Oskarshamn nuclear power plant units 1 and 2 in Sweden impacted the 2015 net result attributable to the owners of the parent by EUR -729 million. The impact is recognised on several rows of the income statement, but the major part is included in Impairment charges, in Items effecting comparability. See further information in Note 7 Effects from early closure of nuclear units in Sweden.
Comparable operating profit, EUR million
Total Fortum 2014
Discontinued operations
2014
Continuing operations
2014
Power and Technology
Russia Continuing operations
2015
Heat Electricity Sales and Solutions
Other Discontinued operations
2015
Total Fortum 2015
1,500
1,000
500
0
Vattenfall Fortum Hafslund Dong Energy E.ON Statkraft SEAS-NVE Helen Göteborg Energi, Din El SE - Syd Energi Others
1,351 -2661,085 -316
4 40 -6 808 114 922
Income statement Statement of comprehensive income Balance sheet Statement of changes in total equity Cash flow statement
Proposal for the distribution of earnings Auditor’s reportPrimary statements Quarterly financial informationParent company financial statements Investor informationOperating and financial review Key figuresNotes
26
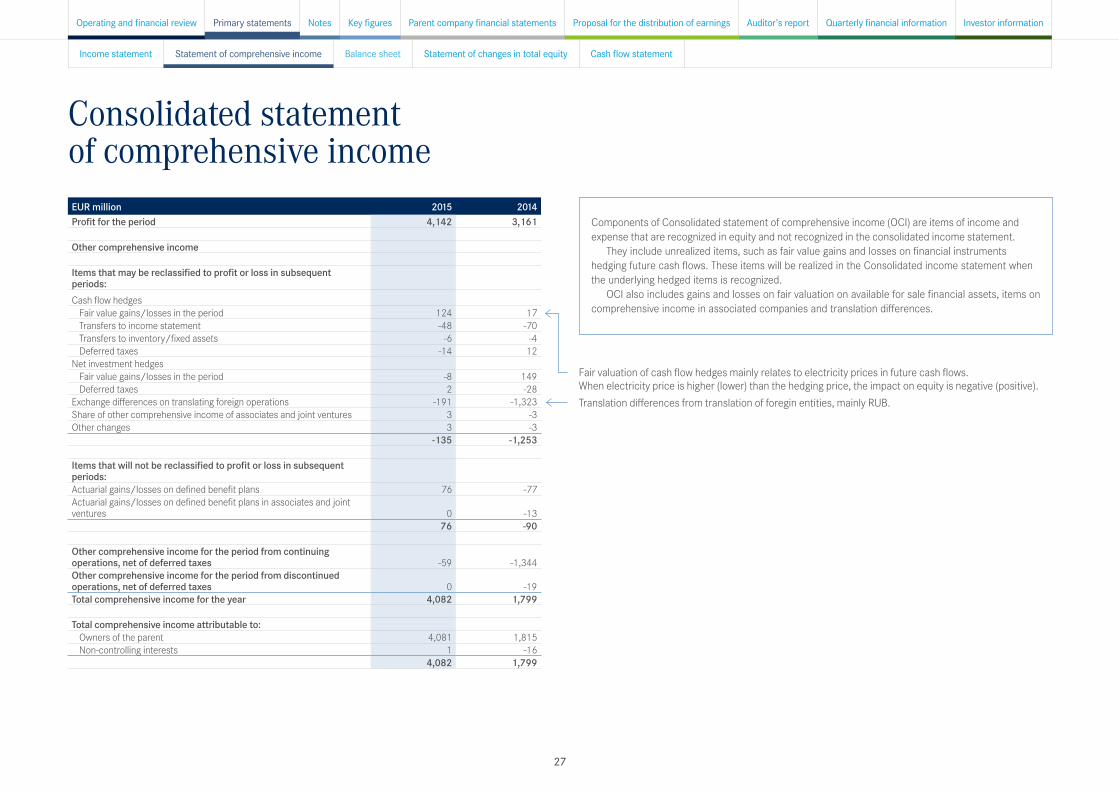
Consolidated statement of comprehensive incomeEUR million 2015 2014Profit for the period 4,142 3,161 Other comprehensive income Items that may be reclassified to profit or loss in subsequent periods:Cash flow hedges
Fair value gains/losses in the period 124 17Transfers to income statement -48 -70Transfers to inventory/fixed assets -6 -4Deferred taxes -14 12
Net investment hedgesFair value gains/losses in the period -8 149Deferred taxes 2 -28
Exchange differences on translating foreign operations -191 -1,323Share of other comprehensive income of associates and joint ventures 3 -3Other changes 3 -3
-135 -1,253 Items that will not be reclassified to profit or loss in subsequent periods:Actuarial gains/losses on defined benefit plans 76 -77Actuarial gains/losses on defined benefit plans in associates and joint ventures 0 -13 76 -90
Other comprehensive income for the period from continuing operations, net of deferred taxes -59 -1,344Other comprehensive income for the period from discontinued operations, net of deferred taxes 0 -19Total comprehensive income for the year 4,082 1,799 Total comprehensive income attributable to:
Owners of the parent 4,081 1,815Non-controlling interests 1 -16
4,082 1,799
Fair valuation of cash flow hedges mainly relates to electricity prices in future cash flows. When electricity price is higher (lower) than the hedging price, the impact on equity is negative (positive).Translation differences from translation of foregin entities, mainly RUB.
Components of Consolidated statement of comprehensive income (OCI) are items of income and expense that are recognized in equity and not recognized in the consolidated income statement.
They include unrealized items, such as fair value gains and losses on financial instruments hedging future cash flows. These items will be realized in the Consolidated income statement when the underlying hedged items is recognized.
OCI also includes gains and losses on fair valuation on available for sale financial assets, items on comprehensive income in associated companies and translation differences.
Income statement Statement of comprehensive income Balance sheet Statement of changes in total equity Cash flow statement
Proposal for the distribution of earnings Auditor’s reportPrimary statements Quarterly financial informationParent company financial statements Investor informationOperating and financial review Key figuresNotes
27

Consolidated balance sheetEUR million Note 31 Dec 2015 31 Dec 2014ASSETSNon-current assetsIntangible assets 18 222 276Property, plant and equipment 19 8,710 11,195Participations in associates and joint ventures 20 1,959 2,027Share in State Nuclear Waste Management Fund 30 810 774Other non-current assets 21 93 68Deferred tax assets 29 80 98Derivative financial instruments 3 509 595Long-term interest-bearing receivables 22 773 2,041Total non-current assets 13,157 17,074 Current assetsInventories 23 231 256Derivative financial instruments 3 355 448Trade and other receivables 24 822 830
Deposits and securities (maturity over three months) 4,913 757Cash and cash equivalents 3,289 2,009
Liquid funds 25 8,202 2,766Total current assets 9,610 4,301 Total assets 22,767 21,375
EUR million Note 31 Dec 2015 31 Dec 2014EQUITYEquity attributable to owners of the parentShare capital 26 3,046 3,046Share premium 73 73Retained earnings 10,507 7,708Other equity components 168 36Total 13,794 10,864Non-controlling interests 27 69 71Total equity 13,863 10,935 LIABILITIESNon-current liabilitiesInterest-bearing liabilities 28 4,965 5,881Derivative financial instruments 3 290 247Deferred tax liabilities 29 483 1,159Nuclear provisions 30 810 774Other provisions 31 81 17Pension obligations 32 65 140Other non-current liabilities 33 168 154Total non-current liabilities 6,863 8,373
Current liabilitiesInterest-bearing liabilities 28 1,042 1,103Derivative financial instruments 3 121 76Trade and other payables 34 879 888Total current liabilities 2,042 2,067 Total liabilities 8,904 10,440 Total equity and liabilities 22,767 21,375
Income statement Statement of comprehensive income Balance sheet Statement of changes in total equity Cash flow statement
Proposal for the distribution of earnings Auditor’s reportPrimary statements Quarterly financial informationParent company financial statements Investor informationOperating and financial review Key figuresNotes
28
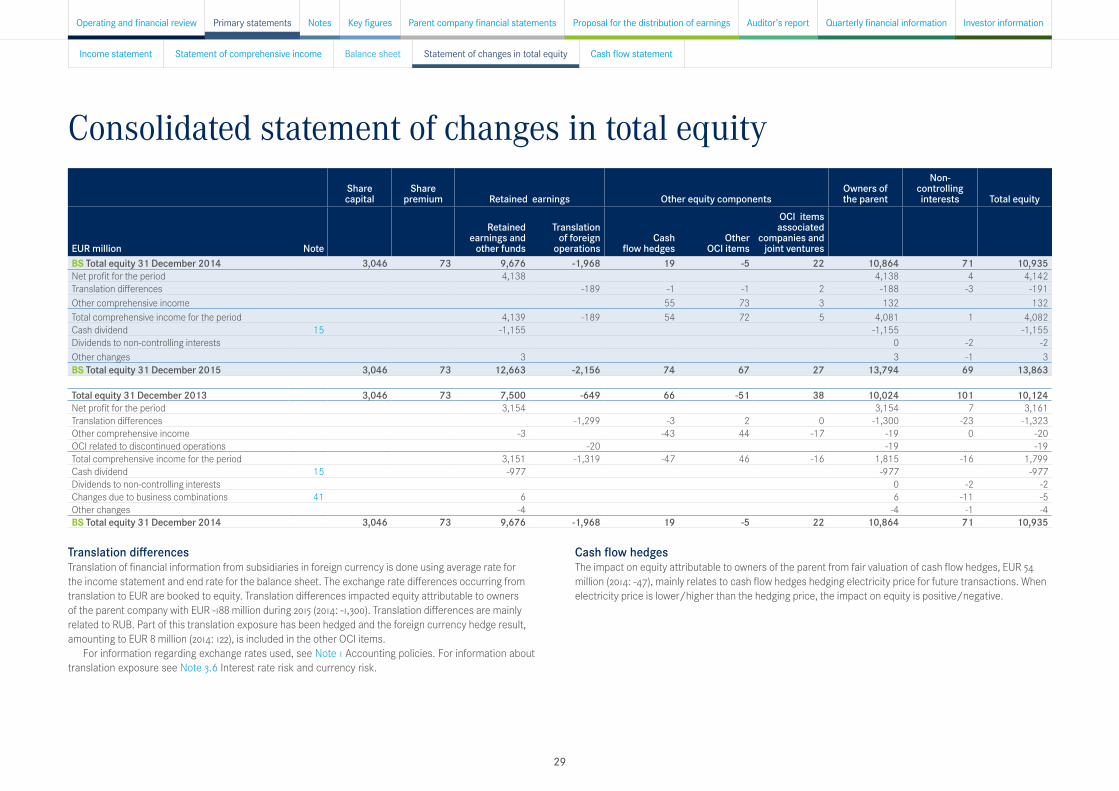
Consolidated statement of changes in total equityShare capital
Share premium Retained earnings Other equity components
Owners of the parent
Non-controlling interests Total equity
EUR million Note
Retained earnings and
other funds
Translation of foreign
operationsCash
flow hedgesOther
OCI items
OCI items associated
companies and joint ventures
BS Total equity 31 December 2014 3,046 73 9,676 -1,968 19 -5 22 10,864 71 10,935Net profit for the period 4,138 4,138 4 4,142Translation differences -189 -1 -1 2 -188 -3 -191Other comprehensive income 55 73 3 132 132Total comprehensive income for the period 4,139 -189 54 72 5 4,081 1 4,082Cash dividend 15 -1,155 -1,155 -1,155Dividends to non-controlling interests 0 -2 -2Other changes 3 3 -1 3BS Total equity 31 December 2015 3,046 73 12,663 -2,156 74 67 27 13,794 69 13,863
Total equity 31 December 2013 3,046 73 7,500 -649 66 -51 38 10,024 101 10,124Net profit for the period 3,154 3,154 7 3,161Translation differences -1,299 -3 2 0 -1,300 -23 -1,323Other comprehensive income -3 -43 44 -17 -19 0 -20OCI related to discontinued operations -20 -19 -19Total comprehensive income for the period 3,151 -1,319 -47 46 -16 1,815 -16 1,799Cash dividend 15 -977 -977 -977Dividends to non-controlling interests 0 -2 -2Changes due to business combinations 41 6 6 -11 -5Other changes -4 -4 -1 -4BS Total equity 31 December 2014 3,046 73 9,676 -1,968 19 -5 22 10,864 71 10,935
Income statement Statement of comprehensive income Balance sheet Statement of changes in total equity Cash flow statement
Proposal for the distribution of earnings Auditor’s reportPrimary statements Quarterly financial informationParent company financial statements Investor informationOperating and financial review Key figuresNotes
29
Translation differencesTranslation of financial information from subsidiaries in foreign currency is done using average rate for the income statement and end rate for the balance sheet. The exchange rate differences occurring from translation to EUR are booked to equity. Translation differences impacted equity attributable to owners of the parent company with EUR -188 million during 2015 (2014: -1,300). Translation differences are mainly related to RUB. Part of this translation exposure has been hedged and the foreign currency hedge result, amounting to EUR 8 million (2014: 122), is included in the other OCI items.
For information regarding exchange rates used, see Note 1 Accounting policies. For information about translation exposure see Note 3.6 Interest rate risk and currency risk.
Cash flow hedgesThe impact on equity attributable to owners of the parent from fair valuation of cash flow hedges, EUR 54 million (2014: -47), mainly relates to cash flow hedges hedging electricity price for future transactions. When electricity price is lower/higher than the hedging price, the impact on equity is positive/negative.

Consolidated cash flow statement EUR million Note 2015 2014Cash flow from operating activitiesNet profit for the period from continuing operations -228 1,089Adjustments:Income tax expenses -78 143Finance costs - net 175 210Share of profit of associates and joint ventures -20 -146Depreciation and amortisation 346 377Operating profit before depreciations (EBITDA) 196 1,673Non-cash flow items and divesting activities 891 -244Interest received 52 99Interest paid -263 -323Dividends received 52 58Realised foreign exchange gains and losses and other financial items 336 349Taxes -65 -163Funds from operations 1,199 1,447Change in working capital 29 -42Total net cash from operating activities continuing operations 1,228 1,406Total net cash from operating activities discontinued operations 154 356Total net cash from operating activities 1,381 1,762
Cash flow from investing activitiesCapital expenditures 5, 18, 19 -527 -622Acquisitions of shares -43 -69Proceeds from sales of fixed assets 28 26Divestments of shares 27 473Shareholder loans to associated companies and joint ventures 481 425Change in other interest-bearing receivables -1 8Total net cash used in investing activities from continuing operations -35 241Total net cash used in investing activities from discontinued operations 6,303 2,574Total net cash used in investing activities 6,268 2,816
EUR million Note 2015 2014Cash flow before financing activities 7,650 4,578
Cash flow from financing activitiesProceeds from long-term liabilities 37 50Payments of long-term liabilities -956 -1,480Change in short-term liabilities -84 -580Dividends paid to the owners of the parent 15 -1,155 -977Other financing items -2 -1Total net cash used in financing activities from continuing operations -2,160 -2,988Total net cash used in financing activities from discontinued operations 0 -19Total net cash used in financing activities -2,160 -3,007Total net increase(+)/decrease(-) in liquid funds 5,490 1,571 Liquid funds at the beginning of the year 2,766 1,265Foreign exchange differences in liquid funds -54 -70Liquid funds at the end of the period 25 8,202 2,766
Non-cash flow items and divesting activities consist mainly of reversal non-recurring items EUR -896 million (2014: 305), changes in provisions (including nuclear) EUR 80 million (2014: 27) and adjustments for unrealised fair value changes of derivatives EUR -78 million (2014:-88). The actual proceeds for divestments are shown under cash flow from investing activities.
Realised foreign exchange gains and losses and other financial items include realised foreign exchange gains and losses of EUR 292 million for 2015 (2014: 352) related mainly to financing of Fortum's Swedish and Russian subsidiaries and the fact that the Group's main external financing currency is EUR. The foreign exchange gains and losses arise for rollover of foreign exchange contracts hedging the internal loans as major part of these forwards is entered into with short maturities i.e. less than twelve months.
Capital expenditures in cash flow do not include not yet paid investments. Capitalised borrowing costs are presented in interest paid.
Income statement Statement of comprehensive income Balance sheet Statement of changes in total equity Cash flow statement
Proposal for the distribution of earnings Auditor’s reportPrimary statements Quarterly financial informationParent company financial statements Investor informationOperating and financial review Key figuresNotes
30
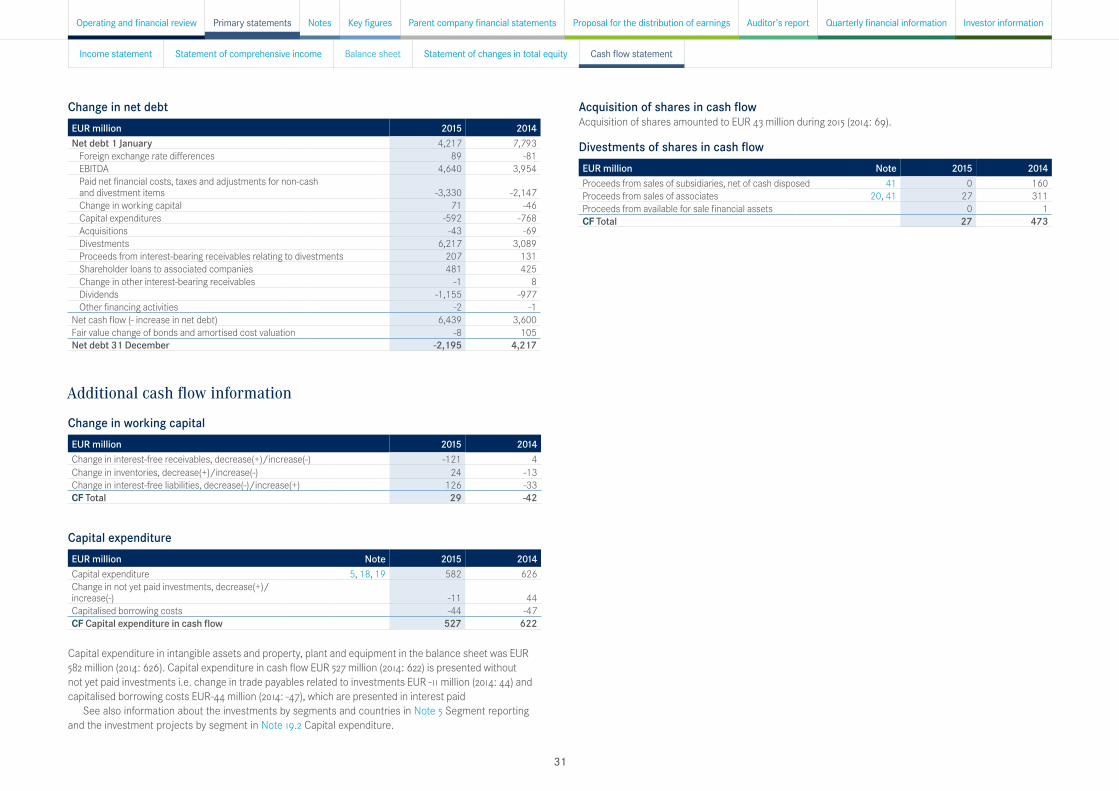
Additional cash flow information
Change in working capitalEUR million 2015 2014Change in interest-free receivables, decrease(+)/increase(-) -121 4Change in inventories, decrease(+)/increase(-) 24 -13Change in interest-free liabilities, decrease(-)/increase(+) 126 -33CF Total 29 -42
Capital expenditureEUR million Note 2015 2014Capital expenditure 5, 18, 19 582 626Change in not yet paid investments, decrease(+)/increase(-) -11 44Capitalised borrowing costs -44 -47CF Capital expenditure in cash flow 527 622
Divestments of shares in cash flowEUR million Note 2015 2014Proceeds from sales of subsidiaries, net of cash disposed 41 0 160Proceeds from sales of associates 20, 41 27 311Proceeds from available for sale financial assets 0 1CF Total 27 473
Acquisition of shares in cash flowAcquisition of shares amounted to EUR 43 million during 2015 (2014: 69).
Capital expenditure in intangible assets and property, plant and equipment in the balance sheet was EUR 582 million (2014: 626). Capital expenditure in cash flow EUR 527 million (2014: 622) is presented without not yet paid investments i.e. change in trade payables related to investments EUR -11 million (2014: 44) and capitalised borrowing costs EUR-44 million (2014: -47), which are presented in interest paid
See also information about the investments by segments and countries in Note 5 Segment reporting and the investment projects by segment in Note 19.2 Capital expenditure.
Change in net debtEUR million 2015 2014Net debt 1 January 4,217 7,793
Foreign exchange rate differences 89 -81EBITDA 4,640 3,954Paid net financial costs, taxes and adjustments for non-cash and divestment items -3,330 -2,147Change in working capital 71 -46Capital expenditures -592 -768Acquisitions -43 -69Divestments 6,217 3,089Proceeds from interest-bearing receivables relating to divestments 207 131Shareholder loans to associated companies 481 425Change in other interest-bearing receivables -1 8Dividends -1,155 -977Other financing activities -2 -1
Net cash flow (- increase in net debt) 6,439 3,600Fair value change of bonds and amortised cost valuation -8 105Net debt 31 December -2,195 4,217
Income statement Statement of comprehensive income Balance sheet Statement of changes in total equity Cash flow statement
Proposal for the distribution of earnings Auditor’s reportPrimary statements Quarterly financial informationParent company financial statements Investor informationOperating and financial review Key figuresNotes
31
12345678910111213141516171819202122232425262728293031323334353637383940414243
1 Accounting policies1.1 Basic informationFortum Corporation (the Company) is a Finnish public limited liability company with its domicile in Espoo, Finland. Fortum's shares are traded on Nasdaq Helsinki.
The operations of Fortum Corporation and its subsidiaries (together the Fortum Group) focus on the Nordic and Baltic countries, Russia and Poland. Fortum's activities cover generation and sale of electricity, generation, distribution and sale of heat, and energy-related expert services.
These financial statements were approved by the Board of Directors on 2 February 2016.
1.2 Basis of preparationThe consolidated financial statements of the Fortum Group have been prepared in accordance with International Financial Reporting Standards (IFRS) and IFRIC Interpretations as adopted by the European Union. The financial statements also comply with Finnish accounting principles and corporate legislation.
The consolidated financial statements have been prepared under the historical cost convention, except for available for sale financial assets, financial assets and financial liabilities (including derivative instruments) at fair value through profit and loss and items hedged at fair value.
1.2.1 Income statement presentationIn the Consolidated income statement Comparable operating profit-key figure is presented to better reflect the Group's business performance when comparing results for the current period with previous periods.
Items affecting comparability are disclosed as a separate line item. The following items are included in Items affecting comparability:
• impairment charges and related provisions (mainly dismantling);• non-recurring items, which mainly consist of capital gains and losses;• effects from fair valuations of derivatives hedging future cash flows which do not obtain hedge
accounting status according to IAS 39. The major part of Fortum's cash flow hedges obtain hedge accounting where fair value changes are recorded in equity;
• effects from accounting of Fortum's part of the State Nuclear Waste Management Fund where the assets can not exceed the related liabilities according to IFRIC5.
Comparable operating profit is used for financial target setting, follow up and allocation of resources in the group's performance management.
On 15 April 2015 Fortum published a stock exchange release regarding the IFRS 5 restatement of income statement and cash flow for 2014. As described in the release, Distribution segment is treated as discontinued operations from the first quarter interim report 2015 onwards. The income statement and cash flow for the comparative period 2014 have been restated accordingly. Reclassification of discontinued operations does not impact the balance sheet. More information on the impact of the reclassification can be found in Note 41 Acquisitions and disposals and the stock exchange release published on 15 April 2015.
1.2.2 Classification of current and non-current assets and liabilities An asset or a liability is classified as current when it is expected to be realised in the normal operating cycle or within twelve months after the balance sheet date or it is classified as financial assets or liabilities held at fair value through profit or loss. Liquid funds are classified as current assets.
All other assets and liabilities are classified as non-current assets and liabilities.
1.3 Principles for consolidation The consolidated financial statements comprise of the parent company, subsidiaries, joint ventures and associated companies.
The Fortum Group was formed in 1998 by using the pooling-of-interests method for consolidating Fortum Power and Heat Oy and Fortum Oil and Gas Oy (the latter demerged to Fortum Oil Oy and Fortum Heat and Gas Oy 1 May 2004). In 2005 Fortum Oil Oy (current Neste Oyj) was separated from Fortum by distributing 85% of its shares to Fortum's shareholders and by selling the remaining 15%. This means that the acquisition cost of Fortum Power and Heat Oy and Fortum Heat and Gas Oy has been eliminated against the share capital of the companies. The difference has been entered as a decrease in shareholders' equity.
1.3.1 SubsidiariesSubsidiaries are defined as companies in which Fortum has control. Control exists when Fortum is exposed to, or has rigths to, variable returns from its involvement with the entity and has the ability to affect those returns through its power over the entity.
The acquisition method of accounting is used to account for the acquisition of subsidiaries. The cost of an acquisition is measured as the aggregate of fair value of the assets given and liabilities incurred or assumed at the date of exchange, plus costs directly attributable to the acquisition. Identifiable assets acquired and liabilities assumed in a business combination are measured initially at their fair values at the acquisition date, irrespective of the extent of any minority interest. The excess of the cost of acquisition over the fair value of the Group's share of the identifiable net assets acquired is recorded as goodwill. If the cost of acquisition is less than the fair value of the net assets of the subsidiary acquired, the difference is recognised directly in the income statement.
Subsidiaries are fully consolidated from the date on which control is transferred to the Group and are no longer consolidated from the date that control ceases.
Intercompany transactions, balances and unrealised gains on transactions between Group companies are eliminated. Unrealised losses are also eliminated unless the transaction provides evidence of an impairment of the asset transferred. Where necessary, subsidiaries' accounting policies have been changed to ensure consistency with the policies the Group has adopted.
The Fortum Group subsidiaries are disclosed in Note 43 Subsidiaries by segment on 31 December 2015.
1.3.2 AssociatesAssociated companies are entities over which the Group has significant influence but not control, generally accompanying a shareholding of between 20% and 50% of the voting rights. The Group's interests in associated companies are accounted for using the equity method of accounting.
Basis of preparation Risks Income statement Balance sheet Off balance sheet items Group structure and related parties
Proposal for the distribution of earnings Auditor’s reportPrimary statements Quarterly financial informationParent company financial statements Investor informationOperating and financial review Key figuresNotes
32

12345678910111213141516171819202122232425262728293031323334353637383940414243
1.3.3. Joint venturesJoint ventures are arrangement in which the Group has joint control. Joint ventures are accounted for using the equity method of accounting.
1.3.4. Non-controlling interests Non-controlling interests in subsidiaries are identified separately from the equity of the owners of the parent company. The non-controlling interests are initially measured at the non-controlling interests' proportionate share of the fair value of the acquiree's identifiable net assets. Subsequent to acquisition, the carrying amount of non-controlling interests is the amount of those interests at initial recognition plus the non-controlling interests' share of subsequent changes in equity.
1.3.5. Assets held for sale and discontinued operationsNon-current assets (or disposal groups) classified as held for sale are valued at the lower of their carrying amount and fair value less costs to sell if their carrying amount will be recovered principally through a sale transaction rather than through continuing use. These classification criteria do not include non-current assets to be abandoned or those that have been temporarily taken out of use. An impairment loss (or subsequent gain) reduces (or increases) the carrying amount of the non-current assets or disposal groups. The assets are not depreciated or amortised. Interest or other expenses related to these assets are recognised as before the classification as held for sale.
Discontinued operations represent a separate major line of business that either has been disposed of or is classified as held for sale. Assets and liabilities attributable to the discontinued operations must be clearly distinguishable from the other consolidated entities in terms of their operations and cash flows. In addition, the reporting entity must not have any significant continuing involvement in the operations classified as a discontinued operation.
1.4 Foreign currency transactions and translation
1.4.1 Functional and presentation currency Items included in the financial statements of each of the Group's entities are measured using the currency of the primary economic environment in which the entity operates (‘the functional currency'). The consolidated financial statements are presented in euros, which is the Company's functional and presentation currency.
1.4.2 Transactions and balances Transactions denominated in foreign currencies are translated using the exchange rate at the date of the transaction. Receivables and liabilities denominated in foreign currencies outstanding on the closing date are translated using the exchange rate quoted on the closing date. Exchange rate differences have been entered in the income statement. Net conversion differences relating to financing are entered under financial income or expenses, except when deferred in equity as qualifying cash flow hedges. Translation differences on available for sale financial assets are included in Other equity components section of the equity.
1.4.3 Group companiesThe income statements of subsidiaries, whose measurement and reporting currencies are not euros, are translated into the Group reporting currency using the average exchange rates for the year based on the month-end exchange rates, whereas the balance sheets of such subsidiaries are translated using the exchange rates on the balance sheet date. On consolidation, exchange differences arising from the translation of the net investment in foreign entities, and of borrowings and other currency instruments designated as hedges of such investments, are taken to equity. When a foreign operation is sold, such exchange differences are recognised in the income statement as part of the gain or loss on sale. Goodwill and fair value adjustments arising on the acquisition of a foreign entity are treated as assets and liabilities of the foreign entity and translated at the closing rate.
The balance sheet date rate is based on the exchange rate published by the European Central Bank for the closing date. The average exchange rate is calculated as an average of each month’s ending rate from the European Central Bank during the year and the ending rate of the previous year.
The key exchange rates applied in the Fortum Group accountsAverage rate Balance sheet date rate
Currency 2015 2014 31 Dec 2015 31 Dec 2014Sweden SEK 9.3414 9.1004 9.1895 9.3930Norway NOK 8.9953 8.3940 9.6030 9.0420Poland PLN 4.1909 4.1909 4.2639 4.2732Russia RUB 69.0427 51.4243 80.6736 72.3370
1.4.4 Associates and joint venturesThe Group’s interests in associated companies and jointly ventures are accounted for by the equity method. Associates and joint ventures, whose measurement and reporting currencies are not euro, are translated into the Group reporting currency using the same principles as for subsidiaries, see 1.4.3 Group companies. 1.5 Accounting policiesFortum describes the accounting principles in conjunction with the relevant note information. The table on the next page lists the significant accounting policies and the note where they are presented as well as the relevant IFRS standard.
Basis of preparation Risks Income statement Balance sheet Off balance sheet items Group structure and related parties
Proposal for the distribution of earnings Auditor’s reportPrimary statements Quarterly financial informationParent company financial statements Investor informationOperating and financial review Key figuresNotes
33
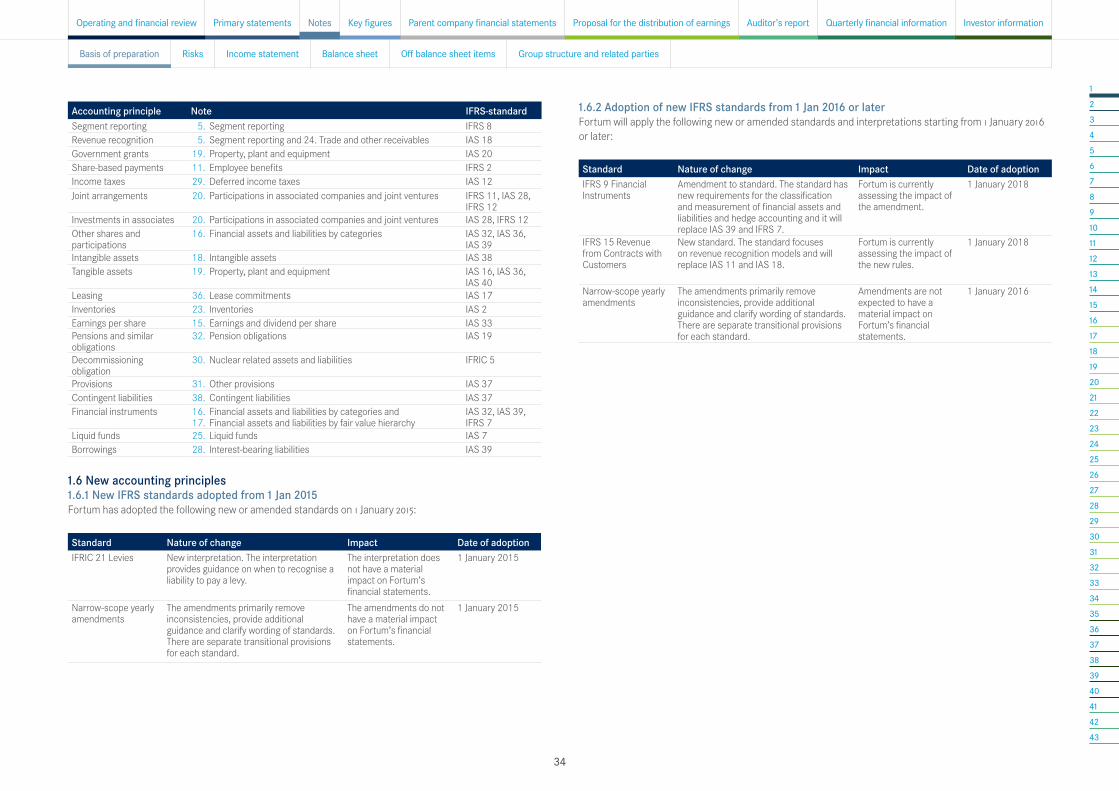
12345678910111213141516171819202122232425262728293031323334353637383940414243
1.6.2 Adoption of new IFRS standards from 1 Jan 2016 or laterFortum will apply the following new or amended standards and interpretations starting from 1 January 2016 or later:
Standard Nature of change Impact Date of adoptionIFRS 9 Financial Instruments
Amendment to standard. The standard has new requirements for the classification and measurement of financial assets and liabilities and hedge accounting and it will replace IAS 39 and IFRS 7.
Fortum is currently assessing the impact of the amendment.
1 January 2018
IFRS 15 Revenue from Contracts with Customers
New standard. The standard focuses on revenue recognition models and will replace IAS 11 and IAS 18.
Fortum is currently assessing the impact of the new rules.
1 January 2018
Narrow-scope yearly amendments
The amendments primarily remove inconsistencies, provide additional guidance and clarify wording of standards. There are separate transitional provisions for each standard.
Amendments are not expected to have a material impact on Fortum’s financial statements.
1 January 2016
Basis of preparation Risks Income statement Balance sheet Off balance sheet items Group structure and related parties
Proposal for the distribution of earnings Auditor’s reportPrimary statements Quarterly financial informationParent company financial statements Investor informationOperating and financial review Key figuresNotes
34
Accounting principle Note IFRS-standardSegment reporting 5. Segment reporting IFRS 8Revenue recognition 5. Segment reporting and 24. Trade and other receivables IAS 18Government grants 19. Property, plant and equipment IAS 20Share-based payments 11. Employee benefits IFRS 2Income taxes 29. Deferred income taxes IAS 12Joint arrangements 20. Participations in associated companies and joint ventures IFRS 11, IAS 28,
IFRS 12Investments in associates 20. Participations in associated companies and joint ventures IAS 28, IFRS 12Other shares and participations
16. Financial assets and liabilities by categories IAS 32, IAS 36, IAS 39
Intangible assets 18. Intangible assets IAS 38Tangible assets 19. Property, plant and equipment IAS 16, IAS 36,
IAS 40Leasing 36. Lease commitments IAS 17Inventories 23. Inventories IAS 2Earnings per share 15. Earnings and dividend per share IAS 33Pensions and similar obligations
32. Pension obligations IAS 19
Decommissioning obligation
30. Nuclear related assets and liabilities IFRIC 5
Provisions 31. Other provisions IAS 37Contingent liabilities 38. Contingent liabilities IAS 37Financial instruments 16.
17.Financial assets and liabilities by categories and Financial assets and liabilities by fair value hierarchy
IAS 32, IAS 39, IFRS 7
Liquid funds 25. Liquid funds IAS 7Borrowings 28. Interest-bearing liabilities IAS 39
1.6 New accounting principles1.6.1 New IFRS standards adopted from 1 Jan 2015Fortum has adopted the following new or amended standards on 1 January 2015:
Standard Nature of change Impact Date of adoptionIFRIC 21 Levies New interpretation. The interpretation
provides guidance on when to recognise a liability to pay a levy.
The interpretation does not have a material impact on Fortum’s financial statements.
1 January 2015
Narrow-scope yearly amendments
The amendments primarily remove inconsistencies, provide additional guidance and clarify wording of standards. There are separate transitional provisions for each standard.
The amendments do not have a material impact on Fortum’s financial statements.
1 January 2015

12345678910111213141516171819202122232425262728293031323334353637383940414243
2 Critical accounting estimates and judgementsThe preparation of IFRS consolidated financial statements requires management to make estimates and assumptions that affect the reported amounts of assets and liabilities, the disclosure of contingent assets and liabilities existing at the balance sheet date as well as the reported amounts of revenues and expenses during the reporting period.
Estimates and judgements are continually evaluated and are based on historical experience and other factors, including expectations of future events that are believed to be reasonable under the circumstances. Actual results and timing may differ from these estimates.
In 2015 Fortum has estimated the impact of the early closure of nuclear power plant units 1 and 2 in Fortum's associated company OKG Aktiebolag (OKG) located in Oskarshamn, Sweden. The closing process will take several years and Fortum will monitor the impacts. Further information of Fortum's estimated impact of the early closure of Oskarshamn nuclear power plant units, see Note 7 Effects from early closure of nuclear units in Sweden.
The table below is listing the areas where management's accounting estimates and judgements are most critical to reported results and financial position. The table is also showing where to find more information about above mentioned estimates and judgements.
Critical accounting estimates NoteAssigned values and useful lifes determined for intangible assets and property, plant and equipment acquired in a business combination
18. Intangible assets
Assumptions related to impairment testing of property, plant and equipment and intangible assets
19. Property, plant and equipment
Judgement used when assessing the nature of Fortum's interest in its investees and when considering the classification of Fortum's joint arrangements
20. Participations in associated companies and joint ventures
Assumptions and estimates regarding future tax consequences 29. 39.
Deferred income taxesLegal actions and official proceedings
Assumptions made to determine long-term cash flow forecasts of estimated costs for provision related to nuclear production
30. Nuclear related assets and liabilities
Assumptions made when estimating provisions 31. Other provisionsAssumptions used to determine future pension obligations 32. Pension obligations
3 Financial risk managementRisk management objectives, principles and framework including governance, organisation and processes as well as description of risks i.e. strategic, financial and operational risks are described in the Operating and financial review (OFR).
See also Risk management.
3.1 Commodity market risksCommodity market risk refers to the potential negative effects of market price movements or volume changes in electricity, fuels and environmental values. A number of different methods, such as Profit-at-Risk and Value-at-Risk, are used throughout Fortum to quantify these risks taking into account their interdependencies. Stress-testing is carried out in order to assess the effects of extreme price movements on Fortum’s earnings.
Fortum hedges its exposure to commodity market risks in accordance with annually approved Hedging Guidelines. Risk taking is limited by risk mandates, including volumetric limits, Profit-at-Risk limits and stop-loss limits. The Profit at-Risk measure is monitored quarterly by management.
3.2 Electricity price and volume riskElectricity price risk is hedged by entering into electricity derivatives contracts, primarily on the Nordic power exchange, Nasdaq Commodities. The main objective of hedging is to reduce the effect of electricity price volatility on earnings. Hedging strategies cover several years in the short to medium term and are executed within approved mandates. These hedging strategies are continuously evaluated as electricity and other commodity market prices, the hydrological balance and other relevant parameters change.
In Russia, electricity prices and capacity sales are the main sources of market risk. Market deregulation has developed as planned and the electricity price is highly correlated with the gas price. Hedges are mainly done through regulated bilateral agreements.
Fortum's sensitivity to electricity market price is dependent on the hedge level for a given time period. As per 31 December 2015, approximately 50% of the Power Segment's estimated Nordic power sales volume was hedged for the calendar year 2016 and approximately 20% for the calendar year 2017. Assuming no changes in generation volumes, hedge ratios or cost structure a 1 EUR/MWh change in the market price of electricity would affect Fortum's 2016 comparable operating profit by approximately EUR 23 million and for 2017 by approximately EUR 36 million. The volume used in this sensitivity analysis is 45 TWh which includes the electricity generation sold to the spot market in Sweden and Finland in the Power Segment without minority owner's shares of electricity or other pass-through sales, and excluding the volume of Fortum's coal-condensing generation. This volume is heavily dependent on price level, the hydrological situation, the length of annual maintenance periods and availability of power plants. Sensitivity is calculated only for electricity market price movements. Hydrological conditions, temperature, CO2 allowance prices, fuel prices and the import/export situation all affect the electricity price on short-term basis and effects of individual factors cannot be separated.
Basis of preparation Risks Income statement Balance sheet Off balance sheet items Group structure and related parties
Proposal for the distribution of earnings Auditor’s reportPrimary statements Quarterly financial informationParent company financial statements Investor informationOperating and financial review Key figuresNotes
35

12345678910111213141516171819202122232425262728293031323334353637383940414243
3.2.1 Sensitivity arising from financial instruments according to IFRS 7Sensitivity analysis shows the sensitivity arising from financial electricity derivatives as defined in IFRS 7. These derivatives are used for hedging purposes within Fortum. Sensitivities are calculated based on 31 December 2015 (31 December 2014) position. Positions are actively managed in the day-to-day business operations and therefore the sensitivities vary from time to time. Sensitivity analysis includes only the market risks arising from derivatives i.e. the underlying physical electricity sales and purchase are not included. Sensitivity is calculated with the assumption that electricity forward quotations in NASDAQ OMX Commodities Europe and in EEX would change 1 EUR/MWh for the period Fortum has derivatives.
Sensitivity according to IFRS 7+/- 1 EUR/MWh change in electricity forward quotations, EUR million Effect 2015 2014Effect on Profit before income tax -/+ 5 7Effect on Equity -/+ 28 13
3.2.2 Electricity derivativesThe tables below disclose the Group's electricity derivatives used mainly for hedging electricity price risk. The fair values represent the values disclosed in the balance sheet.
See also Note 16 Financial assets and liabilities by categories for accounting principles and basis for fair value estimations and Note 8 Fair value changes of derivatives and underlying items in income statement.
Electricity derivatives by instrument 2015Volume, TWh Fair value, EUR million
Under 1 year
1–5 years
Over 5 years Total Positive Negative Net
Electricity derivatives 77 57 0 134 583 502 82Total 77 57 0 134 583 502 82Netting against electricity exchanges 1) -292 -292 0Total 291 209 82
Electricity derivatives by instrument 2014Volume, TWh Fair value, EUR million
Under 1 year
1–5 years
Over 5 years Total Positive Negative Net
Electricity derivatives 75 33 1 109 304 219 85Total 75 33 1 109 304 219 85Netting against electricity exchanges 1) -139 -139 0Total 164 80 85
1) Receivables and liabilities against electricity exchanges arising from standard derivative contracts with same delivery period are netted.
Maturity analysis of commodity derivatives
Amounts in the table are fair values.
2015 2014
EUR millionUnder 1
year1–5
yearsOver 5 years Total
Under 1 year
1–5 years
Over 5 years Total
Electricity derivatives assets 156 133 2 291 114 49 1 164Electricity derivatives liabilities 83 124 3 209 28 51 1 80Other commodity derivatives, assets 16 5 0 22 12 3 15Other commodity derivatives, liabilities 12 6 0 18 4 3 7
3.3 Fuel price and volume risksExposure to fuel prices is limited to some extent due to Fortum's flexible generation capacity, which allows for switching between different fuels according to prevailing market conditions. In some cases, the fuel price risk can be transferred to the customer. The remaining exposure to fuel price risk is mitigated through fixed price purchases that cover forecasted consumption levels. Fixed price purchases can be either for physical deliveries or in the form of financial hedges, such as oil and coal derivatives included in the table above as part of "Other commodity derivatives".
3.4 Emission allowance price and volume riskPart of Fortum's power and heat generation is subject to requirements of emission trading schemes. Fortum manages its exposure to these prices and volumes through the use of CO2 forwards and by ensuring that the costs of allowances are taken into account during production planning. Most of these CO2 forwards are own use contracts valued at cost and some are treated as derivatives in the accounts included in the table above as part of "Other commodity derivatives".
3.5 Liquidity and refinancing riskFortum's business is capital intensive and the Group has a diversified loan portfolio mainly consisting of long-term financing denominated in EUR and SEK. Long-term financing is primarily raised by issuing bonds under Fortum’s Euro Medium Term Note programme as well as through bilateral and syndicated loan facilities from a variety of different financial institutions.
Financing is primarily raised on parent company level and distributed internally through various internal financing arrangements. For example Fortum’s Russian operations are mainly financed via intra group internal long term RUB denominated loans. The internal RUB loan receivables are hedged via external forward contracts offsetting the currency exposure for the internal lender. On 31 December 2015, 97% (2014: 96%) of the Group’s total external financing was raised by the parent company Fortum Oyj.
On 31 December 2015, the total interest-bearing debt was EUR 6,007 million (2014: 6,983) and the interest-bearing net debt was EUR -2,195 million (2014: 4,217).
Fortum manages liquidity and refinancing risks through a combination of cash positions and committed credit facility agreements with its core banks. The Group shall at all times have access to cash, marketable securities and unused committed credit facilities including overdrafts, to cover all loans maturing within the
Basis of preparation Risks Income statement Balance sheet Off balance sheet items Group structure and related parties
Proposal for the distribution of earnings Auditor’s reportPrimary statements Quarterly financial informationParent company financial statements Investor informationOperating and financial review Key figuresNotes
36

12345678910111213141516171819202122232425262728293031323334353637383940414243
next twelve-month period. However, cash/marketable securities and unused committed credit facilities shall always amount to at least EUR 500 million.
On 31 December 2015, loan maturities for the coming twelve-month period amounted to EUR 1,042 million (2014: 1,103). Liquid funds amounted to EUR 8,202 million (2014: 2,766) and the total amount of committed credit facilities amounted to EUR 2,215 million (2014: 2,214) of which EUR 2,215 million (2014: 2,214) was undrawn.
Maturity of interest-bearing liabilitiesEUR million 20152016 1,0422017 5132018 6022019 8042020 702021 and later 2,976Total 6,007
Liquid funds, major credit lines and debt programmes 2015
EUR million Total facilityDrawn
amountAvailable
amountLiquid fundsCash and cash equivalents 3,289Bank deposits over 3 months 4,913Total 8,202
of which in Russia (OAO Fortum) 76Committed credit linesEUR 2,000 million syndicated credit facility 2,000 - 2,000Bilateral overdraft facilities 215 - 215Total 2,215 - 2,215Debt programmes (uncommitted)Fortum Corporation, CP programme EUR 500 million 500 - 500Fortum Corporation, CP programme SEK 5,000 million 544 - 544Fortum Corporation, EMTN programme EUR 8,000 million 8,000 4,094 3,906Total 9,044 4,094 4,950
Loan maturities per loan type, EUR million1,500
1,000
500
02016 2017 2018 2019 2020 2021 2022 2023 2024 2025 2026+
Bonds Other long-term debt Financial institutions Other short-term debt
Liquid funds, major credit lines and debt programmes 2014
EUR million Total facilityDrawn
amountAvailable
amountLiquid fundsCash and cash equivalents 2,009Bank deposits over 3 months 757Total 2,766
of which in Russia (OAO Fortum) 134Committed credit linesEUR 2,000 million syndicated credit facility 2,000 - 2,000Bilateral overdraft facilities 214 - 214Total 2,214 - 2,214Debt programmes (uncommitted)Fortum Corporation, CP programme EUR 500 million 500 - 500Fortum Corporation, CP programme SEK 5,000 million 532 - 532Fortum Corporation, EMTN programme EUR 8,000 million 8,000 4,748 3,252Total 9,032 4,748 4,284
Liquid funds amounted to EUR 8,202 million (2014: 2,766), including OAO Fortum's bank deposits amounting to EUR 72 million (2014: 131). Of these deposits at year-end 2015 EUR 15 million (2014: 30) were in euros and EUR million 57 (2014: 101) in Russian roubles.
See also Note 25 Liquid funds.
Basis of preparation Risks Income statement Balance sheet Off balance sheet items Group structure and related parties
Proposal for the distribution of earnings Auditor’s reportPrimary statements Quarterly financial informationParent company financial statements Investor informationOperating and financial review Key figuresNotes
37

12345678910111213141516171819202122232425262728293031323334353637383940414243
2015 2014
EUR millionUnder 1 year
1–5 years
Over 5 years Total
Under 1 year
1–5 years
Over 5 years Total
Interest-bearing liabilities 1,208 2,412 3,168 6,788 1,295 3,370 3,265 7,930Interest rate and currency derivatives liabilities 2,879 1,286 66 4,231 5,955 1,650 100 7,705Interest rate and currency derivatives receivables -3,026 -1,438 -80 -4,544 -6,228 -1,890 -134 -8,252Total 1,061 2,260 3,154 6,475 1,022 3,130 3,231 7,383
Interest-bearing liabilities include loans from the State Nuclear Waste Management Fund and Teollisuuden Voima Oyj of EUR 1,074 million (2014: 1,040). These loans are renewed yearly and the related interest payments are calculated for ten years in the table above. These loans are renewed yearly and the related interest payments are calculated for ten years in the table above.
For further information regarding loans from the State Nuclear Waste Management Fund and Teollisuuden Voima Oyj, see Note 30 Nuclear related assets and liabilities.
3.6 Interest rate risk and currency risk
3.6.1 Interest rate riskThe Treasury risk policy stipulated in 2015 that the average duration of the debt portfolio shall always be kept within a range of 12 and 36 months and that the flow risk i.e. changes in interest rates shall not affect the net interest payments of the Group by more than EUR 50 million for the next rolling 12-month period. Within these mandates, strategies are evaluated and developed in order to find an optimal balance between risk and financing cost.
On 31 December 2015, the average duration of the debt portfolio (including derivatives) was 2.0 years (2014: 2.3). Approximately 54% (2014: 46%) of the debt portfolio was on a floating rate basis or fixed rate loans maturing within the next 12 month period. The effect of one percentage point change in interest rates on the present value of the debt portfolio was EUR 117 million on 31 December 2015 (2014: 151). The flow risk, measured as the difference between the base case net interest cost estimate and the worst case scenario estimate for Fortum's debt portfolio for the coming 12 months, was EUR 6 million (2014: 23).
The average interest rate for the portfolio consisting mainly of EUR and SEK loans was 2.6% at the balance sheet date (2014: 2.9%). Part of the external loans EUR 641 million (2014: 681) have been swapped to RUB and the average interest cost for these loans, including cost for hedging the RUB, was 12.8% at the balance sheet date (2014: 11.3%).The average interest rate on loans and derivatives on 31 December 2015 was 3.7% (2014: 3.7%). Average cumulative interest rate on loans and derivatives for 2015 was 3.9% (2014: 4.0%).
The average interest rate on investments excl. Russian deposits on 31 December 2015 was 0.1% (2014: 0.2%). Liquid funds held by OAO Fortum amounted to EUR 76 million (Dec 31 2014: 134) and the average interest rate for this portfolio was 5.9% at the balance sheet date.
3.6.2 Currency riskFortum's policy is to hedge major transaction exposures to avoid exchange differences in the profit and loss statement. These exposures are mainly hedged with forward contracts.
Translation exposures in the Fortum Group are generally not hedged as the majority of these assets are considered to be long-term strategic holdings. In Fortum this means largely entities operating in Sweden, Russia, Norway and Poland, whose base currency is not euro.
The currency risk relating to transaction exposures is measured using Value-at-Risk (VaR) for a one-day period at 95% confidence level. Translation exposures relating to net investments in foreign entities are measured using a five day period at 95% confidence level. The limit for transaction exposure is VaR EUR 5 million. On 31 December 2015 the open transaction and translation exposures were EUR 0 million (2014: 0) and EUR 7 292 million (2014: 4,310) respectively. The VaR for the transaction exposure was EUR 0 million (2014: 0) and VaR for the translation exposure was EUR 130 million (2014: 246).
Group Treasury’s transaction exposure 2015 2014
EUR million Net position Hedge Open Net position Hedge OpenSEK 81 -81 0 4,821 -4,821 0USD -36 36 0 -12 12 0NOK -71 71 0 -75 75 0RUB 477 -477 0 483 -483 0PLN 165 -165 0 88 -88 0Other -19 19 0 -10 10 0Total 597 -597 0 5,295 -5,295 0
In addition OAO Fortum is hedging its euro investments with euro deposits EUR 15 million (2014: 30), which qualifies as a cash flow hedge in Fortum group accounts.
Transaction exposure is defined as already contracted or forecasted foreign exchange dependent items and cash flows. Transaction exposure is divided into balance sheet exposure and cash flow exposure. Balance sheet exposure reflects currency denominated assets and liabilities for example loans, deposits and accounts receivable/payable in currencies other than the company’s base currency. Cash flow exposure reflects future forecasted or contracted currency flows in foreign currency deriving from business activities such as sales, purchases or investments. Net conversion differences from transaction exposure are entered under financial income or expense when related to financial items or when related to accounts receivable/payable entered under items included in operating profit. Conversion differences related to qualifying cash flow hedges are deferred to equity.
Fortum's policy is to hedge balance sheet exposures in order to avoid exchange rate differences in the income statement. The Group's balance sheet exposure mainly relates to financing of non-euro subsidiaries and the fact that the Group's main external financing currency is EUR. For derivatives hedging this balance exposure Fortum does not apply hedge accounting, because they have a natural hedge in the income statement.
Contracted cash flow exposures shall be hedged to reduce volatility in future cash flows. These hedges normally consist of currency derivative contracts, which are matched against the underlying
Maturity analysis of interest-bearing liabilities and derivativesAmounts disclosed below are non-discounted expected cash flows (future interest payments and amortisations) of interest-bearing liabilities and interest rate and currency derivatives.
Basis of preparation Risks Income statement Balance sheet Off balance sheet items Group structure and related parties
Proposal for the distribution of earnings Auditor’s reportPrimary statements Quarterly financial informationParent company financial statements Investor informationOperating and financial review Key figuresNotes
38
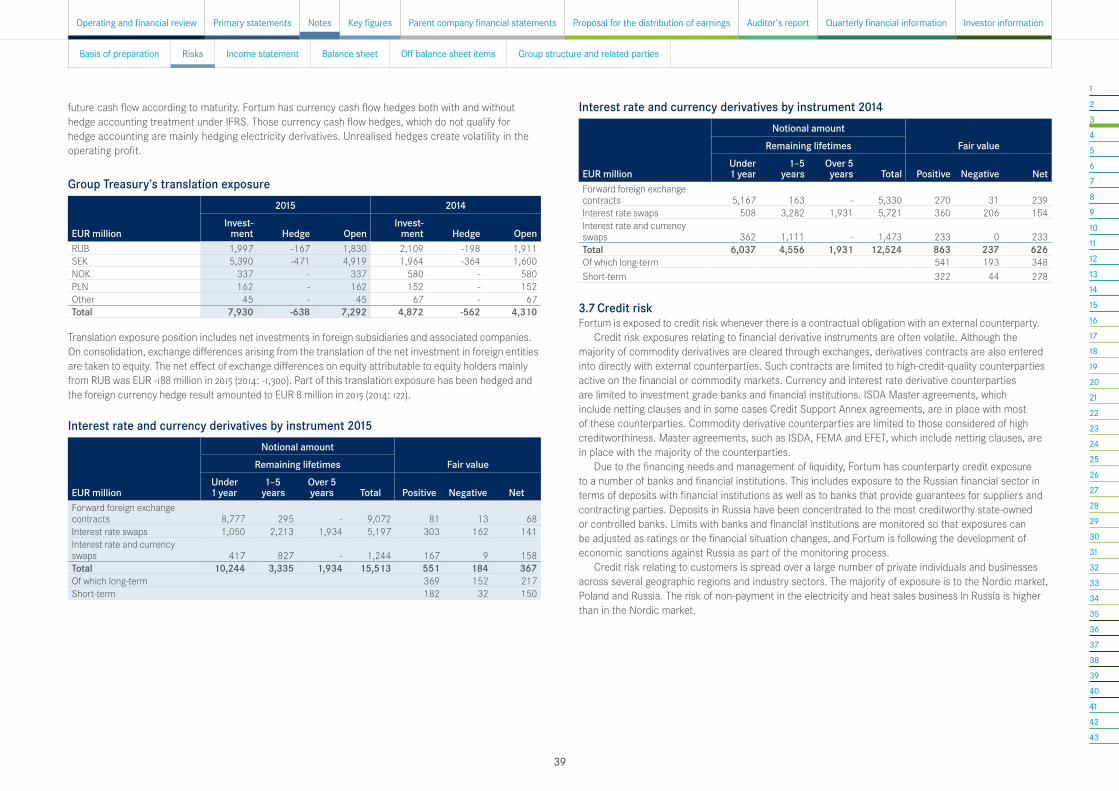
12345678910111213141516171819202122232425262728293031323334353637383940414243
future cash flow according to maturity. Fortum has currency cash flow hedges both with and without hedge accounting treatment under IFRS. Those currency cash flow hedges, which do not qualify for hedge accounting are mainly hedging electricity derivatives. Unrealised hedges create volatility in the operating profit.
Group Treasury’s translation exposure 2015 2014
EUR millionInvest-
ment Hedge OpenInvest-
ment Hedge OpenRUB 1,997 -167 1,830 2,109 -198 1,911SEK 5,390 -471 4,919 1,964 -364 1,600NOK 337 - 337 580 - 580PLN 162 - 162 152 - 152Other 45 - 45 67 - 67Total 7,930 -638 7,292 4,872 -562 4,310
Translation exposure position includes net investments in foreign subsidiaries and associated companies. On consolidation, exchange differences arising from the translation of the net investment in foreign entities are taken to equity. The net effect of exchange differences on equity attributable to equity holders mainly from RUB was EUR -188 million in 2015 (2014: -1,300). Part of this translation exposure has been hedged and the foreign currency hedge result amounted to EUR 8 million in 2015 (2014: 122).
Interest rate and currency derivatives by instrument 2015Notional amount
Fair valueRemaining lifetimes
EUR millionUnder 1 year
1–5 years
Over 5 years Total Positive Negative Net
Forward foreign exchange contracts 8,777 295 - 9,072 81 13 68Interest rate swaps 1,050 2,213 1,934 5,197 303 162 141Interest rate and currency swaps 417 827 - 1,244 167 9 158Total 10,244 3,335 1,934 15,513 551 184 367Of which long-term 369 152 217Short-term 182 32 150
Interest rate and currency derivatives by instrument 2014Notional amount
Fair valueRemaining lifetimes
EUR millionUnder 1 year
1–5 years
Over 5 years Total Positive Negative Net
Forward foreign exchange contracts 5,167 163 - 5,330 270 31 239Interest rate swaps 508 3,282 1,931 5,721 360 206 154Interest rate and currency swaps 362 1,111 - 1,473 233 0 233Total 6,037 4,556 1,931 12,524 863 237 626Of which long-term 541 193 348Short-term 322 44 278
3.7 Credit riskFortum is exposed to credit risk whenever there is a contractual obligation with an external counterparty.
Credit risk exposures relating to financial derivative instruments are often volatile. Although the majority of commodity derivatives are cleared through exchanges, derivatives contracts are also entered into directly with external counterparties. Such contracts are limited to high-credit-quality counterparties active on the financial or commodity markets. Currency and interest rate derivative counterparties are limited to investment grade banks and financial institutions. ISDA Master agreements, which include netting clauses and in some cases Credit Support Annex agreements, are in place with most of these counterparties. Commodity derivative counterparties are limited to those considered of high creditworthiness. Master agreements, such as ISDA, FEMA and EFET, which include netting clauses, are in place with the majority of the counterparties.
Due to the financing needs and management of liquidity, Fortum has counterparty credit exposure to a number of banks and financial institutions. This includes exposure to the Russian financial sector in terms of deposits with financial institutions as well as to banks that provide guarantees for suppliers and contracting parties. Deposits in Russia have been concentrated to the most creditworthy state-owned or controlled banks. Limits with banks and financial institutions are monitored so that exposures can be adjusted as ratings or the financial situation changes, and Fortum is following the development of economic sanctions against Russia as part of the monitoring process.
Credit risk relating to customers is spread over a large number of private individuals and businesses across several geographic regions and industry sectors. The majority of exposure is to the Nordic market, Poland and Russia. The risk of non-payment in the electricity and heat sales business in Russia is higher than in the Nordic market.
Basis of preparation Risks Income statement Balance sheet Off balance sheet items Group structure and related parties
Proposal for the distribution of earnings Auditor’s reportPrimary statements Quarterly financial informationParent company financial statements Investor informationOperating and financial review Key figuresNotes
39

12345678910111213141516171819202122232425262728293031323334353637383940414243
Investment grade receivables consist of deposits, commercial papers and Treasury bank accounts EUR 7,521 million (2014: 2,636), fair values of interest rate and currency derivatives EUR 549 million (2014: 859) and fair values of electricity, coal, oil and CO2 emission allowance derivatives EUR 17 million (2014: 10). Electricity exchange receivable is the fair value of derivatives on NASDAQ OMX Commodities Europe. Associated company and joint venture receivables consist of loan receivables EUR 773 million (2014: 2,041), fair values of interest rate and currency derivatives EUR 1 million (2014: 4) and fair values of electricity, coal, oil and CO2 emission allowance derivatives EUR 38 million (2014: 16). Other receivables consist of investments in commercial papers EUR 563 million (2014: 0), Russian deposits with non-investment grade banks EUR 65 million (2014: 63), loan and other interest bearing receivables EUR 1 million (2014: 4) and fair values of electricity, coal, oil, and CO2 emission allowance derivatives EUR 205 million (2014: 78).
The following tables indicate how bank deposits, commercial papers and fair values of derivatives are distributed by rating class.
Deposits and SecuritiesEUR million 2015 2014Counterparties with external credit rating from Standard & Poor’s and/or Moody’s Investment grade ratingsAAA - -AA+/AA/AA- 1,201 632A+/A/A- 4,820 1,923BBB+/BBB/BBB- 1,501 81Total investment grade ratings 7,521 2,636
EUR million 2015 2014BB+/BB/BB- 92 63B+/B/B- - -Below B- - -Non-investment grade ratings 92 63Counterparties without external credit rating from Standard & Poor’s and/or Moody’s - -Government or municipality 34 -Fortum Rating 5 - Lowest Risk 301 -Fortum Rating 4 - Low Risk 114 -Fortum Rating 3 - Normal Risk 83 -Fortum Rating 2 - High Risk - -Fortum Rating 1 - Highest Risk - -No rating 4 -Total non-rated counterparties 536 -
Total 8,149 2,699
In addition, cash in other bank accounts totalled EUR 53 million on 31 December 2015 (2014: 67).
Interest rate and currency derivatives2015 2014
EUR million ReceivablesNetted
amount 1) ReceivablesNetted
amount 1)Counterparties with external credit rating from Standard & Poor’s and/or Moody’s Investment grade ratingsAAA - - - -AA+/AA/AA- 66 21 147 88A+/A/A- 353 133 712 274BBB+/BBB/BBB- 131 28 - -Total investment grade ratings 549 182 859 362Total associated companies and joint ventures 1 1 4 4Counterparties without external credit rating from Standard & Poor’s and/or Moody’s - - - -Total 551 183 863 366
1) The netted amount includes the cash received in accordance with Credit Support Annex agreements EUR 202 million (2014: 286).
3.7.1 Credit quality of major financial assetsAmounts disclosed below are presented by counterparties for interest-bearing receivables including finance lease receivables, bank deposits and derivative financial instruments recognised as assets.
2015 2014
EUR millionCarrying amount
of which past due
Carrying amount
of which past due
Investment grade receivables 8,087 - 3,505 -Electricity exchanges 52 - 75 -Associated companies and joint ventures 812 - 2,061 -Other 834 - 145 -Total 9,785 - 5,786 -
Basis of preparation Risks Income statement Balance sheet Off balance sheet items Group structure and related parties
Proposal for the distribution of earnings Auditor’s reportPrimary statements Quarterly financial informationParent company financial statements Investor informationOperating and financial review Key figuresNotes
40
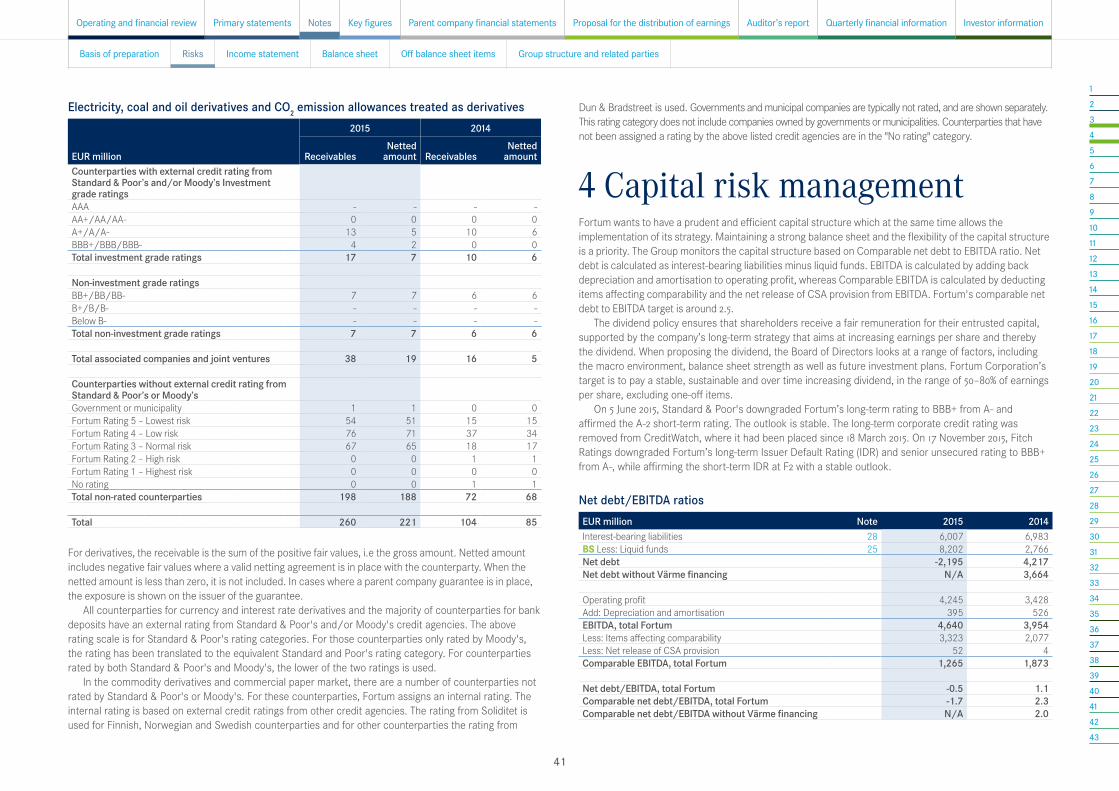
12345678910111213141516171819202122232425262728293031323334353637383940414243
Electricity, coal and oil derivatives and CO2 emission allowances treated as derivatives2015 2014
EUR million ReceivablesNetted
amount ReceivablesNetted
amountCounterparties with external credit rating from Standard & Poor’s and/or Moody’s Investment grade ratingsAAA - - - -AA+/AA/AA- 0 0 0 0A+/A/A- 13 5 10 6BBB+/BBB/BBB- 4 2 0 0Total investment grade ratings 17 7 10 6 Non-investment grade ratingsBB+/BB/BB- 7 7 6 6B+/B/B- - - - -Below B- - - - -Total non-investment grade ratings 7 7 6 6 Total associated companies and joint ventures 38 19 16 5 Counterparties without external credit rating from Standard & Poor’s or Moody’s Government or municipality 1 1 0 0Fortum Rating 5 – Lowest risk 54 51 15 15Fortum Rating 4 – Low risk 76 71 37 34Fortum Rating 3 – Normal risk 67 65 18 17Fortum Rating 2 – High risk 0 0 1 1Fortum Rating 1 – Highest risk 0 0 0 0No rating 0 0 1 1Total non-rated counterparties 198 188 72 68 Total 260 221 104 85
For derivatives, the receivable is the sum of the positive fair values, i.e the gross amount. Netted amount includes negative fair values where a valid netting agreement is in place with the counterparty. When the netted amount is less than zero, it is not included. In cases where a parent company guarantee is in place, the exposure is shown on the issuer of the guarantee.
All counterparties for currency and interest rate derivatives and the majority of counterparties for bank deposits have an external rating from Standard & Poor's and/or Moody's credit agencies. The above rating scale is for Standard & Poor's rating categories. For those counterparties only rated by Moody's, the rating has been translated to the equivalent Standard and Poor's rating category. For counterparties rated by both Standard & Poor's and Moody's, the lower of the two ratings is used.
In the commodity derivatives and commercial paper market, there are a number of counterparties not rated by Standard & Poor's or Moody's. For these counterparties, Fortum assigns an internal rating. The internal rating is based on external credit ratings from other credit agencies. The rating from Soliditet is used for Finnish, Norwegian and Swedish counterparties and for other counterparties the rating from
4 Capital risk managementFortum wants to have a prudent and efficient capital structure which at the same time allows the implementation of its strategy. Maintaining a strong balance sheet and the flexibility of the capital structure is a priority. The Group monitors the capital structure based on Comparable net debt to EBITDA ratio. Net debt is calculated as interest-bearing liabilities minus liquid funds. EBITDA is calculated by adding back depreciation and amortisation to operating profit, whereas Comparable EBITDA is calculated by deducting items affecting comparability and the net release of CSA provision from EBITDA. Fortum's comparable net debt to EBITDA target is around 2.5.
The dividend policy ensures that shareholders receive a fair remuneration for their entrusted capital, supported by the company’s long-term strategy that aims at increasing earnings per share and thereby the dividend. When proposing the dividend, the Board of Directors looks at a range of factors, including the macro environment, balance sheet strength as well as future investment plans. Fortum Corporation’s target is to pay a stable, sustainable and over time increasing dividend, in the range of 50–80% of earnings per share, excluding one-off items.
On 5 June 2015, Standard & Poor's downgraded Fortum’s long-term rating to BBB+ from A- and affirmed the A-2 short-term rating. The outlook is stable. The long-term corporate credit rating was removed from CreditWatch, where it had been placed since 18 March 2015. On 17 November 2015, Fitch Ratings downgraded Fortum’s long-term Issuer Default Rating (IDR) and senior unsecured rating to BBB+ from A-, while affirming the short-term IDR at F2 with a stable outlook.
Net debt/EBITDA ratios EUR million Note 2015 2014Interest-bearing liabilities 28 6,007 6,983BS Less: Liquid funds 25 8,202 2,766Net debt -2,195 4,217Net debt without Värme financing N/A 3,664 Operating profit 4,245 3,428Add: Depreciation and amortisation 395 526EBITDA, total Fortum 4,640 3,954Less: Items affecting comparability 3,323 2,077Less: Net release of CSA provision 52 4Comparable EBITDA, total Fortum 1,265 1,873 Net debt/EBITDA, total Fortum -0.5 1.1Comparable net debt/EBITDA, total Fortum -1.7 2.3Comparable net debt/EBITDA without Värme financing N/A 2.0
Dun & Bradstreet is used. Governments and municipal companies are typically not rated, and are shown separately. This rating category does not include companies owned by governments or municipalities. Counterparties that have not been assigned a rating by the above listed credit agencies are in the "No rating" category.
Basis of preparation Risks Income statement Balance sheet Off balance sheet items Group structure and related parties
Proposal for the distribution of earnings Auditor’s reportPrimary statements Quarterly financial informationParent company financial statements Investor informationOperating and financial review Key figuresNotes
41

12345678910111213141516171819202122232425262728293031323334353637383940414243
5 Segment reportingAccounting policies
Revenue recognitionRevenue comprises the fair value consideration received or receivable at the time of delivery of products and/or upon fulfilment of services. Revenue is shown net of rebates, discounts, value-added tax and selective taxes such as electricity tax. Revenue is recognised as follows:
Sale of electricity, heat, cooling and distribution of electricitySale of electricity, heat, cooling and distribution of electricity is recognised at the time of delivery. The sale to industrial and commercial customers and to end-customers is recognised based on the value of the volume supplied, including an estimated value of the volume supplied to customers between the date of their last meter reading and year-end.
The prices charged of customers for the distribution of electricity as well as the sale and distribution of heat are regulated in some areas. The regulatory mechanism differs from country to country. Any over or under income decided by the regulatory body is regarded as regulatory assets or liabilities that do not qualify for balance sheet recognition due to the fact that no contract defining the regulatory aspect has been entered into with a specific customer and thus the receivable is contingent on future delivery. The over or under income is normally credited or charged over a number of years in the future to the customer using the electricity connection at that time. No retroactive credit or charge can be made.
Physical energy sales and purchase contracts are accounted for on accrual basis based expected purchase, sale and usage requirements.
The Distribution segment is presented as discontinued operations in these financial statements. Revenues for discontinued operations include the distribution of electricity until divestment of the operations. The Swedish operations are included until end of May 2015, Norwegian operations until end of May 2014 and Finnish operations until end of March 2014. See further information in Note 14 Discontinued operations.
Connection feesFees paid by the customer when connected to the electricity, gas, heat or cooling network are recognised as income to the extent that the fee does not cover future commitments. If the connection fee is linked to the contractual agreement with the customer, the income is recognised over the period of the agreement with the customer.
Fees paid by the customer when connected to district heating network in Finland were refundable until 2013. These connection fees have not been recognised in the income statement and are included in other liabilities in the balance sheet.
Contract revenueContract revenue is recognised under the percentage of completion method to determine the appropriate amount to recognise as revenue and expenses in a given period. The stage of completion is measured by reference to the contract costs incurred up to the closing date as a percentage of total estimated costs for each contract.
Netting and inter-segment transactionsPower and Technology segment sells its production to Nord Pool and Electricity Sales buys its electricity from Nord Pool Spot. Eliminations of sales include eliminations of sales and purchases with Nord Pool Spot that are netted on group level on an hourly basis and posted either as revenue or cost depending on if Fortum is a net seller or net buyer during any particular hour. Inter-segment sales, expenses and results for the different business segments are affected by intra-group deliveries, which are eliminated on consolidation. Inter-segment transactions are based on commercial terms.
Below is the description of the reportable segments:
Power and Technology Russia
Divi
sion
sRe
port
ing
segm
ents Hydro Power and Technology
Division and Nuclear and Thermal Power Division are both part of the Power and Technology reporting segment. The two Divisions are responsible for Fortum’s hydro, nuclear and thermal power generation, portfolio management and trading as well as technology and R&D functions.
Heat, Electricity Sales and Solutions consists of Fortum’s combined heat and power (CHP) production, district heating and business to business heating solutions, solar business, electricity sales and related customer offering as well as Corporate Sustainability. It also includes Fortum’s 50% holding in Fortum Värme, which is correspondingly accounted for as a joint venture using the equity method.
Russia Segment consists of power and heat generation as well as heat distribution in Russia. It also includes Fortum’s 29% holding in TGC-1, which is correspondingly accounted for as an associated company using the equity method.
On 1 June 2015, Fortum completed the divestment of its Swedish electricity distribution business. Upon the closing of the transaction, Fortum completed the divestment process of its distribution businesses in Sweden, Norway and Finland. The Distribution segment has been presented as discontinued operations in the financial reporting since the first quarter 2015.
Hydro Power and Technology / Nuclear and Thermal Power
Heat, Electricity Sales and Solutions
Russia
Heat, Electricity Sales and Solutions
Group
Discontinued Operations (Distribution)
Basis of preparation Risks Income statement Balance sheet Off balance sheet items Group structure and related parties
Proposal for the distribution of earnings Auditor’s reportPrimary statements Quarterly financial informationParent company financial statements Investor informationOperating and financial review Key figuresNotes
42
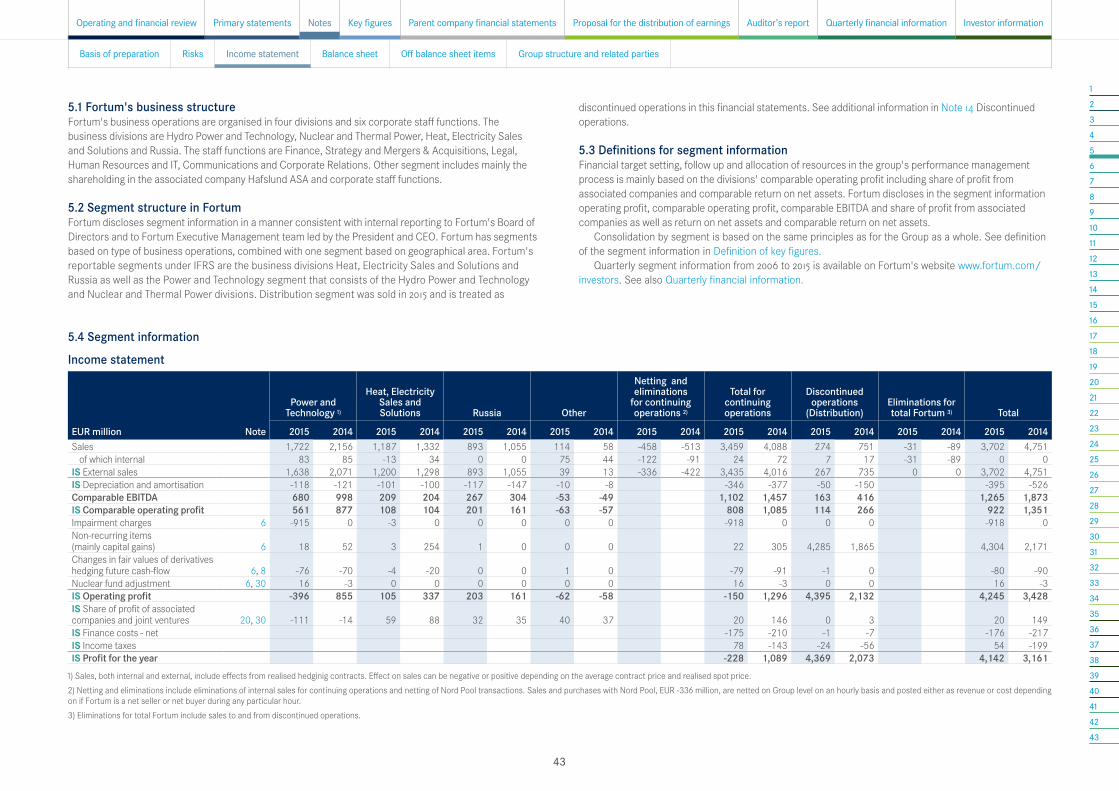
12345678910111213141516171819202122232425262728293031323334353637383940414243
5.1 Fortum's business structureFortum's business operations are organised in four divisions and six corporate staff functions. The business divisions are Hydro Power and Technology, Nuclear and Thermal Power, Heat, Electricity Sales and Solutions and Russia. The staff functions are Finance, Strategy and Mergers & Acquisitions, Legal, Human Resources and IT, Communications and Corporate Relations. Other segment includes mainly the shareholding in the associated company Hafslund ASA and corporate staff functions.
5.2 Segment structure in FortumFortum discloses segment information in a manner consistent with internal reporting to Fortum's Board of Directors and to Fortum Executive Management team led by the President and CEO. Fortum has segments based on type of business operations, combined with one segment based on geographical area. Fortum's reportable segments under IFRS are the business divisions Heat, Electricity Sales and Solutions and Russia as well as the Power and Technology segment that consists of the Hydro Power and Technology and Nuclear and Thermal Power divisions. Distribution segment was sold in 2015 and is treated as
5.4 Segment information
Income statement
Power and Technology 1)
Heat, Electricity Sales and Solutions Russia Other
Netting and eliminations
for continuing operations 2)
Total for continuing operations
Discontinued operations
(Distribution)Eliminations for total Fortum 3) Total
EUR million Note 2015 2014 2015 2014 2015 2014 2015 2014 2015 2014 2015 2014 2015 2014 2015 2014 2015 2014Sales 1,722 2,156 1,187 1,332 893 1,055 114 58 -458 -513 3,459 4,088 274 751 -31 -89 3,702 4,751
of which internal 83 85 -13 34 0 0 75 44 -122 -91 24 72 7 17 -31 -89 0 0IS External sales 1,638 2,071 1,200 1,298 893 1,055 39 13 -336 -422 3,435 4,016 267 735 0 0 3,702 4,751IS Depreciation and amortisation -118 -121 -101 -100 -117 -147 -10 -8 -346 -377 -50 -150 -395 -526Comparable EBITDA 680 998 209 204 267 304 -53 -49 1,102 1,457 163 416 1,265 1,873IS Comparable operating profit 561 877 108 104 201 161 -63 -57 808 1,085 114 266 922 1,351Impairment charges 6 -915 0 -3 0 0 0 0 0 -918 0 0 0 -918 0Non-recurring items (mainly capital gains) 6 18 52 3 254 1 0 0 0 22 305 4,285 1,865 4,304 2,171Changes in fair values of derivatives hedging future cash-flow 6, 8 -76 -70 -4 -20 0 0 1 0 -79 -91 -1 0 -80 -90Nuclear fund adjustment 6, 30 16 -3 0 0 0 0 0 0 16 -3 0 0 16 -3IS Operating profit -396 855 105 337 203 161 -62 -58 -150 1,296 4,395 2,132 4,245 3,428IS Share of profit of associated companies and joint ventures 20, 30 -111 -14 59 88 32 35 40 37 20 146 0 3 20 149IS Finance costs - net -175 -210 -1 -7 -176 -217IS Income taxes 78 -143 -24 -56 54 -199IS Profit for the year -228 1,089 4,369 2,073 4,142 3,161
1) Sales, both internal and external, include effects from realised hedginig contracts. Effect on sales can be negative or positive depending on the average contract price and realised spot price. 2) Netting and eliminations include eliminations of internal sales for continuing operations and netting of Nord Pool transactions. Sales and purchases with Nord Pool, EUR -336 million, are netted on Group level on an hourly basis and posted either as revenue or cost depending on if Fortum is a net seller or net buyer during any particular hour.3) Eliminations for total Fortum include sales to and from discontinued operations.
discontinued operations in this financial statements. See additional information in Note 14 Discontinued operations.
5.3 Definitions for segment informationFinancial target setting, follow up and allocation of resources in the group's performance management process is mainly based on the divisions' comparable operating profit including share of profit from associated companies and comparable return on net assets. Fortum discloses in the segment information operating profit, comparable operating profit, comparable EBITDA and share of profit from associated companies as well as return on net assets and comparable return on net assets.
Consolidation by segment is based on the same principles as for the Group as a whole. See definition of the segment information in Definition of key figures.
Quarterly segment information from 2006 to 2015 is available on Fortum's website www.fortum.com/investors. See also Quarterly financial information.
Basis of preparation Risks Income statement Balance sheet Off balance sheet items Group structure and related parties
Proposal for the distribution of earnings Auditor’s reportPrimary statements Quarterly financial informationParent company financial statements Investor informationOperating and financial review Key figuresNotes
43
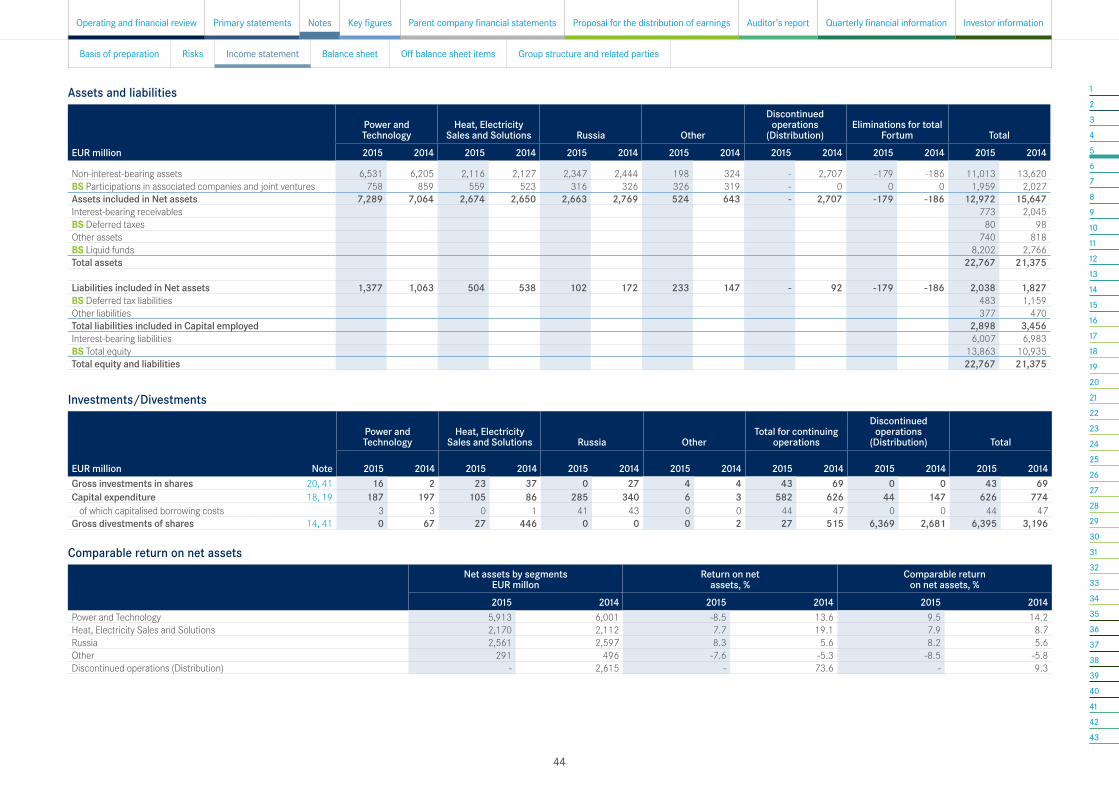
12345678910111213141516171819202122232425262728293031323334353637383940414243
Assets and liabilities
Power and Technology
Heat, Electricity Sales and Solutions Russia Other
Discontinued operations
(Distribution)Eliminations for total
Fortum TotalEUR million 2015 2014 2015 2014 2015 2014 2015 2014 2015 2014 2015 2014 2015 2014
Non-interest-bearing assets 6,531 6,205 2,116 2,127 2,347 2,444 198 324 - 2,707 -179 -186 11,013 13,620BS Participations in associated companies and joint ventures 758 859 559 523 316 326 326 319 - 0 0 0 1,959 2,027Assets included in Net assets 7,289 7,064 2,674 2,650 2,663 2,769 524 643 - 2,707 -179 -186 12,972 15,647Interest-bearing receivables 773 2,045BS Deferred taxes 80 98Other assets 740 818BS Liquid funds 8,202 2,766Total assets 22,767 21,375
Liabilities included in Net assets 1,377 1,063 504 538 102 172 233 147 - 92 -179 -186 2,038 1,827BS Deferred tax liabilities 483 1,159Other liabilities 377 470Total liabilities included in Capital employed 2,898 3,456Interest-bearing liabilities 6,007 6,983BS Total equity 13,863 10,935Total equity and liabilities 22,767 21,375
Investments/Divestments
Power and Technology
Heat, Electricity Sales and Solutions Russia Other
Total for continuing operations
Discontinued operations
(Distribution) Total
EUR million Note 2015 2014 2015 2014 2015 2014 2015 2014 2015 2014 2015 2014 2015 2014 Gross investments in shares 20, 41 16 2 23 37 0 27 4 4 43 69 0 0 43 69Capital expenditure 18, 19 187 197 105 86 285 340 6 3 582 626 44 147 626 774
of which capitalised borrowing costs 3 3 0 1 41 43 0 0 44 47 0 0 44 47Gross divestments of shares 14, 41 0 67 27 446 0 0 0 2 27 515 6,369 2,681 6,395 3,196
Comparable return on net assetsNet assets by segments
EUR millonReturn on net
assets, %Comparable return
on net assets, %2015 2014 2015 2014 2015 2014
Power and Technology 5,913 6,001 -8.5 13.6 9.5 14.2Heat, Electricity Sales and Solutions 2,170 2,112 7.7 19.1 7.9 8.7Russia 2,561 2,597 8.3 5.6 8.2 5.6Other 291 496 -7.6 -5.3 -8.5 -5.8Discontinued operations (Distribution) - 2,615 - 73.6 - 9.3
Basis of preparation Risks Income statement Balance sheet Off balance sheet items Group structure and related parties
Proposal for the distribution of earnings Auditor’s reportPrimary statements Quarterly financial informationParent company financial statements Investor informationOperating and financial review Key figuresNotes
44
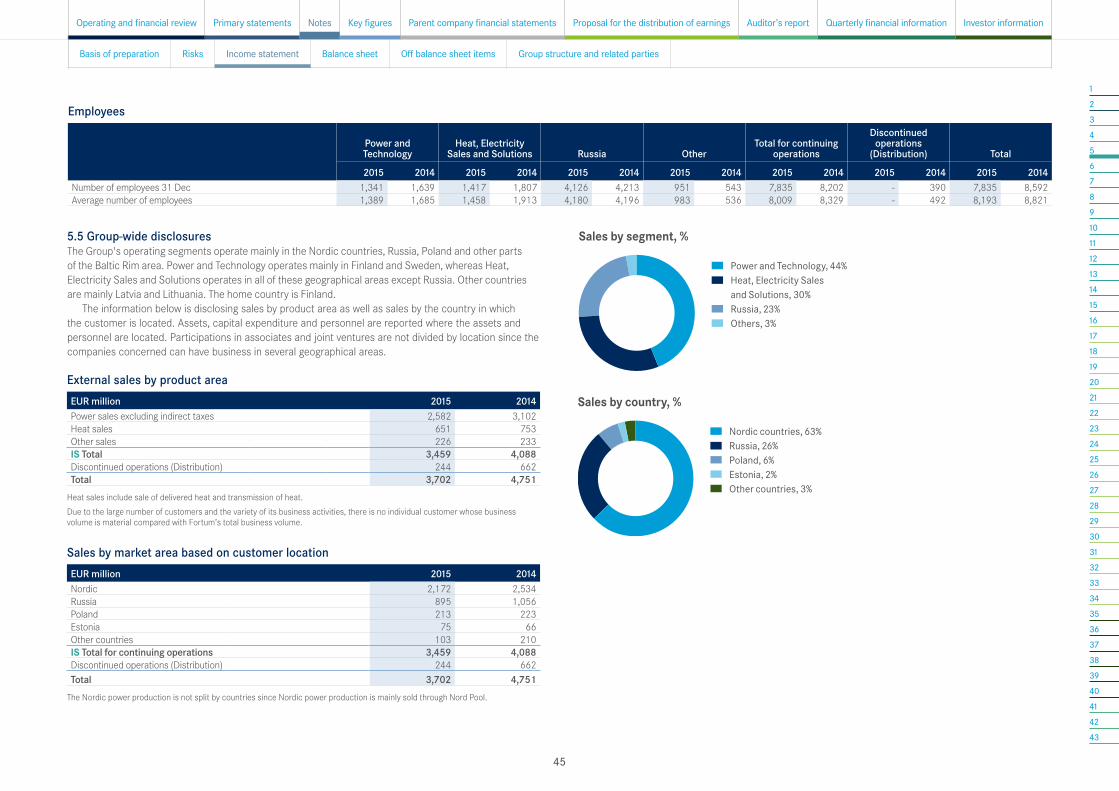
12345678910111213141516171819202122232425262728293031323334353637383940414243
Employees
Power and Technology
Heat, Electricity Sales and Solutions Russia Other
Total for continuing operations
Discontinued operations
(Distribution) Total
2015 2014 2015 2014 2015 2014 2015 2014 2015 2014 2015 2014 2015 2014Number of employees 31 Dec 1,341 1,639 1,417 1,807 4,126 4,213 951 543 7,835 8,202 - 390 7,835 8,592Average number of employees 1,389 1,685 1,458 1,913 4,180 4,196 983 536 8,009 8,329 - 492 8,193 8,821
5.5 Group-wide disclosuresThe Group's operating segments operate mainly in the Nordic countries, Russia, Poland and other parts of the Baltic Rim area. Power and Technology operates mainly in Finland and Sweden, whereas Heat, Electricity Sales and Solutions operates in all of these geographical areas except Russia. Other countries are mainly Latvia and Lithuania. The home country is Finland.
The information below is disclosing sales by product area as well as sales by the country in which the customer is located. Assets, capital expenditure and personnel are reported where the assets and personnel are located. Participations in associates and joint ventures are not divided by location since the companies concerned can have business in several geographical areas.
Sales by segment, %
Power and Technology, 44% Heat, Electricity Sales
and Solutions, 30% Russia, 23% Others, 3%
Sales by country, %
Nordic countries, 63% Russia, 26% Poland, 6% Estonia, 2% Other countries, 3%
External sales by product areaEUR million 2015 2014 Power sales excluding indirect taxes 2,582 3,102Heat sales 651 753Other sales 226 233IS Total 3,459 4,088Discontinued operations (Distribution) 244 662Total 3,702 4,751
Heat sales include sale of delivered heat and transmission of heat.Due to the large number of customers and the variety of its business activities, there is no individual customer whose business volume is material compared with Fortum’s total business volume.
Sales by market area based on customer locationEUR million 2015 2014 Nordic 2,172 2,534Russia 895 1,056Poland 213 223Estonia 75 66Other countries 103 210IS Total for continuing operations 3,459 4,088Discontinued operations (Distribution) 244 662Total 3,702 4,751
The Nordic power production is not split by countries since Nordic power production is mainly sold through Nord Pool.
Basis of preparation Risks Income statement Balance sheet Off balance sheet items Group structure and related parties
Proposal for the distribution of earnings Auditor’s reportPrimary statements Quarterly financial informationParent company financial statements Investor informationOperating and financial review Key figuresNotes
45

12345678910111213141516171819202122232425262728293031323334353637383940414243
Capital expenditure by locationEUR million 2015 2014 Finland 156 152Sweden 87 91Russia 285 340Poland 37 16Estonia 11 8Other countries 7 19Total for continuing operations 582 626Discontinued operations (Distribution) 44 147Total 626 774
Segment assets by locationEUR million 2015 2014Finland 3,413 3,417Sweden 4,568 7,005Russia 2,347 2,444Poland 350 342Estonia 196 199Other countries 319 400Eliminations -179 -186Non-interest bearing assets 11,013 13,620BS Participations in associates and joint ventures 1,959 2,027Total 12,972 15,647
Number of employees on 31 December by location 2015 2014
Finland 1,959 2,040Sweden 618 811Russia 4,126 4,213Poland 586 603Estonia 214 206Other countries 332 329Total for continuing operations 7,835 8,202Discontinued operations (Distribution) - 390Total 7,835 8,592
Basis of preparation Risks Income statement Balance sheet Off balance sheet items Group structure and related parties
Proposal for the distribution of earnings Auditor’s reportPrimary statements Quarterly financial informationParent company financial statements Investor informationOperating and financial review Key figuresNotes
46

12345678910111213141516171819202122232425262728293031323334353637383940414243
6 Items affecting comparabilityEUR million 2015 2014Impairment charges -918 0Non-recurring items (mainly capital gains) 22 305Fair value changes on derivatives that do not qualify for hedge accounting -78 -91Nuclear fund adjustments 16 -3IS Total -958 211
Items affecting comparability are not included in Comparable operating profit. Comparable operating profit is presented to better reflect the Group's business performance when comparing results for the current period with previous periods. Items affecting comparability are disclosed separately in Fortum's income statement as it is deemed necessary for the purposes of understanding the financial performance when comparing the results.
Impairment charges and non-recurring itemsEUR million Segment Country 2015 2014 Impairment charges
Impact from early closure of units 1 and 2 in OKG AB Power and Technology Sweden -794Teollisuuden Voima Oyj’s decision to discontinue the Olkiluoto 4 project Power and Technology Finland -15Dismantling provision for the Finnish coal-fired power plant Inkoo and impairment loss for Fortum's share of the Finnish coal-fired power plant Meri-Pori and other related items Power and Technology Finland -106
Other impairment chargesHeat, Electricity Sales and Solutions -3
Total -918 0
Capital gains in non-recurring items
Heat business in NorwayHeat, Electricity Sales and Solutions Norway 52
Grangemouth CHP plant Power and Technology UK 40Natural gas company Gasum Oy, 31% ownership
Heat, Electricity Sales and Solutions Finland 190
Other non-recurring items 22 23Total 22 305
Fair value changes on derivativesChanges in the fair values of financial derivative instruments hedging future cash flows that do not qualify for hedge accounting are recognised in items affecting comparability. This is done to improve the understanding of the financial performance when comparing results from one period to another.
Nuclear waste management fund adjustmentNuclear fund adjustment includes effects from the accounting principle of Fortum's part of the State Nuclear Waste Management Fund where the assets in the balance sheet cannot exceed the nuclear related provisions according to IFRIC 5. As long as the Fund is overfunded from an IFRS perspective, the effects to the operating profit from this adjustment will be positive if the provisions increase more than the Fund and negative if actual value of the fund increases more than the provisions.
For more information regarding disposals of shares, see Note 41 Acquisitions and disposals.For more information regarding impact from early closure of units 1 and 2 in OKG AB, see Note 7
Effects from early closure of nuclear units in Sweden. For more information regarding fair value changes of derivatives, see Note 8 Fair value changes of
derivatives and underlying items in income statement.For more information regarding nuclear waste management, see Note 30 Nuclear related assets and
liabilities.
7 Effects from early closure of nuclear units in Sweden The financial impacts of the decision made in the Extraordinary shareholder's meeting on 14 October 2015 to close early units 1 and 2 in Oskarshamn are recognised as Impairment charges, included in Items affecting comparability. E.ON is the majority owner of OKG and E.ON did unilaterally decide on the closing of units. The closing process will take several years and Fortum will monitor the impacts.
OKG is a non profit making company and sells produced electricity at production costs to its owners in proportion to the ownership. OKG is funded entirely by its shareholders. Fortum's part of the funding is recognised as long-term interest bearing receivables, which are increased when OKG needs additional funds and decreased when OKG invoices Fortum for the produced electricity.
OKG's impairment charges in Fortum income statementEUR million 2015Comparable operating profit 0Items affecting comparability - Impairment charges -794Operating profit -794Share of profit/loss of associates and joint ventures -116Profit before income tax -910Income tax expenses 175Profit for the period from continuing operations -735Attributable to:
Owners of the parent -729Non-controlling interests -5
Basis of preparation Risks Income statement Balance sheet Off balance sheet items Group structure and related parties
Proposal for the distribution of earnings Auditor’s reportPrimary statements Quarterly financial informationParent company financial statements Investor informationOperating and financial review Key figuresNotes
47
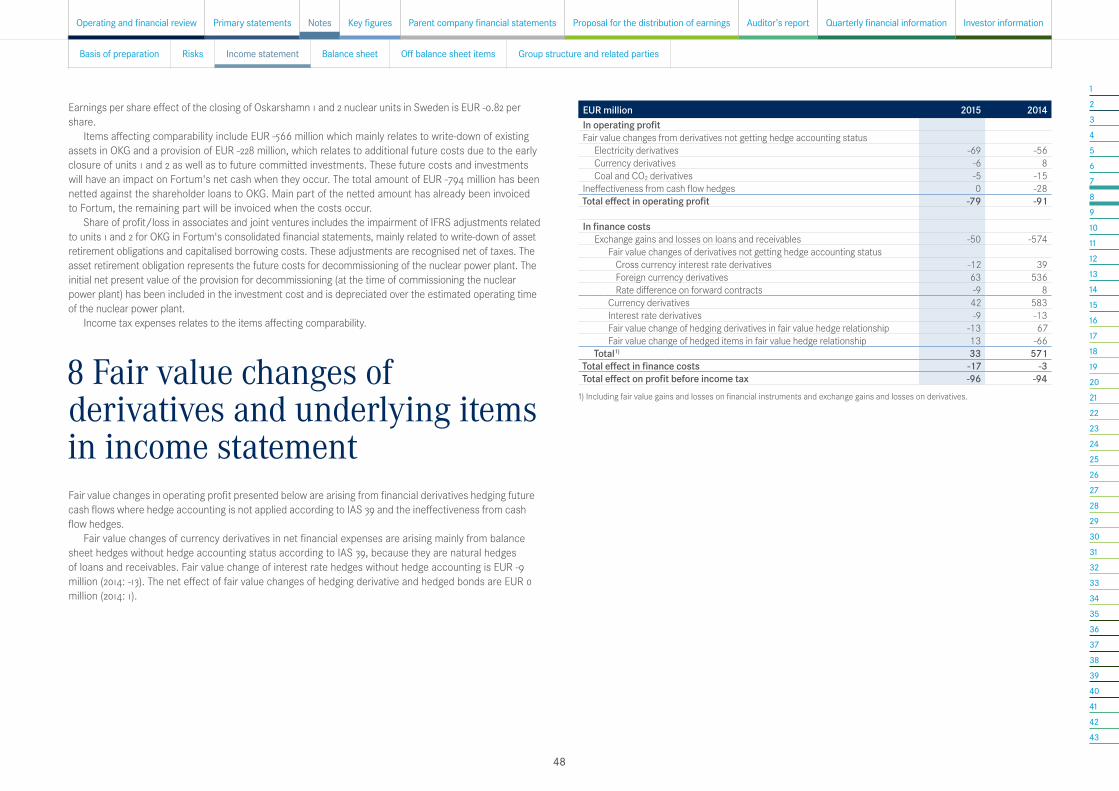
12345678910111213141516171819202122232425262728293031323334353637383940414243
Earnings per share effect of the closing of Oskarshamn 1 and 2 nuclear units in Sweden is EUR -0.82 per share.
Items affecting comparability include EUR -566 million which mainly relates to write-down of existing assets in OKG and a provision of EUR -228 million, which relates to additional future costs due to the early closure of units 1 and 2 as well as to future committed investments. These future costs and investments will have an impact on Fortum's net cash when they occur. The total amount of EUR -794 million has been netted against the shareholder loans to OKG. Main part of the netted amount has already been invoiced to Fortum, the remaining part will be invoiced when the costs occur.
Share of profit/loss in associates and joint ventures includes the impairment of IFRS adjustments related to units 1 and 2 for OKG in Fortum's consolidated financial statements, mainly related to write-down of asset retirement obligations and capitalised borrowing costs. These adjustments are recognised net of taxes. The asset retirement obligation represents the future costs for decommissioning of the nuclear power plant. The initial net present value of the provision for decommissioning (at the time of commissioning the nuclear power plant) has been included in the investment cost and is depreciated over the estimated operating time of the nuclear power plant.
Income tax expenses relates to the items affecting comparability.
8 Fair value changes of derivatives and underlying items in income statementFair value changes in operating profit presented below are arising from financial derivatives hedging future cash flows where hedge accounting is not applied according to IAS 39 and the ineffectiveness from cash flow hedges.
Fair value changes of currency derivatives in net financial expenses are arising mainly from balance sheet hedges without hedge accounting status according to IAS 39, because they are natural hedges of loans and receivables. Fair value change of interest rate hedges without hedge accounting is EUR -9 million (2014: -13). The net effect of fair value changes of hedging derivative and hedged bonds are EUR 0 million (2014: 1).
EUR million 2015 2014In operating profitFair value changes from derivatives not getting hedge accounting status
Electricity derivatives -69 -56Currency derivatives -6 8Coal and CO2 derivatives -5 -15
Ineffectiveness from cash flow hedges 0 -28Total effect in operating profit -79 -91 In finance costs
Exchange gains and losses on loans and receivables -50 -574Fair value changes of derivatives not getting hedge accounting status
Cross currency interest rate derivatives -12 39Foreign currency derivatives 63 536Rate difference on forward contracts -9 8
Currency derivatives 42 583Interest rate derivatives -9 -13Fair value change of hedging derivatives in fair value hedge relationship -13 67Fair value change of hedged items in fair value hedge relationship 13 -66
Total1) 33 571Total effect in finance costs -17 -3Total effect on profit before income tax -96 -94
1) Including fair value gains and losses on financial instruments and exchange gains and losses on derivatives.
Basis of preparation Risks Income statement Balance sheet Off balance sheet items Group structure and related parties
Proposal for the distribution of earnings Auditor’s reportPrimary statements Quarterly financial informationParent company financial statements Investor informationOperating and financial review Key figuresNotes
48

12345678910111213141516171819202122232425262728293031323334353637383940414243
9 Other income and other expenses
Accounting policies
Other incomeRevenue from activities outside normal operations is reported in other income. This includes recurring items such as rental income and non-recurring items such as insurance compensation.
Research and development costsResearch and development costs are recognised as expense as incurred and included in other expenses in the income statement. If development costs will generate future income, they are capitalised as intangible assets and depreciated over the period of the income streams.
EUR million 2015 2014Materials 958 1,225Materials purchased from associated companies and joint ventures 513 566Transmission costs 30 22External services 15 13IS Total 1,515 1,825
Materials consists mainly of coal, gas and nuclear fuels used for producing power and heat.Materials purchased from associated companies consist of nuclear and hydropower purchased at
production cost (including interest costs and production taxes) and purchased steam.Total materials and services include production taxes EUR 133 million (2014: 131), of which nuclear
related capacity and property taxes EUR 82 million (2014: 81) and hydro power related property taxes EUR 14 million (2014: 14). Taxes related to nuclear and hydro production include taxes paid through purchases from associated companies.
See Note 20 Participations in associated companies and joint ventures.
9.1 Other incomeEUR million 2015 2014Rental income 10 11Insurance compensation 1 5Other items 26 44IS Total 38 60
9.2 Other expensesEUR million 2015 2014Operation and maintenance costs 70 70Property taxes 150 158IT and telecommunication costs 54 57Other items 203 207IS Total 477 492
The major components recorded in other expenses are the external operation and maintenance costs of power and heat plants. Property taxes include property taxes relating to directly owned hydropower production EUR 126 million (2014: 132). Other items includes expenses relating to properties and other operative expenses.
Principal auditors feesEUR million 2015 2014Audit fees 1.3 1.3Audit related assignments 0.3 0.1Tax assignments 0.0 0.2Total 1.6 1.7
Deloitte & Touche Oy is the appointed auditor until the next Annual General Meeting, to be held in 2016. Audit fees include fees for the audit of the consolidated financial statements, review of the interim reports as well as the fees for the audit of Fortum Oyj and its subsidiaries. Audit related assignments include fees for assurance of sustainability reporting and other assurance and associated services related to the audit. Tax assignments include fees for tax advice services.
10 Materials and services
Basis of preparation Risks Income statement Balance sheet Off balance sheet items Group structure and related parties
Proposal for the distribution of earnings Auditor’s reportPrimary statements Quarterly financial informationParent company financial statements Investor informationOperating and financial review Key figuresNotes
49

12345678910111213141516171819202122232425262728293031323334353637383940414243
Share bonus programme
2015–2020 1 2 3 4 5 6
2010Plans 2011 2012 2013 2014 2015 2016 2017 2018 2019 2020
2010–2015
2011–2016
2012–2017
2013–2018
2014–2019
Earning period (year) Share deliveryShare releaseLock-up period (year)
1 2 3 4 5 6
1 2 3 4 5 6
1 2 3 4 5 6
1 2 3 4 5 6
1 2 3 4 5 6
11 Employee benefitsEUR million 2015 2014Wages and salaries 246 269Pensions
Defined contribution plans 25 29Defined benefit plans 5 7
Social security costs 42 44Share-based remuneration 1) 19 8Other employee costs 15 13IS Total 351 369
1) LTI costs in 2015 includes a one-time cost increase arising from shortening the accounting period over which the LTI costs are accrued. For more information see 11.2 Long-term incentives below.
The compensation package for Fortum employees consists of a combination of salaries, fringe benefits, short-term incentives, profit sharing paid to the Personnel Fund and share-based long-term incentives.
The remuneration policy is determined by the Board of Directors. Board of Directors' Nomination and Remuneration Committee discusses, assesses and makes recommendations and proposals to the Board of Directors on the remuneration policy, pay structures, bonus and incentive systems for the Group and its management, and contributes to the Group's nomination issues.
For further information on pensions see Note 32 Pension obligations.
11.1 Short term incentives Fortum's short-term incentive scheme, i.e. bonus system, supports the realisation of the Group's financial performance targets, sustainability targets, values and structural changes. The system ensures that the performance targets of individual employees align with the targets of the division and the Group. All Fortum employees are covered by the STI programme or a comparable local variable pay arrangement.
The criteria used in determining the size of the bonus for senior management (the President and CEO and other members of the Fortum Executive Management Team) are decided annually by the Board of Directors on the recommendation of the Board's Nomination and Remuneration Committee. The size of each senior executive's bonus is dependent on the Group's financial performance, as well as on their own success in reaching personal goals. The performance bonus criteria may also include indicators related to sustainability targets. The maximum bonus level for the senior management is 40% of the executive's annual salary including fringe benefits.
For executives with division responsibilities, the bonus system reflects the performance of their division together with the Group's financial performance. The criteria for evaluating an executive's personal performance are mutually agreed between the executive and his/her superior in an annual performance discussion at the beginning of each year. The performance of the President and CEO is evaluated annually by the Board of Directors.
11.2 Long-term incentivesFortum's share bonus system is a performance-based, long-term incentive (LTI) arrangement. A new share plan commences annually if the Board of Directors so decides. The potential reward is based on the performance of the Group and its divisions.
Each share plan begins with a three-year earning period during which participants may earn share rights if the earnings criteria set by the Board of Directors are fulfilled. The value of the share participation is defined after the three-year earning period when the participants are paid the earned rights in the form of shares. After the earning period, income tax and statutory employment related expenses are deducted from the reward and the net reward is used to acquire Fortum shares in the name of the participant. The maximum value of shares, before taxation, to be delivered to a participant after the earning period cannot exceed the participant’s annual salary.
The earning period is followed by a three-year lock-up period. During the lock-up period the shares may not be sold, transferred, pledged or disposed in any other way. Dividends and other financial returns paid on the shares during the lock-up period are, however, not subject to restrictions. From plan 2013-2018 onwards the lock-up period may be shortened to one year for the Fortum Executive Management Team members on individual basis if the value of the aggregate ownership of Fortum shares corresponds to a minimum of annual base salary. For other participants the lock-up period is changed into one year from plan 2013–2018 onwards. This means that the total LTI period is either four or six years, depending on the participant and his or her shareholding in Fortum. The shares are released from the lock-up after publishing of the Company's financial results for the last calendar year of the lock-up period, provided that the participant remains employed by the Group.
The share plans under the LTI arrangement are accounted for as partly cash- and partly equity-settled arrangements. The portion of the earned reward that the participants receive in shares is accounted for
Basis of preparation Risks Income statement Balance sheet Off balance sheet items Group structure and related parties
Proposal for the distribution of earnings Auditor’s reportPrimary statements Quarterly financial informationParent company financial statements Investor informationOperating and financial review Key figuresNotes
50
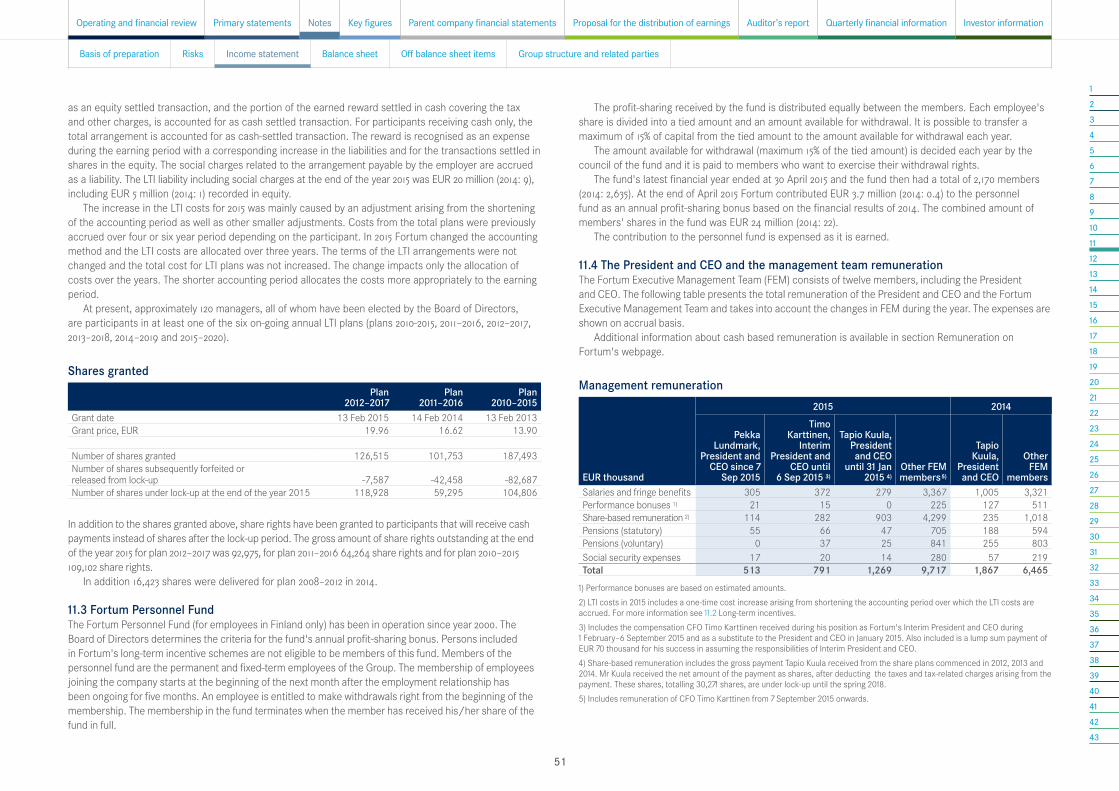
12345678910111213141516171819202122232425262728293031323334353637383940414243
The profit-sharing received by the fund is distributed equally between the members. Each employee's share is divided into a tied amount and an amount available for withdrawal. It is possible to transfer a maximum of 15% of capital from the tied amount to the amount available for withdrawal each year.
The amount available for withdrawal (maximum 15% of the tied amount) is decided each year by the council of the fund and it is paid to members who want to exercise their withdrawal rights.
The fund's latest financial year ended at 30 April 2015 and the fund then had a total of 2,170 members (2014: 2,635). At the end of April 2015 Fortum contributed EUR 3.7 million (2014: 0.4) to the personnel fund as an annual profit-sharing bonus based on the financial results of 2014. The combined amount of members' shares in the fund was EUR 24 million (2014: 22).
The contribution to the personnel fund is expensed as it is earned.
11.4 The President and CEO and the management team remunerationThe Fortum Executive Management Team (FEM) consists of twelve members, including the President and CEO. The following table presents the total remuneration of the President and CEO and the Fortum Executive Management Team and takes into account the changes in FEM during the year. The expenses are shown on accrual basis.
Additional information about cash based remuneration is available in section Remuneration on Fortum's webpage.
Management remuneration2015 2014
EUR thousand
Pekka Lundmark,
President and CEO since 7
Sep 2015
Timo Karttinen,
Interim President and
CEO until6 Sep 2015 3)
Tapio Kuula, President and CEO
until 31 Jan 2015 4)
Other FEM members5)
Tapio Kuula,
President and CEO
Other FEM
membersSalaries and fringe benefits 305 372 279 3,367 1,005 3,321Performance bonuses 1) 21 15 0 225 127 511Share-based remuneration 2) 114 282 903 4,299 235 1,018Pensions (statutory) 55 66 47 705 188 594Pensions (voluntary) 0 37 25 841 255 803Social security expenses 17 20 14 280 57 219Total 513 791 1,269 9,717 1,867 6,465
1) Performance bonuses are based on estimated amounts.2) LTI costs in 2015 includes a one-time cost increase arising from shortening the accounting period over which the LTI costs are accrued. For more information see 11.2 Long-term incentives.3) Includes the compensation CFO Timo Karttinen received during his position as Fortum's Interim President and CEO during 1 February–6 September 2015 and as a substitute to the President and CEO in January 2015. Also included is a lump sum payment of EUR 70 thousand for his success in assuming the responsibilities of Interim President and CEO. 4) Share-based remuneration includes the gross payment Tapio Kuula received from the share plans commenced in 2012, 2013 and 2014. Mr Kuula received the net amount of the payment as shares, after deducting the taxes and tax-related charges arising from the payment. These shares, totalling 30,271 shares, are under lock-up until the spring 2018.5) Includes remuneration of CFO Timo Karttinen from 7 September 2015 onwards.
Shares grantedPlan
2012–2017Plan
2011–2016Plan
2010–2015Grant date 13 Feb 2015 14 Feb 2014 13 Feb 2013Grant price, EUR 19.96 16.62 13.90 Number of shares granted 126,515 101,753 187,493Number of shares subsequently forfeited or released from lock-up -7,587 -42,458 -82,687Number of shares under lock-up at the end of the year 2015 118,928 59,295 104,806
In addition to the shares granted above, share rights have been granted to participants that will receive cash payments instead of shares after the lock-up period. The gross amount of share rights outstanding at the end of the year 2015 for plan 2012–2017 was 92,975, for plan 2011–2016 64,264 share rights and for plan 2010–2015 109,102 share rights.
In addition 16,423 shares were delivered for plan 2008–2012 in 2014.
11.3 Fortum Personnel Fund The Fortum Personnel Fund (for employees in Finland only) has been in operation since year 2000. The Board of Directors determines the criteria for the fund's annual profit-sharing bonus. Persons included in Fortum's long-term incentive schemes are not eligible to be members of this fund. Members of the personnel fund are the permanent and fixed-term employees of the Group. The membership of employees joining the company starts at the beginning of the next month after the employment relationship has been ongoing for five months. An employee is entitled to make withdrawals right from the beginning of the membership. The membership in the fund terminates when the member has received his/her share of the fund in full.
as an equity settled transaction, and the portion of the earned reward settled in cash covering the tax and other charges, is accounted for as cash settled transaction. For participants receiving cash only, the total arrangement is accounted for as cash-settled transaction. The reward is recognised as an expense during the earning period with a corresponding increase in the liabilities and for the transactions settled in shares in the equity. The social charges related to the arrangement payable by the employer are accrued as a liability. The LTI liability including social charges at the end of the year 2015 was EUR 20 million (2014: 9), including EUR 5 million (2014: 1) recorded in equity.
The increase in the LTI costs for 2015 was mainly caused by an adjustment arising from the shortening of the accounting period as well as other smaller adjustments. Costs from the total plans were previously accrued over four or six year period depending on the participant. In 2015 Fortum changed the accounting method and the LTI costs are allocated over three years. The terms of the LTI arrangements were not changed and the total cost for LTI plans was not increased. The change impacts only the allocation of costs over the years. The shorter accounting period allocates the costs more appropriately to the earning period.
At present, approximately 120 managers, all of whom have been elected by the Board of Directors, are participants in at least one of the six on-going annual LTI plans (plans 2010-2015, 2011–2016, 2012–2017, 2013–2018, 2014–2019 and 2015–2020).
Basis of preparation Risks Income statement Balance sheet Off balance sheet items Group structure and related parties
Proposal for the distribution of earnings Auditor’s reportPrimary statements Quarterly financial informationParent company financial statements Investor informationOperating and financial review Key figuresNotes
51
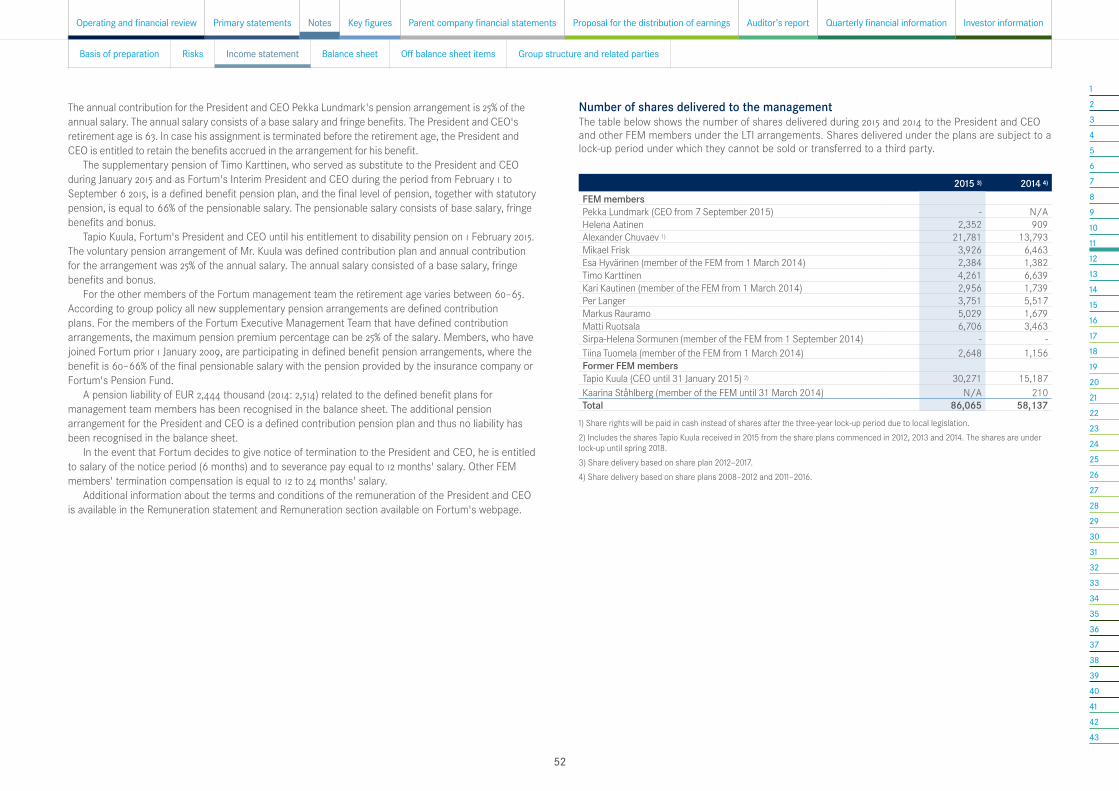
12345678910111213141516171819202122232425262728293031323334353637383940414243
The annual contribution for the President and CEO Pekka Lundmark's pension arrangement is 25% of the annual salary. The annual salary consists of a base salary and fringe benefits. The President and CEO's retirement age is 63. In case his assignment is terminated before the retirement age, the President and CEO is entitled to retain the benefits accrued in the arrangement for his benefit.
The supplementary pension of Timo Karttinen, who served as substitute to the President and CEO during January 2015 and as Fortum's Interim President and CEO during the period from February 1 to September 6 2015, is a defined benefit pension plan, and the final level of pension, together with statutory pension, is equal to 66% of the pensionable salary. The pensionable salary consists of base salary, fringe benefits and bonus.
Tapio Kuula, Fortum's President and CEO until his entitlement to disability pension on 1 February 2015. The voluntary pension arrangement of Mr. Kuula was defined contribution plan and annual contribution for the arrangement was 25% of the annual salary. The annual salary consisted of a base salary, fringe benefits and bonus.
For the other members of the Fortum management team the retirement age varies between 60–65. According to group policy all new supplementary pension arrangements are defined contribution plans. For the members of the Fortum Executive Management Team that have defined contribution arrangements, the maximum pension premium percentage can be 25% of the salary. Members, who have joined Fortum prior 1 January 2009, are participating in defined benefit pension arrangements, where the benefit is 60–66% of the final pensionable salary with the pension provided by the insurance company or Fortum's Pension Fund.
A pension liability of EUR 2,444 thousand (2014: 2,514) related to the defined benefit plans for management team members has been recognised in the balance sheet. The additional pension arrangement for the President and CEO is a defined contribution pension plan and thus no liability has been recognised in the balance sheet.
In the event that Fortum decides to give notice of termination to the President and CEO, he is entitled to salary of the notice period (6 months) and to severance pay equal to 12 months' salary. Other FEM members' termination compensation is equal to 12 to 24 months' salary.
Additional information about the terms and conditions of the remuneration of the President and CEO is available in the Remuneration statement and Remuneration section available on Fortum's webpage.
Number of shares delivered to the managementThe table below shows the number of shares delivered during 2015 and 2014 to the President and CEO and other FEM members under the LTI arrangements. Shares delivered under the plans are subject to a lock-up period under which they cannot be sold or transferred to a third party.
2015 3) 2014 4)
FEM membersPekka Lundmark (CEO from 7 September 2015) - N/AHelena Aatinen 2,352 909Alexander Chuvaev 1) 21,781 13,793Mikael Frisk 3,926 6,463Esa Hyvärinen (member of the FEM from 1 March 2014) 2,384 1,382Timo Karttinen 4,261 6,639Kari Kautinen (member of the FEM from 1 March 2014) 2,956 1,739Per Langer 3,751 5,517Markus Rauramo 5,029 1,679Matti Ruotsala 6,706 3,463Sirpa-Helena Sormunen (member of the FEM from 1 September 2014) - -Tiina Tuomela (member of the FEM from 1 March 2014) 2,648 1,156Former FEM membersTapio Kuula (CEO until 31 January 2015) 2) 30,271 15,187Kaarina Ståhlberg (member of the FEM until 31 March 2014) N/A 210Total 86,065 58,137
1) Share rights will be paid in cash instead of shares after the three-year lock-up period due to local legislation.2) Includes the shares Tapio Kuula received in 2015 from the share plans commenced in 2012, 2013 and 2014. The shares are under lock-up until spring 2018.3) Share delivery based on share plan 2012–2017.4) Share delivery based on share plans 2008–2012 and 2011–2016.
Basis of preparation Risks Income statement Balance sheet Off balance sheet items Group structure and related parties
Proposal for the distribution of earnings Auditor’s reportPrimary statements Quarterly financial informationParent company financial statements Investor informationOperating and financial review Key figuresNotes
52
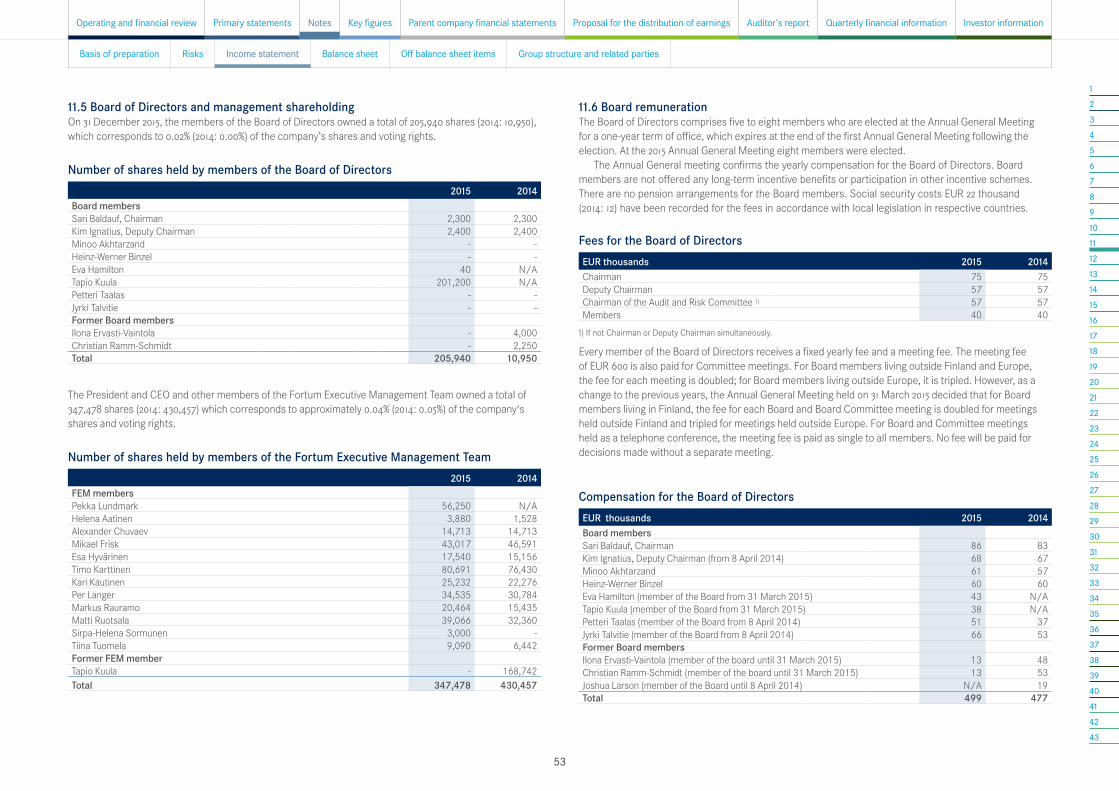
12345678910111213141516171819202122232425262728293031323334353637383940414243
11.6 Board remunerationThe Board of Directors comprises five to eight members who are elected at the Annual General Meeting for a one-year term of office, which expires at the end of the first Annual General Meeting following the election. At the 2015 Annual General Meeting eight members were elected.
The Annual General meeting confirms the yearly compensation for the Board of Directors. Board members are not offered any long-term incentive benefits or participation in other incentive schemes. There are no pension arrangements for the Board members. Social security costs EUR 22 thousand (2014: 12) have been recorded for the fees in accordance with local legislation in respective countries.
Fees for the Board of DirectorsEUR thousands 2015 2014Chairman 75 75Deputy Chairman 57 57Chairman of the Audit and Risk Committee 1) 57 57Members 40 40
1) If not Chairman or Deputy Chairman simultaneously.
Every member of the Board of Directors receives a fixed yearly fee and a meeting fee. The meeting fee of EUR 600 is also paid for Committee meetings. For Board members living outside Finland and Europe, the fee for each meeting is doubled; for Board members living outside Europe, it is tripled. However, as a change to the previous years, the Annual General Meeting held on 31 March 2015 decided that for Board members living in Finland, the fee for each Board and Board Committee meeting is doubled for meetings held outside Finland and tripled for meetings held outside Europe. For Board and Committee meetings held as a telephone conference, the meeting fee is paid as single to all members. No fee will be paid for decisions made without a separate meeting.
11.5 Board of Directors and management shareholdingOn 31 December 2015, the members of the Board of Directors owned a total of 205,940 shares (2014: 10,950), which corresponds to 0.02% (2014: 0.00%) of the company’s shares and voting rights.
Number of shares held by members of the Board of Directors2015 2014
Board membersSari Baldauf, Chairman 2,300 2,300Kim Ignatius, Deputy Chairman 2,400 2,400Minoo Akhtarzand - -Heinz-Werner Binzel - -Eva Hamilton 40 N/ATapio Kuula 201,200 N/APetteri Taalas - -Jyrki Talvitie - -Former Board membersIlona Ervasti-Vaintola - 4,000Christian Ramm-Schmidt - 2,250Total 205,940 10,950
The President and CEO and other members of the Fortum Executive Management Team owned a total of 347,478 shares (2014: 430,457) which corresponds to approximately 0.04% (2014: 0.05%) of the company's shares and voting rights.
Number of shares held by members of the Fortum Executive Management Team2015 2014
FEM membersPekka Lundmark 56,250 N/AHelena Aatinen 3,880 1,528Alexander Chuvaev 14,713 14,713Mikael Frisk 43,017 46,591Esa Hyvärinen 17,540 15,156Timo Karttinen 80,691 76,430Kari Kautinen 25,232 22,276Per Langer 34,535 30,784Markus Rauramo 20,464 15,435Matti Ruotsala 39,066 32,360Sirpa-Helena Sormunen 3,000 -Tiina Tuomela 9,090 6,442Former FEM memberTapio Kuula - 168,742Total 347,478 430,457
Compensation for the Board of Directors EUR thousands 2015 2014Board membersSari Baldauf, Chairman 86 83Kim Ignatius, Deputy Chairman (from 8 April 2014) 68 67Minoo Akhtarzand 61 57Heinz-Werner Binzel 60 60Eva Hamilton (member of the Board from 31 March 2015) 43 N/ATapio Kuula (member of the Board from 31 March 2015) 38 N/APetteri Taalas (member of the Board from 8 April 2014) 51 37Jyrki Talvitie (member of the Board from 8 April 2014) 66 53Former Board membersIlona Ervasti-Vaintola (member of the board until 31 March 2015) 13 48Christian Ramm-Schmidt (member of the board until 31 March 2015) 13 53Joshua Larson (member of the Board until 8 April 2014) N/A 19Total 499 477
Basis of preparation Risks Income statement Balance sheet Off balance sheet items Group structure and related parties
Proposal for the distribution of earnings Auditor’s reportPrimary statements Quarterly financial informationParent company financial statements Investor informationOperating and financial review Key figuresNotes
53

12345678910111213141516171819202122232425262728293031323334353637383940414243
12 Finance costs – netEUR million Note 2015 2014Interest expense
Borrowings -247 -296Other interest expense 0 0Capitalised borrowing costs 19 44 47
Total -203 -249 Interest income
Loan receivables and deposits 49 82Other interest income 2 2
Total 51 84 Fair value gains and losses on financial instruments 8
Fair value change of interest rate derivatives not getting hedge accounting status -9 -13Fair value change of hedging derivatives in fair value hedge relationship -13 67Fair value change of hedged items in fair value hedge relationship 13 -66Rate difference on forward contracts -9 8
Total -18 -5
Exchange gains and lossesLoans and receivables 8 -50 -574Cross currency interest rate derivatives 8 -12 39Foreign currency derivatives 8 63 536
Interest income on share of State Nuclear Waste Management Fund 30 10 11Unwinding of discount on nuclear provisions 30 -44 -43Unwinding of discount on other provisions 31, 32 -5 -7Other financial income 38 2Other financial expenses -5 -5Total -4 -40IS Finance costs - net -175 -210
Interest expenses include interest expenses on interest-bearing loans, interest on interest rate and currency swaps and forward points on forward foreign exchange contracts hedging loans and receivables.
Further information can be found in the Notes mentioned in the table.Interest income includes EUR 15 million (2014: 31) from shareholders' loans in Finnish and Swedish
nuclear companies, EUR 12 million (2014: 27) from Fortum Värme and EUR 20 million (2014: 19) from deposits and commercial papers.
Fair value gains and losses on financial instruments include change in clean price of interest rate and cross currency swaps not getting hedge accounting and fair value changes of interest rate derivatives in hedge relationship and hedged items. Accrued interest on these derivatives is entered in interest expenses of borrowings. Fair value gains and losses include also rate difference from forward contracts hedging loans and receivables without hedge accounting.
Exchange gains and losses includes exchange rate differences arising from valuation of foreign currency loans and receivables and exchange rate differences from forward foreign exchange contracts and interest rate and currency swaps.
Other financial income include compensation from early prepayment of loans by Fortum Värme EUR 37 million (2014: 0).
Fair value changes on interest rate and currency derivativesEUR million 2015 2014Interest rate and cross currency swapsInterest expenses on borrowings 4 6Exchange rate difference from derivatives -12 39Rate difference in fair value gains and losses on financial instruments 1) -22 54Total fair value change of interest rate derivatives in finance costs - net -30 99 Forward foreign exchange contractsInterest expenses on borrowings -79 -80Exchange rate difference from derivatives 63 536Rate difference in fair value gains and losses on financial instruments -9 8Total fair value change of currency derivatives in finance costs - net -25 464Total fair value change of interest and currency derivatives in finance costs - net -55 563
1) Fair value gains and losses on financial instruments include fair value changes from interest rate swaps not getting hedge accounting amounting to EUR -9 million (2014: -13) and fair value change of hedging derivatives in fair value hedge relationship EUR -13 million (2014: 67), totalling EUR -22 million (2014: 54).
Basis of preparation Risks Income statement Balance sheet Off balance sheet items Group structure and related parties
Proposal for the distribution of earnings Auditor’s reportPrimary statements Quarterly financial informationParent company financial statements Investor informationOperating and financial review Key figuresNotes
54

12345678910111213141516171819202122232425262728293031323334353637383940414243
13.3 Income tax rateThe table on the right explains the difference between the theoretical enacted tax rate in Finland compared to the tax rate in the consolidated income statement.
EUR million 2015 % 2014 %Profit before tax -305 1,232Tax calculated at nominal Finnish tax rate 61 20.0 -246 20.0Differences in tax rates and regulations 23 7.6 12 -0.9Income not subject to tax 1 0.2 0 0.0Tax exempt capital gains 2 0.7 64 -5.2Expenses not deductible for tax purposes -2 -0.6 -2 0.1Share of profit of associated companies and joint ventures 5 1.7 33 -2.7Taxes related to dividend distributions -7 -2.2 -3 0.3Changes in tax valuation allowance related to not recognised tax losses -1 -0.4 0 0.0Other items -1 -0.4 5 -0.4Adjustments recognised for taxes of prior periods -3 -1.1 -6 0.5IS Income tax expense 78 25.4 -143 11.6
Key tax indicators:• The weighted average applicable income tax rate for 2015 is 20.2% (2014: 21.0%) • The effective income tax rate in the income statement for 2015 is 25.4% (2014: 11.6%)• The comparable effective income tax rate (excluding the share of profits from associates and joint
ventures, tax exempt capital gains and tax rate changes) for 2015 is 23.5% (2014: 18.0%)• The total tax rate and comparable total tax rate (excluding the share of profits from associates and
joint ventures and tax exempt capital gains) for 2015 is not applicable (2014: 30.0% and 41.9%)
Taxes for the period are positive as the group is in loss position. This is mainly due to the write-down related to early closure of O1 and O2 units in Oskarshamn in Sweden. Deferred tax asset is recognized on this loss. Deferred tax asset can be used against future profits.
When the pre-tax profit is close to null or negative, the total tax rate is not illustrating the tax contribution in an informative way. Therefore we use "not applicable" for total tax rate in 2015.
Effective income tax rate and total tax rate are impacted by gains or losses on sale of shares. In many countries like in Finland, Sweden and Netherlands income on capital gains and losses is treated as tax exempt. The purpose of this is to tax the operative income of the company and avoid taxing the same income twice in case of the sale of the shares. Taxation of capital gains or losses is in line with the taxation of dividend income.
Fortum has a material deferred tax liability owing to its investments in non current assets. These assets are depreciated more rapidly for tax than for accounting purposes resulting in lower current tax payments at the start of an asset's lifetime and higher tax payments at the end of its lifetime. This difference results in a deferred tax liability.
During 2015 Swedish entities released major part of the deferred tax liability related to property, plant and equipment. Together with increase in deferred tax asset related to taxable loss in Sweden the change in deferred tax is positive.
13 Income tax expense13.1 Profit before taxEUR million 2015 2014Finnish companies 154 546Swedish companies -922 56Russian companies 173 152Other companies 291 477IS Total -305 1,232
13.2 Major components of income tax expense by major countriesEUR million 2015 2014Current taxesFinnish companies -64 -82Swedish companies 0 -9Russian companies -3 -3Other companies -38 -43Total -106 -138Deferred taxesFinnish companies 35 15Swedish companies 193 24Russian companies -30 -25Other companies -15 -9Total 184 6Adjustments recognised for current tax of prior periodsFinnish companies -2 -6Swedish companies 1 0Russian companies 0 1Other companies 0 -5Total -1 -11IS Income tax expense 78 -143
Basis of preparation Risks Income statement Balance sheet Off balance sheet items Group structure and related parties
Proposal for the distribution of earnings Auditor’s reportPrimary statements Quarterly financial informationParent company financial statements Investor informationOperating and financial review Key figuresNotes
55
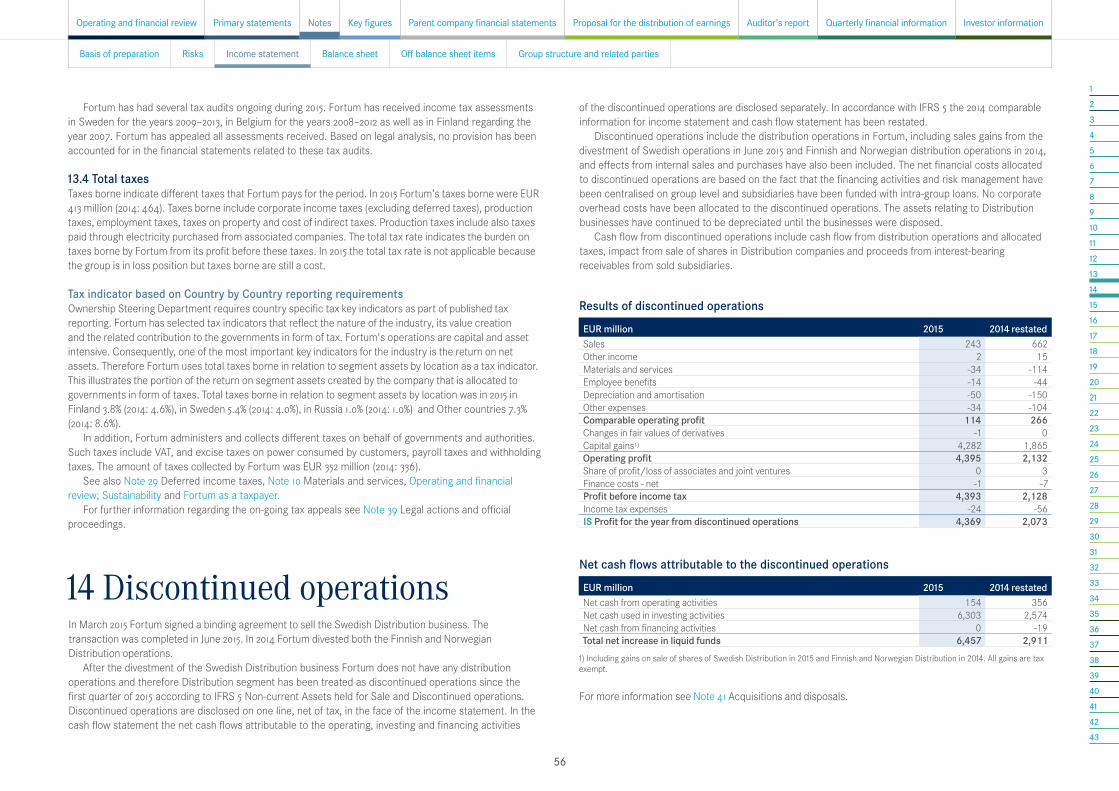
12345678910111213141516171819202122232425262728293031323334353637383940414243
13.4 Total taxesTaxes borne indicate different taxes that Fortum pays for the period. In 2015 Fortum’s taxes borne were EUR 413 million (2014: 464). Taxes borne include corporate income taxes (excluding deferred taxes), production taxes, employment taxes, taxes on property and cost of indirect taxes. Production taxes include also taxes paid through electricity purchased from associated companies. The total tax rate indicates the burden on taxes borne by Fortum from its profit before these taxes. In 2015 the total tax rate is not applicable because the group is in loss position but taxes borne are still a cost.
Tax indicator based on Country by Country reporting requirementsOwnership Steering Department requires country specific tax key indicators as part of published tax reporting. Fortum has selected tax indicators that reflect the nature of the industry, its value creation and the related contribution to the governments in form of tax. Fortum's operations are capital and asset intensive. Consequently, one of the most important key indicators for the industry is the return on net assets. Therefore Fortum uses total taxes borne in relation to segment assets by location as a tax indicator. This illustrates the portion of the return on segment assets created by the company that is allocated to governments in form of taxes. Total taxes borne in relation to segment assets by location was in 2015 in Finland 3.8% (2014: 4.6%), in Sweden 5.4% (2014: 4.0%), in Russia 1.0% (2014: 1.0%) and Other countries 7.3% (2014: 8.6%).
In addition, Fortum administers and collects different taxes on behalf of governments and authorities. Such taxes include VAT, and excise taxes on power consumed by customers, payroll taxes and withholding taxes. The amount of taxes collected by Fortum was EUR 352 million (2014: 336).
See also Note 29 Deferred income taxes, Note 10 Materials and services, Operating and financial review; Sustainability and Fortum as a taxpayer.
For further information regarding the on-going tax appeals see Note 39 Legal actions and official proceedings.
14 Discontinued operations In March 2015 Fortum signed a binding agreement to sell the Swedish Distribution business. The transaction was completed in June 2015. In 2014 Fortum divested both the Finnish and Norwegian Distribution operations.
After the divestment of the Swedish Distribution business Fortum does not have any distribution operations and therefore Distribution segment has been treated as discontinued operations since the first quarter of 2015 according to IFRS 5 Non-current Assets held for Sale and Discontinued operations. Discontinued operations are disclosed on one line, net of tax, in the face of the income statement. In the cash flow statement the net cash flows attributable to the operating, investing and financing activities
of the discontinued operations are disclosed separately. In accordance with IFRS 5 the 2014 comparable information for income statement and cash flow statement has been restated.
Discontinued operations include the distribution operations in Fortum, including sales gains from the divestment of Swedish operations in June 2015 and Finnish and Norwegian distribution operations in 2014, and effects from internal sales and purchases have also been included. The net financial costs allocated to discontinued operations are based on the fact that the financing activities and risk management have been centralised on group level and subsidiaries have been funded with intra-group loans. No corporate overhead costs have been allocated to the discontinued operations. The assets relating to Distribution businesses have continued to be depreciated until the businesses were disposed.
Cash flow from discontinued operations include cash flow from distribution operations and allocated taxes, impact from sale of shares in Distribution companies and proceeds from interest-bearing receivables from sold subsidiaries.
Results of discontinued operations
EUR million 2015 2014 restatedSales 243 662Other income 2 15Materials and services -34 -114Employee benefits -14 -44Depreciation and amortisation -50 -150Other expenses -34 -104Comparable operating profit 114 266Changes in fair values of derivatives -1 0Capital gains1) 4,282 1,865Operating profit 4,395 2,132Share of profit/loss of associates and joint ventures 0 3Finance costs - net -1 -7Profit before income tax 4,393 2,128Income tax expenses -24 -56IS Profit for the year from discontinued operations 4,369 2,073
Net cash flows attributable to the discontinued operations
EUR million 2015 2014 restatedNet cash from operating activities 154 356Net cash used in investing activities 6,303 2,574Net cash from financing activities 0 -19Total net increase in liquid funds 6,457 2,911
1) Including gains on sale of shares of Swedish Distribution in 2015 and Finnish and Norwegian Distribution in 2014. All gains are tax exempt.
For more information see Note 41 Acquisitions and disposals.
Fortum has had several tax audits ongoing during 2015. Fortum has received income tax assessments in Sweden for the years 2009–2013, in Belgium for the years 2008–2012 as well as in Finland regarding the year 2007. Fortum has appealed all assessments received. Based on legal analysis, no provision has been accounted for in the financial statements related to these tax audits.
Basis of preparation Risks Income statement Balance sheet Off balance sheet items Group structure and related parties
Proposal for the distribution of earnings Auditor’s reportPrimary statements Quarterly financial informationParent company financial statements Investor informationOperating and financial review Key figuresNotes
56
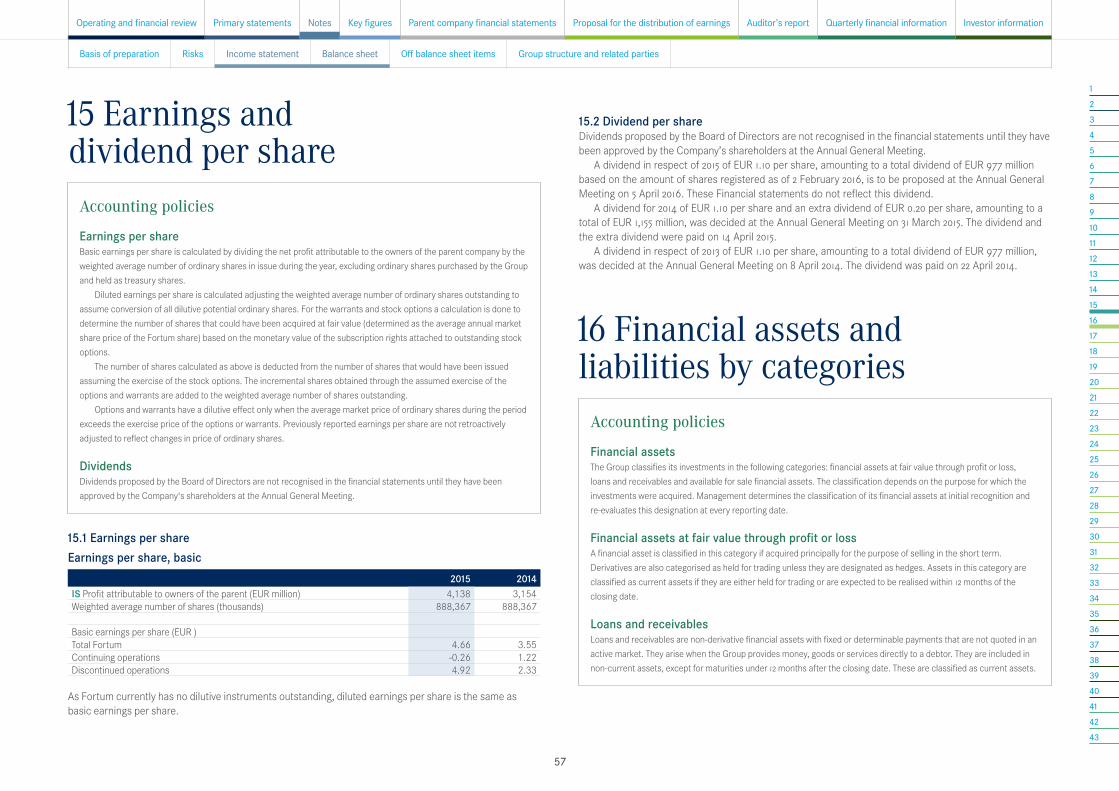
12345678910111213141516171819202122232425262728293031323334353637383940414243
16 Financial assets and liabilities by categories
Accounting policies
Financial assetsThe Group classifies its investments in the following categories: financial assets at fair value through profit or loss, loans and receivables and available for sale financial assets. The classification depends on the purpose for which the investments were acquired. Management determines the classification of its financial assets at initial recognition and re-evaluates this designation at every reporting date.
Financial assets at fair value through profit or lossA financial asset is classified in this category if acquired principally for the purpose of selling in the short term. Derivatives are also categorised as held for trading unless they are designated as hedges. Assets in this category are classified as current assets if they are either held for trading or are expected to be realised within 12 months of the closing date.
Loans and receivablesLoans and receivables are non-derivative financial assets with fixed or determinable payments that are not quoted in an active market. They arise when the Group provides money, goods or services directly to a debtor. They are included in non-current assets, except for maturities under 12 months after the closing date. These are classified as current assets.
15.1 Earnings per shareEarnings per share, basic
2015 2014IS Profit attributable to owners of the parent (EUR million) 4,138 3,154Weighted average number of shares (thousands) 888,367 888,367 Basic earnings per share (EUR )Total Fortum 4.66 3.55Continuing operations -0.26 1.22Discontinued operations 4.92 2.33
As Fortum currently has no dilutive instruments outstanding, diluted earnings per share is the same as basic earnings per share.
15 Earnings and dividend per share
Accounting policies
Earnings per shareBasic earnings per share is calculated by dividing the net profit attributable to the owners of the parent company by the weighted average number of ordinary shares in issue during the year, excluding ordinary shares purchased by the Group and held as treasury shares.
Diluted earnings per share is calculated adjusting the weighted average number of ordinary shares outstanding to assume conversion of all dilutive potential ordinary shares. For the warrants and stock options a calculation is done to determine the number of shares that could have been acquired at fair value (determined as the average annual market share price of the Fortum share) based on the monetary value of the subscription rights attached to outstanding stock options.
The number of shares calculated as above is deducted from the number of shares that would have been issued assuming the exercise of the stock options. The incremental shares obtained through the assumed exercise of the options and warrants are added to the weighted average number of shares outstanding.
Options and warrants have a dilutive effect only when the average market price of ordinary shares during the period exceeds the exercise price of the options or warrants. Previously reported earnings per share are not retroactively adjusted to reflect changes in price of ordinary shares.
DividendsDividends proposed by the Board of Directors are not recognised in the financial statements until they have been approved by the Company's shareholders at the Annual General Meeting.
15.2 Dividend per shareDividends proposed by the Board of Directors are not recognised in the financial statements until they have been approved by the Company’s shareholders at the Annual General Meeting.
A dividend in respect of 2015 of EUR 1.10 per share, amounting to a total dividend of EUR 977 million based on the amount of shares registered as of 2 February 2016, is to be proposed at the Annual General Meeting on 5 April 2016. These Financial statements do not reflect this dividend.
A dividend for 2014 of EUR 1.10 per share and an extra dividend of EUR 0.20 per share, amounting to a total of EUR 1,155 million, was decided at the Annual General Meeting on 31 March 2015. The dividend and the extra dividend were paid on 14 April 2015.
A dividend in respect of 2013 of EUR 1.10 per share, amounting to a total dividend of EUR 977 million, was decided at the Annual General Meeting on 8 April 2014. The dividend was paid on 22 April 2014.
Basis of preparation Risks Income statement Balance sheet Off balance sheet items Group structure and related parties
Proposal for the distribution of earnings Auditor’s reportPrimary statements Quarterly financial informationParent company financial statements Investor informationOperating and financial review Key figuresNotes
57
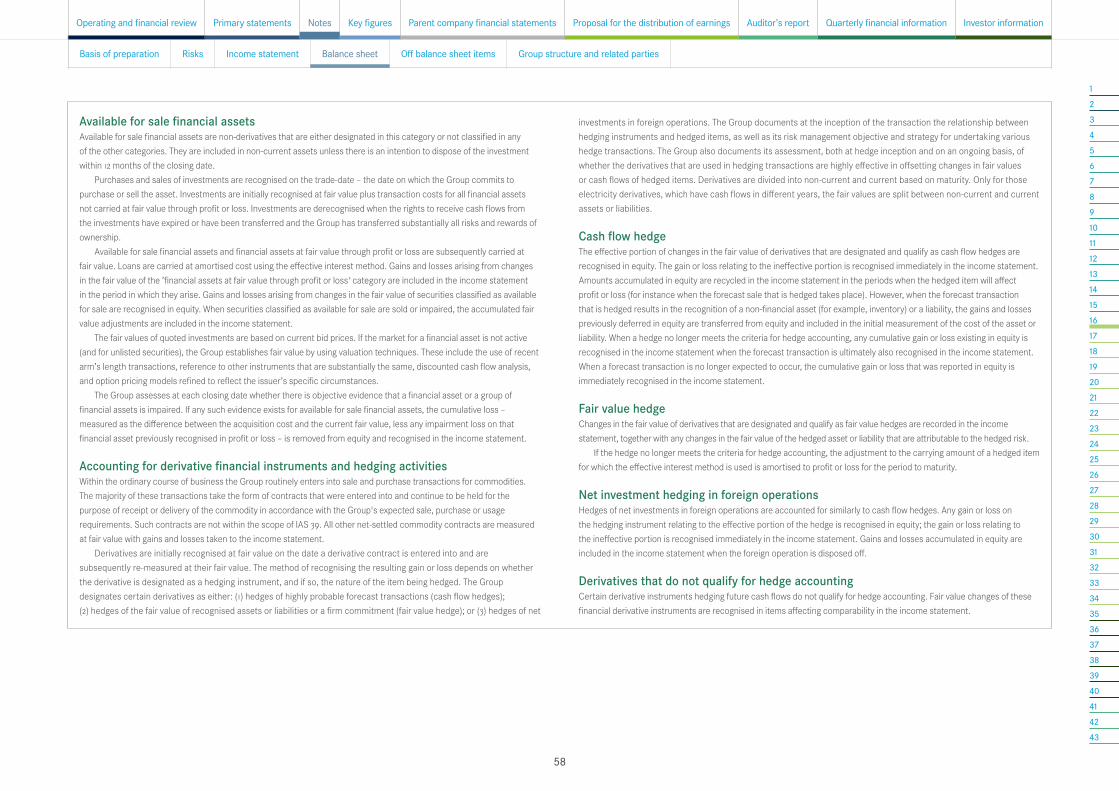
12345678910111213141516171819202122232425262728293031323334353637383940414243
Available for sale financial assetsAvailable for sale financial assets are non-derivatives that are either designated in this category or not classified in any of the other categories. They are included in non-current assets unless there is an intention to dispose of the investment within 12 months of the closing date.
Purchases and sales of investments are recognised on the trade-date – the date on which the Group commits to purchase or sell the asset. Investments are initially recognised at fair value plus transaction costs for all financial assets not carried at fair value through profit or loss. Investments are derecognised when the rights to receive cash flows from the investments have expired or have been transferred and the Group has transferred substantially all risks and rewards of ownership.
Available for sale financial assets and financial assets at fair value through profit or loss are subsequently carried at fair value. Loans are carried at amortised cost using the effective interest method. Gains and losses arising from changes in the fair value of the ’financial assets at fair value through profit or loss' category are included in the income statement in the period in which they arise. Gains and losses arising from changes in the fair value of securities classified as available for sale are recognised in equity. When securities classified as available for sale are sold or impaired, the accumulated fair value adjustments are included in the income statement.
The fair values of quoted investments are based on current bid prices. If the market for a financial asset is not active (and for unlisted securities), the Group establishes fair value by using valuation techniques. These include the use of recent arm’s length transactions, reference to other instruments that are substantially the same, discounted cash flow analysis, and option pricing models refined to reflect the issuer’s specific circumstances.
The Group assesses at each closing date whether there is objective evidence that a financial asset or a group of financial assets is impaired. If any such evidence exists for available for sale financial assets, the cumulative loss – measured as the difference between the acquisition cost and the current fair value, less any impairment loss on that financial asset previously recognised in profit or loss – is removed from equity and recognised in the income statement.
Accounting for derivative financial instruments and hedging activitiesWithin the ordinary course of business the Group routinely enters into sale and purchase transactions for commodities. The majority of these transactions take the form of contracts that were entered into and continue to be held for the purpose of receipt or delivery of the commodity in accordance with the Group's expected sale, purchase or usage requirements. Such contracts are not within the scope of IAS 39. All other net-settled commodity contracts are measured at fair value with gains and losses taken to the income statement.
Derivatives are initially recognised at fair value on the date a derivative contract is entered into and are subsequently re-measured at their fair value. The method of recognising the resulting gain or loss depends on whether the derivative is designated as a hedging instrument, and if so, the nature of the item being hedged. The Group designates certain derivatives as either: (1) hedges of highly probable forecast transactions (cash flow hedges); (2) hedges of the fair value of recognised assets or liabilities or a firm commitment (fair value hedge); or (3) hedges of net
investments in foreign operations. The Group documents at the inception of the transaction the relationship between hedging instruments and hedged items, as well as its risk management objective and strategy for undertaking various hedge transactions. The Group also documents its assessment, both at hedge inception and on an ongoing basis, of whether the derivatives that are used in hedging transactions are highly effective in offsetting changes in fair values or cash flows of hedged items. Derivatives are divided into non-current and current based on maturity. Only for those electricity derivatives, which have cash flows in different years, the fair values are split between non-current and current assets or liabilities.
Cash flow hedgeThe effective portion of changes in the fair value of derivatives that are designated and qualify as cash flow hedges are recognised in equity. The gain or loss relating to the ineffective portion is recognised immediately in the income statement. Amounts accumulated in equity are recycled in the income statement in the periods when the hedged item will affect profit or loss (for instance when the forecast sale that is hedged takes place). However, when the forecast transaction that is hedged results in the recognition of a non-financial asset (for example, inventory) or a liability, the gains and losses previously deferred in equity are transferred from equity and included in the initial measurement of the cost of the asset or liability. When a hedge no longer meets the criteria for hedge accounting, any cumulative gain or loss existing in equity is recognised in the income statement when the forecast transaction is ultimately also recognised in the income statement. When a forecast transaction is no longer expected to occur, the cumulative gain or loss that was reported in equity is immediately recognised in the income statement.
Fair value hedgeChanges in the fair value of derivatives that are designated and qualify as fair value hedges are recorded in the income statement, together with any changes in the fair value of the hedged asset or liability that are attributable to the hedged risk.
If the hedge no longer meets the criteria for hedge accounting, the adjustment to the carrying amount of a hedged item for which the effective interest method is used is amortised to profit or loss for the period to maturity.
Net investment hedging in foreign operationsHedges of net investments in foreign operations are accounted for similarly to cash flow hedges. Any gain or loss on the hedging instrument relating to the effective portion of the hedge is recognised in equity; the gain or loss relating to the ineffective portion is recognised immediately in the income statement. Gains and losses accumulated in equity are included in the income statement when the foreign operation is disposed off.
Derivatives that do not qualify for hedge accountingCertain derivative instruments hedging future cash flows do not qualify for hedge accounting. Fair value changes of these financial derivative instruments are recognised in items affecting comparability in the income statement.
Basis of preparation Risks Income statement Balance sheet Off balance sheet items Group structure and related parties
Proposal for the distribution of earnings Auditor’s reportPrimary statements Quarterly financial informationParent company financial statements Investor informationOperating and financial review Key figuresNotes
58
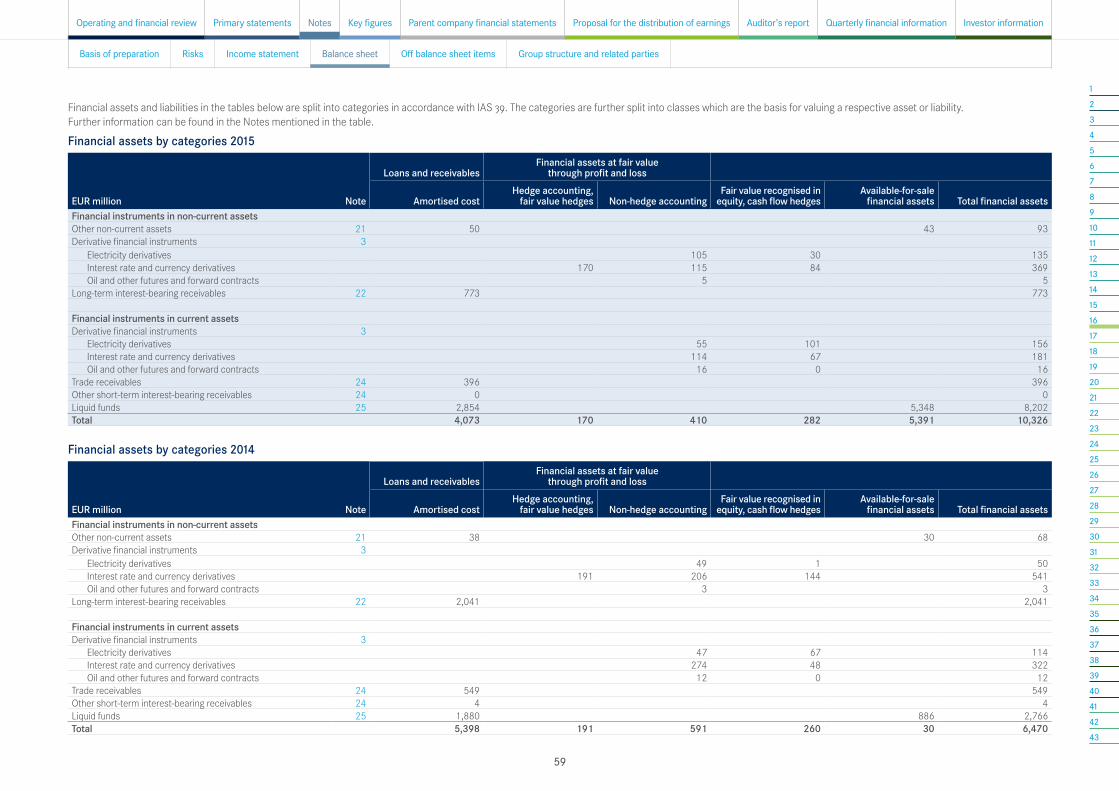
12345678910111213141516171819202122232425262728293031323334353637383940414243
Financial assets and liabilities in the tables below are split into categories in accordance with IAS 39. The categories are further split into classes which are the basis for valuing a respective asset or liability. Further information can be found in the Notes mentioned in the table.
Financial assets by categories 2015
EUR million Note
Loans and receivablesFinancial assets at fair value
through profit and loss
Amortised costHedge accounting,
fair value hedges Non-hedge accountingFair value recognised in
equity, cash flow hedgesAvailable-for-sale
financial assets Total financial assetsFinancial instruments in non-current assetsOther non-current assets 21 50 43 93Derivative financial instruments 3 Electricity derivatives 105 30 135 Interest rate and currency derivatives 170 115 84 369 Oil and other futures and forward contracts 5 5Long-term interest-bearing receivables 22 773 773 Financial instruments in current assetsDerivative financial instruments 3 Electricity derivatives 55 101 156 Interest rate and currency derivatives 114 67 181 Oil and other futures and forward contracts 16 0 16Trade receivables 24 396 396Other short-term interest-bearing receivables 24 0 0Liquid funds 25 2,854 5,348 8,202Total 4,073 170 410 282 5,391 10,326
Financial assets by categories 2014
EUR million Note
Loans and receivablesFinancial assets at fair value
through profit and loss
Amortised costHedge accounting,
fair value hedges Non-hedge accountingFair value recognised in
equity, cash flow hedgesAvailable-for-sale
financial assets Total financial assetsFinancial instruments in non-current assetsOther non-current assets 21 38 30 68Derivative financial instruments 3 Electricity derivatives 49 1 50 Interest rate and currency derivatives 191 206 144 541 Oil and other futures and forward contracts 3 3Long-term interest-bearing receivables 22 2,041 2,041 Financial instruments in current assetsDerivative financial instruments 3 Electricity derivatives 47 67 114 Interest rate and currency derivatives 274 48 322 Oil and other futures and forward contracts 12 0 12Trade receivables 24 549 549Other short-term interest-bearing receivables 24 4 4Liquid funds 25 1,880 886 2,766Total 5,398 191 591 260 30 6,470
Basis of preparation Risks Income statement Balance sheet Off balance sheet items Group structure and related parties
Proposal for the distribution of earnings Auditor’s reportPrimary statements Quarterly financial informationParent company financial statements Investor informationOperating and financial review Key figuresNotes
59

12345678910111213141516171819202122232425262728293031323334353637383940414243
Financial liabilities by categories 2015
EUR million Note
Financial liabilities at fair value through profit and loss
Fair value recognised in equity, cash flow hedges
Other financial liabilitiesHedge accounting, fair
value hedges Non-hedge accounting Amortised costs Fair value Total financial liabilitiesFinancial instruments in non-current liabilitiesInterest-bearing liabilities 28 3,697 1,268 1) 4,965Derivative financial instruments 3 Electricity derivatives 122 4 126
Interest rate and currency derivatives 31 60 62 153Oil and other futures and forward contracts 12 12
Financial instruments in current liabilitiesInterest-bearing liabilities 28 1,042 1,042Derivative financial instruments 3 Electricity derivatives 81 1 82
Interest rate and currency derivatives 28 4 32Oil and other futures and forward contracts 6 0 6
Trade payables 34 249 249Other liabilities 34 67 67Total 31 309 71 5,055 1,268 6,734
1) Fair valued part of bond in fair value hedge relationship.
Financial liabilities by categories 2014
EUR million Note
Financial liabilities at fair value through profit and loss
Fair value recognised in equity, cash flow hedges
Other financial liabilitiesHedge accounting, fair
value hedges Non-hedge accounting Amortised costs Fair value Total financial liabilitiesFinancial instruments in non-current liabilitiesInterest-bearing liabilities 28 4,427 1,454 1) 5,881Derivative financial instruments 3 Electricity derivatives 45 7 52
Interest rate and currency derivatives 96 96 192Oil and other futures and forward contracts 3 3
Financial instruments in current liabilitiesInterest-bearing liabilities 28 1,103 1,103Derivative financial instruments 3 Electricity derivatives 27 1 28
Interest rate and currency derivatives 22 22 44Oil and other futures and forward contracts 4 0 4
Trade payables 34 298 298Other liabilities 34 69 69Total 0 197 126 5,897 1,454 7,675
1) Fair valued part of bond in fair value hedge relationship.
Basis of preparation Risks Income statement Balance sheet Off balance sheet items Group structure and related parties
Proposal for the distribution of earnings Auditor’s reportPrimary statements Quarterly financial informationParent company financial statements Investor informationOperating and financial review Key figuresNotes
60

12345678910111213141516171819202122232425262728293031323334353637383940414243
17 Financial assets and liabilities by fair value hierarchyAccounting policies
Fair value measurements are classified using a fair value hierarchy i.e. Level 1, Level 2 and Level 3 that reflects the significance of the inputs used in making the measurements.
Fair values under Level 1 measurement hierarchyThe fair value of some commodity derivatives traded in active markets (such as publicly traded electricity options, coal and oil forwards) are market quotes at the closing date.
Fair values under Level 2 measurement hierarchyThe fair value of financial instruments including electricity derivatives traded in active markets (such as publicly traded derivatives, and trading and available for sale securities) is based on quoted market prices at the closing date. Known calculation techniques, such as estimated discounted cash flows, are used to determine fair value of interest rate and currency financial instruments. The fair value of interest-rate swaps is calculated as the present value of the estimated future cash flows. The fair value of forward foreign exchange contracts is determined using forward exchange market rates at the closing date. Fair values of options are determined by using option valuation models. The fair value of financial
liabilities is estimated by discounting the future contractual cash flows at the current market interest rate that is available to the Group for similar financial instruments. In fair valuation, credit spread has not been adjusted, as quoted market prices of the instruments used are believed to be consistent with the objective of a fair value measurement.
The Group bases the calculation on existing market conditions at each closing date. Financial instruments used in Fortum are standardised products that are either cleared via exchanges or widely traded in the market. Commodity derivatives are generally cleared through exchanges such as for example NASDAQ OMX Commodities Europe and financial derivatives done with creditworthy financial institutions with investment grade ratings.
Fair values under Level 3 measurement hierarchyInvestments in unlisted shares classified as Available for sale financial assets, for which the fair value cannot be reliably determined. These assets are measured at cost less any impairments.
Other measurementsThe nominal value less estimated credit adjustments of trade receivables and payables are assumed to approximate their fair values.
Basis of preparation Risks Income statement Balance sheet Off balance sheet items Group structure and related parties
Proposal for the distribution of earnings Auditor’s reportPrimary statements Quarterly financial informationParent company financial statements Investor informationOperating and financial review Key figuresNotes
61

12345678910111213141516171819202122232425262728293031323334353637383940414243
Financial assets
EUR million NoteLevel 1 Level 2 Level 3 Netting 2) Total
2015 2014 2015 2014 2015 2014 2015 2014 2015 2014In non-current assetsAvailable for sale financial assets 1) 21 1 1 42 29 43 30Derivative financial instruments 3
Electricity derivativesHedge accounting 40 6 -9 -5 30 1Non-hedge accounting 175 66 -70 -17 105 49
Interest rate and currency derivativesHedge accounting 254 335 254 335Non-hedge accounting 115 206 115 206
Oil and other futures and forward contractsNon-hedge accounting 7 1 6 -2 -3 5 3
In current assetsDerivative financial instruments 3 Electricity derivatives
Hedge accounting 117 79 -16 -11 101 67Non-hedge accounting 1 251 153 -196 -106 55 47
Interest rate and currency derivativesHedge accounting 67 48 67 48Non-hedge accounting 114 274 114 274
Oil and other futures and forward contractsHedge accounting 0 0Non-hedge accounting 47 30 9 -31 -26 16 12
Total 56 32 1,133 1,182 42 29 -324 -168 907 1,0731) Available for sale financial assets, i.e. shares which are not classified as associated companies or joint ventures, consists mainly of shares in unlisted companies of EUR 42 million (Dec 31 2014: 29), for which the fair value cannot be reliably determined. This includes EUR 11 million from Fortum's indirect shareholding in Fennovoima. These assets are measured at cost less any impairments. Available for sale financial assets include listed shares at fair value of EUR 1 million (2014: 1). The cumulative fair value change booked in Fortum's equity was EUR -3 million (2014: -3).2) Receivables and liabilities against electricity, oil and other commodity exchanges arising from standard derivative contracts with same delivery period are netted.
Basis of preparation Risks Income statement Balance sheet Off balance sheet items Group structure and related parties
Proposal for the distribution of earnings Auditor’s reportPrimary statements Quarterly financial informationParent company financial statements Investor informationOperating and financial review Key figuresNotes
62

12345678910111213141516171819202122232425262728293031323334353637383940414243
Financial liabilities
EUR million NoteLevel 1 Level 2 Level 3 Netting 2) Total
2015 2014 2015 2014 2015 2014 2015 2014 2015 2014In non-current liabilitiesInterest-bearing liabilities 28 1,268 1) 1,454 1) 1,268 1,454Derivative financial instruments 3 Electricity derivatives
Hedge accounting 13 11 -9 -5 4 7Non-hedge accounting 192 62 -70 -17 122 45
Interest rate and currency derivativesHedge accounting 93 96 93 96Non-hedge accounting 60 96 60 96
Oil and other futures and forward contractsNon-hedge accounting 14 5 2 -2 -3 12 3
In current liabilitiesDerivative financial instruments 3 Electricity derivatives
Hedge accounting 18 12 -16 -11 1 1Non-hedge accounting 1 277 134 -196 -106 81 27
Interest rate and currency derivativesHedge accounting 4 22 4 22Non-hedge accounting 28 22 28 22
Oil and other futures and forward contractsHedge accounting 0 0Non-hedge accounting 37 29 2 -31 -26 6 4
Total 52 34 1,953 1,913 0 0 -324 -168 1,680 1,7781) Fair valued part of bond in fair value hedge relationship.2) Receivables and liabilities against electricity, oil and other commodity exchanges arising from standard derivative contracts with same delivery period are netted.
Net fair value amount of interest rate and currency derivatives is EUR 367 million, assets EUR 551 million and liabilities EUR 184 million. Fortum has cash collaterals based on Credit Support Annex agreements with some counterparties. At the end of December 2015 Fortum had received EUR 202 million from Credit Support Annex agreements. The received cash has been booked as short term liability.
Basis of preparation Risks Income statement Balance sheet Off balance sheet items Group structure and related parties
Proposal for the distribution of earnings Auditor’s reportPrimary statements Quarterly financial informationParent company financial statements Investor informationOperating and financial review Key figuresNotes
63

12345678910111213141516171819202122232425262728293031323334353637383940414243
18 Intangible assetsAccounting policies
Intangible assets, except goodwill, are stated at the historical cost less accumulated amortisation and impairment losses. They are amortised on a straight-line method over their expected useful lives.
Computer softwareAcquired computer software licences are capitalised on the basis of the costs incurred when bringing the software into use. Costs associated with developing or maintaining computer software are recognised as an expense as incurred. Costs that are directly associated with the production of identifiable and unique software products controlled by the Group, and that will generate economic benefits exceeding costs beyond one year, are recognised as intangible assets. Direct costs include the software development employee costs and an appropriate portion of relevant overheads. Computer software costs recognised as assets are amortised over their estimated useful lives (three to five years).
Trademarks and licensesTrademarks and licences are shown at historical cost less accumulated amortisation and impairment losses, as applicable. Amortisation is calculated using the straight-line method to allocate the cost of trademarks and licences over their estimated useful lives (15–20 years).
Contractual customer relationshipsContractual customer relationships acquired in a business combination are recognised at fair value on acquisition date. The contractual customer relations have a finite useful life and are carried at costs less accumulated amortisation. Amortisation is calculated using the straight-line method over the expected duration of the customer relationship.
GoodwillGoodwill represents the excess of the cost of an acquisition over the fair value of the Group's share of net identifiable assets of the acquired subsidiary/associate at the date of acquisition. Goodwill on acquisitions of subsidiaries is included in intangible assets. Goodwill on acquisition of associates is included in investments in associates and is tested for impairment as part of the overall balance. Separately recognised goodwill is tested annually for impairment and carried at cost less accumulated impairment losses. Impairment losses on goodwill are not reversed. Gains and losses on disposal of an entity include the carrying amount of goodwill relating to the entity sold.
Emission allowancesThe Group accounts for emission allowances based on currently valid IFRS standards where purchased emission allowances are accounted for as intangible assets at cost, whereas emission allowances received free of charge are accounted for at nominal value. For CO2 emissions from power and heat production, a provision is recognized. CO2 emission costs is settled by returning emission allowances. To the extent that the Group already holds allowances to cover emission costs, the provision is measured at the carrying amount of those allowances. Any shortfall of allowances held over the obligation is valued at the current market value of allowances. The emission cost is recognised in the income statement within materials and services. The sales gains and losses of emission allowances not used for covering the obligation from CO2 emissions, are reported in other income.
Critical accounting estimates: Assigned values and useful lives in acquisitionsIn an acquisition acquired intangible and tangible assets are fair valued and their remaining useful lives are determined. Management believes that the assigned values and useful lives, as well as the underlying assumptions, are reasonable. Different assumptions and assigned lives could have a significant impact on the reported amounts.
The Group has significant carrying values in property, plant and equipment as well as goodwill which are tested for impairment according to the accounting policies.
See Note 19 Property, plant and equipment for more information.
EUR millionGoodwill
Other intangible assets Total
2015 2014 2015 2014 2015 2014Cost 1 January 170 275 379 368 549 644Translation differences and other adjustments -18 -101 2 -12 -16 -113Increases through business combinations 0 0 1 0 1 0Capital expenditure 0 0 8 22 8 22Change in emission rights 0 0 -8 -1 -8 -1Disposals 0 0 -6 -1 -6 -1Sale of subsidiary companies 1) 0 -4 -58 -24 -58 -28Reclassifications 0 0 14 27 14 27Cost 31 December 153 170 332 379 485 549 Accumulated depreciation 1 January 0 0 273 260 273 260Translation differences and other adjustments 0 0 1 -11 1 -11Disposals 0 0 -6 -2 -6 -2Sale of subsidiary companies 1) 0 0 -28 -5 -28 -5Reclassifications 0 0 0 5 0 5Depreciation for the period 2) 0 0 22 25 22 25Accumulated depreciation 31 December 0 0 262 273 262 273BS Carrying amount 31 December 153 170 70 106 222 276
1) Divestment of assets related to the Finnish Distribution business are not included in the comparative period figures as they were presented as 'Assets held for sale' in the balance sheet as of 31 December 2013. For more information about divestments of subsidiaries, see Note 41 Acquisitions and disposals.2) Including depreciations related to discontinued operations (see Note 14 Discontinued operations).
The goodwill is included in Russia segment and relates to the acquisition of OAO Fortum. The goodwill has been tested for impairment by comparing recoverable amounts of the net operating assets of OAO Fortum, including goodwill, with their carrying amounts. The recoverable amounts were determined on the basis of value in use, applying discounted cash flow calculations. See also Note 19 Property, plant and equipment for information about impairment testing.
The main items in other intangible assets are costs for software products and software licenses, bought emission rights and emission rights received free of charge, which are recognised to the lower of fair value and historical cost.
Basis of preparation Risks Income statement Balance sheet Off balance sheet items Group structure and related parties
Proposal for the distribution of earnings Auditor’s reportPrimary statements Quarterly financial informationParent company financial statements Investor informationOperating and financial review Key figuresNotes
64

12345678910111213141516171819202122232425262728293031323334353637383940414243
19 Property, plant and equipmentAccounting policies
Property, plant and equipment comprise mainly power and heat producing buildings and machinery, transmission lines, tunnels, waterfall rights and district heating network. Property, plant and equipment are stated at historical cost less accumulated depreciation and accumulated impairment losses as applicable in the consolidated balance sheet. Historical cost includes expenditure that is directly attributable to the acquisition of an item and capitalized borrowing costs. Cost may also include transfers from equity of any gains or losses on qualifying cash flow hedges of foreign currency purchases of property, plant and equipment. Acquired assets on the acquisition of a new subsidiary are stated at their fair values at the date of acquisition.
Subsequent costs are included in the asset's carrying amount or recognised as a separate asset, as appropriate, only when it is probable that future economic benefits associated with the item will flow to the Group and the cost of the item can be measured reliably. All other repairs and maintenance are charged to the income statement during the financial period in which they are incurred.
Additionally the cost of an item of property, plant and equipment includes the estimated cost of its dismantlement, removal or restoration.
See Note 31 Other provisions for information about asset retirement obligations and Note 30, Nuclear related assets and liabilities, for information about provisions for decommissioning nuclear power plants.
Land, water areas, waterfall rights and tunnels are not depreciated since they have indefinite useful lives. Depreciation on other assets is calculated using the straight-line method to allocate their cost to their residual values over their estimated useful lives, as follows:
Hydro power plant buildings, structures and machinery 40–50 yearsThermal power plant buildings, structures and machinery 25 yearsNuclear power plant buildings, structures and machinery 25 yearsCHP power plant buildings, structures and machinery 15–25 yearsSubstation buildings, structures and machinery 30–40 yearsDistribution network (related to discontinued operations) 15–40 yearsDistrict heating network 30–40 yearsOther buildings and structures 20–40 yearsOther tangible assets 20–40 yearsOther machinery and equipment 3–20 yearsOther non-current investments 5-10 years
The assets' residual values and useful lives are reviewed, and adjusted if appropriate, at each closing date. An asset's carrying amount is written down immediately to its recoverable amount if the asset's carrying amount is greater than its estimated recoverable amount.
Impairment of non-financial assetsThe individual assets’ carrying values are reviewed at each closing date to determine whether there is any indication of impairment. An asset's carrying amount is written down immediately to its recoverable amount if it is greater than the estimated recoverable amount.
When considering the need for impairment the Group assesses if events or changes in circumstances indicate that the carrying amount may not be recoverable. This assessment is documented once a year in connection with the Business Plan process. Indications for impairment are analysed separately by each division as they are different for each business and include risks such as changes in electricity and fuel prices, regulatory/political changes relating to energy taxes and price regulations etc. Impairment testing needs to be performed if any of the impairment indications exists. Assets that have an indefinite useful life and goodwill, are not subject to amortisation and are tested annually for impairment.
An impairment loss is recognised in the income statement for the amount by which the assets' carrying amount exceeds its recoverable amount. The recoverable amount is the higher of an asset’s fair value less costs to sell and value in use. For the purpose of assessing impairment, assets are grouped at the lowest levels for which there are separately identifiable cash flows (cash-generating units). Goodwill is allocated to cash-generating units for the purpose of impairment testing. The allocation is made to those cash-generating units or groups of cash-generating units that are expected to benefit from the business combination in which the goodwill arose.
Value in use is determined by discounting the future cash flows expected to be derived from an asset or cash-generating unit. Cash flow projections are based on the most recent Business Plan that has been approved by management and the Board of Directors. Cash flows arising from future investments such as new plants are excluded unless projects have been started. The cash outflow needed to complete the started projects is included.
The period covered by cash flows is related to the useful lives of the assets reviewed for impairment. According to IFRS, projections used should cover a maximum period of five years, but longer period can be justifiable in certain circumstances. The Group uses a longer projection period than normally allowed by IFRS, which reflects the long useful lives of power plants and other major assets. Cash flow projections beyond the period covered by the most recent business plan are estimated by extrapolating the projections using growth rates estimated by management for subsequent years.
Non-financial assets other than goodwill that suffered an impairment charge are reviewed for possible reversal of the impairment at each reporting date.
Government grantsGrants from the government are recognised at their fair value where there is a reasonable assurance that the grant will be received and the Group will comply with all attached conditions. Government grants relating to costs are deferred and recognised in the income statement over the period necessary to match them with the costs that they are intended to compensate. Government grants relating to the purchase of property, plant and equipment are deducted from the acquisition cost of the asset and are recognised as income by reducing the depreciation charge of the asset they relate to.
Basis of preparation Risks Income statement Balance sheet Off balance sheet items Group structure and related parties
Proposal for the distribution of earnings Auditor’s reportPrimary statements Quarterly financial informationParent company financial statements Investor informationOperating and financial review Key figuresNotes
65

12345678910111213141516171819202122232425262728293031323334353637383940414243
Borrowing costsBorrowing costs directly attributable to the acquisition, construction or production of qualifying assets are added to the cost of those assets, until such time as the assets are substantially ready for their intended use or sale. Qualifying assets are assets that necessarily take a substantial period of time to get ready for their intended use or sale.
All other borrowing costs are recognised in profit or loss in the period in which they are incurred.
Joint operationsFortum owns, through its subsidiary Fortum Power and Heat Oy, the coal condensing power plant Meri-Pori in Finland. Teollisuuden Voima Oyj (TVO) has the contractual right to participate in the plant with 45.45%. The capacity and production is divided between Fortum and TVO. Each owner can decide when and how much capacity to use for production. Both Fortum and TVO purchase fuel and emission rights independently. Since Fortum and TVO are sharing control of the power plant, Meri-Pori is accounted for as a joint operation. Fortum is accounting for its part of the investment, i.e. 54.55%. Fortum is also entitled to part of the electricity TVO produces in Meri-Pori through its shareholding of 26.58% of TVO C-series shares.
For further information regarding Fortum’s shareholding in TVO, see Note 20 Participations in associated companies and joint ventures.
EUR million
Land, waterfall rights and tunnels
Buildings, plants and structures
Machinery and equipment
Other tangible assets
Advances paid and construction
in progress Total2015 2014 2015 2014 2015 2014 2015 2014 2015 2014 2015 2014
Cost 1 January 2,810 2,974 3,110 3,424 9,728 11,120 136 144 904 1,161 16,687 18,824Translation differences and other adjustments 59 -164 -72 -426 -124 -1,176 1 -4 -24 -274 -160 -2,043Increases through business combinations 0 0 1 0 1 0 0 0 0 0 2 0Capital expenditure 1 2 24 22 20 28 0 0 575 700 619 752Nuclear asset retirement cost 0 0 0 0 0 -3 0 0 0 0 0 -3Disposals 0 -1 -11 -5 -54 -259 0 0 -1 -1 -67 -266Sale of subsidiary companies 1) -11 -1 -92 -88 -4,319 -443 -2 -1 -132 -16 -4,556 -549Reclassifications 0 0 187 182 363 461 2 -4 -566 -666 -14 -27Cost 31 December 2,859 2,810 3,146 3,110 5,614 9,728 136 136 755 904 12,510 16,687 Accumulated depreciation 1 January 0 0 1,328 1,321 4,054 4,542 111 111 0 0 5,492 5,974Translation differences and other adjustments 0 0 -10 -67 -16 -330 1 -3 0 0 -25 -400Increases through business combinations 0 0 0 0 1 0 0 0 0 0 1 0Disposals 0 0 -8 -1 -52 -258 0 0 0 0 -60 -259Sale of subsidiary companies 1) 0 0 -43 -31 -1,978 -287 -2 -1 0 0 -2,023 -319Depreciation for the period 2) 0 0 100 111 312 387 3 3 0 0 416 502Reclassifications 0 0 0 -5 -1 -1 0 0 0 0 -1 -5Accumulated depreciation 31 December 0 0 1,367 1,328 2,319 4,054 113 111 0 0 3,799 5,492 BS Carrying amount 31 December 2,859 2,810 1,779 1,782 3,295 5,674 23 25 755 904 8,710 11,195
1) Divestment of assets related to the Finnish Distribution business are not included in the comparative period figures as they were presented as 'Assets held for sale' in the balance sheet as of 31 December 2013. For more information about divestments of subsidiaries, see Note 41 Acquisitions and disposals.2) Including depreciations related to discontinued operations (see Note 14 Discontinued operations), as well as impairment loss for Fortum's share of the Finnish coal-fired power plant Meri-Pori.
Critical accounting estimates: Assumptions related to impairment testingThe Group has significant carrying values in property, plant and equipment as well as goodwill which are tested for impairment according to the accounting policy described in the notes. The recoverable amounts of cash-generating units have been determined based on value in use calculations. These calculations are based on estimated future cash flows from most recent approved business plan. Preparation of these estimates requires management to make assumptions relating to future expectations. Assumptions vary depending on the business the tested assets are in. For power and heat generation business the main assumptions relate to the estimated future operating cash flows and the discount rates used to present value them.
Estimates are also made in an acquisition when determining the fair values and remaining useful lives of acquired intangible and tangible assets, see Note 18 Intangible assets.
Basis of preparation Risks Income statement Balance sheet Off balance sheet items Group structure and related parties
Proposal for the distribution of earnings Auditor’s reportPrimary statements Quarterly financial informationParent company financial statements Investor informationOperating and financial review Key figuresNotes
66

12345678910111213141516171819202122232425262728293031323334353637383940414243
The change in property, plant and equipment was negative, even though capital expenditures were higher than depreciation during the year. The decrease was mainly due to the sale of the Swedish electricity distribution business and translation differences. The main increase was due to the ongoing investment programme in OAO Fortum.
For more information on credit risks regarding ongoing investments, see Note 3.7 Credit risk.Property, plant and equipment that are subject to restrictions in the form of real estate mortgages
amount to EUR 255 million (2014: 274).See Note 35 Pledged assets.
19.1 Capitalised borrowing costs
EUR million
Buildings, plants
and structuresMachinery and
equipment
Advances paid and
construction in progress Total
2015 2014 2015 2014 2015 2014 2015 20141 January 35 40 125 162 42 57 202 259Translation differences and other adjustments -4 -14 -13 -56 -4 -21 -21 -91Increases / disposals 0 -6 6 12 38 37 44 43Reclassification 14 9 21 21 -36 -31 -1 -1Depreciation -1 5 -6 -14 0 0 -7 -931 December 43 35 133 125 41 42 217 202
Borrowing costs of EUR 44 million were capitalised in 2015 (2014: 47) mainly for the OAO Fortum investment program. The interest rate used for capitalisation varied between 2.0%–19.2% (2014: 3.3%–16.6%).
144178
58669276
307288
Fortum classifies investments in four main categories, (continuing operations), EUR million
350 300 250 200 150 100
50 0
2014 2015
Maintenance investments
Investments required by legislation
Investments increasing
productivity
Growth investments
19.2 Capital expenditure
Basis of preparation Risks Income statement Balance sheet Off balance sheet items Group structure and related parties
Proposal for the distribution of earnings Auditor’s reportPrimary statements Quarterly financial informationParent company financial statements Investor informationOperating and financial review Key figuresNotes
67

12345678910111213141516171819202122232425262728293031323334353637383940414243
Capital expenditure1)
EUR millionFinland Sweden Russia Poland Estonia Other countries Total
2015 2014 2015 2014 2015 2014 2015 2014 2015 2014 2015 2014 2015 2014Power and TechnologyHydropower 25 16 77 87 102 103Nuclear power 75 80 75 80Fossil-based electricity 0Renewable-based electricity 7 8 1 0 3 8 11Other 2 3 0 2 3Total Power and Technology 102 106 85 88 0 0 0 0 3 187 197Heat, Electricity Sales and SolutionsFossil-based heat 7 3 14 5 21 8Fossil-based electricity 1 1 1 1Renewable, of which 26 24 11 1 13 38 37
waste 11 1 3 12 3biofuels 25 6 1 0 25 6other 2 18 10 2 28
District heat network 12 13 11 8 7 8 1 2 31 31Other 5 4 1 0 1 3 1 5 3 14 9Total Heat, Electricity Sales and Solutions 49 44 1 0 0 37 15 11 9 7 18 105 86Other 5 2 1 0 0 0 0 0 1 6 3RussiaFossil-based electricity 267 305 267 305Fossil-based heat 18 35 18 35Other 0 0 0 0Total Russia 285 340 285 340Total for continuing operations 156 152 87 88 285 340 37 15 11 9 7 22 582 626Discontinued operations (Distribution) 11 44 133 0 0 0 3 44 147Total 156 163 132 221 285 340 37 15 11 9 7 25 626 774
1) Includes capital expenditure to both intangible assets and property, plant and equipment.
Basis of preparation Risks Income statement Balance sheet Off balance sheet items Group structure and related parties
Proposal for the distribution of earnings Auditor’s reportPrimary statements Quarterly financial informationParent company financial statements Investor informationOperating and financial review Key figuresNotes
68

12345678910111213141516171819202122232425262728293031323334353637383940414243
19.2.1 Power and TechnologyIn Finland, Fortum invested EUR 75 million (2014: 80) into the Loviisa nuclear power plant. Fortum invested additionally EUR 102 million (2014: 103) into hydro production, mainly refurbishment and productivity investments. The biggest of these were Höljes refurbishment and Ljusnans dam safety in Sweden, EUR 19 million (2014: 29) and Imatra refurbishment in Finland, EUR 5 million (2014: 8). Investments in CO2 free production were EUR 184 million (2014: 194).
19.2.2 Heat, Electricity Sales and SolutionsGrowth investments in Heat segment totaled EUR 42 million (2014: 34) in year 2015. Refurbishment and legislation investments totaled EUR 62 million (2014: 53). This amount consists mainly of investments in district heat networks and plants as well as the maintenance of existing CHP plants and measures defined by legal requirements. Larger ongoing projects in 2015 comprised of bio-pellet heat boiler in Espoo and new CHP plant in Zabrze, Poland. Investments in CO2 free production were EUR 39 million (2014: 37). .
19.2.3 RussiaOAO Fortum has commissioned seven out of eight new units of its extensive investment programme aiming to almost double its power capacity with 2,300 MW. During 2015 EUR 161 million (2014: 235) was invested in this programme. In November 2015 Fortum commissioned Chelyabinsk GRES 1, which started to receive capacity payments as of 1 December 2015. The final unit, Chelyabinsk GRES 2, is scheduled to be commissioned during the first quarter of 2016.
19.3. Impairment testing of non-financial assets in 2015Key assumptions used in impairment testing are presented below as well as the basis for determining the value of each assumption. Assumptions are based on internal and external data that are consistent with observable market information, when applicable. The assumptions are determined by management as part of the business planning process for the Fortum Group.
Key assumptions Basis for determining the value for key assumptionsPower market development Historical analysis and prospective forecastingRegulation framework Current market setup and prospective forecasting (e.g. CSA
mechanism)Utilisation of power plants Past experience, technical assessment and forecasted market
developmentForecasted maintenance investments Past experience, technical assessment and planned maintenance workFinalisation of the investment programme Project forecastsDiscount rate Mostly market based information
The cash flows used in testing are based on the most recent business plans and are determined in local currency. The period covered by cash flows is related to the useful lives of the assets being reviewed for impairment. The growth rate used to extrapolate the cash flow projections until the end of assets' useful lives is in line with the assumed inflation. In Russia the generation capacity built after 2007 under the Russian Government's Capacity Supply Agreements receives guaranteed capacity payments for a period of 10 years. The discount rate takes into account the risk profile of the country in which the cash flows are generated. There have not been any major changes in the discount rate components or in the methods used to determine them. The long-term pre-tax discount rate used for Russia was 11.1% (2014: 10.8%).
The net operating assets of OAO Fortum, including fair value adjustments and goodwill arising from the acquisition of the company are tested yearly for possible impairment. As of 31 December 2015, the recoverable values were greater than their carrying values and therefore no impairments were booked.
The Group has considered the sensitivity of key assumptions as part of the impairment testing. When doing this any consequential effect of the change on the other variables has also been considered. The calculations are most sensitive to changes in estimated future EBITDA levels and changes in discount rate.
Management estimates that a reasonably possible change in the discount rate used or in future earnings would not cause Russian cash generating unit's carrying amount to exceed its recoverable amount. Based on the sensitivity analysis done, if the estimated future EBITDA were 10% lower than management's estimates or pre-tax discount rate applied was 10% higher than the one used, the Group would not need to recognise impairment losses for property plant and equipment or goodwill.
Basis of preparation Risks Income statement Balance sheet Off balance sheet items Group structure and related parties
Proposal for the distribution of earnings Auditor’s reportPrimary statements Quarterly financial informationParent company financial statements Investor informationOperating and financial review Key figuresNotes
69

12345678910111213141516171819202122232425262728293031323334353637383940414243
20 Participations in associated companies and joint ventures20.1 Principal associated companies and joint ventures
OKG AB
Forsmarks Kraftgrupp
ABKemijoki
OyHafslund
ASA TGC-1 TVOFortum Värme
Nature of the relationship
Power production
company
Power production
company
Power production
company
Holding in energy company
(listed)
Holding in energy company
(listed)
Power production
company
Holding in power and heat company
ClassificationAssociated
companyAssociated
companyAssociated
companyAssociated
companyAssociated
companyJoint
ventureJoint
venture
SegmentPower and
TechnologyPower and
TechnologyPower and
Technology Other RussiaPower and
Technology
Heat, Electricity Sales and Solutions
Domicile Sweden Sweden Finland Norway Russia Finland SwedenOwnership interest, % 1) 46 26 60 34 29 26 50Votes, % 46 26 28 33 29 26 50
1) Kemijoki and TVO have different series of shares. The ownership interest varies due to the changes in equity assigned to the different share series. The ownership interests for 2014 for Kemijoki Oy and TVO were 59% and 26% respectively.
Accounting policies
The Group’s interests in associated companies and jointly controlled entities are accounted for using the equity method of accounting. Assets acquired and liabilities assumed in the investment in associates or joint ventures are measured initially at their fair values at the acquisition date. The excess of the cost of acquisition over the fair value of the Group’s share of the identifiable net assets acquired is recorded as goodwill. If the cost of acquisition is less than the fair value of the net assets of the associate or joint venture acquired, the difference is recognised directly in the income statement.
The Group’s share of its associates or joint ventures post-acquisition profits or losses after tax and the expenses related to the adjustments to the fair values of the assets and liabilities assumed are recognised in the income statement. The cumulative post-acquisition movements are adjusted against the carrying amount of the investment. The Group's share of post-acquisition adjustments to associates or joint ventures equity that has not been recognised in the associates or joint ventures income statement, is recognised directly in Group's shareholder's equity and against the carrying amount of the investment.
When the Group’s share of losses in an associate or a joint venture equals or exceeds its interest in the associate or joint venture, including any other unsecured receivables, the Group does not recognise further losses, unless it has incurred obligations or made payments on behalf of the associate or joint venture.
Unrealised gains on transactions between the Group and its associates or joint ventures are eliminated to the extent of the Group’s interest in the associate or joint venture. Unrealised losses are also eliminated unless the transaction provides evidence of an impairment of the asset transferred. Accounting policies of associates or joint ventures have been changed where necessary to ensure consistency with the policies adopted by the Group.
If more recent information is not available, the share of the profit of certain associated or joint venture companies is included in the consolidated accounts based on the latest available information.
Critical accounting estimates and judgements
Management is required to make significant judgements when assessing the nature of Fortum's interest in its investees and when considering the classification of Fortum's joint arrangements. In the classification, emphasis has been put on decision-making, legal structure and financing of the arrangements.
Shareholdings in power production companiesPower plants are often built jointly with other power producers. Under the consortium agreements, each owner is entitled to electricity in proportion to its share of ownership or other agreements and each owner is liable for an equivalent portion of costs. The production companies are not profit making, since the owners purchase electricity at production cost including interest cost and production taxes. The share of profit of these companies is mainly IFRS adjustments (e.g. accounting for nuclear related assets and liabilities) and depreciations on fair value adjustments from historical acquisitions since the companies are not profit making under local accounting principles.
Fortum has material shareholdings in such power production companies (mainly nuclear and hydro) that are consolidated using equity method either as associated companies (OKG AB, Forsmarks Kraftgrupp AB and Kemijoki Oy) or in some cases as joint ventures (Teollisuuden Voima Oyj (TVO)).
In Sweden nuclear production company shareholdings are 45.5% ownership of the shares in OKG AB and 25.5% ownership of the shares in Forsmarks Kraftgrupp AB. Excluding non-controlling interests in the subsidiaries, Fortum’s participation in the companies are 43.4% and 22.2% respectively, which reflects the share of electricity produced that Fortum can sell further to the market. The minority part of the electricity purchased is invoiced further to each minority owner according to their respective shareholding and treated as pass-through. OKG AB and Forsmarks Kraftgrupp AB are accounted for as associated companies as Fortum has a representation on the Board of Directors and it participates in policy-making processes of the companies.
In Finland Fortum has an ownership in power production company TVO that has three series of shares which entitle the shareholders to electricity produced in the different power plants owned by TVO.
Basis of preparation Risks Income statement Balance sheet Off balance sheet items Group structure and related parties
Proposal for the distribution of earnings Auditor’s reportPrimary statements Quarterly financial informationParent company financial statements Investor informationOperating and financial review Key figuresNotes
70

12345678910111213141516171819202122232425262728293031323334353637383940414243
Shares in series A entitle to electricity produced in nuclear power plants Olkiluoto 1 and 2 and Fortum owns 26.6% of these shares. Series B entitles to electricity in the nuclear power plant presently being built, Olkiluoto 3, and Fortum's ownership in this share series is 25%. Series C entitles to electricity produced in TVO’s share of the thermal power plant Meri-Pori, and Fortum's ownership in this share series is 26.6%. The Meri-Pori power plant is accounted for as a joint operation in Fortum.
See also Joint operations in the accounting principles in Note 19 Property, plant and equipment.The most significant hydro production company shareholding is 63.8% of the hydro shares and
28.27% of the monetary shares in Kemijoki Oy. Each owner of hydro shares is entitled to the hydropower production in proportion to its hydro shareholding. Since Fortum has a representation on the Board of Directors and it participates in the policy-making processes, Kemijoki Oy is accounted for as an associated company.
Other shareholdings accounted for using the equity methodIn Sweden Fortum has a 50% ownership in AB Fortum Värme Holding samägt med Stockholms stad (Fortum Värme) that is co-owned with the City of Stockholm through Stockholms Stadshus AB. Fortum Värme produces district heating, district cooling and electricity and supplies heat and cooling to customers in the Stockholm area. Fortum and the City of Stockholm has have renewed the shareholders’ agreement which came into force as of 1 January 2016. Parties also agreed that Fortum Värme’s shareholder loans from Fortum would be replaced with external financing by the end of 2015. The refinancing has been done and as of 31 December 2015 Fortum Värme no longer has interest-bearing liabilities to Fortum.
Previously Fortum owned 90.1% of the shares representing 50.1% of the votes in Fortum Värme and the City of Stockholm owned 9.9% of the shares as preference shares representing 49,9% of the votes. The preference shares entitled the City of Stockholm to 50% of the economic output of Fortum Värme. On 1 December 2015 the City of Stockholm exchanged their preference shares to ordinary shares after which the voting rights are equally divided (50/50) between Fortum and the City of Stockholm. The City of Stockholm and Fortum have had and will continue to have 50% right to the economic output. The shareholding is accounted for as a joint venture with the equity method as according to the shareholders’ agreement control is shared.
Fortum owns shareholdings in listed companies such as Hafslund ASA and Territorial Generating Company 1 (TGC-1). The shareholdings are accounted for as associated companies as Fortum has representatives in the Board of Directors of the companies. The share of profit of these companies is accounted for based on previous quarter information since updated interim information is not normally available.
Summarised financial information of the principal associated companies in 2015
EUR million OKG AB
Forsmarks Kraftgrupp
AB Kemijoki OyHafslund
ASA TGC-1Balance sheet 31 Dec 2014 31 Dec 2014 31 Dec 2014 30 Sept 2015 30 Sept 2015Non-current assets 2,271 2,261 449 2,301 1,625Current assets 475 491 4 336 236Non-current liabilities 2,648 2,601 305 1,268 417Current liabilities 85 114 71 496 156Equity 12 38 77 873 1,288
Attributable to NCI 2 109Attributable to the owners of the parent 12 38 77 872 1,178
Statement of comprehensive income
1 Jan 2014– 31 Dec 2014
1 Jan 2014– 31 Dec 2014
1 Jan 2014– 31 Dec 2014
1 Oct 2014– 30 Sep 2015
1 Oct 2014– 30 Sep 2015
Revenue 542 707 55 1,351 1,011Profit or loss from continuing operations 0 1 -10 120 62Other comprehensive income 8 1Total comprehensive income 0 1 -10 128 63
Attributable to NCI 0 4Attributable to the owners of the parent 0 1 -10 128 59
Reconciliation to carrying amount in the Fortum groupGroup's interest in the equity of the associate at 1 January 6 9 52 289 374Change in share of profit and from OCI items -6 44 18Dividends received -18 -4Translation differences and other adjustments 0 1 -17 -41Group's interest in the equity of the associate at 31 December 6 10 46 297 374Fair values on acquisitions and different accounting principles 1) 39 88 160 9 -31Carrying amount at 31 December 45 97 206 306 316
Market value for listed shares 2) 411 59
1) Impact of different accounting principles include mainly IFRS adjustments for Nuclear liabilities and assets and capitalised borrowing costs in Swedish associates. Fortum records its share of nuclear related assets and liabilities in its nuclear associated companies according to equity method. The basis for recognition is similar as for Loviisa power plant, see accounting principles in Note 30 Nuclear related assets and liabilities.2) The market quotation for the TGC-1 share is affected by the low liquidity of the TGC-1 shares in the Russian stock exchanges. During 2015 trading volumes of TGC-1 shares in relation to the number of shares of the company were approximately 10% (2014: 9%).
Basis of preparation Risks Income statement Balance sheet Off balance sheet items Group structure and related parties
Proposal for the distribution of earnings Auditor’s reportPrimary statements Quarterly financial informationParent company financial statements Investor informationOperating and financial review Key figuresNotes
71

12345678910111213141516171819202122232425262728293031323334353637383940414243
Summarised financial information of the principal associated companies in 2014
EUR million OKG AB
Forsmarks Kraftgrupp
AB Kemijoki Oy Hafslund ASA TGC-1Balance sheet 31 Dec 2013 31 Dec 2013 31 Dec 2013 30 Sept 2014 30 Sept 2014Non-current assets 2,200 2,094 449 2,426 1,814Current assets 462 488 9 406 259Non-current liabilities 2,552 2,348 279 1,452 481Current liabilities 97 197 90 532 205Equity 13 37 88 849 1,388
Attributable to NCI 2 118Attributable to the owners of the parent 13 37 88 847 1,270
Statement of comprehensive income
1 Jan 2013– 31 Dec 2013
1 Jan 2013– 31 Dec 2013
1 Jan 2013– 31 Dec 2013
1 Oct 2013– 30 Sep 2014
1 Oct 2013– 30 Sep 2014
Revenue 568 727 57 1,481 1,357Profit or loss from continuing operations 1 1 -7 120 126Other comprehensive income -23Total comprehensive income 1 1 -7 96 126
Attributable to NCI 8Attributable to the owners of the parent 1 1 -7 96 118
Reconciliation to carrying amount in the Fortum groupGroup's interest in the equity of the associate at 1 January 8 10 57 298 489Change in share of profit and from OCI items -5 33 35Dividends received -20 -4Acquisitions 52Translation differences and other adjustments -2 -23 -198Group's interest in the equity of the associate at 31 December 6 9 52 289 374Fair values on acquisitions and different accounting principles 1) 145 79 158 11 -48Carrying amount at 31 December 151 88 210 299 326
Market value for listed shares 373 71
1) Impact of different accounting principles include mainly IFRS adjustments for Nuclear liabilities and assets and capitalised borrowing costs in Swedish associates. Fortum records its share of nuclear related assets and liabilities in its nuclear associated companies according to equity method. The basis for recognition is similar as for Loviisa power plant, see accounting principles in Note 30 Nuclear related assets and liabilities.
Summarised financial information of the principal joint ventures in 2015 and 20142015 2014
EUR million TVO Fortum Värme TVO Fortum VärmeBalance sheet 30 Sept 2015 31 Dec 2015 30 Sept 2014 31 Dec 2014Non-current assets 6,785 2,777 6,567 2,552Current assets 521 308 423 313
of which cash and cash equivalents 141 0 128 6Non-current liabilities 5,201 1,645 4,994 1,362
of which non-current interest-bearing liabilities 4,247 1,247 4,078 995
Current liabilities 578 305 516 432of which current financial liabilities 432 145 351 298
Equity 1) 1,528 1,135 1,480 1,071Attributable to NCI 0 0Attributable to the shareholders of the company 1,528 1,135 1,480 1,071
Statement of comprehensive income1 Oct 2014– 30 Sep 2015
1 Jan 2015– 31 Dec 2015
1 Oct 2013– 30 Sep 2014
1 Jan 2014– 31 Dec 2014
Revenue 379 661 353 716Depreciation and amortisation -115 -127 -58 -128Interest income 23 0 23 1Interest expense -64 -57 -67 -28Income tax expense or income 0 -25 -30Profit or loss from continuing operations 8 84 4 126Other comprehensive income 4 -2 12 -22Total comprehensive income 12 82 16 104
Attributable to NCI 0 0Attributable to the shareholders of the company 12 82 16 104
Reconciliation to carrying amount in the Fortum groupGroup's interest in the equity of the joint venture at 1 January 292 535 289 537Change in share of profit and from OCI items 2 37 3 53Dividends received -21 --22Translation differences and other adjustments 16 -32Group's interest in the equity of the joint venture at 31 December 294 567 292 535Fair values on acquisitions and different accounting principles 2) -11 -88 -7 -91Carrying amount at 31 December 283 479 285 445
1) The equity of TVO includes subordinated loans of EUR 379 million (2014: 339). Fortum has given part of these loans, pro rata to the ownership.2) Impact of different accounting principles include mainly IFRS adjustments for Nuclear liabilities and assets and capitalised borrowing costs. Fortum records its share of nuclear related assets and liabilities in its nuclear associated companies according to equity method. The basis for recognition is similar as for Loviisa power plant, see accounting principles in Note 30 Nuclear related assets and liabilities.
Basis of preparation Risks Income statement Balance sheet Off balance sheet items Group structure and related parties
Proposal for the distribution of earnings Auditor’s reportPrimary statements Quarterly financial informationParent company financial statements Investor informationOperating and financial review Key figuresNotes
72

12345678910111213141516171819202122232425262728293031323334353637383940414243
See also Associated companies in Note 39 Legal actions and official proceedings. See Note 30 Nuclear related assets and liabilities.
20.2 Participations and shares of profts in associated companies and joint ventures
Participations in associated companies and joint ventures in the balance sheetEUR million 2015 2014Principal associates 970 1,074Principal joint ventures 762 730Other associates 43 42Other joint ventures 184 182BS Carrying amount 31 December 1,959 2,027
Changes in participation during the year
EUR million
Joint ventures
2015
Associated companies
2015
Joint ventures
2014
Associated companies
2014Historical cost1 January 546 838 518 1,130Translation differences and other adjustments 4 -37 -11 -166Acquisitions 22 5 36 26Reclassifications 6 -5 5 -9Divestments -21 0 -3 -143Historical cost 31 December 558 800 546 838 Equity adjustments1 January 366 277 334 359Translation differences and other adjustments 9 -17 -23 -71Share of profits of associates and joint ventures 1) 2) 56 -37 76 72Reclassifications -6 5 12 -7Divestments -6 0 0 -36Dividends received -29 -23 -27 -30OCI items associated companies and joint ventures -2 7 -6 -10Equity adjustments 31 December 388 213 366 277 Carrying amount at 31 December 946 1,013 912 1,115
1) In 2014 including share of profits related to discontinued operations.2) Including impairment charges of EUR -116 million (2014: 0), see Note 7 Effects from early closure of nuclear units in Sweden.
For information about investments and divestments of shares in associated companies, see Note 41 Acquisitions and disposals.
Share of profit of associates and joint ventures EUR million 2015 2014Principal associates
OKG AB 1) -107 5Forsmarks Kraftgrupp AB 7 -9Kemijoki Oy -9 -5Hafslund ASA 39 36TGC-1 32 35
Principal associates, total -38 61Principal joint ventures
Fortum Värme 47 67TVO -2 -4
Principal joint ventures, total 45 64Other associates 2) 1 11Other joint ventures 11 12IS Total 20 149
1) Including impairment charges of EUR -116 million (2014: 0), see Note 7 Effects from early closure of nuclear units in Sweden.2) In 2014 including share of profits related to discontinued operations.
The unrecognized share of losses of associated companies and joint ventures (for the reporting period and cumulatively) is zero.
Share of profits from Teollisuuden Voima Oyj, Forsmarks Kraftgrupp AB and OKG AB includes EUR -37 million (2014: 2) arising from accounting of nuclear related assets and liabilities.
Share of profits from Värme include compensation paid to Fortum for early prepayment of the interest-bearing loans from Fortum EUR -19 million (2014: 0).
20.3 Transactions and balances
Associated company transactionsEUR million 2015 2014Sales to associated companies 2 1Interest on associated company loan receivables 15 31Purchases from associated companies 418 483
Purchases from joint ventures include mainly purchases of nuclear and hydro power at production cost including interest costs and production taxes.
Basis of preparation Risks Income statement Balance sheet Off balance sheet items Group structure and related parties
Proposal for the distribution of earnings Auditor’s reportPrimary statements Quarterly financial informationParent company financial statements Investor informationOperating and financial review Key figuresNotes
73

12345678910111213141516171819202122232425262728293031323334353637383940414243
21 Other non-current assetsEUR million 2015 2014Available for sale financial assets 43 30Other 50 38BS Total 93 68
Available for sale financial assets, i.e. shares which are not classified as associated companies or joint ventures, consist mainly of shares in unlisted companies of EUR 43 million (2014: 30), for which the fair value can not be reliably determined. These assets are measured at cost less possible impairment.
Fortum has decided to participate in the Fennovoima nuclear power project in Finland with an indirect owning of 6.6% at the commercial date of the power plant. Fortum has in 2015 invested EUR 11 million in Fennovoima, with an indirect ownership of 4.1% at the end of 2015. The participation is carried out through Voimaosakeyhtiö SF. The indirect investment in Fennovoima is classified as Available for sale financial assets, measured at cost, since fair value cannot be reliably determined.
22 Long-term and short-term interest-bearing receivablesEUR million 2015 2014Long-term loan receivables 773 2,041BS Total long-term interest-bearing receivables 773 2,041Other short-term interest-bearing receivables 0 4Total short-term interest-bearing receivables 1) 0 4Total 773 2,045
1) Included in trade and other receivables in the balance sheet, see Note 24 Trade and other receivables.
Long-term loan receivables include receivables from associated companies and joint ventures EUR 773 million (2014: 2,041). These receivables include EUR 582 million (2014: 1,310) from Swedish nuclear companies, OKG AB and Forsmarks Kraftgrupp AB, which are mainly funded with shareholder loans, pro rata each shareholder’s ownership. The impairment charges in OKG AB due to the decision to close down nuclear power units 1 and 2 will be invoiced from the shareholders when the costs are incurred. Fortum has estimated the impact to be EUR 794 million and netted that against the shareholder loan. The main part of the netted amount has already been invoiced to Fortum, the remaining part will be invoiced when the costs occur. Long-term loan receivables include also receivables from Teollisuuden Voima Oyj (TVO), EUR 120 million (2014: 110). At the end of 2015 Fortum does not have any loan receivables from Fortum Värme (2014: 553).
TVO is building Olkiluoto 3, the nuclear power plant, which is funded through external loans, share issues and shareholder loans according to shareholders' agreement between the owners of TVO. At end
Associated company balancesEUR million 2015 2014Receivables from associated companiesLong-term interest-bearing loan receivables 601 1,327Trade receivables 0 1Other receivables 0 0 Liabilities to associated companiesLong-term loan payables 2 1Trade payables 4 1Other payables 160 0
For more info about receivables from associated companies, see Note 22 Long-term and short-term interest-bearing receivables.
Joint venture transactionsEUR million 2015 2014Sales to joint ventures 79 75Interest on joint venture loan receivables 12 28Purchases from joint ventures 91 81Other financial income 37 1
Purchases from joint ventures include mainly purchases of nuclear and hydro power at production cost including interest costs and production taxes.
Other financial income includes compensation from early prepayment of loans by Fortum Värme.
Joint venture balancesEUR million 2015 2014Receivables from joint venturesLong-term interest-bearing loan receivables 172 714Trade receivables 11 17Other receivables 14 15 Liabilities to joint venturesLong-term loan payables 268 261Trade payables 6 5Other payables 6 4
For more info about receivables from joint ventures, see Note 22 Long-term and short-term interest-bearing receivables.
Basis of preparation Risks Income statement Balance sheet Off balance sheet items Group structure and related parties
Proposal for the distribution of earnings Auditor’s reportPrimary statements Quarterly financial informationParent company financial statements Investor informationOperating and financial review Key figuresNotes
74

12345678910111213141516171819202122232425262728293031323334353637383940414243
23 InventoriesAccounting policies
Inventories mainly consist of fuels consumed in the production process or in the rendering of services. Inventories are stated at the lower of cost and net realisable value being the estimated selling price for the end product, less applicable variable selling expenses and other production costs. Cost is determined using the first-in, first-out (FIFO) method.
Inventories which are acquired primarily for the purpose of trading are stated at fair value less selling expenses.
EUR million 2015 2014Nuclear fuel 98 105Coal 62 77Oil 6 12Biofuels 5 1Materials and spare parts 52 52Other inventories 10 9BS Total 231 256
Write downs in inventories amounted to EUR 5 million (2014: 0), mainly relating to obsolete spare parts.
of December 2015 Fortum has EUR 120 million (2014: 95) outstanding receivables regarding Olkiluoto 3 and is additionally committed to provide at maximum EUR 75 million.
TVO’s Extraordinary General Meeting made a decision on 24 June 2015 not to apply for a construction license for Olkiluoto 4. The incurred costs relating to the project were invoiced from TVO’s shareholders in June and Fortum’s share of these costs was EUR 15 million. The invoice was not paid and it was netted against the subordinated shareholder loan that Fortum had given to TVO for funding the planning of Olkiluoto 4. The additional committment related to Olkiluoto 4, EUR 57 million, has been cancelled and Fortum does not have any further commitments related to Olkiluoto 4.For further information regarding credit risk management, see Note 3.7 Credit risk. For additional information regarding OKG AB, see Note 7 Effects from early closure of nuclear units in Sweden.
Interest-bearing receivablesRepricing
EUR million
Effective interest rate, %
Carrying amount
2015Under 1 year
1–5 years
Over 5 years
Fair value 2015
Carrying amount
2014
Fair value 2014
Long-term loan receivables 1) 0.9 773 752 16 5 813 2,044 2,216
1) Including current portion of long-term receivables EUR 0 million (2014: 3).
24 Trade and other receivablesAccounting policies
Trade receivables are recorded at their fair value. A provision for impairment of trade receivables is established when there is evidence that the Group will not be able to collect all amounts due according to the original terms of the receivable. Significant financial difficulties of the debtor, probability that the debtor will enter into bankruptcy or financial reorganisation, and default or delinquency in payments are considered as indicators that the receivable is impaired. The amount of the impairment charge is measured as the difference between the asset's carrying amount and the present value of estimated future cash flows.
Trade receivables include revenue based on an estimate of electricity, heat and cooling already delivered but not yet measured and not yet invoiced.
EUR million 2015 2014Trade receivables 396 549Income tax receivables 124 132Accrued interest income 5 6Accrued income and prepaid expenses 29 23Other receivables 269 116Other short-term interest-bearing receivables 0 4BS Total 822 830
The management considers that the carrying amount of trade and other receivables approximates their fair value.
24.1 Trade receivablesAgeing analysis of trade receivables
2015 2014EUR million Gross Impaired Gross ImpairedNot past due 335 2 504 2Past due 1–90 days 55 3 44 4Past due 91–180 days 8 2 6 3Past due more than 181 days 52 48 50 46Total 449 54 604 55
Impairment losses recognised in the income statement were EUR 11 million (2014: 9), of which EUR 8 million (2014: 4) are impairment losses recognised in the OAO Fortum Group. On 31 December 2015, trade receivables of EUR 54 million (2014: 55) are impaired and provided for, of which EUR 47 million (2014: 46) refers to the OAO Fortum Group.
Basis of preparation Risks Income statement Balance sheet Off balance sheet items Group structure and related parties
Proposal for the distribution of earnings Auditor’s reportPrimary statements Quarterly financial informationParent company financial statements Investor informationOperating and financial review Key figuresNotes
75
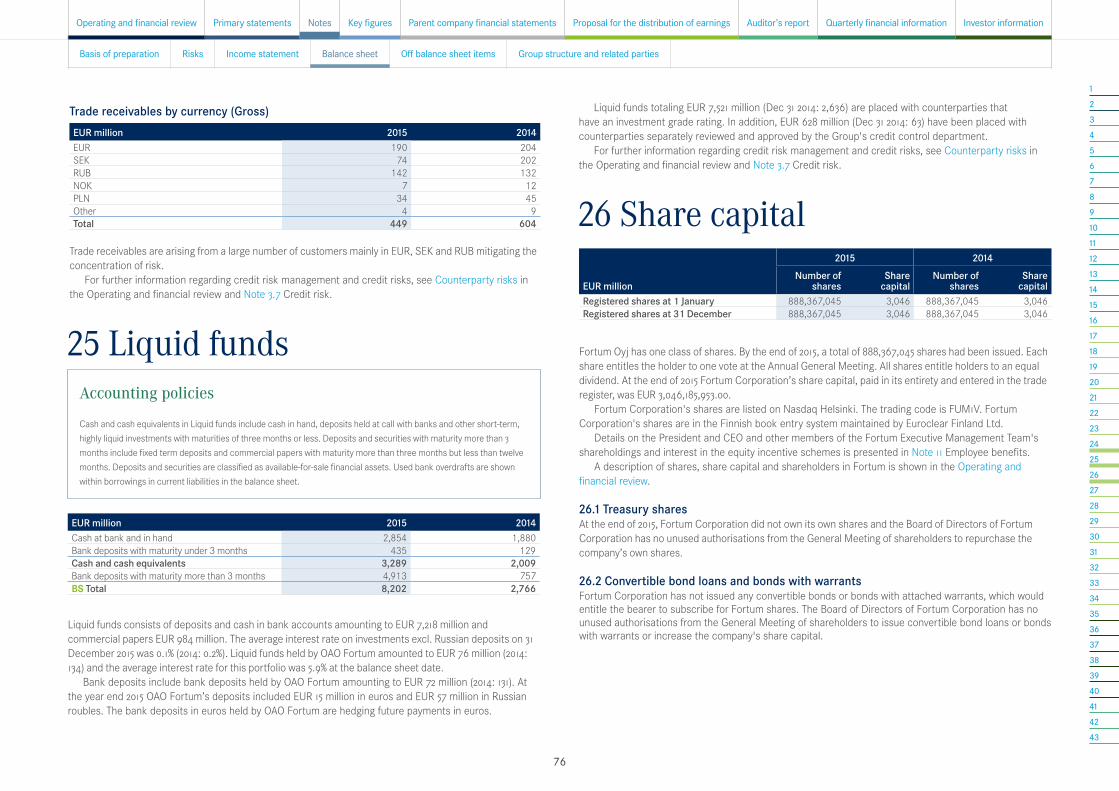
12345678910111213141516171819202122232425262728293031323334353637383940414243
25 Liquid fundsAccounting policies
Cash and cash equivalents in Liquid funds include cash in hand, deposits held at call with banks and other short-term, highly liquid investments with maturities of three months or less. Deposits and securities with maturity more than 3 months include fixed term deposits and commercial papers with maturity more than three months but less than twelve months. Deposits and securities are classified as available-for-sale financial assets. Used bank overdrafts are shown within borrowings in current liabilities in the balance sheet.
EUR million 2015 2014Cash at bank and in hand 2,854 1,880Bank deposits with maturity under 3 months 435 129Cash and cash equivalents 3,289 2,009Bank deposits with maturity more than 3 months 4,913 757BS Total 8,202 2,766
Liquid funds consists of deposits and cash in bank accounts amounting to EUR 7,218 million and commercial papers EUR 984 million. The average interest rate on investments excl. Russian deposits on 31 December 2015 was 0.1% (2014: 0.2%). Liquid funds held by OAO Fortum amounted to EUR 76 million (2014: 134) and the average interest rate for this portfolio was 5.9% at the balance sheet date.
Bank deposits include bank deposits held by OAO Fortum amounting to EUR 72 million (2014: 131). At the year end 2015 OAO Fortum’s deposits included EUR 15 million in euros and EUR 57 million in Russian roubles. The bank deposits in euros held by OAO Fortum are hedging future payments in euros.
Trade receivables by currency (Gross)EUR million 2015 2014EUR 190 204SEK 74 202RUB 142 132NOK 7 12PLN 34 45Other 4 9Total 449 604
Trade receivables are arising from a large number of customers mainly in EUR, SEK and RUB mitigating the concentration of risk.
For further information regarding credit risk management and credit risks, see Counterparty risks in the Operating and financial review and Note 3.7 Credit risk.
26 Share capital2015 2014
EUR millionNumber of
sharesShare
capitalNumber of
sharesShare
capitalRegistered shares at 1 January 888,367,045 3,046 888,367,045 3,046Registered shares at 31 December 888,367,045 3,046 888,367,045 3,046
Fortum Oyj has one class of shares. By the end of 2015, a total of 888,367,045 shares had been issued. Each share entitles the holder to one vote at the Annual General Meeting. All shares entitle holders to an equal dividend. At the end of 2015 Fortum Corporation’s share capital, paid in its entirety and entered in the trade register, was EUR 3,046,185,953.00.
Fortum Corporation's shares are listed on Nasdaq Helsinki. The trading code is FUM1V. Fortum Corporation's shares are in the Finnish book entry system maintained by Euroclear Finland Ltd.
Details on the President and CEO and other members of the Fortum Executive Management Team's shareholdings and interest in the equity incentive schemes is presented in Note 11 Employee benefits.
A description of shares, share capital and shareholders in Fortum is shown in the Operating and financial review.
26.1 Treasury sharesAt the end of 2015, Fortum Corporation did not own its own shares and the Board of Directors of Fortum Corporation has no unused authorisations from the General Meeting of shareholders to repurchase the company’s own shares.
26.2 Convertible bond loans and bonds with warrants Fortum Corporation has not issued any convertible bonds or bonds with attached warrants, which would entitle the bearer to subscribe for Fortum shares. The Board of Directors of Fortum Corporation has no unused authorisations from the General Meeting of shareholders to issue convertible bond loans or bonds with warrants or increase the company's share capital.
Liquid funds totaling EUR 7,521 million (Dec 31 2014: 2,636) are placed with counterparties that have an investment grade rating. In addition, EUR 628 million (Dec 31 2014: 63) have been placed with counterparties separately reviewed and approved by the Group's credit control department.
For further information regarding credit risk management and credit risks, see Counterparty risks in the Operating and financial review and Note 3.7 Credit risk.
Basis of preparation Risks Income statement Balance sheet Off balance sheet items Group structure and related parties
Proposal for the distribution of earnings Auditor’s reportPrimary statements Quarterly financial informationParent company financial statements Investor informationOperating and financial review Key figuresNotes
76
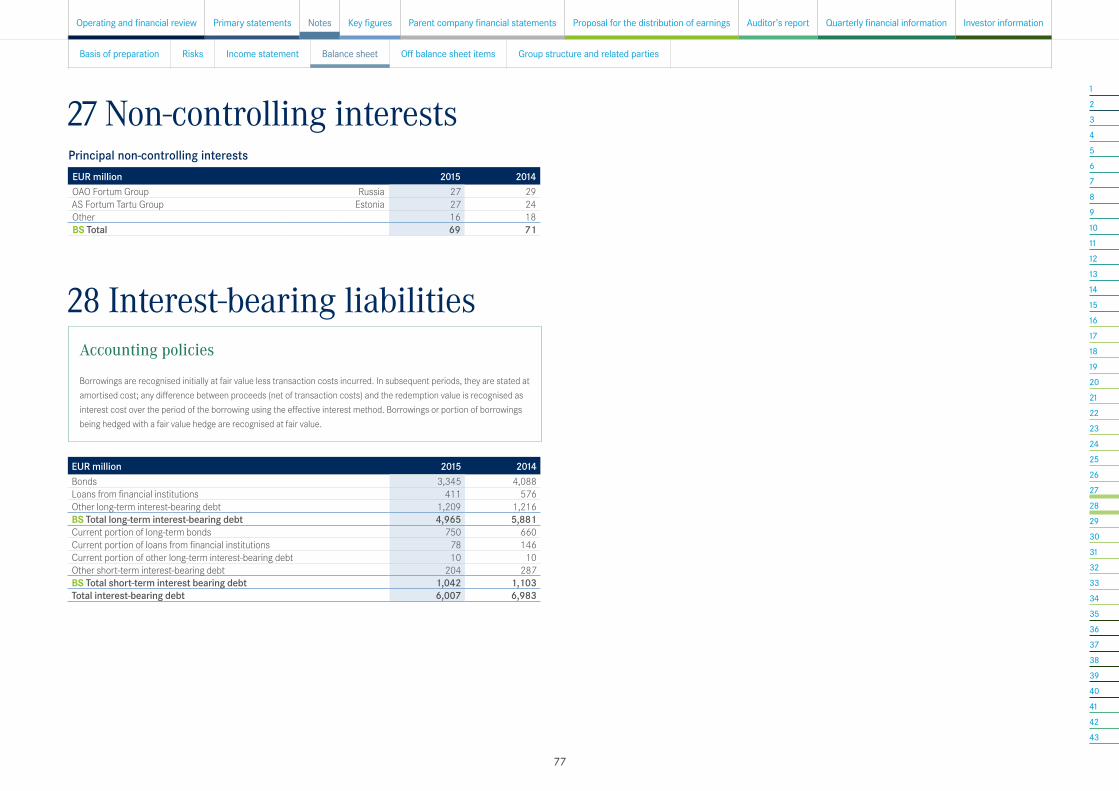
12345678910111213141516171819202122232425262728293031323334353637383940414243
Accounting policies
Borrowings are recognised initially at fair value less transaction costs incurred. In subsequent periods, they are stated at amortised cost; any difference between proceeds (net of transaction costs) and the redemption value is recognised as interest cost over the period of the borrowing using the effective interest method. Borrowings or portion of borrowings being hedged with a fair value hedge are recognised at fair value.
27 Non-controlling interestsPrincipal non-controlling interestsEUR million 2015 2014OAO Fortum Group Russia 27 29AS Fortum Tartu Group Estonia 27 24Other 16 18BS Total 69 71
28 Interest-bearing liabilities
EUR million 2015 2014Bonds 3,345 4,088Loans from financial institutions 411 576Other long-term interest-bearing debt 1,209 1,216BS Total long-term interest-bearing debt 4,965 5,881Current portion of long-term bonds 750 660Current portion of loans from financial institutions 78 146Current portion of other long-term interest-bearing debt 10 10Other short-term interest-bearing debt 204 287BS Total short-term interest bearing debt 1,042 1,103Total interest-bearing debt 6,007 6,983
Basis of preparation Risks Income statement Balance sheet Off balance sheet items Group structure and related parties
Proposal for the distribution of earnings Auditor’s reportPrimary statements Quarterly financial informationParent company financial statements Investor informationOperating and financial review Key figuresNotes
77

12345678910111213141516171819202122232425262728293031323334353637383940414243
Interest-bearing debt
Effective interest rate, %
Carrying amount 2015
Repricing Fair value 2015
Carrying amount 2014
Fair value 2014EUR million Under 1 year 1–5 years Over 5 years
Bonds 3.4 4,094 1,293 1,114 1,687 4,375 4,748 5,093Loans from finan cial institutions 2.8 490 259 66 165 531 722 777Reborrowing from the Finnish State Nuclear Waste Management Fund 0.7 1,074 1,074 - - 1,132 1,040 1,104Other long-term interest-bearing debt 1) 1.9 145 145 - - 155 186 192Total long-term interest-bearing debt 2) 2.8 5,803 2,771 1,180 1,852 6,193 6,696 7,166Other short-term interest-bearing debt 0.0 204 204 - - 204 287 287Total short-term interest-bearing debt 0.0 204 204 - - 204 287 287Total interest-bearing debt 3) 2.7 6,007 2,975 1,180 1,852 6,397 6,983 7,453
1) Includes loans from Finnish pension institutions EUR 68 million (2014: 78) and other loans EUR 77 million (2014: 108). 2) Including current portion of long-term debt.3) The average interest rate on loans and derivatives on 31 December 2015 was 3.7% (2014: 3.7%).
The interest-bearing debt decreased in 2015 by EUR 976 million to EUR 6,007 million (2014: 6,983). The amount of short-term financing decreased with EUR 83 million, and at the end of the year the amount of short-term financing EUR 204 million (2014: 287) included 202 million (2014: 286) from Credit Support Annex agreements.
In March 2015 Fortum increased the amount of re-borrowing from the Finnish nuclear waste fund and Teollisuuden Voima by EUR 34 million to EUR 1,074 million. In the second quarter Fortum repaid bilateral loans of EUR 164 million and in the third quarter two SEK bonds equivalent to EUR 664 million (SEK 6,200 million) and EUR 50 million bilateral loan.
The average interest rate for the portfolio consisting mainly of EUR and SEK loans was 2.6% at the balance sheet date (2014: 2.9%). Part of the external loans EUR 641 million (2014: 681) have been swapped to RUB and the average interest cost for these loans including cost for hedging the RUB was 12.8% at the balance sheet date (2014: 11.3%). The average interest rate on total loans and derivatives at the balance sheet date was 3.7% (2014: 3.7%).
For more information please see Note 3 Financial risk management, Note 35 Pledged assets and Note 38 Contingent liabilities.
28.1 Bond issues
Issued/Maturity Interest basisInterest rate, % Effective interest, % Currency
Nominalvalue
millionCarrying amount
EUR millionFortum Oyj EUR 8,000 million EMTN Programme 1)
2006/2016 Fixed 4.500 4.615 EUR 750 750 2009/2017 Fixed 6.125 6.240 NOK 500 52 2009/2019 Fixed 6.000 6.095 EUR 750 747 2011/2021 Fixed 4.000 4.123 EUR 500 525 2012/2017 Floating Stibor 3M+1.2 SEK 1,000 109 2012/2017 Fixed 3.250 3.260 SEK 1,750 190 2012/2022 Fixed 2.250 2.344 EUR 1,000 1,066 2013/2018 Fixed 2.750 2.855 SEK 1,150 125 2013/2018 Floating Stibor 3M+1.0 SEK 3,000 326 2013/2023 Floating Stibor 3M+1.13 SEK 1,000 109 2013/2043 Fixed 3.500 3.719 EUR 100 96Total outstanding carrying amount 31 December 2015 4,094
1) EMTN = Euro Medium Term Note
Basis of preparation Risks Income statement Balance sheet Off balance sheet items Group structure and related parties
Proposal for the distribution of earnings Auditor’s reportPrimary statements Quarterly financial informationParent company financial statements Investor informationOperating and financial review Key figuresNotes
78

12345678910111213141516171819202122232425262728293031323334353637383940414243
29 Deferred income taxesAccounting policies
The tax currently payable is based on taxable profit for the year. Taxable profit differs from profit as reported in the consolidated income statement because of items of income or expense that are taxable or deductible in other years and items that are never taxable or deductible. The Group's liability for current tax is calculated using tax rates that have been enacted or substantively enacted by the end of the reporting period.
Deferred tax is provided in full, using the liability method, on temporary differences arising between the tax bases of assets and liabilities and their carrying amounts in the consolidated financial statements. However, if the deferred tax arises from initial recognition of an asset or liability in a transaction other than a business combination that at the time of the transaction affects neither accounting nor taxable profit or loss, it is not accounted for. Deferred tax is determined using tax rates (and laws) that have been enacted or substantially enacted by the closing date and are expected to apply when the related deferred tax asset is realised or the deferred tax liability is settled.
Deferred tax assets are recognised to the extent that it is probable that future taxable profit will be available against which the temporary differences can be utilised. Deferred tax assets are set off against deferred tax liabilities if they relate to income taxes levied by the same taxation authority.
Deferred tax is provided on temporary differences arising from investments in subsidiaries, associates and joint ventures, except where the timing of the reversal of the temporary difference is controlled by the Group, and it is probable that the temporary difference will not reverse in the foreseeable future.
Critical accounting estimates: Assumptions and estimates regarding future tax consequencesFortum has deferred tax assets and liabilities which are expected to be realised through the income statement over the extended periods of time in the future. In calculating the deferred tax items, Fortum is required to make certain assumptions and estimates regarding the future tax consequences attributable to differences between the carrying amounts of assets and liabilities as recorded in the financial statements and their tax basis.
Assumptions made include the expectation that future operating performance for subsidiaries will be consistent with historical levels of operating results, recoverability periods for tax loss carry-forwards will not change, and that existing tax laws and rates will remain unchanged into foreseeable future. Fortum believes that it has prudent assumptions in developing its deferred tax balances.
The Group recognises liabilities for anticipated tax dispute issues based on estimates of whether additional taxes will be due. Where the final outcome of these matters is different from the amounts that were initially recorded, such differences will impact the income tax and deferred tax provisions in the period in which such determination is made.
If the actual final outcome (regarding tax disputes) would differ negatively from management's estimates with 10%, the Group would need to increase the income tax liability by EUR 43 million as of 31 December 2015.
Deferred taxes in balance sheet
EUR million2015 2014
1 Jan Change 31 Dec 1 Jan Change 31 DecBS Deferred tax assets 98 -18 80 126 -28 98BS Deferred tax liabilities -1,159 676 -483 -1,338 179 -1,159Net deferred taxes -1,061 658 -404 -1,212 151 -1,061
Deferred income tax assets and liabilities are offset when there is a legally enforceable right to offset current tax assets against current tax liabilities and when the deferred income taxes relate to the same fiscal authority.
Movement in deferred tax assets and liabilities 2015
EUR million 1 Jan 2015Charged to
income statementCharged to other
comprehensive incomeExchange rate differences,
reclassifications and other changes Acquisitions and disposals 31 Dec 2015Property, plant and equipment -1,150 96 7 496 -551Pension obligations 28 3 -20 11Provisions 1 13 14Derivative financial instruments -40 13 -13 2 -5 -42Tax losses and tax credits carry-forward 70 71 4 146Other 30 -12 18Net deferred taxes -1,061 184 -32 13 491 -404
Basis of preparation Risks Income statement Balance sheet Off balance sheet items Group structure and related parties
Proposal for the distribution of earnings Auditor’s reportPrimary statements Quarterly financial informationParent company financial statements Investor informationOperating and financial review Key figuresNotes
79

12345678910111213141516171819202122232425262728293031323334353637383940414243
2015 2014EUR million Tax losses Deferred tax asset Tax losses Deferred tax assetLosses without expiration date 470 97 29 4Losses with expiration date 217 49 260 66Total 687 146 289 70
Deferred tax assets of EUR 50 million (2014: 50) have not been recognised in the consolidated financial statements, because the realisation is not probable. The major part of the unrecognised tax asset relates to loss carry-forwards that are unlikely to be used in the foreseeable future.
Tax loss carry-forwards increased in 2015 mainly because of the taxable loss in Sweden, which was mainly due to the impairments related to early closure of O1 and O2 units in Oskarshamn.
Retained earnings when distributed as dividends are subject to withholding tax (Russia) or distribution tax (Estonia). Provision has been made for these taxes only to extent that it is expected that these earnings will be remitted in the foreseeable future. Deferred income tax liabilities of EUR 13 million (2014: 8) have been recognised for the withholding tax and other taxes that would be payable on the distributions.
Deferred tax assets and liabilities from acquisitions and disposals in 2015 relate to the sale of Swedish electricity distribution business. Also during 2015 Swedish entities released a major part of the deferred tax liability related to property, plant and equipment. Additionally, deferred tax asset was recognized for the taxable loss in Sweden, which was mainly due to the write-down related to early closure of O1 and O2 units in Oskarshamn. This deferred tax asset can be used against future profits. The change in deferred taxes in income statement is positive mainly due to the above mentioned release in the deferred tax liability and increase in the deferred tax asset related to taxable loss in Sweden.
Movement in deferred tax assets and liabilities 2014
EUR million 1 Jan 2014Charged to
income statementCharged to other
comprehensive income
Exchange rate differences, reclassifications and other
changes Acquisitions and disposals 31 Dec 2014Property, plant and equipment -1,264 -10 118 5 -1,150Pension obligations 7 1 22 -2 28Provisions 24 -23 1Derivative financial instruments -46 -1 7 -40Tax losses and tax credits carry-forward 80 -7 -3 70Other -13 44 -1 30Net deferred taxes -1,212 5 29 115 2 -1,061
Change in deferred tax is mainly coming from exchange rate differences in Russia and in Sweden, EUR 115 million.
Deferred income tax assets recognised for tax loss carry-forwards Deferred income tax assets are recognised for tax loss carry-forward to the extent that realisation of the related tax benefit through future profits is probable. The recognised tax assets relate to losses carry-forward with no expiration date and partly with expiry date as described below.
Basis of preparation Risks Income statement Balance sheet Off balance sheet items Group structure and related parties
Proposal for the distribution of earnings Auditor’s reportPrimary statements Quarterly financial informationParent company financial statements Investor informationOperating and financial review Key figuresNotes
80
12345678910111213141516171819202122232425262728293031323334353637383940414243
Accounting policies
Fortum owns Loviisa nuclear power plant in Finland. In Fortum's consolidated balance sheet, Share in the State Nuclear Waste Management Fund and the Nuclear provisions relate to Loviisa nuclear power plant. Fortum's nuclear related provisions and the related part of the State Nuclear Waste Management Fund are both presented separately in the balance sheet. Fortum's share in the State Nuclear Waste Management Fund is accounted for according to IFRIC 5, Rights to interests arising from decommissioning, restoration and environmental rehabilitation funds which states that the fund assets are measured at the lower of fair value or the value of the related liabilities since Fortum does not have control or joint control over the State Nuclear Waste Management Fund. The Nuclear Waste Management Fund is managed by governmental authorities. The related provisions are the provision for decommissioning and the provision for disposal of spent fuel.
The fair values of the provisions are calculated according to IAS 37 by discounting the separate future cash flows, which are based on estimated future costs and actions already taken. The initial net present value of the provision for decommissioning (at the time of commissioning the nuclear power plant) has been included in the investment cost and is depreciated over the estimated operating time of the nuclear power plant. Changes in the technical plans etc., which have an impact on the future cash flow of the estimated costs for decommissioning, are accounted for by discounting the additional costs to the current point in time. The increased asset retirement cost due to the increased provision is added to property, plant and equipment and depreciated over the remaining estimated operating time of the nuclear power plant.
The provision for spent fuel covers the future disposal costs for fuel used until the end of the accounting period. Costs for disposal of spent fuel are expensed during the operating time based on fuel usage. The impact of the possible changes in the estimated future cash flow for related costs is recognised immediately in the income statement based on the accumulated amount of fuel used until the end of the accounting period. The related interest costs due to unwinding of the provision, for the period during which the spent fuel provision has been accumulated and present point in time, are also recognised immediately in the income statement.
The timing factor is taken into account by recognising the interest expense related to discounting the nuclear provisions. The interest on the State Nuclear Waste Management Fund assets is presented as financial income.
Fortum's actual share of the State Nuclear Waste Management Fund, related to Loviisa nuclear power plant, is higher than the carrying value of the Fund in the balance sheet. The legal nuclear liability should, according to the Finnish Nuclear Energy Act, be fully covered by payments and guarantees to the State Nuclear Waste Management Fund. The legal liability is not discounted while the provisions are, and since the future cash flow is spread over 100 years, the difference between the legal liability and the provisions are material.
The annual fee to the Fund is based on changes in the legal liability, the interest income generated in the State Nuclear Waste Management Fund and incurred costs of taken actions.
Fortum also has minority interests in nuclear power companies, i.e. Teollisuuden Voima Oyj (TVO) in Finland and OKG Aktiebolag (OKG) and Forsmarks Kraftgrupp AB (Forsmark) in Sweden. The minority shareholdings are classified as associated companies and joint ventures and are consolidated with equity method. Both the Finnish and the Swedish companies are non-profit making, i.e. electricity production is invoiced to the owners at cost including depreciations, interest costs and production taxes accounted for according to local GAAP. Accounting policies of the associates regarding nuclear assets and liabilities have been changed where necessary to ensure consistency with the policies adopted by the Group.
Critical accounting estimates: Assumptions made when estimating provisions related to nuclear productionThe provision for future obligations for nuclear waste management including decommissioning of Fortum's nuclear power plant and related spent fuel is based on long-term cash flow forecasts of estimated future costs. The main assumptions are technical plans, timing, cost estimates and discount rate. The technical plans, timing and cost estimates are approved by governmental authorities.
Any changes in the assumed discount rate would affect the provision. If the discount rate used would be lowered, the provision would increase. Fortum has contributed cash to the State Nuclear Waste Management Fund based on a non-discounted legal liability, which leads to that the increase in provision would be offset by an increase in the recorded share of Fortum's part of the State Nuclear Waste Management Fund in the balance sheet. The total effect on the income statement would be positive since the decommissioning part of the provision is treated as an asset retirement obligation. This situation will prevail as long as the legal obligation to contribute cash to the State Nuclear Waste Management Fund is based on a non-discounted liability and IFRS is limiting the carrying value of the assets to the amount of the provision since Fortum does not have control or joint control over the fund.
Based on the Nuclear Energy Act in Finland, Fortum has a legal obligation to fully fund the legal liability decided by the governmental authorities, for decommissioning of the power plant and disposal of spent fuel through the State Nuclear Waste Management Fund.
Both in Finland and in Sweden nuclear operators are legally obligated for the decommissioning of the plants and the disposal of spent fuel (nuclear waste management). In both countries the nuclear operators are obligated to secure the funding of nuclear waste management by paying to government operated nuclear waste funds. The nuclear operators also have to give securities to guarantee that sufficient funds exist to cover future expenses of decommissioning of the power plant and disposal of spent fuel.
30 Nuclear related assets and liabilities
Basis of preparation Risks Income statement Balance sheet Off balance sheet items Group structure and related parties
Proposal for the distribution of earnings Auditor’s reportPrimary statements Quarterly financial informationParent company financial statements Investor informationOperating and financial review Key figuresNotes
81

12345678910111213141516171819202122232425262728293031323334353637383940414243
The carrying value of the Fund in the balance sheet cannot exceed the carrying value of the nuclear provisions according to IFRIC Interpretation 5. The Fund is from an IFRS perspective overfunded with EUR 273 million, since Fortum's share of the Fund on 31 December 2015 was EUR 1,083 million and the carrying value in the balance sheet was EUR 810 million.
Fortum's share of the Finnish Nuclear Waste Management Fund in Fortum's balance sheet can in maximum be equal to the amount of the provisions according to IFRS. As long as the Fund is overfunded from an IFRS perspective, the effects to operating profit from this adjustment will be positive if the provisions increase more than the Fund and negative if actual value of the fund increases more than the provisions. This accounting effect is not included in Comparable operating profit in Fortum financial reporting. For more information see Note 6 Other items affecting comparability.
Borrowing from the State Nuclear Waste Management FundParticipants in the Finnish State Nuclear Waste Management Fund are allowed to borrow from the fund according to certain rules. Fortum uses the right to borrow back and has pledged shares in Kemijoki Oy as security for the loans. The loans are renewed yearly. See Note 28 Interest-bearing liabilities and Note 35 Pledged assets.
30.2 Nuclear power plants in associated companies and joint venturesOKG, Forsmark and TVO are non-profit making companies, i.e. electricity production is invoiced to the owners at cost including depreciations, interest costs and production taxes. Invoiced cost is accounted according to local GAAP. In addition to the invoiced electricity production cost, Fortum makes IFRS adjustments to comply with Fortum's accounting principles. These adjustments include also Fortum's share of the companies' nuclear waste funds and nuclear provisions.
The tables below present the 100% figures relating to nuclear funds and provisions for the companies as well as Fortum's net share.
TVO's total nuclear related assets and liabilities (100%)EUR million 2015 2014Carrying values in TVO's balance sheetNuclear provisions 971 930Share of the State Nuclear Waste Management Fund 971 930
of which Fortum's net share consolidated with equity method 0 0
TVO's legal liability and actual share of the State Nuclear Waste Management Fund Liability for nuclear waste management according to the Nuclear Energy Act 1,369 1,349Share of the State Nuclear Waste Management Fund 1,358 1,345Share of the fund not recognised in the balance sheet 387 415
TVO's legal liability and contribution to the fund are based on same principles as described above for Loviisa nuclear power plant.
TVO's share of the Finnish State Nuclear Waste Management Fund is from an IFRS perspective overfunded with EUR 387 million (of which Fortum's share EUR 103 million), since TVO's share of the
30.1 Nuclear related assets and liabilities for 100% owned nuclear power plant, LoviisaEUR million 2015 2014Carrying values in the balance sheetBS Nuclear provisions 810 774BS Fortum's share of the State Nuclear Waste Management Fund 810 774 Legal liability and actual share of the State Nuclear Waste Management FundLiability for nuclear waste management according to the Nuclear Energy Act 1,094 1,084Funding obligation target 1,094 1,074Fortum's share of the State Nuclear Waste Management Fund 1,083 1,039Share of the fund not recognised in the balance sheet 273 265
Legal liability for Loviisa nuclear power plant The legal liability on 31 December 2015, decided by the Ministry of Employment and Economy in December 2015, was EUR 1,094 million.
The legal liability is based on a cost estimate, which is done every year, and a technical plan, which is made every third year. The current technical plan was updated in 2013. Following the update of the technical plan in 2013, the liability increased due to updated cost estimates related to interim and final storage of spent fuel. The legal liability is determined by assuming that the decommissioning would start at the beginning of the year following the assessment year.
Fortum's share in the State Nuclear Waste Management FundAccording to Nuclear Energy Act, Fortum is obligated to contribute funds in full to the State Nuclear Waste Management Fund to cover the legal liability. Fortum contributes funds to the Finnish State Nuclear Waste Management Fund based on the yearly funding obligation target decided by the governmental authorities in December in connection with the decision of size of the legal liability. The current funding obligation target decided in December 2015 is EUR 1,094 million.
Nuclear provisions EUR million 2015 2014BS 1 January 774 744Additional provisions 10 11Used during the year -18 -24Unwinding of discount 44 43BS 31 December 810 774Fortum's share in the State Nuclear Waste Management Fund 810 774
Nuclear provision and fund accounted according to IFRS Nuclear provisions include the provision for decommissioning and the provision for disposal of spent fuel. The carrying value of the nuclear provisions, calculated according to IAS 37, increased by EUR 36 million compared to 31 December 2014, totaling EUR 810 million on 31 December 2015. The provisions are based on the same cash flows for future costs as the legal liability, but based on the estimated future timing of the expenditures. The main reason for the difference between the carrying value of the provision and the legal liability is the fact that the legal liability is not discounted to net present value.
Basis of preparation Risks Income statement Balance sheet Off balance sheet items Group structure and related parties
Proposal for the distribution of earnings Auditor’s reportPrimary statements Quarterly financial informationParent company financial statements Investor informationOperating and financial review Key figuresNotes
82

12345678910111213141516171819202122232425262728293031323334353637383940414243
Fund on 31 December 2015 was EUR 1,358 million and the carrying value in the balance sheet was EUR 971 million.
Participants in the Finnish State Nuclear Waste Management Fund are allowed to borrow from the fund according to certain rules. Fortum is using the right to reborrow funds through TVO based on its ownership. See more information in Note 28 Interest-bearing liabilities.
OKG's and Forsmark's total nuclear related assets and liabilities (100%)EUR million 2015 2014OKG's and Forsmark's nuclear related assets and liabilities 1)
Nuclear provisions 3,210 3,143Share in the State Nuclear Waste Management Fund 3,025 2,790Net amount -185 -353
of which Fortum's net share consolidated with equity method -71 -1381) Accounted for according to Fortum's accounting principles. Companies' statutory financial statements are not prepared according to IFRS.
In Sweden Svensk Kärnbränslehantering AB (SKB), a company owned by the nuclear operators, takes care of all nuclear waste management related activities on behalf of nuclear operators. SKB receives its funding from the Swedish State Nuclear Waste Management Fund, which in turn is financed by the nuclear operators.
In addition to nuclear waste fees nuclear power companies provide guarantees for any uncovered liability and unexpected events.
For more information regarding Fortum's guarantees given on behalf of nuclear associated companies, see Note 38 Contingent liabilities.
Nuclear waste fees and guarantees are updated every third year by governmental decision after a proposal from Swedish Radiation Safety Authority (SSM). Proposal is based on cost estimates done by SKB. Currently the fees and guarantees are decided for years 2015–2017. Nuclear waste fees are based on future costs with the assumed lifetime of 40 years for each unit of a nuclear power plant.
31 Other provisionsAccounting policies
Provisions for environmental restorations, asset retirement obligations, restructuring costs and legal claims are recognised when the Group has a present legal or constructive obligation as a result of past events to a third party, it is probable that an outflow of resources will be required to settle the obligation and the amount can be reliably estimated.
Provisions are measured at the present value of the expenditures expected to be required to settle the obligation using a pre-tax rate that reflects current market assessments of the time value of money and the risks specific to the obligation. The increase in the provision due to the passage of time is recognised as interest expense.
Environmental provisionsEnvironmental provisions are recognised, based on current interpretation of environmental laws and regulations, when it is probable that a present obligation has arisen and the amount of such liability can be reliably estimated. Environmental expenditures resulting from the remediation of an existing condition caused by past operations, and which do contribute to current or future revenues, are expensed as incurred.
Asset retirement obligationsAsset retirement obligation is recognised either when there is a contractual obligation towards a third party or a legal obligation and the obligation amount can be estimated reliably. Obligating event is e.g. when a plant is built on a leased land with an obligation to dismantle and remove the asset in the future or when a legal obligation towards Fortum changes. The asset retirement obligation is recognised as part of the cost of an item of property and plant when the asset is put in service or when contamination occurs. The costs will be depreciated over the remainder of the asset's useful life.
Restructuring provisionsA restructuring provision is recognised when the Group has developed a detailed formal plan for the restructuring and has raised a valid expectation in those affected that it will carry out the restructuring by starting to implement the plan or announcing its main features to those affected by it. The measurement of a restructuring provision includes only the direct expenditures arising from the restructuring, which are those amounts that are both necessarily entailed by the restructuring and not associated with the ongoing activities of the entity. Restructuring provisions comprise mainly employee termination payments and lease termination costs.
Critical accounting estimates: Assumptions made when estimating provisionsProvisions for present obligations require management to assess the best estimate of the expenditure needed to settle the present obligation at the end of the reporting period. The actual amount and timing of the expenditure might differ from estimates made.
Basis of preparation Risks Income statement Balance sheet Off balance sheet items Group structure and related parties
Proposal for the distribution of earnings Auditor’s reportPrimary statements Quarterly financial informationParent company financial statements Investor informationOperating and financial review Key figuresNotes
83
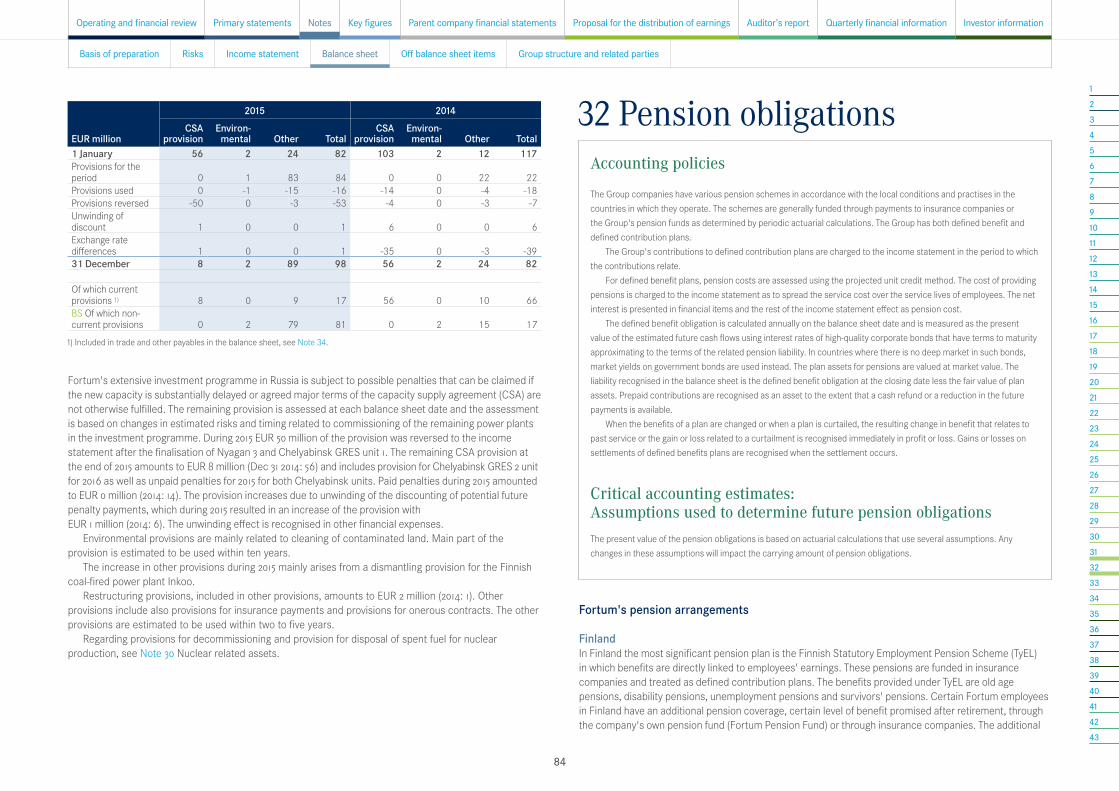
12345678910111213141516171819202122232425262728293031323334353637383940414243
Fortum's extensive investment programme in Russia is subject to possible penalties that can be claimed if the new capacity is substantially delayed or agreed major terms of the capacity supply agreement (CSA) are not otherwise fulfilled. The remaining provision is assessed at each balance sheet date and the assessment is based on changes in estimated risks and timing related to commissioning of the remaining power plants in the investment programme. During 2015 EUR 50 million of the provision was reversed to the income statement after the finalisation of Nyagan 3 and Chelyabinsk GRES unit 1. The remaining CSA provision at the end of 2015 amounts to EUR 8 million (Dec 31 2014: 56) and includes provision for Chelyabinsk GRES 2 unit for 2016 as well as unpaid penalties for 2015 for both Chelyabinsk units. Paid penalties during 2015 amounted to EUR 0 million (2014: 14). The provision increases due to unwinding of the discounting of potential future penalty payments, which during 2015 resulted in an increase of the provision with EUR 1 million (2014: 6). The unwinding effect is recognised in other financial expenses.
Environmental provisions are mainly related to cleaning of contaminated land. Main part of the provision is estimated to be used within ten years.
The increase in other provisions during 2015 mainly arises from a dismantling provision for the Finnish coal-fired power plant Inkoo.
Restructuring provisions, included in other provisions, amounts to EUR 2 million (2014: 1). Other provisions include also provisions for insurance payments and provisions for onerous contracts. The other provisions are estimated to be used within two to five years.
Regarding provisions for decommissioning and provision for disposal of spent fuel for nuclear production, see Note 30 Nuclear related assets.
EUR million
2015 2014CSA
provisionEnviron- mental Other Total
CSA provision
Environ- mental Other Total
1 January 56 2 24 82 103 2 12 117Provisions for the period 0 1 83 84 0 0 22 22Provisions used 0 -1 -15 -16 -14 0 -4 -18Provisions reversed -50 0 -3 -53 -4 0 -3 -7Unwinding of discount 1 0 0 1 6 0 0 6Exchange rate differences 1 0 0 1 -35 0 -3 -3931 December 8 2 89 98 56 2 24 82 Of which current provisions 1) 8 0 9 17 56 0 10 66BS Of which non-current provisions 0 2 79 81 0 2 15 17
1) Included in trade and other payables in the balance sheet, see Note 34.
32 Pension obligationsAccounting policies
The Group companies have various pension schemes in accordance with the local conditions and practises in the countries in which they operate. The schemes are generally funded through payments to insurance companies or the Group's pension funds as determined by periodic actuarial calculations. The Group has both defined benefit and defined contribution plans.
The Group's contributions to defined contribution plans are charged to the income statement in the period to which the contributions relate.
For defined benefit plans, pension costs are assessed using the projected unit credit method. The cost of providing pensions is charged to the income statement as to spread the service cost over the service lives of employees. The net interest is presented in financial items and the rest of the income statement effect as pension cost.
The defined benefit obligation is calculated annually on the balance sheet date and is measured as the present value of the estimated future cash flows using interest rates of high-quality corporate bonds that have terms to maturity approximating to the terms of the related pension liability. In countries where there is no deep market in such bonds, market yields on government bonds are used instead. The plan assets for pensions are valued at market value. The liability recognised in the balance sheet is the defined benefit obligation at the closing date less the fair value of plan assets. Prepaid contributions are recognised as an asset to the extent that a cash refund or a reduction in the future payments is available.
When the benefits of a plan are changed or when a plan is curtailed, the resulting change in benefit that relates to past service or the gain or loss related to a curtailment is recognised immediately in profit or loss. Gains or losses on settlements of defined benefits plans are recognised when the settlement occurs.
Critical accounting estimates: Assumptions used to determine future pension obligationsThe present value of the pension obligations is based on actuarial calculations that use several assumptions. Any changes in these assumptions will impact the carrying amount of pension obligations.
Fortum's pension arrangements
FinlandIn Finland the most significant pension plan is the Finnish Statutory Employment Pension Scheme (TyEL) in which benefits are directly linked to employees' earnings. These pensions are funded in insurance companies and treated as defined contribution plans. The benefits provided under TyEL are old age pensions, disability pensions, unemployment pensions and survivors' pensions. Certain Fortum employees in Finland have an additional pension coverage, certain level of benefit promised after retirement, through the company's own pension fund (Fortum Pension Fund) or through insurance companies. The additional
Basis of preparation Risks Income statement Balance sheet Off balance sheet items Group structure and related parties
Proposal for the distribution of earnings Auditor’s reportPrimary statements Quarterly financial informationParent company financial statements Investor informationOperating and financial review Key figuresNotes
84
12345678910111213141516171819202122232425262728293031323334353637383940414243
including pension benefits from the National Insurance Scheme (Folketrygden). The schemes are fully funded within the rules set out in the Norwegian insurance legislation.
In other countries the pension arrangements are done in accordance with the local legislation and practice, mostly being defined contribution plans.
Main risks relating to defined benefit plans – Sweden and Finland
Overall risksSweden: As the pension fund is separated from the funding companies Fortum is not obliged to make additional contributions to the pension fund in any case of deficit. However if the assets decrease to a level lower than the liability according to Swedish GAAP, Fortum's credit insurance cost from PRI will increase.
Finland: If the return of fund's assets is not enough to cover the raise in liability and benefit payments over the financial year then the employer funds the deficit with contributions unless the fund has sufficient equity.
Change in discount rateSweden: The discount rate which is used to calculate the defined benefit obligation (according to IFRS) is derived from market rates on Swedish covered bonds with an equivalent duration to the pension obligation, and the company therefore has a risk in the development of the bond market. Should the market rates decrease then the liability increases.
Finland: The discount rate which is used to calculate the defined benefit obligation (according to IFRS) depends on the value of corporate bond yields as at reporting date. A decrease in yields increases the benefit obligation that is offset by increase in the value of fixed income holdings.
Investment and volatility riskSweden: The pension fund operation is regulated by law and supervised by central administrative authorities (Finansinspektionen and the County Administrative Board). The pension fund board decides yearly on a policy for asset allocation and a risk management model that stipulates a maximum acceptable market value decrease of the assets. The major assets are fixed income instruments, stock index funds and cash.
Finland: The pension fund's board accepts yearly an Investment Plan, which is based on an external asset-liability analysis. The assets are allocated to stocks and stock funds, fixed income instruments and real estate. The investments are diversified into different asset classes and to different asset managers taking into account the regulation of the Financial Supervisory Authority. The real estate investments consist mainly of the Fortum headquarters, rented by Fortum Oyj.
Risks relating to assumptions usedActuarial calculations use assumptions for future inflation and salary levels and longevity. Should the actual outcome differ from these assumptions, this might lead to higher liability.
pensions through insurance companies provide old age pension and funeral grant and Fortum Pension Fund is providing old age pension, early old age benefit, disability pension, survivors' pension and funeral grant.
The Fortum Pension Fund is a closed fund managed by a Board, consisting of both employers' and employees' representatives. The Fund is operating under regulation from Financial Supervisory Authority (FSA). The liability has to be fully covered according to the regulations. The national benefit obligation related to the defined benefit plans is calculated so that the promised benefit is fully funded until retirement. After retirement the benefits payable are indexed yearly with TyEL-index. The promised benefit is defined in the rules of the Fund, mostly 66% at a maximum of the salary basis. The salary basis is an average of the ten last years' salaries, which are indexed with a common salary index to the accounting year.
SwedenIn Sweden the Group operates several defined benefit and defined contribution plans like the general ITP-pension plan and the PA-KL and PA-KFS plans that are eligible for employees within companies formerly owned by municipalities. The defined benefit plans are fully funded and have partly been financed through Fortum’s own pension fund and partly through insurance premiums. The pension arrangements comprise normal retirement pension, complementary retirement pensions, survivors' pension and disability pension. The most significant pension plan is the ITP-plan for white-collar employees in permanent employment (or temporary employees after a certain waiting period), who fulfill the age conditions. To qualify for a full pension the employee must have a projected period of pensionable service, from the date of entry until retirement age, of at least 30 years.
The Swedish pension fund is managed by a Board, consisting of both employers' and employees' representatives. The fund is operating under regulation from Swedish Financial Supervisory Authority and the County Administrative Board and governed by Swedish law (no. 1967:531). The fund constitutes a security for the employers' defined benefit pension plan liability and the fund has no obligations in relation to pension payments. The employer must have a credit insurance from PRI Pensionsgaranti Mutual Insurance Company for the liability. The liability must not be fully covered by the fund according to the regulations.
The part of the ITP multiemployer pension plan that is secured by paying pension premiums to Alecta, in Fortum’s case the collective family pension, is accounted for as a defined contribution plan due to that there is no consistent and reliable basis to allocate assets or liabilities to the participating entities within the ITP insurance. The reason for this is that it is not possible to determine from the terms of the plan to which extent a surplus or a deficit will affect future contributions.
Pension arrangements in other countriesPension arrangements in Russia include payments made to the state pension fund. These arrangements are treated as defined contribution plans. The Russian (in addition to the defined contribution plans) and Polish companies participate in certain defined benefit plans, defined by collective agreements, which are unfunded and where the company meets the benefit payment obligation as it falls due. The benefits provided under these arrangements include, in addition to pension payments, one-time benefits paid in case of employee mortality or disability as well as lump sum payments for anniversary and financial support to honored workers and pensioners.
The Norwegian companies are part of schemes that are common for municipalities in Norway. These are defined benefit pension plans and provide old age pensions, disability pension and survivor’s pension,
Basis of preparation Risks Income statement Balance sheet Off balance sheet items Group structure and related parties
Proposal for the distribution of earnings Auditor’s reportPrimary statements Quarterly financial informationParent company financial statements Investor informationOperating and financial review Key figuresNotes
85

12345678910111213141516171819202122232425262728293031323334353637383940414243
Movement in the net defined benefit liabilityDefined benefit
obligationFair value
of plan assetsNet defined benefit asset(-)/liability(+)
EUR million 2015 2014 2015 2014 2015 2014Balance at 1 January 540 466 -400 -415 140 51Included in profit or loss 1)
Current service cost 9 7 0 0 9 7Past service cost -5 1 2 0 -3 1Settlements -3 -7 2 6 -1 -1Net interest 2) 9 14 -6 -13 3 1
10 15 -3 -7 7 8Included in OCIRemeasurement gains(-)/losses(+) -65 115 -14 -15 -79 101
Actuarial gains/losses arising from changes in demographic assumptions 3) 7 0 7 0Actuarial gains/losses arising from changes in financial assumptions -65 120 -65 120Actuarial gains/losses arising from experience adjustments -7 -4 -7 -4Return on plan assets (excluding amounts included in net interest expense) -14 -15 -14 -15
Exchange rate differences 3 -12 -3 9 0 -3-63 103 -16 -6 -79 97
OtherContributions paid by the employer -2 -2 -2 -2Benefits paid -16 -17 13 13 -3 -4Disposals of subsidiary companies -23 -27 23 17 0 -10Balance at 31 December 448 540 -384 -400 64 140Present value of funded defined obligation 444 532Fair value of plan assets -384 -400Funded status 60 133Present value of unfunded obligation 4) 4 7Net liability arising from defined benefit obligation 64 140Pension assets included in other non-current assets in the balance sheet 1 0BS Pension obligations in the balance sheet 65 140
1) Items in the profit and loss for 2014 include items related to discontinued operations.
2) Net interest is presented among financial items in income statement, the rest of costs related to defined benefit plans are included in staff costs (row defined benefits plans and part of the amount reduction due to insured defined benefit obligation in the staff cost specification in Note 11 Employee benefits).
3) The mortality rates for Finland and Sweden used in the calculations for year 2015 have been changed. Finnish and Swedish pension insurance companies will change the mortality rate at 31 December 2016. The new mortality rate is already defined and because it is the best estimate of the future mortality, Fortum has decided to use them already now.
4) The unfunded obligation relates to arrangements in Russia and Poland.
At the end of 2015 a total of 1,103 (2014: 1,230) Fortum employees are included in defined benefit plans providing pension benefits. During 2015 pensions or related benefits were paid to a total of 2,855 (2014: 2,929) persons.
Contributions expected to be paid during year 2016 are EUR 2 million.
Fair value of plan assetsEUR million 2015 2014Equity instruments 128 129Debt instruments 136 133Cash and cash equivalents 33 38Real estate, of which the total EUR 65 million (2014: 67) occupied by the Group 68 72Company's own ordinary shares 0 5Other assets 18 23Total 384 400
When the pension plan has been financed through an insurance company, a specification of the plan assets has not been available. In these cases the fair value of plan assets has been included in other assets.
The actual return on plan assets in Finland and Sweden totalled EUR 20 million (2014: 27).
Amounts recognised in the balance sheet by country 2015
EUR million Finland SwedenOther
countries TotalPresent value of funded obligations 302 134 8 444Fair value of plan assets -265 -114 -5 -384Deficit(+)/surplus(-) 37 20 3 60Present value of unfunded obligations 4 4Net asset(-)/liability(+) in the balance sheet 37 20 7 64Pension assets included in non-current assets 0 0 1 1BS Pension obligations in the balance sheet 37 20 7 65
Amounts recognised in the balance sheet by country 2014
EUR million Finland SwedenOther
countries TotalPresent value of funded obligations 354 170 9 532Fair value of plan assets -264 -130 -5 -400Deficit(+)/surplus(-) 90 39 3 133Present value of unfunded obligations 7 7Net asset(-)/liability(+) in the balance sheet 90 39 11 140Pension assets included in non-current assets 0 0 0 0BS Pension obligations in the balance sheet 90 39 11 140
Basis of preparation Risks Income statement Balance sheet Off balance sheet items Group structure and related parties
Proposal for the distribution of earnings Auditor’s reportPrimary statements Quarterly financial informationParent company financial statements Investor informationOperating and financial review Key figuresNotes
86

12345678910111213141516171819202122232425262728293031323334353637383940414243
The principal actuarial assumptions used2015 2014
Finland Sweden RussiaOther
countries Finland Sweden RussiaOther
countriesDiscount rate, % 2.07 3.30 10.00 2.31 1.30 2.50 9.00 3.00Future salary increases, % 2.20 3.00 6.50 2.50 2.20 3.00 7.50 3.25Future pension increases, % 2.10 2.00 6.50 1.48 2.10 2.00 6.50 2.23Rate of inflation, % 2.00 2.00 6.50 1.75 2.00 2.00 6.50 1.75
The discount rate in Finland is based on high quality European corporate bonds with maturity that best reflects the estimated term of the defined benefit pension plans. The discount rate in Sweden and Norway is based on yields on Swedish respectively Norwegian covered bonds with maturity that best reflects the estimated term of the defined benefit pension plans. The covered bonds in Sweden and Norway are considered high quality bonds as they are secured with assets. The discount rate in Russia is based on the yield of long-term government bonds which are consistent with the currency and the estimated term of the post-employment benefit obligations.
The life expectancy is the expected number of years of life remaining at a given age:Longevity at age 65 Finland Sweden45 - male 22.0 23.445 - female 27.0 25.365 - male 21.4 21.765 - female 25.4 24.2
The discount, inflation and salary growth rates used are the key assumptions used when calculating defined benefit obligations. Effects of 0.5 percentage point change in the rates to the defined benefit obligation on 31 December 2015, holding all other assumptions stable, are presented in the table below.
Sensitivity of defined benefit obligation to changes in assumptionsImpact to
the pension obligation increase+/decrease-
Change in the assumption Finland Sweden0.5% increase in discount rate -7% -10%0.5% decrease in discount rate 8% 12%0.5% increase in benefit 7% 8%0.5% decrease in benefit -6% -7%0.5% increase in salary growth rate 1% 3%0.5% decrease in salary growth rate -1% -3%
The methods used in preparing the sensitivity analysis did not change compared to the previous period. Change in mortality basis so that life expectancy increases by one year would increase the net liability in Finland and Sweden with EUR 18 million (30.9%).
Maturity profile of the undiscounted defined benefit obligation for Finland and Sweden as of 31 December 2015EUR million Future benefit paymentsMaturity under 1 year 12Maturity between 1 and 5 years 52Maturity between 5 and 10 years 69Maturity between 10 and 20 years 125Maturity between 20 and 30 years 94Maturity over 30 years 55
The weighted average duration of defined benefit obligation in Finland and Sweden at the end of year 2015 is 16.0 years.
Basis of preparation Risks Income statement Balance sheet Off balance sheet items Group structure and related parties
Proposal for the distribution of earnings Auditor’s reportPrimary statements Quarterly financial informationParent company financial statements Investor informationOperating and financial review Key figuresNotes
87
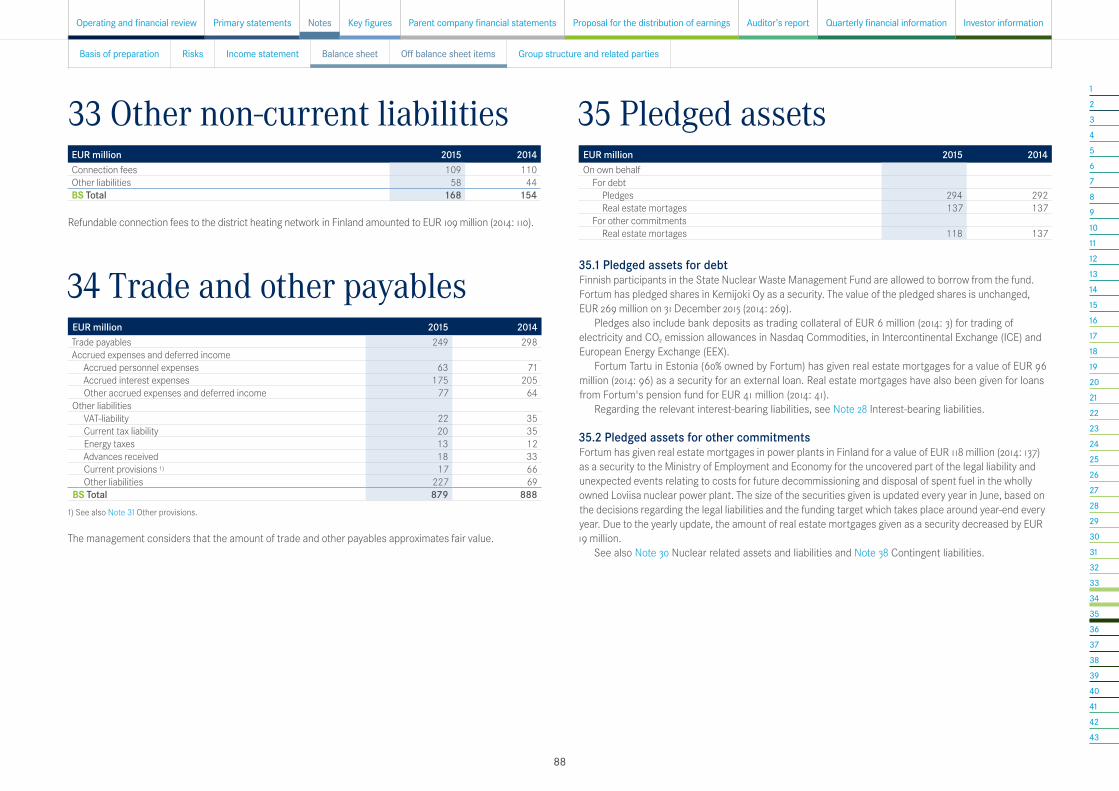
12345678910111213141516171819202122232425262728293031323334353637383940414243
33 Other non-current liabilitiesEUR million 2015 2014Connection fees 109 110Other liabilities 58 44BS Total 168 154
Refundable connection fees to the district heating network in Finland amounted to EUR 109 million (2014: 110).
34 Trade and other payablesEUR million 2015 2014Trade payables 249 298Accrued expenses and deferred income
Accrued personnel expenses 63 71Accrued interest expenses 175 205Other accrued expenses and deferred income 77 64
Other liabilitiesVAT-liability 22 35Current tax liability 20 35Energy taxes 13 12Advances received 18 33Current provisions 1) 17 66Other liabilities 227 69
BS Total 879 8881) See also Note 31 Other provisions.
The management considers that the amount of trade and other payables approximates fair value.
35 Pledged assetsEUR million 2015 2014On own behalf
For debt Pledges 294 292Real estate mortages 137 137
For other commitments Real estate mortages 118 137
35.1 Pledged assets for debtFinnish participants in the State Nuclear Waste Management Fund are allowed to borrow from the fund. Fortum has pledged shares in Kemijoki Oy as a security. The value of the pledged shares is unchanged, EUR 269 million on 31 December 2015 (2014: 269).
Pledges also include bank deposits as trading collateral of EUR 6 million (2014: 3) for trading of electricity and CO2 emission allowances in Nasdaq Commodities, in Intercontinental Exchange (ICE) and European Energy Exchange (EEX).
Fortum Tartu in Estonia (60% owned by Fortum) has given real estate mortgages for a value of EUR 96 million (2014: 96) as a security for an external loan. Real estate mortgages have also been given for loans from Fortum's pension fund for EUR 41 million (2014: 41).
Regarding the relevant interest-bearing liabilities, see Note 28 Interest-bearing liabilities.
35.2 Pledged assets for other commitments Fortum has given real estate mortgages in power plants in Finland for a value of EUR 118 million (2014: 137) as a security to the Ministry of Employment and Economy for the uncovered part of the legal liability and unexpected events relating to costs for future decommissioning and disposal of spent fuel in the wholly owned Loviisa nuclear power plant. The size of the securities given is updated every year in June, based on the decisions regarding the legal liabilities and the funding target which takes place around year-end every year. Due to the yearly update, the amount of real estate mortgages given as a security decreased by EUR 19 million.
See also Note 30 Nuclear related assets and liabilities and Note 38 Contingent liabilities.
Proposal for the distribution of earnings Auditor’s reportPrimary statements Quarterly financial informationParent company financial statements Investor informationOperating and financial review Key figuresNotes
Basis of preparation Risks Income statement Balance sheet Off balance sheet items Group structure and related parties
88

12345678910111213141516171819202122232425262728293031323334353637383940414243
36 Lease commitmentsAccounting policies
Operating leasesLeases of property, plant and equipment, where the Group does not have substantially all of the risks and rewards of ownership are classified as operating leases. Payments made under operating leases are recognised in the income statement as costs on a straight-line basis over the lease term.
Payments received under operating leases where the Group leases out fixed assets are recognised as other income in the income statement.
Finance leasesLeases of property, plant and equipment, where the Group has substantially all the risks and rewards of ownership, are classified as finance leases. Finance leases are capitalised at the commencement of the lease term at the lower of the fair value of the leased property and the present value of the minimum lease payments determined at the inception of the lease.
Future minimum lease payments on operating leasesEUR million 2015 2014Not later than 1 year 14 24Later than 1 year and not later than 5 years 23 43Later than 5 years 24 76Total 1) 60 142
1) In 2014 including discontinued operations.
Finance leasesFortum does not have material finance lease arrangements where the Group is acting as a lessee.
36.1 Leases as a lessor
Operating leases The operating rental income recognised in income statement was EUR 3 million (2014: 1).
Finance leasesFortum does not have material finance lease arrangements where the Group is acting as a lessor.
36.2 Leases as lessee
Operating leases Fortum leases office equipment and cars under various non-cancellable operating leases, some of which contain renewal options. The future costs for non-cancellable operating lease contracts are stated below. Lease rental expenses amounting to EUR 13 million (2014: 16) are included in the income statement in other expenses. Future minimum lease payments include land leases with long lease periods.
37 Capital commitmentsEUR million 2015 2014Property, plant and equipment 426 458Intangible assets 2 3Total 428 461
Capital commitments are capital expenditures contracted for at the balance sheet date but not recognised in the financial statements. Capital commitments have not materially changed in comparison to last year. Capital commitments have increased during the year due to the investment in the new CHP plant in Zabrze, Poland. Decreases come mainly from the progressing of the automation investment in Loviisa nuclear power plant and OAO Fortum investment program in the Russia as well as divestment of the Swedish distribution business.
In addition Fortum has committed to provide a maximum of EUR 107 million to Voimaosakeyhtiö SF, for its participation in the Fennovoima nuclear power project in Finland.
For more information regarding capital expenditure, see Note 19 Property, plant and equipment.
Basis of preparation Risks Income statement Balance sheet Off balance sheet items Group structure and related parties
Proposal for the distribution of earnings Auditor’s reportPrimary statements Quarterly financial informationParent company financial statements Investor informationOperating and financial review Key figuresNotes
89
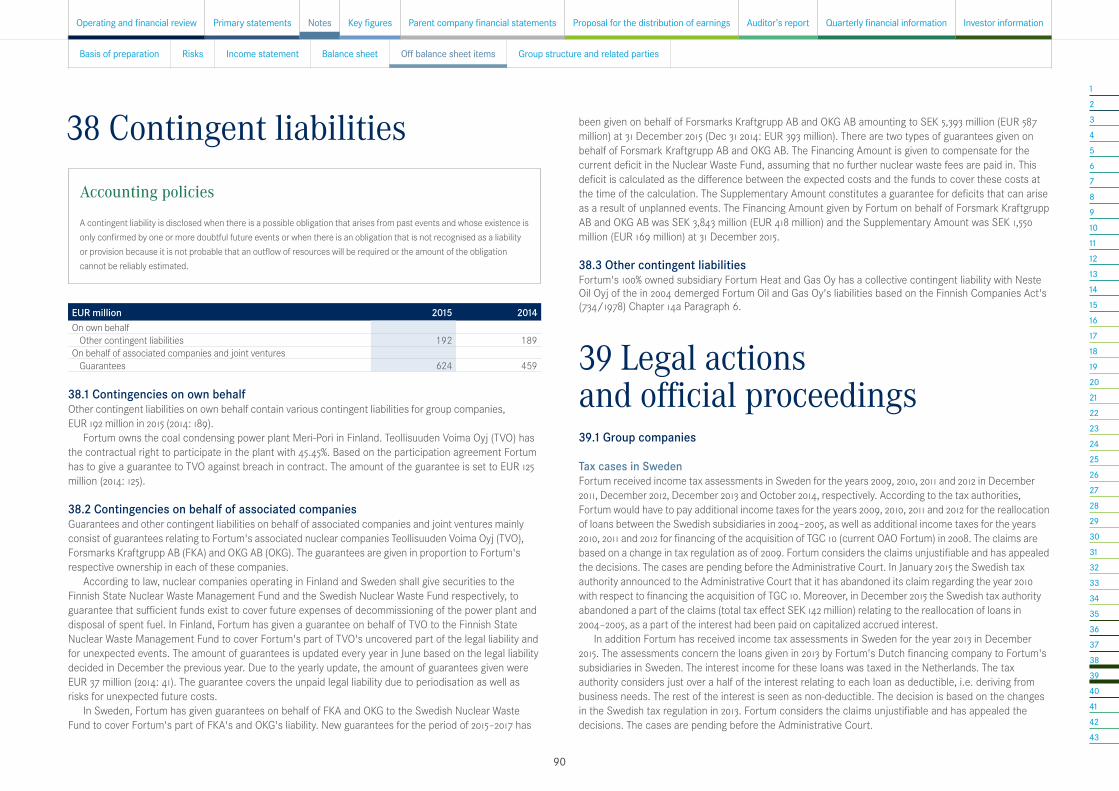
12345678910111213141516171819202122232425262728293031323334353637383940414243
38 Contingent liabilitiesAccounting policies
A contingent liability is disclosed when there is a possible obligation that arises from past events and whose existence is only confirmed by one or more doubtful future events or when there is an obligation that is not recognised as a liability or provision because it is not probable that an outflow of resources will be required or the amount of the obligation cannot be reliably estimated.
EUR million 2015 2014On own behalf
Other contingent liabilities 192 189On behalf of associated companies and joint ventures
Guarantees 624 459
38.1 Contingencies on own behalfOther contingent liabilities on own behalf contain various contingent liabilities for group companies, EUR 192 million in 2015 (2014: 189).
Fortum owns the coal condensing power plant Meri-Pori in Finland. Teollisuuden Voima Oyj (TVO) has the contractual right to participate in the plant with 45.45%. Based on the participation agreement Fortum has to give a guarantee to TVO against breach in contract. The amount of the guarantee is set to EUR 125 million (2014: 125).
38.2 Contingencies on behalf of associated companiesGuarantees and other contingent liabilities on behalf of associated companies and joint ventures mainly consist of guarantees relating to Fortum's associated nuclear companies Teollisuuden Voima Oyj (TVO), Forsmarks Kraftgrupp AB (FKA) and OKG AB (OKG). The guarantees are given in proportion to Fortum's respective ownership in each of these companies.
According to law, nuclear companies operating in Finland and Sweden shall give securities to the Finnish State Nuclear Waste Management Fund and the Swedish Nuclear Waste Fund respectively, to guarantee that sufficient funds exist to cover future expenses of decommissioning of the power plant and disposal of spent fuel. In Finland, Fortum has given a guarantee on behalf of TVO to the Finnish State Nuclear Waste Management Fund to cover Fortum's part of TVO's uncovered part of the legal liability and for unexpected events. The amount of guarantees is updated every year in June based on the legal liability decided in December the previous year. Due to the yearly update, the amount of guarantees given were EUR 37 million (2014: 41). The guarantee covers the unpaid legal liability due to periodisation as well as risks for unexpected future costs.
In Sweden, Fortum has given guarantees on behalf of FKA and OKG to the Swedish Nuclear Waste Fund to cover Fortum's part of FKA's and OKG's liability. New guarantees for the period of 2015–2017 has
39 Legal actions and official proceedings39.1 Group companies
Tax cases in SwedenFortum received income tax assessments in Sweden for the years 2009, 2010, 2011 and 2012 in December 2011, December 2012, December 2013 and October 2014, respectively. According to the tax authorities, Fortum would have to pay additional income taxes for the years 2009, 2010, 2011 and 2012 for the reallocation of loans between the Swedish subsidiaries in 2004–2005, as well as additional income taxes for the years 2010, 2011 and 2012 for financing of the acquisition of TGC 10 (current OAO Fortum) in 2008. The claims are based on a change in tax regulation as of 2009. Fortum considers the claims unjustifiable and has appealed the decisions. The cases are pending before the Administrative Court. In January 2015 the Swedish tax authority announced to the Administrative Court that it has abandoned its claim regarding the year 2010 with respect to financing the acquisition of TGC 10. Moreover, in December 2015 the Swedish tax authority abandoned a part of the claims (total tax effect SEK 142 million) relating to the reallocation of loans in 2004–2005, as a part of the interest had been paid on capitalized accrued interest.
In addition Fortum has received income tax assessments in Sweden for the year 2013 in December 2015. The assessments concern the loans given in 2013 by Fortum's Dutch financing company to Fortum's subsidiaries in Sweden. The interest income for these loans was taxed in the Netherlands. The tax authority considers just over a half of the interest relating to each loan as deductible, i.e. deriving from business needs. The rest of the interest is seen as non-deductible. The decision is based on the changes in the Swedish tax regulation in 2013. Fortum considers the claims unjustifiable and has appealed the decisions. The cases are pending before the Administrative Court.
been given on behalf of Forsmarks Kraftgrupp AB and OKG AB amounting to SEK 5,393 million (EUR 587 million) at 31 December 2015 (Dec 31 2014: EUR 393 million). There are two types of guarantees given on behalf of Forsmark Kraftgrupp AB and OKG AB. The Financing Amount is given to compensate for the current deficit in the Nuclear Waste Fund, assuming that no further nuclear waste fees are paid in. This deficit is calculated as the difference between the expected costs and the funds to cover these costs at the time of the calculation. The Supplementary Amount constitutes a guarantee for deficits that can arise as a result of unplanned events. The Financing Amount given by Fortum on behalf of Forsmark Kraftgrupp AB and OKG AB was SEK 3,843 million (EUR 418 million) and the Supplementary Amount was SEK 1,550 million (EUR 169 million) at 31 December 2015.
38.3 Other contingent liabilitiesFortum's 100% owned subsidiary Fortum Heat and Gas Oy has a collective contingent liability with Neste Oil Oyj of the in 2004 demerged Fortum Oil and Gas Oy's liabilities based on the Finnish Companies Act's (734/1978) Chapter 14a Paragraph 6.
Basis of preparation Risks Income statement Balance sheet Off balance sheet items Group structure and related parties
Proposal for the distribution of earnings Auditor’s reportPrimary statements Quarterly financial informationParent company financial statements Investor informationOperating and financial review Key figuresNotes
90
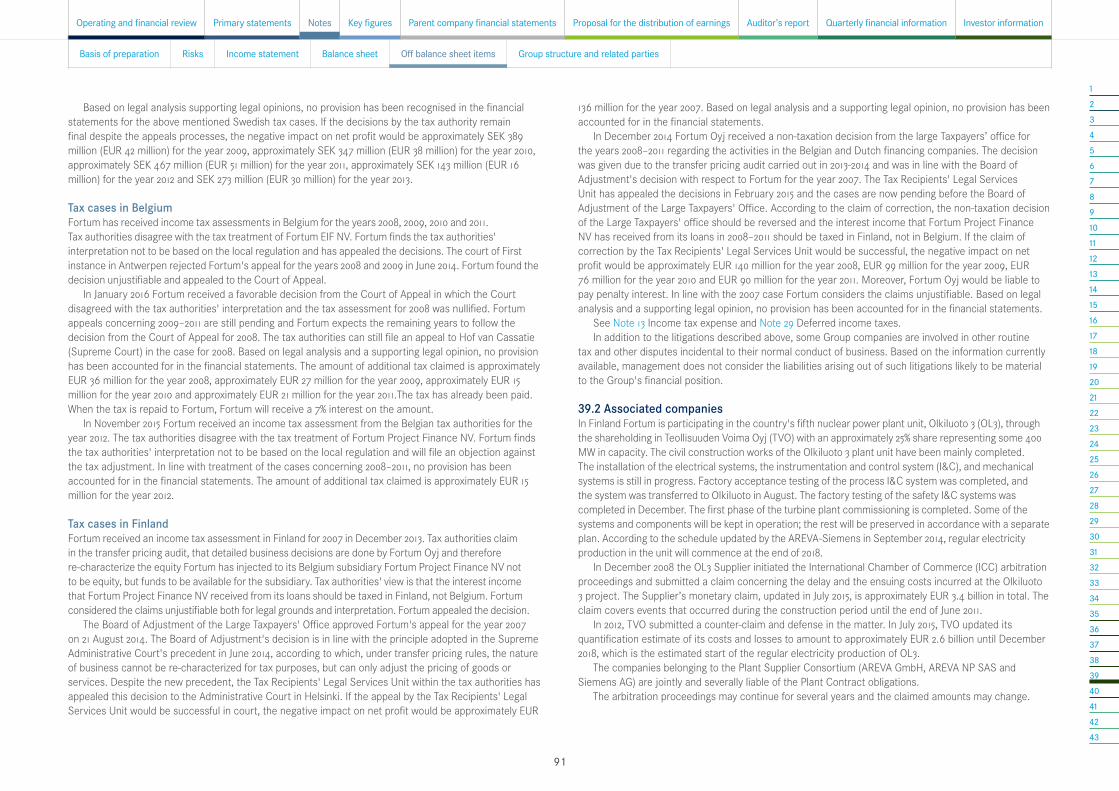
12345678910111213141516171819202122232425262728293031323334353637383940414243
Based on legal analysis supporting legal opinions, no provision has been recognised in the financial statements for the above mentioned Swedish tax cases. If the decisions by the tax authority remain final despite the appeals processes, the negative impact on net profit would be approximately SEK 389 million (EUR 42 million) for the year 2009, approximately SEK 347 million (EUR 38 million) for the year 2010, approximately SEK 467 million (EUR 51 million) for the year 2011, approximately SEK 143 million (EUR 16 million) for the year 2012 and SEK 273 million (EUR 30 million) for the year 2013.
Tax cases in BelgiumFortum has received income tax assessments in Belgium for the years 2008, 2009, 2010 and 2011. Tax authorities disagree with the tax treatment of Fortum EIF NV. Fortum finds the tax authorities' interpretation not to be based on the local regulation and has appealed the decisions. The court of First instance in Antwerpen rejected Fortum's appeal for the years 2008 and 2009 in June 2014. Fortum found the decision unjustifiable and appealed to the Court of Appeal.
In January 2016 Fortum received a favorable decision from the Court of Appeal in which the Court disagreed with the tax authorities' interpretation and the tax assessment for 2008 was nullified. Fortum appeals concerning 2009–2011 are still pending and Fortum expects the remaining years to follow the decision from the Court of Appeal for 2008. The tax authorities can still file an appeal to Hof van Cassatie (Supreme Court) in the case for 2008. Based on legal analysis and a supporting legal opinion, no provision has been accounted for in the financial statements. The amount of additional tax claimed is approximately EUR 36 million for the year 2008, approximately EUR 27 million for the year 2009, approximately EUR 15 million for the year 2010 and approximately EUR 21 million for the year 2011.The tax has already been paid. When the tax is repaid to Fortum, Fortum will receive a 7% interest on the amount.
In November 2015 Fortum received an income tax assessment from the Belgian tax authorities for the year 2012. The tax authorities disagree with the tax treatment of Fortum Project Finance NV. Fortum finds the tax authorities' interpretation not to be based on the local regulation and will file an objection against the tax adjustment. In line with treatment of the cases concerning 2008–2011, no provision has been accounted for in the financial statements. The amount of additional tax claimed is approximately EUR 15 million for the year 2012.
Tax cases in FinlandFortum received an income tax assessment in Finland for 2007 in December 2013. Tax authorities claim in the transfer pricing audit, that detailed business decisions are done by Fortum Oyj and therefore re-characterize the equity Fortum has injected to its Belgium subsidiary Fortum Project Finance NV not to be equity, but funds to be available for the subsidiary. Tax authorities' view is that the interest income that Fortum Project Finance NV received from its loans should be taxed in Finland, not Belgium. Fortum considered the claims unjustifiable both for legal grounds and interpretation. Fortum appealed the decision.
The Board of Adjustment of the Large Taxpayers' Office approved Fortum's appeal for the year 2007 on 21 August 2014. The Board of Adjustment's decision is in line with the principle adopted in the Supreme Administrative Court's precedent in June 2014, according to which, under transfer pricing rules, the nature of business cannot be re-characterized for tax purposes, but can only adjust the pricing of goods or services. Despite the new precedent, the Tax Recipients' Legal Services Unit within the tax authorities has appealed this decision to the Administrative Court in Helsinki. If the appeal by the Tax Recipients' Legal Services Unit would be successful in court, the negative impact on net profit would be approximately EUR
136 million for the year 2007. Based on legal analysis and a supporting legal opinion, no provision has been accounted for in the financial statements.
In December 2014 Fortum Oyj received a non-taxation decision from the large Taxpayers’ office for the years 2008–2011 regarding the activities in the Belgian and Dutch financing companies. The decision was given due to the transfer pricing audit carried out in 2013-2014 and was in line with the Board of Adjustment's decision with respect to Fortum for the year 2007. The Tax Recipients' Legal Services Unit has appealed the decisions in February 2015 and the cases are now pending before the Board of Adjustment of the Large Taxpayers' Office. According to the claim of correction, the non-taxation decision of the Large Taxpayers' office should be reversed and the interest income that Fortum Project Finance NV has received from its loans in 2008–2011 should be taxed in Finland, not in Belgium. If the claim of correction by the Tax Recipients' Legal Services Unit would be successful, the negative impact on net profit would be approximately EUR 140 million for the year 2008, EUR 99 million for the year 2009, EUR 76 million for the year 2010 and EUR 90 million for the year 2011. Moreover, Fortum Oyj would be liable to pay penalty interest. In line with the 2007 case Fortum considers the claims unjustifiable. Based on legal analysis and a supporting legal opinion, no provision has been accounted for in the financial statements.
See Note 13 Income tax expense and Note 29 Deferred income taxes.In addition to the litigations described above, some Group companies are involved in other routine
tax and other disputes incidental to their normal conduct of business. Based on the information currently available, management does not consider the liabilities arising out of such litigations likely to be material to the Group's financial position.
39.2 Associated companiesIn Finland Fortum is participating in the country's fifth nuclear power plant unit, Olkiluoto 3 (OL3), through the shareholding in Teollisuuden Voima Oyj (TVO) with an approximately 25% share representing some 400 MW in capacity. The civil construction works of the Olkiluoto 3 plant unit have been mainly completed. The installation of the electrical systems, the instrumentation and control system (I&C), and mechanical systems is still in progress. Factory acceptance testing of the process I&C system was completed, and the system was transferred to Olkiluoto in August. The factory testing of the safety I&C systems was completed in December. The first phase of the turbine plant commissioning is completed. Some of the systems and components will be kept in operation; the rest will be preserved in accordance with a separate plan. According to the schedule updated by the AREVA-Siemens in September 2014, regular electricity production in the unit will commence at the end of 2018.
In December 2008 the OL3 Supplier initiated the International Chamber of Commerce (ICC) arbitration proceedings and submitted a claim concerning the delay and the ensuing costs incurred at the Olkiluoto 3 project. The Supplier’s monetary claim, updated in July 2015, is approximately EUR 3.4 billion in total. The claim covers events that occurred during the construction period until the end of June 2011.
In 2012, TVO submitted a counter-claim and defense in the matter. In July 2015, TVO updated its quantification estimate of its costs and losses to amount to approximately EUR 2.6 billion until December 2018, which is the estimated start of the regular electricity production of OL3.
The companies belonging to the Plant Supplier Consortium (AREVA GmbH, AREVA NP SAS and Siemens AG) are jointly and severally liable of the Plant Contract obligations.
The arbitration proceedings may continue for several years and the claimed amounts may change.
Basis of preparation Risks Income statement Balance sheet Off balance sheet items Group structure and related parties
Proposal for the distribution of earnings Auditor’s reportPrimary statements Quarterly financial informationParent company financial statements Investor informationOperating and financial review Key figuresNotes
91
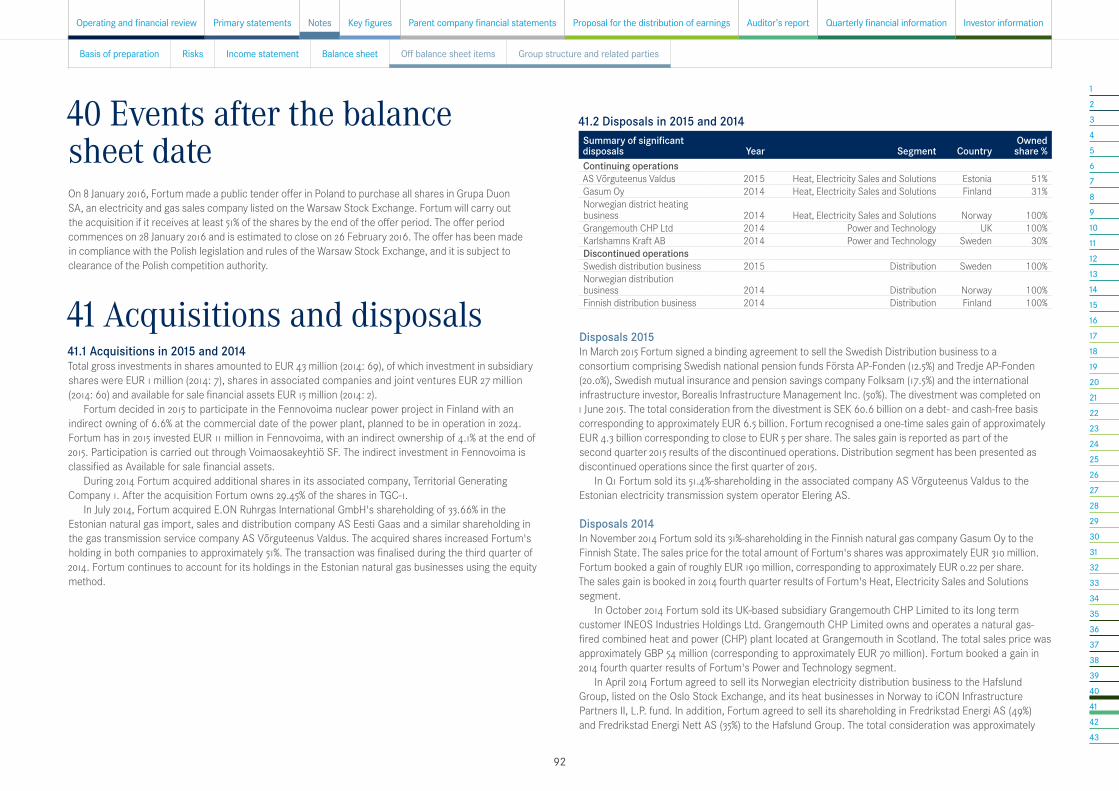
12345678910111213141516171819202122232425262728293031323334353637383940414243
40 Events after the balance sheet dateOn 8 January 2016, Fortum made a public tender offer in Poland to purchase all shares in Grupa Duon SA, an electricity and gas sales company listed on the Warsaw Stock Exchange. Fortum will carry out the acquisition if it receives at least 51% of the shares by the end of the offer period. The offer period commences on 28 January 2016 and is estimated to close on 26 February 2016. The offer has been made in compliance with the Polish legislation and rules of the Warsaw Stock Exchange, and it is subject to clearance of the Polish competition authority.
41 Acquisitions and disposals41.1 Acquisitions in 2015 and 2014Total gross investments in shares amounted to EUR 43 million (2014: 69), of which investment in subsidiary shares were EUR 1 million (2014: 7), shares in associated companies and joint ventures EUR 27 million (2014: 60) and available for sale financial assets EUR 15 million (2014: 2).
Fortum decided in 2015 to participate in the Fennovoima nuclear power project in Finland with an indirect owning of 6.6% at the commercial date of the power plant, planned to be in operation in 2024. Fortum has in 2015 invested EUR 11 million in Fennovoima, with an indirect ownership of 4.1% at the end of 2015. Participation is carried out through Voimaosakeyhtiö SF. The indirect investment in Fennovoima is classified as Available for sale financial assets.
During 2014 Fortum acquired additional shares in its associated company, Territorial Generating Company 1. After the acquisition Fortum owns 29.45% of the shares in TGC-1.
In July 2014, Fortum acquired E.ON Ruhrgas International GmbH's shareholding of 33.66% in the Estonian natural gas import, sales and distribution company AS Eesti Gaas and a similar shareholding in the gas transmission service company AS Võrguteenus Valdus. The acquired shares increased Fortum's holding in both companies to approximately 51%. The transaction was finalised during the third quarter of 2014. Fortum continues to account for its holdings in the Estonian natural gas businesses using the equity method.
41.2 Disposals in 2015 and 2014Summary of significant disposals Year Segment Country
Owned share %
Continuing operationsAS Võrguteenus Valdus 2015 Heat, Electricity Sales and Solutions Estonia 51%Gasum Oy 2014 Heat, Electricity Sales and Solutions Finland 31%Norwegian district heating business 2014 Heat, Electricity Sales and Solutions Norway 100%Grangemouth CHP Ltd 2014 Power and Technology UK 100%Karlshamns Kraft AB 2014 Power and Technology Sweden 30%Discontinued operationsSwedish distribution business 2015 Distribution Sweden 100%Norwegian distribution business 2014 Distribution Norway 100%Finnish distribution business 2014 Distribution Finland 100%
Disposals 2015In March 2015 Fortum signed a binding agreement to sell the Swedish Distribution business to a consortium comprising Swedish national pension funds Första AP-Fonden (12.5%) and Tredje AP-Fonden (20.0%), Swedish mutual insurance and pension savings company Folksam (17.5%) and the international infrastructure investor, Borealis Infrastructure Management Inc. (50%). The divestment was completed on 1 June 2015. The total consideration from the divestment is SEK 60.6 billion on a debt- and cash-free basis corresponding to approximately EUR 6.5 billion. Fortum recognised a one-time sales gain of approximately EUR 4.3 billion corresponding to close to EUR 5 per share. The sales gain is reported as part of the second quarter 2015 results of the discontinued operations. Distribution segment has been presented as discontinued operations since the first quarter of 2015.
In Q1 Fortum sold its 51.4%-shareholding in the associated company AS Võrguteenus Valdus to the Estonian electricity transmission system operator Elering AS.
Disposals 2014In November 2014 Fortum sold its 31%-shareholding in the Finnish natural gas company Gasum Oy to the Finnish State. The sales price for the total amount of Fortum's shares was approximately EUR 310 million. Fortum booked a gain of roughly EUR 190 million, corresponding to approximately EUR 0.22 per share. The sales gain is booked in 2014 fourth quarter results of Fortum's Heat, Electricity Sales and Solutions segment.
In October 2014 Fortum sold its UK-based subsidiary Grangemouth CHP Limited to its long term customer INEOS Industries Holdings Ltd. Grangemouth CHP Limited owns and operates a natural gas-fired combined heat and power (CHP) plant located at Grangemouth in Scotland. The total sales price was approximately GBP 54 million (corresponding to approximately EUR 70 million). Fortum booked a gain in 2014 fourth quarter results of Fortum's Power and Technology segment.
In April 2014 Fortum agreed to sell its Norwegian electricity distribution business to the Hafslund Group, listed on the Oslo Stock Exchange, and its heat businesses in Norway to iCON Infrastructure Partners II, L.P. fund. In addition, Fortum agreed to sell its shareholding in Fredrikstad Energi AS (49%) and Fredrikstad Energi Nett AS (35%) to the Hafslund Group. The total consideration was approximately
Basis of preparation Risks Income statement Balance sheet Off balance sheet items Group structure and related parties
Proposal for the distribution of earnings Auditor’s reportPrimary statements Quarterly financial informationParent company financial statements Investor informationOperating and financial review Key figuresNotes
92

12345678910111213141516171819202122232425262728293031323334353637383940414243
EUR 340 million on a debt- and cash-free basis. The sales gains are booked in Fortum's Distribution segment, EUR 16 million, and Heat and Electricity Sales and Solutions segment, EUR 52 million in the second quarter 2014 results. The one time sales gains correspond to approximately EUR 0.08 per share.
In January 2014 Fortum agreed to sell its 30%-stake in the Swedish power company Karlshamns Kraft AB to the company's majority owner E.ON. The sale has a minor impact on Power and Technology segment’s first quarter 2014 results.
In December 2013 Fortum announced that it had agreed to sell its Finnish electricity distribution business to Suomi Power Networks Oy, owned by a consortium of Finnish and international investors. The total consideration is EUR 2.55 billion on a debt- and cash-free basis. Fortum booked a one-time sales gain of EUR 1.85 billion corresponding to EUR 2.08 per share. The sales gain was reported in Fortum's Distribution segment in the first quarter of 2014.
Divestments total FortumEUR million 2015 2014Divestment of subsidiaries 1)
Intangible assets and property, plant and equipment 2,577 1,342Other non-current and current assets 120 204Liquid funds 12 10Interest-bearing loans -207 -131Other liabilities and provisions -611 -622Gain on sale 4,282 1,958
Sales price received 6,174 2,761Less proceeds not yet settled in cash - 2Less liquid funds 12 10
Sales price for the shares (net of cash) 6,162 2,750Proceeds from interest-bearing receivables 207 131Proceeds not yet settled in cash - 2
Total 6,369 2,884Divestments in associated companies 27 311Divestments of available for sale financial assets 0 1
Gross divestment of shares 6,395 3,1961) Including assets and liabilities relating to discontinued operations (Distribution).
42 Related party transactions42.1 The Finnish State and companies owned by the Finnish StateAt the end of 2015, the Finnish State owned 50.76% of the Company's shares. The Finnish Parliament has authorised the Government to reduce the Finnish State's holding in Fortum Corporation to no less than 50.1% of the share capital and voting rights.See The Fortum share and shareholders section of the Operating and financial review for further information on Fortum shareholders.
All transactions between Fortum and other companies owned by the Finnish State are on arms length basis. In the ordinary course of business Fortum engages in transactions on commercial terms with associated companies and other related parties, which are on same terms as they would be for third parties, except for some associates as discussed later in this note.
In November 2014 Fortum sold its 31%-shareholding in the Finnish natural gas company Gasum Oy to the Finnish State.
See further information on the disposal in Note 41 Acquisitions and disposals.
42.2 Board of Directors and Fortum Management TeamThe key management personnel of the Fortum Group are the members of Fortum Executive Management Team and the Board of Directors. Fortum has not been involved in any material transactions with members of the Board of Directors or Fortum Executive Management Team. No loans exist to any member of the Board of Directors or Fortum Executive Management Team at 31 December 2015. The total compensation (including pension benefits and social costs) for the key management personnel for 2015 was EUR 13 million (2014: 9).
See Note 11 Employee benefits for further information on the Board of Directors and Fortum Executive Management Team remuneration and shareholdings.
42.3 Associated companies and joint venturesFortum owns shareholdings in associated companies and joint ventures which in turn own hydro and nuclear power plants. Under the consortium agreements, each owner is entitled to electricity in proportion to its share of ownership or other agreements. Each owner is liable for an equivalent portion of costs regardless of output. These associated companies are not profit making, since the owners purchase electricity at production cost including interest costs and production taxes.
For further information on transactions and balances with associated companies and joint ventures, see Note 20 Participations in associated companies and joint ventures.
42.4 Pension fund The Fortum pension funds in Finland and Sweden are stand-alone legal entities which manage pension assets related to the part of the pension coverage in Sweden and Finland. The assets in the pension fund in Finland include Fortum shares representing 0.03% (2014: 0.03%) of the company's outstanding shares. Real estate and premises owned by the Finnish pension fund have been leased to Fortum. Fortum has not paid contributions to the pension funds in 2015 nor in 2014. Real estate mortgages have also been given for loans from Fortum's pension fund for EUR 41 million (2014: 41).
Basis of preparation Risks Income statement Balance sheet Off balance sheet items Group structure and related parties
Proposal for the distribution of earnings Auditor’s reportPrimary statements Quarterly financial informationParent company financial statements Investor informationOperating and financial review Key figuresNotes
93
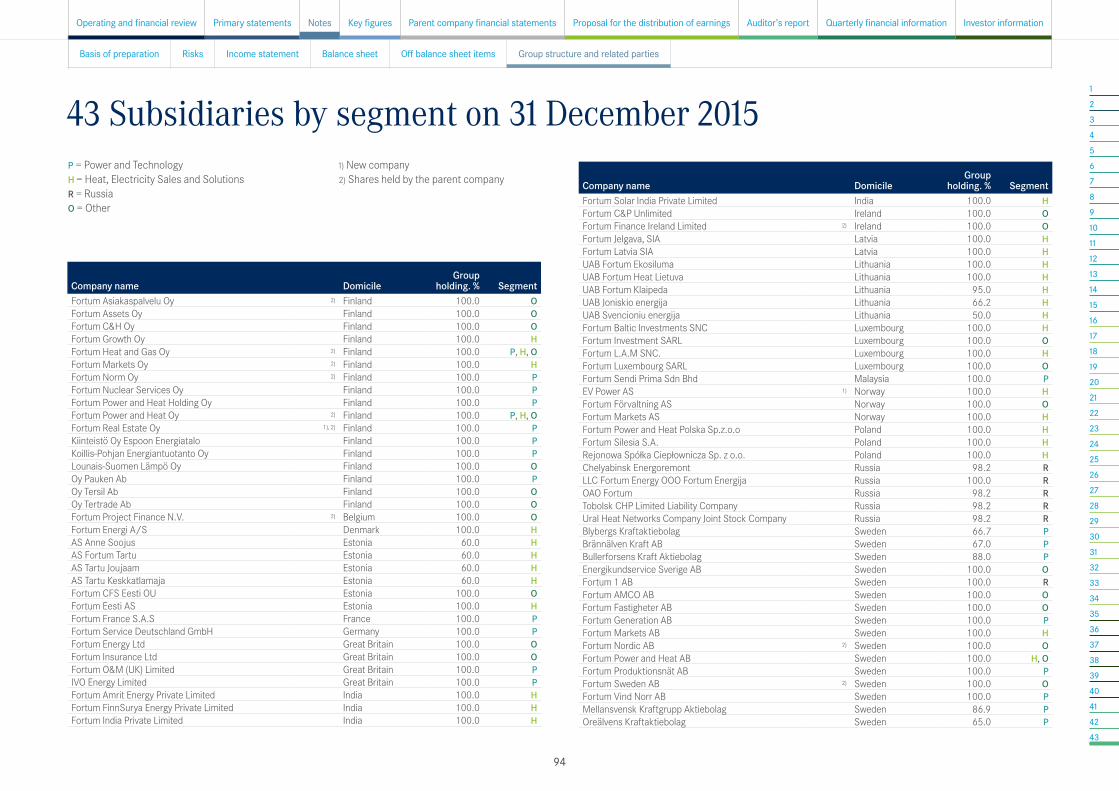
12345678910111213141516171819202122232425262728293031323334353637383940414243
43 Subsidiaries by segment on 31 December 2015P = Power and Technology H = Heat, Electricity Sales and SolutionsR = RussiaO = Other
1) New company2) Shares held by the parent company
Company name DomicileGroup
holding. % SegmentFortum Asiakaspalvelu Oy 2) Finland 100.0 OFortum Assets Oy Finland 100.0 OFortum C&H Oy Finland 100.0 OFortum Growth Oy Finland 100.0 HFortum Heat and Gas Oy 2) Finland 100.0 P, H, OFortum Markets Oy 2) Finland 100.0 HFortum Norm Oy 2) Finland 100.0 PFortum Nuclear Services Oy Finland 100.0 PFortum Power and Heat Holding Oy Finland 100.0 PFortum Power and Heat Oy 2) Finland 100.0 P, H, OFortum Real Estate Oy 1), 2) Finland 100.0 PKiinteistö Oy Espoon Energiatalo Finland 100.0 PKoillis-Pohjan Energiantuotanto Oy Finland 100.0 PLounais-Suomen Lämpö Oy Finland 100.0 OOy Pauken Ab Finland 100.0 POy Tersil Ab Finland 100.0 OOy Tertrade Ab Finland 100.0 OFortum Project Finance N.V. 2) Belgium 100.0 OFortum Energi A/S Denmark 100.0 HAS Anne Soojus Estonia 60.0 HAS Fortum Tartu Estonia 60.0 HAS Tartu Joujaam Estonia 60.0 HAS Tartu Keskkatlamaja Estonia 60.0 HFortum CFS Eesti OU Estonia 100.0 OFortum Eesti AS Estonia 100.0 HFortum France S.A.S France 100.0 PFortum Service Deutschland GmbH Germany 100.0 PFortum Energy Ltd Great Britain 100.0 OFortum Insurance Ltd Great Britain 100.0 OFortum O&M (UK) Limited Great Britain 100.0 PIVO Energy Limited Great Britain 100.0 PFortum Amrit Energy Private Limited India 100.0 HFortum FinnSurya Energy Private Limited India 100.0 HFortum India Private Limited India 100.0 H
Company name DomicileGroup
holding. % SegmentFortum Solar India Private Limited India 100.0 HFortum C&P Unlimited Ireland 100.0 OFortum Finance Ireland Limited 2) Ireland 100.0 OFortum Jelgava, SIA Latvia 100.0 HFortum Latvia SIA Latvia 100.0 HUAB Fortum Ekosiluma Lithuania 100.0 HUAB Fortum Heat Lietuva Lithuania 100.0 HUAB Fortum Klaipeda Lithuania 95.0 HUAB Joniskio energija Lithuania 66.2 HUAB Svencioniu energija Lithuania 50.0 HFortum Baltic Investments SNC Luxembourg 100.0 HFortum Investment SARL Luxembourg 100.0 OFortum L.A.M SNC. Luxembourg 100.0 HFortum Luxembourg SARL Luxembourg 100.0 OFortum Sendi Prima Sdn Bhd Malaysia 100.0 PEV Power AS 1) Norway 100.0 HFortum Förvaltning AS Norway 100.0 OFortum Markets AS Norway 100.0 HFortum Power and Heat Polska Sp.z.o.o Poland 100.0 HFortum Silesia S.A. Poland 100.0 HRejonowa Spółka Ciepłownicza Sp. z o.o. Poland 100.0 HChelyabinsk Energoremont Russia 98.2 RLLC Fortum Energy OOO Fortum Energija Russia 100.0 ROAO Fortum Russia 98.2 RTobolsk CHP Limited Liability Company Russia 98.2 RUral Heat Networks Company Joint Stock Company Russia 98.2 RBlybergs Kraftaktiebolag Sweden 66.7 PBrännälven Kraft AB Sweden 67.0 PBullerforsens Kraft Aktiebolag Sweden 88.0 PEnergikundservice Sverige AB Sweden 100.0 OFortum 1 AB Sweden 100.0 RFortum AMCO AB Sweden 100.0 OFortum Fastigheter AB Sweden 100.0 OFortum Generation AB Sweden 100.0 PFortum Markets AB Sweden 100.0 HFortum Nordic AB 2) Sweden 100.0 OFortum Power and Heat AB Sweden 100.0 H, OFortum Produktionsnät AB Sweden 100.0 PFortum Sweden AB 2) Sweden 100.0 OFortum Vind Norr AB Sweden 100.0 PMellansvensk Kraftgrupp Aktiebolag Sweden 86.9 POreälvens Kraftaktiebolag Sweden 65.0 P
Basis of preparation Risks Income statement Balance sheet Off balance sheet items Group structure and related parties
Proposal for the distribution of earnings Auditor’s reportPrimary statements Quarterly financial informationParent company financial statements Investor informationOperating and financial review Key figuresNotes
94
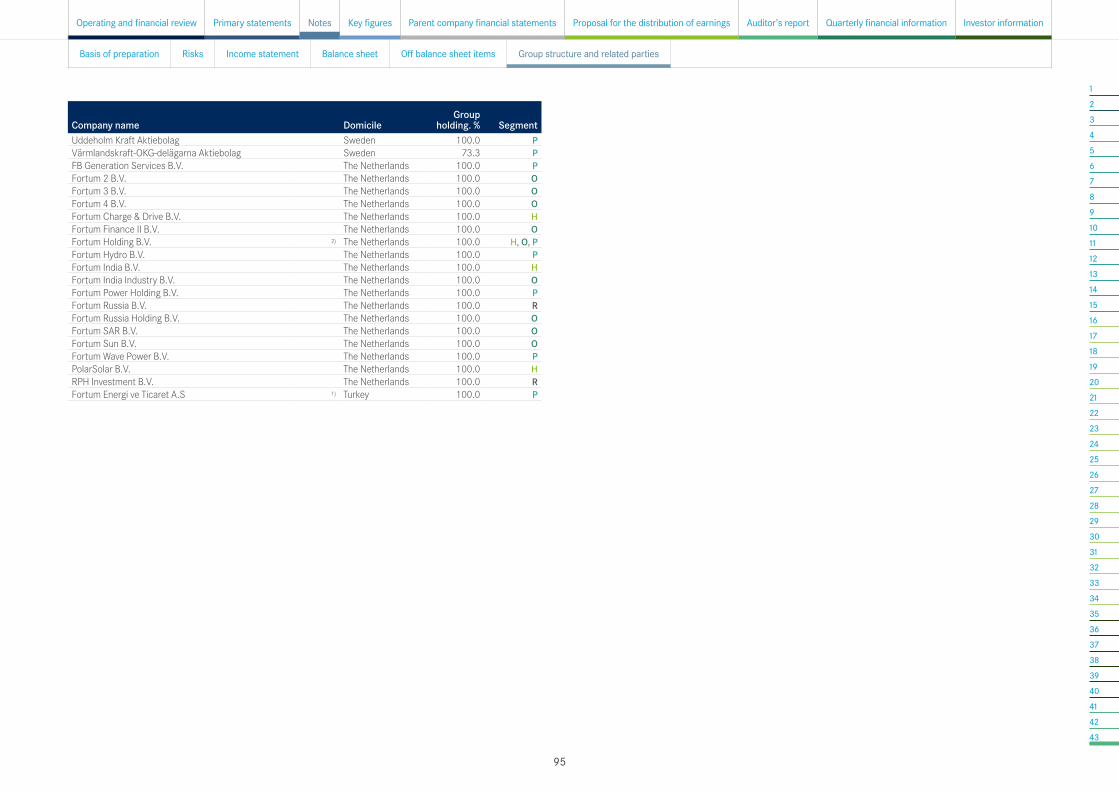
12345678910111213141516171819202122232425262728293031323334353637383940414243
Company name DomicileGroup
holding. % SegmentUddeholm Kraft Aktiebolag Sweden 100.0 PVärmlandskraft-OKG-delägarna Aktiebolag Sweden 73.3 PFB Generation Services B.V. The Netherlands 100.0 PFortum 2 B.V. The Netherlands 100.0 OFortum 3 B.V. The Netherlands 100.0 OFortum 4 B.V. The Netherlands 100.0 OFortum Charge & Drive B.V. The Netherlands 100.0 HFortum Finance II B.V. The Netherlands 100.0 OFortum Holding B.V. 2) The Netherlands 100.0 H, O, PFortum Hydro B.V. The Netherlands 100.0 PFortum India B.V. The Netherlands 100.0 HFortum India Industry B.V. The Netherlands 100.0 OFortum Power Holding B.V. The Netherlands 100.0 PFortum Russia B.V. The Netherlands 100.0 RFortum Russia Holding B.V. The Netherlands 100.0 OFortum SAR B.V. The Netherlands 100.0 OFortum Sun B.V. The Netherlands 100.0 OFortum Wave Power B.V. The Netherlands 100.0 PPolarSolar B.V. The Netherlands 100.0 HRPH Investment B.V. The Netherlands 100.0 RFortum Energi ve Ticaret A.S 1) Turkey 100.0 P
Basis of preparation Risks Income statement Balance sheet Off balance sheet items Group structure and related parties
Proposal for the distribution of earnings Auditor’s reportPrimary statements Quarterly financial informationParent company financial statements Investor informationOperating and financial review Key figuresNotes
95

Financial key figuresComparability of information presented in tables and graphs
Fortum announced the sale of Swedish Distribution business in March 2015. After the divestment of the Swedish Distribution business Fortum has no electricty distribution operations and therefore Distribution segment was treated as discontinued operations in 2015, with restatement of year 2014, according to IFRS 5 Non-current Assets held for Sale and Discontinued operations.
Information in the tables and graphs presented for year 2012 or earlier is not restated due to the adoption of IFRS 10 and IFRS 11. Adoption of standards influences treatment of Fortum’s holding in AB Fortum Värme samägt med Stockholms stad in the the consolidated financial statements.
EUR or as indicated 2006
2007
2008
2009 2010
2011 2012
2013
2014
2015
Change 15/14, %
Income statementSales total Fortum 4,491 4,479 5,636 5,435 6,296 6,161 6,159 5,309 4,751 3,702 -22Sales continuing operations 4,088 3,459 -15EBITDA total Fortum 1) 1,884 2,298 2,478 2,292 2,271 3,008 2,538 2,129 3,954 4,640 17EBITDA continuing operations 1,673 196 -88Comparable EBITDA total Fortum 1,866 2,015 2,360 2,398 2,396 2,374 2,416 1,975 1,873 1,265 -33Comparable EBITDA continuing operations 1,457 1,102 -24Operating profit total Fortum 1,455 1,847 1,963 1,782 1,708 2,402 1,874 1,508 3,428 4,245 24
- of sales % 32.4 41.2 34.8 32.8 27.1 39.0 30.4 28.4 72.2 114.7Operating profit continuing operations 1,296 -150 -112
- of sales % 31.7 -4.3Comparable operating profit total Fortum 1,437 1,564 1,845 1,888 1,833 1,802 1,752 1,403 1,351 922 -32Comparable operating profit continuing operations 1,085 808 -26Profit before income tax total Fortum 1,421 1,934 1,850 1,636 1,615 2,228 1,586 1,398 3,360 4,088 22
- of sales % 31.6 43.2 32.8 30.1 25.7 36.2 25.8 26.3 70.7 110.4Profit before income tax continuing operations 1,232 -305 -124
- of sales % 30.1 -8.8Profit for the period total Fortum 1,120 1,608 1,596 1,351 1,354 1,862 1,512 1,212 3,161 4,142 31- of which attributable to owners of the parent 1,071 1,552 1,542 1,312 1,300 1,769 1,416 1,204 3,154 4,138 31Profit for the period continuing operations 1,089 -228 -121
- of which attributable to owners of the parent 1,081 -231 -121
Financial position and cash flowCapital employed total Fortum 12,663 13,544 15,911 15,350 16,124 17,931 19,420 19,183 17,918 19,870 11Interest-bearing net debt 4,345 4,466 6,179 5,969 6,826 7,023 7,814 7,793 4,217 -2,195 -152Interest-bearing net debt without Värme financing 6,658 3,664 N/ACapital expenditure and gross investments in shares total Fortum 1,395 972 2,624 929 1,249 1,482 1,574 1,020 843 669 -21
- of sales % 31.1 21.7 46.6 17.1 19.8 24.1 25.6 19.2 17.7 18.1Capital expenditure and gross investments in shares continuing operations 695 625 -10Capital expenditure total Fortum 485 655 1,108 862 1,222 1,408 1,558 1,005 774 626 -19Capital expenditure continuing operations 626 582 -7Net cash from operating activities total Fortum 1,151 1,670 2,002 2,264 1,437 1,613 1,382 1,548 1,762 1,381 -22Net cash from operating activities continuing operations 1,406 1,228 -13
1) EBITDA is defined as operating profit + depreciation and amortisation.
Financial key figures Share key figures Operational key figures Definitions of key figures
Proposal for the distribution of earnings Auditor’s reportPrimary statements Quarterly financial informationParent company financial statements Investor informationOperating and financial review Key figuresNotes
96

EUR or as indicated 2006
2007
2008
2009 2010
2011 2012
2013
2014
2015
Change 15/14, %
Key ratiosReturn on capital employed total Fortum, % 13.4 16.5 15.0 12.1 11.6 14.8 10.2 9.0 19.5 22.7Return on shareholders' equity total Fortum, % 14.4 19.1 18.7 16.0 15.7 19.7 14.6 12.0 30.0 33.4Interest coverage total Fortum 11.5 12.8 9.4 12.4 13.7 10.5 7.6 6.7 19.9 27.6Interest coverage including capitalised borrowing costs total Fortum 8.6 10.3 10.0 8.5 5.7 5.3 15.7 21.5Funds from operations/interest-bearing net debt total Fortum, % 30.6 36.3 34.1 37.6 20.5 21.5 19.9 18.8 42.9 -59.7Funds from operations/interest-bearing net debt without Värme financing total Fortum, % 22.1 49.3 N/AGearing, % 53 52 73 70 78 69 73 77 39 -16Net debt/EBITDA total Fortum 2.3 1.9 2.5 2.6 3.0 2.3 3.1 3.7 1.1 -0.5Comparable net debt/EBITDA total Fortum 2.3 2.2 2.6 2.5 2.8 3.0 3.2 3.9 2.3 -1.7Comparable net debt/EBITDA without Värme financing 3.4 2.0 N/AEquity-to-assets ratio, % 48 49 41 43 40 44 43 43 51 61
Other dataDividends 1,122 1,198 888 888 888 888 888 977 1,155 977 2) -15Dividends according to dividend policy in 2006 and from recurring earnings in 2007 650 683 Additional dividends in 2006 and 2007 472 515Research and development expenditure 17 21 27 30 30 38 41 49 41 47 15
- of sales % 0.4 0.5 0.5 0.5 0.5 0.6 0.7 0.9 1.0 1.4Average number of employees total Fortum 8,910 8,304 14,077 13,278 11,156 11,010 10,600 9,532 8,821 8,193Average number of employees continuing operations 8,329 8,009
2) Board of Directors' proposal for the planned Annual General Meeting on 5 April 2016See Definitions of key figures.
Financial key figures Share key figures Operational key figures Definitions of key figures
Proposal for the distribution of earnings Auditor’s reportPrimary statements Quarterly financial informationParent company financial statements Investor informationOperating and financial review Key figuresNotes
97
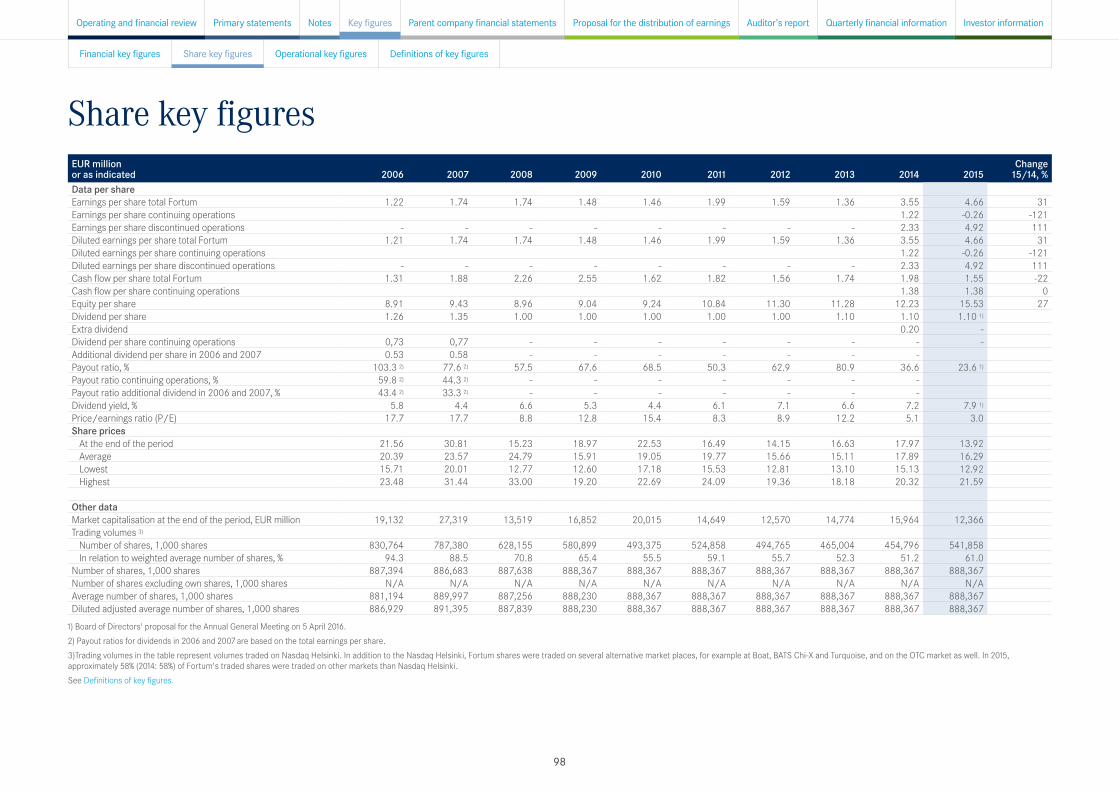
Share key figuresEUR million or as indicated 2006
2007
2008
2009
2010
2011
2012 2013
2014
2015
Change 15/14, %
Data per shareEarnings per share total Fortum 1.22 1.74 1.74 1.48 1.46 1.99 1.59 1.36 3.55 4.66 31Earnings per share continuing operations 1.22 -0.26 -121Earnings per share discontinued operations - - - - - - - - 2.33 4.92 111Diluted earnings per share total Fortum 1.21 1.74 1.74 1.48 1.46 1.99 1.59 1.36 3.55 4.66 31Diluted earnings per share continuing operations 1.22 -0.26 -121Diluted earnings per share discontinued operations - - - - - - - - 2.33 4.92 111Cash flow per share total Fortum 1.31 1.88 2.26 2.55 1.62 1.82 1.56 1.74 1.98 1.55 -22Cash flow per share continuing operations 1.38 1.38 0Equity per share 8.91 9.43 8.96 9.04 9.24 10.84 11.30 11.28 12.23 15.53 27Dividend per share 1.26 1.35 1.00 1.00 1.00 1.00 1.00 1.10 1.10 1.10 1)
Extra dividend 0.20 -Dividend per share continuing operations 0,73 0,77 - - - - - - - -Additional dividend per share in 2006 and 2007 0.53 0.58 - - - - - - -Payout ratio, % 103.3 2) 77.6 2) 57.5 67.6 68.5 50.3 62.9 80.9 36.6 23.6 1)
Payout ratio continuing operations, % 59.8 2) 44.3 2) - - - - - - -Payout ratio additional dividend in 2006 and 2007, % 43.4 2) 33.3 2) - - - - - - -Dividend yield, % 5.8 4.4 6.6 5.3 4.4 6.1 7.1 6.6 7.2 7.9 1)
Price/earnings ratio (P/E) 17.7 17.7 8.8 12.8 15.4 8.3 8.9 12.2 5.1 3.0Share prices
At the end of the period 21.56 30.81 15.23 18.97 22.53 16.49 14.15 16.63 17.97 13.92Average 20.39 23.57 24.79 15.91 19.05 19.77 15.66 15.11 17.89 16.29Lowest 15.71 20.01 12.77 12.60 17.18 15.53 12.81 13.10 15.13 12.92Highest 23.48 31.44 33.00 19.20 22.69 24.09 19.36 18.18 20.32 21.59
Other dataMarket capitalisation at the end of the period, EUR million 19,132 27,319 13,519 16,852 20,015 14,649 12,570 14,774 15,964 12,366Trading volumes 3)
Number of shares, 1,000 shares 830,764 787,380 628,155 580,899 493,375 524,858 494,765 465,004 454,796 541,858In relation to weighted average number of shares, % 94.3 88.5 70.8 65.4 55.5 59.1 55.7 52.3 51.2 61.0
Number of shares, 1,000 shares 887,394 886,683 887,638 888,367 888,367 888,367 888,367 888,367 888,367 888,367Number of shares excluding own shares, 1,000 shares N/A N/A N/A N/A N/A N/A N/A N/A N/A N/AAverage number of shares, 1,000 shares 881,194 889,997 887,256 888,230 888,367 888,367 888,367 888,367 888,367 888,367Diluted adjusted average number of shares, 1,000 shares 886,929 891,395 887,839 888,230 888,367 888,367 888,367 888,367 888,367 888,367
1) Board of Directors' proposal for the Annual General Meeting on 5 April 2016.2) Payout ratios for dividends in 2006 and 2007 are based on the total earnings per share.3)Trading volumes in the table represent volumes traded on Nasdaq Helsinki. In addition to the Nasdaq Helsinki, Fortum shares were traded on several alternative market places, for example at Boat, BATS Chi-X and Turquoise, and on the OTC market as well. In 2015, approximately 58% (2014: 58%) of Fortum's traded shares were traded on other markets than Nasdaq Helsinki.See Definitions of key figures.
Financial key figures Share key figures Operational key figures Definitions of key figures
Proposal for the distribution of earnings Auditor’s reportPrimary statements Quarterly financial informationParent company financial statements Investor informationOperating and financial review Key figuresNotes
98

Operational key figures, volumesComparability of information presented in tables and graphs
Information in the tables and graphs presented for year 2012 or earlier is not restated due to the adoption of IFRS 10 and IFRS 11. Adoption of standards influences treatment of Fortum's holding in AB Fortum Värme samägt med Stockholms stad in the the consolidated financial statements.
Fortum's total power and heat generation in EU and NorwayTWh 2006 2007 2008 2009 2010 2011 2012 2013 2014 2015Power generation 54.4 52.2 52.6 49.3 53.7 55.3 53.9 47.4 50.1 50.2Heat generation 25.8 26.1 25.0 23.2 26.1 22.0 18.5 10.4 8.2 6.4
Fortum's total power and heat generation in RussiaTWh 2006 2007 2008 2009 2010 2011 2012 2013 2014 2015Power generation - - 11.6 16.0 16.1 17.4 19.2 20.0 23.3 25.7Heat generation - - 15.3 25.6 26.0 25.4 24.8 24.2 26.4 25.8
Fortum's own power generation by source, total in the Nordic areaTWh 2006 2007 2008 2009 2010 2011 2012 2013 2014 2015Hydro and wind power 19.8 20.0 22.9 22.1 22.0 21.0 25.2 18.1 22.4 25.1Nuclear power 24.4 24.9 23.7 21.4 22.0 24.9 23.4 23.7 23.8 22.7Thermal power 9.0 6.2 5.0 4.6 8.3 7.2 3.0 3.4 1.8 1.0Total 53.2 51.1 51.6 48.1 52.3 53.1 51.6 45.2 48.0 48.8
Fortum's own power generation by source, total in the Nordic area% 2006 2007 2008 2009 2010 2011 2012 2013 2014 2015Hydro and wind power 37 39 44 46 42 40 49 40 46 51Nuclear power 46 49 46 44 42 47 45 52 50 47Thermal power 17 12 10 10 16 13 6 8 4 2Total 100 100 100 100 100 100 100 100 100 100
Power generation capacity by segmentMW 2006 2007 2008 2009 2010 2011 2012 2013 2014 2015Power and Technology 1) 9,540 9,560 9,575 9,709 9,728 9,752 9,702 9,475 9,063 8,046Heat 1,373 1,360 1,213 1,446 1,600 1,670 1,569Heat, Electricity Sales and Solutions 793 803 743Russia - - 2,785 2,785 2,785 3,404 3,404 4,250 4,758 4,903Total 10,913 10,920 13,573 13,940 14,113 14,826 14,675 14,518 14,624 13,692
1) 2015 figure excluding 750MW mothballed capacity of Inkoo power plant of which preparations for permanent dismantling has started.
Financial key figures Share key figures Operational key figures Definitions of key figures
Proposal for the distribution of earnings Auditor’s reportPrimary statements Quarterly financial informationParent company financial statements Investor informationOperating and financial review Key figuresNotes
99

Heat production capacity by segmentMW 2006 2007 2008 2009 2010 2011 2012 2013 2014 2015Power and Technology 250 250 250 250 250 250 250 250 0Heat 10,633 10,973 10,218 10,284 10,448 10,375 8,785Heat, Electricity Sales and Solutions 4,317 3,936 3,915Russia - - 13,796 13,796 13,796 14,107 13,396 13,466 13,466 12,696Total 10,883 11,223 24,264 24,330 24,494 24,732 22,431 18,033 17,402 16,611
Fortum's total power and heat sales in EU and NorwayEUR million 2006 2007 2008 2009 2010 2011 2012 2013 2014 2015Electricity sales 2,437 2,370 2,959 2,802 3,110 2,868 2,700 2,462 2,344 1,921Heat sales 1,014 1,096 1,157 1,095 1,309 1,278 1,201 538 468 423
Fortum's total power and heat sales in RussiaEUR million 2006 2007 2008 2009 2010 2011 2012 2013 2014 2015Electricity sales - - 332 390 505 590 713 822 758 661Heat sales - - 141 219 287 324 300 290 285 228
Fortum's total power sales by areaTWh 2006 2007 2008 2009 2010 2011 2012 2013 2014 2015Finland 29.6 29.0 28.7 26.1 30.7 24.6 21.6 23.4 21.6 22.3Sweden 28.5 27.6 28.5 26.9 28.3 29.4 30.1 23.3 28.2 29.8Russia - - 14.8 19.5 18.7 20.2 23.3 25.6 26.5 29.4Other countries 3.5 3.1 3.0 3.2 3.2 3.6 3.8 4.3 3.8 2.8Total 61.6 59.7 75.0 75.7 80.9 77.8 78.8 76.6 80.1 84.3
Fortum's total heat sales by areaTWh 2006 2007 2008 2009 2010 2011 2012 2013 2014 2015Finland 10.7 11.1 10.8 8.0 9.6 8.5 5.8 5.5 3.2 3.1Russia - - 15.3 25.6 26.8 26.7 26.4 24.1 26.0 25.4Sweden 9.3 9.2 9.1 9.8 10.9 8.5 8.5 - - -Poland 3.6 3.5 3.6 3.7 4.0 4.3 4.3 4.1 3.4 3.4Other countries 3.2 3.3 3.4 3.5 3.6 3.4 2.9 3.1 2.8 1.2Total 26.8 27.1 42.2 50.6 54.9 51.4 47.9 36.8 35.4 33.2
Volume of distributed electricity in distribution networksTWh 2006 2007 2008 2009 2010 2011 2012 2013 2014 2015Finland 7.7 9.2 9.3 9.4 10.0 9.5 9.8 9.5 2.8 -Sweden 14.4 14.3 14.0 14.0 15.2 14.2 14.4 14.1 13.7 6.4Norway 2.3 2.3 2.3 2.3 2.5 2.3 2.4 2.5 1.1 -Estonia 0.2 0.2 0.2 0.2 0.2 0.1 0.0 - - -Total 24.6 26.0 25.8 25.9 27.9 26.1 26.6 26.1 17.6 6.4
Financial key figures Share key figures Operational key figures Definitions of key figures
Proposal for the distribution of earnings Auditor’s reportPrimary statements Quarterly financial informationParent company financial statements Investor informationOperating and financial review Key figuresNotes
100

Operational key figures, segmentsFollowing the acquisition of the Russian company, OAO Fortum, Fortum changed its segment reporting during 2008. Comparison numbers were restated in 2008.
Fortum renewed its business structure as of 1 March 2014. The reorganisation lead to a change in Fortum's external financial reporting structure as previously separately reported segments Heat and Electricity Sales were combined into one segment: Heat, Electricity Sales and Solutions.
Fortum has applied new IFRS 10 Consolidated financial statements and IFRS 11 Joint arrangements from 1 January 2014. The effect of applying the new standards to Fortum Group financial information relates to AB Fortum Värme samägt med Stockholm Stad (Fortum Värme), that is treated as a joint venture and thus consolidated with equity method from 1 January 2014 onwards. Before the change the company was consolidated as a subsidiary with 50% minority interest.
Information for 2013 has been restated to reflect both the change in business structure and adoption of new IFRS standards.
Fortum announced the sale of Swedish Distribution business in March 2015. After the divestment of the Swedish Distribution business Fortum does not have any distribution operations and therefore Distribution segment has been treated as discontinued operations starting from Q1 2015 with restatement of year 2014, according to IFRS 5 Non-current Assets held for Sale and Discontinued operations.
Sales by segmentEUR million 2006 2007 2008 2009 2010 2011 2012 2013 2014 2015Power and Technology 2,439 2,350 2,892 2,531 2,702 2,481 2,415 2,252 2,156 1,722
- of which internal -133 323 0 254 -281 -24 296 69 85 83Heat 1,268 1,356 1,466 1,399 1,770 1,737 1,628
- of which internal -32 38 0 23 -8 8 18Heat, Electricity Sales and Solutions 1,516 1,332 1,187
- of which internal 87 34 -13Russia 489 632 804 920 1,030 1,119 1,055 893
- of which internal - - - - - - 0 0Distribution 753 769 789 800 963 973 1,070 1,064
- of which internal 8 9 10 13 18 15 37 19Electricity Sales 1,912 1,683 1,922 1,449 1,798 900 722
- of which internal 149 155 177 67 158 95 55Other 78 81 83 71 51 108 137 63 58 114
- of which internal 62 72 82 -5 169 115 -66 54 44 75Eliminations -1,959 -1,760 -2,005 -1,447 -1,792 -958 -843 -706 -91 -122Total for continuing operations 4,491 4,479 5,636 5,435 6,296 6,161 6,159 5,309 4,088 3,459Discontinued operations 751 274Eliminations 1) -89 -31Total 4,751 3,702
1) Sales to and from discontinued operations.
Financial key figures Share key figures Operational key figures Definitions of key figures
Proposal for the distribution of earnings Auditor’s reportPrimary statements Quarterly financial informationParent company financial statements Investor informationOperating and financial review Key figuresNotes
101
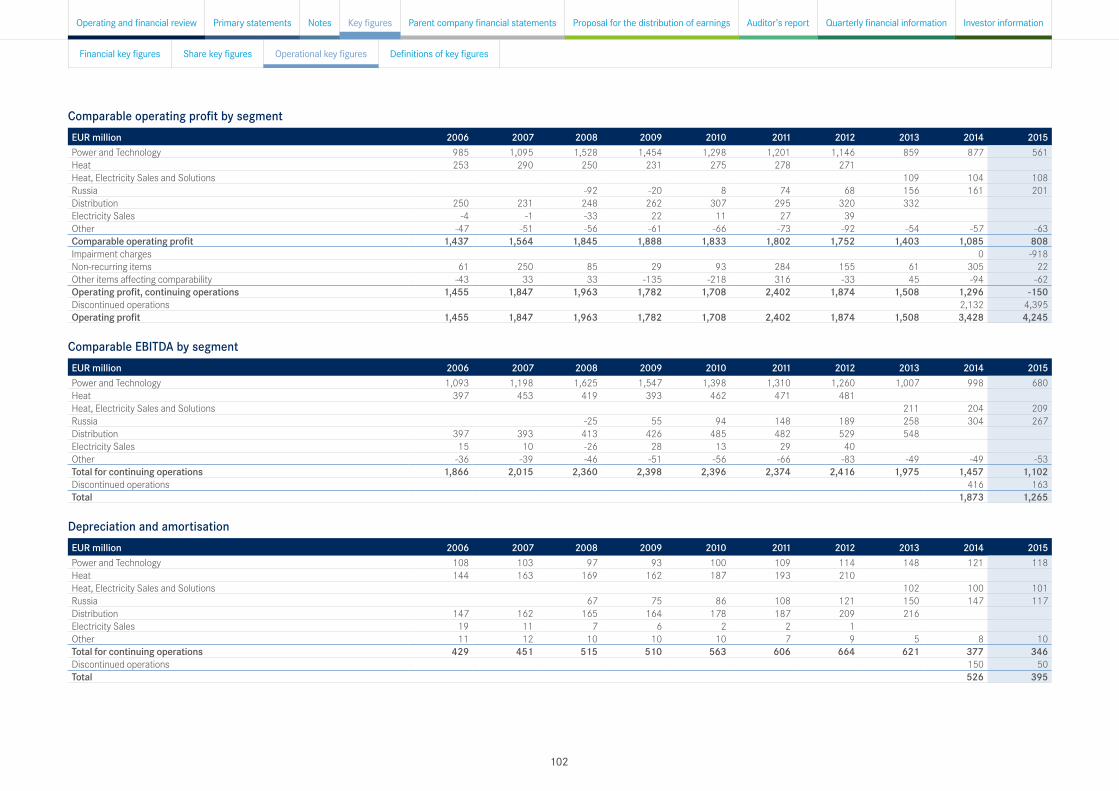
Comparable operating profit by segmentEUR million 2006 2007 2008 2009 2010 2011 2012 2013 2014 2015Power and Technology 985 1,095 1,528 1,454 1,298 1,201 1,146 859 877 561Heat 253 290 250 231 275 278 271Heat, Electricity Sales and Solutions 109 104 108Russia -92 -20 8 74 68 156 161 201Distribution 250 231 248 262 307 295 320 332Electricity Sales -4 -1 -33 22 11 27 39Other -47 -51 -56 -61 -66 -73 -92 -54 -57 -63Comparable operating profit 1,437 1,564 1,845 1,888 1,833 1,802 1,752 1,403 1,085 808Impairment charges 0 -918Non-recurring items 61 250 85 29 93 284 155 61 305 22Other items affecting comparability -43 33 33 -135 -218 316 -33 45 -94 -62Operating profit, continuing operations 1,455 1,847 1,963 1,782 1,708 2,402 1,874 1,508 1,296 -150Discontinued operations 2,132 4,395Operating profit 1,455 1,847 1,963 1,782 1,708 2,402 1,874 1,508 3,428 4,245
Comparable EBITDA by segmentEUR million 2006 2007 2008 2009 2010 2011 2012 2013 2014 2015Power and Technology 1,093 1,198 1,625 1,547 1,398 1,310 1,260 1,007 998 680Heat 397 453 419 393 462 471 481Heat, Electricity Sales and Solutions 211 204 209Russia -25 55 94 148 189 258 304 267Distribution 397 393 413 426 485 482 529 548Electricity Sales 15 10 -26 28 13 29 40Other -36 -39 -46 -51 -56 -66 -83 -49 -49 -53Total for continuing operations 1,866 2,015 2,360 2,398 2,396 2,374 2,416 1,975 1,457 1,102Discontinued operations 416 163Total 1,873 1,265
Depreciation and amortisationEUR million 2006 2007 2008 2009 2010 2011 2012 2013 2014 2015Power and Technology 108 103 97 93 100 109 114 148 121 118Heat 144 163 169 162 187 193 210Heat, Electricity Sales and Solutions 102 100 101Russia 67 75 86 108 121 150 147 117Distribution 147 162 165 164 178 187 209 216Electricity Sales 19 11 7 6 2 2 1Other 11 12 10 10 10 7 9 5 8 10Total for continuing operations 429 451 515 510 563 606 664 621 377 346Discontinued operations 150 50Total 526 395
Financial key figures Share key figures Operational key figures Definitions of key figures
Proposal for the distribution of earnings Auditor’s reportPrimary statements Quarterly financial informationParent company financial statements Investor informationOperating and financial review Key figuresNotes
102

Share of profit of associates and joint ventures by segmentEUR million 2006 2007 2008 2009 2010 2011 2012 2013 2014 2015Power and Technology -9 -23 26 -35 -25 3 -12 4 -14 -111Heat 23 24 12 30 31 19 20Heat, Electricity Sales and Solutions 91 88 59Russia 19 20 8 30 27 46 35 32Distribution 15 18 16 10 19 14 8 4Electricity Sales 1 0 5 0 1 2 0Other 39 222 48 -4 28 23 -20 32 37 40Total for continuing operations 69 241 126 21 62 91 23 178 146 20Discontinued operations 3 0Total 149 20
Capital expenditure by segmentEUR million 2006 2007 2008 2009 2010 2011 2012 2013 2014 2015Power and Technology 95 93 134 96 97 131 190 179 197 187Heat 184 309 408 358 304 297 464Heat, Electricity Sales and Solutions 123 86 105Russia 256 215 599 670 568 435 340 285Distribution 183 236 296 188 213 289 324 255Electricity Sales 8 3 3 1 0 5 1Other 15 14 11 4 9 16 11 12 3 6Total for continuing operations 485 655 1,108 862 1,222 1,408 1,558 1,005 626 582Discontinued operations 147 44Total 774 626
Gross investments in shares by segmentEUR million 2006 2007 2008 2009 2010 2011 2012 2013 2014 2015Power and Technology 5 52 0 57 25 17 - 2 2 16Heat 589 18 23 1 1 32 10Heat, Electricity Sales and Solutions 11 37 23Russia 140 245 1,492 3 - 24 - 0 27 0Distribution 130 1 0 5 0 - - 0Electricity Sales 6 0 0 - - - -Other 40 1 1 1 1 1 6 2 4 4Total for continuing operations 910 317 1,516 67 27 74 16 15 69 43Discontinued operations 0 0Total 69 43
Financial key figures Share key figures Operational key figures Definitions of key figures
Proposal for the distribution of earnings Auditor’s reportPrimary statements Quarterly financial informationParent company financial statements Investor informationOperating and financial review Key figuresNotes
103

Gross divestments of shares by segmentEUR million 2009 2010 2011 2012 2013 2014 2015Power and Technology 10 0 3 102 79 67 0Heat 1 52 203 269Heat, Electricity Sales and Solutions 11 446 27Russia - 43 23 - - 0 0Distribution 1 46 323 37 52Electricity Sales - - 16 2Other 2 6 0 0 - 2 -Total for continuing operations 14 147 568 410 142 515 27Discontinued operations 2,681 6,369Total 3,196 6,395
Net assets by segmentEUR million 2006 2007 2008 2009 2010 2011 2012 2013 2014 2015Power and Technology 5,690 5,599 5,331 5,494 5,806 6,247 6,389 6,355 6,001 5,913Heat 3,407 3,507 3,468 3,787 4,182 4,191 4,286Heat, Electricity Sales and Solutions 2,295 2,112 2,170Russia 294 456 2,205 2,260 2,817 3,273 3,848 3,846 2,597 2,561Distribution 3,412 3,239 3,032 3,299 3,683 3,589 3,889 3,745Electricity Sales 176 247 188 125 210 11 51Other 835 1,237 796 382 29 208 158 295 496 291Total for continuing operations 13,814 14,285 15,020 15,347 16,727 17,519 18,621 16,537 11,206 10,934Net assets related to discontinued operations 2,615 -Total 13,820 10,934
Return on net assets by segment% 2006 2007 2008 2009 2010 2011 2012 2013 2014 2015Power and Technology 17.5 19.2 29.6 24.5 19.5 24.6 18.7 14.5 13.6 -8.5Heat 9.6 9.3 8.9 7.9 8.4 9.9 8.8Heat, Electricity Sales and Solutions 9.7 19.1 7.7Russia 66.3 3.7 0.0 2.4 3.5 3.0 5.2 5.6 8.3Distribution 1) 8.4 7.7 8.1 8.7 9.7 13.7 9.1 9.3 73.6Electricity Sales -1.6 6.9 -14.0 28.9 38.4 4.2 152.3
1) Classified as discontinued operations from 2014 onwards.
Comparable return on net assets by segment% 2006 2007 2008 2009 2010 2011 2012 2013 2014 2015Power and Technology 17.4 18.9 28.0 26.4 22.3 19.9 18.5 13.8 14.2 9.5Heat 9.2 9.2 7.3 7.6 7.7 7.4 7.0Heat, Electricity Sales and Solutions 8.7 8.7 7.9Russia 0.0 -3.8 0.0 0.7 3.5 2.7 5.2 5.6 8.2Distribution 1) 8.3 7.6 8.2 8.6 9.3 8.6 8.8 8.8 9.3Electricity Sales -0.8 -0.6 -15.3 18.6 9.3 33.5 203.1
1) Classified as discontinued operations from 2014 onwards.
Financial key figures Share key figures Operational key figures Definitions of key figures
Proposal for the distribution of earnings Auditor’s reportPrimary statements Quarterly financial informationParent company financial statements Investor informationOperating and financial review Key figuresNotes
104

Average number of personnel2006 2007 2008 2009 2010 2011 2012 2013 2014 2015
Power and Technology 4,147 3,475 3,591 2,068 1,891 1,873 1,896 1,900 1,685 1,389Heat 2,345 2,302 2,422 2,652 2,482 2,682 2,354Heat, Electricity Sales and Solutions 2,051 1,913 1,458Russia 5,566 6,170 4,555 4,436 4,301 4,245 4,196 4,180Distribution 983 1,060 1,222 1,166 1,098 902 873 786Electricity Sales 825 936 766 629 538 510 515Other 610 531 510 593 592 607 661 550 536 983Total for continuing operations 8,910 8,304 14,077 13,278 11,156 11,010 10,600 9,532 8,329 8,009Discontinued operations 492Total 8,821
Financial key figures Share key figures Operational key figures Definitions of key figures
Proposal for the distribution of earnings Auditor’s reportPrimary statements Quarterly financial informationParent company financial statements Investor informationOperating and financial review Key figuresNotes
105
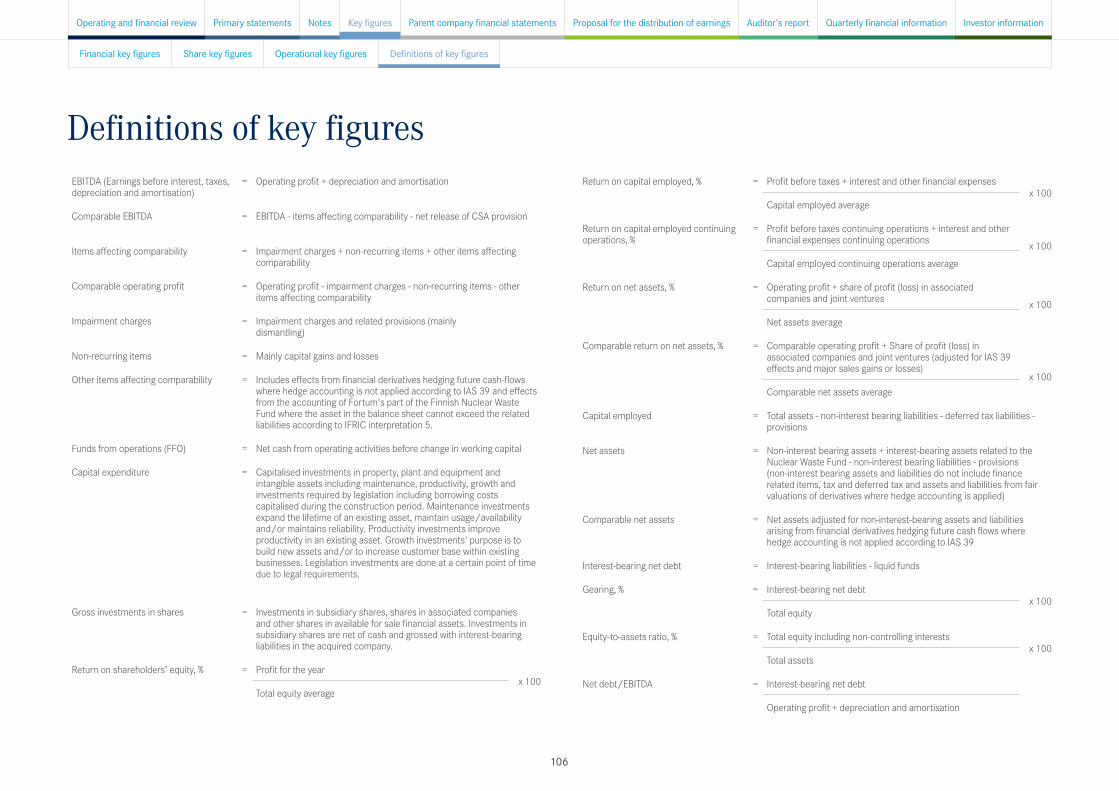
Definitions of key figuresEBITDA (Earnings before interest, taxes, depreciation and amortisation)
= Operating profit + depreciation and amortisation
Comparable EBITDA = EBITDA - items affecting comparability - net release of CSA provision
Items affecting comparability = Impairment charges + non-recurring items + other items affecting comparability
Comparable operating profit = Operating profit - impairment charges - non-recurring items - other items affecting comparability
Impairment charges = Impairment charges and related provisions (mainly dismantling)
Non-recurring items = Mainly capital gains and losses
Other items affecting comparability = Includes effects from financial derivatives hedging future cash-flows where hedge accounting is not applied according to IAS 39 and effects from the accounting of Fortum's part of the Finnish Nuclear Waste Fund where the asset in the balance sheet cannot exceed the related liabilities according to IFRIC interpretation 5.
Funds from operations (FFO) = Net cash from operating activities before change in working capital
Capital expenditure = Capitalised investments in property, plant and equipment and intangible assets including maintenance, productivity, growth and investments required by legislation including borrowing costs capitalised during the construction period. Maintenance investments expand the lifetime of an existing asset, maintain usage/availability and/or maintains reliability. Productivity investments improve productivity in an existing asset. Growth investments' purpose is to build new assets and/or to increase customer base within existing businesses. Legislation investments are done at a certain point of time due to legal requirements.
Gross investments in shares = Investments in subsidiary shares, shares in associated companies and other shares in available for sale financial assets. Investments in subsidiary shares are net of cash and grossed with interest-bearing liabilities in the acquired company.
Return on shareholders’ equity, % = Profit for the yearx 100
Total equity average
Return on capital employed, % = Profit before taxes + interest and other financial expensesx 100
Capital employed average
Return on capital employed continuing operations, %
= Profit before taxes continuing operations + interest and other financial expenses continuing operations x 100
Capital employed continuing operations average
Return on net assets, % = Operating profit + share of profit (loss) in associated companies and joint ventures x 100
Net assets average
Comparable return on net assets, % = Comparable operating profit + Share of profit (loss) in associated companies and joint ventures (adjusted for IAS 39 effects and major sales gains or losses)
x 100 Comparable net assets average
Capital employed = Total assets - non-interest bearing liabilities - deferred tax liabilities - provisions
Net assets = Non-interest bearing assets + interest-bearing assets related to the Nuclear Waste Fund - non-interest bearing liabilities - provisions (non-interest bearing assets and liabilities do not include finance related items, tax and deferred tax and assets and liabilities from fair valuations of derivatives where hedge accounting is applied)
Comparable net assets = Net assets adjusted for non-interest-bearing assets and liabilities arising from financial derivatives hedging future cash flows where hedge accounting is not applied according to IAS 39
Interest-bearing net debt = Interest-bearing liabilities - liquid funds
Gearing, % = Interest-bearing net debtx 100
Total equity
Equity-to-assets ratio, % = Total equity including non-controlling interestsx 100
Total assets
Net debt/EBITDA = Interest-bearing net debt
Operating profit + depreciation and amortisation
Financial key figures Share key figures Operational key figures Definitions of key figures
Proposal for the distribution of earnings Auditor’s reportPrimary statements Quarterly financial informationParent company financial statements Investor informationOperating and financial review Key figuresNotes
106
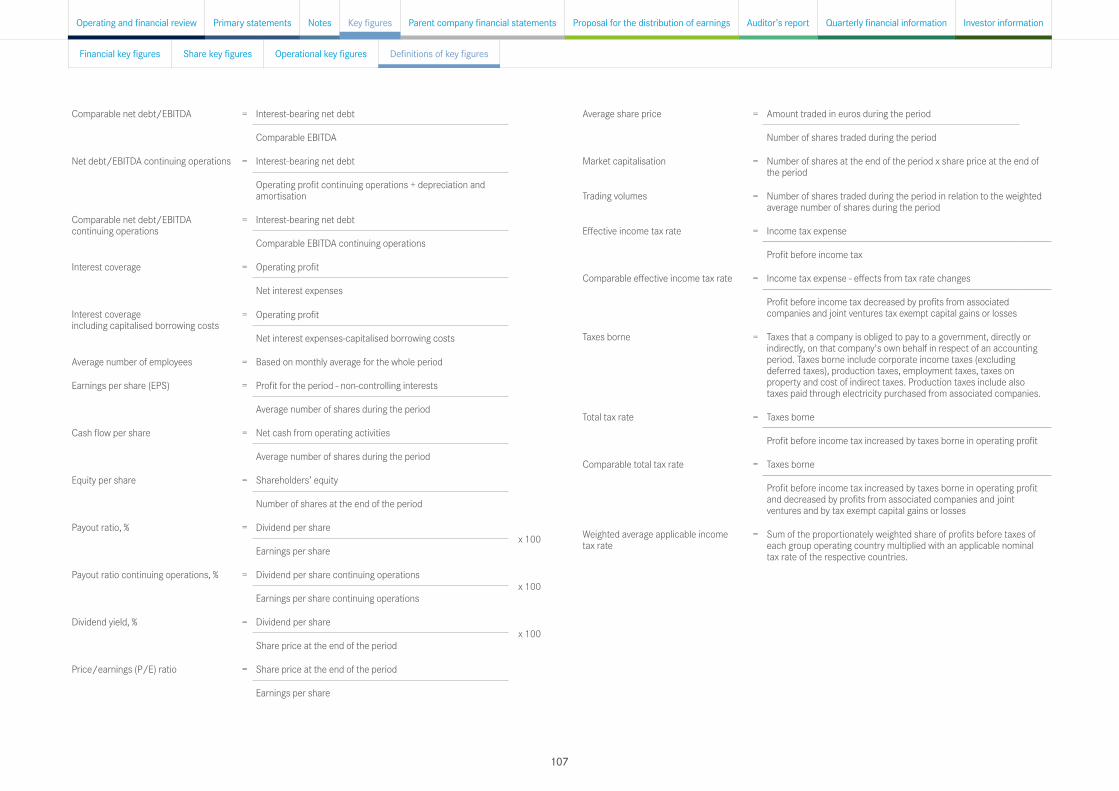
Comparable net debt/EBITDA = Interest-bearing net debt
Comparable EBITDA
Net debt/EBITDA continuing operations = Interest-bearing net debt
Operating profit continuing operations + depreciation and amortisation
Comparable net debt/EBITDA continuing operations
= Interest-bearing net debt
Comparable EBITDA continuing operations
Interest coverage = Operating profit
Net interest expenses
Interest coverage including capitalised borrowing costs
= Operating profit
Net interest expenses-capitalised borrowing costs
Average number of employees = Based on monthly average for the whole period
Earnings per share (EPS) = Profit for the period - non-controlling interests
Average number of shares during the period
Cash flow per share = Net cash from operating activities
Average number of shares during the period
Equity per share = Shareholders’ equity
Number of shares at the end of the period
Payout ratio, % = Dividend per sharex 100
Earnings per share
Payout ratio continuing operations, % = Dividend per share continuing operationsx 100
Earnings per share continuing operations
Dividend yield, % = Dividend per sharex 100
Share price at the end of the period
Price/earnings (P/E) ratio = Share price at the end of the period
Earnings per share
Average share price = Amount traded in euros during the period
Number of shares traded during the period
Market capitalisation = Number of shares at the end of the period x share price at the end of the period
Trading volumes = Number of shares traded during the period in relation to the weighted average number of shares during the period
Effective income tax rate = Income tax expense
Profit before income tax
Comparable effective income tax rate = Income tax expense - effects from tax rate changes
Profit before income tax decreased by profits from associated companies and joint ventures tax exempt capital gains or losses
Taxes borne = Taxes that a company is obliged to pay to a government, directly or indirectly, on that company's own behalf in respect of an accounting period. Taxes borne include corporate income taxes (excluding deferred taxes), production taxes, employment taxes, taxes on property and cost of indirect taxes. Production taxes include also taxes paid through electricity purchased from associated companies.
Total tax rate = Taxes borne
Profit before income tax increased by taxes borne in operating profit
Comparable total tax rate = Taxes borne
Profit before income tax increased by taxes borne in operating profit and decreased by profits from associated companies and joint ventures and by tax exempt capital gains or losses
Weighted average applicable income tax rate
= Sum of the proportionately weighted share of profits before taxes of each group operating country multiplied with an applicable nominal tax rate of the respective countries.
Financial key figures Share key figures Operational key figures Definitions of key figures
Proposal for the distribution of earnings Auditor’s reportPrimary statements Quarterly financial informationParent company financial statements Investor informationOperating and financial review Key figuresNotes
107

Balance sheetEUR million 31 Dec 2015 31 Dec 2014ASSETSNon-current assetsIntangible assets 14 18Property, plant and equipment 4 4Investments in group companies 15,800 16,057Investments in associated companies 6 6Interest-bearing receivables from group companies 714 1,368Interest-bearing receivables from associated companies 13 211Other non-current assets 1 2Deferred tax assets 1 2Total non-current assets 16,553 17,668Current assetsOther current receivables from group companies 458 586Other current receivables from associated companies 0 1Other current receivables 263 170
Deposits and securities (maturity over three months) 4,706 505Cash and cash equivalents 2,939 1,813
Liquid funds 7,645 2,318Total current assets 8,366 3,075Total assets 24,919 20,743
EUR million 31 Dec 2015 31 Dec 2014EQUITYShareholders’ equityShare capital 3,046 3,046Share premium 2,822 2,822Retained earnings 4,284 3,174Profit for the period 1,134 2,265Total shareholders’ equity 11,285 11,307
LIABILITIESNon-current liabilitiesExternal interest-bearing liabilities 4,415 5,269Interest-bearing liabilities to group companies 6,252 2,648Interest-bearing liabilities to associated companies 268 261Other non-current liabilities 5 3Total non-current liabilities 10,940 8,181Current liabilitiesExternal interest-bearing liabilities 1,014 1,083Trade and other payables to group companies 1,545 31Trade and other payables to associated companies 4 3Trade and other payables 131 138Total current liabilities 2,694 1,255Total liabilities 13,634 9,436Total equity and liabilities 24,919 20,743
Changes in shareholders’ equityExtract from parent company financial statements Note 9 Changes in shareholders' equity.
EUR million Share capitalShare
premiumRetained earnings Total
Total equity 31 December 2014 3,046 2,822 5,439 11,307Cash dividend -1,155 -1,155Profit for the period 1,134 1,134Total equity 31 December 2015 3,046 2,822 5,417 11,286
EUR million 2015 2014Distributable funds 31 December 5,417 5,439
Extract of the parent company financial statements
Income statementEUR million 2015 2014Sales 71 76Other income 9 1,959Employee costs -37 -35Depreciation, amortisation and write-downs -9 -9Other expenses -78 -72Operating profit -44 1,919Financial income and expenses 794 -129Profit before extraordinary items 750 1,790Group contributions 1) 447 565Profit before income tax 1,198 2,355Income tax expense -64 -90Profit for the period 1,134 2,265
1) Taxable profits transferred from Finnish subsidiaries.
This extract of the parent company financial statements include income statement, balance sheet, cash flow statement, statement of changes in shareholder's equity and information on the management remuneration for the parent company Fortum Oyj. Parent company financial statements are prepared in accordance with Finnish Accounting Standards (FAS). Please see full parent company financial statements including also the notes to the financial statements in www.fortum.com/investors.
Proposal for the distribution of earnings Auditor’s reportPrimary statements Quarterly financial informationParent company financial statements Investor informationOperating and financial review Key figuresNotes
108

Cash flow statementEUR million 2015 2014Cash flow from operating activitiesProfit for the period 1,134 2,265Adjustments:Income tax expense 64 90Group contributions -447 -565Finance costs - net -794 129Depreciations, amortisation and write-downs 9 9Operating profit before depreciations -35 1,928Non-cash flow items and divesting activities 0 -1,940Interest and other financial income 36 45Interest and other financial expenses paid -147 -168Dividend income 1,060 0Group contribution received 565 609Realised foreign exchange gains and losses -80 -283Taxes -36 -127Funds from operations 1,363 64Other short-term receivables increase(-)/decrease(+) 7 -6Other short-term payables increase(+)/decrease(-) 0 -9Change in working capital 7 -15Net cash from operating activities 1,370 49 Cash flow from investing activitiesCapital expenditures -4 -5Acquisition of shares and capital contributions in subsidiaries -1 0Capital returns from subsidiaries 97 0Acquisition of shares in associated companies 0 -3Acquisition of other shares 0 -2Proceeds from sales of shares in subsidiaries 0 2,093Change in interest-bearing receivables and other non-current assets 854 793Net cash used in investing activities 947 2,876 Cash flow before financing activities 2,317 2,925
Cash flow from financing activitiesProceeds from long-term liabilities 33 46Payment of long-term liabilities -901 -1,340Change in cash-pool liabilities 3,604 1,178Change in short-term liabilities 1,429 -573Dividends paid -1,155 -977Net cash used in financing activities 3,010 -1,666 Net increase(+)/decrease(-) in liquid funds 5,327 1,259 Liquid funds at the beginning of the period 2,318 1,059Liquid funds at the end of the period 7,645 2,318
Management remuneration Extract from audited parent company financial statements Note 4 Employee benefits
EUR thousands
2015 2014
Pekka Lundmark, President and
CEO since 7 Sep 2015
Timo Karttinen, Interim
President and CEO until
6 Sep 2015 2)
Tapio Kuula, President
and CEO until 31 Jan 2015 3)
Tapio Kuula, President and
CEOCompensation for the President and CEO Salaries and fringe benefits 305 372 279 1,005 Performance bonuses 1) 21 15 0 127 Share-based remuneration 114 282 903 235 Pensions (statutory) 55 66 47 188 Pensions (voluntary) 0 37 25 255 Social security expenses 17 20 14 57 Total 513 791 1,269 1,867
EUR thousands 2015 2014Compensation for the Board of Directors 499 477
1) Performance bonuses are based on estimated amounts.2) Includes the compensation CFO Timo Karttinen received during his position as Fortum's Interim President and CEO during 1 February - 6 September 2015 and as a substitute to the President and CEO in January 2015. Also included is a lump sum payment of EUR 70 thousand for his success in assuming the responsibilities of Interim President and CEO.3) Share-based remuneration includes the gross payment Tapio Kuula received from the share plans commenced in 2012, 2013 and 2014. Mr Kuula received the net amount of the payment as shares, after deducting the taxes and tax-related charges arising from the payment. These shares, totalling 30,271 shares, are under lock-up until the spring 2018.
Compensation above is presented on accrual basis. Paid salaries and remunerations in 2015 for the President and CEO Pekka Lundmark were EUR 305 thousand, for Interim President and CEO Timo Karttinen EUR 372 thousand and for former President and CEO Tapio Kuula EUR 1,595 thousand (2014: 1,592).
Timo Karttinen, who assumed responsibility for the duties of the President and CEO during Tapio Kuula's sick leave in December 2014, did not receive any compensation during 2014 for these additional duties.
For the President and CEO Pekka Lundmark the retirement age of old-age pension is 63. The pension obligations for Pekka Lundmark are covered through insurance company and for Timo Karttinen through pension fund. The pension obligation for Tapio Kuula was covered through insurance company.
Board members are not in an employment relationship or service contract with Fortum, and they are not given the opportunity to participate in Fortum's bonus or share bonus systems, nor does Fortum have a pension plan that they can opt to take part in. The compensation of the Board members is not tied to the sustainability performance of the Group.
See Note 11 Employee benefits and Note 32 Pension obligations in the Consolidated financial statements, and section Remuneration on Fortum's webpage.
Proposal for the distribution of earnings Auditor’s reportPrimary statements Quarterly financial informationParent company financial statements Investor informationOperating and financial review Key figuresNotes
109

Proposal for the distribution of earningsThe distributable funds of Fortum Oyj as at 31 December 2015 amounted to EUR 5,417,422,951.23 including the profit of the period of EUR 1,133,611 ,072.83. After theend of the financial period there have been no material changes in the financial positionof the Company.
The Board of Directors proposes to the Annual General Meeting that a dividend of EUR 1.10 per share be paid for 2015.
Espoo, 2 February 2016
Sari Baldauf Kim Ignatius
Minoo Akhtarzand
Heinz-Werner BinzelEva Hamilton
Tapio Kuula
Petteri Taalas Jyrki Talvitie
Pekka LundmarkPresident and CEO
Based on the number of registered shares as of 2 February 2016 the total amount ofdividend proposed to be paid is EUR 977,203,749.50. The Board of Directors proposes,that the remaining part of the profit be retained in the shareholders' equity.
Proposal for the distribution of earnings Auditor’s reportPrimary statements Quarterly financial informationParent company financial statements Investor informationOperating and financial review Key figuresNotes
110

Auditor s̓ reportTo the Annual General Meeting of Fortum Oyj
We have audited the accounting records, the financial statements, the Operating and Financial Review, andthe administration of Fortum Oyj for the financial period 1.1.-31.12.2015. The financial statements compriseof the consolidated income statement, statement of comprehensive income, balance sheet, statement ofchanges in equity, cash flow statement and notes to the consolidated financial statements, as well as the parent company's income statement, balance sheet, cash flow statement and notes to the financial statements.
Responsibility of the Board of Directors and the President and CEO
The Board of Directors and the President and CEO are responsible for the preparation of consolidatedfinancial statements that give a true and fair view in accordance with International Financial ReportingStandards (IFRS) as adopted by the EU, as well as for the preparation of financial statements and theOperating and Financial Review that give a true and fair view in accordance with the laws and regulationsgoverning the preparation of the financial statements and the Operating and Financial Review in Finland. The Board of Directors is responsible for the appropriate arrangement of the control of the company's accounts and finances, and the President and CEO shall see to it that the accounts of the company are in compliance with the law and that its financial affairs have been arranged in a reliable manner.
Auditor's Responsibility
Our responsibility is to express an opinion on the financial statements, on the consolidated financialstatements and on the Operating and Financial Review based on our audit. The Auditing Act requires that we comply with the requirements of professional ethics. We conducted our audit in accordance with goodauditing practice in Finland. Good auditing practice requires that we plan and perform the audit to obtainreasonable assurance about whether the financial statements and the Operating and Financial Review are free from material misstatement, and whether the members of the Board of Directors of the parent company and the President and CEO are guilty of an act or negligence which may result in liability in damages towards the company or have violated the Limited Liability Companies Act or the articles of association of the company.
An audit involves performing procedures to obtain audit evidence about the amounts and disclosures in the financial statements and the Operating and Financial Review. The procedures selected depend on the auditor's judgment, including the assessment of the risks of material misstatement, whether due to fraud or error. In making those risk assessments, the auditor considers internal control relevant to the entity's preparation of financial statements and Operating and Financial Review that give a true and fair view in order to design audit procedures that are appropriate in the circumstances, but not for the purpose of expressing an opinion on the effectiveness of the company's internal control. An audit also includes evaluating the appropriateness of accounting policies used and the reasonableness of
accounting estimates made by management, as well as evaluating the overall presentation of the financial statements and Operating and Financial Review.
We believe that the audit evidence we have obtained is sufficient and appropriate to provide a basis for our audit opinion.
Opinion on the consolidated financial statements
In our opinion, the consolidated financial statements give a true and fair view of the financial position,financial performance, and cash flows of the group in accordance with International Financial ReportingStandards (IFRS) as adopted by the EU.
Opinion on the company's financial statements and the Operating and Financial ReviewIn our opinion, the fmancial statements and the Operating and Financial Review give a true and fair view ofboth the consolidated and the parent company's financial performance and financial position in accordance with the laws and regulations governing the preparation of the financial statements and the Operating and Financial Review in Finland. The information in the Operating and Financial Review is consistent with the information in the financial statements.
Other opinions
We support that the financial statements should be adopted. The proposal by the Board of Directors regarding the treatment of distributable funds is in compliance with the Limited Liability Companies Act. We support that the Board of Directors of the parent company and the President and CEO should be discharged from liability for the financial period audited by us.
Espoo, 2 February 2016
Deloitte & Touche OyAuthorized Public Audit Firm
Jukka VattulainenAuthorized Public Accountant
Proposal for the distribution of earnings Auditor’s reportPrimary statements Quarterly financial informationParent company financial statements Investor informationOperating and financial review Key figuresNotes
111

Selected data based on quarterly consolidated income statement EUR million Q1/2014 Q2/2014 Q3/2014 Q4/2014 2014 Q1/2015 Q2/2015 Q3/2015 Q4/2015 2015IS Sales 1,208 886 861 1,133 4,088 1,040 794 661 964 3,459Comparable EBITDA continuing operations 456 302 242 458 1,457 396 228 163 315 1,102IS Comparable operating profit 358 210 147 370 1,085 343 143 79 243 808IS Operating profit 366 233 113 584 1,296 350 144 -682 38 -150IS Share of profit/loss of associates and joint ventures 69 37 1 38 146 58 22 -95 35 20IS Finance costs - net -62 -47 -54 -47 -210 -57 -24 -42 -52 -175IS Profit before income tax 374 224 61 574 1,232 350 143 -818 20 -305IS Income tax expense -62 -27 -3 -51 -143 -55 -25 160 -2 78IS Profit for the period from continuing operations 312 196 58 523 1,089 295 118 -659 19 -228IS Profit for the period from discontinued operations 1,943 51 27 52 2,073 63 4,306 - - 4,369IS Profit for the period 2,255 247 84 575 3,161 358 4,424 -659 19 4,142IS Non-controlling interests -4 0 1 -4 -7 -4 -1 5 -5 -4IS Profit for the period, owners of the parent 2,251 247 85 571 3,154 354 4,424 -654 14 4,138
Earnings per share for profit from total Fortum Group attributable to the equity owners of the company (EUR per share)Total Fortum 2.53 0.28 0.10 0.64 3.55 0.40 4.98 -0.74 0.02 4.66Continuing operations 0.35 0.22 0.06 0.59 1.22 0.33 0.13 -0.74 0.02 -0.26Discontinued operations 1) 2.18 0.06 0.04 0.05 2.33 0.07 4.85 0.00 0.00 4.92
1) Includes impact from sales gains of Finnish and Norwegian distribution businesses amounting to EUR 2.10 in Q1 and Q2 2014 and sales gain of the Swedish distribution business amounting to EUR 4.82 in Q2 2015.
Note: Quarterly financial information is unaudited.
Sales by quarter, EUR million
2014 2015
Q1 Q2 Q3 Q4
2,000
1,500
1,000
500
0
Comparable operating profit by quarter, EUR million
2014 2015
500
400
300
200
100
0Q1 Q2 Q3 Q4
Quarterly financial information
Proposal for the distribution of earnings Auditor’s reportPrimary statements Quarterly financial informationParent company financial statements Investor informationOperating and financial review Key figuresNotes
112
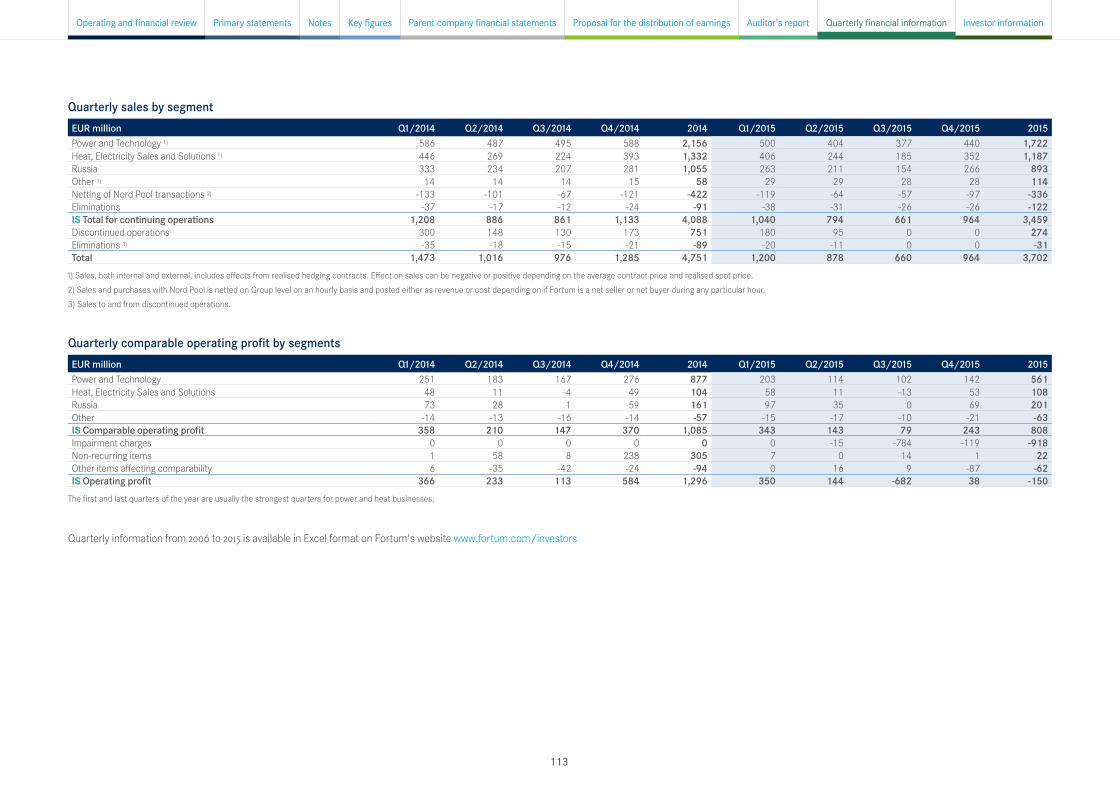
Quarterly sales by segmentEUR million Q1/2014 Q2/2014 Q3/2014 Q4/2014 2014 Q1/2015 Q2/2015 Q3/2015 Q4/2015 2015Power and Technology 1) 586 487 495 588 2,156 500 404 377 440 1,722Heat, Electricity Sales and Solutions 1) 446 269 224 393 1,332 406 244 185 352 1,187Russia 333 234 207 281 1,055 263 211 154 266 893Other 1) 14 14 14 15 58 29 29 28 28 114Netting of Nord Pool transactions 2) -133 -101 -67 -121 -422 -119 -64 -57 -97 -336Eliminations -37 -17 -12 -24 -91 -38 -31 -26 -26 -122IS Total for continuing operations 1,208 886 861 1,133 4,088 1,040 794 661 964 3,459Discontinued operations 300 148 130 173 751 180 95 0 0 274Eliminations 3) -35 -18 -15 -21 -89 -20 -11 0 0 -31Total 1,473 1,016 976 1,285 4,751 1,200 878 660 964 3,702
1) Sales, both internal and external, includes effects from realised hedging contracts. Effect on sales can be negative or positive depending on the average contract price and realised spot price. 2) Sales and purchases with Nord Pool is netted on Group level on an hourly basis and posted either as revenue or cost depending on if Fortum is a net seller or net buyer during any particular hour.3) Sales to and from discontinued operations.
Quarterly comparable operating profit by segmentsEUR million Q1/2014 Q2/2014 Q3/2014 Q4/2014 2014 Q1/2015 Q2/2015 Q3/2015 Q4/2015 2015Power and Technology 251 183 167 276 877 203 114 102 142 561Heat, Electricity Sales and Solutions 48 11 -4 49 104 58 11 -13 53 108Russia 73 28 1 59 161 97 35 0 69 201Other -14 -13 -16 -14 -57 -15 -17 -10 -21 -63IS Comparable operating profit 358 210 147 370 1,085 343 143 79 243 808Impairment charges 0 0 0 0 0 0 -15 -784 -119 -918Non-recurring items 1 58 8 238 305 7 0 14 1 22Other items affecting comparability 6 -35 -42 -24 -94 0 16 9 -87 -62IS Operating profit 366 233 113 584 1,296 350 144 -682 38 -150
The first and last quarters of the year are usually the strongest quarters for power and heat businesses.
Quarterly information from 2006 to 2015 is available in Excel format on Fortum's website www.fortum.com/investors
Proposal for the distribution of earnings Auditor’s reportPrimary statements Quarterly financial informationParent company financial statements Investor informationOperating and financial review Key figuresNotes
113

Investor informationFortum Corporation’s financial statements include the financial statements of the parent company and the consolidated financial statements of the group. The operating and financial review is attached to the financial statements. Fortum’s 2015 reporting entity, including Financial Statements, Corporate Governance Statement, Remuneration as well as Tax footprint, are published at the same time. Fortum's sustainability reporting is integrated part of annual reporting and the company publishes also additional information on sustainability operations on Fortum's website in Sustainability section.
Annual General Meeting
The Annual General Meeting of Fortum Corporation will be held on Tuesday, 5 April 2016, starting at 14:00 EET at Finlandia Hall, address: Mannerheimintie 13 e, Helsinki, Finland. The reception of shareholders who have registered for the meeting will commence at 13.00 EET.
Payment of dividends
The Board of Directors proposes to the Annual General Meeting that Fortum Corporation pays a dividend of EUR 1.10 per share for 2015, totalling approximately EUR 977 million based on the registered shares as of 3 February 2016.The possible dividend related dates planned for 2016 are: • the ex-dividend date 6 April 2016, • the record date for dividend payment 7 April 2016 and • the dividend payment date 14 April 2016.
Financial information in 2016
Fortum will publish three interim reports in 2016: January-March interim report on 28 April, January-June interim report on 20 July, and January-September on 25 October.
The reports are published at approximately 9:00 EET in Finnish and English, and are available on Fortum's website at www.fortum.com/investors
Fortum's management hosts regular press conferences, targeted at analysts and the media. A webcast of these conferences is available online at www.fortum.com. Management also gives interviews on a one-on-one and group basis. Fortum observes a silent period of 30 days prior to publishing its results.
Fortum’s activities in capital markets during 2015Fortum’s Investor Relations (IR) activities cover equity and fixed-income markets to ensure full and fair valuation of the Company’s shares, access to funding sources and stable bond pricing. Investors and analysts primarily are met on a regular basis in Europe and North America.
In 2015, Fortum met approximately 250 professional equity investors individually or in group meetings, whilst maintaining regular contact with equity research analysts at investment banks and brokerage firms. During the year, IR and senior management gave approximately 15 presentations at investor conferences and seminars in Scandinavia and the United Kingdom.
Fortum share basics
Listed on Nasdaq Helsinki Trading ticker: FUM1V Number of shares, 3 February 2016: 888,367,045. Sector: Utilities
Financial Statements Bulletin2015, February 3rdFinancial Statements 2015, February 25th
Annual General Meeting, April 5thInterim Report January–March 2016, April 28th
Interim Report January–September 2016, October 25th
Interim Report January–June 2016, July 20th
Q2Q3
2016
Q4 Q1
Proposal for the distribution of earnings Auditor’s reportPrimary statements Quarterly financial informationParent company financial statements Investor informationOperating and financial review Key figuresNotes
114