financial statements for the year ended 30 june 2019 and... · queensland rail’s financial report...
TRANSCRIPT

Financial Statements for the Year Ended 30 June 2019 Below Rail Services Provided by Queensland Rail

2
Financial Statements pursuant to the Access Undertaking
Contents Page Purpose and Scope of the Financial Statements 3
Statement of Earnings before Interest and Tax 4
Statement of Assets 5
Statement of Investments 6
Notes to and forming part of the Financial Statements
1. Basis of Preparation 7 2. Below Rail Services Provided by Queensland Rail 8 3. Costing Manual 8 4. West Moreton Region 8 5. Mount Isa Region 8 6. North Coast Region 9 7. Internal Charges 9 8. Revenue Net Off 9 9. Allocated Items 10 10. Maintenance Costing Methodology 12 11. Other Relevant Matters 13 12. Reconciliation to General Purpose Income Statement 15
Glossary 16
Certificate of Queensland Rail 19
Independent auditor’s report 20
3
Financial Statements pursuant to the Access Undertaking
Purpose and Scope of the Financial Statements These are the Below Rail Financial Statements of Queensland Rail Limited (ABN 71 132 181 090) (QR). Queensland Rail is a statutory authority established under the Queensland Rail Transit Authority Act 2013 (Qld) (QRTA Act) and is a statutory body for the purposes of the Financial Accountability Act 2009 (Qld) and the Statutory Bodies Financial Arrangements Act 1982 (Qld). Queensland Rail’s functions are detailed in section 9 of the QRTA Act. Queensland Rail discharges its statutory functions through its wholly owned subsidiary Queensland Rail Limited. Queensland Rail Limited does not employ any personnel but owns all non-employee related assets and contracts. It performs the role of rail transport operator under the Transport (Rail Safety) Act 2010. Section 250 (1)(b) of the Queensland Competition Authority Act 1997 (QCA Act), declares the use of rail transport infrastructure for which Queensland Rail, or a successor, assign or subsidiary of Queensland Rail is the rail manager, as a declared service under part 5, division 2 of the QCA Act. Clause 5.3.1 of the Queensland Rail’s Access Undertaking 1 (AU1) requires the annual publication of financial statements for Below Rail Services provided by Queensland Rail. Below Rail Services are the activities associated with the provision and management of rail infrastructure, including the construction, maintenance and renewal of rail infrastructure assets, and the network management services required for the safe operation of Train Services on the rail infrastructure, including Train Control Services and the implementation of safeworking procedures. For the purposes of these financial statements, Below Rail Services excludes passenger stations and associated facilities as they are not required to enable the operation of freight train services. In order to prepare financial statements for the Below Rail Services, there are certain adjustments to exclude non-below rail transactions that have been accounted for within the Queensland Rail legal entity. This means the Below Rail Services financial statements do not fully reflect the statutory financial position of Queensland Rail. These financial statements are prepared in accordance with the Costing Manual and take the form of a Statement of Earnings before Interest and Tax, a Statement of Assets and a Statement of Investments, and separately identify the West Moreton, Mount Isa and North Coast Regions from the rest of the network. These financial statements report only those revenues, expenses, assets and investments that are identified, attributed and allocated to the provision of Below Rail Services by Queensland Rail.

4
Financial Statements pursuant to the Access Undertaking
BELOW RAIL SERVICES PROVIDED BY QUEENSLAND RAIL
STATEMENT OF EARNINGS BEFORE INTEREST AND TAX
FOR THE YEAR ENDED 30 JUNE 2019 FOR THE YEAR ENDED 30 JUNE 2018 West Mount North Total West Mount North Total Moreton Isa Coast Rest of Below Moreton Isa Coast Rest of Below Region Region Region Network Rail Region Region Region Network Rail $000's $000's $000's $000's $000's $000's $000's $000's $000's $000's REVENUE Access charges - coal 46,704 - - 20,198 66,902 44,291 - - 20,181 64,472 Access charges - other 769 71,766 46,220 132,143 250,898 928 74,301 46,374 130,260 251,863
Transport Service Contracts 476 - 194,974 465,818 661,268 743 - 152,339 413,632 566,714
Contributions from developers 72 - - - 72 288 - - - 288
Other 781 1,446 3,363 6,676 12,266 859 1,300 3,332 6,318 11,809 Total Revenue 48,802 73,212 244,557 624,835 991,406 47,109 75,601 202,045 570,391 895,146 OPERATING EXPENSES
Infrastructure maintenance
26,876 28,593 89,639 204,851 349,959 22,482 39,642 87,840 239,150 389,114
Derailment / collision / flood repairs
2,064 27,519 2,397 1,438 33,418 608 1,234 2,701 2,612 7,155
Train operations management
4,511 3,605 10,562 30,833 49,511 4,337 3,419 9,948 27,793 45,497
Other expenses 8,366 13,572 18,660 45,719 86,317 6,088 6,202 14,577 40,695 67,562 Corporate overhead 3,091 5,145 11,328 28,573 48,137 1,317 2,431 5,064 11,443 20,255 Depreciation and amortisation
12,065 13,610 27,620 127,793 181,088 7,600 6,420 24,570 100,926 139,516
Total Expenses 56,973 92,044 160,206 439,207 748,430 42,432 59,348 144,700 422,619 669,099 EARNINGS BEFORE INTEREST AND TAX
(8,171) (18,832) 84,351 185,628 242,976 4,677 16,253 57,345 147,772 226,047
The above statement of earnings before interest and tax should be read in conjunction with the accompanying notes.
5
Financial Statements pursuant to the Access Undertaking
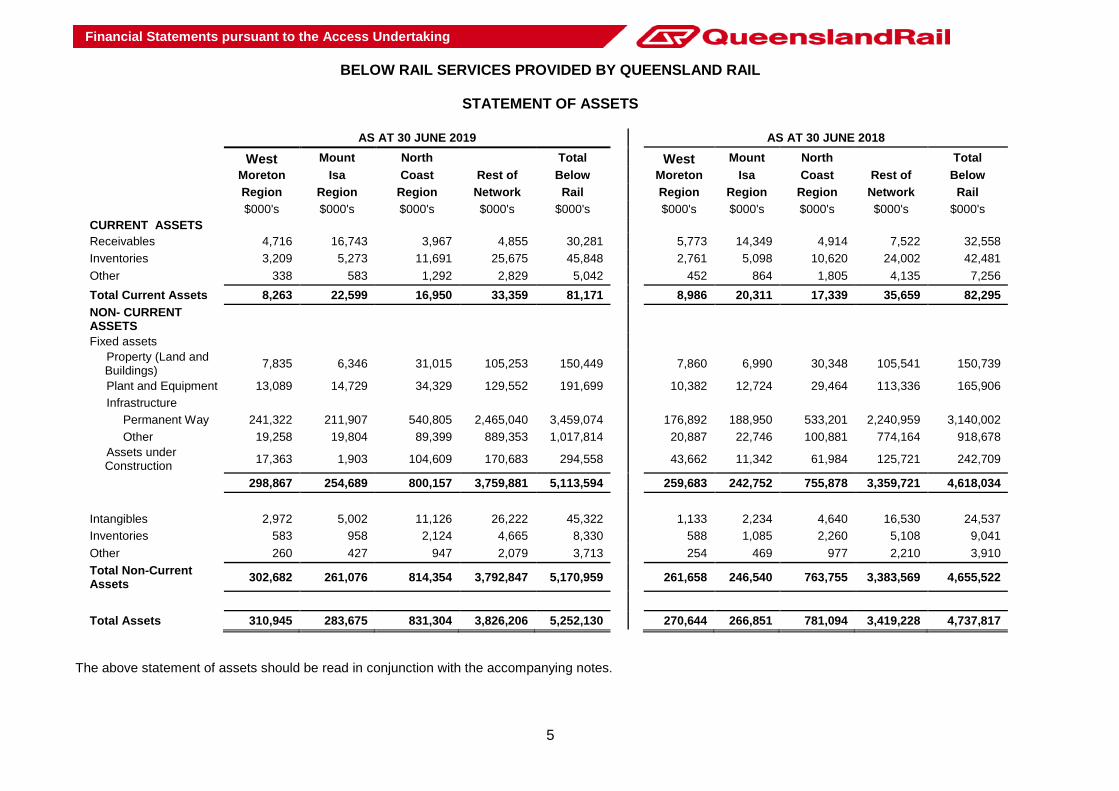
BELOW RAIL SERVICES PROVIDED BY QUEENSLAND RAIL
STATEMENT OF ASSETS
AS AT 30 JUNE 2019 AS AT 30 JUNE 2018 West Mount North Total West Mount North Total Moreton Isa Coast Rest of Below Moreton Isa Coast Rest of Below Region Region Region Network Rail Region Region Region Network Rail $000's $000's $000's $000's $000's $000's $000's $000's $000's $000's CURRENT ASSETS Receivables 4,716 16,743 3,967 4,855 30,281 5,773 14,349 4,914 7,522 32,558 Inventories 3,209 5,273 11,691 25,675 45,848 2,761 5,098 10,620 24,002 42,481 Other 338 583 1,292 2,829 5,042 452 864 1,805 4,135 7,256 Total Current Assets 8,263 22,599 16,950 33,359 81,171 8,986 20,311 17,339 35,659 82,295 NON- CURRENT ASSETS
Fixed assets Property (Land and
Buildings) 7,835 6,346 31,015 105,253 150,449 7,860 6,990 30,348 105,541 150,739
Plant and Equipment 13,089 14,729 34,329 129,552 191,699 10,382 12,724 29,464 113,336 165,906 Infrastructure
Permanent Way 241,322 211,907 540,805 2,465,040 3,459,074 176,892 188,950 533,201 2,240,959 3,140,002 Other 19,258 19,804 89,399 889,353 1,017,814 20,887 22,746 100,881 774,164 918,678 Assets under
Construction 17,363 1,903 104,609 170,683 294,558 43,662 11,342 61,984 125,721 242,709 298,867 254,689 800,157 3,759,881 5,113,594 259,683 242,752 755,878 3,359,721 4,618,034
Intangibles 2,972 5,002 11,126 26,222 45,322 1,133 2,234 4,640 16,530 24,537 Inventories 583 958 2,124 4,665 8,330 588 1,085 2,260 5,108 9,041 Other 260 427 947 2,079 3,713 254 469 977 2,210 3,910 Total Non-Current Assets 302,682 261,076 814,354 3,792,847 5,170,959 261,658 246,540 763,755 3,383,569 4,655,522
Total Assets 310,945 283,675 831,304 3,826,206 5,252,130 270,644 266,851 781,094 3,419,228 4,737,817 The above statement of assets should be read in conjunction with the accompanying notes.

6
Financial Statements pursuant to the Access Undertaking
BELOW RAIL SERVICES PROVIDED BY QUEENSLAND RAIL
STATEMENT OF INVESTMENTS
FOR THE YEAR ENDED 30 JUNE 2019 FOR THE YEAR ENDED 30 JUNE 2018 West Mount North Total West Mount North Total Moreton Isa Coast Rest of Below Moreton Isa Coast Rest of Below Region Region Region Network Rail Region Region Region Network Rail $000's $000's $000's $000's $000's $000's $000's $000's $000's $000's
Expenditure on fixed assets 55,508 43,295 99,653 206,777 405,233 53,634 27,108 62,837 220,388 363,967 The above statements of investments should be read in conjunction with the accompanying notes.

7
Financial Statements pursuant to the Access Undertaking
NOTES TO AND FORMING PART OF THE FINANCIAL STATEMENTS 1. Basis of Preparation These financial statements represent a special purpose financial report prepared specifically to meet the
information needs of the Queensland Competition Authority (QCA) and access seekers who may seek access to rail infrastructure for the purpose of operating trains. Accordingly, this special purpose financial report may not be suitable for any other purpose.
These financial statements have been prepared in accordance with:
(a) Clause 5.3.1 of the Queensland Rail’s Access Undertaking 1. (b) The methodology and format set out in the Costing Manual for preparing Queensland Rail’s 2018-19
regulatory accounts as approved by QCA on 16 June 2017. Refer to Note 3 for the details of the Costing Manual.
The recognition and measurement requirements of the Australian Accounting Standards, the Financial and Performance Management Standard 2009, the Queensland Treasury Financial Reporting Requirements for Queensland Government Agencies and other authoritative pronouncements of the Australian Accounting Standards Board applicable to Queensland Rail’s general purpose financial statements reported in Queensland Rail’s Financial Report for the year ended 30 June 2019 are applicable in the preparation of these statements, unless specifically stated otherwise. For a summary of the significant accounting policies used, refer to Notes to the general-purpose financial statements of Queensland Rail for the year ended 30 June 2019.
Statement of Earnings before Interest and Tax
The source of information for the Statement of Earnings before Interest and Tax is the accounting records of Queensland Rail. In preparing the Statement of Earnings before Interest and Tax these accounts have been adjusted for this special purpose reporting by the addition of revenue net off (see Note 8), and treatment of internal charges as revenue (see Note 7).
Statement of Assets
The source of information for the Statement of Assets comprises the asset accounts and values from the balance sheet of Queensland Rail. The deferred tax assets reported on the balance sheet of Queensland Rail has been offset against deferred tax liabilities and the resulting net liability excluded from the Statement of Assets.
Statement of Investments
The Statement of Investments has been based on internal capital expenditure reports, and relates to those capital projects which have incurred capital expenditure during the year ended 30 June 2019, with assets either commissioned during the year or remaining in the assets under construction balance at 30 June 2019.
Comparative Information
Comparative information in these financial statements has not been restated for changes in network ownership, Queensland Rail Access Undertaking 1 or Queensland Rail’s Costing Manual unless specifically stated otherwise.

8
Financial Statements pursuant to the Access Undertaking
NOTES TO AND FORMING PART OF THE FINANCIAL STATEMENTS (Cont.) 2. Below Rail Services Provided by Queensland Rail
Below Rail Services provided by Queensland Rail are the activities associated with the provision and management of Rail Infrastructure for which Queensland Rail is the Railway Manager, and the network management services required for the safe operation of Train Services on the Rail Infrastructure, including Train Control Services and the implementation of safeworking procedures. For the purposes of these statements Below Rail services exclude infrastructure and activities associated with the provision of passenger stations and platforms.
3. Costing Manual The QCA approved a Costing Manual applicable to Queensland Rail on 16 June 2017. The Costing Manual details the format and methodology used in the preparation of these financial statements. Standard Allocators The Costing Manual approved by the QCA on 16 June 2017 was updated with the following Standard Allocators for the 2018/19 financial year which was approved by the QCA on 14 February 2019.
2018-19 2017-18
A Share of Queensland Rail Wide Items Allocated to Below Rail Services provided by Queensland Rail 45.0% 45.0%
B Operations Management “Mark Up” 0.0% 0.0%
C West Moreton Region’s Share of Network Wide Items 7.0% 6.5%
D Mount Isa Region’s Share of Network Wide Items 11.5% 12.0%
E North Coast Region’s Share of Network Wide Items 25.5% 25.0%
4. West Moreton Region The Costing Manual requires the Financial Statements to separately identify the West Moreton Region from
the Rest of Network. The West Moreton Region represents the following rail corridors: • Rosewood to Miles • Columboola to Cameby Downs
5. Mount Isa Region The Costing Manual requires the Financial Statements to separately identify the Mount Isa Region from the
Rest of Network. The Mount Isa Region represents the following rail corridors: • Stuart to Mount Isa • Flynn to Phosphate Hill

9
Financial Statements pursuant to the Access Undertaking
NOTES TO AND FORMING PART OF THE FINANCIAL STATEMENTS (Cont.)
6. North Coast Region The Costing Manual requires the Financial Statements to separately identify the North Coast Region from
the Rest of Network. The North Coast Region represents the following rail corridors: • Nambour to Aurizon Interface Point 11 (Parana) • Gympie North to Gympie • Maryborough West to Maryborough • Auckland Point • Aurizon Interface Point 7 (Rocklands) to Aurizon Interface Point 2 (Durroburra) • Glenmore to Nerimbera • Aurizon Interface Point 1 (Kaili) to Townsville • Erakala to Mackay Harbour • Bowen Jct to Bowen • Townsville Jetty Branch • Townsville to Cairns • Cobarra Balloon • North Coast Line Branches:
o Aurizon Interface Point 12 (Graham) – Taragoola
7. Internal Charges Internal charges for Below Rail Services provided are treated as revenue. Internal charges treated as revenue
are access charges, telecommunications charges and ancillary infrastructure charges. The total internal charges reported as Below Rail Services revenue in 2018-19 was $150.4 million ($148.1 million in 2017-18). Included in the telecommunication charges to Above Rail, is a capital charge of $3.2m ($3.0 million in 2017-18).
8. Revenue Net Off
Clause 3.4 of Queensland Rail’s Costing Manual requires that certain non-sales revenues be netted off against related expenses in the preparation of the Statement of Earnings before Interest and Tax. The list of transactions netted off against related expense is: (a) Revenue that is a direct cost reimbursement; (b) Proceeds from the sale of scrap; and (c) Non-sales revenue recorded in corporate overhead and corporate service areas.
The total revenue offset against expenses for 2018-19 is $59.3 million ($33.2 million in 2017-18) of which $42.1 million ($20.8 million in 2017-18) relates to Below Rail Services.

10
Financial Statements pursuant to the Access Undertaking
NOTES TO AND FORMING PART OF THE FINANCIAL STATEMENTS (Cont.) 9. Allocated Items
This Note provides details of the value of network wide revenue, expenses, assets and investments allocated to Regions using Standard Allocators C, D and E. The balance of Below Rail Services revenue, expenses, assets and investments have been either directly identified to regions (including identified to corridors), or attributed to regions on a causal basis. Network wide items have been allocated to West Moreton, Mount Isa and North Coast Regions using the Standard Allocators C, D and E that applied in the respective year.
(a) Statement of Earnings before Interest and Tax
The following table shows the allocated and attributed or identified Below Rail Services revenues and expenses:
YEAR ENDED 30 JUNE 2019 YEAR ENDED 30 JUNE 2018 Allocated Identified / Total Allocated Identified / Total Network Attributed Below Network Attributed Below Wide To Regions Rail Wide To Regions Rail $000's $000's $000's $000's $000's $000's REVENUE Access charges - coal - 66,902 66,902 - 64,472 64,472 Access charges - other - 250,898 250,898 - 251,863 251,863 Transport Service Contracts - 661,268 661,268 - 566,714 566,714 Contributions from developers - 72 72 - 288 288 Other 11,881 385 12,266 11,325 484 11,809 Total Revenue 11,881 979,525 991,406 11,325 883,821 895,146 OPERATING EXPENSES Infrastructure maintenance - 349,959 349,959 7,613 381,501 389,114 Derailment / collision / flood repairs - 33,418 33,418 - 7,155 7,155
Train operations management - 49,511 49,511 - 45,497 45,497 Other expenses 52,336 33,981 86,317 45,908 21,654 67,562 Corporate overhead 48,137 - 48,137 20,255 - 20,255 Depreciation and amortisation - 181,088 181,088 - 139,516 139,516 Total Operating Expenses 100,473 647,957 748,430 73,776 595,323 669,099
Included in the Other expenses are telecommunications costs of $16.5 million ($13.5 million in 2017-18). This was made up of maintenance costs of $7.8 million ($7.6 million in 2017-18), depreciation of $9.8 million ($8.5 million in 2017-18) and other expenses of $9.8 million ($8.1 million in 2017-18) offset by $6.4 million ($6.5 million in 2017-18) to Above Rail as internal charges and $4.5 million external revenue ($4.2 million in 2017-18). Below Rail Services has restated its previously reported access charges for the year ended 30 June 2018 and all related disclosures to conform to the presentation adopted in the current year. The impact of the correction is QCA levy fees of $2.45 million previously presented within “Access charges – other” is now reported under “Access charges – coal”.

11
Financial Statements pursuant to the Access Undertaking
NOTES TO AND FORMING PART OF THE FINANCIAL STATEMENTS (Cont.)
9. Allocated Items (Cont.) (b) Statement of Assets
The following table shows the allocated and attributed or identified Below Rail assets:
YEAR ENDED 30 JUNE 2019 YEAR ENDED 30 JUNE 2018 Allocated Identified / Total
Allocated Identified / Total Network Attributed Below Network Attributed Below Wide To Regions Rail Wide To Regions Rail $000's $000's $000's $000's $000's $000's Current Assets Receivables 2,384 27,897 30,281 1,510 31,048 32,558 Inventories 45,848 - 45,848 42,481 - 42,481 Other 4,715 327 5,042 6,864 392 7,256 Total Current Assets 52,947 28,224 81,171 50,855 31,440 82,295 Non-Current Assets Fixed assets
Property (Land and Buildings) 35,908 114,541 150,449 38,867 111,872 150,739 Plant and Equipment 2,479 189,220 191,699 45,384 120,522 165,906 Infrastructure
Permanent Way 8 3,459,066 3,459,074 - 3,140,002 3,140,002 Other 4,908 1,012,906 1,017,814 68,410 850,268 918,678 Assets under Construction 6,867 287,691 294,558 18,834 223,875 242,709 50,170 5,063,424 5,113,594 171,495 4,446,539 4,618,034
Intangibles 41,979 3,343 45,322 16,546 7,991 24,537 Inventories 8,330 - 8,330 9,041 - 9,041 Other 3,713 - 3,713 3,910 - 3,910 Total Non-Current Assets 104,192 5,066,767 5,170,959 200,992 4,454,530 4,655,522
Total Assets 157,139 5,094,991 5,252,130 251,847 4,485,970 4,737,817 Below Rail network wide assets include $69.3 million for telecommunications infrastructure ($65.4 million in 2017-18).
(c) Statement of Investments The following table shows the allocated and attributed or identified Below Rail investments:
YEAR ENDED 30 JUNE 2019 YEAR ENDED 30 JUNE 2018 Allocated Identified / Total
Allocated Identified / Total Network Attributed Below Network Attributed Below Wide To Regions Rail Wide To Regions Rail $000's $000's $000's $000's $000's $000's
Expenditure on fixed assets 21,703 383,530 405,233 46,663 317,304 363,967
12
Financial Statements pursuant to the Access Undertaking
NOTES TO AND FORMING PART OF THE FINANCIAL STATEMENTS (Cont.)
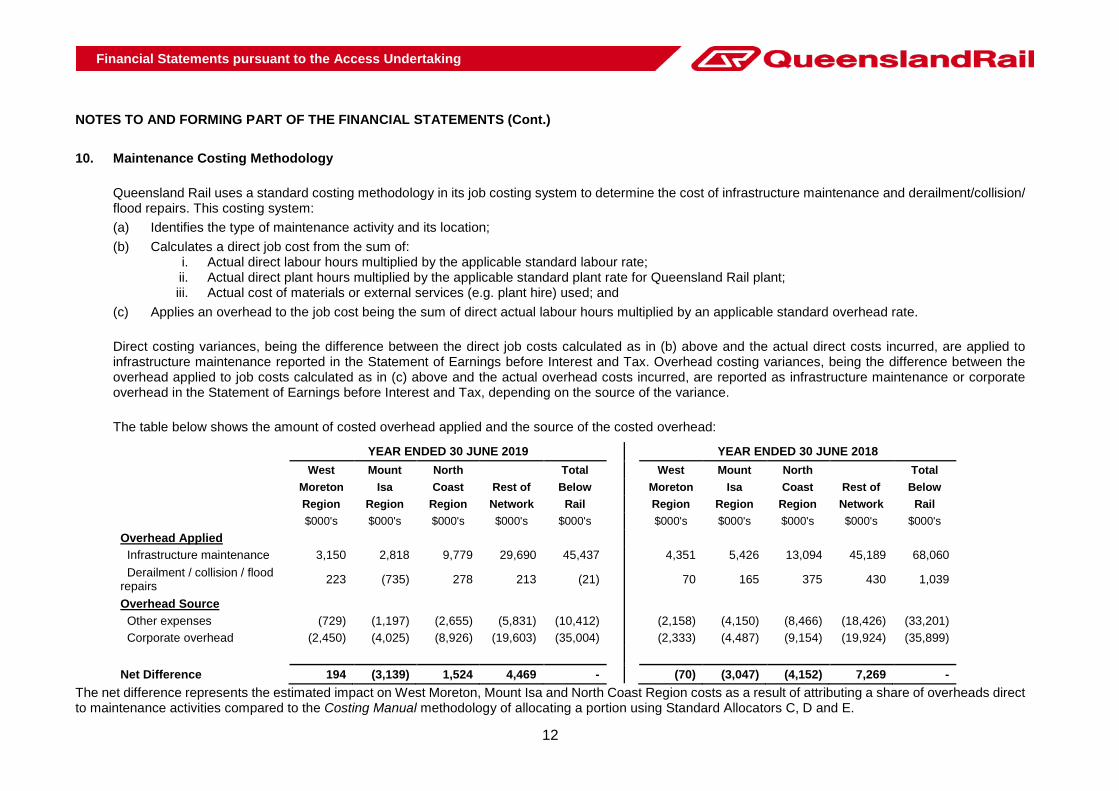
10. Maintenance Costing Methodology Queensland Rail uses a standard costing methodology in its job costing system to determine the cost of infrastructure maintenance and derailment/collision/ flood repairs. This costing system: (a) Identifies the type of maintenance activity and its location; (b) Calculates a direct job cost from the sum of:
i. Actual direct labour hours multiplied by the applicable standard labour rate; ii. Actual direct plant hours multiplied by the applicable standard plant rate for Queensland Rail plant; iii. Actual cost of materials or external services (e.g. plant hire) used; and
(c) Applies an overhead to the job cost being the sum of direct actual labour hours multiplied by an applicable standard overhead rate.
Direct costing variances, being the difference between the direct job costs calculated as in (b) above and the actual direct costs incurred, are applied to infrastructure maintenance reported in the Statement of Earnings before Interest and Tax. Overhead costing variances, being the difference between the overhead applied to job costs calculated as in (c) above and the actual overhead costs incurred, are reported as infrastructure maintenance or corporate overhead in the Statement of Earnings before Interest and Tax, depending on the source of the variance.
The table below shows the amount of costed overhead applied and the source of the costed overhead:
YEAR ENDED 30 JUNE 2019 YEAR ENDED 30 JUNE 2018 West Mount North Total West Mount North Total Moreton Isa Coast Rest of Below Moreton Isa Coast Rest of Below Region Region Region Network Rail Region Region Region Network Rail $000's $000's $000's $000's $000's $000's $000's $000's $000's $000's Overhead Applied Infrastructure maintenance 3,150 2,818 9,779 29,690 45,437 4,351 5,426 13,094 45,189 68,060 Derailment / collision / flood repairs 223 (735) 278 213 (21) 70 165 375 430 1,039
Overhead Source Other expenses (729) (1,197) (2,655) (5,831) (10,412) (2,158) (4,150) (8,466) (18,426) (33,201) Corporate overhead (2,450) (4,025) (8,926) (19,603) (35,004) (2,333) (4,487) (9,154) (19,924) (35,899) Net Difference 194 (3,139) 1,524 4,469 - (70) (3,047) (4,152) 7,269 -
The net difference represents the estimated impact on West Moreton, Mount Isa and North Coast Region costs as a result of attributing a share of overheads direct to maintenance activities compared to the Costing Manual methodology of allocating a portion using Standard Allocators C, D and E.

13
Financial Statements pursuant to the Access Undertaking
NOTES TO AND FORMING PART OF THE FINANCIAL STATEMENTS (Cont.)
11. Other Relevant Matters (a) Attribution of Coal Access Charges
Access charges for coal traffic relate mostly to coal trains that originate from mines in the West Moreton Region for unloading at the Port of Brisbane. These hauls are on rail corridors in both the West Moreton Region and the Metropolitan Region, which is reported in Rest of Network. Revenue for coal access charges may include a number of pricing components which have been attributed to regions as follows:
1. AT1 component is applied as a rate per thousand gross tonne kilometres (GTK), and is directly identified with the GTK recorded for specific corridors.
2. AT2 component (if applicable) is a fixed amount per Reference Train Service, and has been attributed to rail corridors based on the GTK recorded.
3. Other component typically relates to payments and rebates for specific infrastructure which are identified to regions based on the value of related infrastructure in the region, and the levy for QCA fees and payments arising from contract take or pay provisions which are attributed to corridors in line with the AT1 component.
The following table shows the breakdown by pricing component of the coal access charge revenue:
YEAR ENDED 30 JUNE 2019 YEAR ENDED 30 JUNE 2018 West Mount North Rest of West Mount North Rest of Price Components Moreton Isa Coast Network Total Moreton Isa Coast Network Total $000's $000's $000's $000's $000's $000's $000's $000's $000's $000's
1. AT1 21,475 - - 10,062 31,537 22,459 - - 10,359 32,818 2. AT2 21,017 - - 8,138 29,155 21,547 - - 8,319 29,866 3. Other 4,212 - - 1,998 6,210 285 - - 1,503 1,788
Total 46,704 - - 20,198 66,902 44,291 - - 20,181 64,472
The Other component (item 3 above), includes $7.9 million ($6.4 million for West Moreton Region) in Access Facilitation Deed revenue, $1.0 million ($0.7 million for West Moreton Region) related to QCA Levy charges, which is partially offset by $2.8 million in West Moreton Region coal rebates. There were no new Endorsed Variation or Review Event reference tariff adjustments in 2018/19. Below Rail Services has restated its previously reported access charges for the year ended 30 June 2018 and all related disclosures to conform to the presentation adopted in the current year. The impact of the correction is QCA levy fees of $2.45 million previously presented within “Access charges – other” is now reported under “Access charges – coal”.

14
Financial Statements pursuant to the Access Undertaking
NOTES TO AND FORMING PART OF THE FINANCIAL STATEMENTS (Cont.) 11. Other Relevant Matters (cont.)
(b) Depreciation and amortisation
Depreciation and amortisation reported in the Statement of Earnings before Interest and Tax relates only to rail infrastructure held for the provision of Below Rail Services. Other depreciation and amortisation expenses relating to assets held for maintenance or administration activities (e.g. for buildings, plant and equipment and depot facilities) have been reclassified as a working expense of those activities. See Note 12 for further details.
(c) Treatment of plant and equipment assets
Below Rail Services plant and equipment mainly comprise assets held for the maintenance of below rail infrastructure. The following tables indicate the amounts attributed or allocated to Above Rail and Below Rail, based on either direct attribution to regions or the application of Standard Allocators C, D and E (Network Wide).
Total Below Rail Total Plant & Equipment Queensland Network Above 30 June 2019 Rail Wide Regions Total Rail
$000's $000's $000's $000's $000's Rollingstock 1,024,811 17,589 108 17,697 1,007,114 Motor Vehicles 82,184 16,501 62,233 78,734 3,450 Other Plant & Equipment 144,741 11,611 83,656 95,267 49,474 Total Queensland Rail 1,251,736 45,701 145,997 191,698 1,060,038
The majority of rollingstock held by Queensland Rail is for passenger transport and therefore above rail, however a number of wagons are held for the purpose of transporting infrastructure materials. At 30 June 2019 the written down value of Queensland Rail’s motor vehicles was $82.2 million, of which $77.6 million was directly identified to Network. A summary of the treatment of vehicles is as follows:
Total Below Rail Total Motor Vehicles Queensland Network Above 30 June 2019 Rail Wide Regions Total Rail
$000's $000's $000's $000's $000's Network 77,636 16,219 61,186 77,405 231 Other Queensland Rail 4,548 282 1,047 1,329 3,219 Total Queensland Rail 82,184 16,501 62,233 78,734 3,450
The vehicles attributed to Regions, within Below Rail, are specific to the regions according to their cost centre and location information. Network vehicles attributed to above rail relate to maintenance of above rail infrastructure.
15
Financial Statements pursuant to the Access Undertaking
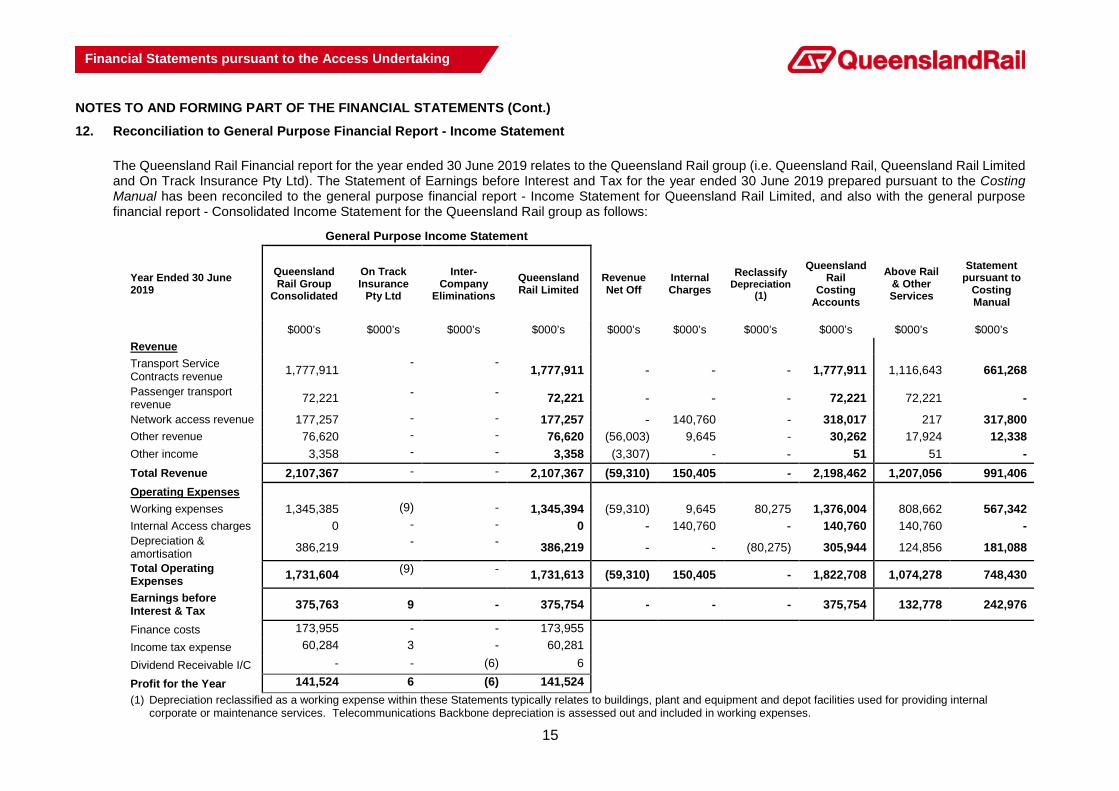
NOTES TO AND FORMING PART OF THE FINANCIAL STATEMENTS (Cont.) 12. Reconciliation to General Purpose Financial Report - Income Statement The Queensland Rail Financial report for the year ended 30 June 2019 relates to the Queensland Rail group (i.e. Queensland Rail, Queensland Rail Limited
and On Track Insurance Pty Ltd). The Statement of Earnings before Interest and Tax for the year ended 30 June 2019 prepared pursuant to the Costing Manual has been reconciled to the general purpose financial report - Income Statement for Queensland Rail Limited, and also with the general purpose financial report - Consolidated Income Statement for the Queensland Rail group as follows:
General Purpose Income Statement
Year Ended 30 June 2019
Queensland Rail Group
Consolidated
On Track Insurance
Pty Ltd
Inter- Company
Eliminations Queensland Rail Limited
Revenue Net Off
Internal Charges
Reclassify Depreciation
(1)
Queensland Rail
Costing Accounts
Above Rail & Other Services
Statement pursuant to
Costing Manual
$000’s $000’s $000’s $000’s $000’s $000’s $000’s $000’s $000’s $000’s Revenue
Transport Service Contracts revenue 1,777,911 - - 1,777,911 - - - 1,777,911 1,116,643 661,268 Passenger transport revenue 72,221 - - 72,221 - - - 72,221 72,221 - Network access revenue 177,257 - - 177,257 - 140,760 - 318,017 217 317,800 Other revenue 76,620 - - 76,620 (56,003) 9,645 - 30,262 17,924 12,338 Other income 3,358 - - 3,358 (3,307) - - 51 51 - Total Revenue 2,107,367 - - 2,107,367 (59,310) 150,405 - 2,198,462 1,207,056 991,406 Operating Expenses
Working expenses 1,345,385 (9) - 1,345,394 (59,310) 9,645 80,275 1,376,004 808,662 567,342 Internal Access charges 0 - - 0 - 140,760 - 140,760 140,760 - Depreciation & amortisation 386,219 - - 386,219 - - (80,275) 305,944 124,856 181,088 Total Operating Expenses 1,731,604 (9) - 1,731,613 (59,310) 150,405 - 1,822,708 1,074,278 748,430
Earnings before Interest & Tax 375,763 9 - 375,754 - - - 375,754 132,778 242,976
Finance costs 173,955 - - 173,955
Income tax expense 60,284 3 - 60,281
Dividend Receivable I/C - - (6) 6 Profit for the Year 141,524 6 (6) 141,524 (1) Depreciation reclassified as a working expense within these Statements typically relates to buildings, plant and equipment and depot facilities used for providing internal
corporate or maintenance services. Telecommunications Backbone depreciation is assessed out and included in working expenses.
16
Financial Statements pursuant to the Access Undertaking
Glossary
Above Rail Services means those activities, other than Below Rail Services, required to provide and operate Train Services, including rollingstock provision, rollingstock maintenance, non-Train Control related communications, train crewing, terminal provision and services, freight handling and marketing and administration of those services. Access means the non-exclusive utilisation of a specified section of rail infrastructure for the purposes of operating Train Services. Access Charge means the price paid by a Railway Operator for Access under an Access Agreement. Queensland Rail Access Undertaking 1 refers to the access undertaking approved in accordance with the Queensland Competition Authority Act 1997 on 11 October 2016 for Queensland Rail Limited. Allocated Items means a category of assets, costs, revenues and investments that is used in the general costing approach described in the Costing Principles section of the Manual. The three categories used are as follows: (a) Identifiable. Where costs are directly incurred, or assets directly used, in the performance of Below Rail
Services, those costs and assets are directly Identified as Below Rail Costs; (b) Attributable. Where costs are incurred, or assets are used, in common for the provision of Below Rail,
Above Rail and/or Other Services, and where there is a causal relationship between the resources used for Below Rail, Above Rail or Other Services, these costs are Attributed on a reasonable basis of cost causality; and
(c) Allocated. Where assets, costs, revenues and investments are used jointly for the provision of Below Rail, Above Rail and/or Other Services, and where there is no direct causal relationship between the resources used for Below Rail, Above Rail or Other Services, these costs are Allocated on a reasonable basis.
Below Rail Services means the activities associated with the provision and management of rail infrastructure, including the construction, maintenance and renewal of rail infrastructure assets, and the network management services required for the safe operation of Train Services on the rail infrastructure, including Train Control Services and the implementation of safeworking procedures. However, for the purposes of these Financial Statements Below Rail Services does not include passenger stations and their associated facilities. Costing Manual means a manual prepared by Queensland Rail Limited and approved by the Queensland Competition Authority from time to time that identifies the following matters: (a) for Financial Statements prepared under Clause 5.3.1 of the Queensland Rail Access Undertaking 1:
i. the process for identifying, from Queensland Rail Limited’s audited general purpose financial statements, the cost base for Below Rail Services, separate from other services provided by Queensland Rail Limited to which those Financial Statements relate; and
ii. within the cost base for Below Rail Services, the process for identifying the costs of Below Rail Services provided by Queensland Rail Limited separate from the costs of Below Rail Services provided by Operational Business Groups (i.e. the management of stations and platforms);
(b) within the cost base for Below Rail Services, the process for identifying costs attributable to the specified corridors (corridor costs), costs not attributable to specified corridors but attributable to specified geographic regions (regional costs), and costs not attributable to specified corridors or any specified geographic region (network costs); and
(c) the format of Financial Statements.
Financial Statements means the Statement of Assets, Statement of Earnings before Interest and Tax and Statement of Investments, for Below Rail Services managed by Queensland Rail, as required in accordance with the Queensland Rail Access Undertaking 1.

17
Financial Statements pursuant to the Access Undertaking
Glossary (Cont.)
Mount Isa refers to the region defined in Note 5 of these statements or Schedule A of the Costing Manual. North Coast refers to the region defined in Note 6 of these statements or Schedule A of the Costing Manual.
Queensland Rail [ABN 68 598 268 528] is an unincorporated statutory body owned by the Queensland State Government. Queensland Rail changed its name from the Queensland Rail Transit Authority on 2 June 2013 in accordance with the Queensland Rail Transit Authority Act 2013. Queensland Rail Limited [ABN 71 132 181 090] is a company responsible for delivery of passenger and non-coal network services in Queensland. Queensland Rail Limited became a wholly owned subsidiary of the Queensland Rail Transit Authority on 3 May 2013. Network, a function of Queensland Rail that is responsible for the day to day management, planning & development of Queensland Rail’s network infrastructure, which includes track and civil assets, signalling & operational systems, traction power supply & distribution assets, telecommunication, stations and yards. Permanent Way means track and bridge assets including formation, retaining walls, drainage systems, access roads, cuttings, embankments, tunnels, subways, fences along the rail corridor, ballast, sleepers, rails, rail fastenings, points and crossings, culverts and pipes (major), rail bridges and road overbridges (excluding footbridges). The term excludes fences surrounding other assets such as stations, freight terminals, workshops, depots and buildings. QCA means the Queensland Competition Authority as established by the Queensland Competition Authority Act 1997 (Qld).
Operator Business Group means business groups within Queensland Rail that are separate from Network and that undertake the operation of Train Services for transporting passengers for reward. Other Infrastructure means all other classes of infrastructure excluding Permanent Way. This includes signals and train control systems excluding software, electric overhead distribution structures and power systems, telecommunication structures and equipment, footbridges, carparks, access roads and surveillance equipment. Rail Infrastructure means Rail Transport Infrastructure, except that the term does not include track and associated infrastructure on those parts of the network not identified as the responsibility of Queensland Rail Limited in the Queensland Rail Access Undertaking 1. Rail Transport Infrastructure means rail transport infrastructure as defined in the Transport Infrastructure Act 1994 (Qld) for which Queensland Rail is the Railway Manager. Railway Manager has the meaning given to that term in the Transport Infrastructure Act 1994 (Qld). Railway Operator has the meaning given to that term in the Transport Infrastructure Act 1994 (Qld). Reference Tariff is an Access Charge applicable for a specified Reference Train Service, set out in Schedule D of the Queensland Rail Access Undertaking 1, or established by Queensland Rail and authorised by the QCA, the purpose of which is to provide information to Access Seekers as to the likely level of Access Charge for Train Service of similar type as the specified Reference Train Service (as amended, varied or escalated in accordance with the Queensland Rail Access Undertaking from time to time). Reference Train Service means a notional Train Service identified in respect to a Reference Tariff and conforming to certain criteria, including specified technical characteristics, operational characteristics and contract terms and conditions. Relinquishment Fee means the amount payable by the Access Holder should it cease to operate contracted train services.

18
Financial Statements pursuant to the Access Undertaking
Glossary (Cont.)
Standard Allocators are used in certain circumstances to allocate items which are not identifiable or attributable to a Queensland Rail Service. These Standard Allocators are specified in Schedule C of the approved Costing Manual together with a reference to the relevant clauses within the manual. Take or Pay Charge means a charge or other amount payable by an Access Holder to Queensland Rail under an Access Agreement in relation to the Access Holder not fully using its Access Rights for a specified period. West Moreton refers to the region defined in Note 4 of these statements or Schedule A of the Costing Manual.


