financial statements b2w companhia global do varejo · financial statements b2w companhia global do...
TRANSCRIPT
Financial Statements
B2W Companhia Global do Varejo December 31 2010 and 2009 with Report of the Independent Auditors

B2W COMPANHIA GLOBAL DO VAREJO Financial Statements
December 31 2010 and 2009 Index Report of independent auditors ............................................................................................1 Audited financial statement Balance sheets ....................................................................................................................4 Financial statements............................................................................................................6 Statements of chages in Shareholder’s equity ...................................................................7 Cash flow statements ..........................................................................................................9 Statements of valeu added................................................................................................10 Explanatory notes to the financial statements ...................................................................11


4
B2W COMPANHIA GLOBAL DO VAREJO Balance Sheets Raised on December 31, 2010 and 2009 (In thousand reais) Parent Company Consolidated Note 12.31.2010 12.31.2009 01.01.2009 12.31.2010 12.31.2009 01.01.2009 Assets Current assets Cash and cash equivalents 7,288 56,974 26,673 15,283 62,047 37,324 Marketable securities 5 776,973 540,010 701,006 790,707 547,832 704,569
Customers accounts receivables 6 650,087 272,265 346,826 817,201 424,287 554,160 Inventories 7 530,947 463,683 304,954 560,013 485,569 341,207 Recoverable taxes 8 52,699 58,992 28,060 54,919 64,221 33,690 Prepaid expenses 17,813 12,394 25,052 18,783 13,862 25,060 Other accounts receivable 59,984 45,862 63,600 67,391 48,615 68,366
Total current assets 2,095,791 1,450,180 1,496,171 2,324,297 1,646,433 1,764,376 Non current assets Long-term assets
Deferred income and social contribution taxes 9 103,606 91,490 101,114 134,943 120,483 130,228
Escrow deposits 18 13,413 12,069 6,156 13,847 12,289 6,175 Related parties 11 45,614 45,794 31,112 19,361 33,744 22,451 Other accounts receivable - 3,833 4,999 1,051 5,319 6,321
Investments 10 40,772 29,970 22,303 - - - Fixed assets 12 122,471 88,011 75,316 131,949 92,826 76,663 Intangible 13 568,433 381,093 299,227 586,566 392,842 306,388 Deferred charges 14 44,030 60,419 77,350 - - -
Total non current assets 938,339 712,679 617,577 887,717 657,503 548,226 Total assets 3,034,130 2,162,859 2,113,748 3,212,014 2,303,936 2,312,602

5
Parent Company Consolidated Note 12.31.2010 12.31.2009 01.01.2009 12.31.2010 12.31.2009 01.01.2009
Liabilities and Stockholders’ equity Current liabilities
Suppliers 768,436 568,242 575,732 794,052 580,933 583,795 Loans and financing 15 199,929 182,491 592,311 351,888 327,929 808,878 Debentures 16 191,225 17,835 25,885 191,225 17,835 25,885 Wages, provisions and social
contributions 9,229 6,278 6,295 11,520 8,240 8,737 Recoverable taxes 17 1,981 10,261 29,508 8,935 19,009 31,898 Proposed dividends 5,383 11,308 18,012 5,383 11,308 18,012 Other liabilities 25,380 28,952 25,214 37,285 35,694 46,075
Total current liabilities 1,201,563 825,367 1,272,957 1,400,288 1,000,948 1,523,280 Non current liabilities Long term liabilities
Loans and financing 15 1,032,444 710,181 272,774 1,035,337 710,181 272,774 Debentures 16 499,879 363,244 362,908 499,879 363,244 362,908
Provision for contingencies 18 12,811 13,517 4,270 12,811 13,517 4,270 Deferred income and social
contribution taxes 9 25,457 7,897 - 31,080 13,666 - Other liabilities 6,674 9,509 10,281 6,674 9,508 10,281
Total non curretn liabilities 1,577,265 1,104,348 650,233 1,585,781 1,110,116 650,233 Stockholders’ equity Capital Stock 19 a 182,491 181,566 181,566 182,491 181,566 181,566 Capital reserves 19 d 207,807 205,291 203,508 207,807 205,291 203,508
(-) Treasury shares 19 c (200,000) (200,000) (200,000) (200,000) (200,000) (200,000)Equity adjustment 620 1,250 (861) 620 1,250 (861)Profit reserves 19 d and f g 82,212 64,529 28,228 52,855 24,257 (23,241)(-) Treasury shares 19 c (18,631) (22,701) (21,883) (18,631) (22,701) (21,883)Accumulated profits - 3,209 - - 3,209 - Adittional proposed dividends 803 - - 803 - -
Total stockholders’ equity 255,302 233,144 190,558 225,945 192,872 139,089 Total of liabilities and stockholders’
equity 3,034,130 2,162,859 2,113,748 3,212,014 2,303,936 2,312,602
The explanatory notes are integral part of the financial statements.

6
B2W COMPANHIA GLOBAL DO VAREJO Financial Statements Years ended on December 31, 2010 and 2009 (In thousands of reais except where otherwise mentioned) Parent Company Consolidated Note 12.31.2010 12.31.2009 12.31.2010 12.31.2009 Net revenue from sales and/or services 21 3,803,907 3,386,414 4,073,569 3,632,580 Cost of goods and/or services sold (2,811,748) (2,427,298) (2,937,529) (2,570,035) Gross profit 992,159 959,116 1,136,040 1,062,545 Operating income (expenses)
Selling expenses 23 (451,278) (459,003) (512,448) (502,536)Depreciation/amortization (66,819) (63,817) (55,767) (48,528)General and administrative expenses 23 (53,771) (56,765) (69,043) (68,278)Equity pick up 10 10,802 6,667 - -
Management fees (7,215) (3,810) (7,565) (4,460) Other operating income (expenses) (63,982) (63,071) (80,453) (63,062) Result before financial result 359,896 319,317 410,764 375,681 Financial Result Financial revenue 22 126,160 135,745 128,796 140,274 Financial expenses 22 (457,473) (383,007) (489,660) (419,766) Income before income and social contribution
taxes 28,583 72,055 49,900 96,189 Income tax and social contribution taxes (5,911) (21,237) (16,313) (34,174) Current 9 c - (10,361) (12,470) (17,482) Deferred 9 c (5,911) (10,876) (3,843) (16,692) Net income of the period 22,672 50,818 33,587 62,015 Earnings per share of the capital stock at the end
of the period, excluding treasury shares - R$ 0.2057 0.4611 0.3047 0.5628
The explanatory notes are integral part of the financial statements.

7
B2W COMPANHIA GLOBAL DO VAREJO Statements of changes in Shareholders’ equity For the years ended on December 31, 2010 and 2009 – Parent Company On December 31, 2010 and 2009 (In thousands of reais)
Profi reserves Additional
Capital stockCapital
reserves Treasury shares
Equity adjustment Legal reserve
Expansion reserves
Treasury shares
Accumulated profit
dividends proposal Total
Balance in December 31, 2008 181,566 203,508 (200,000) (861) 6,118 39,143 (21,883) - - 207,591
Adjustment to the CPC's/IFRS suitability - - - - - (17,033) - - - (17,033) Balance in December 31, 2008 (adjusted) 181,566 203,508 (200,000) (861) 6,118 22,110 (21,883) - - 190,558
Repurshase of shares - - - - - - (818) - - (818) Stock option plan - 1,783 - - - - - - - 1,783 Equity adjustment – Financial applications - - - 2,111 - - - - - 2,111 Net income of the period - - - - - - - 50,818 - 50,818 Allocation of net income Legal reserves - - - - 2,380 - - (2,380) - - Mandatory dividends (R$ 102.62 per
thousand chares, excluding treasury shares) - - - - - - - (11,308) - (11,308)
Destination of expansion reserve - - - - - 33,921 - (33,921) - - Balance in December 31, 2009 181,566 205,291 (200,000) 1,250 8,498 56,031 (22,701) 3,209 - 233,144
Destination of accumulated profits Additional dividends proposal - - - - - - - (803) 803 - Destination of expansion reserve - - - - - 2,406 - (2,406) - - Capital increase 925 - - - - - - - - 925 Stock option plan - 2,516 - - - - - - - 2,516 Sale of treasury shares - - - - - (2,012) 4,070 - - 2,058 Equity valuation adjustment – Financial
applications - - - (630) - - - - - (630) Net income of the period - - - - - - - 22,672 - 22,672 Allocation of net income - - - - - - - - - - Legal reserves - - - - 1,134 - - (1,134) - - Mandatory dividends (R$ 163.43 per
thousand chares, excluding treasury shares) - - - - - - - (5,383) - (5,383)
Destination of expansion reserve - - - - - 16,155 - (16,155) - - Balance in December 31, 2010 182,491 207,807 (200,000) 620 9,632 72,580 (18,631) - 803 255,302
The explanatory notes are integral part of the financial statements.
8
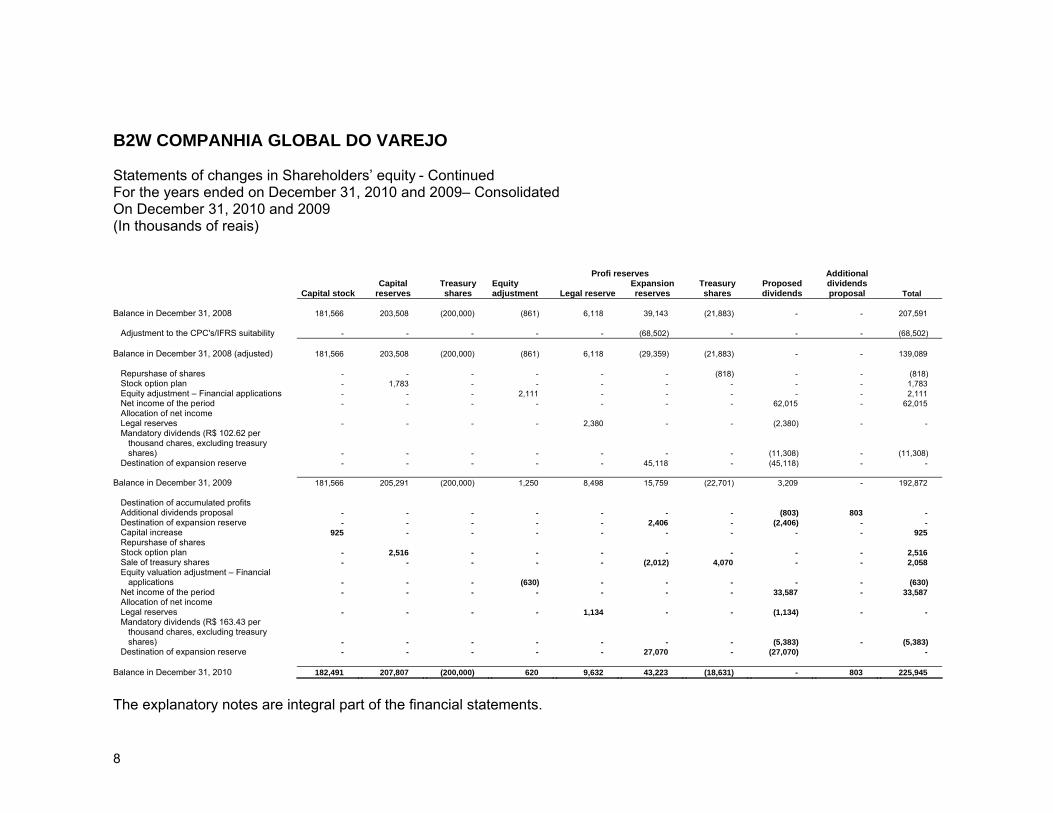
B2W COMPANHIA GLOBAL DO VAREJO Statements of changes in Shareholders’ equity - Continued For the years ended on December 31, 2010 and 2009– Consolidated On December 31, 2010 and 2009 (In thousands of reais) Profi reserves Additional
Capital stockCapital
reserves Treasury shares
Equity adjustment Legal reserve
Expansion reserves
Treasury shares
Proposed dividends
dividends proposal Total
Balance in December 31, 2008 181,566 203,508 (200,000) (861) 6,118 39,143 (21,883) - - 207,591
Adjustment to the CPC's/IFRS suitability - - - - - (68,502) - - - (68,502) Balance in December 31, 2008 (adjusted) 181,566 203,508 (200,000) (861) 6,118 (29,359) (21,883) - - 139,089
Repurshase of shares - - - - - - (818) - - (818) Stock option plan - 1,783 - - - - - - - 1,783 Equity adjustment – Financial applications - - - 2,111 - - - - - 2,111 Net income of the period - - - - - - - 62,015 - 62,015 Allocation of net income Legal reserves - - - - 2,380 - - (2,380) - - Mandatory dividends (R$ 102.62 per
thousand chares, excluding treasury shares) - - - - - - - (11,308) - (11,308)
Destination of expansion reserve - - - - - 45,118 - (45,118) - - Balance in December 31, 2009 181,566 205,291 (200,000) 1,250 8,498 15,759 (22,701) 3,209 - 192,872
Destination of accumulated profits Additional dividends proposal - - - - - - - (803) 803 - Destination of expansion reserve - - - - - 2,406 - (2,406) - - Capital increase 925 - - - - - - - - 925 Repurshase of shares Stock option plan - 2,516 - - - - - - - 2,516 Sale of treasury shares - - - - - (2,012) 4,070 - - 2,058 Equity valuation adjustment – Financial
applications - - - (630) - - - - - (630) Net income of the period - - - - - - - 33,587 - 33,587 Allocation of net income Legal reserves - - - - 1,134 - - (1,134) - - Mandatory dividends (R$ 163.43 per
thousand chares, excluding treasury shares) - - - - - - - (5,383) - (5,383)
Destination of expansion reserve - - - - - 27,070 - (27,070) - Balance in December 31, 2010 182,491 207,807 (200,000) 620 9,632 43,223 (18,631) - 803 225,945
The explanatory notes are integral part of the financial statements.
9
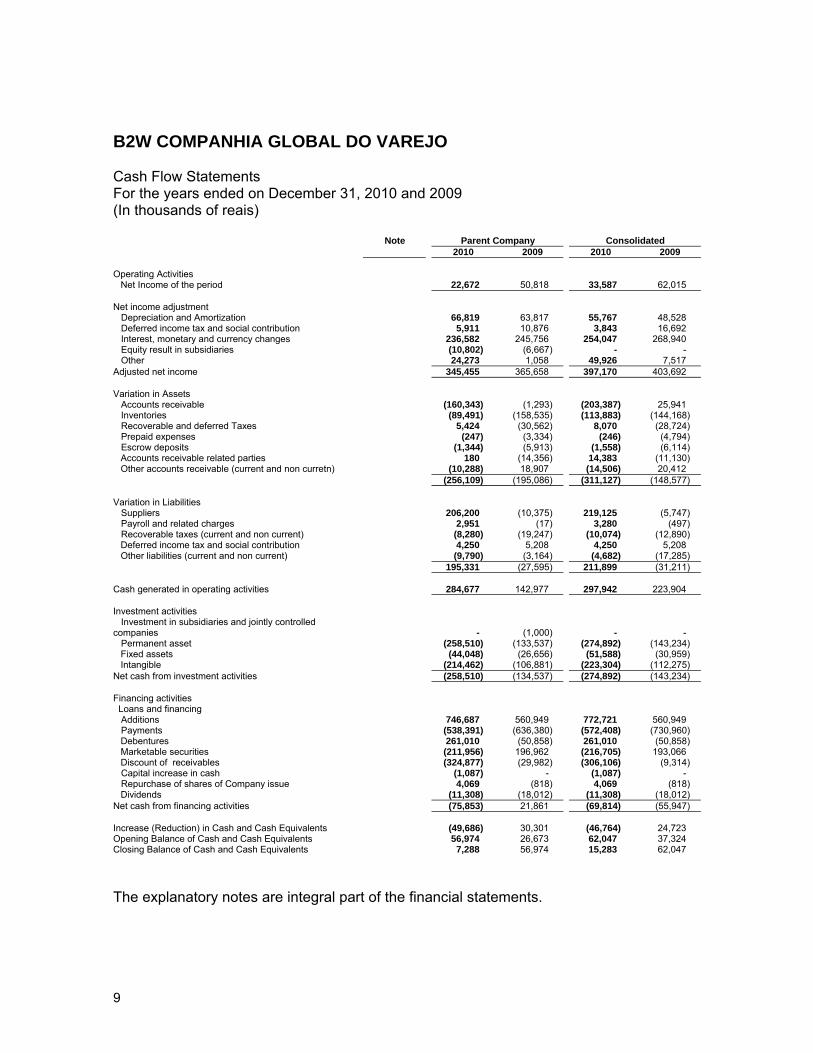
B2W COMPANHIA GLOBAL DO VAREJO Cash Flow Statements For the years ended on December 31, 2010 and 2009 (In thousands of reais) Note Parent Company Consolidated 2010 2009 2010 2009 Operating Activities
Net Income of the period 22,672 50,818 33,587 62,015 Net income adjustment Depreciation and Amortization 66,819 63,817 55,767 48,528 Deferred income tax and social contribution 5,911 10,876 3,843 16,692 Interest, monetary and currency changes 236,582 245,756 254,047 268,940 Equity result in subsidiaries (10,802) (6,667) - - Other 24,273 1,058 49,926 7,517 Adjusted net income 345,455 365,658 397,170 403,692 Variation in Assets Accounts receivable (160,343) (1,293) (203,387) 25,941 Inventories (89,491) (158,535) (113,883) (144,168) Recoverable and deferred Taxes 5,424 (30,562) 8,070 (28,724) Prepaid expenses (247) (3,334) (246) (4,794) Escrow deposits (1,344) (5,913) (1,558) (6,114)
Accounts receivable related parties 180 (14,356) 14,383 (11,130) Other accounts receivable (current and non curretn) (10,288) 18,907 (14,506) 20,412
(256,109) (195,086) (311,127) (148,577) Variation in Liabilities Suppliers 206,200 (10,375) 219,125 (5,747) Payroll and related charges 2,951 (17) 3,280 (497) Recoverable taxes (current and non current) (8,280) (19,247) (10,074) (12,890)
Deferred income tax and social contribution 4,250 5,208 4,250 5,208 Other liabilities (current and non current) (9,790) (3,164) (4,682) (17,285)
195,331 (27,595) 211,899 (31,211) Cash generated in operating activities 284,677 142,977 297,942 223,904 Investment activities Investment in subsidiaries and jointly controlled companies - (1,000) - - Permanent asset (258,510) (133,537) (274,892) (143,234)
Fixed assets (44,048) (26,656) (51,588) (30,959) Intangible (214,462) (106,881) (223,304) (112,275)
Net cash from investment activities (258,510) (134,537) (274,892) (143,234) Financing activities Loans and financing Additions 746,687 560,949 772,721 560,949 Payments (538,391) (636,380) (572,408) (730,960)
Debentures 261,010 (50,858) 261,010 (50,858) Marketable securities (211,956) 196,962 (216,705) 193,066 Discount of receivables (324,877) (29,982) (306,106) (9,314)
Capital increase in cash (1,087) - (1,087) - Repurchase of shares of Company issue 4,069 (818) 4,069 (818)
Dividends (11,308) (18,012) (11,308) (18,012) Net cash from financing activities (75,853) 21,861 (69,814) (55,947) Increase (Reduction) in Cash and Cash Equivalents (49,686) 30,301 (46,764) 24,723 Opening Balance of Cash and Cash Equivalents 56,974 26,673 62,047 37,324 Closing Balance of Cash and Cash Equivalents 7,288 56,974 15,283 62,047
The explanatory notes are integral part of the financial statements.
10
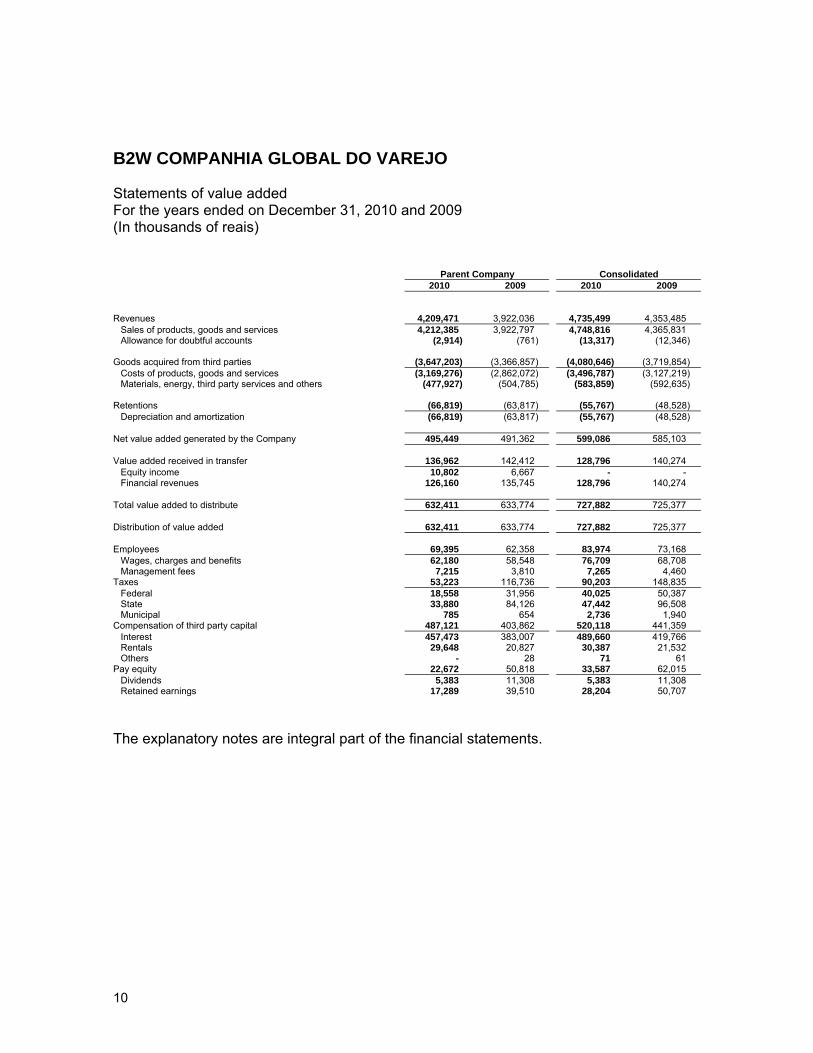
B2W COMPANHIA GLOBAL DO VAREJO Statements of value added For the years ended on December 31, 2010 and 2009 (In thousands of reais)
Parent Company Consolidated 2010 2009 2010 2009 Revenues 4,209,471 3,922,036 4,735,499 4,353,485
Sales of products, goods and services 4,212,385 3,922,797 4,748,816 4,365,831 Allowance for doubtful accounts (2,914) (761) (13,317) (12,346)
Goods acquired from third parties (3,647,203) (3,366,857) (4,080,646) (3,719,854)
Costs of products, goods and services (3,169,276) (2,862,072) (3,496,787) (3,127,219) Materials, energy, third party services and others (477,927) (504,785) (583,859) (592,635)
Retentions (66,819) (63,817) (55,767) (48,528)
Depreciation and amortization (66,819) (63,817) (55,767) (48,528)
Net value added generated by the Company 495,449 491,362 599,086 585,103
Value added received in transfer 136,962 142,412 128,796 140,274 Equity income 10,802 6,667 - - Financial revenues 126,160 135,745 128,796 140,274
Total value added to distribute 632,411 633,774 727,882 725,377 Distribution of value added 632,411 633,774 727,882 725,377 Employees 69,395 62,358 83,974 73,168
Wages, charges and benefits 62,180 58,548 76,709 68,708 Management fees 7,215 3,810 7,265 4,460
Taxes 53,223 116,736 90,203 148,835 Federal 18,558 31,956 40,025 50,387 State 33,880 84,126 47,442 96,508 Municipal 785 654 2,736 1,940
Compensation of third party capital 487,121 403,862 520,118 441,359 Interest 457,473 383,007 489,660 419,766 Rentals 29,648 20,827 30,387 21,532 Others - 28 71 61
Pay equity 22,672 50,818 33,587 62,015 Dividends 5,383 11,308 5,383 11,308 Retained earnings 17,289 39,510 28,204 50,707
The explanatory notes are integral part of the financial statements.
11
B2W - COMPANHIA GLOBAL DO VAREJO Notes to the financial statements Years ended December 31, 2010 and 2009 (In thousands of reais except where otherwise mentioned) 1. Operating Context
B2W - Companhia Global do Varejo ("B2W" or "Company") is a publicly traded corporation, with head offices at Rua Sacadura Cabral, 102, in city and state of Rio de Janeiro, incorporated through the merger of Americanas.com S.A. - Comércio Eletrônico (Americanas.com) and Submarino S.A. (merger approved by their shareholders on December 13, 2006), with shares traded on the Brazilian Securities Exchange (BM&FBOVESPA), under the ticker symbol BTOW3. B2W is controlled by Lojas Americanas S.A. ("LASA" and/or "Parent Company"), a public company with shares traded on the São Paulo Stock Exchange under the ticker symbols LAME3 - ON and LAME4 - PN. The Company and its subsidiaries are engaged in retail and wholesale of goods and products in general through various sales channels, particularly through the Internet; the rental of movies and related items; the intermediation and distribution of theater and movie tickets, tickets for transportation and public events, entrance to theme parks and events in general; the import of products for resale; promotional services, marketing development and the offering of credit products; and various other products and services for the general consumer. B2W's portfolio contains the Americanas.com, Shoptime, Submarino, Submarino Finance, B2W Viagens, Ingresso.com and Blockbuster Online brands, which offer hundreds of thousands of products and services in various categories through distribution through the Internet, catalogs, television sales and kiosks. B2W also offers outsourced e-commerce services for some of the leading consumer products companies (business-to-business to consumer - B2B2C).
2. Presentation of financial statement
The financial statements of the Company for the years ended on December 31, 2010 and 2009,and as of January 1, 2009 were prepared in accordance with accounting practices adopted in Brazil which include rules of the Brazilian Securities Exchange Commission (CVM) and Accounting Standards Board Pronouncements Committee (CPC), and the Consolidated Financial Statements were prepared in accordance with accounting practices adopted in Brazil which include rules of the Brazilian Securities Exchange Commission (CVM) and Accounting Standards Board Pronouncements Committee (CPC), as well as are in conformity with the International Accounting Standards (IFRS) issued by the International Accounting Standards Board (IASB). The Financial Statements were approved by Board of Directs´ Meeting held on March 16, 2011.

12
The Parent Company and Consolidated financial statements were prepared based on assumptions and estimates by management that impact the assets and liabilities balances. Management judgment involves making estimates related to the probability of future events, actual results may differ from those estimates. Those areas involving a higher level of judgment and/or the use of estimates and assumptions relevant to the financial statements are disclosed in Note 3. As a result, the settlement of transactions comprising these estimates may be materially different from those recorded in the financial statements due to the probabilistic treatment inherent to the estimation process. The Company reviews the estimates and assumptions, at least once a year. The Company has adopted all the standards, standards reviews and interpretations issued by the Accounting Pronouncement Committee (CPC),by IASB and regulatory agencies that were in effect on December 31, 2010. The financial statements were prepared using the historical cost as the value basis, except for the valuation of certain assets, such as financial instruments (measured at their fair value). The values of assets and/or liabilities that represent items subject to fair value hedges, which alternatively, would be recorded at amortized cost, are adjusted to show the changes in fair value attributable to the hedged risks. The effects of adopting IFRS and new pronouncements issued by the CPC are presented in Note 4. Pursuant to current Brazilian Corporate Law, the individual financial statements present an appraisal of investments in subsidiaries and jointly controlled subsidiaries by the equity accounting method, while under IFRS these investments should be valued at cost or fair value, as well as maintenance of the existing balance of deferred charges on December 31, 2008, which has been amortized, whereas under IFRS these expenses do not qualify for recognition as assets. Consequently, these individual financial statements are not considered to be in compliance with IFRS. Criteria for Consolidation The consolidated financial statements include the financial statements of the Parent Company, B2W - Companhia Global do Varejo and those companies that the Company controls (directly or indirectly), as well as those in which control is shared, as detailed in Note 10. Fiscal years of subsidiaries and jointly controlled affiliates included in the consolidation are compatible with the Company and the accounting practices and policies were consistently applied over consolidated companies. As anticipated in Technical Pronouncement CPC 19 (IAS 31) - Investments in Jointly Controlled Ventures ("Joint Ventures"), the consolidation of Submarino Finance Promotora de Credito Ltda. ("Submarino Finance") was done proportionally to the Parent Company's ownership interest in the capital of that Company (50%),
13
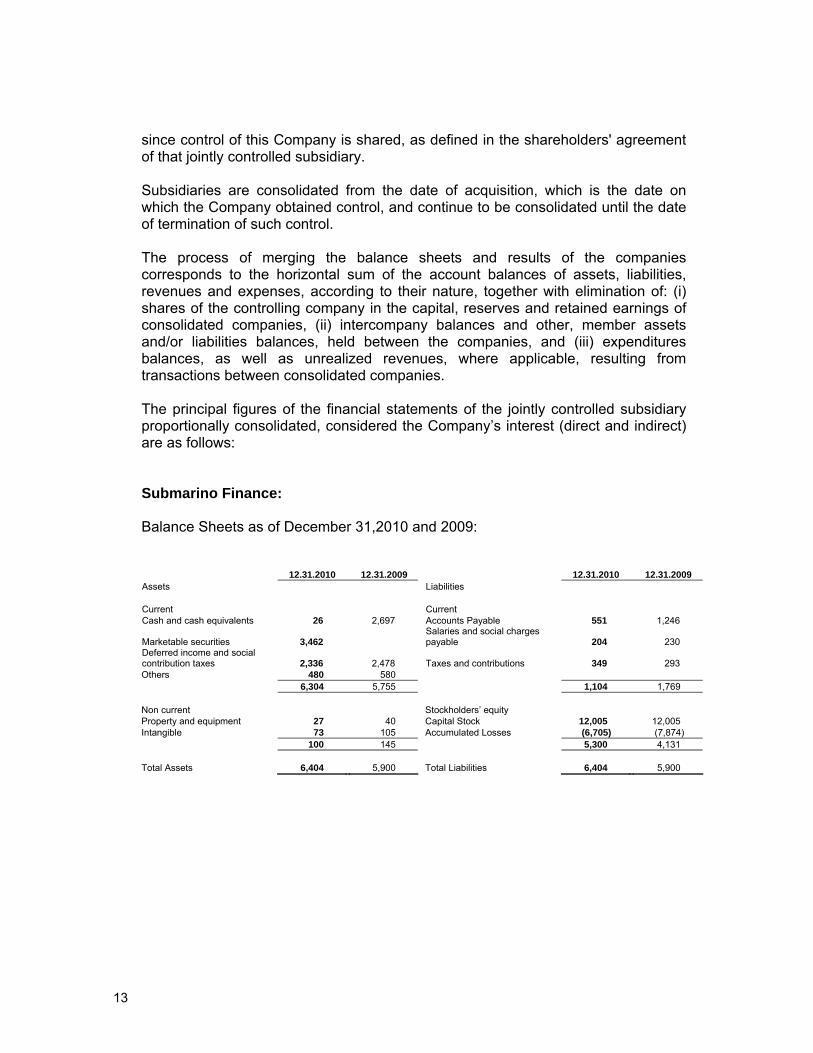
since control of this Company is shared, as defined in the shareholders' agreement of that jointly controlled subsidiary. Subsidiaries are consolidated from the date of acquisition, which is the date on which the Company obtained control, and continue to be consolidated until the date of termination of such control. The process of merging the balance sheets and results of the companies corresponds to the horizontal sum of the account balances of assets, liabilities, revenues and expenses, according to their nature, together with elimination of: (i) shares of the controlling company in the capital, reserves and retained earnings of consolidated companies, (ii) intercompany balances and other, member assets and/or liabilities balances, held between the companies, and (iii) expenditures balances, as well as unrealized revenues, where applicable, resulting from transactions between consolidated companies. The principal figures of the financial statements of the jointly controlled subsidiary proportionally consolidated, considered the Company’s interest (direct and indirect) are as follows: Submarino Finance: Balance Sheets as of December 31,2010 and 2009:
12.31.2010 12.31.2009 12.31.2010 12.31.2009 Assets Liabilities Current Current Cash and cash equivalents 26 2,697
Accounts Payable 551 1,246
Marketable securities 3,462 Salaries and social charges payable 204 230
Deferred income and social contribution taxes 2,336 2,478
Taxes and contributions 349 293 Others 480 580 6,304 5,755 1,104 1,769 Non current Stockholders’ equity Property and equipment 27 40 Capital Stock 12,005 12,005 Intangible 73 105 Accumulated Losses (6,705) (7,874) 100 145 5,300 4,131 Total Assets 6,404 5,900 Total Liabilities 6,404 5,900

14
Income statement for the years ended on December 31, 2010 and 2009: 12.31.2010 12.31.2009 Net revenue 3,337 3,169 Selling, administrative and general expenses (2,325) (2,703) Net financial result 1,014 940 Other operational expenses (396) (39) Deferred income and social contribution taxes - current (320) (121) Deferred income and social contribution taxes - deferred (142) (270) Net income for the year 1,168 976
3. Summary of principle accounting practices
a) Significant judgments, estimates and assumptions
Judgments
The preparation of the Parent Company and Consolidated financial statements requires that the management make judgments, estimates and adopt assumptions that affect revenues, expenses, assets and liabilities figures, as well as disclosures of contingent liabilities as of the date of its financial statements. However, the uncertainty associated with these assumptions and estimates could lead to results that require a significant adjustment to the book value of the affected assets or liabilities in future periods.
Estimates and assumptions The key assumptions regarding the sources of uncertainty for future estimates and other important sources of uncertainty for estimates on the balance sheet date, involving significant risk of causing a major adjustment to the book value for assets and liabilities in following reported period are discussed below.
Provision for doubtful accounts This provision is based on analysis of historical losses monitored by management, which are provided for an amount considered sufficient to cover probable losses on accounts receivable. Provision for losses in inventories The provision for losses in inventories is based on estimates, which take into account historical data for losses in the annual, physical inventories in the distribution centers, as well as the sale of items below their cost of acquisition. This provision is considered sufficient by management to cover probable losses in the turnover of their inventories.
15
Useful life of fixed and intangible assets Depreciation and amortization of fixed and intangible assets are considered the best estimate of the management on the use of these assets over the course of their useful life. Changes in economic conditions and/or the consumer market may require revision of these useful life estimates.
Impairment of non-financial assets
Management annually reviews the net accounting value of assets with the objective of identifying events or changes in economic, operating or technological circumstances that could indicate the deterioration or loss of their recoverable value. If such evidence is identified and the net accounting value of an asset exceeds its recoverable value, an impairment allowance adjusts the net accounting value to the recoverable value. The recoverable value of an asset or a particular cash-generating unit is defined as the greater value between the remaining useful life and net sales value. In estimating assets value in use, estimated future cash flows are discounted to present value using a discount rate before taxes, reflecting weighted average cost of capital for the industry in which the cash-generating unit operates. The net sales price is determined, whenever possible, based on firm sales contract in a transaction on arm´s length basis, between well informed and willing parties, adjusted by expenses attributable to asset sale or, when there is no firm sales contract, based on the market price in a active market or the most recent transaction price with similar assets. The following criterion is also applied to evaluate impairment losses: i) Goodwill paid for expected future profitability This goodwill is tested annually for impairment or when circumstances indicate loss due to depreciation of its book value. ii) Intangible assets Indefinite-life intangible assets are tested annually for impairment, either individually or at the level of the cash-generating unit depending on the case, or when circumstances indicate loss due to depreciation of their book value. When this evidence is identified and the net book value exceeds the recoverable value, an impairment allowance is booked, adjusting the net book value adjusted to the recoverable value, when applicable.

16
Taxes
Deferred income and social contribution tax assets are recognized only to the extent that it is probable that there will be taxable income for which temporary differences and tax losses can be utilized. The recovery of the deferred tax asset is reviewed at end of each fiscal year and when it is not probable that future taxable profits will be available to allow recovery of all or part of the asset, the asset balance is adjusted by the amount expected to be recovered. Significant management judgment is required to determine the value of deferred tax assets that can be recognized, based upon the likely timing and level of future taxable profits, along with future strategic fiscal planning.
Provision for tax, civil and labor risks
The Company recognizes a provision, which involve considerable management judgment, for tax, labor and civil risks resulting from past events, when it is probable that an outflow of resources embodying economic benefits will result from the settlement of an obligation and the amount at which the settlement will take place can be reasonably measured. The Company is also subject to legal, civil and labor claims related to matters that arise through the normal course of the activities of its business. The assessment of probability of loss includes evaluating available evidence, the hierarchy of laws, available case law, recent court decisions and their relevance in the legal system, as well as the assessment of outside counsel. Provisions are reviewed and adjusted to take into account changes in circumstances, such as the applicable limitation period, conclusions of tax inspections or additional exposures identified based upon new issues or decisions of courts. Actual results may differ from estimates. The basis and nature of provision for contingencies are described in Note 18. The settlement of transactions involving these estimates may result in amounts significantly different from those recorded in the financial statements due to the inaccuracies inherent to the process of their determination. The Company reviews its estimates and assumptions at least quarterly.
b) Results of operations
The results of operations are determined in accordance with the accrual basis of accounting, highlighting the following:
Revenues from the sales of goods and services, which include the freight
charges to customers, are recorded upon transfer of ownership and the risk to third parties by their gross values, deducting unconditional discounts and returns, and adjusting the current calculated value of term sales and sales taxes. Approved sales orders for credit card administrators, whose products have not yet been billed or shipped to customers, and the sales of gift certificates that are in the hands of customers and that will be used in

17
the future are recorded as “Other Obligations” under current liabilities;
The cost of goods sold and services rendered includes the cost of acquisition of goods and the cost of services, deducting for supplier subsidies received, as applicable;
Advertising expenses are recorded in the results when their effective
placement was reduced by the participation of suppliers;
Freight expenses related to the delivery of goods to consumers are classified as sales expenses.
c) Foreign currency
The functional currency of the Company and its subsidiaries based in Brazil is the Brazilian Real (R$), the same currency used in the preparation and presentation of the Parent Company and Consolidated financial statements. Transactions in foreign currency, i.e. all those not made in the functional currency, at exchange rates prevailing on the dates of the transactions. Assets and liabilities in foreign currencies are converted into the functional currency using the exchange rate on the balance sheet closing date. Gains and losses, from changes in the exchange rates, on assets and liabilities are recorded in the results statements. Non-monetary assets and liabilities acquired or contracted in foreign currency, as applicable, are converted using the exchange rates on the dates of transactions or at fair value, on the dates of review, when it is used.
d) Cash and cash equivalents
Cash and cash equivalents include cash, positive balances in bank accounts and investments redeemable within 90 days from the signing date, and with insignificant risk of change in market value. These investments are valued at cost plus income earned to the date of the balance sheet, which do not exceed their market or realizable value.
e) Accounts receivable from clients
Accounts receivable from credit card administrators are shown at net adjusted present value, calculated on the portion of the sales and the depreciation allowance for doubtful accounts. Sales through corporate loyalty programs and trade agreements are recorded under “other receivables”.
f) Inventories
Inventories are shown at average acquisition cost, adjusted to the present value from suppliers (forward purchases) and, when applicable, subsidies received from suppliers, that do not exceed their net realizable value.
18
g) Investments in subsidiaries and jointly controlled subsidiaries
For the purposes of the Company’s financial statements, the investments in subsidiaries and jointly controlled subsidiaries are valued by the equity method, in accordance with Technical Pronouncement CPC 18 (IAS 28). The accounting practices used by subsidiaries and jointly controlled subsidiaries are the same as those used by the Company and the financial statements database used in the calculation of equity is the same as that used by the Company. Based on the equity method, investments in subsidiaries and jointly controlled subsidiaries are calculated on the Company’s balance sheet at cost, adding such changes following the acquisition of shares in those companies. The equity interest in subsidiaries and jointly controlled subsidiaries is presented in the Parent Company’s income statement as equity accounting, shown as net profit attributable to the shareholders of the investee.
h) Fixed assets
Fixed assets are recorded at cost of acquisition, less the respective depreciation and impairment losses, if applicable. Depreciation is calculated on a straight-line basis at the rates described in Note 12, which takes into consideration the useful economic life of these assets. Amortization of the improvements in leased properties is calculated on the basis of the respective time periods for the lease contracts. Costs subsequent to initial recognition are incorporated into the residual value of the fixed asset or recognized as a specific item, as appropriate, only if the economic benefits associated with these items are probable and whose value can be reliably measured. The carrying amount of an item being replaced is de-recognized. Other repairs and maintenance are recognized directly in the results as they were incurred. The residual values and useful life of assets are reviewed and adjusted, as appropriate, at the end of each fiscal year. As a result of the changes in Brazilian accounting practices to completely adhere to the process of convergence with international accounting practices, in the first time adoption of Technical Pronouncement CPC 27 (IAS 16) and,Interpretation of Initial Application to Fixed Assets ICPC 10, there is an option to record adjustments in the initial balances similar to that permitted under international financial reporting standards by using the concept of deemed cost, as indicated in Technical Statements CPC 37 (IFRS 1) and CPC 43. The Company opted not to evaluated its fixed assets at fair value as attributed cost considering that (i) the cost method, minus allowance for losses, is the best method for evaluating the Company's fixed assets, (ii) the Company's

19
fixed assets is broken down into well-defined classes related to its only operational activities, which is recoverable values and useful life estimates are frequently revised, and (iii) the Company has effective controls over fixed assets that allow it to identify impairment losses and changes to the useful life estimates.
i) Intangible
The goodwill registered on the acquisition of investments, including that recorded from the merger, are based on the expectation of future profitability and were amortized through December 31, 2008 using periods of 5 to 10 years, according to the proportion of future profits expected from the investments. The goodwill according to the expectation of future profitability is no longer amortized as of January 1, 2009, and its recoverable value is tested annually, or whenever deemed necessary. The expenses related to the development of websites (the main sales channel of the Company), as well as the development of operating applications, technological infrastructure (purchase and internal development of software and the installation of applications on the sites), as well as graphics development are recorded as intangibles, in accordance with Technical Pronouncement CPC 04 (IAS 38), is amortized on a straight-line basis taking into account the estimated term stipulated for their use and the benefits that will be reported (Note 13). Other intangibles, such as use licenses and software licensing rights, are recorded at their acquisition cost, less amortization, calculated on a straight-line basis according to the useful life of those intangible assets (Note 13).
j) Commercial Leasing
Financial leases
Financial lease contracts substantially transfer to the Company the risks and benefits inherent to the asset ownership. These contracts are characterized as capital lease contracts and the assets are recorded at fair value or the present value of minimum payments foreseen in the contracts. The items recorded as assets are depreciated at depreciation rates applicable to each asset group, according to Note 12. Finance charges relating to capital lease contracts are noted in the results over the term of these contracts, based on the amortized cost method and the effective interest rate.
Operating leases
Payments made under operating leases are recognized in fiscal year results on a straight-line basis over the lease term, in accordance with accrual accounting methodologies for the fiscal years.

20
k) Borrowing costs
The costs of finance charges on non-specific purpose loans, which are used to acquire and/or construct an asset that requires a substantial period of time to be completed ("qualifying asset"), are capitalized during the period required to complete and prepare the asset for its intended use. Capitalized loan finance charges are obtained by applying the weighted average interest rate on loans that were in force during the period in which investments were made to obtain the qualifying asset, not to exceed the amount of borrowing costs incurred during the period.
l) Deferred assets
In connection to Law 11941/09 and CPC 43, the Company opted to maintain, under Deferred Assets, the balances related to pre-operating expenses that showed signs of recoverability, for amortization during the period of anticipated benefits. The effect of maintaining the Deferred Assets balance is totally eliminated in the preparation and presentation of the consolidated financial statements (Notes 4 and 14).
m) Income tax and social contribution
Expenditure on income tax and social contribution are the sum of current and deferred taxes.
Current taxes
Provisions for income tax and social contribution are based on taxable income for the fiscal year. The income tax was set at the rate of 15%, plus an additional 10% on taxable income exceeding R$240. The social contribution was calculated at the rate of 9% on the adjusted net income. Taxable income differs from income presented in the income statement because it excludes taxable revenues or expenditures deductibles from other fiscal years, and excludes permanently non-taxable or non-deductible items. Provisions for income tax and social contribution are calculated individually (by a Group company) based on the prevailing rates at the close of the fiscal year.
Deferred taxes
Income tax and social contribution taxes are recognized in their entirety, in accordance with the concept described in Technical Pronouncement CPC 32 (IAS 12) regarding the differences between assets and liabilities recognized for tax purposes and their corresponding values in the financial statements. Deferred income tax and social contribution amounts are determined by the prevailing rates (and laws) at the time of preparation of financial statements and applicable when the respective, deferred income tax and social contribution payments are made.

21
Current and deferred taxes are recognized in the results, except when they correspond to items recorded as "Other accumulated income," or directly as equity, in which case the current and deferred taxes are also recognized as "Other accumulated income" or directly as equity, respectively. Deferred tax assets and liabilities are presented as net only if there is a legal or contractual right to offset tax assets against tax liabilities and the deferred taxes are related to the same, taxable entity and subject to the same tax authority.
n) Adjustment at present value
The operations of long-term transactions, primarily from suppliers of goods and services, were adjusted to their present value taking into account the maturities of these transactions. We used the average rate of 11.70% per year on December 31, 2010 (12.60% per year and 13.33% per year on December 31, 2009 and January 1, 2009, respectively), with a minimum of 10.59% per year on December 31, 2010 (10.59% per year and 11.94% per year on December 31, 2009 and January 1, 2009, respectively) and the maximum of 12.63% per year on December 31, 2010 (15.97% per year and 15.96% per year on December 31, 2009 and January 1, 2009, respectively), based on funding for the respective fiscal years. The constitution of present value adjustment of purchases is recorded under “Suppliers” and “Inventory” (Note 7) and their counterpart reversals are shown under the heading “Financial Expenses,” to the time of maturity, in the case of suppliers, and for the realization of inventories turnover with regard to the values recorded under the heading “Cost of goods sold.” The operations of long-term transactions, at the same previously-agreed prices as represented, mainly, through credit cards installment sales, were brought to their present value taking into account the payment deadlines of the aforementioned transactions. The same treatment was given to the taxes on those sales, considering the effective rate on them. We used the average rate of 10.68% per year on December 31, 2010 (11.76% per year and 14.25% per year on December 31, 2009 and January 1, 2009, respectively), with a minimum of 9.45% per year on December 31, 2010 (9.27% per year and 11.76% per year on December 31, 2009 and January 1, 2009, respectively) and a maximum of 11.70% per year on December 31, 2010 (17.79% per year and 19.03% per year on December 31, 2009 and January 1, 2009, respectively), receivables discounts being based upon their respective base dates. The present value adjustment of installment sales has a counterpart under the heading “Accounts receivable from clients” (Note 6) and its performance is recorded under “Financial income” to the maturity of the term.
22
o) Financial instruments
The Company’s financial instruments are represented by cash and cash equivalents, marketable securities, accounts receivable, accounts payable, debentures, loans and financing and derivatives. Financial instruments are initially recorded at fair value plus transaction costs that are directly attributable to their acquisition or issue, except for financial assets and liabilities classified at fair value, through profit or loss, when such costs are recorded directly in fiscal year results. Their subsequent measurement occurs as of each date of financial statements, in accordance with classification of financial instruments in the following financial assets and liabilities categories: (i) financial assets or financial liabilities measured at fair value through profit or loss, (ii) investments held to maturity, (iii) loans and receivables, (iv) financial assets available for sale.
Financial assets at fair value through profit or loss: Financial assets at fair value through profit or loss include financial assets held-for-trading and financial assets designated upon initial recognition at fair value through profit or loss. Financial assets are classified as held-for-trading if they are acquired for the purpose of selling in the near term. Gains and losses on liabilities held-for-trading are recognized in the income statement. Financial liabilities at fair value through profit or loss: Financial liabilities at fair value through profit or loss include financial liabilities held-for-trading and financial liabilities designated upon recognition at fair value though profit or loss. Gains and losses on liabilities held-for-trading are recognized in the income statement. Held-to-maturity investment: Financial assets with fixed or determinable payments and fixed maturity dates, which the Company has the intention and ability to hold until maturity, are classified in this category. Financial assets held-to-maturity are measured at amortized cost using the effective interest rate method, less provision for impairment loss of recoverable (“impairment”) value. Interest income is recognized by applying the effective interest method. Loans and receivables: After initial recognition, loans and receivables subject to interest are subsequently measured at amortized cost, using the effective interest method. Gains and losses in liabilities and assets are recognized in the income statement at the time of its closing, as well as during the amortization process by the effective interest rate method.
Available-for-sale financial assets: Available-for-sale financial assets are those that are non-derivative and are designated as available for sale or are not classified in the aforementioned categories. Available-for-sale financial assets are measured at fair value. Interest, restatement, and exchange rates, as applicable, are recognized in the income statement, when incurred. The variations arising from valuation at fair value are recognized, when incurred, as a separate component of equity in the income statement when they are held in cash or determined to be unrecoverable.

23
The Company is exposed to market risks arising from its operations and uses derivative financial instruments to minimize its exposure to these risks, such as swap contracts to protect it from the risks of exchange rates. Derivative financial instruments are measured at fair value (market value) on each balance sheet disclosure date. Given that the Company and its subsidiaries make use of derivatives for protection (“hedge”), it adopted the accounting practice of accounting for hedging instruments (“hedge accounting”). Loans and financing are initially measured at fair value net of incurred transaction costs. Loans and financing not covered by hedging instruments are subsequently measured at amortized cost using the effective interest method, while those that are covered subject to hedge accounting are adjusted for the effects of the fair value of the covered risks. The Company and its subsidiaries have neither cash flow hedges nor overseas investment hedges. The current and noncurrent liabilities are stated at known or estimated amounts, as applicable to the corresponding charges, monetary variations and/or exchange rates incurred through the balance sheet date.
p) Stock option plans
The fair value of the respective equity instruments is calculated on the grant date of the stock option plans, based on pricing models usually adopted by the market. These models are calculated using assumptions, such as market value of the stock, the option exercise price, price volatility of the Company’s stock (calculated on a historical stock price basis), risk-free interest rate, term of the contract (“vesting period”) and anticipated distribution of dividends. The compensation costs associated with these plans are recorded on a straight-line basis over the service period to the beneficiary beneficial, in consideration of an anticipated withdrawal. The assumptions and models used to estimate the fair value of share-based payments are disclosed in Note 20.
q) Other assets and liabilities
An asset is recorded on the balance sheet when it is treated as a resource controlled by the Company as a result of past events and from which future economic benefits are expected to flow. A liability is recorded on the balance sheet when the Company has a legal obligation or an obligation has come about as a result of a past event, where it is probable that an economic resource will be required to liquidate it.
24
r) Earnings per share
In accordance with Technical Pronouncement CPC 41 (IAS 33), net income is calculated and presented in a basic format and diluted, as described in Note 24.
s) Statements of Cash Flows
The statements of cash flows have been prepared by the indirect method and are presented in accordance with Technical Pronouncement CPC 03 (IAS 7).
t) Information per segment
Operating segments are defined as components of an enterprise for which separate financial information is regularly available and evaluated by the chief operating decision-maker in deciding how to allocate resources to an individual segment and in assessing the performance of the segment. The Company’s activities are concentrated in the marketing of products and delivery of services by various means of distance marketing, especially the Internet. Despite the diversity of products sold and services provided by the Company (retail and wholesale trade, movie rentals, sale and distribution of theater and movie tickets, tickets for transportation and public events, entrance to theme parks and events in general, among others), such activities are not controlled and managed by the Management as independent operational segments, as their accompanying results are monitored, tracked and evaluated in an integrated manner. Thus, Management understands that the Company is organized, basically, in a single business unit. The Company also operates in the area of financial products through the jointly controlled subsidiary, Submarino Finance, which, because does not achieve the minimum quantitative and qualitative parameters, is not being presented as a separate operating segment.
u) Value Added Statement (VAS)
This statement aims to highlight the wealth created by the Company, its subsidiaries and jointly controlled subsidiaries, and its distribution channels during a specific fiscal year, and is presented as required by Brazilian corporate law, as part of its individual financial statements and as supplemental information to the consolidated financial statements, yet it is not a planned or compulsory statement in accordance with the IFRS. The VAS has been prepared based on information obtained from accounting records that serve as the basis for preparation of financial statements and following the provisions contained in Technical Pronouncement CPC 09. The first part introduces the wealth created by the Company, represented by revenue (gross sales revenue, including the taxes levied on it, other revenue and the effects of the allowance for doubtful accounts), the inputs acquired from third parties (cost of sales and purchases of materials, energy and services from third parties, including taxes included at the time of acquisition, the effects
25
of loss and recovery of asset values, and depreciation and amortization) and the received value added from third parties (the result of equity, financial income and other revenue). The second part of VAS shows the distribution of wealth between personnel, taxes, fees and contributions, remuneration of third party capital, and pay equity.
4. First time adoption of International Accounting Standards
The Company’s financial statements (Parent Company and Consolidated) up to December 31, 2009 were prepared based on the accounting practices adopted in Brazil, additional rules of CVM, technical pronouncements of CPC issued up December 31, 2008 and provisions in the Brazilian Corporate Law (BRGAAP). The Company has prepared its opening balance sheet with a transition date of January 1, 2009. Therefore, it has adopted the mandatory exceptions and certain optional exemptions of full retrospective adoption, according to Technical Pronouncements, Interpretations and Guidelines issued by the CPC and approved by the CVM for Individual (Parent Company) and Consolidated Financial Statements according to the International Financial Reporting Standards (IFRS), issued by the International Accounting Standards Board (IASB) for Consolidated Financial Statements. The CPC 37R (IFRS 1) requires that an entity to develop accounting policies based on CPC and IASB standards and interpretations effective on the closing date of the first Parent Company´s and Consolidated financial statements, and such policies shall be applied the transition date and during all periods presented in the first CPC (application of all rules) and the IFRS statements. The Company´s transition date is January 1, 2009. The Company has adopted all the pronouncements, guidelines and interpretations of the CPC issued up as of December 31, 2010 and, therefore the consolidated financial statements aligned with the International Accounting Standards issued by IASB and approved by CPC. The main differences between the accounting practices adopted on the transition date, including the Shareholders’ Equity and income reconciliations, and the practices adopted for the presentation of comparative financial information are described below. The individual financial statements for the year ended December 31, 2010 are the first one presented consideration the full application of the CPCs and the consolidated financial statements, also are the first one considering the full application of CPCs and in accordance with the International Financial Reporting Standards (IFRS).
26
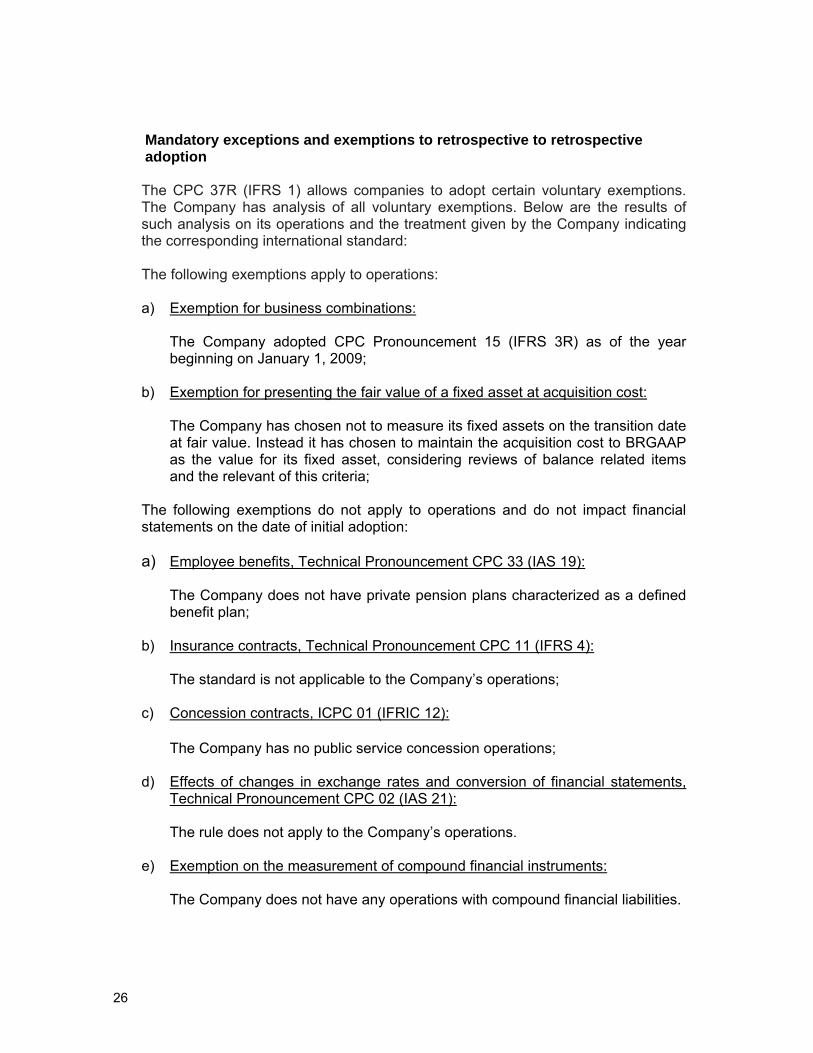
Mandatory exceptions and exemptions to retrospective to retrospective adoption The CPC 37R (IFRS 1) allows companies to adopt certain voluntary exemptions. The Company has analysis of all voluntary exemptions. Below are the results of such analysis on its operations and the treatment given by the Company indicating the corresponding international standard: The following exemptions apply to operations: a) Exemption for business combinations:
The Company adopted CPC Pronouncement 15 (IFRS 3R) as of the year beginning on January 1, 2009;
b) Exemption for presenting the fair value of a fixed asset at acquisition cost:
The Company has chosen not to measure its fixed assets on the transition date at fair value. Instead it has chosen to maintain the acquisition cost to BRGAAP as the value for its fixed asset, considering reviews of balance related items and the relevant of this criteria;
The following exemptions do not apply to operations and do not impact financial statements on the date of initial adoption:
a) Employee benefits, Technical Pronouncement CPC 33 (IAS 19):
The Company does not have private pension plans characterized as a defined benefit plan;
b) Insurance contracts, Technical Pronouncement CPC 11 (IFRS 4):
The standard is not applicable to the Company’s operations;
c) Concession contracts, ICPC 01 (IFRIC 12):
The Company has no public service concession operations;
d) Effects of changes in exchange rates and conversion of financial statements,
Technical Pronouncement CPC 02 (IAS 21):
The rule does not apply to the Company’s operations.
e) Exemption on the measurement of compound financial instruments:
The Company does not have any operations with compound financial liabilities.

27
f) Investments in subsidiaries, assets and liabilities of subsidiaries, liabilities from the deactivation and transfer of customer assets:
These rules, which briefly allow adoption of a different transition date from January 1, 2009 for these issues, do not bring practical impacts for the first adoption of the CPCs by the Company.
In addition to voluntary exemptions, the CPC 37R (IFRS 1) also prescribes expressly prohibits adjustment of certain transactions on the first adoption, since the adoption in these areas require management to analyze past events after the results of such transactions. The mandatory exceptions include:
a) Accounting for assets and liabilities write-offs:
The Company has not retrospectively adjusted its financial assets and liabilities for the first adoption of the CPC;
b) Registration of hedge transactions:
The CPC 37R (IFRS 1) prohibits the retrospective application of hedge accounting methodology. However, since all of the Company’s hedge instruments have already been properly designated as such on the date of transition, this prohibition does not generate effects for the initial application of CPCs;
c) Changes in estimates:
Estimates taken in the transition to the CPC are consistent with estimates adopted by previous accounting standards;
d) Derecognition of financial assets and liabilities:
The Company has no operations that were subject to these standards.
Reconciliations of accounting practices adopted in teh preparation of financial statement previously disclosed
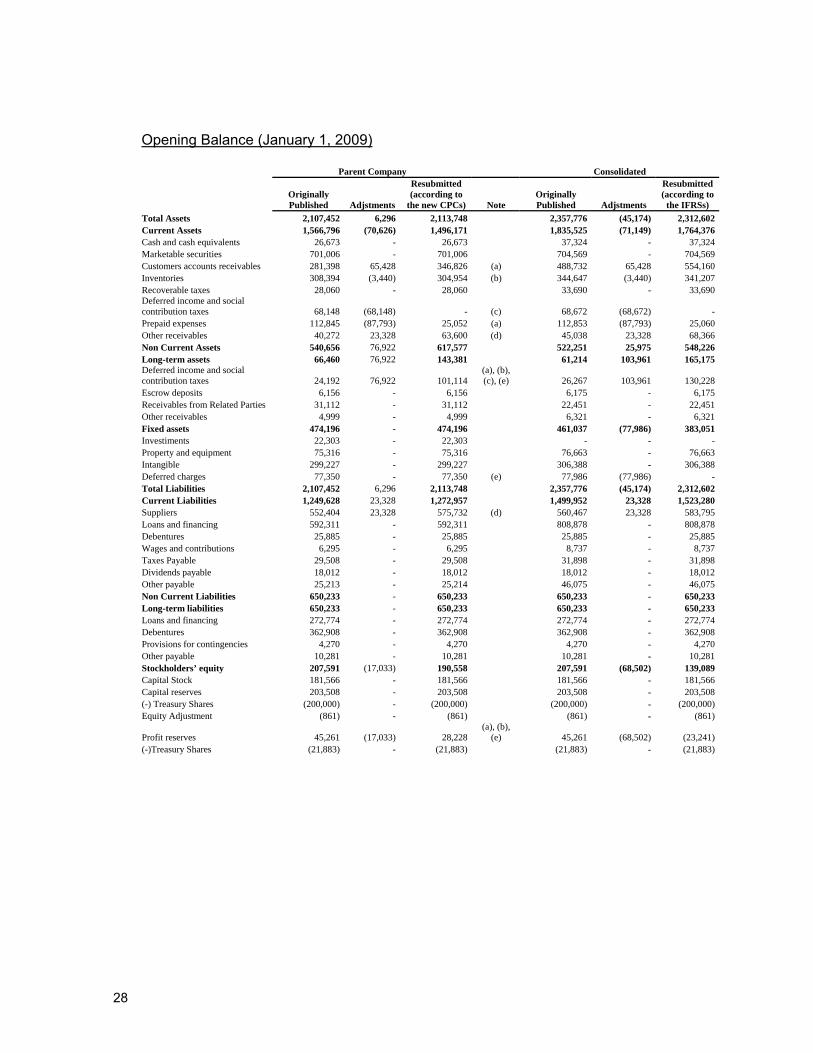
Pursuant to the CPC 37R (IFRS 1), the Company presents the reconciliation of the assets, liabilities, results, equity and cash flows, for the Parent Company and Consolidated, information previously disclosed for the periods of January 1, 2009 (transition date) and December 31, 2009, originally prepared based on practices adopted in Brazil (BRGAAP), in effect up to December 31, 2009, and international rules considering the CPCs in effect in 2010.
28
Opening Balance (January 1, 2009) Parent Company Consolidated
Originally Published Adjstments
Resubmitted (according to
the new CPCs) Note Originally Published Adjstments
Resubmitted (according to
the IFRSs) Total Assets 2,107,452 6,296 2,113,748 2,357,776 (45,174) 2,312,602 Current Assets 1,566,796 (70,626) 1,496,171 1,835,525 (71,149) 1,764,376 Cash and cash equivalents 26,673 - 26,673 37,324 - 37,324 Marketable securities 701,006 - 701,006 704,569 - 704,569 Customers accounts receivables 281,398 65,428 346,826 (a) 488,732 65,428 554,160 Inventories 308,394 (3,440) 304,954 (b) 344,647 (3,440) 341,207 Recoverable taxes 28,060 - 28,060 33,690 - 33,690 Deferred income and social contribution taxes 68,148 (68,148) - (c) 68,672 (68,672) - Prepaid expenses 112,845 (87,793) 25,052 (a) 112,853 (87,793) 25,060 Other receivables 40,272 23,328 63,600 (d) 45,038 23,328 68,366 Non Current Assets 540,656 76,922 617,577 522,251 25,975 548,226 Long-term assets 66,460 76,922 143,381 61,214 103,961 165,175 Deferred income and social contribution taxes 24,192 76,922 101,114
(a), (b), (c), (e) 26,267 103,961 130,228
Escrow deposits 6,156 - 6,156 6,175 - 6,175 Receivables from Related Parties 31,112 - 31,112 22,451 - 22,451 Other receivables 4,999 - 4,999 6,321 - 6,321 Fixed assets 474,196 - 474,196 461,037 (77,986) 383,051 Investiments 22,303 - 22,303 - - - Property and equipment 75,316 - 75,316 76,663 - 76,663 Intangible 299,227 - 299,227 306,388 - 306,388 Deferred charges 77,350 - 77,350 (e) 77,986 (77,986) - Total Liabilities 2,107,452 6,296 2,113,748 2,357,776 (45,174) 2,312,602 Current Liabilities 1,249,628 23,328 1,272,957 1,499,952 23,328 1,523,280 Suppliers 552,404 23,328 575,732 (d) 560,467 23,328 583,795 Loans and financing 592,311 - 592,311 808,878 - 808,878 Debentures 25,885 - 25,885 25,885 - 25,885 Wages and contributions 6,295 - 6,295 8,737 - 8,737 Taxes Payable 29,508 - 29,508 31,898 - 31,898 Dividends payable 18,012 - 18,012 18,012 - 18,012 Other payable 25,213 - 25,214 46,075 - 46,075 Non Current Liabilities 650,233 - 650,233 650,233 - 650,233 Long-term liabilities 650,233 - 650,233 650,233 - 650,233 Loans and financing 272,774 - 272,774 272,774 - 272,774 Debentures 362,908 - 362,908 362,908 - 362,908 Provisions for contingencies 4,270 - 4,270 4,270 - 4,270 Other payable 10,281 - 10,281 10,281 - 10,281 Stockholders’ equity 207,591 (17,033) 190,558 207,591 (68,502) 139,089 Capital Stock 181,566 - 181,566 181,566 - 181,566 Capital reserves 203,508 - 203,508 203,508 - 203,508 (-) Treasury Shares (200,000) - (200,000) (200,000) - (200,000) Equity Adjustment (861) - (861) (861) - (861)
Profit reserves 45,261 (17,033) 28,228 (a), (b),
(e) 45,261 (68,502) (23,241) (-)Treasury Shares (21,883) - (21,883) (21,883) - (21,883)

29
Balance Sheet on December 31,2009
Parent Company Consolidated
Originally Published
Adjstments
Resubmitted (according to the
new CPCs) Note Originally Published
Adjstments
Resubmitted (according to the
IFRSs) Total Assets 2,144,629 18,230 2,162,859 2,320,210 (16,274) 2,303,936 Current Assets 1,486,566 (36,386) 1,450,180 1,685,297 (38,864) 1,646,433 Cash and cash equivalents 56,974 - 56,974 62,047 - 62,047 Marketable securities 540,010 - 540,010 547,832 - 547,832 Customers accounts receivables 237,352 34,913 272,265 (a) 389,374 34,913 424,287 Inventories 468,511 (4,828) 463,683 (b) 490,397 (4,828) 485,569 Recoverable taxes 58,992 0 58,992 64,221 - 64,221 Deferred income and social contribution taxes 36,896 (36,896) - (c) 39,373 (39,373) - Prepaid expenses 71,334 (58,940) 12,394 (a) 72,802 (58,940) 13,862 Other receivables 16,498 29,364 45,862 (d) 19,251 29,364 48,615 Non Current Assets 658,063 54,616 712,679 634,913 22,590 657,503 Long-term assets 106,480 46,706 153,186 96,137 75,698 171,835 Deferred income and social contribution taxes 44,784 46,706 91,490
(a), (b), (c), (e) 44,784 75,698 120,483
Escrow deposits 12,069 - 12,069 12,289 - 12,289 Receivables from Related Parties 45,794 - 45,794 33,744 - 33,744 Other receivables 3,833 - 3,833 5,319 - 5,319 Fixed assets 551,583 7,910 559,493 538,776 (53,108) 485,668 Investiments 29,970 - 29,970 - - - Property and equipment 88,011 - 88,011 92,826 - 92,826 Intangible 373,183 7,910 381,093 (f) 384,932 7,910 392,842 Deferred charges 60,419 - 60,419 (e) 61,018 (61,018) - Total Liabilities 2,144,629 18,230 2,162,859 2,320,210 (16,274) 2,303,936 Current Liabilities 796,003 29,364 825,367 971,584 29,364 1,000,948 Suppliers 538,878 29,364 568,242 (d) 551,569 29,364 580,933 Loans and financing 182,491 - 182,491 327,929 - 327,929 Debentures 17,835 - 17,835 17,835 - 17,835 Salaries and social charges security 6,278 - 6,278 8,240 - 8,240 Taxes Payable 10,261 - 10,261 19,009 - 19,009 Dividends payable 11,308 - 11,308 11,308 - 11,308 Other payable 28,952 - 28,952 35,694 - 35,694 Non Current Liabilities 1,101,659 2,689 1,104,348 1,101,658 8,459 1,110,116 Long-term liabilities 1,101,659 2,689 1,104,348 1,101,658 8,459 1,110,116 Loans and financing 710,181 - 710,181 710,181 - 710,181 Debentures 363,244 - 363,244 363,244 0 363,244 Deferred income and social contribution taxes 5,208 2,689 7,897 (f) 5,208 8,458 13,666 Provisions for contingencies 13,517 - 13,517 13,517 - 13,517 Other payable 9,509 - 9,509 9,508 0 9,508 Stockholders’ equity 246,968 (13,824) 233,144 246,968 (54,096) 192,872 Capital Stock 181,566 - 181,566 181,566 - 181,566 Capital reserves 205,291 - 205,291 205,291 - 205,291 (-) Treasury Shares (200,000) - (200,000) (200,000) - (200,000) Equity Adjustment 1,250 - 1,250 1,250 - 1,250
Profit reserves 81,562 (17,033) 64,529 (a), (b), (e), (f) 81,562 (57,305) 24,257
(-)Treasury Shares (22,701) - (22,701) (22,701) - (22,701) Total Assets - 3,209 3,209 - 3,209 3,209
30
Income Statement for the year ended on December 31,2009
Parent Company Consolidated
Originally Published Adjstments
Resubmitted (according to the
new CPCs) Note Originally Published Adjstments
Resubmitted (according to
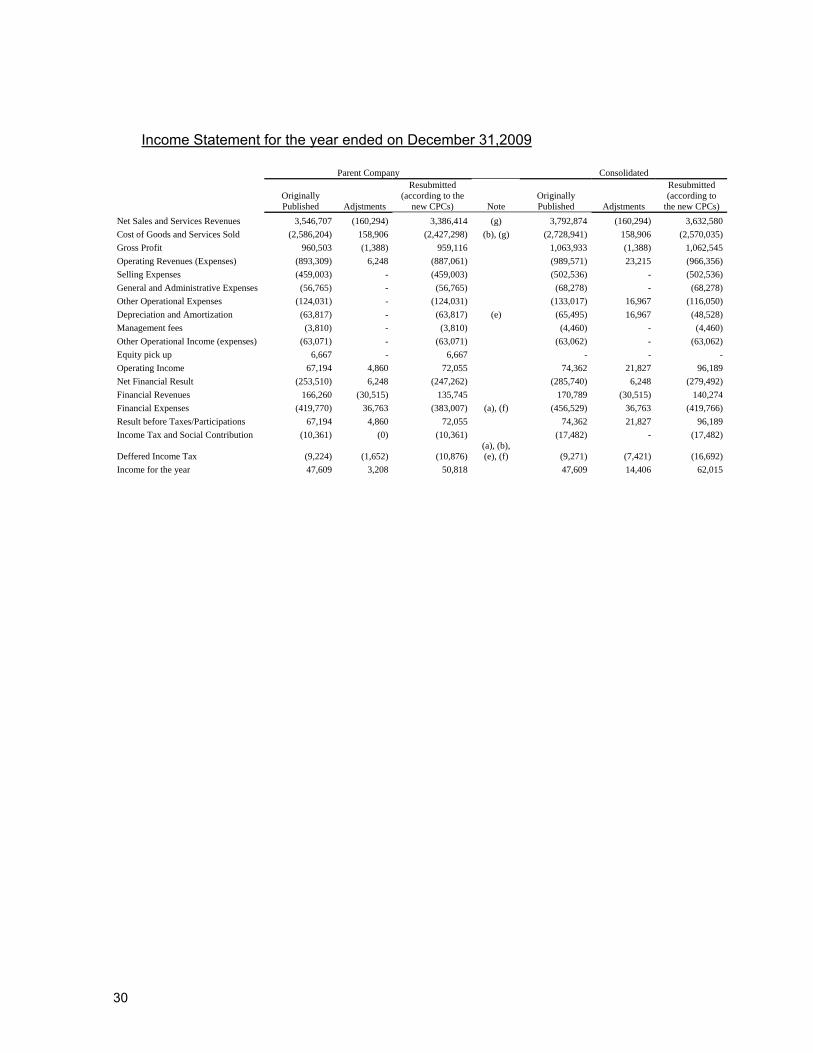
the new CPCs) Net Sales and Services Revenues 3,546,707 (160,294) 3,386,414 (g) 3,792,874 (160,294) 3,632,580 Cost of Goods and Services Sold (2,586,204) 158,906 (2,427,298) (b), (g) (2,728,941) 158,906 (2,570,035) Gross Profit 960,503 (1,388) 959,116 1,063,933 (1,388) 1,062,545 Operating Revenues (Expenses) (893,309) 6,248 (887,061) (989,571) 23,215 (966,356) Selling Expenses (459,003) - (459,003) (502,536) - (502,536) General and Administrative Expenses (56,765) - (56,765) (68,278) - (68,278) Other Operational Expenses (124,031) - (124,031) (133,017) 16,967 (116,050) Depreciation and Amortization (63,817) - (63,817) (e) (65,495) 16,967 (48,528) Management fees (3,810) - (3,810) (4,460) - (4,460) Other Operational Income (expenses) (63,071) - (63,071) (63,062) - (63,062) Equity pick up 6,667 - 6,667 - - - Operating Income 67,194 4,860 72,055 74,362 21,827 96,189 Net Financial Result (253,510) 6,248 (247,262) (285,740) 6,248 (279,492) Financial Revenues 166,260 (30,515) 135,745 170,789 (30,515) 140,274 Financial Expenses (419,770) 36,763 (383,007) (a), (f) (456,529) 36,763 (419,766) Result before Taxes/Participations 67,194 4,860 72,055 74,362 21,827 96,189 Income Tax and Social Contribution (10,361) (0) (10,361) (17,482) - (17,482)
Deffered Income Tax (9,224) (1,652) (10,876) (a), (b), (e), (f) (9,271) (7,421) (16,692)
Income for the year 47,609 3,208 50,818 47,609 14,406 62,015

31
Cash Flow Statement for the year ended on December 31,2009
Parent Company Consolidated
Originally Published Adjstments
Resubmitted
(according to the new CPCs)
Originally Published Adjstments Adjstments
Resubmitted (according to
the new CPCs) Operating Activities: Net Income of the period 47,609 3,209 50,818 47,609 14,406 62,015 Adjust for non cash and non operating items: Present Value Adjustment (16,281) 16,281 - (a) (16,281) 16,281 - Depreciation and amortization 63,817 - 63,817 (e) 65,495 (16,967) 48,528
Deferred income tax and social contribution 9,224 1,652 10,876 (a), (b), (e),
(f) 9,271 7,421 16,692 Interest, monetary and currency changes 252,004 (6,248) 245,756 (a), (f) 275,188 (6,248) 268,940 Equity result in subsidiaries (6,667) - (6,667) - - -
Others 15,952 (14,894) 1,058 (a), (b), (e),
(f) 22,410 (14,893) 7,517 Adjusted Net Income (Cash Earnings) 365,658 - 365,658 403,692 - 403,692 (Increase) decrease in assets: Accounts receivable (14,606) 13,313 (1,293) (a) 12,628 13,313 25,941
Inventory (158,535) - (158,535) (144,168) - (144,168) Taxes recoverable (30,562) - (30,562) (28,724) - (28,724) Prepaid expenses (3,334) - (3,334) (4,794) - (4,794) Escrow deposits (5,913) - (5,913) (6,114) - (6,114) Accounts receivable related parties - (14,356) (14,356) - (11,130) (11,130) Other accounts receivable (current and non-current) (18,234) 43,177 24,943 (a) (14,456) 40,904 26,448 (231,184) 42,134 (189,050) (185,628) 43,087 (142,541) (Increase) decrease in liabilities: Suppliers 24,717 (41,128) (16,411) (a) 29,345 (41,128) (11,783) Salaries and social charges security (17) - (17) (497) - (497) Taxes recoverable (current and non-current) (19,247) - (19,247) (12,890) - (12,890) Related parties payables 2,183 (2,183) - 2,183 (2,183) -
Deferred income tax and social contribution - 5,208 5,208 (a), (b), (e),
(f) - 5,208 5,208 Other liabilities (current and non-current) 2,043 (5,207) (3,164) (12,077) (5,208) (17,285) 9,679 (43,310) (33,631) 6,064 (43,311) (37,247) Cash flow from operating activities 144,153 (1,176) 142,977 224,128 (224) 223,904 Investing Activities Investment in subsidiaries and jointly controled compananies (1,000) - (1,000) - - - Fixed Assets (133,537) - (133,537) (143,234) - (143,234) Property and equipment (26,656) - (26,656) (30,959) - (30,959) Intangible (106,881) - (106,881) (112,275) - (112,275) Cash Flow from investing activities (134,537) - (134,537) (143,234) - (143,234) Financing Activities Loans and financing Additions 560,949 - 560,949 560,949 - 560,949 Payments (636,380) - (636,380) (730,960) - (730,960) Debentures (51,082) 224 (50,858) (51,082) 224 (50,858) Marketable Securities 196,962 - 196,962 193,066 - 193,066 Discount of receivables (30,934) 952 (29,982) (a) (9,314) - (9,314) Shares repurchase (818) - (818) (818) - (818) Dividends paid (18,012) - (18,012) (18,012) - (18,012) Cash Flow from financing activities 20,685 1,176 21,861 (56,171) 224 (55,947) Changes in cash balance 30,301 30,301 24,723 24,723 Beginning Cash Balance 26,673 26,673 37,324 37,324 Ending Cash Balance 56,974 56,974 62,047 62,047
32
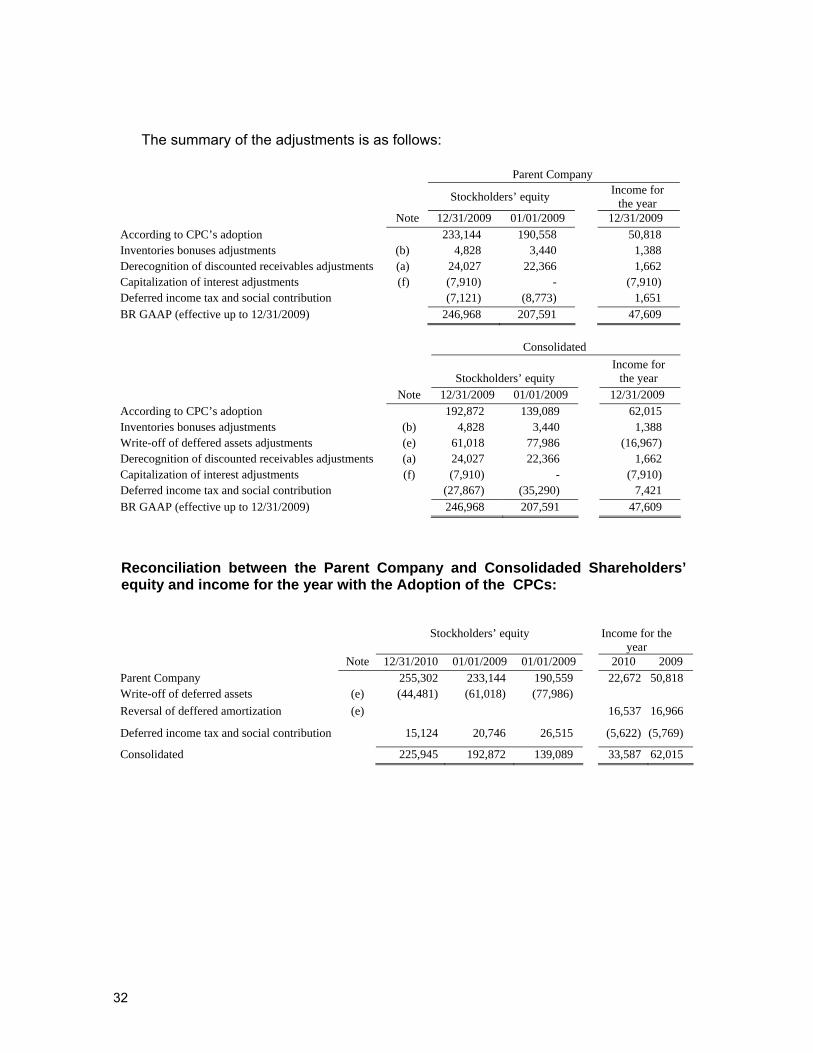
The summary of the adjustments is as follows:
Parent Company
Stockholders’ equity Income for the year
Note 12/31/2009 01/01/2009 12/31/2009 According to CPC’s adoption 233,144 190,558 50,818 Inventories bonuses adjustments (b) 4,828 3,440 1,388 Derecognition of discounted receivables adjustments (a) 24,027 22,366 1,662 Capitalization of interest adjustments (f) (7,910) - (7,910) Deferred income tax and social contribution (7,121) (8,773) 1,651 BR GAAP (effective up to 12/31/2009) 246,968 207,591 47,609
Consolidated
Stockholders’ equity Income for
the year Note 12/31/2009 01/01/2009 12/31/2009 According to CPC’s adoption 192,872 139,089 62,015 Inventories bonuses adjustments (b) 4,828 3,440 1,388 Write-off of deffered assets adjustments (e) 61,018 77,986 (16,967) Derecognition of discounted receivables adjustments (a) 24,027 22,366 1,662 Capitalization of interest adjustments (f) (7,910) - (7,910) Deferred income tax and social contribution (27,867) (35,290) 7,421 BR GAAP (effective up to 12/31/2009) 246,968 207,591 47,609
Reconciliation between the Parent Company and Consolidaded Shareholders’ equity and income for the year with the Adoption of the CPCs:
Stockholders’ equity Income for the
year Note 12/31/2010 01/01/2009 01/01/2009 2010 2009 Parent Company 255,302 233,144 190,559 22,672 50,818 Write-off of deferred assets (e) (44,481) (61,018) (77,986) Reversal of deffered amortization (e) 16,537 16,966
Deferred income tax and social contribution 15,124 20,746 26,515 (5,622) (5,769)
Consolidated 225,945 192,872 139,089 33,587 62,015
33
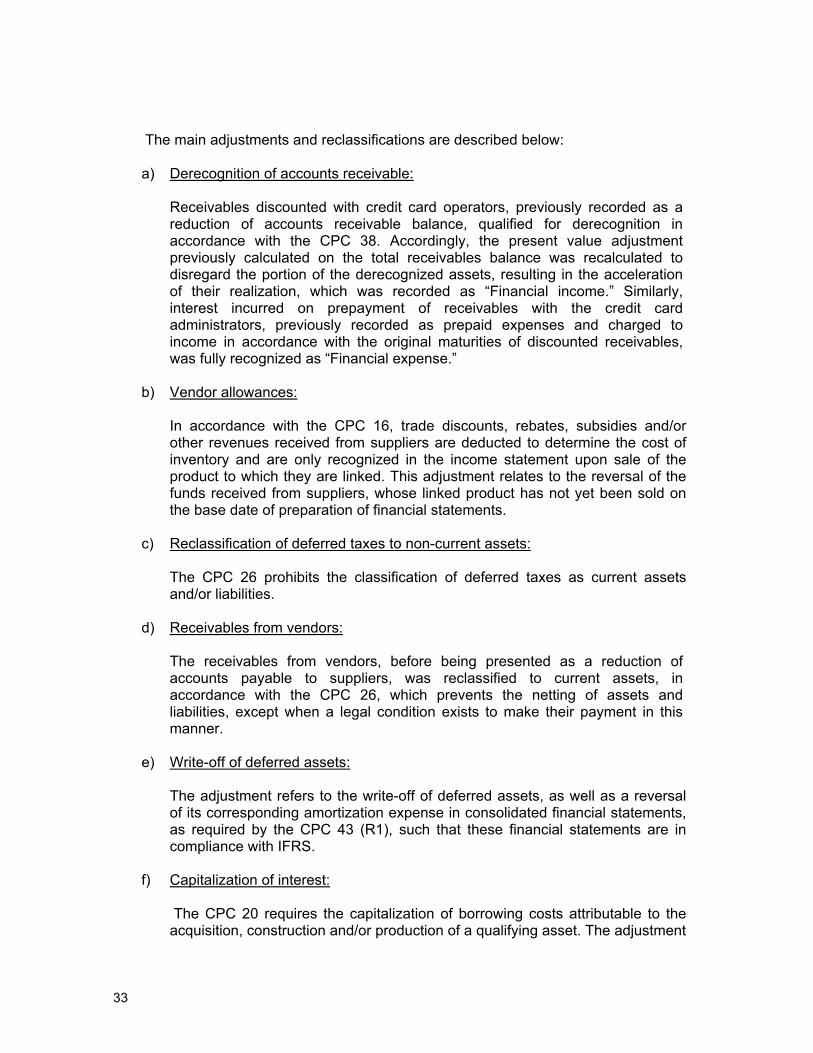
The main adjustments and reclassifications are described below:
a) Derecognition of accounts receivable:
Receivables discounted with credit card operators, previously recorded as a reduction of accounts receivable balance, qualified for derecognition in accordance with the CPC 38. Accordingly, the present value adjustment previously calculated on the total receivables balance was recalculated to disregard the portion of the derecognized assets, resulting in the acceleration of their realization, which was recorded as “Financial income.” Similarly, interest incurred on prepayment of receivables with the credit card administrators, previously recorded as prepaid expenses and charged to income in accordance with the original maturities of discounted receivables, was fully recognized as “Financial expense.”
b) Vendor allowances:
In accordance with the CPC 16, trade discounts, rebates, subsidies and/or other revenues received from suppliers are deducted to determine the cost of inventory and are only recognized in the income statement upon sale of the product to which they are linked. This adjustment relates to the reversal of the funds received from suppliers, whose linked product has not yet been sold on the base date of preparation of financial statements.
c) Reclassification of deferred taxes to non-current assets:
The CPC 26 prohibits the classification of deferred taxes as current assets and/or liabilities.
d) Receivables from vendors:
The receivables from vendors, before being presented as a reduction of accounts payable to suppliers, was reclassified to current assets, in accordance with the CPC 26, which prevents the netting of assets and liabilities, except when a legal condition exists to make their payment in this manner.
e) Write-off of deferred assets:
The adjustment refers to the write-off of deferred assets, as well as a reversal of its corresponding amortization expense in consolidated financial statements, as required by the CPC 43 (R1), such that these financial statements are in compliance with IFRS.
f) Capitalization of interest:
The CPC 20 requires the capitalization of borrowing costs attributable to the acquisition, construction and/or production of a qualifying asset. The adjustment

34
in question refers to the capitalization of borrowing costs related to developments of software and websites for the Company.
g) Net revenue:
Piece of the income from subsidies, previously registered as sales revenue, was reclassified as a reduction in the cost of the sales of goods.
Restatement of 2010 quarterly reports, compared with 2009, also adjusted by the CPCs in effect on December 31, 2010.
As permitted by CVM Resolution 656 of January 25, 2011, the Company chose to restate the quarterly reports for the quarters ended on March 31, June 30 and September 30, 2010 up to the quarterly report for the quarter ending on March 31, 2011. Thus, in accordance with the requirement of CVM Resolution, the Company presents below the effects on income and equity for the quarters ended March 31, June 30 and September 30, 2010 and 2009, resulting from the adoption of the CPCs in effect on December 31, 2010.

35
Reconciliation of the Shareholders’ equity:
09/30/2010 06/30/2010 03/31/2010 09/30/2009 06/30/2009 03/31/2009 Restated Shareholders’ equity (according to the new CPCs)
276,976 259,641 243,947 223,189 216,736 214,801
Inventories bonuses adjustments
3,890 5,153 3,729 4,272 4,186 5,350 Derecognition of discounted receivables adjustments
11,226 17,426
23,335 31,539 21,320 (1,782)
Revision of the useful life of fixed and intangible assets
(18,883)
(12,424)
(6,183) - - -
Capitalization of interest adjustments
(17,644)
(15,462)
(10,720)
(5,732)
(3,712) (2,036)Deferred income tax and social contribution
7,280 1,805
(3,454)
(10,227)
(7,410) (521)
Shareholders’ equity originally published
262,845 256,139 250,654 243,041 231,120 215,812
Reconciliation of the quarter’s net income:
09/30/2010 06/30/2010 03/31/2010 09/30/2009 06/30/2009 03/31/2009 Restated Net Income (according to the new CPCs)
13,156 15,239 11,326 4,653 16,712 9,280
Inventories bonuses adjustments
(1,263) 1,424
(1,099) 86
(1,164) 1,910 Derecognition of discounted receivables adjustments
(6,200)
(5,909)
(692) 10,219 736
(1,782)
Revision of the useful life of fixed and intangible assets
(6,459)
(6,241)
(6,183) - - -
Capitalization of interest adjustments
(2,182)
(4,742)
(2,810)
(2,020)
(1,676)
(2,036)Deferred income tax and social contribution
5,475 5,259 3,667
(2,817) 716 648
Net Income originally published
2,527 5,030 4,209 10,121 15,324 8,020
36
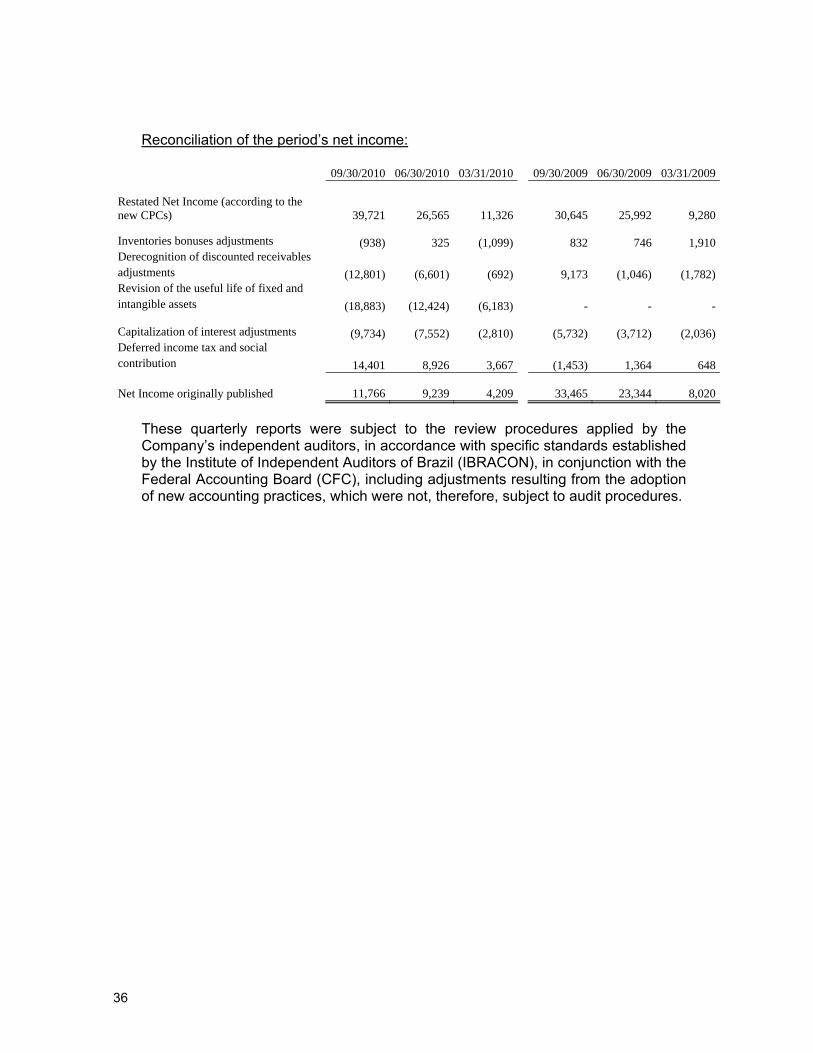
Reconciliation of the period’s net income:
09/30/2010 06/30/2010 03/31/2010 09/30/2009 06/30/2009 03/31/2009 Restated Net Income (according to the new CPCs)
39,721 26,565 11,326 30,645 25,992 9,280
Inventories bonuses adjustments
(938) 325
(1,099) 832 746 1,910 Derecognition of discounted receivables adjustments
(12,801)
(6,601)
(692) 9,173
(1,046)
(1,782)
Revision of the useful life of fixed and intangible assets
(18,883)
(12,424)
(6,183) - - -
Capitalization of interest adjustments
(9,734)
(7,552)
(2,810)
(5,732)
(3,712)
(2,036)Deferred income tax and social contribution
14,401 8,926 3,667
(1,453) 1,364 648
Net Income originally published
11,766 9,239 4,209 33,465 23,344 8,020
These quarterly reports were subject to the review procedures applied by the Company’s independent auditors, in accordance with specific standards established by the Institute of Independent Auditors of Brazil (IBRACON), in conjunction with the Federal Accounting Board (CFC), including adjustments resulting from the adoption of new accounting practices, which were not, therefore, subject to audit procedures.

37
New IFRS and IFRIC interpretations
The new accounting procedures from the International Accounting Standards Board (IASB), and interpretations from the International Financial Reporting Interpretations Committee (IFRIC), have been published and/or revised. Their adoption is optional or mandatory for the years beginning on January 1, 2010, not yet comment or related modifications by CPC. It is expected that the Brazilian standards will be modified to converge to international standards by the time the standards will be enforced. Below are some of the principal standards published but not yet in effect, as well as the expected impact on the Company’s Financial Statements:
IFRS 9 Financial Instruments - Classification and Measurement - The IFRS 9
concludes the first part of the project for the substitution of the “IAS 39 Financial Instruments: Recognition and Measurement”. IFRS 9 uses a simple approach to determine whether a financial asset is measured at amortized cost or fair value, based on the way in which an entity manages its financial instruments (its business model) and the typical contractual cash flows of financial assets. The standard also requires the adoption of only one method for determining the amount of losses of recoverable assets. This standard becomes effective for fiscal years beginning January 1, 2013. The Company does not expect this change to have a significant impact on its financial statements.
IFRIC 14 Prepayments of a Minimum Funding Requirement – This amendment
applies only to those situations where an entity is subject to minimum requirement funding contributions and advances to cover these requirements. The change allows the entity to account for the benefit of such prepayment as an asset. This amendment is effective for fiscal years beginning on or after January 1, 2011. The Company will not suffer any impact from this interpretation.
IFRIC 19 Extinguishing Financial Liabilities with Equity Instruments – The IFRIC
19 was issued in November 2009 and became effective on July 1, 2010, and early implementation was allowed. This interpretation clarifies the requirements of the International Financial Reporting Standards (IFRS) when an entity renegotiates the terms of a financial obligation and the lender agrees to accept this and the actions of the entity or other equity instruments to settle the financial obligation in whole or in part. The Company does not expect that IFRIC 19 would have a significant impact on its Financial Statements.
IFRS Improvements - The IASB issued improvements to the IFRS standards
and amendments in May 2010 and the amendments will be effective from January 1, 2011. The main changes that could impact the Company are shown below:
IFRS 3 - Business Mergers IFRS 7 - Financial Instruments Disclosures IAS 1 - Presentation of Financial Statements IAS 27 - Consolidated and individual Financial Statements IFRIC 13 - Customer Loyalty Program

38
The Company does not expect the changes to have a significant impact on its Financial Statements.
5. Marketable Securities
Parent Company Consolidated 12/31/2010 12/31/2009 1/1/2009 12/31/2010 12/31/2009 1/1/2009
Certificates of bank – deposits - CDBs 582,632 238,537 336,293 594,761 241,230 338,732Debentures 194,341 301,473 364,713 195,946 306,602 365,837 776,973 540,010 701,006 790,707 547,832 704,569
Certificates of bank deposit are in the custody of first-line financial institutions and are remunerated at rates between 100% and 105.2% of the CDI as of December 31, 2010 (100.0% to 110.0% of CDI as of December 31, 2009). Debentures are issued by a first line financial institution, and are reported at their fair value, remunerated by rates between 100% and 105% of the CDI, individual and consolidated as of December 31, 2010 (between 99.5% and 105.7% of the CDI, individual and consolidated as of December 31, 2009) and may be traded at any time ("available for sale").
6. Accounts receivable from clients
Parent Company Consolidated 12/31/2010 12/31/2009 1/1/2009 12/31/2010 12/31/2009 1/1/2009
Credit cards 606,556 196,899 284,487 640,930 221,606 305,489Other accounts receivable 89,890 100,666 94,384 258,557 257,358 292,144 696,446 297,565 378,871 899,487 478,964 597,633Present value Adjustments (16,151) (5,779) (16,858) (16,151) (5,779) (16,858)Provision for credits from doubtful accounts (30,208) (19,521) (15,187) (66,135) (48,898) (26,615) 650,087 272,265 346,826 817,201 424,287 554,160
Transactions with credit cards can be paid in up to 12 months. The Company’s and its subsidiaries’ credit risks are minimized as the portfolio receivables are monitored by the credit card management companies. Other accounts receivable include, principally, sales through corporate operations, loyalty programs and commercial agreements.
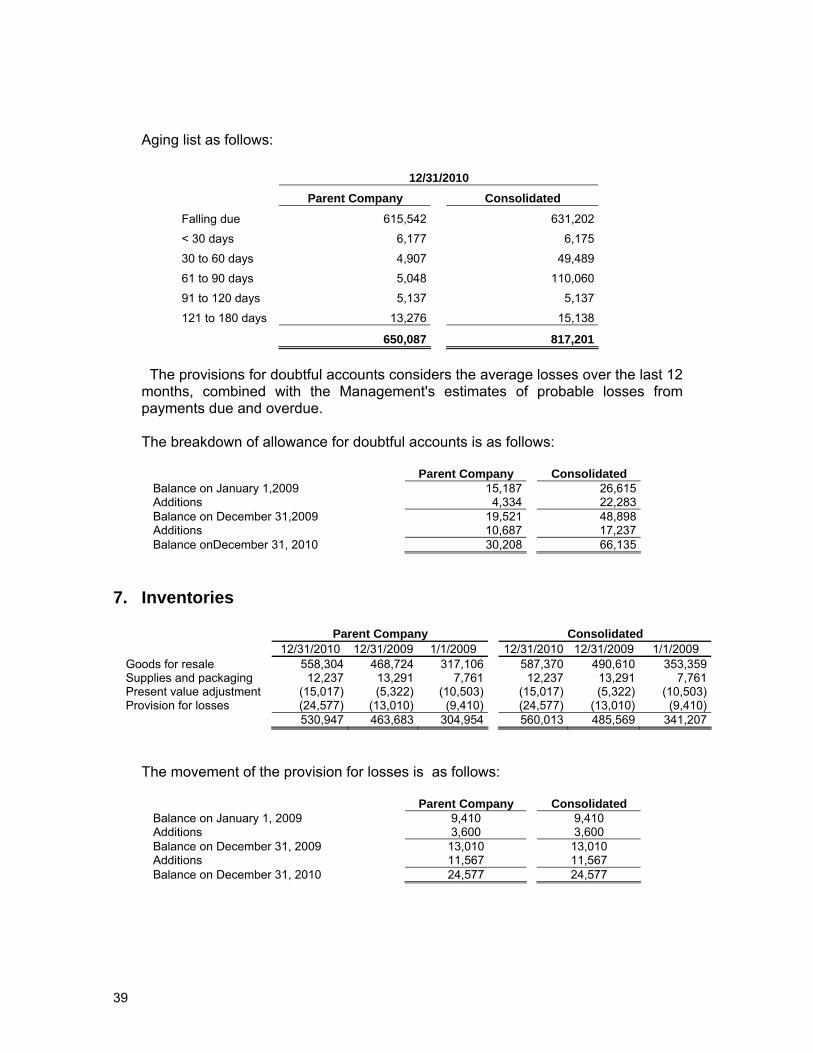
39
Aging list as follows:
12/31/2010 Parent Company Consolidated Falling due 615,542 631,202 < 30 days 6,177 6,175 30 to 60 days 4,907 49,489 61 to 90 days 5,048 110,060 91 to 120 days 5,137 5,137 121 to 180 days 13,276 15,138
650,087 817,201
The provisions for doubtful accounts considers the average losses over the last 12 months, combined with the Management's estimates of probable losses from payments due and overdue. The breakdown of allowance for doubtful accounts is as follows:
Parent Company Consolidated Balance on January 1,2009 15,187 26,615 Additions 4,334 22,283 Balance on December 31,2009 19,521 48,898 Additions 10,687 17,237 Balance onDecember 31, 2010 30,208 66,135
7. Inventories
Parent Company Consolidated 12/31/2010 12/31/2009 1/1/2009 12/31/2010 12/31/2009 1/1/2009
Goods for resale 558,304 468,724 317,106 587,370 490,610 353,359Supplies and packaging 12,237 13,291 7,761 12,237 13,291 7,761Present value adjustment (15,017) (5,322) (10,503) (15,017) (5,322) (10,503)Provision for losses (24,577) (13,010) (9,410) (24,577) (13,010) (9,410) 530,947 463,683 304,954 560,013 485,569 341,207
The movement of the provision for losses is as follows:
Parent Company Consolidated Balance on January 1, 2009 9,410 9,410 Additions 3,600 3,600 Balance on December 31, 2009 13,010 13,010 Additions 11,567 11,567 Balance on December 31, 2010 24,577 24,577
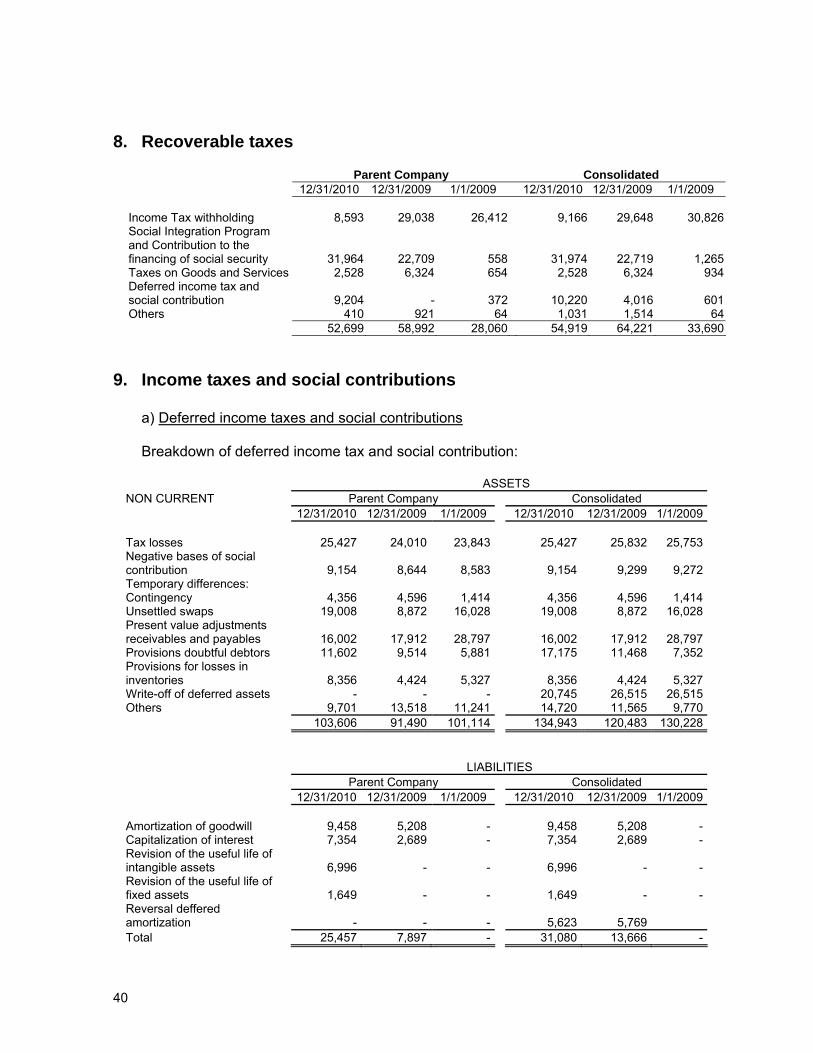
40
8. Recoverable taxes
Parent Company Consolidated 12/31/2010 12/31/2009 1/1/2009 12/31/2010 12/31/2009 1/1/2009
Income Tax withholding 8,593 29,038 26,412 9,166 29,648 30,826Social Integration Program and Contribution to the financing of social security 31,964 22,709 558 31,974 22,719 1,265Taxes on Goods and Services 2,528 6,324 654 2,528 6,324 934Deferred income tax and social contribution 9,204 - 372 10,220 4,016 601Others 410 921 64 1,031 1,514 64
52,699 58,992 28,060 54,919 64,221 33,690
9. Income taxes and social contributions
a) Deferred income taxes and social contributions Breakdown of deferred income tax and social contribution:
ASSETS
NON CURRENT Parent Company Consolidated 12/31/2010 12/31/2009 1/1/2009 12/31/2010 12/31/2009 1/1/2009
Tax losses 25,427 24,010 23,843 25,427 25,832 25,753Negative bases of social contribution 9,154 8,644 8,583 9,154 9,299 9,272Temporary differences: Contingency 4,356 4,596 1,414 4,356 4,596 1,414Unsettled swaps 19,008 8,872 16,028 19,008 8,872 16,028Present value adjustments receivables and payables 16,002 17,912 28,797 16,002 17,912 28,797Provisions doubtful debtors 11,602 9,514 5,881 17,175 11,468 7,352Provisions for losses in inventories 8,356 4,424 5,327 8,356 4,424 5,327Write-off of deferred assets - - - 20,745 26,515 26,515Others 9,701 13,518 11,241 14,720 11,565 9,770 103,606 91,490 101,114 134,943 120,483 130,228 LIABILITIES Parent Company Consolidated 12/31/2010 12/31/2009 1/1/2009 12/31/2010 12/31/2009 1/1/2009 Amortization of goodwill 9,458 5,208 - 9,458 5,208 -Capitalization of interest 7,354 2,689 - 7,354 2,689 -Revision of the useful life of intangible assets 6,996 - - 6,996 - -Revision of the useful life of fixed assets 1,649 - - 1,649 - -Reversal deffered amortization - - - 5,623 5,769 Total 25,457 7,897 - 31,080 13,666 -
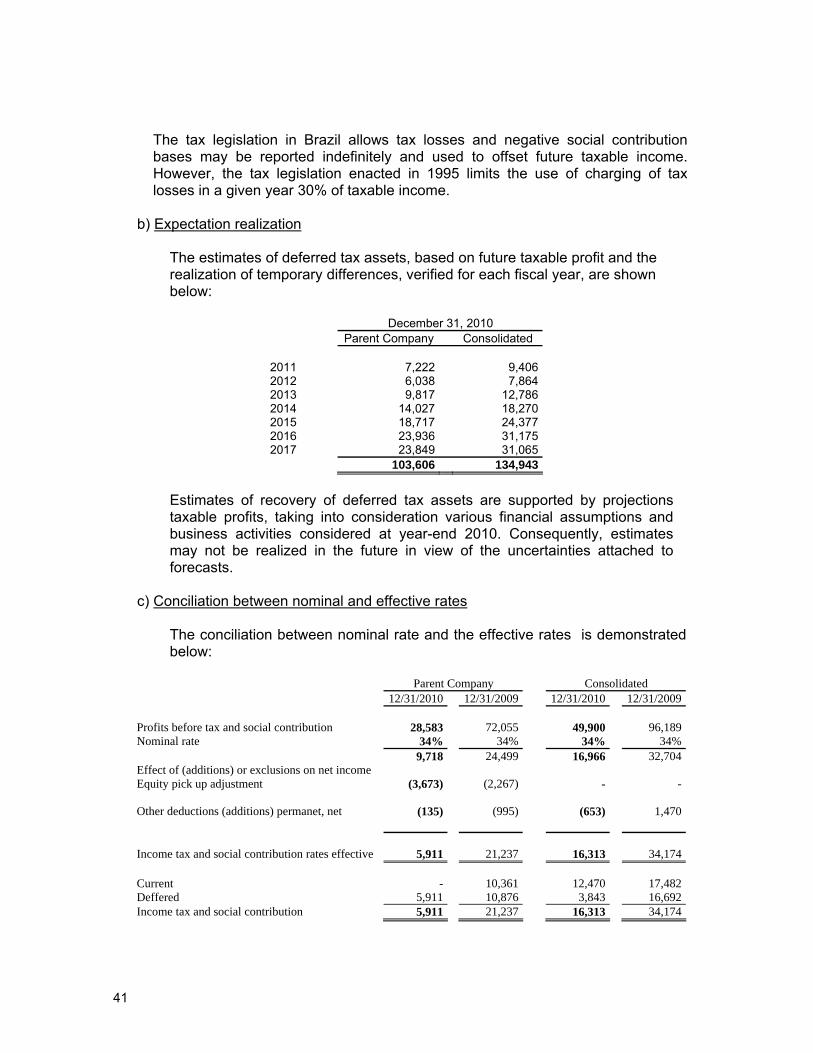
41
The tax legislation in Brazil allows tax losses and negative social contribution bases may be reported indefinitely and used to offset future taxable income. However, the tax legislation enacted in 1995 limits the use of charging of tax losses in a given year 30% of taxable income.
b) Expectation realization
The estimates of deferred tax assets, based on future taxable profit and the realization of temporary differences, verified for each fiscal year, are shown below:
December 31, 2010 Parent Company Consolidated
2011 7,222 9,4062012 6,038 7,8642013 9,817 12,7862014 14,027 18,2702015 18,717 24,3772016 23,936 31,1752017 23,849 31,065
103,606 134,943 Estimates of recovery of deferred tax assets are supported by projections taxable profits, taking into consideration various financial assumptions and business activities considered at year-end 2010. Consequently, estimates may not be realized in the future in view of the uncertainties attached to forecasts.
c) Conciliation between nominal and effective rates
The conciliation between nominal rate and the effective rates is demonstrated below:
Parent Company Consolidated 12/31/2010 12/31/2009 12/31/2010 12/31/2009
Profits before tax and social contribution 28,583 72,055 49,900 96,189 Nominal rate 34% 34% 34% 34% 9,718 24,499 16,966 32,704Effect of (additions) or exclusions on net income Equity pick up adjustment (3,673) (2,267) - -
Other deductions (additions) permanet, net (135) (995) (653)
1,470
Income tax and social contribution rates effective 5,911
21,237 16,313
34,174 Current - 10,361 12,470 17,482Deffered 5,911 10,876 3,843 16,692Income tax and social contribution 5,911 21,237 16,313 34,174

42
10. Investments
Parent Company 12/31/2010 12/31/2009 01/01/2009
Participation in Subsidiaries 35,473 25,839 20,148 Participation in jointly controled Companies 5,299 4,131 2,155
40,772 29,970 22,303 a) Subsidiaries
Ingresso.com
The subsidiary provides technology and services to purchase tickets for concerts, theater shows, soccer, theme parks, events and movies throught the Internet. The Company holds a 100% ownership stake in Ingresso.com, which owns a 100% interest in B2W Rental Ltda.
B2W Viagens
The subsidiary, under its brands Americanas Viagens, Submarino Viagens and Shoptime Viagens, offers hotel reservation services, tour packages, airline tickets, ocean cruises and rental cars. Apart from direct participation in Submarino Viagens e Turismo Ltda., the Company has a 15.73% indirect interest in this company through 8M Participações Ltda.
b) Jointly controlled Companies
Submarino Finance Promotora de Crédito Ltda.
The Company has a 50% ownership stake in Submarino Finance Promotora de Crédito Ltda., a Company whose management is shared with Cetelem Brasil S/A - Crédito Financiamento e Investimento, through which it offers Submarine credit cards and financing for the purchase of products on the Submarino website. Thus, consolidated financial statements have been prepared considering the balances of this jointly controlled company in proportion to the 50% stake held by each Company.
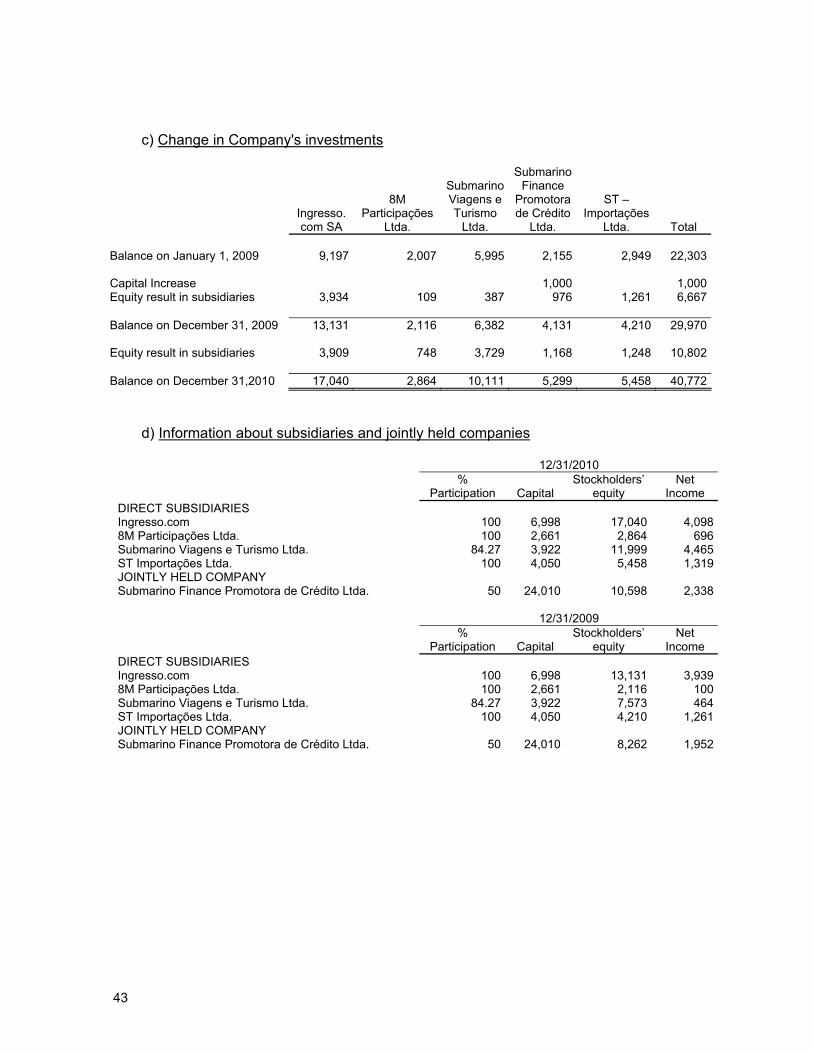
43
c) Change in Company's investments
Ingresso.com SA
8M Participações
Ltda.
Submarino Viagens e Turismo
Ltda.
Submarino Finance
Promotora de Crédito
Ltda.
ST – Importações
Ltda. Total Balance on January 1, 2009 9,197 2,007 5,995 2,155 2,949 22,303 Capital Increase 1,000 1,000Equity result in subsidiaries 3,934 109 387 976 1,261 6,667 Balance on December 31, 2009 13,131 2,116 6,382 4,131 4,210 29,970 Equity result in subsidiaries 3,909 748 3,729 1,168 1,248 10,802 Balance on December 31,2010 17,040 2,864 10,111 5,299 5,458 40,772
d) Information about subsidiaries and jointly held companies 12/31/2010
%
Participation Capital Stockholders’
equity Net
Income DIRECT SUBSIDIARIES Ingresso.com 100 6,998 17,040 4,0988M Participações Ltda. 100 2,661 2,864 696Submarino Viagens e Turismo Ltda. 84.27 3,922 11,999 4,465ST Importações Ltda. 100 4,050 5,458 1,319JOINTLY HELD COMPANY Submarino Finance Promotora de Crédito Ltda. 50 24,010 10,598 2,338
12/31/2009
%
Participation Capital Stockholders’
equity Net
Income DIRECT SUBSIDIARIES Ingresso.com 100 6,998 13,131 3,9398M Participações Ltda. 100 2,661 2,116 100Submarino Viagens e Turismo Ltda. 84.27 3,922 7,573 464ST Importações Ltda. 100 4,050 4,210 1,261JOINTLY HELD COMPANY Submarino Finance Promotora de Crédito Ltda. 50 24,010 8,262 1,952

44
11. Related party transactions a) Commercial cooperation agreement and other agreements
The Company has a Commercial Cooperation Agreement and Covenants with its Parent Company LASA, aimed at coordinating efforts in various areas of activity for mutual benefit, namely: (i) sale of goods purchased by the Company from LASA, (ii) form of competition, (iii) installation of the Company's kiosks on the business premises of LASA, (iv) use of personnel, (v) joint use of the brand name and advertising. This agreement provides that the goods purchased for resale and provided by LASA will be purchased at the price of the cost the product paid by LASA to the supplier and delivered in their Distribution Centers, plus taxes and other charges directly incurring on the buying and selling, and a percentage of 2% on the cost price of the product until the Company reaches an accumulated volume of purchases from LASA of R$ 10,000 per year. After achieving this volume, there will be an increase to 3% on the cost price of the product, the other conditions remaining unchanged. In the exercise of 2010, this operation totaled R$16,354 and in 2009, there were no substantial purchases of goods from the B2W subsidiary. Furthermore, on December 31, 2010 the amount due from the cooperation was R$5,932 (there was no balance due on December 31, 2009).
b) Licensing of the use of the Americanas.com brand and similar trademarks
The Company signed a licensing agreement with LASA for the use of the trademark, through which it is granted the exclusive license to use the Americanas.com trademark and similar brands for the activities specified in its Bylaws. As stated in the contract, the brand licensing will be free as long as LASA holds a significant shareholding position in the Company.
c) Remuneration of management
The transactions, compensation and benefits for the Directors and key executives Company and subsidiaries are described in notes as recommended in Technical Bulletin CPC 05 (IAS 24).
d) Kiosk Operations
The Company has a contract with its Parent Company, LASA, to jointly carry out activities to increase the synergy in their operations with the installation of Americanas.com brand kiosks on the commercial premises of LASA. Under that agreement, the payments for transactions on the Americanas.com site by customers can also be made at any of the counters in LASA stores. The entire proceeds from these transactions, which are paid at the LASA points of sale, are transferred monthly to the Company, net of costs incurred by the LASA
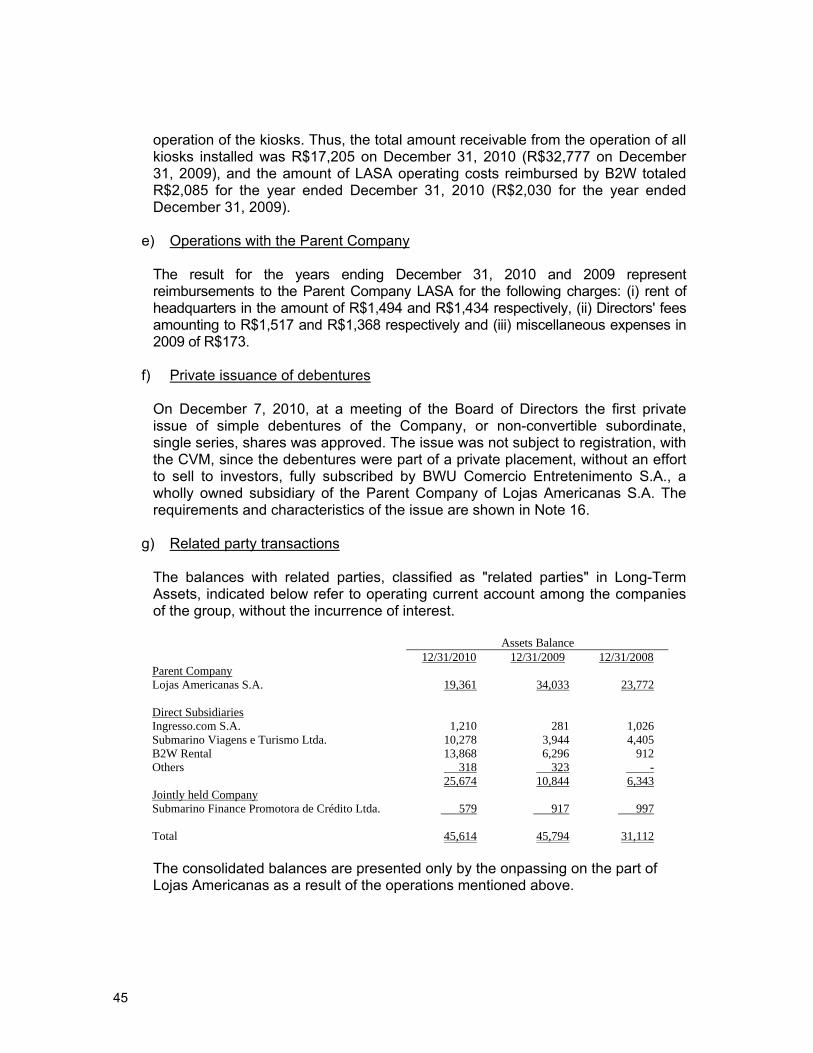
45
operation of the kiosks. Thus, the total amount receivable from the operation of all kiosks installed was R$17,205 on December 31, 2010 (R$32,777 on December 31, 2009), and the amount of LASA operating costs reimbursed by B2W totaled R$2,085 for the year ended December 31, 2010 (R$2,030 for the year ended December 31, 2009).
e) Operations with the Parent Company
The result for the years ending December 31, 2010 and 2009 represent reimbursements to the Parent Company LASA for the following charges: (i) rent of headquarters in the amount of R$1,494 and R$1,434 respectively, (ii) Directors' fees amounting to R$1,517 and R$1,368 respectively and (iii) miscellaneous expenses in 2009 of R$173.
f) Private issuance of debentures
On December 7, 2010, at a meeting of the Board of Directors the first private issue of simple debentures of the Company, or non-convertible subordinate, single series, shares was approved. The issue was not subject to registration, with the CVM, since the debentures were part of a private placement, without an effort to sell to investors, fully subscribed by BWU Comercio Entretenimento S.A., a wholly owned subsidiary of the Parent Company of Lojas Americanas S.A. The requirements and characteristics of the issue are shown in Note 16.
g) Related party transactions
The balances with related parties, classified as "related parties" in Long-Term Assets, indicated below refer to operating current account among the companies of the group, without the incurrence of interest.
Assets Balance 12/31/2010 12/31/2009 12/31/2008 Parent Company Lojas Americanas S.A. 19,361 34,033 23,772 Direct Subsidiaries Ingresso.com S.A. 1,210 281 1,026 Submarino Viagens e Turismo Ltda. 10,278 3,944 4,405 B2W Rental 13,868 6,296 912 Others 318 323 - 25,674 10,844 6,343 Jointly held Company Submarino Finance Promotora de Crédito Ltda. 579 917 997 Total 45,614 45,794 31,112
The consolidated balances are presented only by the onpassing on the part of Lojas Americanas as a result of the operations mentioned above.

46
12. Fixed Assets
Parent Company
Land
Facilities, furniture and
fixtures Machines and equipments
Improvements to third parties buildings (*)
Computer equipment Others Total
Balance on January 1, 2009 5,754 22,331 33,371 6,711 5,560 1,589 75,316 Acquisitions - 2,731 12,208 139 321 11,278 26,677 Transfers - 12,504 (12,504) - Depreciation - (3,060) (4,272) (1,224) (5,380) (46) (13,982)Balance on December 31, 2009 5,754 22,002 53,811 5,626 501 317 88,011 Acquisitions - 3,960 37,962 652 1,474 - 44,048 Transfers - (3,911) 7,763 (3,540) (312) - Depreciation - (2,619) (6,105) (263) (600) (1) (9,588)Balance on December 31, 2010 5,754 19,432 93,431 2,475 1,375 4 122,471 Balance on December 31, 2010: Total cost 5,754 27,972 122,374 3,066 28,565 5 187,736 Accumulated depreciation - (8,540) (28,943) (591) (27,190) (1) (65,265) Residual value 5,754 19,432 93,431 2,475 1,375 4 122,471 Balance on December 31, 2009: Total cost 5,754 31,422 66,669 12,294 27,091 458 143,688 Accumulated depreciation - (9,420) (12,858) (6,668) (26,590) (141) (55,677)
Residual value 5,754 22,002 53,811 5,626 501 317 88,011Weighted avarage of annual depreciation rate 10% 6.89% 10% 9.45% 10%

47
Consolidated
Land
Facilities, furniture and
fixtures Machines and equipments
Improvements to third parties buildings (*)
Computer equipment
Goods for lease Others Total
Balance on January 1,2009 5.754 22.772 33.491 6.731 6.030 - 1.885 76.663 Acquisitions - 3.009 12.208 173 896 3.620 11.278 31.184 Transfers - 12.797 - - (12.797) - Depreciation - (3.077) (4.570) (1.224) (5.513) (591) (46) (15.021)Balance on December 31, 2009 5.754 22.704 53.926 5.680 1.413 3.029 320 92.826 Acquisitions - 4.115 38.054 684 1.845 6.906 - 51.604 Transfers - (3.911) 7.763 (3.540) - - (312) - Depreciation - (2.743) (6.142) (269) (922) (2.402) (3) (12.481)Balance on December 31, 2010 5.754 20.165 93.601 2.555 2.336 7.533 5 131.949 Balance on December 31, 2010: Total cost 5.754 28.996 122.647 3.152 30.691 10.526 18 201.784 Accumulated depreciation - (8.831) (29.046) (597) (28.355) (2.993) (13) (69.835) Residual value 5.754 20.165 93.601 2.555 2.336 7.533 5 131.949 Balance on December 31, 2009: Total cost 5.754 32.291 66.851 12.348 28.846 3.620 470 150.180 Accumulated depreciation - (9.587) (12.925) (6.668) (27.433) (591) (150) (57.354)
Residual value 5.754 22.704 53.926 5.680 1.413 3.029 320 92.826Weighted avarage of annual depreciation rate 10% 6,89% 10% 9,45% 33% 10%
(*)Calculated based on the terms of leases. The average term of leases is 10 years.
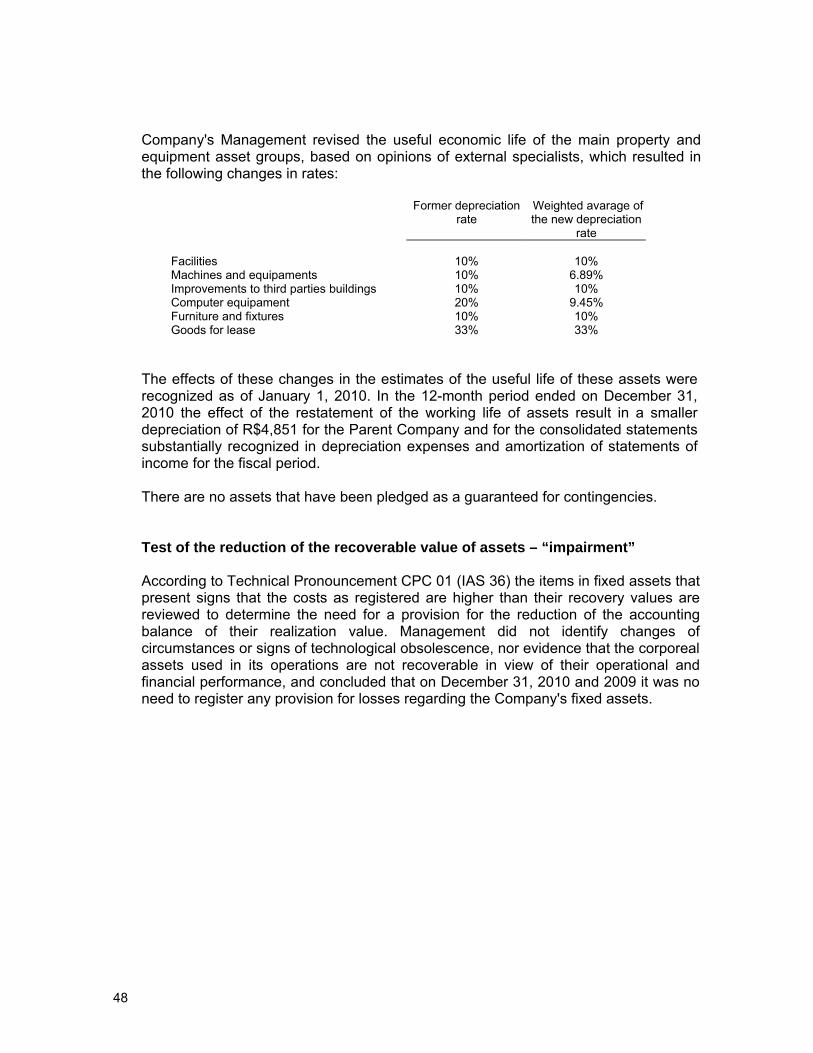
48
Company's Management revised the useful economic life of the main property and equipment asset groups, based on opinions of external specialists, which resulted in the following changes in rates:
Former depreciation
rate Weighted avarage of the new depreciation
rate Facilities 10% 10% Machines and equipaments 10% 6.89% Improvements to third parties buildings 10% 10% Computer equipament 20% 9.45% Furniture and fixtures 10% 10% Goods for lease 33% 33%
The effects of these changes in the estimates of the useful life of these assets were recognized as of January 1, 2010. In the 12-month period ended on December 31, 2010 the effect of the restatement of the working life of assets result in a smaller depreciation of R$4,851 for the Parent Company and for the consolidated statements substantially recognized in depreciation expenses and amortization of statements of income for the fiscal period. There are no assets that have been pledged as a guaranteed for contingencies. Test of the reduction of the recoverable value of assets – “impairment”
According to Technical Pronouncement CPC 01 (IAS 36) the items in fixed assets that present signs that the costs as registered are higher than their recovery values are reviewed to determine the need for a provision for the reduction of the accounting balance of their realization value. Management did not identify changes of circumstances or signs of technological obsolescence, nor evidence that the corporeal assets used in its operations are not recoverable in view of their operational and financial performance, and concluded that on December 31, 2010 and 2009 it was no need to register any provision for losses regarding the Company's fixed assets.
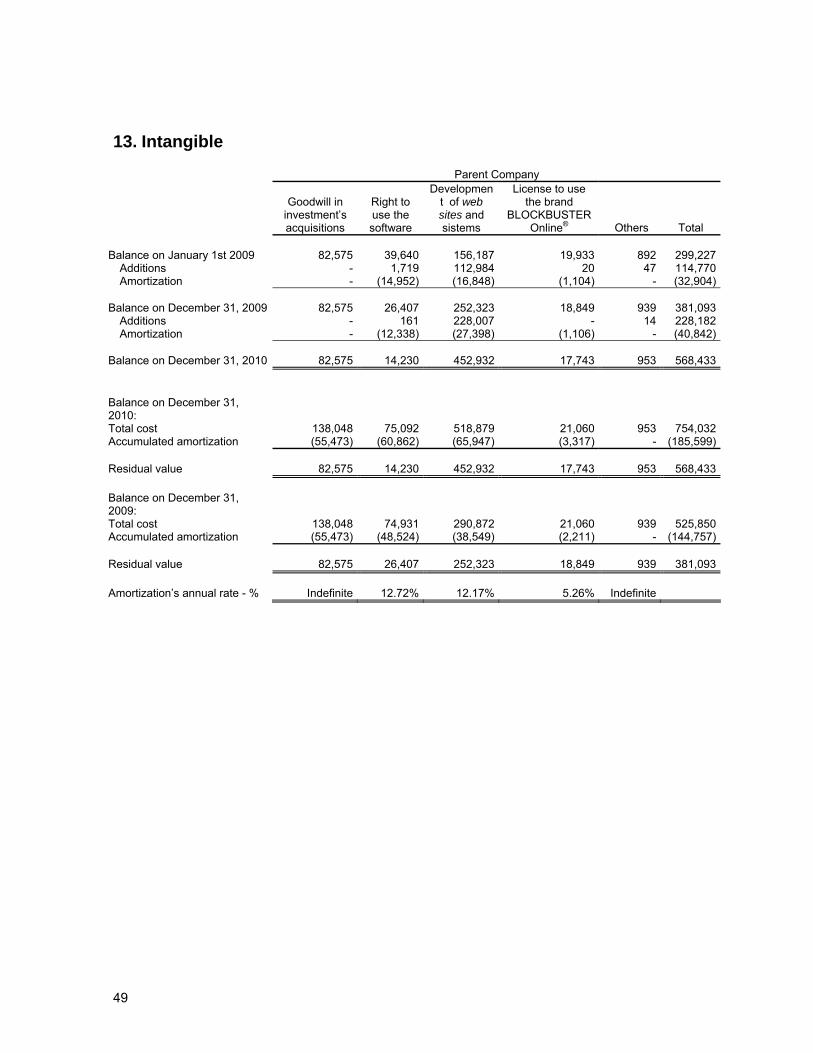
49
13. Intangible
Parent Company
Goodwill in investment’s acquisitions
Right to use the software
Development of web sites and sistems
License to use the brand
BLOCKBUSTER Online® Others Total
Balance on January 1st 2009 82,575 39,640 156,187 19,933 892 299,227
Additions - 1,719 112,984 20 47 114,770Amortization - (14,952) (16,848) (1,104) - (32,904)
Balance on December 31, 2009 82,575 26,407 252,323 18,849 939 381,093Additions - 161 228,007 - 14 228,182Amortization - (12,338) (27,398) (1,106) - (40,842)
Balance on December 31, 2010 82,575 14,230 452,932 17,743 953 568,433
Balance on December 31, 2010: Total cost 138,048 75,092 518,879 21,060 953 754,032Accumulated amortization (55,473) (60,862) (65,947) (3,317) - (185,599) Residual value 82,575 14,230 452,932 17,743 953 568,433 Balance on December 31, 2009: Total cost 138,048 74,931 290,872 21,060 939 525,850Accumulated amortization (55,473) (48,524) (38,549) (2,211) - (144,757) Residual value 82,575 26,407 252,323 18,849 939 381,093
Amortization’s annual rate - % Indefinite 12.72% 12.17% 5.26% Indefinite
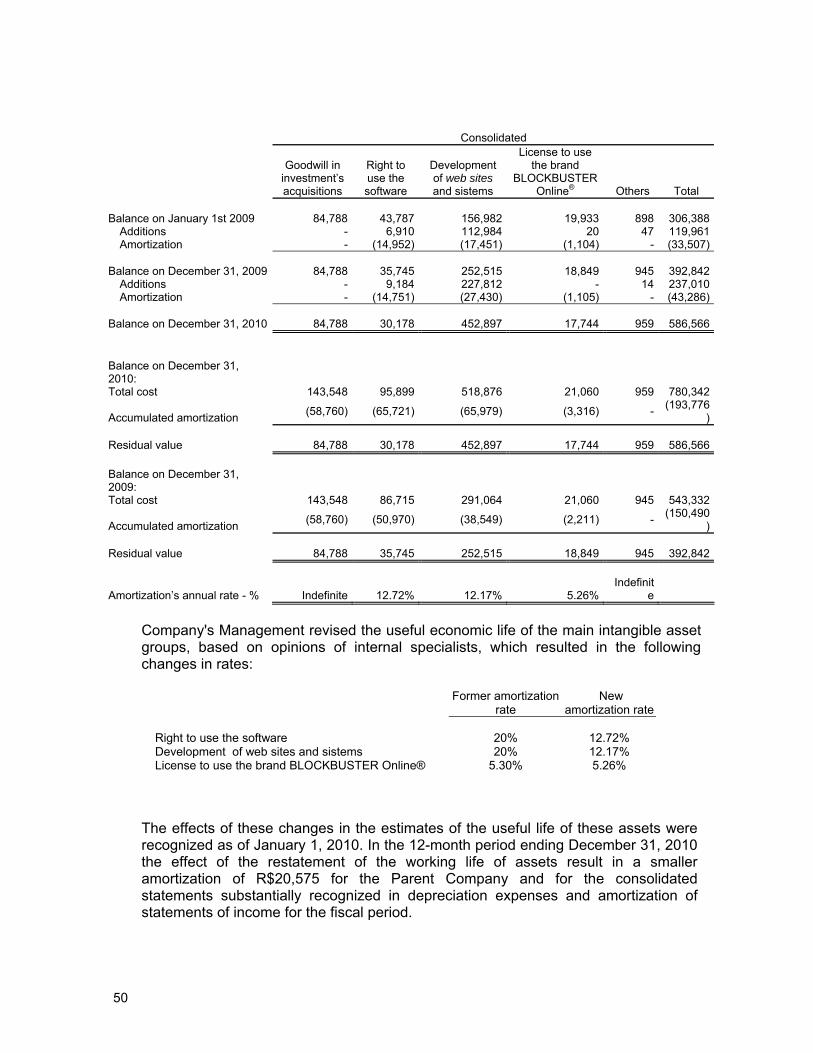
50
Consolidated
Goodwill in investment’s acquisitions
Right to use the software
Development of web sites and sistems
License to use the brand
BLOCKBUSTER Online® Others Total
Balance on January 1st 2009 84,788 43,787 156,982 19,933 898 306,388
Additions - 6,910 112,984 20 47 119,961Amortization - (14,952) (17,451) (1,104) - (33,507)
Balance on December 31, 2009 84,788 35,745 252,515 18,849 945 392,842Additions - 9,184 227,812 - 14 237,010Amortization - (14,751) (27,430) (1,105) - (43,286)
Balance on December 31, 2010 84,788 30,178 452,897 17,744 959 586,566
Balance on December 31, 2010: Total cost 143,548 95,899 518,876 21,060 959 780,342
Accumulated amortization (58,760) (65,721) (65,979) (3,316) - (193,776)
Residual value 84,788 30,178 452,897 17,744 959 586,566 Balance on December 31, 2009: Total cost 143,548 86,715 291,064 21,060 945 543,332
Accumulated amortization (58,760) (50,970) (38,549) (2,211) - (150,490)
Residual value 84,788 35,745 252,515 18,849 945 392,842
Amortization’s annual rate - % Indefinite 12.72% 12.17% 5.26% Indefinit
e
Company's Management revised the useful economic life of the main intangible asset groups, based on opinions of internal specialists, which resulted in the following changes in rates:
Former amortization
rate New
amortization rate Right to use the software 20% 12.72% Development of web sites and sistems 20% 12.17% License to use the brand BLOCKBUSTER Online® 5.30% 5.26%
The effects of these changes in the estimates of the useful life of these assets were recognized as of January 1, 2010. In the 12-month period ending December 31, 2010 the effect of the restatement of the working life of assets result in a smaller amortization of R$20,575 for the Parent Company and for the consolidated statements substantially recognized in depreciation expenses and amortization of statements of income for the fiscal period.

51
On December 31, 2010 and 2009, goodwill on acquisitions in investment was represented as follows:
Parent Company Consolidated 12/31/2010 12/31/2009 1/1/2009 12/31/2010 12/31/2009 1/1/2009
Accumulated Accumulated Cost amortization Net Net Net Cost amortization Net Net Net
Goodwill in investment’s acquisitions TV Sky Shop 135,305 (53,866) 81,439 81,439 81,439 135,305 (53,866) 81,439 81,439 81,439Ingresso.com 2,743 (1,607) 1,136 1,136 1,136 6,164 (3,613) 2,551 2,551 2,5518 MParticipações 2,079 (1,281) 798 798 798 138,048 (55,473) 82,575 82,575 82,575 143,548 (58,760) 84,788 84,788 84,788
a) Goodwill on acquisition of investments
The goodwill referring to the investment in TV Sky Shop S.A. was constituted as of the acquisition from Shoptime S.A. (Shoptime) and TV Sky Shop S.A. (TV Sky) by Americanas.com. On August 31, 2005, Americanas.com acquired the equivalent of 98.85% of the capital of Shoptime, which held 56% of the capital of TV Skyshop, and 44% of the capital of TV Sky. During the first quarter of 2006 Americanas.com acquired the remaining 1.15% of Shoptime, and now holds 100% of this company. On August 1, 2006, Shoptime was incorporated by its holding company TV Sky, and thus the goodwill registered with Americanas.com with reference to an investment in Shoptime was added to the goodwill with reference to the investment in TV Sky, for a total of R$135,305. With the merger of Americanas.com and Submarino S.A on December 13, 2006, B2W was incorporated, with all the rights and obligations of Americanas.com and, consequently, the portion of the goodwill related to TV Sky. The balances of the goodwill related to the acquisitions of other shareholder interests are supported by Technical Appraisals based on the future profitability of the companies and were amortized through December 31, 2008, using the period of 5-10 years, according to the proportion of future income expected from these investments. Beginning on January 1, 2009, the amortization of these premiums is subject only to the evaluation of impairment as anticipated in CPC 01, (IAS 36) with their respective amortizations no longer being applicable The Company evaluates its impairment annually, and the last evaluation made for year-end December 31, 2010 accounting, the goodwill shown in the acquisitions for investments and mergers based on expectations of future earnings for a period of 10 years, using a nominal rate of 10% per year as the rate of growth (equivalent to real growth expected) and a single discount rate of 12% (equivalent to the Company's cost of capital) to discount the cash flows of estimated future earnings. The recovery test for assets performed did not show the need to recognize losses.
b) Licenses – Blockbuster Trademark (online)
This represents, essentially, the license to use the Blockbuster trademark online,
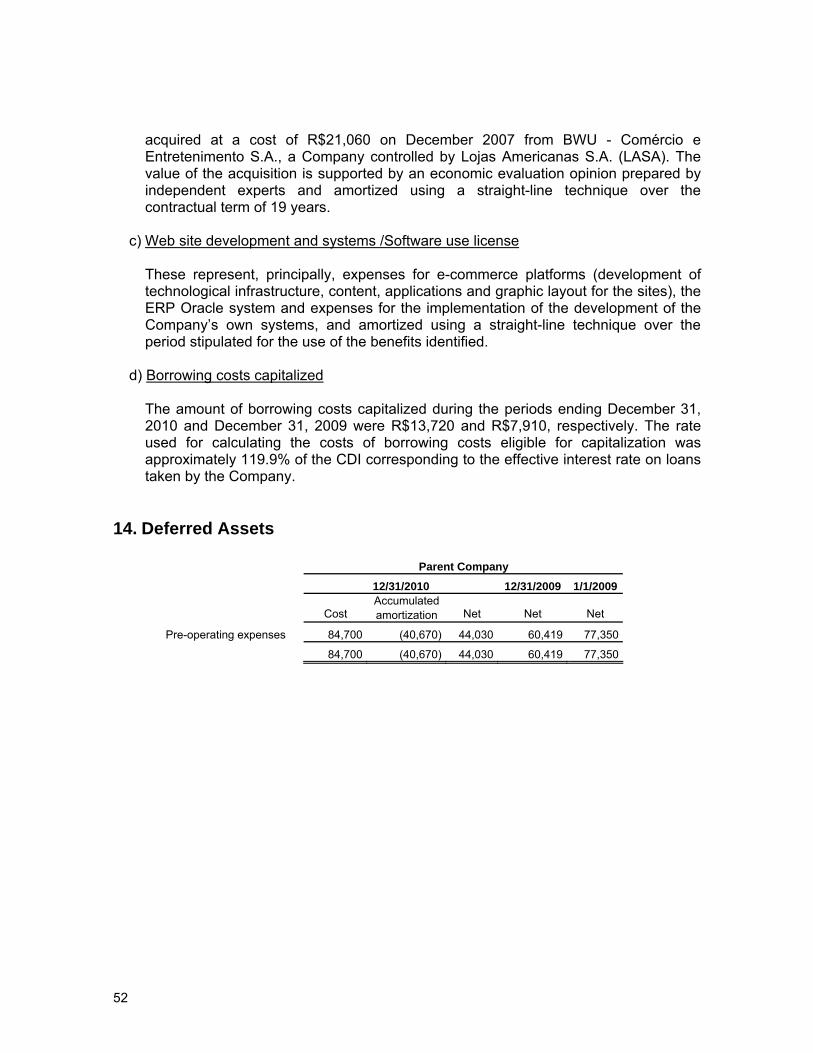
52
acquired at a cost of R$21,060 on December 2007 from BWU - Comércio e Entretenimento S.A., a Company controlled by Lojas Americanas S.A. (LASA). The value of the acquisition is supported by an economic evaluation opinion prepared by independent experts and amortized using a straight-line technique over the contractual term of 19 years.
c) Web site development and systems /Software use license
These represent, principally, expenses for e-commerce platforms (development of technological infrastructure, content, applications and graphic layout for the sites), the ERP Oracle system and expenses for the implementation of the development of the Company’s own systems, and amortized using a straight-line technique over the period stipulated for the use of the benefits identified.
d) Borrowing costs capitalized
The amount of borrowing costs capitalized during the periods ending December 31, 2010 and December 31, 2009 were R$13,720 and R$7,910, respectively. The rate used for calculating the costs of borrowing costs eligible for capitalization was approximately 119.9% of the CDI corresponding to the effective interest rate on loans taken by the Company.
14. Deferred Assets
Parent Company 12/31/2010 12/31/2009 1/1/2009
Accumulated Cost amortization Net Net Net
Pre-operating expenses 84,700 (40,670) 44,030 60,419 77,350 84,700 (40,670) 44,030 60,419 77,350

53
15. Loans and financings
Final Parent Company Consolidated Object Annual Charges Maturity 12/31/2010 12/31/2009 1/1/2009 12/31/2010 12/31/2009 1/1/2009
In national currency
Working capital
115% CDI (in 12/31/2010 and 12/31/2009)
11/18/2016 439,369 319,395 119,884 471,534 394,128 239,183
BNDES (a)
TJLP + 4.75% per year (in 12/31/2010 and 12/31/2009)
8/15/2015 354,656 172,059 4,250 361,128 172,059 4,250
794,025 491,454 124,134 832,662 566,187 243,433In foreign currency (c)
Working capital (b)
US$ + 4.0 to 7.2% (in 12/31/2010) and US$ + 4.0 a 7.2% and JPY + 0.8% to 2.44% per year (in 12/31/2009)
9/30/2013 456,777 403,070 916,387 567,048 473,248 1,011,123
Swap operations (b)
105.8% to 147.9% CDI (in 12/31/2010 and 12/31/2009)
9/30/2013 (18,429) (1,852) (175,436) (12,485) (1,325) (172,904)
1,232,373 892,672 865,085 1,387,225 1,038,1101,081,65
2Non-current share (1,032,444) (710,181) (272,774) (1,035,337) (710,181) (272,774)Current share 199,929 182,491 592,311 351,888 327,929 808,878
(a) BNDES financing related to the FINEM program (investments in information technology, implementing a distribution center, acquisition of machinery and equipment and investments in social projects), PEC (Working Capital), BNDES Automatic and “Connected Citizens – Computers for Everyone” programs. (b) Foreign-currency operations are protected against changes in exchange rates by the use of financial instruments known as swaps (see Note 25). Management reports these transactions using the hedge accounting method. (c) Funding consistent with Resolution 2,770 of the Central Bank of Brazil (BACEN).
Loans and long-term financings by maturity:
Parent Company Consolidated 12/31/2010 12/31/2009 01/01/2009 12/31/2010 12/31/2009 01/01/2009
2010 - - 178,711 - - 178,711 2011 - 180,438 37,341 - 180,438 37,341 2012 425,278 275,297 37,634 428,170 275,297 37,634 2013 271,029 221,439 19,088 271,029 221,439 19,088 2014 107,699 19,804 - 107,699 19,804 - 2015 198,438 13,203 - 198,439 13,203 - 2016 30,000 - - 30,000 - -
1,032,444 710,181 272,774 1,035,337 710,181 272,774
Guarantees
Loans and financing are secured by letters of guarantee and promissory notes.
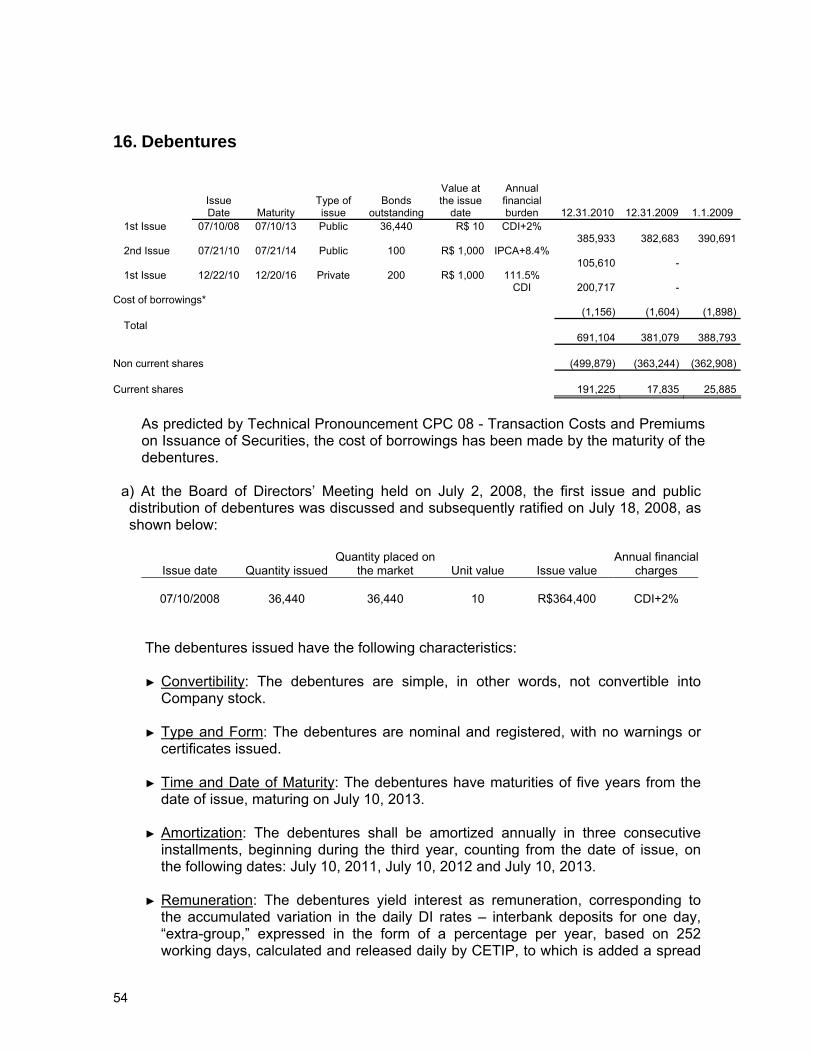
54
16. Debentures
Issue Date Maturity
Type of issue
Bonds outstanding
Value at the issue
date
Annual financial burden 12.31.2010 12.31.2009 1.1.2009
1st Issue 07/10/08 07/10/13 Public 36,440 R$ 10 CDI+2% 385,933
382,683
390,691
2nd Issue 07/21/10 07/21/14 Public 100 R$ 1,000 IPCA+8.4% 105,610 -
1st Issue 12/22/10 12/20/16 Private 200 R$ 1,000 111.5% CDI
200,717 -
Cost of borrowings*
(1,156)
(1,604)
(1,898)
Total
691,104
381,079
388,793
Non current shares
(499,879)
(363,244)
(362,908)
Current shares
191,225
17,835
25,885
As predicted by Technical Pronouncement CPC 08 - Transaction Costs and Premiums on Issuance of Securities, the cost of borrowings has been made by the maturity of the debentures.
a) At the Board of Directors’ Meeting held on July 2, 2008, the first issue and public distribution of debentures was discussed and subsequently ratified on July 18, 2008, as shown below:
Issue date Quantity issued Quantity placed on
the market Unit value Issue value Annual financial
charges
07/10/2008 36,440 36,440 10 R$364,400 CDI+2%
The debentures issued have the following characteristics: ► Convertibility: The debentures are simple, in other words, not convertible into
Company stock. ► Type and Form: The debentures are nominal and registered, with no warnings or
certificates issued. ► Time and Date of Maturity: The debentures have maturities of five years from the
date of issue, maturing on July 10, 2013. ► Amortization: The debentures shall be amortized annually in three consecutive
installments, beginning during the third year, counting from the date of issue, on the following dates: July 10, 2011, July 10, 2012 and July 10, 2013.
► Remuneration: The debentures yield interest as remuneration, corresponding to
the accumulated variation in the daily DI rates – interbank deposits for one day, “extra-group,” expressed in the form of a percentage per year, based on 252 working days, calculated and released daily by CETIP, to which is added a spread

55
of 2% per year, tax related exponentially and cumulatively pro rata temporis for consecutive working days, on the nominal unit value of R$10.
► Frequency of payment of remuneration: The amounts related to remuneration are
paid semiannually, on the 10th day of the months of January and July of each year, with the first payment being due on January 10, 2009.
► Distribution and placement: The debentures were distributed publicly, with firm
subscription guarantees through the intermediation of a financial institution belonging to the stocks and securities distribution system.
► Financial indexes: The financial indices calculated based on the quarterly
consolidated financial statements of the Company, beginning in the third quarter of 2008, will be less than or equal to (i) Consolidated Net Debt/EBITDA Adjusted less than or equal to 2.90x; and (ii) EBITDA Adjusted/Net Consolidated Financial Income and greater than or equal to 1.5x.
In the measurement of these indices, it is understood that (i) “Consolidated Net Debt” is the sum of all consolidated financial debts of the Company with individuals or corporations, including loans and financing with third parties, fixed income securities, convertible or not into shares, on the local and/or international capital markets, as well as the differential to pay from derivatives operations less the sum of the liquid assets (cash and securities and time deposits) and the differential to receive from operations with derivatives; (ii) “Adjusted EBITDA,” the sum (a) of consolidated operating profits of the Company before taxes, fees, contributions and participations; (b) depreciation and amortization occurred during the same period; (c) financial expenditures deducted from financial income from the same period; and (d) equity equivalents; all being verified for a period of 12 months and, without considering the occasional effects of the calculation of adjustments to present value – AVP (article 184 of Corporate Law, as modified by Law 10,303 of December 31, 2001, and by Law 11,638 of December 28, 2007); and, (iii) “Consolidated Net Financial Income,” financial income less financial expenses of the Company.
On December 31, 2010, and January 1, 2009, the Company had met all of the restrictive clauses (financial indexes) established upon the public registration of the debentures.
► Limits and financial indexes: In the a case of failure to comply with contractual
clauses, the Fiduciary Agent will call for a General Meeting of Debenture Holders to discuss the declaration of the early maturity of the debentures. After the realization of the General Meeting the Fiduciary Agent shall declare all of the obligations from the debentures as having matured, unless debenture holders representing at least 75% of the debentures in circulation opt not to declare early maturity.
► Guarantees: The debentures are of the floating guarantee type with a preferred
position with regard to the assets of the Company.
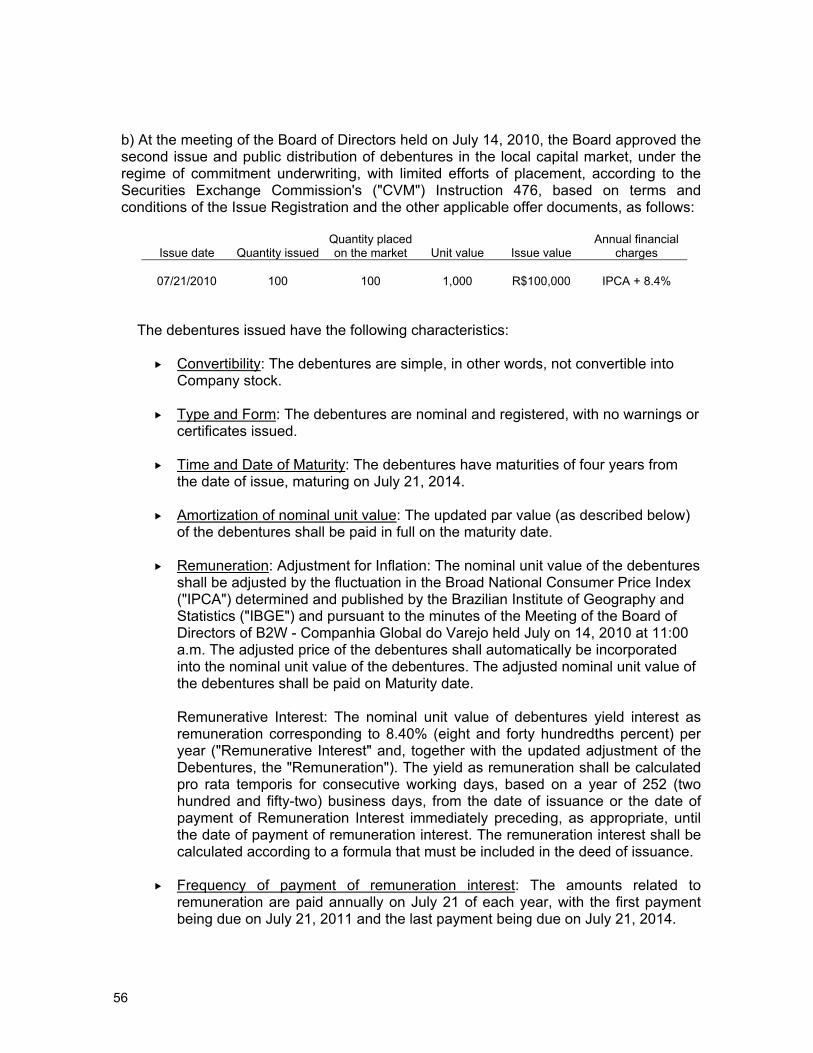
56
b) At the meeting of the Board of Directors held on July 14, 2010, the Board approved the second issue and public distribution of debentures in the local capital market, under the regime of commitment underwriting, with limited efforts of placement, according to the Securities Exchange Commission's ("CVM") Instruction 476, based on terms and conditions of the Issue Registration and the other applicable offer documents, as follows:
Issue date Quantity issued Quantity placed on the market Unit value Issue value
Annual financial charges
07/21/2010 100 100 1,000 R$100,000 IPCA + 8.4%
The debentures issued have the following characteristics:
Convertibility: The debentures are simple, in other words, not convertible into Company stock.
Type and Form: The debentures are nominal and registered, with no warnings or
certificates issued.
Time and Date of Maturity: The debentures have maturities of four years from the date of issue, maturing on July 21, 2014.
Amortization of nominal unit value: The updated par value (as described below)
of the debentures shall be paid in full on the maturity date.
Remuneration: Adjustment for Inflation: The nominal unit value of the debentures shall be adjusted by the fluctuation in the Broad National Consumer Price Index ("IPCA") determined and published by the Brazilian Institute of Geography and Statistics ("IBGE") and pursuant to the minutes of the Meeting of the Board of Directors of B2W - Companhia Global do Varejo held July on 14, 2010 at 11:00 a.m. The adjusted price of the debentures shall automatically be incorporated into the nominal unit value of the debentures. The adjusted nominal unit value of the debentures shall be paid on Maturity date.
Remunerative Interest: The nominal unit value of debentures yield interest as remuneration corresponding to 8.40% (eight and forty hundredths percent) per year ("Remunerative Interest" and, together with the updated adjustment of the Debentures, the "Remuneration"). The yield as remuneration shall be calculated pro rata temporis for consecutive working days, based on a year of 252 (two hundred and fifty-two) business days, from the date of issuance or the date of payment of Remuneration Interest immediately preceding, as appropriate, until the date of payment of remuneration interest. The remuneration interest shall be calculated according to a formula that must be included in the deed of issuance.
Frequency of payment of remuneration interest: The amounts related to
remuneration are paid annually on July 21 of each year, with the first payment being due on July 21, 2011 and the last payment being due on July 21, 2014.

57
Distribution and placement: The debentures will be subject to public distribution, with limited efforts of placement, with subscription guarantees through the intermediation of financial institutions belonging to the stocks and securities distribution system, with no early reservations nor minimum or maximum lots.
Financial indexes: The financial indixes calculated based on the quarterly
consolidated financial statements of the Company, beginning in the third quarter of 2010, must be: Consolidated Net Debt/EBITDA Adjusted less than or equal to 2.90x, considering the following definitions:
"Consolidated Net Debt" means the sum of all of the Issuer's consolidated financial debts with individuals and/or legal entities, including third party loans and financing, the issue of fixed income securities, convertible into stock or not, in the local and/or international capital markets, as well as differences payable for derivative transactions less the sum of available cash (cash and financial investments) and the differences receivable for derivative transactions. "Adapted EBITDA" means the sum of: (a) the Issuer's consolidated operating income before taxes, levies, contributions and participations; (b) the Issuer's consolidated depreciation and amortization occurred in the same period; (c) any other consolidated revenues (expenses) occurred during the same period, (d) the Issuer's consolidated financial expenses net of consolidated financial income statements for the same period; and (e) the equity restatement; the result of the sum of items (a), (b) (c) (d) and (e) of this paragraph shall be obtained for the last 12 (twelve) months calculated from the date of the Issuer's most recent quarterly balance sheet. For purposes of this definition and the subsequent obtaining of the Financial Indices, the possible effects of calculating the present value adjustment - AVP (Article 184 of the Corporations Act) should be ignored. For purposes of the foregoing, each Debenture holder by checking Quarterly Reports, the Financial Index should be calculated based on current accounting rules at the time of preparation of financial statements of the Issuer for the fiscal year ended on December 31, 2009 (the "Rules Existing in 2009"). Thus, the Issuer now undertakes, throughout the duration of the Debentures, to present to the Debenture holder all financial information necessary for these to calculate the index based on Existing Financial Standards in 2009, accounting information that will be derived from the financial statements of the Issuer which, in turn, will be audited by Company's independent auditors at the time. The Issuer will assist the Debenture holder in the understanding of the financial information provided to him so that it might calculate the Financial Index.
Limits and financial indexes: In the case of failure to comply with contractual
clauses, the Fiduciary Agent will call for a General Meeting of Debenture Holders to discuss the declaration of the early maturity of the debentures. After the realization of the General Meeting the Fiduciary Agent shall declare all of the obligations from the debentures as having matured, unless debenture holders representing at least 70% of the debentures in circulation opt not to declare early maturity.

58
On December 31, 2010, the Company met all of the restrictive clauses (financial indexes) established upon the public registration of the debentures.
Guarantees: The debentures are of the floating guarantee type with a
preferred position with regard to the assets of the Company.
c) At the Board of Directors’ Meeting on December 7, 2010, the Board approved the first private issuance of debentures of the Company, or non-convertible into shares, subordinated in a single series. The issue was not subject to registration by the Securities Exchange Commission (CVM), since the debentures were a private placement, without any effort to sell to investors, complying with the following requirements:
Issue date Quantity issued Unit value Issue value
Annual financial charges
12/22/2010 200 1,000 R$200,000 111.5% CDI
The issued debêntures hás the follow caracteristics:
Subscriber: The debentures were wholly subscribed by BWU Comércio Entretenamento S.A., a wholly owned subsidiary of Lojas Americanas S.A.
Convertibility: The debentures are simple, in other words, not convertible into
Company stock.
Type and Form: The debentures are nominal and registered, with no warnings or certificates issued.
Time and Date of Maturity: The debentures have maturities of six years from
the date of issue, maturing on December 22, 2016.
Amortization of nominal unit value: The updated per value (as described below) of the debentures shall be paid in full on the maturity date.
Remuneration Interest: The debentures yield interest as remuneration
corresponding to 111.5% of the average rate of interest of the Interbank Deposit Rate DI for one-day, “Extra Group” (“DI Rate”), calculated and published by the CETIP, in the daily bulletin, published on its page on the Internet (http://cetip.com.br) as a percentage per year, based on 252 (two hundred and fifty two) business days (the “Maximum Rate”), incident on the nominal unitary value, from the date of issue or the last days of payment over generation, whichever the case, and paid at the end of each period of capitalization (“Remuneration”).
Frequency of payment of interest remuneration: The amounts related to
remuneration are paid annually on December 22 of each year, with the first

59
payment being due on December 22, 2011 and the last payment being due on the maturity date.
Financial Indexes: The financial indices calculated based on the quarterly
consolidated financial statements of the Company, beginning in the third quarter of 2010, must be: Consolidated Net Debt/EBITDA Adjusted less than or equal to 2.90x, considering the following definitions:
"Consolidated Net Debt" means the sum of all of the Issuer's consolidated financial debts with individuals and/or legal entities, including third party loans and financing, the issue of fixed income securities, convertible into stock or not, in the local and/or international capital markets, as well as differences payable for derivative transactions less the sum of available cash (cash and financial investments) and the differences receivable for derivative transactions. "Adjusted EBITDA" means the sum of: (a) the Issuer's consolidated operating income before deducting taxes, contributions and participations; (b) the Issuer's consolidated depreciation and amortization inccurred in the same period; (c) any other consolidated revenues (expenses) inccurred during the same period, (d) the Issuer's consolidated financial expenses net of consolidated financial income statements for the same period; and (e) the equity restatement; the result of the sum of items (a), (b) (c) (d) and (e) of this paragraph shall be obtained for the last 12 (twelve) months calculated from the date of the Issuer's most recent quarterly balance sheet. For purposes of this definition and the subsequent obtaining of the Financial Indices, the possible effects of calculating the present value adjustment - AVP (Article 184 of the Corporations Act) should be ignored. For purposes of the foregoing, each Debenture holder should check the Company's Quarterly Reports,and should calculate the Financial Index based on current accounting rules at the time of preparation of financial statements of the Issuer for the fiscal year ended on December 31, 2009 (the "Rules Existing in 2009"). Thus, the Issuer now agrees, throughout the duration of the Debentures, to present to the Debenture holder all financial information necessary for these to calculate the index based on Existing Financial Standards in 2009, accounting information that will be derived from the financial statements of the Issuer which, in turn, will be audited by Company's independent auditors at the time. The Issuer will assist the Debenture holder in the understanding of the financial information provided to him so that he might calculate the Financial Index. On December 31, 2010, the Company met all of the restrictive clauses (financial indexes) established upon the public registration of the simple debentures.
Distribution and placement: The debentures will be subject to public
distribution, with limited efforts of placement, through the intermediation of
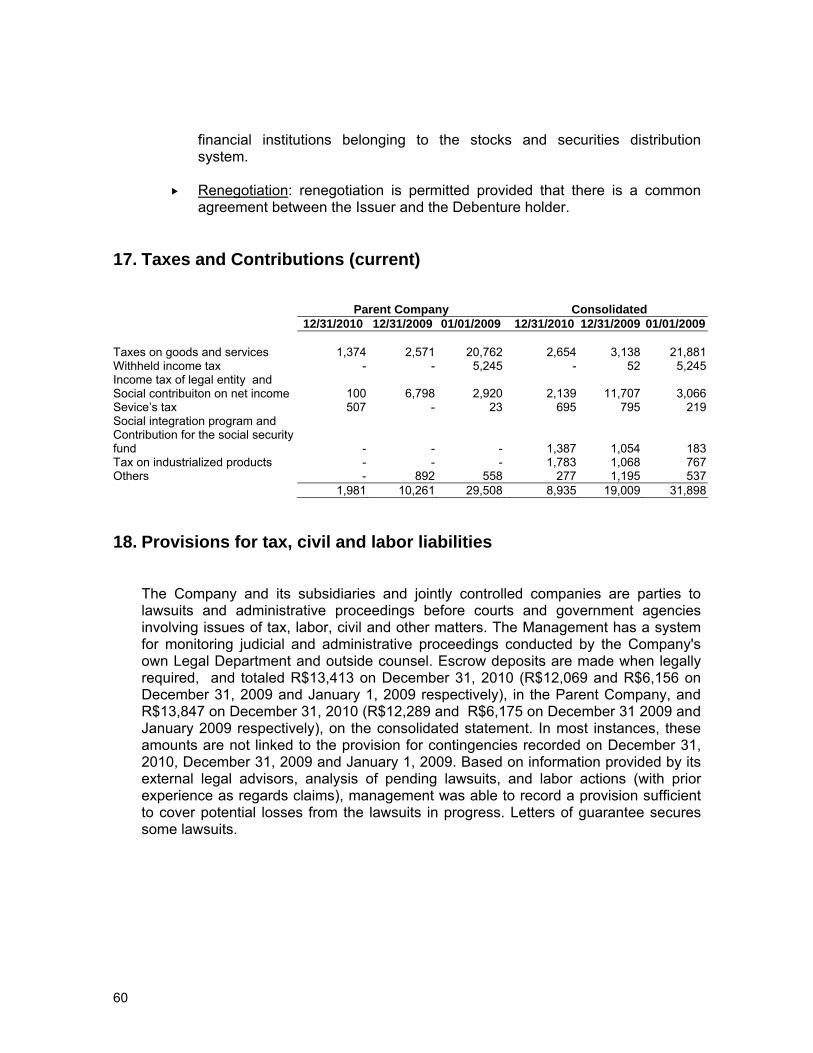
60
financial institutions belonging to the stocks and securities distribution system.
Renegotiation: renegotiation is permitted provided that there is a common
agreement between the Issuer and the Debenture holder.
17. Taxes and Contributions (current)
Parent Company Consolidated 12/31/2010 12/31/2009 01/01/2009 12/31/2010 12/31/2009 01/01/2009
Taxes on goods and services 1,374 2,571 20,762 2,654 3,138 21,881Withheld income tax - - 5,245 - 52 5,245Income tax of legal entity and Social contribuiton on net income 100 6,798 2,920 2,139 11,707 3,066Sevice’s tax 507 - 23 695 795 219Social integration program and Contribution for the social security fund - - - 1,387 1,054 183Tax on industrialized products - - - 1,783 1,068 767Others - 892 558 277 1,195 537
1,981 10,261 29,508 8,935 19,009 31,898
18. Provisions for tax, civil and labor liabilities The Company and its subsidiaries and jointly controlled companies are parties to lawsuits and administrative proceedings before courts and government agencies involving issues of tax, labor, civil and other matters. The Management has a system for monitoring judicial and administrative proceedings conducted by the Company's own Legal Department and outside counsel. Escrow deposits are made when legally required, and totaled R$13,413 on December 31, 2010 (R$12,069 and R$6,156 on December 31, 2009 and January 1, 2009 respectively), in the Parent Company, and R$13,847 on December 31, 2010 (R$12,289 and R$6,175 on December 31 2009 and January 2009 respectively), on the consolidated statement. In most instances, these amounts are not linked to the provision for contingencies recorded on December 31, 2010, December 31, 2009 and January 1, 2009. Based on information provided by its external legal advisors, analysis of pending lawsuits, and labor actions (with prior experience as regards claims), management was able to record a provision sufficient to cover potential losses from the lawsuits in progress. Letters of guarantee secures some lawsuits.
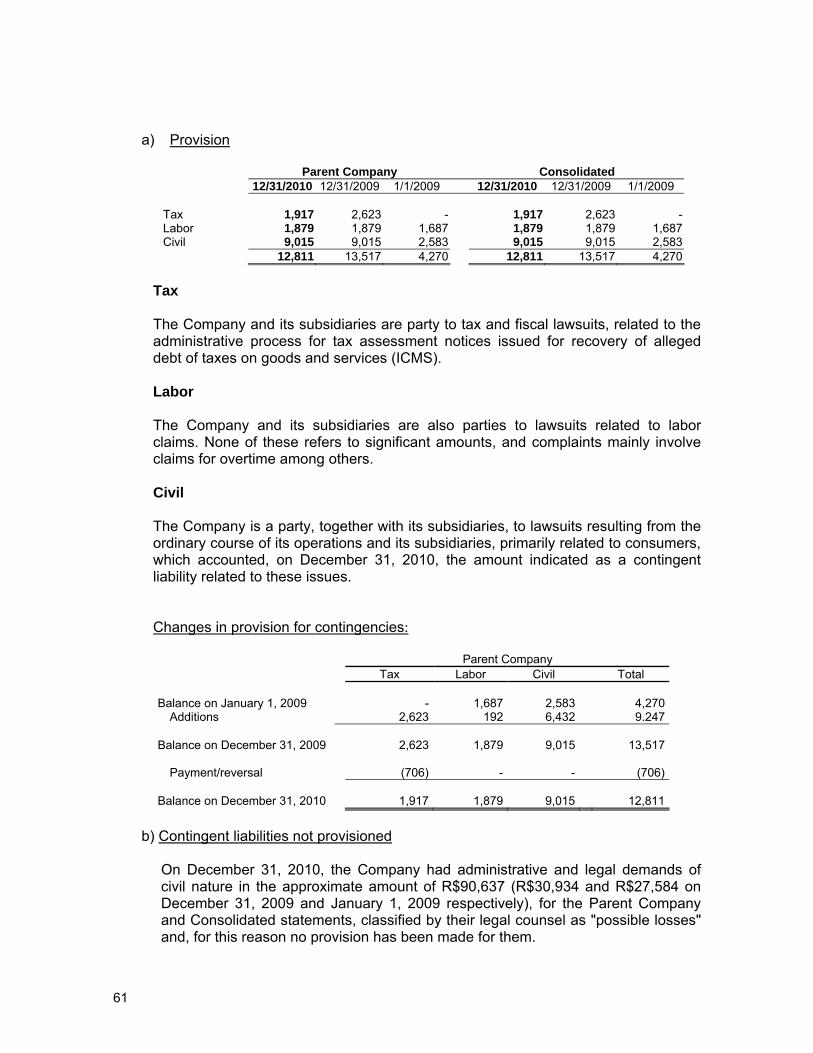
61
a) Provision
Parent Company Consolidated 12/31/2010 12/31/2009 1/1/2009 12/31/2010 12/31/2009 1/1/2009
Tax 1,917 2,623 - 1,917 2,623 -Labor 1,879 1,879 1,687 1,879 1,879 1,687Civil 9,015 9,015 2,583 9,015 9,015 2,583 12,811 13,517 4,270 12,811 13,517 4,270
Tax The Company and its subsidiaries are party to tax and fiscal lawsuits, related to the administrative process for tax assessment notices issued for recovery of alleged debt of taxes on goods and services (ICMS).
Labor The Company and its subsidiaries are also parties to lawsuits related to labor claims. None of these refers to significant amounts, and complaints mainly involve claims for overtime among others.
Civil The Company is a party, together with its subsidiaries, to lawsuits resulting from the ordinary course of its operations and its subsidiaries, primarily related to consumers, which accounted, on December 31, 2010, the amount indicated as a contingent liability related to these issues.
Changes in provision for contingencies:
Parent Company Tax Labor Civil Total
Balance on January 1, 2009 - 1,687 2,583 4,270
Additions 2,623 192 6,432 9.247 Balance on December 31, 2009 2,623 1,879 9,015 13,517
Payment/reversal (706) - - (706)
Balance on December 31, 2010 1,917 1,879 9,015 12,811
b) Contingent liabilities not provisioned
On December 31, 2010, the Company had administrative and legal demands of civil nature in the approximate amount of R$90,637 (R$30,934 and R$27,584 on December 31, 2009 and January 1, 2009 respectively), for the Parent Company and Consolidated statements, classified by their legal counsel as "possible losses" and, for this reason no provision has been made for them.

62
The main administrative/judicial demands, classified as "possible losses" the Parent Company, refer mainly to:
i) lawsuits in civil court, special civil court, the Consumer Protection Institute
(PROCON) in several states, referring to actions for claims and indemnifications, amounting to approximately R$42,650 (R$ 30,934 and R$27,584 on December 31, 2009 and January 1, 2009, respectively).
ii) lawsuits relating to tax assessment notices issued for the recovery of income tax
of legal entity and social contribuiton on net income debts due to alleged improper use of tax loss carryforwards and social contribution, since the limit of 30% for realization of compensation was not observed, in the amount of approximately R$41,100.
19. Shareholder’s Equity
a) Paid in Capital Paid in Capital may be increased by the Board of Directors, without the need for statutory reform, up to a liimit of 200,000,000 common shares. There is no preemptive right to the subscription of shares. On December 31, 2010, the capital is represented by 113,562,867 common shares, nominal and having no par value (113,535,372 shares on December 31, 2009 and on January 1, 2009). The composition of the shareholders in the Company's capital on December 31, 2010 and 2009, and on January 1, 2009 is as follows:
12/31/2010 12/31/2009 1/1/2009
Lojas Americanas S.A 62,389,539 62,389,539 62,389,539The BANK OF NEW YORK – ADR Program - 3,012,350 3,234,924OPENHEIMER DEVEL MARKETS FUND 9,267,100 - -Management 183,142 204,522 170,119Other shareholders 38,443,104 44,587,938 44,415,686Treasury shares 3,279,982 3,341,023 3,325,104
113,562,867 113,535,372 113,535,372

63
b) Changes in Capital Stock
Number of shares, without par value.
Common Nominal
On January 1st, 2009 113,535,372 On December 31st, 2009 113,535,372 Subscription 27,495 On December 31st, 2010 113,562,867
At the Board of Directors’ Meeting held on July 30, 2010, the Board approved a capital increase of the Company for R$925, with the consequent emission of 27,495 common shares with respect to the exercise of options granted under the Stock Option Purchase Program of the Company (Note 20).
c) Treasury Shares
On May 8, 2008, pursuant to CVM Instructions 10/80 and 268/97, the Board of Directors of the Company approved the repurchase of shares programs of its own issue, using equity reserves, in order to retain them in treasury or cancel them, with the ability to further alienation, during the subsequent 365 days, up to the limit of 4,971,895 common shares, which corresponds to 10% of the outstanding shares.
Treasury share changes:
Quantity of
shares
Balance R$
thousand Weighted avarage cost of acquisition
On January 1st, 2009 3,325,104 221,883 66.73 Acquisition of shares 15,919 818 52.04 On December 31st, 2009 3,341,023 222,701 66.66 Sale of shares (61,041) (4,070) 66.66 On December 31st, 2010 3,279,982 218,631 66.66 Market value on December 31, 2010 per share 31.50
The minimum and maximum share prices were of R$46.39 and R$74.20, respectively.
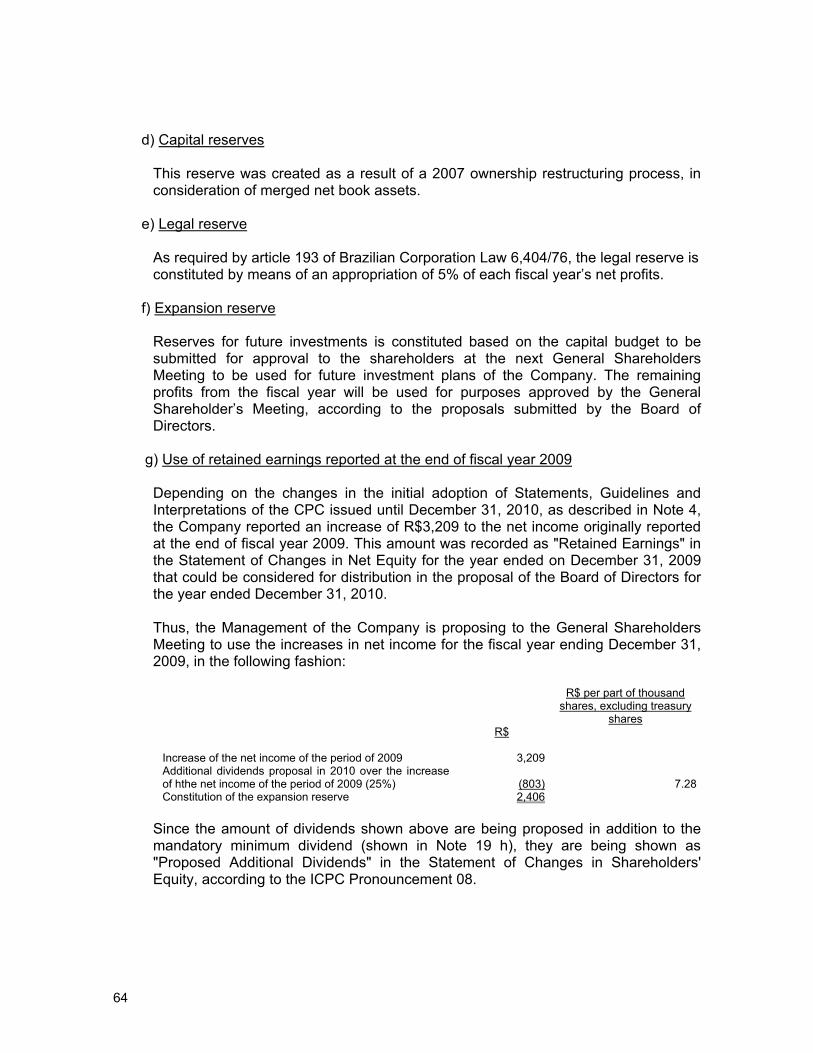
64
d) Capital reserves
This reserve was created as a result of a 2007 ownership restructuring process, in consideration of merged net book assets.
e) Legal reserve
As required by article 193 of Brazilian Corporation Law 6,404/76, the legal reserve is constituted by means of an appropriation of 5% of each fiscal year’s net profits.
f) Expansion reserve
Reserves for future investments is constituted based on the capital budget to be submitted for approval to the shareholders at the next General Shareholders Meeting to be used for future investment plans of the Company. The remaining profits from the fiscal year will be used for purposes approved by the General Shareholder’s Meeting, according to the proposals submitted by the Board of Directors.
g) Use of retained earnings reported at the end of fiscal year 2009
Depending on the changes in the initial adoption of Statements, Guidelines and Interpretations of the CPC issued until December 31, 2010, as described in Note 4, the Company reported an increase of R$3,209 to the net income originally reported at the end of fiscal year 2009. This amount was recorded as "Retained Earnings" in the Statement of Changes in Net Equity for the year ended on December 31, 2009 that could be considered for distribution in the proposal of the Board of Directors for the year ended December 31, 2010. Thus, the Management of the Company is proposing to the General Shareholders Meeting to use the increases in net income for the fiscal year ending December 31, 2009, in the following fashion:
R$
R$ per part of thousand shares, excluding treasury
shares
Increase of the net income of the period of 2009 3,209 Additional dividends proposal in 2010 over the increase of hthe net income of the period of 2009 (25%) (803) 7.28Constitution of the expansion reserve 2,406
Since the amount of dividends shown above are being proposed in addition to the mandatory minimum dividend (shown in Note 19 h), they are being shown as "Proposed Additional Dividends" in the Statement of Changes in Shareholders' Equity, according to the ICPC Pronouncement 08.
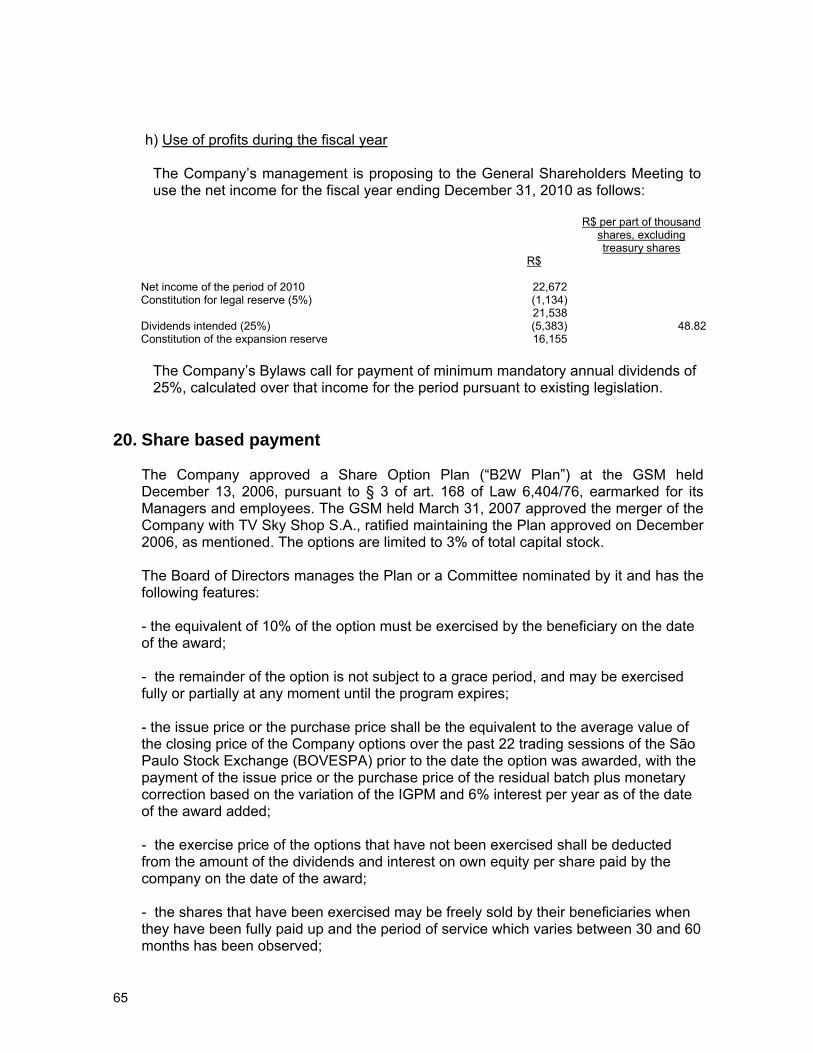
65
h) Use of profits during the fiscal year
The Company’s management is proposing to the General Shareholders Meeting to use the net income for the fiscal year ending December 31, 2010 as follows:
R$
R$ per part of thousand shares, excluding treasury shares
Net income of the period of 2010 22,672 Constitution for legal reserve (5%) (1,134) 21,538Dividends intended (25%) (5,383) 48.82Constitution of the expansion reserve 16,155
The Company’s Bylaws call for payment of minimum mandatory annual dividends of 25%, calculated over that income for the period pursuant to existing legislation.
20. Share based payment
The Company approved a Share Option Plan (“B2W Plan”) at the GSM held December 13, 2006, pursuant to § 3 of art. 168 of Law 6,404/76, earmarked for its Managers and employees. The GSM held March 31, 2007 approved the merger of the Company with TV Sky Shop S.A., ratified maintaining the Plan approved on December 2006, as mentioned. The options are limited to 3% of total capital stock. The Board of Directors manages the Plan or a Committee nominated by it and has the following features:
- the equivalent of 10% of the option must be exercised by the beneficiary on the date of the award; - the remainder of the option is not subject to a grace period, and may be exercised fully or partially at any moment until the program expires; - the issue price or the purchase price shall be the equivalent to the average value of the closing price of the Company options over the past 22 trading sessions of the São Paulo Stock Exchange (BOVESPA) prior to the date the option was awarded, with the payment of the issue price or the purchase price of the residual batch plus monetary correction based on the variation of the IGPM and 6% interest per year as of the date of the award added; - the exercise price of the options that have not been exercised shall be deducted from the amount of the dividends and interest on own equity per share paid by the company on the date of the award; - the shares that have been exercised may be freely sold by their beneficiaries when they have been fully paid up and the period of service which varies between 30 and 60 months has been observed;

66
- The Company has preference for the option of repurchasing the shares once an employment relationship no longer exists with the beneficiary.
Below is a statement of the 2009 and 2007 Programs still open as at December 31, 2010 offered to the Company’s main executives:
2009 Program 2007 Program Global volume (ON) 1,189,414 1,099,868 Strike price 33.63 45.46 Strike deadline 6 years 6 years Subscription date 07/30/2010 12/10/2007 e
09/23/2008 Number of offered shares 1,006,861 906,736 Number of not exercised shares 121,500 207,216 Number of canceled share 137,500 658,392 Weighted avarage cost of shares not exercised 37.39 65.14
The fair value of the shares awarded by the B2W Plan was estimated based on the Black & Scholes options value model, based on the following assumptions:
2009 Program 2007 Program Risk free rate 10.64% 9.79% “Plan” duration in years 6 6 Expected annualized volatility 40.83% 45.3% Dividend yield 0.23% 1.44% Fair value of the option in grant date (per share) 28.85 19.43 Market value in grant date (per share) 33.63 58.37 Expected dropout date* 50.00% 50.00% (*) The dropout rate corresponds to the percentage of the share options awarded by the Company, which it expects will not be exercised, because of the non-compliance on the part of the participants in the conditions established by the B2W Plan. This rate was estimated by the Company using historical bases and the monitoring of the compliance of the performance conditions of the participants of the B2W Plan.
As of the date of the approval of the B2W Plan until December 31, 2010, the following were exercised:
Period of option exercise Quantity of shares
Total amount in Reais
Weighted avarage cost
Weighted average market valeu in the date
of exercise of shares 2007 69,952 3,180 45.46 78.10
2008 141,403 6,799 48.08 56.97
2010 27,495 925 33.63 28.74
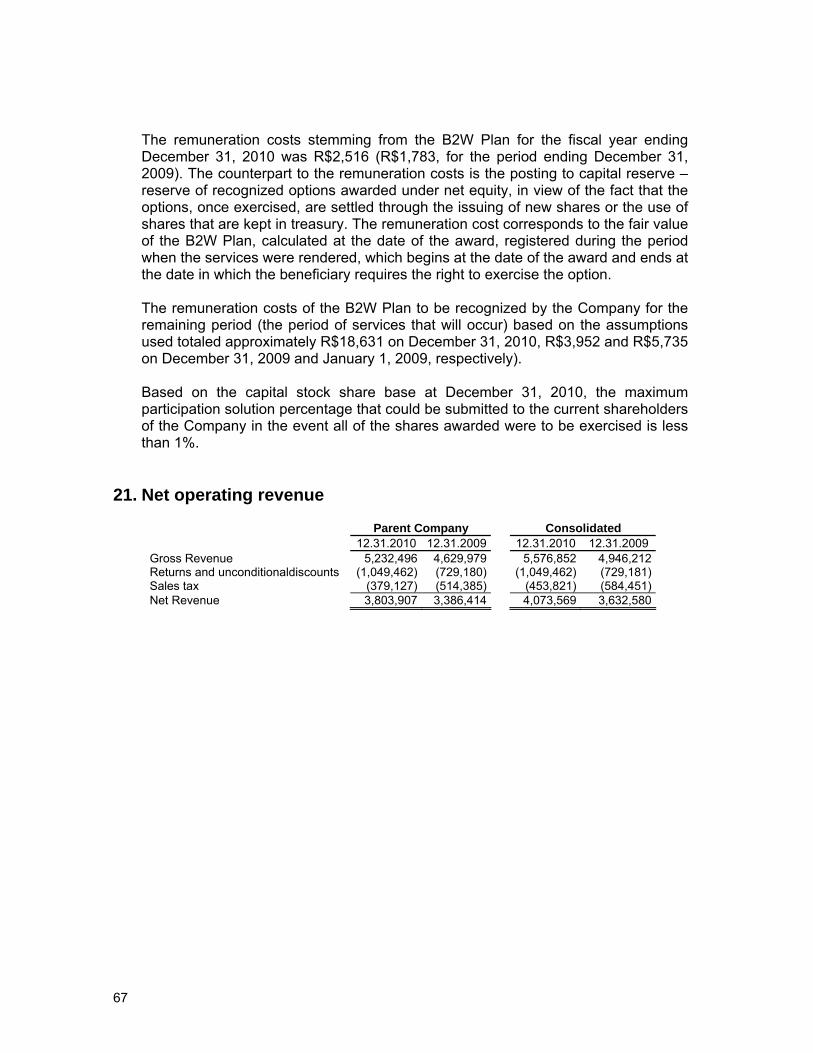
67
The remuneration costs stemming from the B2W Plan for the fiscal year ending December 31, 2010 was R$2,516 (R$1,783, for the period ending December 31, 2009). The counterpart to the remuneration costs is the posting to capital reserve – reserve of recognized options awarded under net equity, in view of the fact that the options, once exercised, are settled through the issuing of new shares or the use of shares that are kept in treasury. The remuneration cost corresponds to the fair value of the B2W Plan, calculated at the date of the award, registered during the period when the services were rendered, which begins at the date of the award and ends at the date in which the beneficiary requires the right to exercise the option. The remuneration costs of the B2W Plan to be recognized by the Company for the remaining period (the period of services that will occur) based on the assumptions used totaled approximately R$18,631 on December 31, 2010, R$3,952 and R$5,735 on December 31, 2009 and January 1, 2009, respectively). Based on the capital stock share base at December 31, 2010, the maximum participation solution percentage that could be submitted to the current shareholders of the Company in the event all of the shares awarded were to be exercised is less than 1%.
21. Net operating revenue
Parent Company Consolidated 12.31.2010 12.31.2009 12.31.2010 12.31.2009 Gross Revenue 5,232,496 4,629,979 5,576,852 4,946,212 Returns and unconditionaldiscounts (1,049,462) (729,180) (1,049,462) (729,181) Sales tax (379,127) (514,385) (453,821) (584,451) Net Revenue 3,803,907 3,386,414 4,073,569 3,632,580
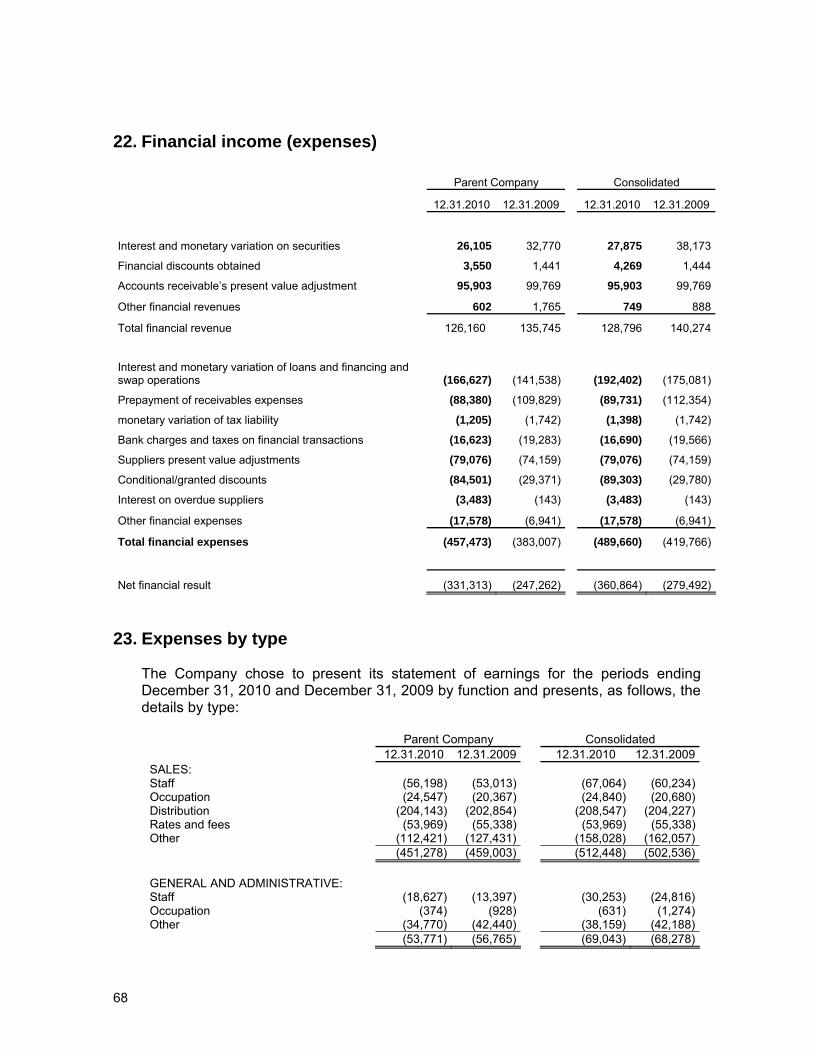
68
22. Financial income (expenses)
Parent Company Consolidated
12.31.2010 12.31.2009 12.31.2010 12.31.2009
Interest and monetary variation on securities 26,105 32,770 27,875 38,173
Financial discounts obtained 3,550 1,441 4,269 1,444
Accounts receivable’s present value adjustment 95,903 99,769 95,903 99,769
Other financial revenues 602 1,765 749 888
Total financial revenue 126,160 135,745 128,796 140,274 Interest and monetary variation of loans and financing and swap operations (166,627) (141,538) (192,402) (175,081)
Prepayment of receivables expenses (88,380) (109,829) (89,731) (112,354)
monetary variation of tax liability (1,205) (1,742) (1,398) (1,742)
Bank charges and taxes on financial transactions (16,623) (19,283) (16,690) (19,566)
Suppliers present value adjustments (79,076) (74,159) (79,076) (74,159)
Conditional/granted discounts (84,501) (29,371) (89,303) (29,780)
Interest on overdue suppliers (3,483) (143) (3,483) (143)
Other financial expenses (17,578) (6,941) (17,578) (6,941)
Total financial expenses (457,473) (383,007) (489,660) (419,766)
Net financial result (331,313) (247,262) (360,864) (279,492)
23. Expenses by type The Company chose to present its statement of earnings for the periods ending December 31, 2010 and December 31, 2009 by function and presents, as follows, the details by type:
Parent Company Consolidated 12.31.2010 12.31.2009 12.31.2010 12.31.2009SALES: Staff (56,198) (53,013) (67,064) (60,234)Occupation (24,547) (20,367) (24,840) (20,680)Distribution (204,143) (202,854) (208,547) (204,227)Rates and fees (53,969) (55,338) (53,969) (55,338)Other (112,421) (127,431) (158,028) (162,057) (451,278) (459,003) (512,448) (502,536) GENERAL AND ADMINISTRATIVE: Staff (18,627) (13,397) (30,253) (24,816)Occupation (374) (928) (631) (1,274)Other (34,770) (42,440) (38,159) (42,188) (53,771) (56,765) (69,043) (68,278)
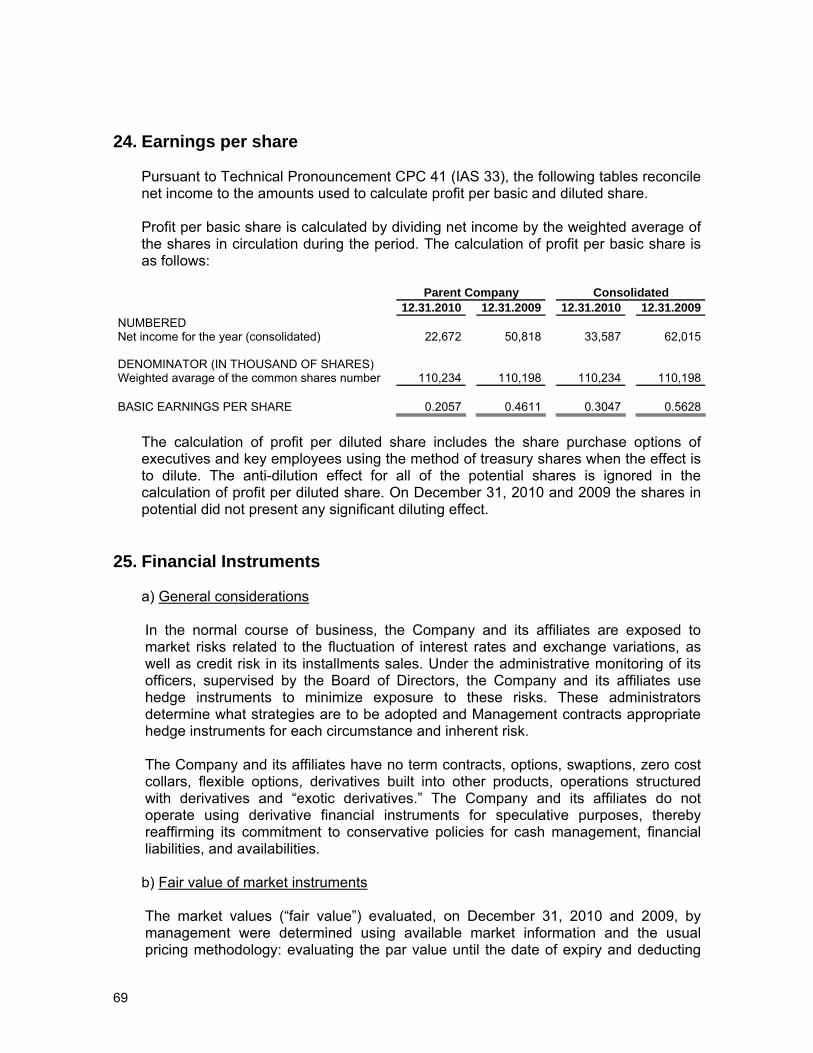
69
24. Earnings per share Pursuant to Technical Pronouncement CPC 41 (IAS 33), the following tables reconcile net income to the amounts used to calculate profit per basic and diluted share. Profit per basic share is calculated by dividing net income by the weighted average of the shares in circulation during the period. The calculation of profit per basic share is as follows:
Parent Company Consolidated 12.31.2010 12.31.2009 12.31.2010 12.31.2009NUMBERED Net income for the year (consolidated) 22,672 50,818 33,587 62,015 DENOMINATOR (IN THOUSAND OF SHARES) Weighted avarage of the common shares number 110,234 110,198 110,234 110,198 BASIC EARNINGS PER SHARE 0.2057 0.4611 0.3047 0.5628
The calculation of profit per diluted share includes the share purchase options of executives and key employees using the method of treasury shares when the effect is to dilute. The anti-dilution effect for all of the potential shares is ignored in the calculation of profit per diluted share. On December 31, 2010 and 2009 the shares in potential did not present any significant diluting effect.
25. Financial Instruments
a) General considerations
In the normal course of business, the Company and its affiliates are exposed to market risks related to the fluctuation of interest rates and exchange variations, as well as credit risk in its installments sales. Under the administrative monitoring of its officers, supervised by the Board of Directors, the Company and its affiliates use hedge instruments to minimize exposure to these risks. These administrators determine what strategies are to be adopted and Management contracts appropriate hedge instruments for each circumstance and inherent risk. The Company and its affiliates have no term contracts, options, swaptions, zero cost collars, flexible options, derivatives built into other products, operations structured with derivatives and “exotic derivatives.” The Company and its affiliates do not operate using derivative financial instruments for speculative purposes, thereby reaffirming its commitment to conservative policies for cash management, financial liabilities, and availabilities. b) Fair value of market instruments
The market values (“fair value”) evaluated, on December 31, 2010 and 2009, by management were determined using available market information and the usual pricing methodology: evaluating the par value until the date of expiry and deducting

70
the present value of future market rates, which were published in the bulletins of Brazil's Mercantile and Futures Exchange (Bolsa de Mercadorias e Futuros - BM&F). These estimates of fair value presented are not necessarily indicative of values that the Company and its affiliates might realize in the market. The use of different hypotheses or evaluation methodologies can produce divergent results as regards fair value, particularly bearing in mind the considerable element of judgment needed for the interpretation of market information. The values of the principal financial instruments that would reflect possible differences between the book value and the fair value on December 31, 2010 are as follows. On December 31st, 2010:
Parent Company Consolidated
Bookkepping base
Amortized cost Fair value Amortized
cost Fair value
ASSETS Marketable securities Fair value 776,176 776,973 789,910 790,707 LIABILITIES Debentures Amortized cost 691,104 664,941 691,104 664,941 Loans and financing: National currency Amortized cost 794,026 761,613 832,662 800,250
Forreing currency Hedge accounting
(i) 411,794 456,778 525,072 567,048 Traditional swaps Fair value 26,555 (18,429) 29,491 (12,485)
(i) “Hedge Accounting” (ledger result of debt and swaps effectuated according to their fair value)
On December 31st, 2009:
Parent Company Consolidated
Bookkepping base Amortized
cost Fair value Amortized cost Fair value
ASSETS Marketable securities Fair value 538,117 540,010 545,939 547,832 LIABILITIES Debêntures Amortized cost 381,079 369,675 381,079 369,675 Loans and financing: National currency Amortized cost 491,453 475,699 566,188 550,432
Forreing currency Hedge accounting
(i) 389,758 403,070 459,936 473,248 Traditional swaps Fair value 11,461 (1,852) 11,988 (1,325)
(i) “Hedge Accounting” (ledger result of debt and swaps effectuated according to their fair value)

71
c) Credit risk
Credit risk is minimized because approximately 78% of the Company’s and its subsidiaries’ sales were carried out through credit cards administered by third parties. The Company and its subsidiaries’ maintain a provision for doubtful accounts in an amount considered by management sufficient to cover possible losses.
d) Interest rate risk
The Company and its subsidiaries’ use resources produced by operational activities to manage its operations, as well as to guarantee investments and growth. To complement the necessity for cash growth, the Company and its subsidiaries obtain loans and financing from Brazil’s principal financial institutions, substantially indexed to the variation of the Interbank Deposit Certificate (CDI). Relevant fluctuations in the CDI (see chart of sensitivity below) raise the possibility of inherent risk. Financial investment policies indexed by the CDI partially mitigate this effect.
e) Exchange rate risk
These risks originate from foreign currency exchange rate variations on the loan portfolio. The Company and its subsidiaries’ make use of derivatives, such as traditional swaps, for the purpose of canceling exchange losses resulting from sharp devaluations of the Real (R$) against foreign currency denominated funding. On December 31, 2010, the position of these derivative financial instruments was the following:
Traditional Swaps (registered in the loans and financing account):
The counterparts to these traditional swaps are the financial institutions that provide loans in foreign currency (American dollars or yens), generally in accord with Resolution 2770 of the Central Bank of Brazil (BACEN). These CDI-referenced swaps aim to cancel exchange risk, transforming the cost of the debt (see note regarding conditions of loans and financing – Note #13) for local currency and interest rate, which varies from 113.8% to 134.0% of the CDI (CDI - EXTRAGRUPO that is equivalent to Interfinancial Market Average Funding Rate, published daily by the CETIP - OTC Clearing House). These contracts in 2010 amounted to a reference value to R$430,274 for the Parent Company (R$545,637 consolidated). In 2009, the reference value for the Parent Company was R$390,066 (R$460,684 consolidated). These operations are matched in terms of value, terms, and interest rates. The Company always seeks to liquidate such contracts, simultaneously, with the respective loans that are the subject of the hedge transactions. There are no margin call contractual clauses in this type of transaction.
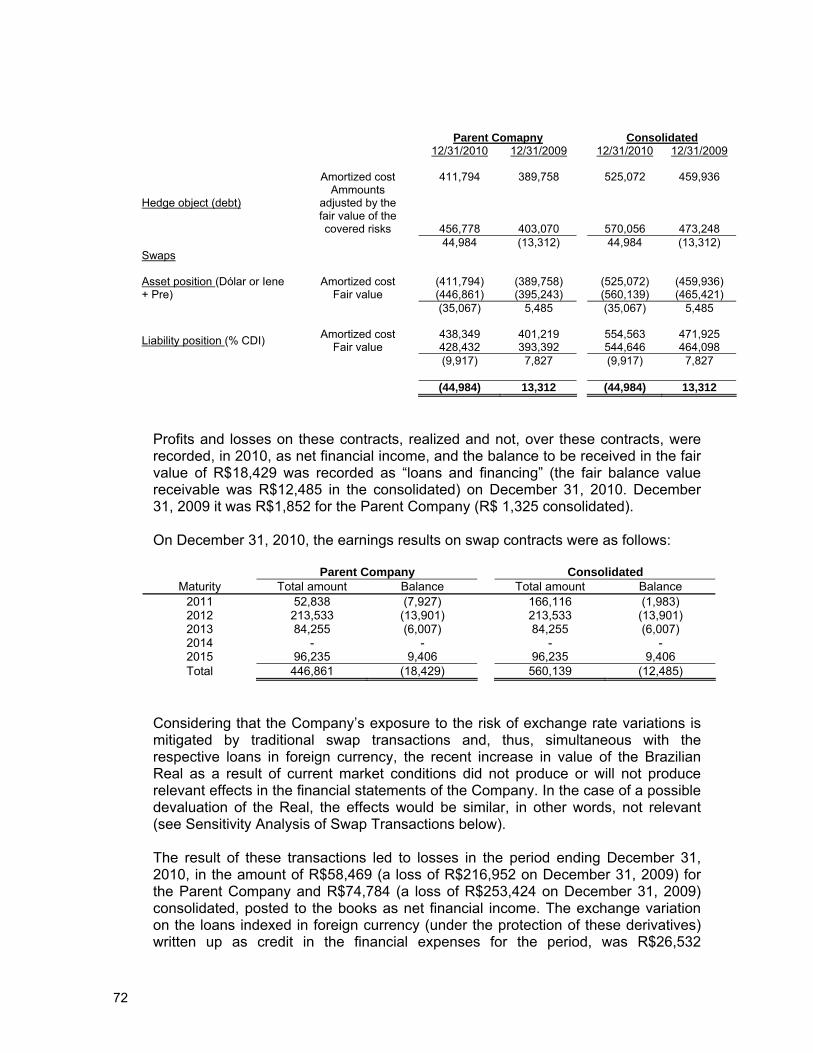
72
Parent Comapny Consolidated 12/31/2010 12/31/2009 12/31/2010 12/31/2009
Amortized cost 411,794 389,758 525,072 459,936
Hedge object (debt)
Ammounts adjusted by the fair value of the covered risks 456,778 403,070 570,056 473,248
44,984 (13,312) 44,984 (13,312) Swaps
Amortized cost (411,794) (389,758) (525,072) (459,936) Asset position (Dólar or Iene + Pre) Fair value (446,861) (395,243) (560,139) (465,421) (35,067) 5,485 (35,067) 5,485
Amortized cost 438,349 401,219 554,563 471,925 Liability position (% CDI) Fair value 428,432 393,392 544,646 464,098 (9,917) 7,827 (9,917) 7,827 (44,984) 13,312 (44,984) 13,312
Profits and losses on these contracts, realized and not, over these contracts, were recorded, in 2010, as net financial income, and the balance to be received in the fair value of R$18,429 was recorded as “loans and financing” (the fair balance value receivable was R$12,485 in the consolidated) on December 31, 2010. December 31, 2009 it was R$1,852 for the Parent Company (R$ 1,325 consolidated). On December 31, 2010, the earnings results on swap contracts were as follows:
Parent Company Consolidated
Maturity Total amount Balance Total amount Balance 2011 52,838 (7,927) 166,116 (1,983) 2012 213,533 (13,901) 213,533 (13,901) 2013 84,255 (6,007) 84,255 (6,007) 2014 - - - - 2015 96,235 9,406 96,235 9,406 Total 446,861 (18,429) 560,139 (12,485)
Considering that the Company’s exposure to the risk of exchange rate variations is mitigated by traditional swap transactions and, thus, simultaneous with the respective loans in foreign currency, the recent increase in value of the Brazilian Real as a result of current market conditions did not produce or will not produce relevant effects in the financial statements of the Company. In the case of a possible devaluation of the Real, the effects would be similar, in other words, not relevant (see Sensitivity Analysis of Swap Transactions below). The result of these transactions led to losses in the period ending December 31, 2010, in the amount of R$58,469 (a loss of R$216,952 on December 31, 2009) for the Parent Company and R$74,784 (a loss of R$253,424 on December 31, 2009) consolidated, posted to the books as net financial income. The exchange variation on the loans indexed in foreign currency (under the protection of these derivatives) written up as credit in the financial expenses for the period, was R$26,532

73
(R$169,757 written up as a credit in the financial expenses as of December 31, 2009) for the Parent Company and R$36,298, (R$196,697 written up as a credit in the financial expenses on December 31, 2009) consolidated.
f) Sensitivity analysis of swap transactions
Swap transactions recorded by the Company and its affiliates were contracted, simultaneously, to the foreign currency loan transactions, contemplating terms, rates, and equivalent values, exchanging the loans’ exchange exposure for exposure to the CDI. On December 31, the Company’s gross debt (Parent Company), in U.S. dollars, was R$456,778 and R$567,048 consolidated. According to data drawn from the Central Bank of Brazil (“Relatório Focus”) on February 11, 2011 market expectations were indicating an exchange rate for the end of calendar year 2011 (probable scenario) of 1.7000 R$/US$ and compared to R$/US$ 1.6662 on December 31, 2010. Scenarios I and II were calculated with a deterioration of 25% and 50% respectively, above probable expectations (Management’s opinion), according to figures below:
Parent Company viewpoint:
Operation Risk Probable scenario
Scenario I – Deterioration of
25%
Scenario II – Deterioration of
50% DOLAR Exchange rate in 12/31/2010 1.6662 1.6662 1.6662 Estimated Exchange rate to 12/31/2011 1.7200 2.1500 2.5800 Forreign currency loans (variation US$) 14,749 132,631 250,512 Swaps (Long position in foreign currency) (variation US$) (14,749) (132,631) (250,512)
Net Effect Null Null Null
Consolidated viewpoint:
Operation Risk Probable scenario
Scenario I – Deterioration of
25%
Scenario II – Deterioration of
50% DOLAR Exchange rate in 12/31/2010 1,6662 1,6662 1,6662Estimated Exchange rate to 12/31/2011 1,7200 2,1500 2,5800
Forreign currency loans (variation US$) 18.309 164.649 310.988 Swaps (Long position in foreign currency) (variation US$) (18.309) (164.649) (310.988)
Net Effect Null Null Null
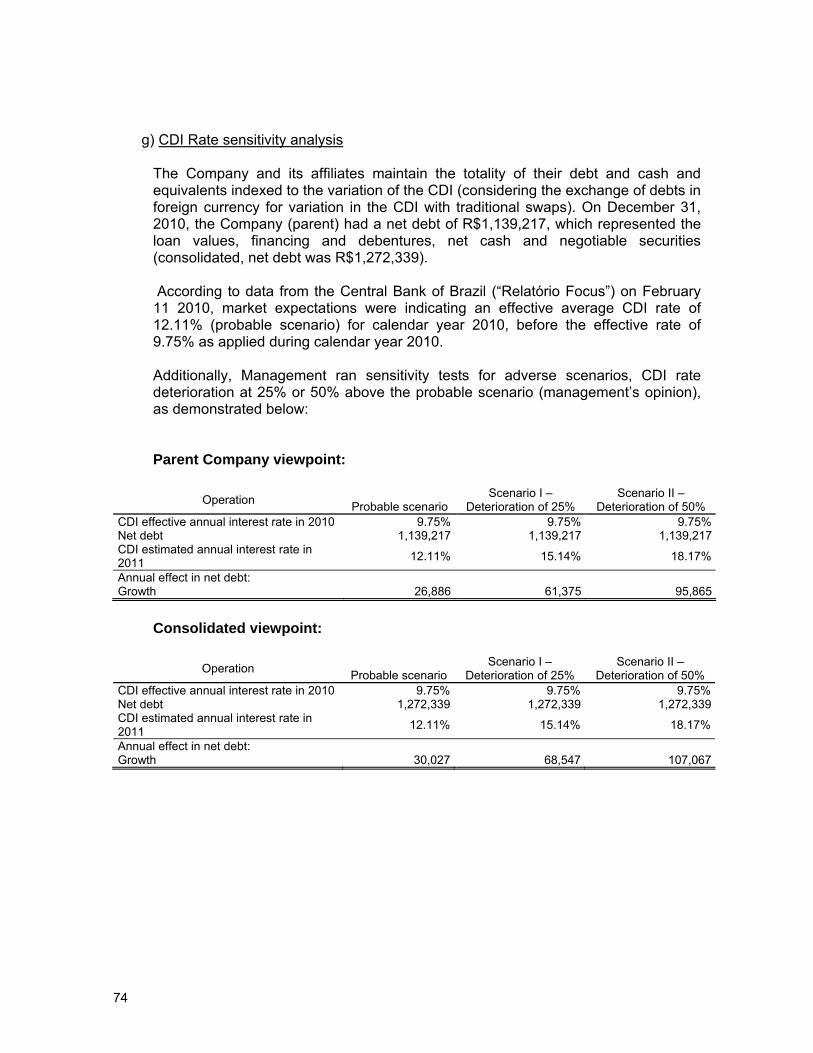
74
g) CDI Rate sensitivity analysis
The Company and its affiliates maintain the totality of their debt and cash and equivalents indexed to the variation of the CDI (considering the exchange of debts in foreign currency for variation in the CDI with traditional swaps). On December 31, 2010, the Company (parent) had a net debt of R$1,139,217, which represented the loan values, financing and debentures, net cash and negotiable securities (consolidated, net debt was R$1,272,339). According to data from the Central Bank of Brazil (“Relatório Focus”) on February 11 2010, market expectations were indicating an effective average CDI rate of 12.11% (probable scenario) for calendar year 2010, before the effective rate of 9.75% as applied during calendar year 2010. Additionally, Management ran sensitivity tests for adverse scenarios, CDI rate deterioration at 25% or 50% above the probable scenario (management’s opinion), as demonstrated below:
Parent Company viewpoint:
Operation Probable scenario Scenario I –
Deterioration of 25% Scenario II –
Deterioration of 50% CDI effective annual interest rate in 2010 9.75% 9.75% 9.75%Net debt 1,139,217 1,139,217 1,139,217 CDI estimated annual interest rate in 2011 12.11% 15.14% 18.17%
Annual effect in net debt: Growth 26,886 61,375 95,865
Consolidated viewpoint:
Operation Probable scenario Scenario I –
Deterioration of 25% Scenario II –
Deterioration of 50% CDI effective annual interest rate in 2010 9.75% 9.75% 9.75%Net debt 1,272,339 1,272,339 1,272,339 CDI estimated annual interest rate in 2011 12.11% 15.14% 18.17%
Annual effect in net debt: Growth 30,027 68,547 107,067

75
26. Insurance coverage The Company and its affiliates have insurance coverage for merchandise in stock and fixed assets, as well as against robberies and thefts of cash. On December 31, 2010, such coverage was as follows:
Property insured Covered risks Coverage amount- R$ Investories and fixed assets Fire and other risks 581,400 Outgoing profit 64,000 Civil liability 5,000 Robberies 1,125
The scope of the auditors’ work did not include review of the sufficiency of the coverage, which was determined and assessed regarding adequacy by the Company’s Management.
27. Rental contracts
The Company has a Private Instrument for Commercial Real Estate Rental Contracts and Other Agreements with Hulusa Comercial e Imóveis Ltda (unaffiliated company). Through this instrument, the company, in the capacity of tenant, and Hulusa, in the capacity of landlord, executed a study regarding the establishment of a new distribution center (DC) for use by B2W on real estate owned by Hulusa. This new DC has been used by the Company since August 2008. The Company still maintains its Pirambóia and Osasco DCs, whose consolidation into the operations in the Hulusa DC is anticipated. The rent is updated monthly on basis of the arithmetical average of the following Brazilian indexes: IGP-M (Market General Price Index) and IPC (Consumer Price Index); on December 31, 2010, the value of the monthly rent stood at R$1,274. The 10-year (120-month) lease term is counted as of the execution date on the above-mentioned lease instrument. To guarantee the new DC, the Company made payments in the total amount of R$10,000 that will be applied against future rent payments, in representing 50% of the monthly rent. Under the above- referenced contract, Lojas Americanas S.A. is the Company’s co-signer, guarantor, and principal debt payer. For the period, which closed on December 31, 2010, the Company incurred rent expenses for its DCs and headquarters in the amount of R$20,392 (R$20,827 for the period ending December 31, 2009). Pursuant to Technical Pronouncement CPC 06, the Company analyzed the above-referenced contracts and concluded that they conform to the classification of operational mercantile leasing. Future commitments arising from the lease contracts of these DCs-in-use, for values as of December 31, 2010 are as follows:

76
2011 2012 2013 2014 2015 onwards
Rentals 20,392 22,980 23,079 23,179 23,280
28. Employee and management remunaration In accordance with the Brazilian Corporation Law and the Company’s Bylaws, it is the responsibility of the shareholders, in a General Shareholders Meeting, to establish the total amount of the annual remuneration of the Management. The Board of Directors is charged with effectuating the disbursement of this allocated amongst the members of Management. At the General Shareholder’s Meeting of April 30, 2010, the monthly, global remuneration limit was established for the Company’s Management (Board of Directors and Executive Board). For the periods ended on December 31, 2010 and 2009, the total remuneration (salaries and profit-sharing) for the Company’s board members, directors and principal executives was R$11,003 and R$8,583 respectively (R$11,353 and R$9,233 consolidated), with compensation falling within the limits approved in corresponding Shareholders’ Meetings. The Company and its affiliates do not grant post-employment benefits, employment contract rescission benefits, or other long-term benefits for management and its employees (except for the Stock Option Purchase Plan described in Note 20).
29. Statement of extended results Pursuant to CPC 26 (IAS 1) – Presentation of Accounting Statements, the Company is demonstrating below the changes in extended results for the years ended on December 31, 2010 and 2009:
Parent Company Consolidated 12.31.2010 12.31.2009 12.31.2010 12.31.2009 Net income for the year 22,672 50,818 33,587 62,015 Other comprehensive income: Equity adjustments of investments (630) 2,111 (630) 2,111 Other comprehensive income total (630) 2,111 (630) 2,111 Comprehensive income 22,042 52,929 32,957 64,126
30. Subsequent events
At the Board of Directors meeting held January 27, 2011, conditions were approved for establishing a Credit Rights Investment Fund (“FIDC”), whose objective is the acquisition of the credit rights belonging to the Company and others, as first seen in the Regulations, that originate through credit card payment means used in the sale of products and services on the part of the Company, which will operate under the following main terms:

77
a) Eligible receivables: credits against accredited commercial establishments for the acceptance of electronic means of payment for the purchase and sale of products and services through payment cards, responsible for the capture and processing of the respective electronic transactions and for the payment of these transactions to the respective commercial establishments;
b) Initial Net Equity: R$541,500; c) Issue of senior quotas: 1st issue of 1,643 quotas in the amount of R$300 each,
totaling R$492,900; d) Issue of subordinated mezzanine quotas: 1st issue of 72 subordinated mezzanine
quotas in the amount of R$300 each, totaling R$21,600;
e) Issue of subordinated junior quotas: 1st issue of 90 subordinated junior quotas in the amount of R$300 each, totaling R$27,000, to be subscribed and fully paid in by the FIDC assignors under the terms of the regulations. The assignors of the operation shall be the Company and its Parent Company Lojas Americanas S/A.
f) Benchmark: (i) senior quotas: 111% of the DI rate and (ii) subordinated mezzanine
quotas: 155% of the DI; g) Deadline: the first issue mature in 60 months; h) Redemption date: as of the 60th month; i) Payment of remuneration: two times a year (each semester); j) Lead coordinator: BB - Banco de Investimento S.A.; k) Manager: Votorantim Asset Management Distribuidora de Títulos e Valores
Mobiliários Ltda.; l) Custodian: Citibank Distribuidora de Títulos e Valores Mobiliários S.A.
The Fund was called FÊNIX FUNDO DE INVESTIMENTO EM DIREITOS CREDITÓRIOS DO VAREJO established as a closed condominium, governed by CMN Resolution 907 of November 29, 2001 and by CVM Instruction 356/01. The Regulation of the fund is available at the following website: www.cvm.gov.br.