financial statements 2018 and management report · legal framework hapag-lloyd’s business is...
TRANSCRIPT

Financial Statements 2018 and Management Report
Hapag-Lloyd Aktiengesellschaft

Disclaimer: This annual report contains statements concerning future developments at Hapag-Lloyd. Due to market fluctuations, the development of the competitive situation, world market prices for commodities, and changes in exchange rates and the economic environment, the actual results may differ considerably from these forecasts. Hapag-Lloyd neither intends nor undertakes to update forward-looking statements to adjust them for events or developments which occur after the date of this report. United Arab Shipping Company Ltd. (until 16 January 2017 S. A. G.) and its subsidiaries (subsequently referred to as UASC or the UASC Group) are included in the Hapag-Lloyd AG group of consolidated companies from the acquisition date of 24 May 2017. The figures of the 2017 financial year include effects resulting from the transaction as well as the integration of the UASC Group as of the date of acquisition. As such, the figures for the 2018 financial year are only comparable with those of previous years to a limited extent.
This report was published in April 2019.
FINANCIAL STATEMENTS 2018 AND MANAGEMENT REPORT
HAPAG-LLOYD AKTIENGESELLSCHAFT
FOR THE FINANCIAL YEAR FROM 1 JANUARY TO 31 DECEMBER 2018

CONTENT
2 MANAGEMENT REPORT
2 Operating activities
4 Company structure and shareholders
6 Company objectives and strategy
12 Corporate management
15 Principles and performance indicators
20 Research and development
21 Employees
22 Economic report
22 General economic conditions
23 Sector-specific conditions
30 Earnings, financial and net asset position
30 Earnings position
34 Financial position
38 Net asset position
40 Executive Board’s statement on overall economic performance
41 Report by the Executive Board on relationships with affiliated companies
41 Risk and opportunity report
41 Risk management
45 Risks
60 Summarised overview of corporate risks
62 Opportunities
64 Summarised overview of corporate opportunities
65 Overall assessment of risks and opportunities
66 Outlook
68 Remuneration report
84 Other obligatory disclosures
84 Disclosures and notes relevant to the takeover
91 Declaration on corporate governance in accordance with section 315 d in conjunction
with section 289 f (1) of the German Commercial Code (HGB) and declaration of conformity
in accordance with section 161 of the German Stock Corporation Act (AktG)
91 Non-financial group declaration as per German CSR Guideline Implementation Act
(CSR-Richtlinie-Umsetzungsgesetz)
92 ANNUAL FINANCIAL STATEMENTS
92 Balance sheet
94 Income statement
95 Notes
132 RESPONSIBILITY STATEMENT
133 INDEPENDENT AUDITORS’ REPORT
141 Imprint

MANAGEMENT REPORT
OPERATING ACTIVITIES
Hapag-Lloyd is Germany’s largest container liner shipping company and is one of the world’s
leading container liner shipping companies in terms of global market coverage. The Group’s
core business is the shipping of containers by sea, but also encompasses transport services
from door to door.
Network of Hapag-Lloyd services
119 Services
Europe – North America(incl. IRT North Europe)
20 Services
Asia / Oceania – N. America
17 Services
Latin America
28 Services
Africa / Med
15 Services
Middle East
10 Services
Europe – Asia / Oceania
9 Services
Asia IRT(incl. Far East – ME / Indian Ocean; Far East – Oceania)
20 Services
Source: Company data
2 M a n a g e M e n t R e p o R t
H a p a g - L L o y d a k t i e n g e s e L L s c H a f t i f i n a n c i a L s t a t e M e n t s 2 0 1 8 a n d M a n a g e M e n t R e p o R t

As at 31 December 2018, Hapag-Lloyd AG´s fleet comprised 220 ships (previous year: 208). In
partnership with Hapag-Lloyd AG´s subsidiaries, the Group had 227 container ships (previous
year: 219), 407 sales offices (previous year: 387) in 128 countries (previous year: 125) and a
global network of 119 services (previous year: 120). Hapag-Lloyd served around 30,200 cus-
tomers in the 2018 financial year (previous year: around 32,400).
Hapag-Lloyd conducts its container liner shipping business in an international business envi-
ronment in which transactions are invoiced mainly in US dollars and payment processes are
handled in US dollars. This relates not only to operating business transactions, but also to
investment activities such as the acquisition, chartering and rental of ships and containers,
as well as the corresponding financing of investments.
The Hapag-Lloyd Group’s functional currency is the US dollar. The reporting currency of the
individual and consolidated financial statements of Hapag-Lloyd is, however, the euro. Assets
and liabilities recognised in the consolidated financial statements of Hapag-Lloyd AG are trans-
lated into euros as at the balance sheet date (closing date rate) using the middle rate of that
day. The translation differences are recognised in Hapag-Lloyd AG´s other operating income /
expenses. If required, hedging transactions are conducted in the Hapag-Lloyd Group to hedge
against the USD / EUR exchange rate.
Legal framework
Hapag-Lloyd’s business is subject to multiple regulatory and legal provisions. In order to
engage in business operations, it is necessary to have authorisations, licences and certificates.
Compliance with the ISM Code (International Safety Management), which regulates the meas-
ures required for ensuring safety at sea, and the ISPS Code (International Ship and Port Facility
Security) must be given particular emphasis. The latter stipulates what measures are to be
taken to prevent hazards on board ships and in ports, thereby contributing to supply chain
security. There are also numerous country-specific rules, such as “advance manifest rules”,
which stipulate certain disclosure obligations in relation to the ship’s cargo. Adherence to in -
ternational regulations and compliance specifications is a basic requirement for the provision
of services.
3M a n a g e M e n t R e p o R t
H a p a g - L L o y d a k t i e n g e s e L L s c H a f t i f i n a n c i a L s t a t e M e n t s 2 0 1 8 a n d M a n a g e M e n t R e p o R t

COMPANY STRUCTURE AND SHAREHOLDERS
The controlling company of the Hapag-Lloyd Group, Hapag-Lloyd AG, is also the largest single
operating company within the Group. Hapag-Lloyd AG has the following key branch offices
active in the areas of sales and operations: Hapag-Lloyd Rotterdam (Rotterdam, Netherlands),
Hapag-Lloyd Antwerpen (Antwerp, Belgium) and Hapag-Lloyd Denmark (Holte, Denmark).
In terms of operations, the Group structure of Hapag-Lloyd AG as at 31 December 2018 is
as follows:
Shareholder structure of Hapag-Lloyd AG
Following the takeover of UASC on 24 May 2017 in the form of a capital increase in exchange
for contributions in kind, UASC’s former primary shareholders, Qatar Holding LLC on behalf
of the Qatar Investment Authority (QIA) and Public Investment Fund Saudi Arabia (PIF),
became additional major shareholders in Hapag-Lloyd AG, with initial stakes in its share capital
of 14.4% (QIA) and 10.1% (PIF). The shares held by the other previous UASC shareholders
(Kuwait, Iraq, United Arab Emirates and Bahrain) totalling around 3.4% of Hapag-Lloyd shares
have been included in the free float since the acquisition date. CSAV Germany Container
Holding GmbH (CSAV), Hamburger Gesellschaft für Vermögens- und Beteiligungsmanagement
mbH (HGV) and Kühne Maritime GmbH together with Kühne Holding AG (Kühne) continued to
be Anchor Shareholders following the merger with UASC. During the second quarter of 2018,
Kühne increased its share in Hapag-Lloyd to a total of 25.0%.
The five aforementioned major shareholders together held around 89.4% of the share capital
of Hapag-Lloyd AG as at the balance sheet date. CSAV, HGV and Kühne Maritime GmbH
have also agreed under a shareholders’ agreement to exercise their voting rights from the
shares in Hapag-Lloyd AG by issuing a common voting proxy, thereby making important
decisions together. The shareholder structure of Hapag-Lloyd AG as at 31 December 2018
was as follows:
Exe
cu
tive C
om
mitte
e
CEORolf Habben Jansen
CFOnicolás Burr
CPOJoachim schlotfeldt
Executive Board
Trade Management Network
Central Functions
North America Latin America Europe Middle East Asia
Regions
HQ Piscataway
HQ Hamburg
HQ Valparaíso
HQ Dubai
HQ Singapur
COOanthony J. firmin
4 M a n a g e M e n t R e p o R t
H a p a g - L L o y d a k t i e n g e s e L L s c H a f t i f i n a n c i a L s t a t e M e n t s 2 0 1 8 a n d M a n a g e M e n t R e p o R t

Voting rights as at 31 December 2018
in % 2018 2017
CSAV Germany Container Holding GmbH 25.8 25.5
Kühne Holding AG and Kühne Maritime GmbH 25.0 20.5
Qatar Holding Germany GmbH 14.5 14.5
HGV Hamburger Gesellschaft für Vermögens- und Beteiligungsmanagement mbH 13.9 13.9
The Public Investment Fund of the Kingdom of Saudi Arabia 10.2 10.2
Free float 10.6 15.4
Total 100.0 100.0
Personnel changes on the Supervisory Board and the Executive Board
of Hapag-Lloyd AG
After Dr Nabeel Al-Almudi stepped down from his position as member of the Supervisory
Board on 30 November 2017, Hamburg district court, on 23 February 2018, appointed Mr Turqi
Alnowaiser as a new member of the shareholder representatives on the Supervisory Board
until the next Annual General Meeting. Mr Turqi Alnowaiser was officially elected at the end of
the AGM on 10 July 2018.
Ms Christine Behle stepped down from her position on the Supervisory Board for personal
reasons with effect from 30 September 2018. The district court appointed Ms Maya Schwiegers-
hausen-Güth as her successor with effect from 26 October 2018.
Mr Joachim Kramer as an employee representative on the Supervisory Board left the com-
pany for reasons of age on 28 February 2019. The Hamburg district court appointed Mr Felix
Albrecht effective 11 March 2019, as the new representative of the Supervisory Board´s
employee.
As part of the reallocation of Executive Board responsibilities, the scope of responsibilities of
the Chief Commercial Officer was transferred to the Chief Executive Officer. Mr Joachim
Schlotfeldt was appointed as new member of the Executive Board as of 1 April 2018, who is
inter alia responsible as labour director for the newly created division of Chief Personnel and
Global Procurement.
According to a resolution of the Supervisory Board from 17 December 2018, Dr Maximilian
Rothkopf was appointed as a new Executive Board member with effect from 1 May 2019.
Dr Rothkopf will become new COO and succeed Anthony J. Firmin, who will retire on
30 June 2019.
The targets, framework conditions and principles upon which the Group conducts business
successfully are presented below. These include achieving sustainable operating cash flows,
a solid financing structure and a sound liquidity and equity base.
5M a n a g e M e n t R e p o R t
H a p a g - L L o y d a k t i e n g e s e L L s c H a f t i f i n a n c i a L s t a t e M e n t s 2 0 1 8 a n d M a n a g e M e n t R e p o R t

COMPANY OBJECTIVES AND STRATEGY
The presentation of corporate objectives and strategy in the management report of Hapag-
Lloyd AG relates to the Hapag-Lloyd Group. Hapag-Lloyd AG is the most important single
company in the Hapag-Lloyd Group, so the objectives and strategies are identical. Where
statements do not relate to the Hapag-Lloyd Group, reference is made explicitly to
Hapag-Lloyd AG.
The prime strategic objective of the Hapag-Lloyd Group is to achieve long-term profitable
growth measured on the basis of the developments in transport volume, the key performance
indicators EBITDA and EBIT as well as the return on invested capital (ROIC).
In terms of increasing its transport volume, Hapag-Lloyd has achieved growth of more than
100% over the past five years. This was due mainly to the takeover of CSAV’s container ship-
ping activities in December 2014 and to the merger with UASC in May 2017, but also to the
rising global demand for container shipping services.
Despite the continuing very competitive industry environment, Hapag-Lloyd recorded an
increase in its EBITDA and EBIT in the 2018 financial year. Earnings before interest, taxes,
depreciation and amortisation (EBITDA) are calculated by adding the revenue, other operating
income and the earnings of companies accounted for using the equity method generated
within a period less transport expenses, personnel expenses and other operating expenses,
not including amortisation of intangible assets and depreciation of property, plant and equip-
ment. To calculate earnings before interest and taxes (EBIT), depreciation and amortisation
are deducted from EBITDA.
Hapag-Lloyd achieved an EBITDA margin of 9.9% in the 2018 financial year. The margin was
supported in particular by the achieved synergies, cost savings and efficiency improvements
and a relatively balanced presence both in East–West and in North–South trades.
Development of key performance indicators of the Hapag-Lloyd Group
in % 2018 2017 2016 2015 2014
Transport volume (in TTEU) 11,874 9,803 7,599 7,401 5,907
EBITDA (in million EUR) 1,138 1,055 607 831 99
EBIT (in million EUR) 443 411 126 366 –383
EBITDA-margin (in % of revenue) 9.9 10.6 7.9 9.4 1.5
EBIT-margin (in % of revenue) 3.8 4.1 1.6 4.1 –5.6
6 M a n a g e M e n t R e p o R t
H a p a g - L L o y d a k t i e n g e s e L L s c H a f t i f i n a n c i a L s t a t e M e n t s 2 0 1 8 a n d M a n a g e M e n t R e p o R t

Unlike in the previous fiscal year, the earnings development of the Hapag-Lloyd AG was sig-
nificantly below the performance of the Group. The main reasons for this were negative
exchange rate effects from the conversion of financial liabilities as a result of the USD / EUR
price development as well as the integration of the subsidiary result after consolidation. The
earnings development is fully described in the Earnings, Financial and Asset Position.
Hapag-Lloyd intends to increase the transport volume in line with market growth. Hapag-Lloyd
wants to further improve its operating result by means of additional cost savings and efficiency
improvements, expected growth in volume and an improvement in revenue quality (HIS Global
Insight, January 2019).
The target of achieving transport volume growth equal to market growth was significantly
exceeded in 2018 with an increase in the transport volume of 21.1%. This was largely due to
the merger with UASC. On a pro forma basis 1, the transport volume rose by 5.9% in the
reporting period, which was higher than the market growth rate of 4.0%.
In previous years, Hapag-Lloyd implemented extensive synergy, cost saving and efficiency
programmes. The Company’s most important programmes, CUATRO, OCTAVE I and II and
Close the Cost Gap, had successfully been implemented by the end of the first quarter of 2017.
This laid the foundations for generating annual synergies, efficiency improvements and cost
savings of approximately USD 600 million as against the comparable cost base in the 2014
financial year, and assuming that external factors remain the same.
In addition to the efficiency-boosting and cost-cutting programmes implemented in previous
years, the merger with UASC was another key strategical step towards strengthening Hapag-
Lloyd’s market position and competitiveness. It was planned that the synergies from the
merger with UASC would contribute approximately 435 million USD per annum from the 2019
financial year onwards, whereas the Executive Board of Hapag-Lloyd AG expected to achieve
approximately 90% of the synergies by the end of the financial year 2018. The synergies had
already been achieved in full by 31 December 2018. Following the merger on 24 May 2017, the
operational integration of the UASC Group was successfully completed by October 2017. A
significant step in the operational integration was the incorporation of all UASC services into
Hapag-Lloyd’s existing IT system (voyage cut-over). One-off expenses of approximately
110 million USD were incurred up until 31 December 2018 from the transaction and imple-
mentation of the merger (thereof approximately 5 million USD in 2018). No further significant
expenses are expected in relation to the integration of the UASC Group.
Despite what continued to be a very competitive industry environment and the increase in the
balance sheet total resulting from the UASC integration, the return on invested capital (ROIC)
came to 3.7% in 2018. The aim is to generate a return on invested capital at least equal to the
weighted average cost of capital (WACC) across one economic cycle in the medium term. The
weighted average cost of capital in the reporting period was 8.2% (previous year: 7.9%).
1 The pro forma basis assumes that the merger with UASC occurred on 1 January 2017 and facilitates comparability with regard to the Company’s performance.
7M a n a g e M e n t R e p o R t
H a p a g - L L o y d a k t i e n g e s e L L s c H a f t i f i n a n c i a L s t a t e M e n t s 2 0 1 8 a n d M a n a g e M e n t R e p o R t

Strategy 2023
The Executive Board of Hapag-Lloyd AG first presented on the Group’s new strategy (“Strategy
2023”) in November 2018.
Starting position
The liner shipping industry is emerging from the longest downturn in its history. Since the 2008
financial crisis, the industry has been unable to return its cost of capital. Following a substantial
number of mergers, the world’s 10 biggest liner shipping companies now account for more
than 80% of the global volume. This consolidation, as well as the use of ever larger ships, has
led to a significant reduction in unit costs. However, Hapag-Lloyd believes that the benefits of
further consolidation would only be relatively small. From Hapag-Lloyd’s perspective, the likeli-
hood of large mergers is therefore low. There would only be few potential synergies, greater
integration risks and probably stricter controls and conditions from the competition authorities.
Furthermore, the entire industry lacks the financial strength that would be needed to finance a
cash acquisition. As a result, no further significant consolidation is likely. Given that the largest
liner shipping companies are already very cost-competitive, the challenge for them now is to
differentiate themselves commercially from one another. Measured by transport capacity
Hapag-Lloyd is the fifth-largest liner shipping company in the world. With one of the youngest
and most efficient vessel fleet, Hapag-Lloyd is well positioned and well prepared to deal with
the changes in the operating environment and the challenges to safeguard its future competi-
tiveness.
A changed market environment requires a new strategic focus: Strategy 2023
The Executive Board of Hapag-Lloyd AG assumes that the future of the container shipping
industry will no longer be solely determined by unit costs and economies of scale. Instead, it
firmly believes that service quality and reliability will be decisive competitive factors and that
customers are willing to pay for quality, service and greater reliability. With regard to reliability
in particular, there is a need for action by the industry, and therefore by Hapag-Lloyd.
Hapag-Lloyd has developed its new strategy based on these premises. Successful implemen-
tation of the strategy will safeguard the future and provide the foundations for further organic
growth.
The three core objectives of Strategy 2023 are:
• Becoming number one for quality
• Remain a global player
• Profitability throughout the entire economic cycle
8 M a n a g e M e n t R e p o R t
H a p a g - L L o y d a k t i e n g e s e L L s c H a f t i f i n a n c i a L s t a t e M e n t s 2 0 1 8 a n d M a n a g e M e n t R e p o R t

The aim is to ensure that the company remains a global player, to make Hapag-Lloyd a leader
in quality and to set standards in the industry for quality, reliability and service. Hapag-Lloyd
considers leadership in quality as a basic requirement for maintaining or even improving mar-
gins and the future success in the market. Continuous process optimisation will contribute to
this, brought about by a more agile organisation, digitalisation and automation.
The following unique selling points will differentiate us clearly from our competitors and form
the core of our strategy:
Leadership in quality
Surveys commissioned by Hapag-Lloyd show that proven quality and reliability, such as punc-
tual delivery, play a significant role for more than half of market participants. As part of its aim
to set industry standards with regard to quality, Hapag-Lloyd has specified pledges on quality
that are being implemented on a gradual basis. As a result, customer satisfaction will be one of
our targets in future. A corresponding methodology for recording and measuring this indicator
is currently under discussion and will be implemented and communicated during the coming
quarters. In addition to a base product that includes clearly specified pledges on service and
quality, we will offer customised premium products that meet specific customer requirements
and cover additional services.
agile organisational activities
A key factor for the success of Strategy 2023 is the development of Hapag-Lloyd’s organisa-
tion towards increased agility. The aim is to make quicker and better commercial decisions
with the help of data based analysis tools. This will enable amongst others a faster and more
flexible response to market changes in supply and demand. Agility also requires the willingness
to continuously learn. At the same time, agility means that Hapag-Lloyd must be more flexible
in project development and be open to partnerships.
digitalisation and automation
New technologies and automation are enabling a continuous improvement in internal pro-
cesses and systems, thus reducing time-consuming manual administrative tasks. The
resources freed up by this can be used to increase efficiency and make optimisations in other
areas, such as improving cost control and enhancing revenue management.
Hapag-Lloyd believes that it is well equipped for the digitalisation and automation. Our “single
operating system” is recognised within the industry and forms the backbone of our efficient
operating process. This also means that Hapag-Lloyd is in a comparatively good starting posi-
tion when it comes to implementing and taking advantage of new technologies, as was shown
with the introduction of the Web Channel, for example.
9M a n a g e M e n t R e p o R t
H a p a g - L L o y d a k t i e n g e s e L L s c H a f t i f i n a n c i a L s t a t e M e n t s 2 0 1 8 a n d M a n a g e M e n t R e p o R t

continuous cost and revenue management
The basis for the successful implementation of Strategy 2023 remains a consistent cost and
revenue management. Hapag-Lloyd has already launched a number of projects to ensure that
the company cost structure is competitive. In the area of revenue management, Hapag-Lloyd
has identified the key areas in which optimisations can be made and initial measures have
been started. Thanks to improved cost structures, Hapag-Lloyd expects to achieve an earn-
ings contribution of USD 350 to 400 million annually by 2021. The cost structures will be con-
tinuously reviewed and adjusted. In terms of economies of scale, Hapag-Lloyd is already on
par with substantially bigger competitors. At the same time, rigorous and consistent digitisa-
tion is a prerequisite for increasing service quality.
Summary of objectives and measurement of results
Hapag-Lloyd believes that the most recent major wave of consolidation within the industry is
largely complete. The focus of Strategy 2023 is on becoming number one for quality and
achieving profitable growth. The basis is continuous and consistent cost and revenue manage-
ment as well as improving internal processes through greater agility and taking advantage of
technological opportunities, such as digitisation and automation. Initial measures such as the
Web Channel with Quick Quotes have already been implemented. The planning period for
Strategy 2023 will run until the end of the year 2023. Although further implementation will take
place in 2019, most of the measures and their effects on earnings will be visible in the subse-
quent years.
The current financial key performance indicators of the Hapag-Lloyd Group will remain the
EBITDA and the EBIT. Hapag-Lloyd furthermore aims to be profitable throughout the entire
economic cycle, i. e. to achieve a return on invested capital (ROIC) that is at least equal to the
Company’s weighted average cost of capital (WACC). The reduction of debt remains a priority,
and the Company’s target is to achieve a ratio of net debt to EBITDA of 3.0x or less by the
end of 2023. Its target for the end of 2019 continues to be a ratio of net debt to EBITDA of 3.5x
or less. Furthermore, Hapag-Lloyd is aiming for an equity ratio of over 45% and a liquidity
reserve of around USD 1.1 billion.
In addition to the key financial indicators, the following new non-financial goals have been set:
Leadership in quality is to be measured using the Net Promoter Score (NPS). In addition, the
Company intends to improve reliability, i. e. punctuality, by clearly defining its pledge on punc-
tuality and to put in place the technical requirements for measuring and reporting punctuality
on a standardised basis.
10 M a n a g e M e n t R e p o R t
H a p a g - L L o y d a k t i e n g e s e L L s c H a f t i f i n a n c i a L s t a t e M e n t s 2 0 1 8 a n d M a n a g e M e n t R e p o R t

Hapag-Lloyd aims to increase the percentage of door-to-door business to over 40% by 2023.
This cargo type requires additional services which Hapag-Lloyd offers customers and which
enable it to generate higher revenue and higher margins.
Hapag-Lloyd targets a global market share (worldwide excl. Intra-Asia) of more than 10%. To
achieve this aim Hapag-Lloyd wants to continue expanding in attractive growth markets and in
the area of special container transports such as reefer. The company believes it already has a
strength in this business and wants to increase its market share in special transports also to
around 10%.
The success of the digitisation strategy is to be measured by whether the volume of cargo
booked via the Web Channel will reach 15% of total volume by 2023.
As a company with a tradition of environmental awareness, it is a matter of course that Hapag-
Lloyd will comply with the stricter environmental requirements, such as IMO 2020, and that the
company will implement the necessary technical and organisational changes with the greatest
care and attention. With regard to the new regulations by the International Maritime Organi-
zation (IMO) coming into effect 2020 to reduce sulphur emissions, Hapag-Lloyd will predomi-
nantly use low sulphur fuel. On 10 vessels the company will install Exhaust Gas Cleaning
Systems (EGCS) to wash out the sulphur from the exhaust gases. In addition, an LNG-pilot will
be conducted with one LNG ready ultra large container vessel (ULCV) being retrofitted to run
on LNG.
The Strategy 2023, including the aforementioned targets and goals, will become more granular
as the strategy implementation progresses. When necessary, the strategy will be adapted to a
changing operating environment.
In the 2019 financial year our focus will be on:
• The Strategy 2023
• Achieving further cost savings, which are expected to reach USD 350 – 400 million
annually by 2021
• Continue implementing measures to improve revenue quality
• Further developing Hapag-Lloyd’s partnership within THE Alliance
• Technical and organisational preparations for the IMO’s new exhaust gas standards
In the course of the financial year 2019, Hapag-Lloyd will report about the progress in target
achievement.
11M a n a g e M e n t R e p o R t
H a p a g - L L o y d a k t i e n g e s e L L s c H a f t i f i n a n c i a L s t a t e M e n t s 2 0 1 8 a n d M a n a g e M e n t R e p o R t

CORPORATE MANAGEMENT
The presentation of corporate management in Hapag-Lloyd AG’s management report relates
to the Hapag-Lloyd Group. Hapag-Lloyd AG is the most important individual company of the
Hapag-Lloyd Group. Where comments do not relate to the Hapag-Lloyd Group, reference is
made explicitly to Hapag-Lloyd AG.
The Group’s key performance indicators for its operating business are EBITDA and EBIT.
EBITDA is an important indicator of the achievement of sustainable company results and gross
cash flows. Hapag-Lloyd uses EBITDA as an important parameter for investment and financing
decisions. The financial performance indicators, EBITDA and EBIT, are only used to analyse
and manage the operating results of the Group as a whole.
The main factors influencing the development of the operating result indicators are transport
volume, freight rate, the US dollar exchange rate against the euro and operating costs includ-
ing bunker price.
Earnings before interest, taxes, depreciation and amortisation (EBITDA) for the Hapag-Lloyd
Group equal the revenue, the other operating income and the earnings of companies accoun-
ted for using the equity method generated within a period less transport expenses, personnel
expenses and other operating expenses, not including amortisation of intangible assets and
depreciation of property, plant and equipment. To calculate earnings before interest and taxes
(EBIT), depreciation and amortisation are deducted from EBITDA.
The main differences between the factors influencing the operating result of Hapag-Lloyd AG
and the Group are the applicable accounting standards (IFRS and HGB) and the different func-
tional currencies (euro and US dollar). Exchange rate effects affect the other operating income
and expenses of Hapag-Lloyd AG.
EBITDA
Expenses
Depreciation
EBIT
Revenue
XtRanspoRt VoLUMe fReigHt Rate
12 M a n a g e M e n t R e p o R t
H a p a g - L L o y d a k t i e n g e s e L L s c H a f t i f i n a n c i a L s t a t e M e n t s 2 0 1 8 a n d M a n a g e M e n t R e p o R t
The global transport volume is dependent on the prevailing economic developments around
the world and therefore also on the various levels of demand for shipping services. Other fac-
tors influencing Hapag-Lloyd’s transport volume are container ship capacity and the accom-
panying change in the competitive situation in the trades.
Freight rates can be managed only to a limited degree because they are heavily dependent
on market capacity and market demand. The Group follows a yield management approach,
according to which individual container shipments are examined using profitability criteria. It
attempts to continuously reduce the proportion of less profitable cargo through targeted yield
management. Business operations around the globe have benefited from the deployment of
customised IT systems.
Efficient cost management provides essential control over the EBITDA and EBIT values. The
system of cost management is supported by a standardised, integrated IT solution which pro-
vides essential and up-to-date data required for management and for implementing and main-
taining cost reduction measures. The cost base is, however, largely dependent on external
influencing factors. Due to the global nature of the Group’s business operations, exchange rate
fluctuations can have a considerable influence on costs. If necessary, the Group hedges a por-
tion of its cash outflows in euros using a rolling hedge with the aim of limiting currency risks in
the consolidated financial statements.
Operating costs are also influenced by bunker price changes. The bunker price correlates
with the development of crude oil prices and is subject to substantial fluctuations. Depending
on the competitive situation, a proportion of the fluctuations can be compensated for via the
freight rate in the form of bunker surcharges. However, the extent to which this can be imple-
mented depends very much on the prevailing market situation.
Part of the Group’s likely bunker fuel needs are hedged using options in order to lessen the
risk of changes in the bunker price due to rising prices.
In addition to EBITDA and EBIT as operating performance indicators, the return on invested
capital (ROIC) is calculated at Group level as an indicator of the performance within a period.
ROIC compares net operating profit after tax (NOPAT), defined as EBIT less income taxes,
with invested capital as at the reporting date. Invested capital is defined as assets excluding
cash and cash equivalents less liabilities excluding financial debt. To facilitate comparison
with other international shipping companies, the return on invested capital is calculated and
presented exclusively on the basis of the functional currency, the US dollar.
13M a n a g e M e n t R e p o R t
H a p a g - L L o y d a k t i e n g e s e L L s c H a f t i f i n a n c i a L s t a t e M e n t s 2 0 1 8 a n d M a n a g e M e n t R e p o R t

Calculation of return on invested capital on a Group basis
million EUR million USD
2018 2017 2018 2017
Non-current assets 12,845.0 12,633.5 14,709.1 15,146.1
Inventory 238.1 186.4 272.6 223.5
Accounts receivables 1,217.7 887.8 1,394.3 1,064.4
Other assets 343.4 515.2 393.3 617.7
Assets 14,644.2 14,222.9 16,769.3 17,051.7
Provisions 692.6 615.1 793.1 737.5
Accounts payable 1,774.1 1,559.8 2,031.6 1,870.1
Other liabilities 557.4 259.1 638.4 310.5
Liabilities 3,024.1 2,434.0 3,463.1 2,918.1
Invested Capital 11,620.1 11,788.9 13,306.2 14,133.6
EBIT 443.0 411.4 523.5 466.8
Taxes 31.8 24.1 37.7 27.3
Net Operating Profit after Tax (NOPAT) 411.2 387.3 485.8 439.5
Return on Invested Capital (ROIC) 3.7% 3.1%
Figures are in USD, rounded, aggregated and calculated on an annualised basis
UASC Ltd. and its subsidiaries are included in Hapag-Lloyd AG’s consolidated financial statements from the date control was trans-ferred on 24 May 2017. The presented figures include the effects of the transaction from this date and can therefore only be com-pared to the prior-year’s figures to a limited extent.
The chart outlines selected items from the consolidated statement of financial position and the consolidated income statement in abbreviated form only. Currencies are translated as per the reporting date rates and average rates (1.15 USD / EUR; 1.18 USD / EUR).
The return on invested capital for the Hapag-Lloyd Group (ROIC) in the 2018 financial year was
3.7%, following 3.1% in the 2017 financial year. The return on capital employed in 2018 was
therefore below the weighted average cost of capital. The weighted average cost of capital
after income taxes as used for discounting purposes is 8.2% for the reporting period (2017:
7.9%). The weighted cost of capital is calculated on the basis of capital market-oriented mod-
els as the weighted average of equity and debt capital costs.
14 M a n a g e M e n t R e p o R t
H a p a g - L L o y d a k t i e n g e s e L L s c H a f t i f i n a n c i a L s t a t e M e n t s 2 0 1 8 a n d M a n a g e M e n t R e p o R t

PRINCIPLES AND PERFORMANCE INDICATORS
IMPORTANT FINANCIAL PERFORMANCE INDICATORS
Important financial performance indicators for the Hapag-Lloyd Group include EBITDA, EBIT,
the transport volume and freight rates. Transport volume and freight rates are important factors
influencing revenue development. A description and the calculation of the performance indica-
tors can be found in the “Corporate Management” section. Since the 2015 financial year, return
on invested capital (ROIC) has also been used as a performance indicator.
IMPORTANT NON-FINANCIAL PRINCIPLES
In addition to the financial performance indicators, the optimal utilisation of the available ship
and container capacities also has a substantial influence on whether Hapag-Lloyd achieves
long-term profitable growth.
Sustainable and quality-conscious corporate governance and highly qualified and motivated
employees are also important parameters for Hapag-Lloyd’s long-term profitable growth. The
following non-financial parameters are important for understanding Hapag-Lloyd as a con-
tainer liner shipping company. However, they are not used by the Company as performance
indicators.
Productivity and efficiency
Hapag-Lloyd pays special attention to productivity and efficiency. In this respect, important
measures include yield management and continuous cost control. In recent years in particular,
profitability has improved as a result of comprehensive cost-cutting and efficiency-boosting
programmes.
Business operations around the globe have benefited from the deployment of customised
IT systems.
The globally standardised blueprint organisational structure allows for a standardised
exchange of information between the head office, the various regions and the offices, ensuring
that standardised information is used all over the world. This enables the Group to increase
productivity and ensures that the ship and container fleets are used efficiently.
Hapag-Lloyd’s membership of alliances and various other collaborative projects makes it pos-
sible to optimise fleet deployment and expand the services provided. This likewise guarantees
that the fleet is used efficiently and keeps the cost per transport unit low, thereby ensuring
increased productivity. Due to increasing requirements to cut emissions and further reduce
energy consumption and costs, the Fleet Support Center (FSC) department was established in
2013 to create an integrated energy management concept for both the Company’s own ships
as well as chartered ships. Its primary aim is to achieve optimum fleet deployment across all
trades and regions.
15M a n a g e M e n t R e p o R t
H a p a g - L L o y d a k t i e n g e s e L L s c H a f t i f i n a n c i a L s t a t e M e n t s 2 0 1 8 a n d M a n a g e M e n t R e p o R t

Another important factor in connection with the fleet’s capacity utilisation is the turnaround
frequency of the containers. Each container was transported on average 4.8 times in 2018
(previous year: 4.9 times). The average number of deployments per container per year is
calculated. The objective is to increase the turnaround frequency in order to boost productivity
and keep the total number of containers required as low as possible. Hapag-Lloyd also makes
beneficial use of modern IT systems to do this.
In the reporting period, the capacity utilisation of the container ship fleet (as measured by total
TEU capacity on the dominant leg) rose by 0.4 percentage points to 93.0% (previous year:
92.6%) 1.
Flexible fleet and capacity development
As at 31 December 2018, Hapag-Lloyd’s fleet comprised a total of 220 container ships. All of
the ships are certified in accordance with the ISM (International Safety Management) Code
and have a valid ISSC (ISPS) certificate. The majority of the ships are certified as per ISO 9001
(quality management) and ISO 14001 (environmental management). The TEU capacity of
Hapag-Lloyd AG´s fleet as at 31 December 2018 was 1,620,170 TEU, which was an increase of
123,886 TEU compared to the prior year period (previous year: 1,496,284 TEU). Based on the
TEU capacities, around 37% of the fleet was owned by the Group as at 31 December 2018
(previous year: approximately 37%).
At the end of the reporting period, Hapag-Lloyd also owned or rented 1,554,423 containers
with a capacity of 2,559,316 TEU for shipping cargo. Around 52% of containers (capacity-
weighted) were owned by the Group as at 31 December 2018 (previous year: around 54%).
With a fleet of around 97,000 reefer containers capable of transporting approximately
185,000 TEU, Hapag-Lloyd has a strong competitive position in the attractive market seg-
ment for refrigerated shipping. In order to benefit from the growing market opportunities,
Hapag-Lloyd invested further in the expansion of its reefer fleet and in 2018 ordered another
11,100 reefer containers.
Structure of Hapag-Lloyd AG’s container ship fleet
31.12.2018 31.12.2017 31.12.2016 31.12.2015 31.12.2014
Number of vessels 220 208 159 171 144
thereof
Own vessels 56 56 58 49 56
Leased vessels 17 14 3 3 5
Chartered vessels 147 138 98 119 83
Aggregate capacity of vessels (TTEU) 1,620 1,496 940 948 763
Aggregate container capacity (TTEU) 2,559 2,349 1,576 1,564 1,619
Number of services 119 120 128 121 119
The information on the ship fleet refers to Hapag-Lloyd AG. The figures on the number of services and transport capacity of con-tainers refer to the Hapag-Lloyd Group. UASC Ltd. and its subsidiaries are included in the consolidated financial statements of Hapag-Lloyd AG from the date of the transfer of control, 24 May 2017. Accordingly, the figures presented include the effects of the transaction from this date and are therefore only comparable to a limited extent with the previous year’s figures. The figures from 2014 onwards relate to Hapag-Lloyd’s fleet including the container activities taken over from CSAV.
1 In the reporting period the company redefined the classifications for Feeder / Mainliner. The figures for the previous year have been adjusted accordingly.
16 M a n a g e M e n t R e p o R t
H a p a g - L L o y d a k t i e n g e s e L L s c H a f t i f i n a n c i a L s t a t e M e n t s 2 0 1 8 a n d M a n a g e M e n t R e p o R t

As at 31 December 2018, Hapag-Lloyd had chartered-in 3 ships mainly for the repositioning of
empty containers. The transport capacity of these 3 ships was approximately 13,000 TEU in
total. The ships are not deployed in a liner service and are therefore not included in the display
of the fleet structure. There are no orders for newbuilds as at the balance sheet date. Since the
merger, Hapag-Lloyd has had a very young and efficient fleet. As a result, it will not be neces-
sary to invest in new ship systems in the short term. The existing fleet and cooperation with the
partners in THE Alliance will make it possible to utilise the short-term expansion opportunities
resulting from market growth and to realise economies of scale in ship operations. However, in
order to remain competitive in the medium term, the Executive Board of Hapag-Lloyd AG
believes that the Group will invest in new ship systems again at the appropriate time.
The efficiency of Hapag-Lloyd’s container ship fleet is reflected in the bunker consumption
data. Absolute bunker consumption rose as a result of the growth of the container ship fleet to
a total of 4,403,896 tonnes (previous year: 3,925,736 tonnes). Bunker consumption per slot (as
measured by the average annual container storage space) was 2.75 tonnes (previous year:
2.85 tonnes).
Bunker consumption of the Hapag-Lloyd Group
metric tons 2018 2017
MFO (High Sulphure) 3,841,488 3,416,770
MDO, MFO (Low Sulphure) 562,408 508,538
Total bunker consumption 4,403,896 3,925,308
Based on the total transport volume, the bunker consumption per TEU amounted to
0.37 tonnes (previous year: 0.40 tonnes per TEU).
Efficient transport services
In container liner shipping, the flow of goods to and from different regions varies in terms of
size and structure. This is due to volume differences in the import and export of goods. Most
trades therefore have a “dominant leg” with a higher cargo volume and a “non-dominant leg”
with a lower transport volume.
17M a n a g e M e n t R e p o R t
H a p a g - L L o y d a k t i e n g e s e L L s c H a f t i f i n a n c i a L s t a t e M e n t s 2 0 1 8 a n d M a n a g e M e n t R e p o R t

Imbalances in the world’s biggest trades
cargo volume
TTEU 2018 2017
Transatlantic trade
Europe – North America 3,289 3,162
North America – Europe 2,119 1,980
Far East trade
Asia – Europe 15,857 15,474
Europe – Asia 7,430 7,598
Transpacific trade
Asia – North America 20,307 19,158
North America – Asia 7,743 7,606
Source: Drewry Container Forecaster Q4 2018. Figures rounded
The transport capacities must be planned to meet the volumes on the dominant leg. The
return transport of empty containers also produces costs. The relevant performance indicator
here is the ratio of loaded containers on the dominant leg to the number of loaded containers
on the non-dominant leg. The objective is to keep the number of empty container transport
operations low or balance the ratio to the greatest possible extent. Furthermore, empty con-
tainers are repositioned into the regions with high demand via the shortest, quickest and
cheapest route.
Hapag-Lloyd reduces imbalances better than the market 1
Hapag-Lloyd AG Industry average
Transpacific 4.6 3.8
Atlantic 6.6 6.4
Europe – Far East 5.0 4.7
1 Number of full containers on the non-dominant leg per ten full containers on the dominant leg. (The higher the rate, the lower the imbalance in the respective trade.)
Source: Drewry Container Forecaster Q4 2018; Hapag-Lloyd 2018; figures as per Drewry’s definition of trades
The number of loaded containers transported on the non-dominant leg on the key trades is
well above the market average thanks to Hapag-Lloyd’s use of modern IT and network man-
agement systems.
Customers and customer orientation
With its new medium-term “Strategy 2023”, Hapag-Lloyd is aiming to differentiate itself further
from its competitors in the container liner shipping industry as a quality service provider. The
reliability and high quality that the customer experiences with Hapag-Lloyd services are at the
very heart of Hapag-Lloyd’s market presence. Top clients are supported by the Global Account
Management team in Hamburg and are visited by key account managers. This enables the
Company to establish and maintain long-standing, sustainable customer relationships. The
Key Account Programme also ensures that top regional clients receive particular care and
attention. In doing so, Hapag-Lloyd focuses on achieving a high degree of customer satisfac-
tion and on having a diversified portfolio of customers comprising both direct customers and
shipping companies, with the latter ensuring a permanent regular supply of cargo volumes.
18 M a n a g e M e n t R e p o R t
H a p a g - L L o y d a k t i e n g e s e L L s c H a f t i f i n a n c i a L s t a t e M e n t s 2 0 1 8 a n d M a n a g e M e n t R e p o R t

The Global Industry Management team pools expertise and develops customised solutions for
particular market segments, such as the chemical industry. There is also a special department
for looking after reefer customers on a global scale.
Contractual relationships of up to 12 months generally exist with direct customers. Direct
customers allow Hapag-Lloyd to plan the required transport capacity better because of the
framework agreements concluded with them. Hapag-Lloyd has a balanced customer base,
as demonstrated by the fact that its 50 largest customers represent considerably less than
50% of its cargo volume. In total, transports were completed for approximately 30,200 cus-
tomers in the 2018 financial year (previous year: approximately 32,400 customers).
With the successful launch of the Web Channel, Hapag-Lloyd established a new sales chan-
nel in the financial year 2018. After a pilot phase, the Web Channel was rolled out in August.
Approximately 6% of Hapag-Lloyd’s transport volume was booked through the Web Channel
in the fourth quarter of 2018.
A breakdown of the goods shipped according to product category shows a relatively balanced
distribution. No individual product category accounted for a share of over 16% during the past
financial year.
Transport volume by product category in 2018
Product category Share 2018
in %Share 2017
in %
Food products 16 16
Chemical Products 14 14
Plastik Products 14 13
Paper and wood products 10 10
Mechenical products 9 9
Raw materials 8 8
Textiles 8 8
Automotive parts 6 6
Electronic products 5 5
Furniture 5 5
Other products 5 6
Total 100 100
This means that the economic cycles affecting individual sectors have relatively little impact on
developments in the transport volume. In a normal economic environment, the volume trans-
ported will therefore increase continuously.
19M a n a g e M e n t R e p o R t
H a p a g - L L o y d a k t i e n g e s e L L s c H a f t i f i n a n c i a L s t a t e M e n t s 2 0 1 8 a n d M a n a g e M e n t R e p o R t
RESEARCH AND DEVELOPMENT
Hapag-Lloyd does not pursue any noteworthy research and development activities of its own.
Expenses relating to the modernisation and optimisation of the IT systems and software com-
ponents (IT) developed in-house are recorded in operating expenses. The IT system developed
by the Company is constantly being improved.
The use of modern, networked systems guarantees a swift exchange of data between partners
in the transport chain around the world. This places considerable demands on the IT systems
used. Some examples of how IT systems are used for container shipping are presented here:
operating empty legs as efficiently as possible using modern forecast algorithms as part of the
Company’s equipment deficit action planning, using IT-supported processes in yield manage-
ment to determine the earnings contribution of container shipments, writing quotations, profit-
oriented cargo volume management, and also designing new shipment services. Special IT
systems support the efficient commissioning and invoicing of terminal services. The use of effi-
cient IT solutions is also particularly important in trans-shipment planning and commissioning.
The IT systems are continuously being enhanced, and new opportunities which are currently
arising as a particular result of digitalisation are being identified. The Digital Channel & Incuba-
tion Unit (DCIU) was established in 2017. This DCIU specialist department works closely with
the various regions and the IT department to develop new, digitally available services and busi-
ness models.
The security of Hapag-Lloyd AG’s central IT systems is continuously monitored, managed and
improved. In addition, Hapag-Lloyd maintains continuous contact with external security
experts. To minimise potential future financial risks as a result of cyberattacks, the Company
entered into service agreements with external partners in the 2017 financial year which came
into effect in January 2018. The systems essential for ship operations are not connected to the
IT system on land, which means that there is currently no risk of cyberattacks on ships. A sep-
arate security review is conducted for the security of the operating systems on our ships.
20 M a n a g e M e n t R e p o R t
H a p a g - L L o y d a k t i e n g e s e L L s c H a f t i f i n a n c i a L s t a t e M e n t s 2 0 1 8 a n d M a n a g e M e n t R e p o R t

EMPLOYEES
Hapag-Lloyd AG employed 3,381 persons as at 31 December 2018 (previous year: 3,362 per-
sons). 1,155 people were employed in the marine division as at 31 December 2018 (previous
year: 1,142). The number of shore-based staff remained stable at 2,018 (previous year: 2,017).
The average tenure for shore-based staff is 13.3 years.
Number of employees 1
31.12.2018 31.12.2017 31.12.2016 31.12.2015 31.12.2014
Marine personnel 1,155 1,142 1,141 1,232 1,259
Shore-based personnel 2,018 2,017 1,814 1,805 1,529
Apprentices 208 203 218 225 201
Total 3,381 3,362 3,173 3,262 2,989
1 The figures from 2014 onwards relate to the Hapag-Lloyd Group, including CSAV´s container shipping activities. The figures for 2017 include UASC.
There is a strong focus on vocational training and qualifications for both the shore-based and
marine employees. Hapag-Lloyd attaches particular importance to extensive, high-quality
training. The proportion of those offered jobs at the end of their training is generally between
80 and 90% (2018: 82%). As at 31 December 2018, the Hapag-Lloyd AG employed a total of
120 apprentices in shore-based positions and 88 at sea (previous year: 120 shore-based and
83 at sea).
21M a n a g e M e n t R e p o R t
H a p a g - L L o y d a k t i e n g e s e L L s c H a f t i f i n a n c i a L s t a t e M e n t s 2 0 1 8 a n d M a n a g e M e n t R e p o R t

ECONOMIC REPORT
GENERAL ECONOMIC CONDITIONS
The pace at which the global economy grows and, by extension, at which global trade
expands is a significant factor that influences demand for container shipping services and
thus the development of the container shipping companies’ cargo volumes. According to
the International Monetary Fund (IMF, World Economic Outlook, January 2019), the global
economy grew by 3.7% in 2018 (previous year: 3.8%). In its latest economic outlook, the
IMF expects a global economic growth of 3.5% in 2019 and 3.6% in 2020.
Global economic growth was therefore slightly below the original prediction of 3.9% for 2018
(IMF, World Economic Outlook, January 2018). According to the IMF, the risk of a downturn
in global growth increased during the year. This downward correction reflects lower than
expected economic growth in industrialised countries in the first half of 2018. First negative
effects of the USA’s trade dispute with its trading partners were also becoming evident. In
addition, economic conditions deteriorated in some key developing and emerging markets,
such as Brazil and Turkey, which were suffering not just as a result of domestic issues but
also due to rising interest rates in the USA and the resulting outflow of capital.
According to the IMF, the volume of global trade, which is key to the demand for container
shipping services, grew by 4.0% in 2018 (previous year: 5.3%) and is forecast to increase by
4.0% in both 2019 and 2020. This means that global trade outpaced the global economy in
2018 and is likely to do so again in 2019 and 2020. At the beginning of 2018, the IMF forecast
growth in world trade volume of 4.6%. In the course of the year, the IMF initially raised its fore-
cast and then lowered it twice during the year (April 2018: +0.5 percentage points; July 2018:
–0.3 percentage points; October 2018: –0.6 percentage points) and a further time in January
2019 by –0.2 percentage points. Reasons were the deteriorating operating environment for
international trade, mainly as a result of the USA’s trade conflict with its trading partners, in
particular China but also the EU. In addition, sector-specific factors such as new emission
standards for the automobile industry lead to a slight deceleration in global trade growth.
Despite this clear drop in growth expectations, the predicted growth of 4.0% in both 2019
and 2020 is higher than the average level over the last 5 years (3.5%).
Developments in global economic growth (GDP) and world trading volume
in % 2020e 2019e 2018e 2017 2016 2015 2014
Global economic growth 3.6 3.5 3.7 3.8 3.3 3.5 3.6
Industrialised countries 1.7 2.0 2.3 2.4 1.7 2.3 2.1
Developing and newly industrialised countries 4.9 4.5 4.6 4.7 4.4 4.3 4.7
World trading volume (goods and services) 4.0 4.0 4.0 5.3 2.2 2.8 3.8
Source: IMF, January 2019
22 M a n a g e M e n t R e p o R t
H a p a g - L L o y d a k t i e n g e s e L L s c H a f t i f i n a n c i a L s t a t e M e n t s 2 0 1 8 a n d M a n a g e M e n t R e p o R t

SECTOR-SPECIFIC CONDITIONS
According to IHS Global Insight, the global cargo volume in 2018 was around 146 million TEU.
This is a rise of 4.0% on the previous year (IHS Global Insight, January 2019). As a result, the
growth rate was 0.9 percentage points below the increase of 4.9% originally forecast for 2018
(IHS Global Insight, November 2017). For 2019 IHS Global Insight is forecasting a rise of 4.7%
and for 2020 an increase of 4.9% to around 161 million TEU.
Development of global container transport volume, 2014 – 2023 in million TEU
2023e 2022e 2021e 2020e 2019e 2018e 2017 2016 2015 2014
million TEU 185 176 168 161 153 146 141 133 129 128
Growth rate in % 4.8 4.7 4.8 4.9 4.7 4.0 5.6 3.1 1.2 4.0
Source: IHS Global Insight, January 2019
Current forecasts put the expected compound annual growth rate (CAGR) for the period from
2019 to 2023 at 4.8%, compared with an average growth rate of around 3.6% between 2014
and 2018. Container shipping thus continues to be a growth industry.
According to IHS Global Insight, the anticipated growth will be spread relatively evenly across
the individual trades, with the strongest growth expected in the Middle East and the Indian
subcontinent trade.
Transport volume and growth rates for global container traffic per trade
(Volume 2018 in million TEU; in brackets: CAGR 2019 – 2023 in %)
Source: IHS Global Insight, January 2019
Fa
r E
ast
Fa
r E
ast
Latin America
North AmericaFar East
Intra FEME & ISC
Europe(incl. Med)
4.9 (+3.5%) 15.0 (+3.4%)
15.6 (+4.2%) 2.5 (+6.7%)2.5
(+3.7
%)
2.9 (+4.7%)
29.8 (+5.3%)
4.1 (+3.7%)
8.7 (+4.5%)
2.9 (+5.2%)
1.7 (+
2.8%
)2.5 (+3.7%)
1.8 (+4.4%)
3.4 (+2.8%) 6.7 (+4.0%)
Global Container Trade: 146 million TEU (+4.8%)
23M a n a g e M e n t R e p o R t
H a p a g - L L o y d a k t i e n g e s e L L s c H a f t i f i n a n c i a L s t a t e M e n t s 2 0 1 8 a n d M a n a g e M e n t R e p o R t

While the rate of global trade growth determines the demand for container shipping services,
putting new vessels into service and scrapping inefficient, older ones are the most important
factors influencing the supply of transport capacities. Supply has grown at a faster pace than
demand in recent years as a result of new and particularly large container ships continually
being put into service. Freight rates thus reached a record low in the second quarter of 2016.
Despite the continuous increase in the supply of transport capacity, freight rates made a
strong recovery from the lows recorded, due to the growing global demand for container
transport services in 2018.
At the end of 2018, the aggregate capacity of the global container ship fleet was approximately
21.9 million TEU (Drewry Container Forecaster Q4 2018, December 2018), a rise of 5.4% on
the previous year. Based on the container ships on order and planned deliveries, the globally
available transport capacity should see an increase of around 0.5 million TEU in 2019 (+2.5%)
(Drewry Container Forecaster Q4 2018, December 2018). This includes the expected delays of
deliveries in 2019 and the expected scrapping. While the scrapping of old ships was at a very
low level of approximately 100,000 TEU in 2018, scrapping is expected to increase to around
450,000 TEU in 2019. The idle fleet consisted of 179 ships with a capacity of around 0.6 mil-
lion TEU at the end of 2018. The majority of the idle fleet comprised smaller ship sizes of up
to 5,100 TEU.
The tonnage of the commissioned container ships of approximately 2.5 million TEU (MDS
Transmodal, January 2019) is equivalent to around 11% of the present global container fleet’s
capacity (approximately 21.9 million TEU). It therefore remains well below the highest level seen
to date, which was around 61% in 2007, and the average over the last 5 years (around 17%).
In 2018, orders were placed for the construction of 198 container ships with a transport cap-
acity totalling approximately 1.2 million TEU (Clarksons Research, January 2019). This means
that there was a significant increase in the number and capacity of newbuilds on order com-
pared with the previous year with orders for 117 container ships with a capacity of 0.8 million
TEU. While orders of newbuilds in 2016 and 2017 were below the average for the last 10 years
(around 1 million TEU), the figure for 2018 means that there was a relative increase again in
the number of new ships ordered to provide the capacity needed for the expected growth in
demand and to replace older and inefficient ships. Measured in terms of the transport capacity
of the newbuilds ordered, approximately 81% of the ships have a capacity of over 10,000 TEU
(MDS Transmodal, January 2019).
60% of the new ship capacity was delivered in the first half of 2018. In total, 164 container
ships with a capacity of 1.3 million TEU were put into service last year. 25 of the ships delivered
were bigger than 20,000 TEU (MDS Transmodal, January 2019).
24 M a n a g e M e n t R e p o R t
H a p a g - L L o y d a k t i e n g e s e L L s c H a f t i f i n a n c i a L s t a t e M e n t s 2 0 1 8 a n d M a n a g e M e n t R e p o R t

Expected development of global container fleet capacity
million TEU 2020 2019 2018 2017
Existing fleet (beginning of the year) 22.5 21.9 20.8 20.1
Planned deliveries 1.3 1.1 1.5 1.5
Scrappings 0.5 0.5 0.1 0.4
Postponed deliveries 0.1 0.1 0.3 0.4
Net capacity growth 0.7 0.5 1.1 0.8
Source: Drewry Container Forecaster Q4 2018. Figures rounded
Although the prospects for growth remain positive in the medium term, there may be tem-
porary imbalances in supply and demand, which could have a substantial impact on the
respective transport volumes and freight rates. For example, as additional larger ships with
a trans port capacity of more than 15,000 TEU go into service, transport capacities increase
sharply, negatively affecting the development of freight rates in all the trades.
Transport volumes and freight rates in container liner shipping are subject to seasonal fluctua-
tions. Demand for transport services is traditionally higher in the second and third quarter of
any given year.
The height of fuel costs in the shipping industry is largely linked to the development of the
crude oil price. This stood at USD 53.80 / barrel (Bloomberg) as at 31 December 2018 and
was therefore around 19% lower than at the beginning of the year (31 December 2017:
USD 66.57 / barrel). After the oil price reached its 2018 peak in October at 86.29 USD / barrel
(Bloomberg), it recorded a significant decline and ended the year at a much lower level than
anticipated at the beginning of the year.
Due to the regulations of the International Maritime Organization (IMO) to reduce sulphur diox-
ide emissions coming into effect in 2020, a large part of the world fleet will run on new low-
sulphur fuel with a sulphur content of 0.5% (currently 3.5%). This new fuel, which is currently
being developed by the refineries, has to be bunkered already in the fourth quarter of 2019 to
ensure that the new emission requirements are met by 2020. It is currently expected that this
new low sulphur bunker will be significantly more expensive than the currently mainly used fuel
According to current estimates, the price difference per ton could be around 250 USD. Ship-
ping companies will therefore face substantial additional costs beginning with the year-end
2019. These additional costs will have to be passed on to customers. Hapag-Lloyd, as well
as all other large container lines, have already published new calculation methods for the fuel
surcharges, which will be implemented over the course of the year 2019.
25M a n a g e M e n t R e p o R t
H a p a g - L L o y d a k t i e n g e s e L L s c H a f t i f i n a n c i a L s t a t e M e n t s 2 0 1 8 a n d M a n a g e M e n t R e p o R t

Consolidation of the industry and alliances in the container shipping market
In the past years, the container shipping industry has gone through a phase of significant
consolidation.
On 30 November 2017, the legal merger between Maersk Line A / S (Maersk) and Hamburg
Südamerikanische Dampfschifffahrts-Gesellschaft ApS & Co KG (Hamburg Süd) took place.
On 1 April 2018 the joint venture of the container shipping business of the 3 Japanese shipping
companies Kawasaki Kisen Kaisha Ltd. (“K” Line), Mitsui O. S. K. Lines Ltd. (MOL) and Nippon
Yusen Kabushiki Kaisha Ltd. (NYK) commenced operations as Ocean Network Express (ONE).
The joint venture integrates the container shipping business (including the terminal business
outside Japan) of the 3 companies. The company is headquartered in Singapore.
The takeover of Orient Overseas (International) Limited (OOIL), Hong Kong by the Chinese
shipping company COSCO Shipping (China) (COSCO) was executed on 13 July 2018, following
the approval by the majority of the shareholders of the takeover offer from COSCO dated 9 July
2018 and after all further prerequisites for the takeover had been met, OOIL is to remain listed
on the stock exchange in Hong Kong. With total transport capacity of 2.8 million TEU, COSCO
has therefore further strengthened its market position and is now the world’s third-largest con-
tainer shipping company, just ahead of CMA CGM.
On 8 August 2017, 14 Korean liner shipping companies signed a memorandum of understand-
ing, thereby founding the “Korean Shipping Partnership” (KSP). The initiative will be supported
by the Korean government and the Korea Shipowners Association and led by HMM.
According to data from MDS Transmodal (January 2019), the 10 largest container liner shipping
companies provide approximately 84% of the total capacity of the global fleet of container ships.
26 M a n a g e M e n t R e p o R t
H a p a g - L L o y d a k t i e n g e s e L L s c H a f t i f i n a n c i a L s t a t e M e n t s 2 0 1 8 a n d M a n a g e M e n t R e p o R t

Fleet capacity and market share of the top container liner shipping companies
in TTEU
Alliances are an essential part of the liner shipping industry as they enable a better utilisation of
the vessels and provide the opportunity for the shipping companies to provide a more exten-
sive service to customers. The following 3 alliances exist since the start of the second quarter
of 2017. Measured in terms of capacity the largest alliance is the “2M Alliance” consisting of the
two market leaders – Maersk (Denmark) and Mediterranean Shipping Company S. A. (Switzer-
land) (MSC). The “Ocean Alliance” consists of CMA CGM S. A. (France), including its subsidiary
APL (Singapore), COSCO, including its subsidiary OOIL (Hong Kong) and Evergreen Marine
Corp. Ltd. (Taiwan) (Evergreen) is the second biggest alliance. Hapag-Lloyd (Germany) oper-
ates THE Alliance in partnership with ONE (Singapore) and Yang Ming Marine Transport Corp.
Ltd. (Taiwan) (Yang Ming). As at 31 December 2018, THE Alliance covered all East-West trades
with 246 container ships and 30 services.
MSC, Maersk and Hyundai Merchant Marine Co., Ltd (Korea) (HMM) cooperate on the East-
West trades on the basis of a slot-chartering agreement.
Source: Drewry Container Forecaster Q4 2018; MDS Transmodal January 2018
4.0
3.2
2.82.6
1.6 1.51.2
0.60.4 0.4
Mae
rsk
MS
C
CO
SC
O
CM
A /
CG
M
Hap
ag-L
loyd
ON
E
Eve
rgre
en
Yang
Min
g
PIL
Hyu
ndai
2013
2018
18% 15% 13% 12% 8% 7% 6% 3% 2% 2%
Global capacity share in %
■ Top 10
■ Remaining
39 16
61 84
27M a n a g e M e n t R e p o R t
H a p a g - L L o y d a k t i e n g e s e L L s c H a f t i f i n a n c i a L s t a t e M e n t s 2 0 1 8 a n d M a n a g e M e n t R e p o R t

Since September 2018, ZIM Integrated Shipping Services Ltd (Israel) (ZIM) cooperates with
the 2M Alliance on the route between Asia and the US east coast. The partners jointly operate
5 services, with the 2M Alliance partners Maersk and MSC providing 4 services and ZIM pro-
viding one. The partnership is based on slot swapping on all 5 services. In January 2019, ZIM
and the 2M Alliance announced to extend their cooperation towards the Asia – East Mediter-
ranean Sea and the Asia – North-West Pacific Coast America trade. Four joint services are
expected be offered in these trades from March 2019 onwards.
THE Alliance members Hapag-Lloyd, ONE and Yang Ming cooperate since December 2018
with CMA-CGM, COSCO and OOCL on the route between the Mediterranean Sea and the
US east coast. The joint service, which has been available since December 2018, replaces the
existing separate services offered by each of the companies and will provide customers with
a more efficient and improved service using bigger ships.
In October 2018, the shipping companies Hapag-Lloyd and ONE entered into a bilateral agree-
ment for a feeder network partnership. As part of the strategic partnership, the two companies
will share the capacities of their existing feeder networks.
In January 2019, the Ocean Alliance members extended their cooperation ahead of time. The
cooperation was initially planned to last 5 years and was extended to 10 years until 2027.
Capacity share of alliances in East–West trades
Alliance Far East trade Transpacific trade Atlantic trade
2M in % 40 25 50
Ocean Alliance in % 36 42 11
THE Alliance in % 23 27 34
Other in % 1 6 5
Source: Alphaliner, December 2018
Report on the development of the Hapag-Lloyd Group and the Hapag-Lloyd AG
in 2018 compared with the forecast
The main differences between the factors influencing the operating result of Hapag-Lloyd AG
and the Group are the applicable accounting standards (IFRS and HGB) and the different func-
tional currencies (euro and US dollar). In the following, reference is made to the forecast for
Hapag-Lloyd Group. Where comments do not relate to Hapag-Lloyd Group, reference is made
explicitly to Hapag-Lloyd AG.
The transport volume rose by 21.1% in the reporting period, driven mainly by the integration of
UASC. As such, the forecast of a “clearly increasing” transport volume met. As a result of the
5.4% increase, as expected, in the capacity of the container ship fleet in 2018, freight rates
remained under pressure. Hapag-Lloyd’s average freight rate was maintained at roughly the
same level as in the previous year, decreasing slightly in 2018 to USD 1,044 / TEU (USD
-16 / TEU). The development of the freight rate was therefore as expected. It should be noted
that UASC had a structurally lower average freight rate than Hapag-Lloyd due to a different
trade mix. This has impacted the development of Hapag-Lloyd Group’s freight rate after the
date of consolidation.
28 M a n a g e M e n t R e p o R t
H a p a g - L L o y d a k t i e n g e s e L L s c H a f t i f i n a n c i a L s t a t e M e n t s 2 0 1 8 a n d M a n a g e M e n t R e p o R t

Based on developments in the first five months of the 2018 financial year and the expected
further business performance, the Executive Board of Hapag-Lloyd AG decided on 29 June
2018 to adjust the original outlook for the Group’s EBIT and EBITDA for the current 2018 finan-
cial year (previous outlook for both key indicators: clearly increasing). The reason for that was
an unexpectedly significant and continuing increase in operating costs since the beginning of
the year, especially with regard to fuel-related costs and charter rates, combined with a slower
than expected recovery of freight rates. It was not possible to fully offset these developments
through cost-saving measures that had already been initiated.
Against this background and the continuing uncertainty regarding the development of freight
rates in the upcoming peak season, the revised outlook for the 2018 financial year now
assumed an EBIT in a range between EUR 200 million and EUR 450 million (EBIT as at
31 December 2017: EUR 411.4 million) and an EBITDA in a range between EUR 900 million
and EUR 1,150 million (EBITDA as at 31 December 2017: EUR 1,055.0 million).
The clear increase in the average bunker consumption price was more than offset by the
rise in the transport volume and the synergies from the integration of UASC. The synergies
achieved in 2018 as a result of the merger with UASC were above initial expectations. The
forecasts for an EBIT in a range between EUR 200 million and EUR 450 million and an
EBITDA in a range between EUR 900 million and EUR 1,150 million were therefore also
achieved.
Value 2018
Value 2017
Change Forecast in the half-year financial report as at 30.06.2018
Forecast in the Group manage-ment report as at 31.12.2017
transport volume (tteU)
11,874 9,803 +21.1% Increasing clearly Increasing clearly
average bunker consumption price (Mfo+Mdo, Usd / mt)
421 318 +103 Increasing clearly Increasing clearly
average freight rate Hapag-Lloyd (Usd / teU)
1,044 1,060 –1.5% On previous year´s level
On previous year´s level
eBitda (million eUR) 1,138.1 1,055.0 +83.1 900 – 1,150 million EUR
Increasing clearly
eBit (million eUR) 443.0 411.4 +31.6 200 – 450 million EUR
Increasing clearly
Note: For the financial year 2018, revenue for ancillary services in Latin America and Turkey was included in the calculation of freight rates. The previous year’s values have been adjusted accordingly.
29M a n a g e M e n t R e p o R t
H a p a g - L L o y d a k t i e n g e s e L L s c H a f t i f i n a n c i a L s t a t e M e n t s 2 0 1 8 a n d M a n a g e M e n t R e p o R t

Development of Hapag-Lloyd AG
The result from operating activities of Hapag-Lloyd AG was also negatively impacted by the
significant increase in the average bunker consumption price. As a result, Hapag-Lloyd AG’s
earnings development fell short of initial expectations at the beginning of the year. In addition,
the strengthening of the US dollar against the euro at the balance sheet date contributed to
a significant burden on earnings at Hapag-Lloyd AG level.
Development of strategic projects
The achievement of synergies from the integration with UASC was one area of focus in 2018.
This achievement of synergies exceeds the initial plan. It was anticipated that the synergies
from the merger with UASC will contribute approximately USD 435 million per annum from the
2019 financial year onwards, whereas the Executive Board of Hapag-Lloyd AG expected to
achieve approximately 90% of the synergies by the end of the financial year 2018. At the time
of the preparation of the Annual Report, Hapag-Lloyd already realised the full run rate of
synergies.
Notwithstanding the intense competitive environment, the Executive Board considered the
Hapag-Lloyd Group’s economic position to be robust at the time that the management report
was being prepared. With its portfolio of services and current financial profile, the Hapag-Lloyd
Group is well positioned and has clearly strengthened its market position as a result of the
merger with UASC. The Executive Board of Hapag-Lloyd is convinced that the implementation
of Strategy 2023 will also make a key contribution towards ensuring that Hapag-Lloyd can
defend this strong market position in the medium term as well. Business has developed in
accordance with expectations in the first few weeks of 2019.
EARNING, FINANCIAL AND NET ASSET POSITION
The earnings and financial position are only comparable with the previous year to a limited
degree, as the integration of UASC’s operating business did not occur until the third quarter
of 2017.
EARNINGS POSITION
Hapag-Lloyd’s performance in the 2018 financial year was once again dominated by the
challenges in the container shipping industry.
Global economic growth stood at 3.7% in 2018 (previous year: 3.8%), which was slightly
below the IMF’s original forecasts (+3.9% January 2018).
30 M a n a g e M e n t R e p o R t
H a p a g - L L o y d a k t i e n g e s e L L s c H a f t i f i n a n c i a L s t a t e M e n t s 2 0 1 8 a n d M a n a g e M e n t R e p o R t

The average freight rate was lower than had been expected at the start of the year due to per-
sistently strong competition and, in particular, due to developments in the first half of 2018.
However, freight rate increases in the second half of the year played a part in an initial recovery.
Furthermore, the transport volume increased significantly, and this, together with the synergy
effects from the merger with UASC, had a positive impact on the earnings position. However,
the development of the US dollar / euro exchange rate along with the considerable rise in the
average bunker price reduced earnings considerably in the 2018 financial year. As at 31 De -
cem ber 2018, the US dollar exchange rate was quoted as USD 1.15 / EUR and was much
stron ger than in the previous year (USD 1.20 / EUR) resulting in a substantial negative impact
on earnings at the reporting date due to the valuation of loans and liabilities primarily quoted in
US dollars. Simultaneously, there was also a negative impact on earnings as a result of the
weaker quotation of the average US dollar / euro exchange rate than in the previous year (2018:
USD 1.18 / EUR; previous year: USD 1.13 / EUR). These changes in the exchange rate reduced
earnings from operating activities by EUR 211.3 million overall. In total, Hapag-Lloyd AG
recorded a net loss of EUR 187.0 million in the 2018 financial year (previous year: net profit
of EUR 414.0 million).
Notes to the income statement
million EUR 1.1. – 31.12.2018 1.1. – 31.12.2017
Revenue 11,555.4 9,576.9
Decrease / increase in capitalised expenses for unfinished voyages 2.4 5.4
Other own work capitalised 2.8 0.0
Other operating income 812.6 1,094.6
Transport expenses –10,052.3 –8,136.0
Personnel expenses –277.4 –266.5
Depreciation, amortisation and impairment –433.8 –383.5
Other operating expenses –1,644.0 –1,283.0
Operating result –34.3 607.9
Financial result –120.2 –166.4
thereof interest result –198.4 –213.0
Taxes on income –5.3 –6.4
Result after taxes –159.8 435.1
Other taxes –27.2 –21.1
Net gain or loss for the year –187.0 414.0
Retained earnings brought forward 422.2 108.4
Withdrawal from the capital reserve 0.0 0.0
Balance sheet profit 235.2 522.4
EBIT 12.2 627.9
EBIT margin (%) 0.1 6.6
EBITDA 446.0 1,011.4
EBITDA margin (%) 3.9 10.6
The average freight rate for Hapag-Lloyd AG in the 2018 financial year was USD 1,038 / TEU,
which was USD 21 / TEU less than in the previous year (USD 1,059 / TEU). Besides the integra-
tion of UASC’s operational business units, which had a lower freight rate level overall, the main
reason for the decline was the ongoing competitive market environment, with a high influx of
new capacity, especially during the first half of the year.
31M a n a g e M e n t R e p o R t
H a p a g - L L o y d a k t i e n g e s e L L s c H a f t i f i n a n c i a L s t a t e M e n t s 2 0 1 8 a n d M a n a g e M e n t R e p o R t

Freight rate increases in the Atlantic, Transpacific, Latin America and EMAO trades had a posi-
tive effect on the average freight rate and consequently on the earnings in the reporting period.
However, freight rate decreases in the Middle East, Intra-Asia and Far East trades had a coun-
ter effect.
Freight rates per trade
USD / TEU 1.1. – 31.12.2018 1.1. – 31.12.2017
Atlantic 1,316 1,285
Transpacific 1,269 1,253
Far East 908 951
Middle East 758 866
Intra Asia 512 573
Latin America 1,125 1,049
EMAO (Europe, Mediterranean, Africa, Oceania) 1,099 1,066
Total (weighted average) 1,038 1,059
The transport volume increased from 8,958 TTEU to 11,750 TTEU in the last financial year. The
significant rise in the transport volume of 31.2% is primarily due to the fact that the integration
of UASC’s operating business did not take place until part way through the 2017 financial year.
As a result, the previous year’s figures do not include the transport volumes generated by
UASC prior to its integration.
Transport volume per trade
TTEU 1.1. – 31.12.2018 1.1. – 31.12.2017
Atlantic 1,820 1,648
Transpacific 1,959 1,613
Far East 2,086 1,243
Middle East 1,473 795
Intra Asia 1,045 771
Latin America 2,690 2,362
EMAO (Europe, Mediterranean, Africa, Oceania) 677 526
Total 11,750 8,958
Revenue grew by 21.1% to EUR 11,555.4 million (previous year: EUR 9,576.9 million) in the
2018 financial year. This was primarily due to the growth in transport volumes as a result of
integrating UASC’s operational business and to the generally positive development of volumes.
The lower average freight rate had the opposite effect on revenue.
Other operating income fell from EUR 1,094.6 million to EUR 812.6 million in the reporting
year. The main reason for this was lower exchange rate gains compared to the prior year
period in the amount of EUR 668.2 million (previous year: EUR 903.2 million). These primarily
resulted from the measurement of foreign currency loans and foreign currency liabilities with
affiliated companies due to the change in the USD / EUR exchange rate. In addition, income
from the release of provisions for outstanding invoices dropped by EUR 60.1 million.
32 M a n a g e M e n t R e p o R t
H a p a g - L L o y d a k t i e n g e s e L L s c H a f t i f i n a n c i a L s t a t e M e n t s 2 0 1 8 a n d M a n a g e M e n t R e p o R t

In the 2018 financial year, transport expenses rose by EUR 1,952.6 million to EUR 10,052.3
million (previous year: EUR 8,136.0 million), representing an increase of 24.1%. That is due to
increased bunker prices and partially due to the integration of UASC’s operational business
and the related growth in transport volumes. The increase in expenses for raw materials and
supplies of EUR 541.4 million to EUR 1,619.8 million primarily resulted from the higher bunker
price. In the 2018 financial year, the Hapag-Lloyd Group’s average bunker consumption price
was USD 421 per tonne, which was a significant USD 103 per tonne above the price of the
prior year period (USD 318 per tonne). At EUR 8,432.5 million, the cost of purchased services
was significantly up by EUR 1,411.2 million year-on-year, due to the increase in transport
volumes.
Personnel expenses rose by 4.1% year-on-year to EUR 277.4 million (previous year: EUR 266.5
million). The increase essentially relates to pension costs, which rose from EUR 16.8 million to
EUR 24.4 million due in particular to the decrease in the ten-year average rate used for dis-
counting pension obligations. As at 31 December 2018, a total of 3,381 people (including
apprentices) were employed at Hapag-Lloyd (previous year: 3,362). At 2.4%, there was only
a slight drop in the personnel expenses ratio compared to the 2017 financial year (previous
year: 2.8%).
Depreciation, amortisation and impairment of EUR 433.8 million was recorded in the 2018
financial year (previous year: EUR 383.5 million). The increase of depreciation mainly resulted
from the EUR 32.8 million increase in depreciation on containers and from the EUR 16.5 million
increase in the impairment of goodwill. This was due in particular to the fact that the contai-
ners acquired from UASC Ltd. and the goodwill which resulted from the acquisition of UASC’s
business operations were not incorporated until 1 July 2017, meaning that depreciation and
impairment recognised for them in the previous year only pertained to half of the year.
Other operating expenses increased year-on-year by EUR 361.0 million to EUR 1,644.0 million
(previous year: EUR 1,283.0 million). The main reason for this was significantly higher exchange
rate losses, including bank charges, totalling EUR 884.2 million (previous year: EUR 567.0 mil-
lion). These were largely due to the valuation of liabilities and loans denominated in USD on the
reporting date and to exchange rate effects of currency forward contracts. Netted, the ex -
change rate-related other operating income and other operating expenses decreased earnings
by EUR 211.3 million (previous year: positive earnings contribution of EUR 342.8 million). Other
operating expenses also comprise commission expenses and selling expenses totalling
EUR 480.2 million (previous year: EUR 431.8 million) and EDP expenses of EUR 123.1 million
(previous year: EUR 100.3 million).
The operating result in the last financial year was EUR –34.3 million (previous year: EUR 607.9
million). Earnings before interest and taxes also include income from profit transfer agree-
ments, income from investments, amortisation of financial assets and marketable securities,
expenses from the transfer of losses and other taxes and came to EUR 12.2 million as at
the balance sheet date (previous year: EUR 627.9 million). Compared to the Group’s EBIT of
EUR 443.0 million, the German Commercial Code (HGB) earnings are significantly lower.
33M a n a g e M e n t R e p o R t
H a p a g - L L o y d a k t i e n g e s e L L s c H a f t i f i n a n c i a L s t a t e M e n t s 2 0 1 8 a n d M a n a g e M e n t R e p o R t

This was primarily caused by negative exchange rate effects from the translation of financial
liabilities due to the development of the US dollar / euro exchange rate and by the inclusion of
subsidiary earnings in the Group. Earnings before interest, taxes, depreciation and amortisa-
tion (EBITDA) came to EUR 446.0 million (previous year: EUR 1,011.4 million) and were signifi-
cantly lower than the figure for the Group, unlike in the previous year (EUR 1,138.1 million;
previous year: EUR 1,054.5 million). The main reasons for this substantial difference are the
same as those mentioned above, although the impact of including the subsidiary result in the
Group is significantly greater due to the fact that depreciation, amortisation and impairment
were not taken into consideration.
In the 2018 financial year, the financial result improved by EUR 46.2 million to EUR –120.2 mil-
lion (previous year: EUR –166.4 million). The main reasons for this were the increase in income
from investments from EUR 41.2 million to EUR 72.5 million and lower interest expenses of
EUR 222.9 million (previous year: EUR 239.1 million). The decrease in interest expenses is
associated with the reduction in financial debt (see Financial and net asset position).
A net loss for the financial year of EUR 187.0 million was reported for the 2018 financial year
(previous year: net profit for the financial year of EUR 414.0 million). Including retained earnings
carried forward of EUR 422.2 million after distribution of a dividend (EUR 100.2 million), the
Company recorded retained earnings of EUR 235.2 million (previous year: EUR 522.4 million).
FINANCIAL POSITION
Principles and objectives of financial management
Hapag-Lloyd AG’s financial management aims to ensure the permanent solvency of the
Company and thus its ability to maintain financial stability at all times. In addition to making
sure there is a sufficient supply of liquidity, financial risks are limited by means of the hedging
of net positions in foreign currency, the use of derivative financial instruments (currencies,
interest and bunker), the implementation of a cash pooling system and the optimisation of
loan conditions.
Maintaining an appropriate minimum liquidity level is a deciding factor. Efficient financial man-
agement is primarily based on optimising short and medium-term cash outflows. This is based
on budgetary planning for a number of years and a rolling monthly liquidity plan that spans a
period of one year. Hapag-Lloyd AG secures its short-term liquidity reserve by means of syndi-
cated credit facilities and bilateral bank loans, as well as its portfolio of cash and cash equiva-
lents. Financial management is carried out within the framework of relevant legislation as well
as internal principles and regulations.
34 M a n a g e M e n t R e p o R t
H a p a g - L L o y d a k t i e n g e s e L L s c H a f t i f i n a n c i a L s t a t e M e n t s 2 0 1 8 a n d M a n a g e M e n t R e p o R t

The Hapag-Lloyd Group is an international company that is active around the world. It is
exposed to operational financial transaction risks which result from the business operations
of Hapag-Lloyd AG. In particular, these risks include bunker price change risk, currency risk
and interest rate risk.
Changes in commodity prices have an impact on the Hapag-Lloyd Group, particularly with
regard to the cost of procuring fuel such as bunker oil. Insofar as it is possible to pass bunker
price changes on to the customer based on contractual agreements. Remaining price risks
arising from fuel procurement are partly hedged using derivative hedging transactions.
The transactions of the Group companies are conducted mainly in US dollars. The euro (EUR),
Indian rupee (INR), Brazilian real (BRL), Chinese renminbi (CNY), Canadian dollar (CAD), British
pound sterling (GBP), Australian dollar (AUD), Japanese yen (JPY) and United Arab Emirates
dirham (AED) are also significant currencies.
For Hapag-Lloyd AG transaction risks especially from US dollar dominated financial debts
exists while currency risks within the Group arise out from the financial debt taken up in EUR.
To hedge euro exchange rate risks, derivative hedging transactions are concluded, the hedg-
ing effect of which is only felt within the Group. Interest rate risks which arise as a result of
liquidity procurement on the international money and capital markets are centrally managed
within the scope of interest rate management and are partially limited using derivative interest
rate hedging instruments on a case-by-case basis.
The use of derivative hedging is strictly transaction-related; derivatives are not used for specu-
lation purposes. Other disclosures about hedging strategies and risk management, and about
financial transactions and their scope as at the balance sheet date, can be found in the risk
report section of the management report (see fuel price risks, currency risks and interest rate
risks).
Issuer ratings
Rating / Outlook 31.12.2018 31.12.2017
Standard & Poor’s B+ / Stable B+ / Stable
Moody’s B2 / Stable B2 / Stable
The international rating agency Standard & Poor’s reaffirmed its issuer rating for Hapag-Lloyd
AG, awarding the Company a rating of B+ with a stable outlook. The rating agency Moody’s
also maintained the corporate rating at B2 with a stable outlook. On 18 February 2019
Moody’s increased their rating for Hapag-Lloyd AG to B1 with a stable outlook.
35M a n a g e M e n t R e p o R t
H a p a g - L L o y d a k t i e n g e s e L L s c H a f t i f i n a n c i a L s t a t e M e n t s 2 0 1 8 a n d M a n a g e M e n t R e p o R t

Financing
Hapag-Lloyd AG covers its financing requirements with cash inflows from operating activities
and by assuming short, medium and long-term financial debt.
The financing mix in terms of borrowing is designed to optimise financing conditions, create
a balanced range of maturities and achieve investor diversification.
The focus in the 2018 financial year was on the financing of investments in containers and the
implementation and restructuring of financing as part of efforts to optimise the existing capital
structure and cost.
Financing and investing activities
The Company executed the following major financing and investing activities in the 2018
reporting year:
Container
• During 2018 Hapag-Lloyd ordered new container equipment to the amount of
USD 373.1 million. The main part of the ordered containers were delivered in the report-
ing year while the remaining containers should arrive in the first quarter of 2019.
• For the refinancing of these investments, Hapag-Lloyd entered into several sale and lease-
back transactions in the second half of the year in a volume of EUR 195.0 million. The newly
acquired containers were sold to groups of investors on the basis of Japanese operating
leases and leased back in the same moment for seven or eight years, with the option of
repurchasing the equipment upon their respective maturity. The lease agreements are
essentially a form of borrowing, secured by the assignment of containers and other rights
as security.
• In September 2018, Hapag-Lloyd fully repaid container financing with UASC (finance lease)
in the amount of EUR 59.4 million so that UASC could repay its corresponding financial debt
to the bank early. Subsequently the ownership of the respective container equipment was
transferred to Hapag-Lloyd. For the purpose of refinancing the prepayment Hapag-Lloyd
entered into a Sale-and-Lease-Back transaction in form of a Japanese operating lease in
an amount of EUR 66.9 million.
• In December 2018, container financing of EUR 46.8 million obtained in 2012 was repaid in
full using cash in order to reduce current interest costs.
Vessels
• The development of used-market prices for container ships resulted in deficits in the loan-
to-value ratios, prompting Hapag-Lloyd to make early repayments of EUR 8.2 million in the
reporting year at the request of lending banks.
36 M a n a g e M e n t R e p o R t
H a p a g - L L o y d a k t i e n g e s e L L s c H a f t i f i n a n c i a L s t a t e M e n t s 2 0 1 8 a n d M a n a g e M e n t R e p o R t

Investments
• On 14 August 2018, Hapag-Lloyd AG acquired the business operations of its third-party
agent in Egypt. The resulting financial obligation was worth EUR 10.2 million at the trans-
action date. Thereof, the significant part is contractually fixed and long-term. Besides, the
variable part of the purchase price is variable and dependent on the prospective quantity
development of the agent.
• On 17 October 2018, the shares in a minority investment held by Hapag-Lloyd AG were
sold. This generated sales proceeds of EUR 5.9 million.
Credit facilities
• A credit facility to finance investments in containers of USD 210.0 million was utilised sev-
eral times during the financial year. A total of EUR 262.7 million was utilised in the reporting
year. The amounts paid out from this facility were fully repaid again in 2018, with the result
that this credit facility was unutilised at the end of the year.
• Other existing credit facilities were not utilised either.
Covenant clauses of a type customary on the market have been arranged for existing financing
from bonds or loans. These clauses primarily concern equity and liquidity at the Hapag-Lloyd
Group level along with certain loan-to-value ratios for the financing of ship investments. As at
31 December 2018, all of the covenants were fulfilled. Based on current planning, the Execu-
tive Board expects that these covenants will also be adhered to during the subsequent period.
As of 1 January 2019 the new IFRS 16 standard on Leases have to be applied for the Hapag-
Lloyd Group. The accounting of the right of use and the respective lease liabilities will lead to a
balance sheet extension for the Hapag-Lloyd Group, and therefore to a reduction of the equity
ratio. As a consequence, in the financing contracts the terms and conditions of a loan have
been adjusted regarding the minimum equity ratio on group level (Financial covenants). Adjust-
ments have been made to neutralise the impact of IFRS 16. The executive board expects that
the application of IFRS 16 does not have an impact on the ability to meet the conditions with
respect to the minimum equity ratio on group level.
Liquidity analysis
Hapag-Lloyd AG’s solvency was fully guaranteed at all times in the last financial year by cash
inflows from operating activities, a portfolio of cash and cash equivalents, and syndicated
credit facilities. The Company had a liquidity reserve (consisting of cash, cash equivalents and
unused credit facilities) totalling EUR 916.4 million as at 31 December 2017 (previous year:
EUR 776.9 million). At the balance sheet date, a sum totalling EUR 10.4 million with a term of
up to three months was deposited in pledged accounts (previous year: EUR 9.4 million) and
was therefore subject to a limitation on disposal.
37M a n a g e M e n t R e p o R t
H a p a g - L L o y d a k t i e n g e s e L L s c H a f t i f i n a n c i a L s t a t e M e n t s 2 0 1 8 a n d M a n a g e M e n t R e p o R t

Off-balance-sheet obligations
While orders for containers were placed in the 2018 financial year, there were no new orders
for ships. As at 31 December 2018, Hapag-Lloyd had purchase commitments for containers of
EUR 33.4 million as well as investments in exhaust gas cleaning systems (EGCS) on container
ships with an amount of EUR 11.2 million. As at 31 December 2017, there were no substantial
orders. In the course of its normal business activities, Hapag-Lloyd AG uses assets of which it
is not the beneficial owner. These are, in particular, vessels and containers which are let within
the framework of rental, lease and charter agreements as are customary in the industry.
A detailed presentation of the other financial obligations is provided in the Notes to the annual
financial statements (Note (13)).
NET ASSET POSITION
million EUR 31.12.2018 31.12.2017
Fixed assets 8,167.6 8,310.1
thereof property, plant and equipment 5,171.6 5,239.0
Current assets 1,895.8 1,580.6
thereof cash-in-hand, bank balances and cheques 440.5 322.3
Prepaid expenses 8.7 11.3
Excess of plan assets over post-employment benefit liability 0.0 0.0
Assets 10,072.1 9,902.0
Equity 2,908.9 3,196.1
Provisions 964.3 745.1
Financial liabilities 2,179.4 2,485.6
thereof short-term 226.9 319.3
Other liabilities 4,010.6 3,463.2
thereof short-term 2,171.4 2,295.6
Deferred income 8.9 12.0
Equity and liabiltities 10,072.1 9,902.0
Net financial position (liquid assets – financial debt) –1,738.9 –2,163.3
Equity ratio (equity / total assets) 28.9% 32.3%
Compared to the previous year, Hapag-Lloyd AG’s balance sheet total increased by
EUR 170.1 million to EUR 10,072.1 million (previous year: EUR 9,902.0 million). While cur-
rent assets rose from EUR 1,580.6 million to EUR 1,895.8 million, fixed assets dropped
by EUR 142.5 million to EUR 8,167.6 million (previous year: EUR 8,310.1 million).
38 M a n a g e M e n t R e p o R t
H a p a g - L L o y d a k t i e n g e s e L L s c H a f t i f i n a n c i a L s t a t e M e n t s 2 0 1 8 a n d M a n a g e M e n t R e p o R t

Within fixed assets, intangible assets fell from EUR 1,182.2 million to EUR 1,113.3 million and
property, plant and equipment decreased from EUR 5,239.0 million to EUR 5,171.6 million. The
decrease in intangible assets resulted primarily from the scheduled amortisation of goodwill
in the amount of EUR 72.2 million. The change in property, plant and equipment primarily
comprises investments of EUR 301.9 million in containers (EUR 802.3 million). This effect was
offset by depreciation on ships and containers totalling EUR 356.6 million (previous year:
EUR 322.2 million) and disposals of containers at their carrying amount of EUR 17.4 million.
Due to the greater volume of business, current assets increased by EUR 315.2 million year-
on-year to EUR 1,895.8 million (previous year: EUR 1,580.6 million).
Accounts receivable and other assets amounted to EUR 1,082.2 million (previous year:
EUR 921.2 million). In addition to trade accounts receivable totalling EUR 404.0 million (previ-
ous year: EUR 327.7 million), they primarily included accounts receivable from affiliated com-
panies in the amount of EUR 493.9 million (previous year: EUR 433.0 million).
Inventories increased from EUR 337.1 million to EUR 373.1 million primarily as a result of a
volume-related rise in bunker supplies.
Cash and cash equivalents totalled EUR 440.5 million at the balance sheet date (previous year:
EUR 322.3 million). Further details of cash inflows and outflows are provided in the explanatory
notes to financing activities under Financial position.
As at 31 December 2018, Hapag-Lloyd AG had equity totalling EUR 2,908.9 million (previous
year: EUR 3,196.1 million). The negative year-on-year change was partly due to a net loss
for the year of EUR 187.0 million (previous year: net profit for the year of EUR 414.0 million)
and partly due to a distribution from the previous year’s retained earnings in the amount of
EUR 100.2 million. Including remaining retained earnings carried forward from the previous
year of EUR 422.2 million, as at 31 December 2018 there were retained earnings of
EUR 235.2 million (previous year: EUR 522.4 million).
Provisions rose from EUR 745.1 million to EUR 964.3 million in the reporting period. This was
in particular attributable to the increase of EUR 115.0 million in provisions for outstanding
invoices and the allocation of EUR 63.7 million in provisions for onerous currency forward con-
tracts. The provisions as at the balance sheet date included provisions for pensions and similar
obligations totalling EUR 168.8 million (previous year: EUR 144.1 million), tax provisions in the
amount of EUR 0.6 million (previous year: EUR 7.5 million) and other provisions of EUR 794.9
million (previous year: EUR 593.5 million).
39M a n a g e M e n t R e p o R t
H a p a g - L L o y d a k t i e n g e s e L L s c H a f t i f i n a n c i a L s t a t e M e n t s 2 0 1 8 a n d M a n a g e M e n t R e p o R t

Financial liabilities came to EUR 2,179.4 million at the balance sheet date (previous year:
EUR 2,485.6 million). They comprise bonds issued by Hapag-Lloyd AG and liabilities to banks.
The decrease in financial debt was primarily due the fact that repayments and early repay-
ments of debt in the reporting year (totalling EUR 597.8 million) exceeded new financing
(EUR 262.7 million). More detailed information on individual financing activities is provided
under Financial position. The balance sheet date valuation effects relating to financial liabilities
denominated in US dollars resulted in a EUR 28.6 million increase in financial liabilities.
Other liabilities increased from EUR 3,463.2 million to EUR 4,010.6 million. The main reason for
this was on the one hand the outpayments of the new sale and lease back transactions for
container in the amount of EUR 261.9 million. On the other hand, the liabilities to affiliated com-
panies increased from EUR 312.3 million to EUR 2,278.3 million. This was essentially due to
the increase of EUR 217.8 million in liabilities to UASC from its business operations and of
EUR 194.2 million in trade accounts payable to affiliated companies. The increase was partly
offset by the repayment of liabilities resulting from finance lease contracts for containers
between Hapag-Lloyd AG and UASC in the amount of EUR 117.9 million. This includes an early
repayment of EUR 59.4 million (see Financial position). In addition to liabilities to affiliated com-
panies and the liabilities from loans and other financial debt totalling EUR 985.3 million (previ-
ous year: EUR 806.8 million), other liabilities in particular comprise trade accounts payable in
the amount of EUR 600.6 million (previous year: EUR 527.4 million), and finance lease liabilities
in the amount of EUR 101.4 million (previous year: EUR 128.1 million).
EXECUTIVE BOARD’S STATEMENT ON OVERALL ECONOMIC PERFORMANCE
The growth in earnings of the 2018 financial year was below the Executive Board’s expecta-
tions at the beginning of the year, however in line with the on June, 29 2018 adjusted Outlook
for the financial year. Causes are the since the start of the year unexpected increase of opera-
tional cost, in particular bunker cost, combined with a later than expected recovery of freight
rates. As a result of the unchanged intense competition in the container shipping industry is
the freight rate development still volatile. Although freight rate increases in the second half of
the year contributed to an increase in average freight rates, they could not fully compensate
the year on year significantly increased bunker and other operating costs. The overall result
impact could be partially compensated due to the realisation of synergies from the UASC inte-
gration. The frameworks for economic development were despite the trade restrictions with
China not subject to any material changes, however.
40 M a n a g e M e n t R e p o R t
H a p a g - L L o y d a k t i e n g e s e L L s c H a f t i f i n a n c i a L s t a t e M e n t s 2 0 1 8 a n d M a n a g e M e n t R e p o R t

REPORT BY THE EXECUTIVE BOARD ON RELATIONSHIPS WITH AFFILIATED COMPANIES
The Executive Board of Hapag-Lloyd AG has prepared a report on relations with affiliated com-
panies for the period from 1 January to 31 December 2018 in accordance with Section 312 of
the German Stock Corporation Act (AktG), which contains the following concluding declara-
tion: “Our Company received appropriate compensation for each legal transaction listed in the
report on relationships to affiliated companies in accordance with the circumstances known to
us when the legal transactions were conducted. No measures required by or in the interests of
the controlling companies or their affiliated companies subject to a reporting obligation were
performed or omitted.”
RISK AND OPPORTUNITY REPORT
Risk management and the strategic focus on business opportunities are designed to enhance
the Company’s value by providing stable, long-term growth, to contribute to the attainment of
its medium-term financial goals and to ensure its long-term existence as a going concern. The
following information relates to the Hapag-Lloyd Group as well as the Hapag-Lloyd AG.
RISK MANAGEMENT
The objective of risk management is to recognise and assess risks of all kinds at an early stage
and promptly minimise them by taking appropriate steps. Thanks to monitoring and control
systems installed throughout the Group, business developments and their associated risks are
regularly recorded, assessed and monitored with regard to their effects on Hapag-Lloyd. Risk
management is decentralised in accordance with Hapag-Lloyd’s organisational structure.
Due to their overriding importance, however, strategic risks are generally identified at the top
management level and factored into medium and long-term planning. The management and
the Executive Board of Hapag-Lloyd evaluate the opportunities which result from market and
company developments on a regular basis.
The Executive Board and operational management have integrated multilevel reporting sys-
tems at their disposal for risk management purposes. The planning and controlling system,
for example, conducts a monthly analysis of how actual business developments have deviated
from planned developments, and uses this analysis to identify and report risks early on that
may jeopardise the operating result of the Company. As well as regular reporting on opera-
tional and financial risks, such as the development of freight rates, transport volumes and
liquidity, an additional autonomous reporting system is incorporated into the risk manage-
ment system (RMS) and includes measures to identify risks to the Company’s existence at
an early stage.
41M a n a g e M e n t R e p o R t
H a p a g - L L o y d a k t i e n g e s e L L s c H a f t i f i n a n c i a L s t a t e M e n t s 2 0 1 8 a n d M a n a g e M e n t R e p o R t

The principles, structures and processes of risk management are defined in a Group guide-
line which is valid for the entire organisation. The Group’s significant risk categories serve as a
basis for specifying the structures and responsibilities within the entire process. Furthermore,
regular quarterly reporting and ad-hoc reporting is conducted on the basis of mandatory
regulations.
Within the context of the decentralised structure of risk management, risk managers are
appointed across the Group and are responsible for continuously identifying, assessing, man-
aging and monitoring operational and financial risks in the various regions and central depart-
ments (e. g. Treasury & Finance). These risk managers assess and document the risks
identified, including the measures to reduce risks as part of risk reporting.
Risk reports are submitted on a regular quarterly basis to the central risk management unit in
the Accounting department. Unscheduled reports must also be submitted if risks are newly
identified or newly assessed, with the result that reporting thresholds are exceeded (ad-hoc
reporting).
The central Risk Management unit monitors the regular reporting by risk managers and sum-
marises the significant risks for the Risk Committee on a quarterly basis and, if urgent, on an
unscheduled basis. The Risk Committee discusses and assesses the risks present and sub-
sequently reports on the overall risk situation to the Executive Board. In particular, it reports
on the risk status of significant factors, such as the current development of freight rates and
transport volumes, on the potential effects of significant fluctuations in these factors and on
significant individual risks.
Risk management system of Hapag-Lloyd
Risk Committee
Central Risk Management
Supervisory Board and Audit Committee
Executive Board of Hapag-Lloyd AG
Region
Latin
America
Region
North
America
Region
Europe
Region
Asia
Region
Middle
East
Central Departments
• Monitoring• Risk report
• Aggregation of risks• Monitoring• Reporting
Tasks of each unit:• Risk identification • Risk assessment • Risk documentation and reporting • Risk management
Areas Areas Areas Areas Areas
42 M a n a g e M e n t R e p o R t
H a p a g - L L o y d a k t i e n g e s e L L s c H a f t i f i n a n c i a L s t a t e M e n t s 2 0 1 8 a n d M a n a g e M e n t R e p o R t

The Corporate Audit department conducts regular checks of the risk management processes
and – in particular – the early-warning system for risks, focusing on different aspects each time.
In risk management, the methods, systems and controls are adapted according to the type of
risk and are continuously checked, enhanced and adapted to the constantly changing busi-
ness conditions. As part of risk management, risks are hedged by the decentralised compa-
nies and central departments to the greatest extent possible. Insurance policies are concluded
to cover claims and various other risks that arise in everyday business operations, insofar as
these are economically justifiable. The Company also holds a number of insurance policies
which are customary in the industry and tailored to the requirements of Hapag-Lloyd. These
include third-party liability, property and personal insurance, as well as shipping insurance.
The policies are examined regularly and adjusted if required.
Description of the significant characteristics of the accounting ICS / RMS pursuant
to Section 289 of the German Commercial Code (HGB)
Concept and objectives
Hapag-Lloyd has established an internal control system (ICS) on the basis of the internationally
acknowledged framework “COSO (The Committee of Sponsoring Organizations of the Tread-
way Commission) Internal Control – Integrated Framework”. The system was documented in
2010 and safeguarded by means of a verification process. A central ICS coordination frame-
work exists for the continuous further development and securing of the internal control system.
A technical platform also exists to monitor processes globally. This internal control system
includes the accounting-related ICS.
The primary objectives of the accounting-related ICS are to decrease the risk of significant
errors in accounting, detect substantially incorrect valuations and ensure compliance with
applicable regulations. The principles, processes and measures implemented to this end are
regularly checked and enhanced. Irrespective of its form or structure, however, an ICS can-
not provide absolute assurance that these objectives will be achieved.
Organisation and significant processes in accounting and consolidation
Hapag-Lloyd AG prepares its annual financial statements in accordance with German account-
ing standards and its consolidated financial statements in accordance with the requirements
of IFRS. An accounting guideline is used. This is codified in the form of procedures and regu-
lations. Changes to the legal provisions and standards are constantly monitored and the
accounting guidelines and procedures are examined promptly for any adjustments that might
be required. There is also a uniform chart of accounts for Hapag-Lloyd.
The Accounting department has overall responsibility for the consolidation process, the prepa-
ration of the financial statements and the internal and external Group and individual reporting.
Information is obtained from other departments and processed in the course of preparing the
financial statements. This includes information from the Treasury department for the reporting
of hedge relationships and financial derivatives, and information from the Controlling depart-
ment pertaining to Company planning in relation to the impairment tests that are carried out.
43M a n a g e M e n t R e p o R t
H a p a g - L L o y d a k t i e n g e s e L L s c H a f t i f i n a n c i a L s t a t e M e n t s 2 0 1 8 a n d M a n a g e M e n t R e p o R t

Individual items are accounted for based on the input of external specialists and appraisers,
such as actuaries for pension valuation. The process of preparing the financial statements is
carried out in accordance with a detailed time schedule (the financial statements calendar),
which is agreed with the departments and subsidiaries. The Accounting department is respon-
sible for ensuring that these time limits are adhered to. Accounting throughout the Group is
supported by means of suitable and standard market accounting systems at Hapag-Lloyd AG
and its subsidiaries. The subsidiaries send Group reporting packages needed for the prepa-
ration of the consolidated financial statements. These packages are compiled to form the
consolidated financial statements using the SAP Financial Consolidations (FC) system. The
necessary steps to be taken in the consolidation process are initiated by the Accounting
department.
General and internal controlling activities
Potential effects on financial reporting are already often taken into consideration in the organi-
sational environment, e. g. significant investments and financing should already be agreed
upon with the Accounting department before being approved by the Executive Board, particu-
larly in light of their presentation in the financial statements, and are critically assessed with
regard to their impact on the consolidated financial statements. Further risks are also identified
and evaluated by having the Head of Accounting preside over the Risk Committee to ensure
that significant circumstances or events within the entity and their potential accounting-related
effects can be recorded and assessed at an early stage.
Compliance with accounting and valuation regulations is monitored by internal controls. Some
of these internal controls are integrated into processes, while others are established indepen-
dently of them. These internal controls encompass preventive as well as detective activities.
Segregation of duties and a dual control principle have been implemented as fundamental
process-integrated controls to ensure proper accounting. For example, entries are authorised
by way of a multilevel approval and release procedure. The controls that have been imple-
mented in the IT systems should also ensure that the booking systems can only be accessed
by authorised employees due to the presence of an authorisation system. In addition, reports
concerning changes and exceptions, for example, are verified as downstream control activities
for sensitive areas.
The Corporate Audit department has a fundamental supervisory role to play in the process-
independent control measures. The Corporate Audit department reports directly to the CEO
of Hapag-Lloyd AG and has a wide range of informational, auditing and access rights to ena-
ble it to fulfil its role as an internal auditor and advisor. The subjects examined by the Corporate
Audit department are systematically selected using a risk-based approach to auditing. They
regularly include processes and controls which are relevant to accounting.
ICS verification process
Hapag-Lloyd AG has put in place a standard procedure to confirm the establishment of the
ICS. The results of this procedure are compiled in a report on an annual basis (“ICS verification
process”). This ensures that the Hapag-Lloyd AG Audit Committee is kept informed about the
internal control system by the Executive Board.
44 M a n a g e M e n t R e p o R t
H a p a g - L L o y d a k t i e n g e s e L L s c H a f t i f i n a n c i a L s t a t e M e n t s 2 0 1 8 a n d M a n a g e M e n t R e p o R t

RISKS
The key risks and their potential impact on the earnings, financial and net asset position of
Hapag-Lloyd, including their probability of occurrence, are listed on page 61. In general the key
risks of the Group are consistent with the key risks of the Hapag-Lloyd AG. In case there are
differences, these differences are described in the following. The less significant risks are also
described in the following section, although the probability of their occurrence and their effects
have not been assessed for risk management purposes, unless otherwise stated.
STRATEGIC RISKS
General economic risks
Container shipping is heavily dependent on the general prevailing conditions in the world’s
economies and is subject to a high level of risk of being affected to an above-average degree
by fluctuations in the economic climate. The development of freight rates, which have a signifi-
cant influence on Hapag-Lloyd’s financial and earnings position, is particularly dependent on
the transport volume and capacity supply on routes and therefore on economic developments
in individual regions.
The pace at which the global economy grows and, by extension, at which global trade
expands is a significant factor that influences demand for container shipping services and
thus the development of the container shipping companies’ cargo volumes. In its latest eco-
nomic outlook (January 2019), the IMF expects global economic growth to reach 3.5% over-
all in 2019 (2018: 3.7%) and to achieve further growth of 3.6% in 2020.
Despite the current positive performance of the global economy and the corresponding
expected performance of container transport volumes, there continue to be significant risks
for the global economy in 2019. A detailed forecast can be found in the “General economic
conditions” chapter. Geopolitical tensions, increasing protectionism in some countries, uncer-
tainties about the USA’s future economic, trade and financial policies, the effects of Brexit and
significant valuations on the capital markets represent the main risks for global economic per-
formance in 2019. A slowdown in global economic growth could lead to a significant decrease
in the global transport volume growth in the container shipping segment. According to IHS
Global Insight, the rise in global demand for container shipping services fell short of the original
forecasts in recent years. The main reason for this was the modest pace of global economic
growth. The lower than anticipated increase in the transport volume, coupled with the sharp
rise in capacity supply, has led to a marked decline in freight rates in all the main trades in
recent years. If the transport volume remains below expectations and freight rates fall further,
this could have a considerable negative impact on Hapag-Lloyd’s earnings.
45M a n a g e M e n t R e p o R t
H a p a g - L L o y d a k t i e n g e s e L L s c H a f t i f i n a n c i a L s t a t e M e n t s 2 0 1 8 a n d M a n a g e M e n t R e p o R t
Risks associated to the chosen mid-term strategy
With its Strategy 2023, Hapag-Lloyd focuses in differentiation in the market in order to become
number one for quality. Should Hapag-Lloyd not make use of long-term strategic potentials by
applying its Strategy 2023 or misinterpret these potentials, deviations from plan could have
negative impacts on the earnings of Hapag-Lloyd.
Risks arising from changes in trade flows
The utilisation of the Group’s capacities is influenced by the development of the trade flows
between the various regions. In the case of transport between regions comprising net export-
ers and regions comprising net importers, capacity utilisation in the two directions is divergent.
This results in empty container transports and associated costs. An increase in the imbalances
in global trade could further push up the costs associated with empty container transports
and negatively affect the earnings. In 2018, for example, the importation bans on materials for
recycling (primarily waste paper and plastic) and uncertainties regarding Brexit as well as a
potential trade war led to a temporary weakening of Asian imports and exports.
Risks resulting from intense competition
Global container shipping is characterised by intense competition among the shipping com-
panies. Some of the competitors are larger than Hapag-Lloyd in terms of business volume,
fleet size, transport volume and capacities. Others have better capital resources. This means
that these competitors can be better positioned on the market to achieve economies of scale
and are able to invest in more efficient ships. They would therefore be able to offer a more
cost-effective service and lower freight rates. This, in turn, might have an adverse effect on
Hapag-Lloyd’s market share.
Generally, Hapag-Lloyd does not conclude long-term or exclusive contracts with its customers.
The majority of customers maintain similar business relationships with other shipping com-
panies. Depending on the market circumstances, customers may partially or solely use other
shipping companies’ services. In global container shipping, there are no restrictions for com-
petitors who want to expand their service to cover other trades or routes. Each of the competi-
tors might therefore offer a comparable service on the routes where Hapag-Lloyd maintains a
liner service and try to undercut the Group’s freight rates. In view of the currently low charter
rates for ships, new competitors could also emerge and provide a liner service with particularly
low freight rates and negatively affect the earnings.
Risks resulting from further industry consolidation
In the view of Hapag-Lloyd the latest phase of consolidation in container shipping is largely
complete. The corporate mergers of the companies involved have been completed. The merg-
ers and acquisitions could enable individual shipping companies to achieve higher economies
of scale and greater financial strength, so that these competitors would be better able to
cope with stronger price competition and higher market volatility than Hapag-Lloyd. Further
large / far-reaching acquisitions within the industry are not expected for the time being.
46 M a n a g e M e n t R e p o R t
H a p a g - L L o y d a k t i e n g e s e L L s c H a f t i f i n a n c i a L s t a t e M e n t s 2 0 1 8 a n d M a n a g e M e n t R e p o R t

Risks arising from membership of alliances
Hapag-Lloyd’s membership of alliances is important for it to be able to cover all the key trades
and offer a global service network. Membership of alliances can involve risks alongside the
opportunities described in the opportunity report. The conditions within the alliances could
change or other shipping companies could relinquish or not renew their membership.
Since 1 April 2017, Hapag-Lloyd has been operating THE Alliance in partnership with Ocean
Network Express. Ltd (Singapur) (ONE) (formerly Kawasaki Kisen Kaisha Ltd. (Japan), Mitsui
O. S. K. Lines Ltd. (Japan), Nippon Yusen Kabushiki Kaisha Ltd. (Japan) and Yang Ming Marine
Transport Corp. Ltd. (Taiwan) (Yang Ming). The THE Alliance is the successor organisation to
the Grand Alliance and the G6 Alliance. The partnership is scheduled to last for at least five
years. Members must remain in the alliance for 36 months and then give twelve months’ notice
if they wish to leave. In the event of a change of control or insolvency, a member may be
excluded from the alliance. The decision to exclude an alliance member must be taken unani-
mously by the other members.
Hapag-Lloyd needs to be a member of an alliance in order to offer a global service network. If
Hapag-Lloyd were to be excluded from an alliance or refused membership of an alliance, this
would have significant negative effects on its competitive situation and therefore its earnings
position.
Risks arising from competition from new alliances
In Hapag-Lloyd’s view, the extensive restructuring of the alliances in 2017 is currently regar-
ded as stable, which is why no changes in the composition of the alliances are to be expected
in the short term. Risks from medium-term developments cannot yet be estimated.
The European Commission is presently reviewing the EU Block Exemption Regulation (“BER”)
for consortia (including alliances). A BER is an exemption from Art. 101.1 TFEU (Treaty of the
Functioning of the European Union) for a certain business line or industry. The current consor-
tia BER, which clearly spells out what is permitted within consortia in order to maintain compe-
tition, runs until April 2020. A consultation procedure of the European competition authorities
on the continuation of the BER is ongoing. The BER may be extended unchanged, extended
with revisions, withdrawn or replaced by a new guideline. A short-term decision in the next
weeks is not expected. Even if the BER is abolished, alliances can continue to operate un -
changed, since consortia with a market share above 30% already operate outside the BER
today. Without the BER the clear guidance for internal documentation it provides would be lost,
but the legality of alliances would remain the same.
These various alliances have different levels of presence in the respective trade lanes. A differ-
ent development in the individual trade lanes would allow competitors to develop better than
Hapag-Lloyd, which could pose a risk to Hapag-Lloyd´s profitability.
47M a n a g e M e n t R e p o R t
H a p a g - L L o y d a k t i e n g e s e L L s c H a f t i f i n a n c i a L s t a t e M e n t s 2 0 1 8 a n d M a n a g e M e n t R e p o R t

Risks arising from state aid for competitors
Direct and indirect state aid from countries such as China, Taiwan and South Korea to their
own shipping companies creates an unequal competitive environment and may put pressure
on freight rates or result in the excessive availability of container transport capacity on the
market.
State aid for exports in the form of lower interest rates on ship financing for customers placing
orders at local shipyards as well as the sharp increase in ship financing activities from Chinese
banks and lease companies may result in too many ships being ordered, causing capacity
supply to grow faster than demand, with negative effects on freight rates.
OPERATING RISKS
Measures for ensuring the effectiveness of bunker price, currency and
interest rate hedges
The intended effective risk hedging is ensured by closely aligning the hedging transactions with
the parameters of the risk-bearing hedged items (currency, nominal value, maturity, index, etc.).
Moreover, the amount of the underlying risks and the resulting hedging ratio are continuously
monitored.
Fuel price risks
Hapag-Lloyd’s business activity exposes it to market price risks arising from the procurement
of fuels (bunker fuel) for the container ship fleet. Bunker fuel expenditure accounts for a sub-
stantial proportion of overall operating costs. Bunker price fluctuations have a delayed effect
on transport expenses, depending on when the bunker fuel was purchased and subsequently
consumed.
In the 2018 financial year, the cost of the ships’ fuel amounted to 13.8% of the Hapag-Lloyd
Group’s revenue. The bunker consumption price is the most important factor influencing fuel
costs, which is one of the main cost components for the container shipping industry. In 2018,
the average bunker consumption price (MFO and MDO) was USD 421 per tonne (MFO:
USD 407 per tonne; MDO: USD 616 per tonne). This was USD 103 per tonne higher than the
average for the previous year. Changes in the price of bunker fuel are aligned with the price
of crude oil, which has been subject to substantial fluctuations and influenced by a number of
economic and geopolitical factors in the past. Bunker prices rose significantly again in the
course of 2018, before temporarily decreasing slightly towards the end of the year. Bunker
prices are rising again since the beginning of 2019. If this trend continues, it is likely to lead to
a sharp increase in fuel costs in 2019.
48 M a n a g e M e n t R e p o R t
H a p a g - L L o y d a k t i e n g e s e L L s c H a f t i f i n a n c i a L s t a t e M e n t s 2 0 1 8 a n d M a n a g e M e n t R e p o R t
On 1 January 2020, the global marine fuel regulation IMO 2020 comes into force, which lowers
the sulphur limit for fuel from 3.5% to 0.5%. From 1 February 2019, Hapag-Lloyd will gradually
implement the Marine Fuel Recovery (MFR) mechanism, which replaces the bunker surcharges
that were previously part of the average freight rate. The higher fuel prices for low-sulphur fuel
(LSFO 0.5% sulphur) will automatically be included in the MFR as soon as Hapag-Lloyd ships
use low-sulphur fuel. The MFR mechanism captures different parameters such as fuel con-
sumption per day, fuel type and price (for HSFO, LSFO 0.5% and LSFO 0.1%), sea and port
days, and transported TEUs. These parameters are derived from a representative service in
the market for a specific trade. The MFR also takes better account of price fluctuations with an
optimised coverage of upward and downward movements in fuel market prices. Fluctuating
bunker prices can therefore have a major impact on average freight rates, depending on the
trade in question. To limit the effect that rising bunker prices have on its shipping costs,
Hapag-Lloyd is endeavouring to offset a large proportion of the fluctuations in raw materials
prices by means of the MFR mechanism on freight rates. However, the extent to which this can
be implemented depends heavily on the prevailing market situation. If the cost increases can-
not be passed on to customers, or can only be passed on in part, this will have a negative
impact on earnings.
In addition, price risks emanating from fuel procurement are hedged by means of hedging
transactions in accordance with the internal hedging strategy. This involves hedging the Com-
pany’s anticipated bunker requirements. Please refer to the “Financial instruments” section
of the notes to the consolidated financial statements for information on the scope and type of
hedging instruments as of the balance sheet date. By the end of December 2018, approxi-
mately 21% of the planned fuel consumption volumes for the 2019 financial year had been
hedged.
The requirement to use marine diesel oil (MDO) as a result of stricter environmental regula-
tions governing coastal regions may lead to a considerable rise in transport costs, given the
significantly higher price of MDO. In 2018, around 13% (previous year: around 13%) of total
bunker consumption of approximately 4.4 million tonnes (previous year: approximately 3.9 mil-
lion tonnes) was low-sulphur bunker. From 2020, the use of low-sulphur fuels is mandatory.
Risks from fluctuations in charter rates
Within the framework of a charter contract, a ship owner puts a ship at the disposal of a con-
tainer shipping company for a contractually agreed period, with the owner usually also provid-
ing the crew, insuring the ship and being responsible for maintenance. As charter rates are
subject to severe fluctuations influenced by how market participants anticipate that supply and
demand will develop in the future – especially for short-term contracts – chartering ships in
periods of increasing demand can be more expensive than operating own ships. It cannot be
ruled out that charter rates could rise sharply in the future and that it might not be possible to
pass on these cost increases to customers in the form of higher freight rates.
49M a n a g e M e n t R e p o R t
H a p a g - L L o y d a k t i e n g e s e L L s c H a f t i f i n a n c i a L s t a t e M e n t s 2 0 1 8 a n d M a n a g e M e n t R e p o R t

Charter rates are determined by the supply of and demand for ship capacities and by develop-
ments in freight rates. As a rule, charter rates shadow the trend in freight rates, which are
dependent on expectations regarding the future development of the supply of and demand for
transport capacities, with a time lag of several months. This time lag in adjusting charter rates
is caused by the contractual bond between the ship’s owner and the liner shipping company.
This means that in the event of increasing demand, the owner cannot raise their charter rates
before the contract expires. If demand is weakening, on the other hand, the shipping company
cannot reduce its charter rates before existing contracts expire. In this case, falling freight rates
accompanied by fixed charter rates can lead to a decrease in revenue, particularly after a
phase of high demand for ship chartering. As a result, Hapag-Lloyd may be unable to reduce
its portfolio of chartered ships with above-average charter rates in comparison to the market
for several months as a response to falling freight rates.
The proportion of own and leased ships in terms of the total capacity (in TEU) of the Hapag-
Lloyd AG fleet as at 31 December 2018 was approximately 37% (previous year: approximately
37%). The remaining 63% are chartered, of which 8 ships are chartered long-term, 38 medium-
term and 69 short-term.
Risks resulting from fluctuating transport volumes and freight rates
In respect of the development of transport volumes and freight rates, there are differences
between the various trades in which Hapag-Lloyd is active. The development of transport
volumes depends heavily on economic activity in the regions linked together by the trades.
Freight rate developments are also largely determined by the available transport capacities
within a trade. In view of the fact that transport capacities are set to increase further in the
near future, intensified competition between the shipping companies may again lead to
greater price competition in individual trades in 2019, as has been the case in recent years.
Transport volumes and freight rates in container shipping are traditionally subject to sharp
seasonal fluctuations. The peak season in the third quarter of the calendar year is of particu-
lar importance to the Company’s performance and earnings.
Risks from capacity bottlenecks at individual ports
Over the past few years, capacities in container shipping have grown more quickly than the
number of available berths at the ports. This leads to waiting times at the ports in question and
results in a sometimes considerable amount of lost time during loading and unloading of the
ships. If capacities were increased further, the loss of time at the ports concerned could be
even greater. This would make it harder to keep to the timetables and could put pressure on
the Company’s earnings and financial position. Decisions on whether to expand the ports are
the responsibility of the respective governments and are therefore beyond the influence of
Hapag-Lloyd. Labour disputes at the ports could likewise make it difficult to adhere to timeta-
bles and possibly result in substantial additional costs.
50 M a n a g e M e n t R e p o R t
H a p a g - L L o y d a k t i e n g e s e L L s c H a f t i f i n a n c i a L s t a t e M e n t s 2 0 1 8 a n d M a n a g e M e n t R e p o R t

Risks from long delivery periods for newbuilds
The lead time between the ordering and delivery of newbuilds is two to three years, with the
placement of the order being based on expectations of future demand for transport capacities.
The market situation can change by the time new ships are delivered. There is also the risk that
the available capacity will be too low and Hapag-Lloyd cannot meet its customers’ demands.
This would lead to falls in revenue and a loss of market share. If additional capacities had to be
chartered to retain customers, higher charter rates would have to be paid as a consequence of
increased demand, leading to an additional cost burden. As of the balance sheet date, there
were no orders for new ships. In order to remain competitive in the medium term, the Executive
Board of Hapag-Lloyd AG assumes that the Group will invest in new ship systems again in due
course.
Risks from the operation of ships
The operation of ships involves specific risks which include accidents, collisions, total loss of a
ship, environmental damage, fire, explosions, loss of or damage to the cargo, damage caused
by material defects, human error, war, terrorism, piracy, political activities in individual coun-
tries, loss of certification of ships, difficult weather conditions and delays resulting from strikes
by the crews or dock workers.
All of the points listed above can prevent the ships from operating, impede a shipment’s pro-
gress or lead to the death or injury of people as well as to the loss of or damage to property.
This could damage the reputation of the Company and put pressure on customer relation-
ships. As far as possible, Hapag-Lloyd has concluded economically appropriate insurance pol-
icies to counter these risks. However, it cannot be ruled out that the existing insurance policies
do not cover the full amount of all types of damage. This could have a significant negative
impact on Hapag-Lloyd’s earnings position.
Risks arising from claims by suppliers and service providers
If unpaid invoices lead to claims against Hapag-Lloyd, then suppliers of goods and services
and crewmembers could have the ships seized when they enter ports, thereby preventing
them from continuing on their journeys. Unless Hapag-Lloyd makes the court-ordered pay-
ments immediately, this could result in an interruption to transport services, which, in turn,
could lead to a high level of material damage.
Risks caused by general political conditions and protectionism
Hapag-Lloyd is active in many countries around the world. Its commercial activities can be
hindered by political tension, wars, terrorism, and economic and social problems. This can
result in disruptions to the production processes of its customers or interruptions in its own
liner services. The use of ports or other major shipping channels (Panama Canal, Suez Canal)
might be hindered as a further result. Individual countries could react to financial or economic
crises by resorting to protectionist measures, for example by introducing import or foreign
exchange restrictions. Other countries could initiate countermeasures, thereby encouraging
protectionism around the world. This would have a negative impact on the development of
container shipping.
51M a n a g e M e n t R e p o R t
H a p a g - L L o y d a k t i e n g e s e L L s c H a f t i f i n a n c i a L s t a t e M e n t s 2 0 1 8 a n d M a n a g e M e n t R e p o R t

Risks arising from the biggest trade, Latin America
With a share of around 23.4% of the container transport volume in 2018, the Latin America
trade is Hapag-Lloyd’s biggest trade. According to the latest IMF forecast (January 2019), eco-
nomic growth in the region of Latin America and the Caribbean was 1.1% in 2018 (2017: 1.3%).
Economic growth is expected to increase further by 2.0% in 2019, then by 2.5% in 2020. The
expected recovery in economic growth could however quickly come to a halt once again as
local economies are heavily dependent on political developments, commodity prices and
exchange rates. This may have a negative impact on the region’s import and export activities,
and therefore also on demand for container shipments and consequently on the revenue and
earnings performance of Hapag-Lloyd. The volatility of local currencies could also have a neg-
ative impact on earnings performance.
Risks arising from the loss of the US flag or cabotage business
In certain regional sub-trades in Latin America, Hapag-Lloyd provides container transport ser-
vices on routes which are protected by regulation from general competition (cabotage busi-
ness). If Hapag-Lloyd is no longer allowed to operate on these routes or if these routes are
opened up to general competition, this could have a negative effect on its earnings position.
The cabotage business is operated through the companies CSAV Austral SpA, Companhia
Libra de Navegacao S. A., Andes Operador Multimodal Ltda and Consorcio Naviero Peruano
S. A. If the earnings position of these companies undergoes a sustained deterioration due to
the loss of the cabotage business, this could have a negative effect on the recoverable amount
of Hapag-Lloyd AG’s investment. Both the probability of occurrence and the impact of such
risks on Hapag-Lloyd´s earnings before interest and taxes (EBIT) are classified as medium.
Hapag-Lloyd is one of three international container liner shipping companies that provide con-
tainer transport services for the governmental organisations of the USA (US flag business). If
Hapag-Lloyd no longer meets the requirements for this, it could have a negative impact on its
earnings position. The US flag business is operated through the company Hapag-Lloyd USA
LLC. If the earnings position of this company undergoes a sustained deterioration due to the
loss of the US flag business, this could have a negative effect on the recoverable amount of
Hapag-Lloyd AG’s investment.
Risks arising from the loss of customers and employees
Container shipping operates in a very competitive industry environment. If Hapag-Lloyd is
unsuccessful in binding key customers and employees to the Company over the long term,
this may have negative consequences for the revenue and earnings position of Hapag-Lloyd.
A sustained loss of customer groups that were acquired through taking over the customer
base of CP Ships Limited, CSAV and UASC could lead to an impairment of capitalised good-
will in Hapag-Lloyd AG’s statement of financial position.
52 M a n a g e M e n t R e p o R t
H a p a g - L L o y d a k t i e n g e s e L L s c H a f t i f i n a n c i a L s t a t e M e n t s 2 0 1 8 a n d M a n a g e M e n t R e p o R t
Risks arising from the lower earnings contribution of projects
The development of earnings and the achievement of corporate goals are closely linked to
the implementation of efficiency and cost reduction programmes as part of Strategy 2023.
Hapag-Lloyd expects the announced cost reduction measures to generate annual cost sav-
ings of USD 350 to 400 million from 2021 onwards.
If implementation of these measures does not deliver the expected contribution to earnings,
this could have a negative effect on Hapag-Lloyd’s earnings position and make it more difficult,
or even impossible, to achieve the mid-term financial targets. Changes to internal structures
(e. g. the structure of services in the respective trades) and the development of external factors,
such as currency fluctuations, bunker prices and the development of freight rates, also have a
substantial effect on the development of revenue and operating costs. These developments
can either assist with, duplicate or counteract the implementation of the projects. The develop-
ment of the income statement may therefore only reflect the planned effects of the strategic
measures to a limited extent, if necessary.
IT risks
Hapag-Lloyd ensures that all necessary data on transport volumes, freight rates, transport
costs, container locations and timetables is supplied by means of its own IT systems. The
availability of the systems is necessary for the management of the fleet and the containers,
for the efficient management of business processes and for cost control. An IT systems fail-
ure could hinder business processes and lead to higher costs.
The IT systems are protected in several ways. It can nevertheless not be ruled out that dam-
age, such as that caused by fire, power failures, system errors, hacker attacks, cases of fraud
or terrorism, could lead to the loss of data. The recovery of this data, if at all possible, could
lead to increased costs and / or negatively affect the customer or partner relationship. The
occurrence of IT risks described above could have a negative impact on the earnings position
of Hapag-Lloyd. The potential impact as well as the probability of occurrence are classified
as low.
COMPLIANCE RISKS
Risks caused by regulatory frameworks
As a container shipping company, Hapag-Lloyd is subject to numerous regulations with
domestic and international applicability. The alteration or broadening of such regulations and
the necessity of obtaining further authorisations can be a burden on the course of business
and possibly require a change of procedures. The Company could face considerable fines if
it infringes applicable regulations.
Container shipping is subject to numerous safety, security and customs regulations in the
respective countries of origin, transit and destination. Checks by the authorities responsible
could lead to the seizure of containers or their contents or to delays in the loading or unload-
ing of the ships.
In connection with this, customs duties could be levied or fines imposed on exporters, import-
ers or the shipping company. Based on current and foreseeable regulatory frameworks, there
are no discernible factors that could lead to restrictions affecting the Group’s commercial
activity.
53M a n a g e M e n t R e p o R t
H a p a g - L L o y d a k t i e n g e s e L L s c H a f t i f i n a n c i a L s t a t e M e n t s 2 0 1 8 a n d M a n a g e M e n t R e p o R t

Like other companies in the industry, Hapag-Lloyd AG is subject to increasing regulation in the
area of data protection and IT security. When the EU General Data Protection Regulation came
into force on 25 May 2018, it led to greater general data protection risks and, in particular,
increased the maximum fine for violations of data protection law (up to 4% of annual revenue).
Similar trends towards tighter regulation and increased sanctions under data protection law are
happening globally, particularly in Asia and Latin America. In addition to classic data protection
regulations, various states and multinational organisations are also striving for greater stand-
ardisation of IT security and cybersecurity. Hapag-Lloyd AG attaches particular importance to
the Cybersecurity Law of the People’s Republic of China. Furthermore, the increasing digitali-
sation of business processes is altering Hapag-Lloyd AG’s risk exposure, which means that
the additional risks relating to data protection law must be continuously assessed and man-
aged. Both the probability of occurrence and the impact of such risks on Hapag-Lloyd’s earn-
ings before interest and taxes (EBIT) are classified as medium.
Risks resulting from the tightening of climate protection regulations
The emission standards set by the International Maritime Organization (IMO) require a further
significant reduction in emissions. The legally stipulated use of particularly low-sulphur fuels
has been applicable since January 2015 in US coastal areas (and in the coastal areas of Cali-
fornia since January 2014) as well as in Hong Kong and certain coastal areas around Europe.
This will be gradually extended to the coastal region of China from 2018 onwards. The IMO
has decided to expand these climate protection regulations to all of the world’s oceans. From
2020 onwards, the threshold for sulphur content will be limited to 0.5%. This could lead to a
sharp rise in specific fuel prices. If the rise in costs cannot be passed on to the customers in
the form of fuel surcharges, either wholly or in part, this will have a negative impact on the
earnings position.
Legal disputes and legal risks
Hapag-Lloyd AG and some of its subsidiaries are currently involved in legal disputes. These
include disputes with foreign tax authorities, claims asserted by former employees and dis-
putes arising from contractual relationships with suppliers, former agents and customers. Even
if the Company is successful in legal disputes, they can involve substantial costs if uninsured
and can damage the Company’s reputation. The potential impact as well as the probability of
occurrence are classified as low.
54 M a n a g e M e n t R e p o R t
H a p a g - L L o y d a k t i e n g e s e L L s c H a f t i f i n a n c i a L s t a t e M e n t s 2 0 1 8 a n d M a n a g e M e n t R e p o R t
On 20 February 2019, the U. S. Department of Justice Antitrust Division (“DoJ”) announced to
Hapag-Lloyd the termination of the investigation. The official end of the investigation against
Hapag-Lloyd was confirmed by the DoJ on 25 February 2019. The investigations were termi-
nated without allegations against Hapag-Lloyd AG, its affiliates or any current or former
employee. This investigation was related to subpoenas to a DoJ hearing served to company
representatives in San Francisco on 15 March 2017.
Hapag-Lloyd is subject to regular tax audits and these may lead to the payment of tax arrears.
Investigations by local tax authorities concerning individual circumstances are currently taking
place in a number of jurisdictions, such as in Mexico, India and Brazil. To the extent that the
Company can expect to incur charges and these charges are quantifiable, these were
accounted for by creating corresponding provisions.
As at the reporting date, there was also EUR 107.2 million in contingent liabilities from tax
risks (previous year: EUR 135.5 million), whereby the probability of occurrence is classified
as low overall.
Risks from taxation
In 1999, Hapag-Lloyd AG decided to make use of the possibility of having its commercial
activities taxed on the basis of the transport capacities utilised (“tonnage tax”). There are also
comparable taxation systems in other European countries. Under this system, the tax burden
is determined by the capacity of the fleet, not by the earnings actually achieved. It requires a
certain percentage of the fleet to be registered and managed in Germany and deployed as an
international liner service. Any change in or discontinuation of tonnage tax or any failure of the
Company to meet the prerequisites for continuing to use the tonnage tax option could con-
siderably increase the tax burden, particularly in periods of high earnings.
Risks from being a listed company
As a listed company, Hapag-Lloyd is subject to a range of regulatory requirements. If Hapag-
Lloyd does not comply with, or only partly complies with, the statutory regulations and the
regulations under private law, it is at risk of incurring financial sanctions and a significant loss
of reputation.
55M a n a g e M e n t R e p o R t
H a p a g - L L o y d a k t i e n g e s e L L s c H a f t i f i n a n c i a L s t a t e M e n t s 2 0 1 8 a n d M a n a g e M e n t R e p o R t

FINANCIAL RISKS
Management of financial risks
Hapag-Lloyd has a worldwide presence through its business activities. Within the scope of its
ordinary business activities, Hapag-Lloyd is primarily exposed to currency risks, interest rate
risks and liquidity risks, which can have a significant impact on its net asset, financial and earn-
ings position.
Its corporate strategy is to limit the currency and commodity price risks resulting from ordinary
business operations by using hedging transactions. The individual rules, responsibility assign-
ments and processes as well as the limits for transactions and risk positions are established
in guidelines and implementation rules. Compliance with the guidelines and transaction limits
is monitored on an ongoing basis. Hedging transactions are only concluded in order to hedge
anticipated underlying transactions or such transactions recognised in the statement of finan-
cial position. Approved, standardised software is used for the recording, valuation and report-
ing of the hedging transactions concluded.
Currency risks
In international container shipping, the US dollar is the currency in which the bulk of services
are usually invoiced. This applies to freight and charter rates, fuel, and the financing of con-
tainers and ships. The US dollar is the functional currency within the Hapag-Lloyd Group.
However, the Group is a business which conducts its operations worldwide and is therefore
exposed to the risk of currency fluctuations because various currencies account for its income
and expenses. This also applies to financial debt assumed in euros. In addition to the US dollar
and the euro, the Canadian dollar, Brazilian real, Indian rupee, British pound sterling, Chinese
renminbi, Australian dollar, Japanese yen and Mexican peso are also significant currencies.
The materiality of risks arising from exchange rate fluctuations is monitored on an ongoing
basis. If necessary, the Group hedges a portion of its net cash outflows using a rolling hedge
with the aim of limiting currency risks in the consolidated financial statements. Despite this,
fluctuations in exchange rates can have a significant influence on Hapag-Lloyd’s earnings
position.
The reporting currency for the Hapag-Lloyd Group and the individual financial statements of
Hapag-Lloyd AG is the euro. Changes in the USD / EUR exchange rate thus have a considera-
ble impact on the key financial indicators reported in the annual and quarterly financial state-
ments. As a result, the key financial indicators reported in euros can diverge significantly from
the key financial indicators for the operating activities reported in US dollars.
From the perspective of the individual Financial Statements of Hapag-Lloyd AG according to
German Commercial Code, a strengthening of the US dollar represents a significant risk, espe-
cially with regards to valuation effects on the balance sheet date of financial debt denominated
in US dollar. Both the probability of occurrence and the impact of such risks on Hapag-Lloyd’s
earnings before interest and taxes (EBIT) are classified as medium. On the other hand, a weak-
ening of the US dollar represents a chance.
56 M a n a g e M e n t R e p o R t
H a p a g - L L o y d a k t i e n g e s e L L s c H a f t i f i n a n c i a L s t a t e M e n t s 2 0 1 8 a n d M a n a g e M e n t R e p o R t
Interest rate risks
Interest rate risks which arise as a result of raising new funds are reduced with a balanced
portfolio of fixed and variable interest rate structures. Interest rate hedges can be implemented
further, if necessary.
Risks resulting from changes in the lending values of ships
Typically, lending limits (so-called loan-to-value ratios) are agreed in ship loans, which are
reviewed continuously (usually every six months) by the lenders. If these loan-to-value ratios
are undercut, the result is usually that adequate replacement collateral has to be procured
or a corresponding unscheduled repayment has to be made under the loan.
As at the balance sheet date, the used-market prices for ships provide a sufficient buffer in
the loan-to-value ratios of the Company’s ship loans.
Risks resulting from a more restrictive lending policy by banks towards
shipping companies
Ship financing banks could make their lending policies more restrictive, which, in turn, could
either make it more difficult for Hapag-Lloyd to obtain new financing or increase lending costs.
This, in turn, would have a negative effect on Hapag-Lloyd’s financial situation and earnings.
Liquidity risks
Liquidity risk, i. e. the risk of not being able to fulfil existing or future payment obligations, is
managed centrally at Hapag-Lloyd. The Company secures an adequate liquidity reserve for
itself by means of syndicated credit facilities and bilateral bank loans, as well as its portfolio
of cash and cash equivalents. The liquidity reserve of the Hapag-Lloyd Group as at 31 De -
cember 2018 amounted to EUR 1,133.0 million (previous year: EUR 1,059.5 million). Arrange-
ments with the banks to provide lines of credit are based on a rolling liquidity plan.
Bank default risk management also covers the Hapag-Lloyd Group’s derivative financial in -
struments and financial investments. The maximum default risk of the derivative financial
instruments concluded is restricted to the sum of the positive market values of all of these
in stru ments because the financial damages in the event of their non-fulfilment by the contrac-
tual partners would not exceed this amount. No default risks are expected as derivative finan-
cial instruments have been concluded with different borrowers of impeccable credit standing.
Nonetheless, the counterparty risk is monitored constantly and managed by means of internal
bank limits.
Credit default risks
In order to prevent or reduce bad debt losses, Hapag-Lloyd operates a uniform, centrally
controlled receivables management system. Its components include a standardised approval
procedure for granting loans, complete with a creditworthiness risk check by Bisnode (formerly
Dun & Bradstreet, the world’s largest provider of business information and analyses), securing
the customer receivables by means of credit insurance, and a centrally managed monthly
reporting system for monitoring the outstanding amounts, including their age structure and the
guidelines and rules of receivables management.
57M a n a g e M e n t R e p o R t
H a p a g - L L o y d a k t i e n g e s e L L s c H a f t i f i n a n c i a L s t a t e M e n t s 2 0 1 8 a n d M a n a g e M e n t R e p o R t

With regard to derivative financial instruments, all the counterparties must have a credit rating
or, alternatively, a corresponding internal credit assessment determined according to clear
specifications.
Risks arising from debt
Hapag-Lloyd Group’s financial debt as at 31 December 2018 was EUR 6,017.9 million (previous
year: EUR 6,335.5 million). The ability to finance the operating capital, debt servicing and other
expenditure depends on the future course of business and the development of income. Due to
the existing borrowed capital, a portion of income has to be used to pay interest and service
debt. An increase in the total interest-bearing liabilities could possibly make it more difficult for
the Company to fulfil the payment obligations for its bonds and loans taken out.
Covenant clauses that are customary in the market and are based on IFRS consolidated finan-
cial statements and individual contractual agreements are in place for existing financing from
bonds or loans.
They primarily require the Company to comply with minimum adjusted equity requirements,
maintain a minimum liquidity level and comply with loan-to-value ratios. As at 31 December
2018, all of the covenants were complied with. Based on current planning, the Executive
Board expects that these covenants will also be adhered to during the subsequent period.
The bonds issued entail certain limitations with regard to possible payments to the sharehold-
ers and subordinated creditors. In addition, there are termination clauses which are customary
in the market relating to much of the financial debt in the event that more than 50% of the
Company’s shares are acquired by a third party.
Risks arising from the impairment of goodwill
As at 31 December 2018, the goodwill recognised in the statement of financial position of
Hapag-Lloyd AG amounted to EUR 1,103.4 million (previous year: EUR 1,175.6 million). This
represented 11.0% of the balance sheet total (previous year: 11.9%). In the event that an
impairment test identifies the need to recognise an impairment charge for goodwill, this could
have a significant negative effect on Hapag-Lloyd’s earnings position and equity base. An
impairment test as at 31 December 2018 did not identify any need for an impairment charge.
As a result, the probability of a potential need for an impairment of goodwill is classified as
low at the time of reporting.
Risks arising from the impairment of the investment in Container Terminal
Altenwerder GmbH
Hapag-Lloyd has a 25.1% stake in Container Terminal Altenwerder GmbH (“CTA”). CTA oper-
ates Container Terminal Altenwerder in the Port of Hamburg. CTA’s earnings position, and
therefore its dividend distributions and investment value, are dependent on container through-
put at the terminal. This is also dependent on the continuation of the project to dredge and
widen the Elbe shipping channel. A decrease in container throughput would have a negative
impact on the earnings position and could negatively affect CTA’s investment carrying amount.
58 M a n a g e M e n t R e p o R t
H a p a g - L L o y d a k t i e n g e s e L L s c H a f t i f i n a n c i a L s t a t e M e n t s 2 0 1 8 a n d M a n a g e M e n t R e p o R t
Risks arising from differing perspectives on the operation of joint ventures
Hapag-Lloyd currently operates a range of companies together with partners (subsidiaries with
non-controlling interests and equity-accounted investees). Differing perspectives regarding the
operation and strategic focus of these joint ventures could have a considerable impact on the
operational performance of these companies and their value.
Risks arising from Hapag-Lloyd AG having a low equity base
As at 31 December 2018, Hapag-Lloyd AG’s equity in the individual financial statements
prepared under German commercial law totalled EUR 2,908.9 million (previous year:
EUR 3,196.1 million) and was therefore significantly lower than the Group’s equity. The equity
ratio according to the German Commercial Code of 28.9% as at 31 December 2018 was
lower than in the previous year (32.3%). Hapag-Lloyd AG’s financial debt as at 31 December
2018 was EUR 2,179.4 million (previous year: EUR 2,732.0 million). If another loss-making
situation occurs, this could have an adverse effect on Hapag-Lloyd AG’s equity base under
German commercial law and its ability to pay dividends. This could result, for example, from
losses under German commercial law due to exchange rate changes with the US dollar.
The probability of occurrence is classified as medium. The current US dollar / euro exchange
rate is USD 1.15 / EUR as at 31 December 2018 (previous year: USD 1.20 / EUR).
The authorised share capital of Hapag-Lloyd AG is approximately EUR 11 million as at the
balance sheet date. The Executive Board is authorised, subject to the approval of the Super-
visory Board, to increase the Company’s share capital by this amount up to 30 April 2022
by issuing new no-par shares, thereby strengthening the Company’s equity.
Risks from a downgrading of the rating
The bonds issued are assessed by the rating agencies Moody’s and Standard & Poor’s. In
principle, the Company intends its future bond issues to be rated in the same way. The credit
rating given by the rating agencies influences the Group’s ability to take on additional financial
debt. Any downgrading of the Hapag-Lloyd Group’s rating or that of the bonds it issues could
result in less favourable conditions for raising new funds and could adversely affect the price
and the fungibility of the securities it has already issued. For example, if there is a sustained
deterioration in the earnings position of Hapag-Lloyd Group, the rating agencies could down-
grade Hapag-Lloyd’s creditworthiness.
The international rating agency Standard & Poor’s currently rates Hapag-Lloyd with an
issuer rating of B+ and a stable outlook. On 25 July 2018, the rating agency Moody’s con-
firmed Hapag-Lloyd’s unchanged corporate rating of B2 and a stable outlook. Both rating
agencies took a positive view of the acquisition of UASC’s business activities with regard to
Hapag-Lloyd’s competitiveness. Both rating agencies indicated the possibility of a rating
downgrade if Hapag-Lloyd was unable to reduce its high level of debt following the merger
with UASC as announced. Such a rating downgrade could have negative effects on the
fi nancing costs of Hapag-Lloyd, which in turn would adversely affect the earnings position.
59M a n a g e M e n t R e p o R t
H a p a g - L L o y d a k t i e n g e s e L L s c H a f t i f i n a n c i a L s t a t e M e n t s 2 0 1 8 a n d M a n a g e M e n t R e p o R t

RISKS ARISING FROM THE TAKEOVER OF UASC
The merger with UASC took place on 24 May 2017, and the operational integration was
completed by the end of 2017.
Risks arising from the potential failure to achieve the planned synergies
The merger with UASC expects to deliver annual synergies of around USD 435 million from
2019 onwards. At the time the report was prepared, the achievement of the planned syner-
gies had already been fully established. The risk of not achieving the synergies therefore no
longer exists.
Risks arising from the increase in intangible assets
Especially due to the integration of CCS’s and UASC’s business activities in prior years the
intangible assets amount to EUR 3,342 million (previous year: EUR 3,272 million) on Hapag-
Lloyd’s statement of financial position as at 31 December 2018. In the event that an impairment
test identifies the need to recognise an impairment charge for goodwill or for other intangible
assets, this could have a significant negative effect on Hapag-Lloyd’s earnings position and
equity base. An impairment could result amongst others from an increase in the general, cur-
rently very low, interest rate level.
SUMMARISED OVERVIEW OF CORPORATE RISKS
The key risks for the Hapag-Lloyd Group relate to a possible decline in transport volume
growth, a noticeably negative trend in average freight rates, a potentially sharp rise in average
bunker prices, a sustained depreciation of the US dollar against the euro, liquidity develop-
ments that were much poorer than expected and the lower earnings contribution of efficiency
projects. The probability of the potential risks occurring and their potential impact on corporate
development were classified on the basis of the system for assessing the Group’s risk situation
in internal Group risk management reports (based on internal sensitivity analyses and models).
The operating risk situation was also compared with that of the previous year. The details relat-
ing to possible effects on the Group net result are netted, i. e. after the effects of risk mitigation
measures have been accounted for. The probability of possible risks occurring based on the
annual budget for the 2019 financial year as at the time of preparation of the management
report is classified as follows:
• Low: The probability of occurrence is 25% or less
• Medium: The probability of occurrence is more than 25% and up to 50%
• High: The probability of occurrence is more than 50%
60 M a n a g e M e n t R e p o R t
H a p a g - L L o y d a k t i e n g e s e L L s c H a f t i f i n a n c i a L s t a t e M e n t s 2 0 1 8 a n d M a n a g e M e n t R e p o R t

After considering countermeasures, the possible effects on the Group operating result (EBIT)
in the financial year are classified as follows:
• Low: In the event of occurrence, the negative impact on the Group’s earnings before
interest and taxes (EBIT) will be up to USD 100 million (previous year: up to USD 100 million)
• Medium: In the event of occurrence, the negative impact on the Group’s earnings before
interest and taxes (EBIT) will be more than USD 100 million and up to USD 250 million
(previous year: more than USD 100 million and up to USD 250 million)
• High: In the event of occurrence, the negative impact on the Group’s earnings before
interest and taxes (EBIT) will be more than USD 250 million (previous year: more than
USD 250 million)
The assessment of the risk situation compared to the previous year results from the change
in the probability of occurrence:
• Lower: The probability of occurrence has considerably decreased
• Equal: The probability of occurrence is unchanged
• Higher: The probability of occurrence has considerably increased
Key risks
Risk Probability of occurence
Potentialimpact
Probability of occurence in 2019 in comparison to the previous year
decrease in transport volume growth
Medium Low Higher
decrease in average freight rate
Medium High Equal
decline in Usd vs. eUR Low Low Lower
Rise in bunker con-sumption prices
Low Medium Lower
Liquidity 1 Low High Equal
Lower earnings contribu-tion of synergies
Low Medium n. a.
1 The assessment relates to the impact on the covenants to be complied with and on the liquidity situation.
From the point of view of Hapag-Lloyd AG’s single-entity financial statements in accordance
with HGB, a strengthening of the US dollar represents a significant risk for the valuation effects
of financial liabilities denominated in US dollars at the reporting date.
In the previous year reference was made to the synergies from the merger with UASC, while
the current year 2018 places a greater importance on the contribution to earnings by the effi-
ciency programs.
61M a n a g e M e n t R e p o R t
H a p a g - L L o y d a k t i e n g e s e L L s c H a f t i f i n a n c i a L s t a t e M e n t s 2 0 1 8 a n d M a n a g e M e n t R e p o R t

OPPORTUNITIES
Opportunities management – strategic focus on opportunities
At Hapag-Lloyd, recognising and exploiting opportunities are core elements of strategic man-
agement. Basis for the identification of opportunities are the systematic observation and analy-
sis of developments on the markets relevant to the Company and general and sector-specific
trends from which opportunities can be derived and assessed. This analysis and assessment
forms the basis for the initiation of measures which are geared towards long-term profitable
growth and are designed to contribute to a lasting increase in the Company’s value. As one of
the world’s leading container liner shipping companies, Hapag-Lloyd is subject to a wide range
of developments on the domestic and international markets. The general conditions described
in this report and the information regarding market, competition and business developments
reveal a diversity of potential opportunities.
By utilising and enhancing its own strengths and competitive advantages, Hapag-Lloyd strives
to exploit any potential opportunities that arise to the greatest possible extent. The continuous
identification of potential opportunities is an integral part of the strategy described in the chap-
ter “Group objectives and strategy”. Significant potential opportunities arise from the following
developments:
STRATEGIC AND OPERATIONAL OPPORTUNITIES
General economic opportunities
Container shipping is heavily dependent on the general prevailing conditions in the world’s
economies. Fluctuations in the economic climate have a strong, overproportional effect on this
industry. The development of freight rates, which have a significant influence on Hapag-Lloyd’s
financial and earnings position, are particularly dependent on the transport volume on the
routes and therefore on the economic development. According to IMF estimates, in 2019, the
world trade volume may grow by 4.0%, a similarly strong pace to 2018 (+4.0%). IHS Global
Insight believes that the volume of global container shipments will rise by 4.7% in 2019 and
therefore at a faster rate than in 2018 (4.0%). Furthermore, all trades can expect to see an
increase in transport volumes in 2019. If the economic recovery and, by extension, the de-
mand for container shipping services progresses at a faster rate than forecast in the cur-
rent year, this would present an opportunity to achieve additional volume growth.
Opportunities with regard to the chosen medium-term strategy
If unexpected potential is exploited by the measures planned under Strategy 2023, this could
have a positive impact on Hapag-Lloyd’s earnings situation.
62 M a n a g e M e n t R e p o R t
H a p a g - L L o y d a k t i e n g e s e L L s c H a f t i f i n a n c i a L s t a t e M e n t s 2 0 1 8 a n d M a n a g e M e n t R e p o R t
Opportunities arising from changes in trade flows
The increasing industrialisation of the emerging economic regions in Latin America, Asia and
Africa, and the rising consumption-related demand in these countries may result in more
goods being exchanged between these countries and with industrialised nations. This could
offer additional opportunities for growth in container shipping in 2019. Hapag-Lloyd is en -
deavouring to participate in these growth markets with a suitable service network.
Opportunities arising from developments in ship and container capacities
The market fluctuations between the supply of and demand for transport services can lead to
opportunities as a result of the achievement of cost advantages and increasing freight rates.
These opportunities are exemplified as follows:
If there is a large inventory of chartered ships, there may be cost advantages lasting several
months if ships are chartered at favourable rates and the freight rates increase as a result of
higher demand.
Hapag-Lloyd is working continuously on the further development of IT-based forecast models
in order to minimise empty legs and reduce the costs incurred because of them. This results in
cost advantages if efforts to reduce the empty leg ratio to below the market average prove to
be successful, which could have a positive effect on the earnings position.
Opportunities arising from membership of the THE Alliance
Hapag-Lloyd’s membership of alliances puts it in a position to offer its own customers a more
comprehensive network of liner services on important trades with regular departure times,
which would not be possible with its own fleet. This means that the Company is better able to
capitalise on opportunities arising from developments in transport volumes and ship capacities.
A possible expansion of the services and collaboration within the THE Alliance, for example
into hinterland transport, could provide additional growth opportunities.
Opportunities arising from local market leadership
The merger between Hapag-Lloyd and UASC took place on 24 May 2017, and the integration
was completed by the end of November 2017. The integration of UASC’s business activities
has strengthened Hapag-Lloyd’s market position in the Far East trade and provided it with
market access to the attractive Middle East trade. This gives the Company the opportunity to
increase its share of container shipments in these trades.
With its acquisition of CSAV’s container shipping activities, Hapag-Lloyd had already enhanced
its market position in the North and South America trades in particular, and also its local mar-
ket leadership in the Transatlantic trade.
63M a n a g e M e n t R e p o R t
H a p a g - L L o y d a k t i e n g e s e L L s c H a f t i f i n a n c i a L s t a t e M e n t s 2 0 1 8 a n d M a n a g e M e n t R e p o R t

FINANCIAL OPPORTUNITIES
Opportunities arising from an improvement in the company rating
The international rating agency Standard & Poor’s has given Hapag-Lloyd an issuer rating of
B+ and a stable outlook. On 25 July 2018, the rating agency Moody’s confirmed Hapag-Lloyd’s
unchanged corporate rating of B2 and a stable outlook. Both rating agencies took a positive
view of the acquisition of UASC’s business activities with regard to Hapag-Lloyd’s competitive-
ness. If there is a further significant improvement in Hapag-Lloyd’s earnings position, the rating
agencies could upgrade its company rating. An improved company rating could result in lower
finance costs.
Opportunities arising from improved access to the capital market
The shares of Hapag-Lloyd AG are listed on the Prime Standard segment of the Frankfurt
Stock Exchange since 6 November 2015. Following its successful IPO, Hapag-Lloyd has
strengthened its equity base and improved its access to the capital market. As a listed
company, there is a wider range of financing options available to Hapag-Lloyd if it needs to
obtain financing in the future. e. g. through the increased issuing of corporate bonds.
SUMMARISED OVERVIEW OF CORPORATE OPPORTUNITIES
In the opinion of Hapag-Lloyd’s Executive Board, the key opportunities relate to the successful
implementation of the efficiency and cost reduction programs of Strategy 2023 and the result-
ing positive effects on earnings, a noticeably positive trend in average freight rates, a much
sharper than expected increase in transport volume and the appreciation of the US dollar
against the euro.
These opportunities are regularly analysed and discussed in Hapag-Lloyd’s management
bodies. The Executive Board informs the Supervisory Board about the potential impact of the
aforementioned opportunities on the Company’s performance in its scheduled meetings and
in individual discussions.
64 M a n a g e M e n t R e p o R t
H a p a g - L L o y d a k t i e n g e s e L L s c H a f t i f i n a n c i a L s t a t e M e n t s 2 0 1 8 a n d M a n a g e M e n t R e p o R t

Key opportunities
Opportunities Probability of occurence
Potentialimpact
Probability of occurence in 2019 in comparison to the previous year
increase in transport volume growth
Low Low Lower
increase in average freight rate
Medium High Equal
increase in Usd vs. eUR High Low Higher
decrease in bunker consumption prices
High Medium Higher
Higher earnings contribu-tion of synergies
High Medium n. a.
From the point of view of Hapag-Lloyd AG’s single-entity financial statements according to
HGB, a weakening of the US dollar represents a significant opportunity for the valuation effects
of financial liabilities denominated in US dollars at the reporting date.
In the previous year reference was made to the synergies from the merger with UASC. For the
financial year 2018 the contribution to earnings by the efficiency programs have gained greater
importance.
OVERALL ASSESSMENT OF RISKS AND OPPORTUNITIES
The assessment of Hapag-Lloyd’s overall risk situation is the result of an examination of all of
the Group’s significant individual risks as they affect the Group as a whole. After the balance
sheet date of 31 December 2018, there are currently no indications of any risks, either alone or
in combination with other risks, which endanger the continued existence of Hapag-Lloyd as a
going concern. The once again solid balance sheet and the more than sufficient liquidity situa-
tion provide a stable foundation for Hapag-Lloyd’s expected organic growth. In light of the
continuing macroeconomic and geopolitical uncertainties in 2019, the assessment of overall
risk remains unchanged from 2018.
The main risk facing Hapag-Lloyd in 2019 continues to be a market environment characterised
by a strong level of competition, which could lead to renewed pressure on freight rates and, in
turn, to a significant potential impact on the earnings position. The outlook for global economic
performance is stable, and this should lead to increasing global trade and therefore to growing
demand for container transport services.
65M a n a g e M e n t R e p o R t
H a p a g - L L o y d a k t i e n g e s e L L s c H a f t i f i n a n c i a L s t a t e M e n t s 2 0 1 8 a n d M a n a g e M e n t R e p o R t

OUTLOOK
The general economic and sector-specific conditions which are of importance to container
shipping are presented and analysed in detail in the Economic report. A summary of the most
important external factors is given below.
In its latest economic outlook (January 2019), the International Monetary Fund (IMF) expects
global economic growth to reach 3.5% in the current year. This forecast means that the
global economy is set to grow at a slightly lower rate in 2019 than in the previous year (+3.7%).
According to the IMF, the volume of global trade, which is key to the demand for container
shipping services, will increase by 4.0% in 2019 (2018: +4.0%). This means that in 2019 the
growth in global trade will once again outpace that of the global economy. IHS Global Insight
(January 2019) is forecasting that the global container shipping volume will increase by 4.7%
to approximately 153 million TEU in 2019 (2018: 4.0%). As such, the expected rise in worldwide
transport volumes in container shipping for 2019 would be in line with the rate of growth for
global trade.
Following a rise in transport capacities (following scrapping and delays in deliveries) of approxi-
mately 1.1 million TEU to 21.9 million TEU in 2018, Drewry forecasts a nominal increase in trans-
port capacities of up to approximately 0.5 million TEU for the current year. In relation to the
total capacity of the global trading fleet, this represents an increase of around 2.5%. Although
the rise is expected to be lower than in the previous year (5.4%), the delivery of large vessels
for use on the Far East trade could also make it difficult to increase freight rates in 2019.
Hapag-Lloyd is anticipating a rise in the transport volume in 2019 in line with the general
growth of the market. Additionally assuming a lower increase in global transport capacity com-
pared to 2018, Hapag-Lloyd’s average freight rate in 2019 is likely to increase slightly com-
pared with the previous year. Hapag-Lloyd is also expecting the average bunker consumption
price in 2019 to be moderately higher compared to the previous year.
Provided that Hapag-Lloyd achieves the expected freight rate, the anticipated improvement in
revenue quality combined with the cost savings as part of Strategy 2023, and the expected
growth in volumes, it is forecasting an EBITDA in the range of 1.6 – 2.0 billion EUR and an EBIT
in the range of 0.5 – 0.9 billion EUR. Accounted for here is the currently expected impact on
EBITDA in the range of 370 – 470 million EUR as well as EBIT in the range of 10 – 50 million EUR
related to the first-time implementation of the reporting standard IFRS 16. Impairments on
goodwill, other intangible assets and property, plant and equipment are not considered. These
corrections are not expected at present but cannot be ruled out given current geopolitical
developments and other factors.
66 M a n a g e M e n t R e p o R t
H a p a g - L L o y d a k t i e n g e s e L L s c H a f t i f i n a n c i a L s t a t e M e n t s 2 0 1 8 a n d M a n a g e M e n t R e p o R t

The factors influencing Hapag-Lloyd AG’s operating result and that of the Group differ mainly
as a result of the accounting principles used (IFRS and HGB) and of the different functional
currencies (euro and US dollar). Despite the persistently intense competition in the container
shipping industry, freight rates made a recovery in 2018 compared with the previous year. In
contrast to the previous year, the depreciation of the euro against the US dollar led to a signifi-
cant deterioration in earnings in the 2018 financial year on Hapag-Lloyd AG level.
Given the development of the operating result of Hapag-Lloyd AG in terms of currency transla-
tion effects as at the 2018 balance sheet date, we can expect an improvement in the operating
result again in the 2019 financial year, assuming the USD / EUR exchange rate remains con-
stant. This statement is to be considered in connection with the forecast for the Group for the
2019 financial year excluding the effects of the accounting standard IFRS 16, which is not rele-
vant under German commercial law. The earnings forecast is based on the assumption of con-
stant exchange rates.
Key benchmark figures for the 2019 outlook
global economic growth (iMf) 3.5%
increase in global trade (iMf) 4.0%
increase in global container transport volume (iHs) 4.7%
transport volume, Hapag-Lloyd Increasing slightly
average bunker consumption prices, Hapag-Lloyd Increasing moderately
average freight rate, Hapag-Lloyd Increasing slightly
eBitda (earnings before interest, taxes, depreciation and amortisation), Hapag-Lloyd
1.6 – 2.0 billion EUR
eBit (earnings before interest and taxes), Hapag-Lloyd 0.5 – 0.9 billion EUR
The majority of the earnings are expected to be generated in the second half of the year, par-
ticularly in the third quarter, when the peak season occurs. This is because the volume of
global trade fluctuates throughout the year and is usually much higher in the second half of
the year than in the first.
Risks that may have an impact on the forecast for business development are described in
detail in the risk report. Significant risks for the Group’s revenue and earnings development
include in particular a slowdown in global economic and trade volume growth, a significant
and lasting rise in bunker prices extending beyond the average bunker consumption price
level in 2018, a sharp and persistent increase in the euro against the US dollar and a lasting
reduction in freight rates. Additional risks could result from the consolidation of the industry
and changes in the composition of global alliances.
The occurrence of one or more of these risks could have a substantial negative impact on the
industry and, by extension, on the business development of Hapag-Lloyd in the 2019 financial
year, which could also lead to impairments on goodwill, other intangible assets and property,
plant and equipment.
67M a n a g e M e n t R e p o R t
H a p a g - L L o y d a k t i e n g e s e L L s c H a f t i f i n a n c i a L s t a t e M e n t s 2 0 1 8 a n d M a n a g e M e n t R e p o R t
REMUNERATION REPORT
The remuneration report is part of the management report of Hapag-Lloyd AG and describes
the basic features of the remuneration system for the Executive Board and Supervisory Board
members and the amount and structure of individual remuneration. The report adheres to the
requirements of the German Corporate Governance Code (GCGC), complies with the legal
provisions of the German Stock Corporation Act (AktG) and the German Commercial Code
(HGB) and incorporates the principles of German Accounting Standard 17 (DRS 17).
1. PRINCIPLES AND OBJECTIVES / GENERAL PRINCIPLES
The Supervisory Board regularly reviews the remuneration of the Executive Board and, if ne -
cessary, engages the services of external consultants for this purpose. As part of this review,
both the remuneration structure and the amount of Executive Board remuneration are as-
sessed, in particular by comparing them with the external market (horizontal benchmarking)
and other remuneration within the Company (vertical benchmarking). If the review identifies
the need to change the remuneration system, structure or amount, the Supervisory Board’s
Presidential and Personnel Committee submits appropriate proposals to the Supervisory
Board for approval.
The purpose of the remuneration system for the Executive Board is to remunerate the Execu-
tive Board members appropriately in accordance with their duties and responsibilities, while
directly taking into consideration the performance of each Executive Board member and the
success of the Company.
The structure of the remuneration system for the Executive Board of Hapag-Lloyd AG aims
to incentivise successful, long-term corporate governance that increases the value of the
Company.
Executive Board remuneration initially comprises fixed basic remuneration, which is paid
monthly and takes into consideration the duties and activities of the Executive Board mem-
bers, and performance-related short-term variable remuneration in the form of an annual
bonus. The Supervisory Board can also grant additional remuneration in special circumstan-
ces, such as for extraordinary activities and workloads during the financial year. In addition,
benefits in kind and other fringe benefits are granted to the Executive Board members.
In addition, a long-term remuneration element exists for all Executive Board members (long-
term incentive plan – LTIP) which is directly linked to changes in the value of the Company and
therefore aims to incentivise long-term commitment to the Company.
Executive Board remuneration in the 2018 financial year was the same as in the previous year.
68 M a n a g e M e n t R e p o R t
H a p a g - L L o y d a k t i e n g e s e L L s c H a f t i f i n a n c i a L s t a t e M e n t s 2 0 1 8 a n d M a n a g e M e n t R e p o R t

1.1 Changes to the Executive Board
On 28 March 2018, the Supervisory Board of Hapag-Lloyd AG approved a reallocation of the
Executive Board’s responsibilities. CEO Rolf Habben Jansen took responsibility for global sales
activities. Joachim Schlotfeldt became a new member of Hapag-Lloyd AG’s Executive Board
on 1 April 2018. In addition to other areas of responsibility, he took charge of human resources
(prior to that, the responsibility of the CEO) as Labour Director, as well as global procurement
as Chief Personnel and Global Procurement Officer (CPO). The latter had been the responsibil-
ity of the Chief Operating Officer (COO). The Chief Commercial Officer (CCO) Thorsten Haeser
resigned on 31 March 2018.
2. MAIN REMUNERATION COMPONENTS
The main remuneration components are broken down as follows:
2.1 Non-performance-related components
a) Fixed annual remuneration
Fixed annual remuneration is cash remuneration based on the financial year. In particular, it
reflects the responsibilities and the position of the respective Executive Board member. This
fixed income is set individually and is divided into twelve equal amounts which are paid at the
end of each month. If an employment contract starts or ends during a financial year, the fixed
remuneration is paid pro rata.
b) Non-cash remuneration and other fringe benefits
Non-cash remuneration and other fringe benefits comprise benefits in kind such as the provi-
sion of a company car, use of the company driver service, retirement benefits, funeral allow-
ances and allowances for surviving dependants, and insurance cover such as accident in sur -
ance. Non-cash remuneration due is detailed in this remuneration report with the amounts
stipulated by tax legislation.
The Company reimburses Mr Burr for living costs at an appropriate amount. It also covers the
school costs of Mr Burr’s children and the cost of one flight per year to Chile for Mr Burr and
his family. Furthermore, the Company covers the language tuition costs of Mr Burr and his
wife. If Mr Burr is required to pay income tax on these benefits, Hapag-Lloyd AG will pay the
applicable income tax and the benefits will increase accordingly.
With regard to Mr Schlotfeldt, the Company covered his expenses for relocating to Hamburg
in the financial year as well as his living costs for three months. The costs were covered at an
appropriate amount in return for supporting documentation.
69M a n a g e M e n t R e p o R t
H a p a g - L L o y d a k t i e n g e s e L L s c H a f t i f i n a n c i a L s t a t e M e n t s 2 0 1 8 a n d M a n a g e M e n t R e p o R t

2.2 Performance-related components
a) Short-term variable remuneration
Short-term variable remuneration is granted in the form of an annual bonus which is paid after
the consolidated financial statements have been examined and audited by the external audi-
tors and subsequently approved. Since the 2016 financial year, the annual bonus of the ordi-
nary Executive Board members has been equal to 0.065% of the Group’s earnings before
interest and taxes (EBIT), capped at EUR 400,000 (gross); the CEO’s annual bonus is equal
to 0.1% of the Group’s EBIT, capped at EUR 600,000 (gross).
Mr Schlotfeldt was granted a guaranteed bonus of EUR 25,000 (gross) for every full calendar
month in which he works for the Company as an Executive Board member in the period from
1 April 2018 to 31 March 2019. It is paid irrespective of the operating result achieved. If the
Group’s operating result leads to a higher bonus based on the calculation method outlined
above, the higher amount is paid.
In line with the Supervisory Board’s resolution on 6 November 2018, short-term variable remu-
neration has been adjusted as and from the 2019 financial year as follows: the variable bonus
of ordinary Executive Board members is 0.05% of the Company’s earnings before interest and
taxes (EBIT). This is capped at max. EUR 600,000 (gross) per annum. The variable bonus of
the CEO is 0.075% of the Company’s earnings before interest and taxes (EBIT). This is capped
at max. EUR 900,000 (gross) per annum.
b) Long-term variable remuneration
Under long-term variable remuneration (long-term incentive plan – LTIP), a specified euro
amount is granted to the Executive Board members per calendar year. This allocation amount
is converted into virtual shares in the Company on a specific date. The relevant share price for
the conversion at the time of allocation is the average share price over the last 60 trading
days before the virtual shares are granted, which happens on the first trading day of the calen-
dar year. The virtual shares are divided equally into performance share units and retention
share units. They are subject to a four-year vesting period, during which the corresponding
values are unavailable.
The retention share units automatically become non-forfeitable when the vesting period
expires (non-forfeitable retention share units). They then depend entirely on the Executive
Board member’s length of service.
The number of performance share units relevant for the payment depends on the performance
of the Hapag-Lloyd share compared with a specific, industry-based reference index – the
DAXglobal Shipping index – over the performance period. The number of performance share
units can be a maximum of 1.5 and a minimum of zero, depending on the performance of the
Hapag-Lloyd share relative to the chosen index as measured by a performance factor. If the
performance factor is zero, all of the performance share units are forfeited.
70 M a n a g e M e n t R e p o R t
H a p a g - L L o y d a k t i e n g e s e L L s c H a f t i f i n a n c i a L s t a t e M e n t s 2 0 1 8 a n d M a n a g e M e n t R e p o R t

If capital measures which affect the value of real shares are carried out during the term of
the LTIP, the conditions of the plan state that the Executive Board members must be treated
like owners of real shares as a rule. In the event of an ordinary capital increase, the stake in
the company held by owners of real shares is diluted. However, they are granted subscription
rights to new shares in return. Under the conditions of the plan, the Executive Board members
are not automatically granted a subscription right in the event of an ordinary capital increase.
To compensate them for being treated differently to owners of real shares, for all LTIP tranches
belonging to Executive Board members which are in existence when a capital increase is
carried out, the number of shares is adjusted by a value equal to the subscription rights that
an owner of real shares with the same number of shares is entitled to. The additional virtual
shares here are valued at the arithmetical share price on the day before trading of the sub-
scription rights commences (ex-subscription rights). The rule must be applied separately to all
LTIP tranches in existence at the time of the capital measure. The additional virtual shares are
based directly on the existing virtual shares of the respective LTIP tranches. As a result, the
additional virtual shares are given the same parameters as were defined in the conditions of
the plan and at the time the respective tranche was granted. The additional virtual shares are
consequently a component of the respective tranche.
Hapag-Lloyd AG carried out an ordinary capital increase in October 2017. The capital increase
led to a reduction in the share price and therefore to a markdown on the value of the existing
virtual shares for the Executive Board members. This dilution of the virtual shares was com-
pensated for by adjusting the number of virtual shares based on the procedure outlined above,
whereby an arithmetical share price of EUR 35.13 was used.
When the performance period expires, the number of non-forfeitable virtual shares is con-
verted into a euro amount by multiplying the non-forfeitable virtual shares by the relevant share
price. This share price is equal to the average share price over the last 60 trading days before
the performance period ends.
The amount calculated in this way is paid to the respective Executive Board member as a
gross amount up to a specific limit on 31 March of the year following the end of the perfor-
mance period. This upper limit is EUR 750,000 (gross) for ordinary Executive Board members
and EUR 1,050,000 (gross) for the CEO.
If an Executive Board member steps down from their position before the performance period
ends without cause or if their employment contract is extraordinarily terminated by Hapag-
Lloyd for cause pursuant to Section 626 of the German Civil Code (BGB) (“bad leaver”), all
en titlements under the long-term incentive programme are forfeited.
If the employment contract of an Executive Board member expires, the participant retires or
the employment contract ends due to the invalidity of the participant, their entitlements under
the LTIP for the tranches which have not yet been paid remain. As a basic principle, the alloca-
tion amount for the financial year in which the participant resigns is granted on a pro rata basis.
For resignations in the aforementioned cases, the performance period ends when the employ-
ment contract ends, and payment is made at the latest at the end of the third calendar month
following the end of the performance period.
71M a n a g e M e n t R e p o R t
H a p a g - L L o y d a k t i e n g e s e L L s c H a f t i f i n a n c i a L s t a t e M e n t s 2 0 1 8 a n d M a n a g e M e n t R e p o R t

If an employment contract begins during a financial year, as a basic principle the long-term
variable remuneration component is granted on the basis of the pro rata allocation amount for
the corresponding financial year. Exceptions to this can be made on an individual basis.
Share-based remuneration under the 2018 long-term incentive plan (LTIP)
Allotment for 2018 financial year
Number of shares on allotment 1
Fair value on allotment
in EUR
Total value on allotment (allotment amount)
in EUR
Rolf Habben Jansen (Chairman of the Executive Board) 20,784 33.68 700,000
Nicolás Burr 14,846 33.68 500,000
Anthony J. Firmin 14,846 33.68 500,000
Thorsten Haeser (Member of the Executive Board until 31 March 2018) 11,134 33.68 375,000
Joachim Schlotfeldt (Member of the Executive Board since 1 April 2018) 11,134 33.68 375,000
Total 72,744 2,450,000
1 The number of shares allotted is commercially rounded to the nearest whole number in accordance with the terms and conditions of the 2018 LTIP.
Share-based remuneration under the 2017 long-term incentive plan (LTIP)
Allotment for 2017 financial year
Number of shares on allotment 1
Fair value on allotment
in EUR
Total value on allotment (allotment amount)
in EUR
Rolf Habben Jansen (Chairman of the Executive Board) 37,294 18.77 700,000
Nicolás Burr 26,638 18.77 500,000
Anthony J. Firmin 26,638 18.77 500,000
Thorsten Haeser (Member of the Executive Board until 31 March 2018) 26,638 18.77 500,000
Total 117,208 2,200,000
1 The number of shares allotted is commercially rounded to the nearest whole number in accordance with the terms and conditions of the 2017 LTIP.
As a result of the ordinary capital increase carried out by Hapag-Lloyd AG in October 2017, the
number of shares in the LTIP 2017 for the CEO, Mr Habben Jansen, was adjusted by 392, and
for all other members of the Executive Board by 280.
72 M a n a g e M e n t R e p o R t
H a p a g - L L o y d a k t i e n g e s e L L s c H a f t i f i n a n c i a L s t a t e M e n t s 2 0 1 8 a n d M a n a g e M e n t R e p o R t

c) Possible additional remuneration in cash (discretionary bonus)
The Executive Board contracts also stipulate that the Supervisory Board may grant additional
remuneration in special circumstances or for extraordinary activities.
2.3 Company pension
For every full calendar year, the Executive Board members receive an annual lump sum equal
to 20% of their fixed annual remuneration for the purpose of a pension in the form of a defined
contribution payment pursuant to Section 1 (2) (1) of the German Company Pensions Act
(BetrAVG). The payment is financed by annual contributions from the Company to an assis-
tance fund and is made until the Executive Board members have reached the age of 67 or
until their employment contracts end. If an employment contract starts or ends during a finan-
cial year, the amount is paid pro rata.
An exception to this is the company pensions of Anthony J. Firmin and Joachim Schlotfeldt,
who are due a company pension payment of EUR 72,000 per annum and EUR 69,000 per
annum respectively as a result of their long-standing service prior to their appointment as
Executive Board members. This amount will be paid when their statutory retirement com-
mences. This will be further supplemented by the annual conversion of 20% of fixed annual
remuneration into pension entitlements. The entitlements of Mr Firmin and Mr Schlotfeldt
under this company pension will be transferred to their surviving dependants to a limited
extent after they are deceased.
2.4 Regulations in the event that Executive Board activities end
a) Severance payment cap in the event that Executive Board activities
end prematurely
In accordance with the German Corporate Governance Code (GCGC), the employment con-
tracts of the Executive Board members provide for a general cap on any severance payments.
Accordingly, payments to an Executive Board member whose Executive Board activities end
prematurely will not exceed two annual remunerations and must not remunerate more than the
remaining term of the employment contract. In the event that an Executive Board member’s
contract is terminated for cause pursuant to Section 626 BGB (“bad leaver”), the employment
contracts do not provide for any severance payment or remuneration under the LTIP.
When calculating the severance payment cap, the remuneration in the last full financial year is
used as a basis (including short-term variable remuneration and fringe benefits); if the Execu-
tive Board member has been in office for two full financial years when the contract ends pre-
maturely, the average remuneration for the last two financial years is used as a basis. The LTIP
is not taken into consideration when calculating the severance payment.
73M a n a g e M e n t R e p o R t
H a p a g - L L o y d a k t i e n g e s e L L s c H a f t i f i n a n c i a L s t a t e M e n t s 2 0 1 8 a n d M a n a g e M e n t R e p o R t

The Chief Commercial Officer Thorsten Haeser resigned on 31 March 2018. In relation to the
early, mutual termination of his employment contract, Mr Haeser received early payment of the
benefits contractually agreed until the original end date of his employment contract in the first
quarter of the financial year. This comprised in particular a bonus of EUR 0.3 million in lieu of all
of his entitlements to short-term variable remuneration for the financial year. Additionally, an
amount of EUR 2.6 million relating to the LTIP tranches from 2015 to 2018 (long-term variable
remuneration) was paid early. Mr Haeser also received a severance payment of EUR 0.2 million
in the first quarter of the financial year for the early termination of his employment contract.
b) Post-contractual non-compete restrictions
No post-contractual non-compete restrictions have been agreed with the Executive Board
members.
c) Change-of-control clause
The employment contracts of the Executive Board members do not contain any change-of-
control clauses.
The LTIP stipulates that the LTIP ceases in the event of a change of control as defined in the
German Securities Acquisition and Takeover Act (WpÜG). The virtual shares granted until then
become non-forfeitable when the change of control occurs and, pursuant to the conditions of
the LTIP, are converted into a euro amount that is to be paid to the respective Executive Board
member in the short term. If this amount falls below the relevant allocation amount for the
Executive Board member, the Executive Board member receives a payment equal to the allo-
cation amount instead.
2.5 Remuneration of the Executive Board in the 2018 financial year
a) Total remuneration of active Executive Board members pursuant to the
German Commercial Code (HGB) and German Accounting Standard 17 (DRS 17)
The total remuneration granted to active Executive Board members in the financial year was
EUR 6.8 million (2017: EUR 6.2 million). This includes share-based payments with a fair value
of EUR 2.5 million (2017: EUR 2.2 million) on the date the remuneration was granted. The
active Executive Board members were granted a total of 72,744 virtual shares in the financial
year (2017: 117,208).
74 M a n a g e M e n t R e p o R t
H a p a g - L L o y d a k t i e n g e s e L L s c H a f t i f i n a n c i a L s t a t e M e n t s 2 0 1 8 a n d M a n a g e M e n t R e p o R t

b) Individual remuneration of active Executive Board members pursuant to the
German Commercial Code (HGB) and German Accounting Standard 17 (DRS 17)
Remuneration of the Executive Board
EUR
Fixed remuneration Variable remunerationTotal
remuneration
Components with short-term incentive effect
Components with long-term
incentive effects
Fixed salary
Fringe benefits Bonuses
Share-based remuneration
(LTIP 2017, LTIP 2018)
Rolf Habben Jansen (Chairman of the Executive Board)
2018 750,000 172,053 443,039 700,000 2,065,092
2017 750,000 172,086 410,878 700,000 2,032,964
Nicolás Burr
2018 450,000 387,694 287,976 500,000 1,625,670
2017 450,000 357,781 267,071 500,000 1,574,852
Anthony J. Firmin
2018 450,000 22,053 287,976 500,000 1,260,029
2017 450,000 22,086 267,071 500,000 1,239,157
Thorsten Haeser (Member of the Executive Board until 31 March 2018)
2018 112,500 71,146 300,000 375,000 858,646
2017 450,000 104,629 267,071 500,000 1,321,700
Joachim Schlotfeldt (Member of the Executive Board since 1 April 2018)
2018 337,500 29,519 225,000 375,000 967,019
Total 2018 2,100,000 682,465 1,543,991 2,450,000 6,776,456
Total 2017 2,100,000 656,582 1,212,091 2,200,000 6,168,673
In the past financial year, no member of the Executive Board received payments or corre-
sponding commitments from a third party with regard to their activities as an Executive Board
member. In addition, there were no advance payments or loans to members of the Executive
Board as at 31 December 2018 or 31 December 2017.
75M a n a g e M e n t R e p o R t
H a p a g - L L o y d a k t i e n g e s e L L s c H a f t i f i n a n c i a L s t a t e M e n t s 2 0 1 8 a n d M a n a g e M e n t R e p o R t

With regard to pension commitments, the following obligations exist:
Pension plans (pension plans and death grants) persuant to
German Commercial Code (HGB)
EUR Present value Personnel expenses
Rolf Habben Jansen (Chairman of the Executive Board)
2018 5,756 666
2017 4,741 746
Nicolás Burr
2018 2,209 322
2017 1,711 448
Anthony J. Firmin
2018 1,847,674 170,369
2017 1,516,834 –121,349
Thorsten Haeser (Member of the Executive Board until 31 March 2018)
2018 0 –2,160
2017 2,084 640
Joachim Schlotfeldt (Member of the Executive Board since 1 April 2018)
2018 1,466,629 –50,888
Total 2018 3,322,268 118,309
Total 2017 1,525,370 –119,515
76 M a n a g e M e n t R e p o R t
H a p a g - L L o y d a k t i e n g e s e L L s c H a f t i f i n a n c i a L s t a t e M e n t s 2 0 1 8 a n d M a n a g e M e n t R e p o R t

77M a n a g e M e n t R e p o R t
H a p a g - L L o y d a k t i e n g e s e L L s c H a f t i f i n a n c i a L s t a t e M e n t s 2 0 1 8 a n d M a n a g e M e n t R e p o R t

c) Disclosure of remuneration pursuant to the German Corporate Governance
Code (GCGC)
The German Corporate Governance Code (GCGC) for listed companies also recommends
disclosure of Executive Board remuneration in a table detailing the amounts granted and
amounts paid.
Amounts granted for the financial year
Remuneration granted Rolf Habben Jansen
(Chairman of the Executive Board)Nicolás Burr Anthony J. Firmin
EUR 2017 2018 2018
(min.)2018
(max.)2017 2018 2018
(min.)2018
(max.)2017 2018 2018
(min.)2018
(max.)
Fixed salary 750,000 750,000 750,000 750,000 450,000 450,000 450,000 450,000 450,000 450,000 450,000 450,000
Fringe benefits 172,086 172,053 172,053 172,053 357,781 387,694 387,694 387,694 22,086 22,053 22,053 22,053
Total 922,086 922,053 922,053 922,053 807,781 837,694 837,694 837,694 472,086 472,053 472,053 472,053
One-year variable remuneration 410,878 443,039 0 600,000 267,071 287,976 0 400,000 267,071 287,976 0 400,000
Multiple-year variable remuneration 700,000 700,000 0 1,050,000 500,000 500,000 0 750,000 500,000 500,000 0 750,000
LTIP 2017 (term: 2017 – 2020) 700,000 0 – – 500,000 0 – – 500,000 0 – –
LTIP 2018 (term: 2018 – 2021) 0 700,000 0 1,050,000 0 500,000 0 750,000 0 500,000 0 750,000
Total 1,110,878 1,143,039 0 1,650,000 767,071 787,976 0 1,150,000 767,071 787,976 0 1,150,000
Service cost 1,760 1,550 1,550 1,550 842 767 767 767 218,981 203,186 203,186 203,186
Total remuneration 2,034,724 2,066,642 923,603 2,573,603 1,575,694 1,626,437 838,461 1,988,461 1,458,138 1,463,215 675,239 1,825,239
Remuneration granted Thorsten Haeser
(Member of the Executive Board until 31 March 2018)Joachim Schlotfeldt
(Member of the Executive Board since 1 April 2018)
EUR 2017 2018 2018
(min.)2018
(max.)2017 2018 2018
(min.)2018
(max.)
Fixed salary 450,000 112,500 112,500 112,500 0 337,500 337,500 337,500
Fringe benefits 104,629 71,146 71,146 71,146 0 29,519 29,519 29,519
Total 554,629 183,646 183,646 183,646 0 367,019 367,019 367,019
One-year variable remuneration 267,071 300,000 300,000 300,000 0 225,000 225,000 400,000
Multiple-year variable remuneration 500,000 375,000 0 750,000 0 375,000 0 750,000
LTIP 2017 (term: 2017 – 2020) 500,000 0 – – 0 0 – –
LTIP 2018 (term: 2018 – 2021) 0 375,000 0 750,000 0 375,000 0 750,000
Total 767,071 675,000 300,000 1,050,000 0 600,000 225,000 1,150,000
Service cost 1,260 265 265 265 0 156,395 156,395 156,395
Total remuneration 1,322,960 858,911 483,911 1,233,911 0 1,123,414 748,414 1,673,414
78 M a n a g e M e n t R e p o R t
H a p a g - L L o y d a k t i e n g e s e L L s c H a f t i f i n a n c i a L s t a t e M e n t s 2 0 1 8 a n d M a n a g e M e n t R e p o R t

c) Disclosure of remuneration pursuant to the German Corporate Governance
Code (GCGC)
The German Corporate Governance Code (GCGC) for listed companies also recommends
disclosure of Executive Board remuneration in a table detailing the amounts granted and
amounts paid.
Amounts granted for the financial year
Remuneration granted Rolf Habben Jansen
(Chairman of the Executive Board)Nicolás Burr Anthony J. Firmin
EUR 2017 2018 2018
(min.)2018
(max.)2017 2018 2018
(min.)2018
(max.)2017 2018 2018
(min.)2018
(max.)
Fixed salary 750,000 750,000 750,000 750,000 450,000 450,000 450,000 450,000 450,000 450,000 450,000 450,000
Fringe benefits 172,086 172,053 172,053 172,053 357,781 387,694 387,694 387,694 22,086 22,053 22,053 22,053
Total 922,086 922,053 922,053 922,053 807,781 837,694 837,694 837,694 472,086 472,053 472,053 472,053
One-year variable remuneration 410,878 443,039 0 600,000 267,071 287,976 0 400,000 267,071 287,976 0 400,000
Multiple-year variable remuneration 700,000 700,000 0 1,050,000 500,000 500,000 0 750,000 500,000 500,000 0 750,000
LTIP 2017 (term: 2017 – 2020) 700,000 0 – – 500,000 0 – – 500,000 0 – –
LTIP 2018 (term: 2018 – 2021) 0 700,000 0 1,050,000 0 500,000 0 750,000 0 500,000 0 750,000
Total 1,110,878 1,143,039 0 1,650,000 767,071 787,976 0 1,150,000 767,071 787,976 0 1,150,000
Service cost 1,760 1,550 1,550 1,550 842 767 767 767 218,981 203,186 203,186 203,186
Total remuneration 2,034,724 2,066,642 923,603 2,573,603 1,575,694 1,626,437 838,461 1,988,461 1,458,138 1,463,215 675,239 1,825,239
Remuneration granted Thorsten Haeser
(Member of the Executive Board until 31 March 2018)Joachim Schlotfeldt
(Member of the Executive Board since 1 April 2018)
EUR 2017 2018 2018
(min.)2018
(max.)2017 2018 2018
(min.)2018
(max.)
Fixed salary 450,000 112,500 112,500 112,500 0 337,500 337,500 337,500
Fringe benefits 104,629 71,146 71,146 71,146 0 29,519 29,519 29,519
Total 554,629 183,646 183,646 183,646 0 367,019 367,019 367,019
One-year variable remuneration 267,071 300,000 300,000 300,000 0 225,000 225,000 400,000
Multiple-year variable remuneration 500,000 375,000 0 750,000 0 375,000 0 750,000
LTIP 2017 (term: 2017 – 2020) 500,000 0 – – 0 0 – –
LTIP 2018 (term: 2018 – 2021) 0 375,000 0 750,000 0 375,000 0 750,000
Total 767,071 675,000 300,000 1,050,000 0 600,000 225,000 1,150,000
Service cost 1,260 265 265 265 0 156,395 156,395 156,395
Total remuneration 1,322,960 858,911 483,911 1,233,911 0 1,123,414 748,414 1,673,414
79M a n a g e M e n t R e p o R t
H a p a g - L L o y d a k t i e n g e s e L L s c H a f t i f i n a n c i a L s t a t e M e n t s 2 0 1 8 a n d M a n a g e M e n t R e p o R t

Amounts paid for the financial year
Remuneration disbursed Rolf Habben Jansen (Chairman of the Executive Board)
Nicolás Burr Anthony J. Firmin Thorsten Haeser (Member of the Executive Board
until 31 March 2018)
Joachim Schlotfeldt (Member of the Executive Board
since 1 April 2018)
EUR 2018 2017 2018 2017 2018 2017 2018 2017 2018 2017
Fixed salary 750,000 750,000 450,000 450,000 450,000 450,000 112,500 450,000 337,500 0
Fringe benefits 172,053 172,086 387,694 357,781 22,053 22,086 71,146 104,629 29,519 0
Total 922,053 922,086 837,694 807,781 472,053 472,086 183,646 554,629 367,019 0
One-year variable remuneration 443,039 410,878 287,976 267,071 287,976 267,071 300,000 267,071 225,000 0
Multiple-year variable remuneration 0 0 0 0 0 0 2,615,752 0 0 0
LTIP 2015 (term: 2015 – 2018) 0 0 0 0 0 0 750,000 0 0 0
LTIP 2016 (term: 2016 – 2019) 0 0 0 0 0 0 750,000 0 0 0
LTIP 2017 (term: 2017 – 2020) 0 0 0 0 0 0 750,000 0 0 0
LTIP 2018 (term: 2018 – 2021) 0 – 0 – 0 – 365,752 – 0 –
Other 0 0 0 0 0 0 0 0 0 0
Total 443,039 410,878 287,976 267,071 287,976 267,071 2,915,752 267,071 225,000 0
Service cost 1,550 1,760 767 842 203,186 218,981 265 1,260 156,395 0
Total remuneration 1,366,642 1,334,724 1,126,437 1,075,694 963,215 958,138 3,099,663 822,960 748,414 0
80 M a n a g e M e n t R e p o R t
H a p a g - L L o y d a k t i e n g e s e L L s c H a f t i f i n a n c i a L s t a t e M e n t s 2 0 1 8 a n d M a n a g e M e n t R e p o R t

Amounts paid for the financial year
Remuneration disbursed Rolf Habben Jansen (Chairman of the Executive Board)
Nicolás Burr Anthony J. Firmin Thorsten Haeser (Member of the Executive Board
until 31 March 2018)
Joachim Schlotfeldt (Member of the Executive Board
since 1 April 2018)
EUR 2018 2017 2018 2017 2018 2017 2018 2017 2018 2017
Fixed salary 750,000 750,000 450,000 450,000 450,000 450,000 112,500 450,000 337,500 0
Fringe benefits 172,053 172,086 387,694 357,781 22,053 22,086 71,146 104,629 29,519 0
Total 922,053 922,086 837,694 807,781 472,053 472,086 183,646 554,629 367,019 0
One-year variable remuneration 443,039 410,878 287,976 267,071 287,976 267,071 300,000 267,071 225,000 0
Multiple-year variable remuneration 0 0 0 0 0 0 2,615,752 0 0 0
LTIP 2015 (term: 2015 – 2018) 0 0 0 0 0 0 750,000 0 0 0
LTIP 2016 (term: 2016 – 2019) 0 0 0 0 0 0 750,000 0 0 0
LTIP 2017 (term: 2017 – 2020) 0 0 0 0 0 0 750,000 0 0 0
LTIP 2018 (term: 2018 – 2021) 0 – 0 – 0 – 365,752 – 0 –
Other 0 0 0 0 0 0 0 0 0 0
Total 443,039 410,878 287,976 267,071 287,976 267,071 2,915,752 267,071 225,000 0
Service cost 1,550 1,760 767 842 203,186 218,981 265 1,260 156,395 0
Total remuneration 1,366,642 1,334,724 1,126,437 1,075,694 963,215 958,138 3,099,663 822,960 748,414 0
d) Former Executive Board members, including those who resigned
in the financial year
The total remuneration for former members of the Executive Board and their surviving depend-
ants amounted to EUR 1.1 million in the 2018 financial year (previous year: EUR 0.8 million).
Provisions created under HGB for current pensions and entitlements to pensions for former
Executive Board members and their surviving dependants totalled EUR 19.7 million in the 2018
financial year (previous year: EUR 18.7 million).
81M a n a g e M e n t R e p o R t
H a p a g - L L o y d a k t i e n g e s e L L s c H a f t i f i n a n c i a L s t a t e M e n t s 2 0 1 8 a n d M a n a g e M e n t R e p o R t

3. REMUNERATION OF THE SUPERVISORY BOARD
Remuneration of the Supervisory Board is regulated in Section 12 of the Company’s articles of
association. The remuneration system reflects the responsibilities and activities of the Super-
visory Board members. In addition to a reimbursement of their expenses and the VAT payable
on their remuneration and expenses, the members of the Supervisory Board receive fixed
annual remuneration. There is no variable remuneration component.
The fixed annual remuneration of the Supervisory Board is EUR 150,000 for the Chairman,
EUR 75,000 for deputies and EUR 50,000 for other members. The Chairman of the Presiden-
tial and Personnel Committee and the Chairman of the Audit and Finance Committee each
receive additional remuneration of EUR 20,000 and the other members of these committees
each receive EUR 10,000. If Supervisory Board members receive remuneration for activities
on the Supervisory Board of a subsidiary of Hapag-Lloyd AG, this remuneration is offset
against the aforementioned remuneration.
The members of the Supervisory Board also receive an attendance fee of EUR 300 for every
meeting of the Supervisory Board and its committees that they attend.
For Supervisory Board members who are only on the Supervisory Board for part of the
financial year, remuneration is granted pro rata, rounded to full months. This also applies to
increases in remuneration for the Chairman of the Supervisory Board and his deputies as
well as to increases in remuneration for membership and chairmanship of a Supervisory
Board committee.
82 M a n a g e M e n t R e p o R t
H a p a g - L L o y d a k t i e n g e s e L L s c H a f t i f i n a n c i a L s t a t e M e n t s 2 0 1 8 a n d M a n a g e M e n t R e p o R t

The following table shows the amounts due to the individual members of the Supervisory
Board:
EUR
Fixed remuneration
Remuneration for committee service
Meeting allowance Total
2018 2017 2018 2017 2018 2017 2018 2017
Dr Nabeel Al-Amudi . / . 29,167 . / . 5,833 . / . 1,200 . / . 36,200
Turqi Alnowaiser 45,833 . / . 9,167 . / . 2,400 . / . 57,400 . / .
Scheich Ali Al-Thani 50,000 33,333 10,000 6,667 2,100 600 62,100 40,600
Christine Behle 56,250 75,000 7,500 10,000 1,500 2,100 65,250 87,100
Michael Behrendt 150,000 150,000 20,000 20,000 1,800 2,100 171,800 172,100
Jutta Diekamp 50,000 50,000 10,000 10,000 1,800 2,100 61,800 62,100
Nicola Gehrt 50,000 50,000 . / . . / . 1,800 1,800 51,800 51,800
Karl Gernandt 62,500 50,000 25,000 30,000 2,700 4,200 90,200 84,200
Oscar Hasbún 62,500 75,000 15,000 10,000 3,000 4,200 80,500 89,200
Dr Rainer Klem-mt-Nissen 50,000 50,000 20,000 20,000 3,000 3,900 73,000 73,900
Joachim Kramer 50,000 29,167 . / . . / . 1,800 600 51,800 29,767
Annabell Kröger 50,000 29,167 10,000 5,833 3,000 1,500 63,000 36,500
Arnold Lipinski 50,000 50,000 20,000 20,000 3,000 3,900 73,000 73,900
Sabine Nieswand 50,000 50,000 10,000 10,000 1,800 2,100 61,800 62,100
Francisco Pérez 50,000 50,000 10,000 10,000 1,800 2,100 61,800 62,100
Klaus Schroeter 54,167 50,000 11,667 10,000 3,000 4,200 68,833 64,200
Maya Schwiegers-hausen-Güth 12,500 . / . . / . . / . 300 . / . 12,800 . / .
Uwe Zimmermann 50,000 50,000 20,000 16,667 2,400 3,900 72,400 70,567
Total 943,750 870,833 198,333 185,000 37,200 40,500 1,179,283 1,096,333
The Supervisory Board remuneration and attendance fees have been included in the overview
based on the expense incurred in the respective financial year. For the Supervisory Board
members who resigned or were appointed, the amounts have been calculated pro rata. The
Supervisory Board members did not receive any ancillary remuneration in the aforementioned
period.
The Chairman of the Supervisory Board is provided with an office and assistant and a driver
service so that he can perform his duties. If the Chairman of the Supervisory Board attends
certain appointments and performs certain representative duties on behalf of Hapag-Lloyd AG
to promote the business of the Company and foster a positive public image of the Company
and does so for no fee, he may use the Company’s internal resources to prepare for and per-
form these activities for no fee. He is reimbursed for expenses incurred in connection with
these activities at an appropriate amount.
There were no advance payments or loans to members of the Supervisory Board as at
31 December 2018 or 31 December 2017. Furthermore, the Supervisory Board members
did not receive any remuneration in 2018 or the comparative period for their own services
provided, in particular consultation and mediation services.
83M a n a g e M e n t R e p o R t
H a p a g - L L o y d a k t i e n g e s e L L s c H a f t i f i n a n c i a L s t a t e M e n t s 2 0 1 8 a n d M a n a g e M e n t R e p o R t

OTHER OBLIGATORY DISCLOSURES
DISCLOSURES AND NOTES RELEVANT TO THE TAKEOVER
REPORT PURSUANT TO SECTION 315A (1) OF THE GERMAN COMMERCIAL CODE
(HGB) AND SECTION 289A (1) OF THE GERMAN COMMERCIAL CODE (HGB)
1. Composition of subscribed capital
The Company’s subscribed capital totalled EUR 175,760,293.00 as at the balance sheet date.
It is divided into 175,760,293 no-par registered shares, with each individual share representing
EUR 1.00 of the share capital. The shares are ordinary shares, without exception. Different
share classes are not issued and are not provided for in the articles of association. Each share
is eligible for voting rights and dividends from the time that it is created. Each share grants one
vote at the shareholders’ meeting (Section 15 (1) of the articles of association).
2. Restrictions which affect voting rights or the transfer of shares
On 16 April 2014, CSAV Germany Container Holding GmbH, Hamburg (“CG Hold Co”), HGV
Hamburger Gesellschaft für Vermögens- und Beteiligungsmanagement mbH, Hamburg
(“HGV”), and Kühne Maritime GmbH, Hamburg (“Kühne”) (CG Hold Co, HGV and Kühne also
jointly referred to as the “Anchor Shareholders”) entered into a shareholders’ agreement which
was newly formulated in the course of the business combination with United Arab Shipping
Company Ltd. (“New Shareholders’ Agreement”). CG Hold Co, HGV and Kühne agreed under
the New Shareholders’ Agreement to uniformly exercise their voting rights as and from the day
following the 2017 Annual General Meeting by issuing a common voting proxy and giving bind-
ing instructions to an agent. To ensure a uniform voting, the Anchor Shareholders intend to
pass a resolution on how the pooled votes shall be cast prior to shareholders’ meetings. If the
Anchor Shareholders are unable to pass a unanimous resolution on their voting for any agenda
item, the decision will be transferred to the decision-makers of the Anchor Shareholders’ ulti-
mate shareholders. If the ultimate shareholders cannot pass a unanimous decision either, the
Anchor Shareholders should cast the votes (a) against the measure with regard to resolutions
requiring a 75% majority of the votes cast or of the subscribed capital present at the time of
adoption of the resolution pursuant to mandatory law or the articles of association or (b) each
at their own discretion regarding the respective shares of each of the Anchor Shareholders on
resolution proposals which, pursuant to mandatory law or the articles of association, require a
simple majority.
By coordinating their voting rights, the shareholders will be in a position to exert a significant
influence on the shareholders’ meeting and, consequently, on matters decided by the share-
holders’ meeting, including the appointment of the Company’s Supervisory Board, the distri-
bution of dividends or proposed capital increases.
Although the New Shareholders’ Agreement shall have a fixed term until 30 November 2024,
the parties are free to dispose of their shares. The parties have granted each other a right of
first refusal in the event that one party would like to sell shares representing a certain portion
of voting rights (over-the-counter).
84 M a n a g e M e n t R e p o R t
H a p a g - L L o y d a k t i e n g e s e L L s c H a f t i f i n a n c i a L s t a t e M e n t s 2 0 1 8 a n d M a n a g e M e n t R e p o R t

3. Shareholdings that exceed 10% of the voting rights
At the time of preparation of the financial statements, the Company had received the following
information about shareholdings subject to mandatory disclosure pursuant to Section 160 (1)
(8) of the German Stock Corporation Act (AktG). The following voting right notifications from
2015 do not take account of the total number of voting rights at the end of the reporting period:
CSAV Germany Container Holding GmbH, Hamburg, Germany, notified us on 5 November
2015 pursuant to Section 21 (1a) of the German Securities Trading Act (WpHG) that its share
of voting rights in Hapag-Lloyd AG, Ballindamm 25, 20095 Hamburg, Germany, as at
4 November 2015 was 71.56% (corresponding to 84,524,291 voting rights). 31.35% of the
voting rights (corresponding to 37,032,743 voting rights) are held directly by the Company.
40.21% of the voting rights (corresponding to 47,491,548 voting rights) are attributable to the
Company pursuant to Section 22 (2) WpHG through Kühne Maritime GmbH and HGV Ham-
burger Gesellschaft für Vermögens- und Beteiligungsmanagement mbH.
Compañía Sud Americana de Vapores S. A., Santiago, Chile, notified us on 5 November 2015
pursuant to Section 21 (1a) WpHG that its share of voting rights in Hapag-Lloyd AG, Ball-
indamm 25, 20095 Hamburg, Germany, as at 4 November 2015 was 71.56% (corresponding
to 84,524,291 voting rights). 40.21% of the voting rights (corresponding to 47,491,548 voting
rights) are attributable to the Company pursuant to Section 22 (2) WpHG through Kühne Mari-
time GmbH and HGV Hamburger Gesellschaft für Vermögens- und Beteiligungsmanagement
mbH. In accordance with Section 22 (1) (1) (1) WpHG, 31.35% of the voting rights (correspond-
ing to 37,032,743 voting rights) are attributable to the Company through CSAV Germany Con-
tainer Holding GmbH, of which 3% or more are assigned in each case.
The Luksburg Stiftung, Vaduz, Liechtenstein, notified us on 5 November 2015 pursuant to
Section 21 (1a) WpHG that its share of voting rights in Hapag-Lloyd AG, Ballindamm 25, 20095
Hamburg, Germany, as at 4 November 2015 was 71.56% (corresponding to 84,524,291 voting
rights). 40.21% of the voting rights (corresponding to 47,491,548 voting rights) are attributable
to the Company pursuant to Section 22 (2) WpHG through Kühne Maritime GmbH and HGV
Hamburger Gesellschaft für Vermögens- und Beteiligungsmanagement mbH. In accordance
with Section 22 (1) (1) (1) WpHG, 31.35% of the voting rights (corresponding to 37,032,743 vot-
ing rights) are attributable to the Company through CSAV Germany Container Holding GmbH,
Compañía Sud Americana de Vapores S. A., Quiñenco S. A., Andsberg Inversiones Limitada,
Ruana Copper A. G. Agencia Chile and Inversiones Orengo S. A., of which 3% or more are
assigned in each case.
Inversiones Orengo S. A., Santiago, Chile, notified us on 5 November 2015 pursuant to Sec-
tion 21 (1a) WpHG that its share of voting rights in Hapag-Lloyd AG, Ballindamm 25, 20095
Hamburg, Germany, as at 4 November 2015 was 71.56% (corresponding to 84,524,291 voting
rights). 40.21% of the voting rights (corresponding to 47,491,548 voting rights) are attributable
to the Company pursuant to Section 22 (2) WpHG through Kühne Maritime GmbH and HGV
Hamburger Gesellschaft für Vermögens- und Beteiligungsmanagement mbH. In accordance
with Section 22 (1) (1) (1) WpHG, 31.35% of the voting rights (corresponding to 37,032,743 vot-
ing rights) are attributable to the Company through CSAV Germany Container Holding GmbH,
Compañía Sud Americana de Vapores S. A. and Quiñenco S. A., of which 3% or more are
assigned in each case.
85M a n a g e M e n t R e p o R t
H a p a g - L L o y d a k t i e n g e s e L L s c H a f t i f i n a n c i a L s t a t e M e n t s 2 0 1 8 a n d M a n a g e M e n t R e p o R t

Ruana Copper A. G. Agencia Chile, Santiago, Chile, notified us on 5 November 2015 pursuant
to Section 21 (1a) WpHG that its share of voting rights in Hapag-Lloyd AG, Ballindamm 25,
20095 Hamburg, Germany, as at 4 November 2015 was 71.56% (corresponding to 84,524,291
voting rights). 40.21% of the voting rights (corresponding to 47,491,548 voting rights) are attrib-
utable to the Company pursuant to Section 22 (2) WpHG through Kühne Maritime GmbH and
HGV Hamburger Gesellschaft für Vermögens- und Beteiligungsmanagement mbH. In accord-
ance with Section 22 (1) (1) (1) WpHG, 31.35% of the voting rights (corresponding to 37,032,743
voting rights) are attributable to the Company through CSAV Germany Container Holding
GmbH, Compañía Sud Americana de Vapores S. A. and Quiñenco S. A., of which 3% or more
are assigned in each case.
Quiñenco S. A., Santiago, Chile, notified us on 5 November 2015 pursuant to Section 21 (1a)
WpHG that its share of voting rights in Hapag-Lloyd AG, Ballindamm 25, 20095 Hamburg,
Germany, as at 4 November 2015 was 71.56% (corresponding to 84,524,291 voting rights).
40.21% of the voting rights (corresponding to 47,491,548 voting rights) are attributable to the
Company pursuant to Section 22 (2) WpHG through Kühne Maritime GmbH and HGV Ham-
burger Gesellschaft für Vermögens und Beteiligungsmanagement mbH. In accordance with
Section 22 (1) (1) (1) WpHG, 31.35% of the voting rights (corresponding to 37,032,743 voting
rights) are attributable to the Company through CSAV Germany Container Holding GmbH and
Compañía Sud Americana de Vapores S. A., of which 3% or more are assigned in each case.
Andsberg Inversiones Limitada, Santiago, Chile, notified us on 5 November 2015 pursuant to
Section 21 (1a) WpHG that its share of voting rights in Hapag-Lloyd AG, Ballindamm 25, 20095
Hamburg, Germany, as at 4 November 2015 was 71.56% (corresponding to 84,524,291 voting
rights). 40.21% of the voting rights (corresponding to 47,491,548 voting rights) are attributable
to the Company pursuant to Section 22 (2) WpHG through Kühne Maritime GmbH and HGV
Hamburger Gesellschaft für Vermögens- und Beteiligungsmanagement mbH. In accordance
with Section 22 (1) (1) (1) WpHG, 31.35% of the voting rights (corresponding to 37,032,743 vot-
ing rights) are attributable to the Company through CSAV Germany Container Holding GmbH,
Compañía Sud Americana de Vapores S. A. and Quinenco S. A., of which 3% or more are
assigned in each case.
Kühne Maritime GmbH, Hamburg, Germany, notified us on 6 November 2015 pursuant to
Section 21 (1a) WpHG that its share of voting rights in Hapag-Lloyd AG, Ballindamm 25, 20095
Hamburg, Germany, as at 4 November 2015 was 71.56% (corresponding to 84,524,291 voting
rights). 19.58% of the voting rights (corresponding to 23,128,073 voting rights) are held directly
by the Company. 51.98% of the voting rights (corresponding to 61,396,218 voting rights) are
attributable to the Company pursuant to Section 22 (2) WpHG through CSAV Germany Con-
tainer Holding GmbH and HGV Hamburger Gesellschaft für Vermögens- und Beteiligungs-
management mbH.
Mr Klaus-Michael Kühne, Switzerland, notified us on 6 November 2015 pursuant to Section 21
(1a) WpHG that his share of voting rights in Hapag-Lloyd AG, Ballindamm 25, 20095 Hamburg,
Germany, as at 4 November 2015 was 72.20% (corresponding to 85,274,291 voting rights).
51.98% of the voting rights (corresponding to 61,396,218 voting rights) are attributable to Mr
Kühne pursuant to Section 22 (2) WpHG through CSAV Germany Container Holding GmbH
and HGV Hamburger Gesellschaft für Vermögens- und Beteiligungsmanagement mbH.
86 M a n a g e M e n t R e p o R t
H a p a g - L L o y d a k t i e n g e s e L L s c H a f t i f i n a n c i a L s t a t e M e n t s 2 0 1 8 a n d M a n a g e M e n t R e p o R t

20.22% of the voting rights (corresponding to 23,878,073 voting rights) are attributable to him
pursuant to Section 22 (1) (1) (1) WpHG through Kühne Holding AG and Kühne Maritime GmbH,
of which 3% or more are assigned in each case.
Kühne Holding AG, Schindellegi, Switzerland, notified us on 6 November 2015 pursuant to
Section 21 (1a) WpHG that its share of voting rights in Hapag-Lloyd AG, Ballindamm 25, 20095
Hamburg, Germany, as at 4 November 2015 was 72.20% (corresponding to 85,274,291 voting
rights). 51.98% of the voting rights (corresponding to 61,396,218 voting rights) are attributable
to the Company pursuant to Section 22 (2) WpHG through CSAV Germany Container Holding
GmbH and HGV Hamburger Gesellschaft für Vermögens- und Beteiligungsmanagement mbH.
19.58% of the voting rights (corresponding to 23,128,073 voting rights) are attributable to the
Company through Kühne Maritime GmbH pursuant to Section 22 (1) (1) (1) WpHG, of which 3%
or more are assigned.
HGV Hamburger Gesellschaft für Vermögens- und Beteiligungsmanagement mbH, Hamburg,
Germany, notified us on 6 November 2015 pursuant to Section 21 (1a) of the German Securi-
ties Trading Act (WpHG) that its share of voting rights in Hapag-Lloyd AG, Ballindamm 25,
20095 Hamburg, Germany, as at 4 November 2015 was 71.56% (corresponding to 84,524,291
voting rights). 20.63% of the voting rights (corresponding to 24,363,475 voting rights) are held
directly by the Company. 50.94% of the voting rights (corresponding to 60,160,816 voting
rights) are attributable to the Company pursuant to Section 22 (2) WpHG through CSAV Ger-
many Container Holding GmbH and Kühne Maritime GmbH.
The Free and Hanseatic City of Hamburg, Germany, notified us on 6 November 2015 pursuant
to Section 21 (1a) WpHG that its share of voting rights in Hapag-Lloyd AG, Ballindamm 25,
20095 Hamburg, Germany, as at 4 November 2015 was 71.56% (corresponding to 84,524,291
voting rights). 50.94% of the voting rights (corresponding to 60,160,816 voting rights) are attrib-
utable to the Company pursuant to Section 22 (2) WpHG through Kühne Maritime GmbH
and CSAV Germany Container Holding GmbH. 20.63% of the voting rights (corresponding
to 24,363,475 voting rights) are attributable to the Company through HGV Hamburger
Gesellschaft für Vermögens- und Beteiligungsmanagement mbH pursuant to Section 22 (1)
(1) (1) WpHG, of which 3% or more are assigned.
The Public Investment Fund of the Kingdom of Saudi Arabia, Riyadh, Saudi Arabia, notified us
on 24 May 2017 pursuant to Section 21 (1) WpHG that its share of voting rights in Hapag-Lloyd
AG, Ballindamm 25, 20095 Hamburg, Germany as at 24 May 2017 was 10.14% (corresponding
to 16,637,197 voting rights).
The State of Qatar, acting through the Qatar Investment Authority, Doha, Qatar, notified us on
24 May 2017 pursuant to Section 21 (1) WpHG that its share of voting rights in Hapag-Lloyd
AG, Ballindamm 25, 20095 Hamburg, Germany as at 24 May 2017 was 14.43% (corresponding
to 23,663,648 voting rights). All of the aforementioned voting rights are attributable to the
State of Qatar, acting through the Qatar Investment Authority, Doha, Qatar, pursuant to Sec-
tion 22 (1) WpHG. The companies through which the voting rights are held are (starting with
the top subsidiary): Qatar Holding LLC, Doha, Qatar, Qatar Holding Luxembourg II S. à. r. l.,
Luxembourg, Qatar Holding Netherlands B. V., Amsterdam, Netherlands, Qatar Holding Ger-
many GmbH, Frankfurt am Main, Germany.
87M a n a g e M e n t R e p o R t
H a p a g - L L o y d a k t i e n g e s e L L s c H a f t i f i n a n c i a L s t a t e M e n t s 2 0 1 8 a n d M a n a g e M e n t R e p o R t

4. Holders of shares with special rights
There are no shares with special rights that confer powers of control.
5. Type of voting right control for employee investments
The Company is not aware of any employees who hold an interest in its capital and do not
exercise their control over voting rights directly.
6. Rules on appointing and discharging members of the Executive Board and on
amending the articles of association
The guidelines on the appointment and discharge of members of the Executive Board are
based on Sections 84 and 85 of the German Stock Corporation Act (AktG) and on Section 31
of the German Co-Determination Act (MitbestG) in conjunction with Section 7 (1) of the articles
of association. Pursuant to Section 7 (1) of the articles of association, the Executive Board
shall comprise not less than two members. The Supervisory Board determines the number of
members of the Executive Board; taking into account the minimum number of members, it
may appoint one member of the Executive Board as the Chairperson and may appoint deputy
members of the Executive Board.
The articles of association can only be amended by a resolution of the shareholders’ meeting
in accordance with Section 179 of the German Stock Corporation Act (AktG). The resolution of
the shareholders’ meeting requires a majority of at least three quarters of the share capital
represented when the resolution is being adopted; Sections 179 ff. of the German Stock Cor-
poration Act (AktG) are applicable. In accordance with Section 20 of the articles of association,
the Supervisory Board is authorised to make amendments to the articles of association which
only affect the wording. The Supervisory Board is also entitled to amend the wording of the
articles of association after a share capital increase from the Authorised Capital 2017 and after
the authorisation period expires, in accordance with the amount of the capital increase.
7. Powers of the Executive Board, in particular regarding the option of
issuing or buying back shares
In accordance with Section 5 (3) of the articles of association, the Executive Board, subject to
the approval of the Supervisory Board, is authorised to increase the Company’s share capital
by up to EUR 11,282,647.00, fully or in partial amounts, on one or more occasion up to 30 April
2022 by issuing up to 11,282,647 new no-par registered shares against cash contributions
and / or contributions in kind (Authorised Capital 2017). As a general rule, subscription rights
must be granted to the shareholders. The new shares can also be taken up by one or more
banks, with the obligation to offer them to the shareholders for subscription.
Under certain circumstances and subject to the approval of the Supervisory Board, the Exe-
cutive Board is authorised to exclude the subscription rights of the shareholders in order to
exclude fractional amounts from the subscription right.
Section 71 of the German Stock Corporation Act (AktG) includes rules regarding the acquisi-
tion of own shares. Furthermore, there is no authorisation of the Execution Board granted by
the shareholders’ meeting to buy back own shares.
88 M a n a g e M e n t R e p o R t
H a p a g - L L o y d a k t i e n g e s e L L s c H a f t i f i n a n c i a L s t a t e M e n t s 2 0 1 8 a n d M a n a g e M e n t R e p o R t

8. Significant agreements of the Company which are subject to the condition
of a change of control following a takeover bid, and the resulting effects
The following significant agreements which are subject to the condition of a change of control
are in place at the Company:
a) As part of two bonds issued by the Company with a value totalling EUR 900 million,
the Company is obliged to offer to buy back the bonds from the bondholders at an
amount equal to 101% of the respective nominal value plus interest accrued if, among
other reasons, a third party who is not an Anchor Shareholder, IDUNA Vereinigte
Lebensversicherung auf Gegenseitigkeit für Handwerk, Handel und Gewerbe, HSH
Nordbank AG, HanseMerkur Krankenversicherung AG, HanseMerkur Lebensver-
sicherung AG, M. M.Warburg & CO Gruppe (GmbH & Co) KGaA (jointly also referred to
as the “Key Shareholders”), Qatar Holding LLC, the Public Investment Fund of the
Kingdom of Saudi Arabia or TUI AG, directly or indirectly acquires more than 50% of
the voting rights of the Company’s shares.
b) As part of various ship, container and other bank financing arrangements with out-
standing repayment amounts and fixed financing commitments with a value totalling
approximately EUR 6,026 million (approximately USD 6,900 million), the respective
lenders have an extraordinary right of termination in the event of a qualified change
of control at the Company. If the outstanding amounts after the termination cannot
be settled or refinanced, the creditors will have, among other options, recourse to
the financed assets if necessary.
c) As part of syndicated credit facilities not utilised as at the reporting date with a value
totalling around EUR 476 million (around USD 545 million), the respective lenders are
entitled to terminate the loan commitment and / or seek repayment of the amounts
already utilised in the event of a qualified change of control at the Company. If the
outstanding amounts after the termination cannot be settled or refinanced, the cre-
ditors will have recourse to the collateralised assets to a certain extent.
89M a n a g e M e n t R e p o R t
H a p a g - L L o y d a k t i e n g e s e L L s c H a f t i f i n a n c i a L s t a t e M e n t s 2 0 1 8 a n d M a n a g e M e n t R e p o R t

The qualified change of control mentioned in b) and c) occurs if:
• the voting percentage jointly held in the Company by the Key Shareholders and other share-
holders who have entered into a voting agreement or a comparable agreement with a Key
Shareholder (“Other shareholders with a voting agreement”) (i) falls to 25% or less, or (ii) falls
below the percentage held by a third-party shareholder or by persons or groups acting
together with this third-party shareholder within the meaning of Section 2 (5) of the German
Securities Acquisition and Takeover Act (WpÜG); or
• the voting percentage jointly held by the Key Shareholders falls below the voting percentage
held by another shareholder with a voting agreement; or
• one of the Anchor Shareholders (including all of its affiliated companies) individually (directly
or indirectly) holds 50% or more of the voting rights in the Company.
9. Company compensation agreements with Executive Board members
or employees in the event of a takeover bid
Company compensation agreements which are entered into with the members of the Exe-
cutive Board or employees in the event of a takeover bid are not in place.
90 M a n a g e M e n t R e p o R t
H a p a g - L L o y d a k t i e n g e s e L L s c H a f t i f i n a n c i a L s t a t e M e n t s 2 0 1 8 a n d M a n a g e M e n t R e p o R t

DECLARATION ON CORPORATE GOVERNANCE IN ACCORDANCE WITH
SECTION 315 D IN CONJUNCTION WITH SECTION 289 F (1) OF THE GERMAN
COMMERCIAL CODE (HGB) AND DECLARATION OF CONFORMITY IN
ACCORDANCE WITH SECTION 161 OF THE GERMAN STOCK CORPORATION
ACT (AKTG)
The declaration on corporate governance in accordance with Section 289f of the German
Commercial Code (HGB) and the declaration of conformity in accordance with Section 161
of the German Stock Corporation Act (AktG) have been published and made permanently
available in the “Corporate Governance” section under “Investor Relations” on the Company’s
website, https://www.hapag-lloyd.com/en/home.html, at https://www.hapag-lloyd.com/en/ir/
corporate-governance/compliance-statement.html, and are not part of the management
report.
NON-FINANCIAL GROUP DECLARATION AS PER GERMAN CSR GUIDELINE
IMPLEMENTATION ACT (CSR-RICHTLINIE-UMSETZUNGSGESETZ)
In addition to the non-financial principles already outlined, sustainable economic, ecological
and social action is regarded as a basic commercial principle for Hapag-Lloyd.
The separate non-financial report as per Section 315b (3) of the German Commercial Code
(HGB) is contained in the sustainability report, which can be retrieved from Hapag-Lloyd AG’s
website via the following link: https://www.hapag-lloyd.com/en/about-us/sustainability/sustain-
ability-report.html, and is not part of the management report.
Hamburg, 18 March 2019
Hapag-Lloyd Aktiengesellschaft
Executive Board
Rolf Habben Jansen
Nicolás Burr Anthony J. Firmin Joachim Schlotfeldt
91M a n a g e M e n t R e p o R t
H a p a g - L L o y d a k t i e n g e s e L L s c H a f t i f i n a n c i a L s t a t e M e n t s 2 0 1 8 a n d M a n a g e M e n t R e p o R t

FINANCIAL STATEMENTS
BALANCE SHEETof the Hapag-Lloyd Aktiengesellschaft, Hamburg, as at 31 December 2018
ASSETS
million EUR Notes 31.12.2018 31.12.2017
A. Fixed assets (1)
I. Intangible assets 1,113.3 1,182.2
II. Property, plant and equipment 5,171.6 5,239.0
III. Financial assets (2) 1,882.7 1,888.9
8,167.6 8,310.1
B. Current assets
I. Inventories
1. Raw materials and supplies 202.5 180.3
2. Unfinished voyages 191.1 188.7
3. Prepayments received 1.6 0.6
4. Payments received on account of orders –22.1 –32.5
373.1 337.1
II. Accounts receivables and other assets (3)
1. Trade accounts receivable 404.0 327.7
2. Accounts receivable from affiliated companies 493.9 433.0
3. Accounts receivable from associated companies 0.0 0.2
4. Other assets 184.3 160.3
1,082.2 921.2
III. Cash-in-hand, bank balances and cheques (4) 440.5 322.3
1,895.8 1,580.6
C. Prepaid expenses (5) 8.7 11.3
Total assets 10,072.1 9,902.0
Rounding differences may occur.
92 f i n a n c i a L s t a t e M e n t s i B a L a n c e s H e e t
H a p a g - L L o y d a k t i e n g e s e L L s c H a f t i f i n a n c i a L s t a t e M e n t s 2 0 1 8 a n d M a n a g e M e n t R e p o R t
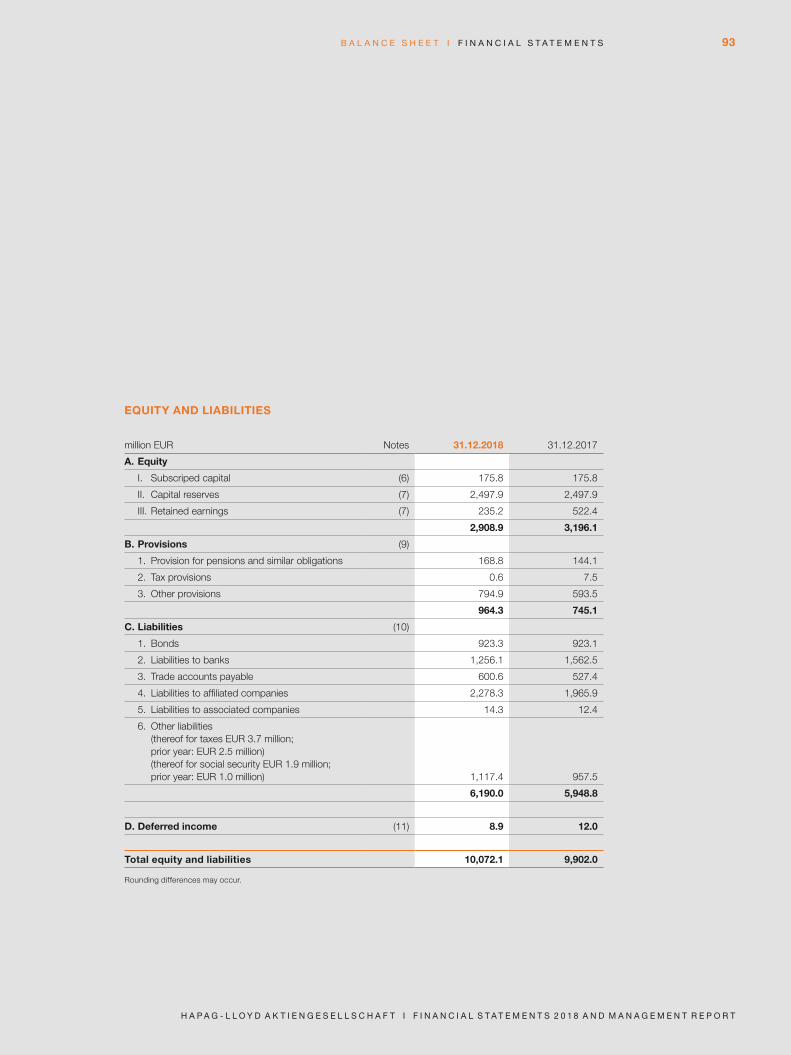
EQUITY AND LIABILITIES
million EUR Notes 31.12.2018 31.12.2017
A. Equity
I. Subscriped capital (6) 175.8 175.8
II. Capital reserves (7) 2,497.9 2,497.9
III. Retained earnings (7) 235.2 522.4
2,908.9 3,196.1
B. Provisions (9)
1. Provision for pensions and similar obligations 168.8 144.1
2. Tax provisions 0.6 7.5
3. Other provisions 794.9 593.5
964.3 745.1
C. Liabilities (10)
1. Bonds 923.3 923.1
2. Liabilities to banks 1,256.1 1,562.5
3. Trade accounts payable 600.6 527.4
4. Liabilities to affiliated companies 2,278.3 1,965.9
5. Liabilities to associated companies 14.3 12.4
6. Other liabilities (thereof for taxes EUR 3.7 million; prior year: EUR 2.5 million) (thereof for social security EUR 1.9 million; prior year: EUR 1.0 million) 1,117.4 957.5
6,190.0 5,948.8
D. Deferred income (11) 8.9 12.0
Total equity and liabilities 10,072.1 9,902.0
Rounding differences may occur.
93B a L a n c e s H e e t i f i n a n c i a L s t a t e M e n t s
H a p a g - L L o y d a k t i e n g e s e L L s c H a f t i f i n a n c i a L s t a t e M e n t s 2 0 1 8 a n d M a n a g e M e n t R e p o R t

INCOME STATEMENTof the Hapag-Lloyd Aktiengesellschaft, Hamburg,
for the period 1 January to 31 December 2018
million EUR Notes 1.1. – 31.12.2018 1.1. – 31.12.2017
1. Revenue (14) 11,555.4 9,576.9
2. Increase in capitalised expenses for unfinished voyages 2.4 5.4
3. Other own work capitalised (15) 2.8 0.0
4. Other operating income (16) 812.6 1,094.6
12,373.2 10,676.9
5. Transport expenses (17) 10,052.3 8,136.0
6. Personnel expenses (18) 277.4 266.5
7. Amortisation of intangible fixed assets and depreciation of property, plant and equipment (19) 433.8 383.5
8. Other operating expenses (20) 1,644.0 1,283.0
12,407.5 10,069.0
9. Operating result –34.3 607.9
10. Income from profit transfer 4.1 5.9
11. Income from investments 72.5 41.2
12. Income from loans within financial assets 4.5 5.5
13. Other interest and similar income 24.5 26.1
14. Amortisation of financial assets 2.6 6.0
15. Expenses from transfer of losses 0.3 0.0
16. Interest and similar expenses 222.9 239.1
17. Financial result (21) –120.2 –166.4
18. Taxes on income (22) 5.3 6.4
19. Result after taxes –159.8 435.1
20. Other taxes 27.2 21.1
21. Net loss / profit of the year –187.0 414.0
22. Retained earnings brought forward 422.2 108.4
23. Retained earnings carried forward (7) 235.2 522.4
Rounding differences may occur.
94 f i n a n c i a L s t a t e M e n t s i i n c o M e s t a t e M e n t
H a p a g - L L o y d a k t i e n g e s e L L s c H a f t i f i n a n c i a L s t a t e M e n t s 2 0 1 8 a n d M a n a g e M e n t R e p o R t

NOTES
to the financial statements of Hapag-Lloyd Aktiengesellschaft, Hamburg,
for the financial year from 1 January to 31 December 2018
GENERAL NOTES
Hapag-Lloyd Aktiengesellschaft, domiciled in Hamburg, is registered in commercial register B
of the district court in Hamburg under the number HRB 97937.
The annual financial statements of Hapag-Lloyd AG are prepared in accordance with the
regulations for large companies within the German Commercial Code (HGB) and in accord-
ance with the supplementary provisions of the German Stock Corporation Act (AktG).
The annual financial statements are published in the online version of the German Federal
Gazette. The financial year corresponds to the calendar year.
The annual financial statements, comprising the statement of financial position, the income
statement and the Notes, are prepared in euros (EUR); the amounts are quoted in million euros
(million EUR).
The income statement is prepared using the total cost method. For clarity of presentation,
individual items have been summarised in the statement of financial position and the income
statement and are listed separately and explained in the Notes.
The legal merger between Hapag-Lloyd AG and United Arab Shipping Company Ltd. (“UASC
Ltd.”), Dubai, United Arab Emirates, was completed on 24 May 2017. After acquiring the shares
in UASC, Hapag-Lloyd also acquired UASC’s entire container liner service by purchase agree-
ment dated 1 July 2017. The gradual integration of the operating business of UASC’s container
shipping activities occurred in the third quarter of 2017 and was completed in September 2017.
This included, among other things, consolidating the services and ship systems in the various
trades and transferring the operating business to Hapag-Lloyd’s IT systems. As the previous
year’s acquisition of the container liner business took place part way through the year, the
income statement is only comparable with the previous year to a limited extent, in particular
with regard to revenue and transport expenses.
95n o t e s i f i n a n c i a L s t a t e M e n t s
H a p a g - L L o y d a k t i e n g e s e L L s c H a f t i f i n a n c i a L s t a t e M e n t s 2 0 1 8 a n d M a n a g e M e n t R e p o R t

ACCOUNTING AND MEASUREMENT PRINCIPLES
The previous year’s accounting and measurement principles and balance sheet structure
were generally maintained in the year under review. In additional to the first time usage of the
option to capitalise internally generated intangible assets according to Section 248 (2) of the
German Commercial Code (HGB), valuation units were recognised in the financial year in
accordance with Section 254 HGB in connection to liabilities with variable interest.
Currency translation
Receivables, other assets, cash and cash equivalents, liabilities, provisions as well as con-
tingencies in foreign currencies are generally recorded with the mean spot exchange rate as
at the transaction date. Short term foreign currency positions are carried at the mean spot
exchange rate on the reporting date in accordance with Section 256a of the German Commer-
cial Code (HGB). Long term foreign currency positions with a remaining term of more than one
year are carried at the mean spot exchange rate as at the transaction date, as long as under
the lowest / highest value principle no lower / higher reporting date exchange rate is used. The
cost of acquisition of fixed assets purchased in foreign currency – primarily ships and contain-
ers invoiced in US dollars – are calculated by converting them on the basis of the mean spot
exchange rates valid at the time of their acquisition.
Fixed assets
Intangible assets
Intangible assets acquired in return for payment are recognised initially at cost of acquisition,
written off on a straight-line basis over the course of their expected useful lives of between
5 and 8 years and recorded as a disposal in the year in which they are fully written off. Trade-
mark rights are not subject to amortisation due to the likelihood of an indefinite useful life.
For the first time, Hapag-Lloyd availed itself of the option to capitalise internally generated
intangible assets in accordance with Section 248 (2) of the German Commercial Code (HGB)
The capitalised production costs are calculated on the basis of direct costs.
Goodwill acquired is written off on a straight-line basis over a useful life of 20 years as well as
over a useful life of 10 years. The reason for the duration of 20 years is the longevity of the cus-
tomer portfolio and of the expected synergy potential from acquiring the business operations
of the container liner shipping company CSAV in 2014 and of UASC in 2017. The duration of
10 years is due to the goodwill acquired during the year as part of the mergers and is based
on the residual useful lives of the ships acquired.
Property, plant and equipment
Property, plant and equipment are carried at acquisition and production cost less depreciation
and, if applicable, impairment charges. Depreciation is recognised on a straight-line basis over
the estimated useful operating life of an asset up to the amount of the anticipated residual /
scrap value. Depreciation on additions to property, plant and equipment are recorded on a pro
rata basis. Estimation of the residual value is based on the current realisable value for a com-
parable asset to be sold that has already reached the end of its useful life and which was used
under similar circumstances. Ships are depreciated over a useful economic life of 25 years,
taking their scrap values into account. Containers are depreciated to a residual value of 10% or
20% of their cost of acquisition depending on the container type over a useful economic life of
96 f i n a n c i a L s t a t e M e n t s i n o t e s
H a p a g - L L o y d a k t i e n g e s e L L s c H a f t i f i n a n c i a L s t a t e M e n t s 2 0 1 8 a n d M a n a g e M e n t R e p o R t

13 years. Write-downs are effected if there is likely to be ongoing impairment. Impairment
losses are reversed up to the amount of the amortised cost if the reasons for ongoing im -
pairment no longer apply.
In as far as Hapag-Lloyd AG as lessee bears all the substantial risks and rewards associated
with a lease, the leased assets are capitalised in the statement of financial position at the net
present value of the minimum lease payments. They are subject to straight-line depreciation
throughout the term of the lease or the useful life of the asset (whichever is longer), provided
that it is sufficiently certain at the beginning of the lease that legal ownership of the asset will
be transferred to the Company once the contractual term expires.
Low-value assets with an acquisition and production cost of greater than EUR 150 and up to
EUR 1,000 are recorded as a collective item for the financial year in accordance with Section 6
(2a) of the German Income Tax Act (EStG), this item being depreciated by 20% each year.
Financial assets
Shares in affiliated companies and holdings are carried at cost of acquisition or fair value as
at the reporting date, whichever is lower. Impairment to a lower value is performed on the bal-
ance sheet date if the impairment is likely to be ongoing. Impairment losses are reversed at a
maximum up to the amount of the cost of acquisition if the reasons for ongoing impairment
no longer apply.
Loans are carried at their nominal value. Appropriate specific valuation allowances are accrued
to cover items subject to risk.
Current assets
Raw materials, supplies and purchased goods are carried at acquisition and production cost
or at fair value as at the reporting date, whichever is lower. Fuel inventories are measured
on the basis of a moving average price. A write-down on fuel inventories is recorded at the
balance sheet date if the market price is below the carrying amount. Unfinished voyages are
measured on the basis of the direct costs plus the minimum overhead costs required pursuant
to commercial law; interest on borrowing costs is not included. The capitalised expenses
are adjusted for the anticipated losses of any loss-making unfinished voyages. Prepayments
received are offset against the inventories.
Accounts receivable, other assets and cash and cash equivalents are carried at their nominal
value. Identifiable individual risks from receivables are taken into account by means of specific
valuation allowances.
Derivatives and hedging instruments
The functional currency for the group financial statements is the US Dollar as the majority of
the operational business is conducted in US Dollar. Due to this, currency forward contracts
are used to hedge the euro currency risks from operational payments as well as financing
activities. There is no currency risk regarding this within the EUR reported financial statements.
Additionally price risks from the purchase of bunker oil are hedged using raw material deriva-
tives; in particular, options are used. Furthermore, interest rate risks are hedged for the first
time using interest rate swaps.
97n o t e s i f i n a n c i a L s t a t e M e n t s
H a p a g - L L o y d a k t i e n g e s e L L s c H a f t i f i n a n c i a L s t a t e M e n t s 2 0 1 8 a n d M a n a g e M e n t R e p o R t

Provisions are recognised for negative fair values of derivative financial instruments under the
imparity and realisation principle as long as no valuation units according to Section 254 of
the German Commercial Code (HGB) are recorded for these transactions. Concerning the
premiums paid for bunker options the strict lowest value principle is used. Accordingly options
are impaired to the lower fair value as at the reporting date, in as far as this has fallen below
the initial costs. The option premiums are reported under other assets. Interest rate hedges
are recorded in the financial statements using valuation units. The recognition is based on the
net hedge presentation method.
Realised and unrealised gains and losses from currency forward contracts as well as the valu-
ation of bunker options are reported in other operating income or other operating expenses
respectively. Realised gains and losses from the options in relation to bunker oil are reported
within the transport expenses. The interest accruals from the interest rate swaps as well as
realised gains and losses from these are recorded within in the interest result.
The valuation of derivative financial instruments or the calculation of the market values depend
on the type of instrument. Currency forward contracts are valued with their market-traded
forward rates as at the reporting date. The market values of bunker options are calculated
using the Black & Scholes model or the modified Turnbull & Wakeman model and are based on
the current exchange rates, commodity prices, currency and commodity price volatility, yield
curves and forward prices. The fair value of interest rate swaps is calculated as the fair value
of the estimated future cash flows. Estimates for the future cash flows from variable interest
payments are based on listed swap rates and interbank interest rates.
The issued bonds at the reported date each contain options for the early redemption (buy-
back options) by the company. As these structured bonds show different risks and opportuni-
ties compared to bonds without redemption options (basic contract), they are recognised
separately from each other as independent assets and liabilities in accordance with the rele-
vant German Commercial Code requirements. Accordingly the redemption options is recog-
nised as an embedded derivative. With the addition of the bonds, the repurchase options
contained in the bonds were capitalised at their market value at the time of addition. The mar-
ket value of the embedded derivatives is calculated using the Hull-White model together with a
trinomial decision tree based on current market values. The redemption options are therefore
recognised at the initial cost or the market value at the reporting date, if lower, and reported
under other assets, however the changes in value are recorded within the interest result. The
liability recorded as offset to the capitalised redemption option, which is to be released linearly
over the period of the redemption option as per section 250 of the German Commercial Code
(HGB), depicts an interest regulative for the current interest of the bonds.
Prepaid expenses
Expenses prior to the balance sheet date are recognised as prepaid expenses insofar as they
constitute expenses for a specific period subsequent to this date.
98 f i n a n c i a L s t a t e M e n t s i n o t e s
H a p a g - L L o y d a k t i e n g e s e L L s c H a f t i f i n a n c i a L s t a t e M e n t s 2 0 1 8 a n d M a n a g e M e n t R e p o R t

Provisions
Provisions for pensions are determined in accordance with actuarial principles on the basis of
the projected unit credit method, drawing on the 2018 G mortality tables devised by Prof.
Klaus Heubeck. The average market interest rate over the past ten years as published by
Deutsche Bundesbank for a remaining term of 15 years is used for discounting. The positive
difference between the pension provision method based on the corresponding average market
interest rate for the previous ten financial years and the pension provision method based on
the corresponding average market interest rate for the previous seven financial years is non-
distribut able if the freely available reserves – plus retained earnings carried forward and less
losses carried forward – remaining after the distribution are not at least equal to the difference.
For measurement as at 31 December 2018, the respective interest rate was based on the
interest rate information published on 31 October 2018 forecasted to 31 December 2018. This
is 3.21% p. a. (previous year: 3.67% p. a.). This measurement is also based on the following
assumptions: a salary trend of 2.5% p. a. (previous year: 2.5% p. a.), a pension trend of 5.5%
every three years (previous year: 5.5% every three years), and a fluctuation rate of 1.0% p. a.
(previous year: 1.0% p. a.). Deviating from these figures, the provisions relating to the branch in
the Netherlands are calculated using a pension trend of 2.0% p. a. (previous year: 2.0% p. a.)
and a fluctuation rate of between 0% and 10% p. a. depending on the age of the employees
(previous year: between 0% and 10% p. a.).
Reinsurance agreements exist in relation to some of the pension provisions, these being
pledged to the retirees. Accordingly, the provisions and the equivalent amount of the reinsur-
ance are recognised net in accordance with Section 246 (2) of the German Commercial Code
(HGB). In addition, there are special-purpose funds in place for another portion of the pension
provisions and for obligations relating to employees’ pre-retirement part-time employment
agreements. These are not available to other creditors. Plan assets are measured at their fair
value and are offset against the underlying provisions. In the event of an excess of obligations,
this is recognised under provisions. If the value of the securities exceeds the obligations, they
are recognised on the assets side of the statement of financial position as excess of plan
assets over post-employment benefit liability. Insofar as the fair value of plan assets is above
the historic cost of acquisition, the income generated by these assets is subject to the distribu-
tion restriction pursuant to Section 268 (8) (3) of the German Commercial Code (HGB). The
result components from the existing plan assets are recorded in the interest result and there-
fore offset with the interest expenses from the pension obligations.
99n o t e s i f i n a n c i a L s t a t e M e n t s
H a p a g - L L o y d a k t i e n g e s e L L s c H a f t i f i n a n c i a L s t a t e M e n t s 2 0 1 8 a n d M a n a g e M e n t R e p o R t

Tax provisions and other provisions are calculated using the settlement amount estimated on
the basis of prudent business judgement. All the identifiable risks are taken into account
appropriately in the measurement of these provisions. Provisions with a remaining term of
more than one year are discounted using the average market interest rate which corresponds
to their remaining term and which is calculated based on the previous seven financial years.
The discount rates for similar maturities published by the Deutsche Bundesbank for discount-
ing other provisions range from 0.88% to 1.88% in 2018, depending on the remaining term.
In connection with provisions for transport damage, the claims for compensation against the
insurance company reduce the obligation excess to be carried as a liability, so that a provision
is only shown in the amount of the deductible.
Liabilities
Liabilities are recognised at their settlement amount. In the event that the settlement amount of
a liability is greater than the issue price, the difference is recognised as a prepaid expense and
expensed in the income statement on a pro rata basis over the term of the liability. In the event
that the settlement amount of a liability is less than the issue price, the difference is recognised
as deferred income and recognised in the income statement on a pro rata basis over the term
of the liability.
If Hapag-Lloyd AG as lessee is considered economic owner of a leased asset, then this is to
be recognised in the statement of financial position. At the same time a lease obligation is rec-
ognised, with an initial carrying amount equivalent to that of the leased asset recognised. Each
lease rate is divided into an interest portion and a repayment element. The interest portion is
recognised as an expense in the income statement; the repayment element reduces the lease
obligation recognised.
Deferred income
Income prior to the balance sheet date is recognised as deferred income insofar as it consti-
tutes income for a specific period subsequent to this date.
Deferred taxes
For differences between the carrying amounts of assets, liabilities, prepaid expenses and
deferred income according to the German Commercial Code and tax law, which are expected
to reverse in future financial years, deferred taxes are determined using the balance sheet con-
cept. Tax loss carry-forwards are taken into account for the calculation of deferred tax assets
in the amount of the expected loss utilisation in the next years. As Hapag-Lloyd AG has opted
for tonnage taxation, temporary measurement differences do not affect taxation, with the
result that no deferred taxes are calculated. For domestic income which is not subject to ton-
nage taxation, a combined income tax rate of 32.3% was used both in 2018 and 2017 to cal-
culate the deferred taxes. A resulting tax burden would be carried as a deferred tax liability in
the statement of financial position. As in the previous year, Hapag-Lloyd AG did not avail itself
of the option of recognising deferred tax assets due to tax relief generated pursuant to Sec-
tion 274 (1) (2) of the German Commercial Code (HGB). Overall in the 2018 financial year, there
was an unrecognised deferred tax asset. This resulted from a corporate income tax loss car-
ry-forward.
100 f i n a n c i a L s t a t e M e n t s i n o t e s
H a p a g - L L o y d a k t i e n g e s e L L s c H a f t i f i n a n c i a L s t a t e M e n t s 2 0 1 8 a n d M a n a g e M e n t R e p o R t

Revenue Recognition
Revenue recognition follows the “end-of-voyage-principle”. Once the ships have arrived
their predefined destination or turnaround harbours the revenue is recognised. Therefore,
the revenue recognition follows ship voyages and not individual container shipments.
NOTES ON THE STATEMENT OF FINANCIAL POSITION – ASSETS
(1) Fixed assets
Intangible assets with the sum of EUR 1,113.3 million are comprised by goodwill from the
acquisitions of container shipping business of CSAV in 2014 and UASC in 2017. Planned
depreciation amount to EUR 74.7 million (previous year: EUR 58.7 million).
Tangible assets totalling up to EUR 5,171.6 million are essentially containerships and container.
Out of the total EUR 309.3 million additions in the reporting year, EUR 301.9 million are made
of newly balanced container, chassis and gensets. Planned depreciations of the tangible
assets summing up to EUR 359.2 million.
The asset items summarised in the statement of financial position and their development in the
2018 financial year can be found in the statement of fixed assets under Annexe I to the Notes.
(2) Financial assets
In addition to the shares in subsidiaries and investments, a long-term loan to an affiliated com-
pany is recognised in financial assets. Hapag-Lloyd AG’s main indirect and direct holdings are
outlined in Annexe II to the Notes.
(3) Accounts receivable and other assets
Accounts receivable from affiliated companies primarily comprise a shareholder loan made to
Hapag-Lloyd Special Finance DAC (“Hapag-Lloyd Special Finance”) in Dublin, Ireland, in the
amount of EUR 401.9 million (previous year: EUR 308.0 million) in connection with an existing
asset securitisation.
million EUR 31.12.2018
thereof remaining
duration > 1 year 31.12.2017
thereof remaining
duration > 1 year
Trade accounts receivable 404.0 0.0 327.7 0.0
Accounts receivable from affiliated companies 493.9 0.0 433.0 0.0
thereof from trade accounts receivable 23.3 0.0 47.4 0.0
Accounts receivable from associated companies 0.0 0.0 0.2 0.0
Other assets 184.3 7.2 160.3 22.1
Total 1,082.2 7.2 921.2 22.1
101n o t e s i f i n a n c i a L s t a t e M e n t s
H a p a g - L L o y d a k t i e n g e s e L L s c H a f t i f i n a n c i a L s t a t e M e n t s 2 0 1 8 a n d M a n a g e M e n t R e p o R t
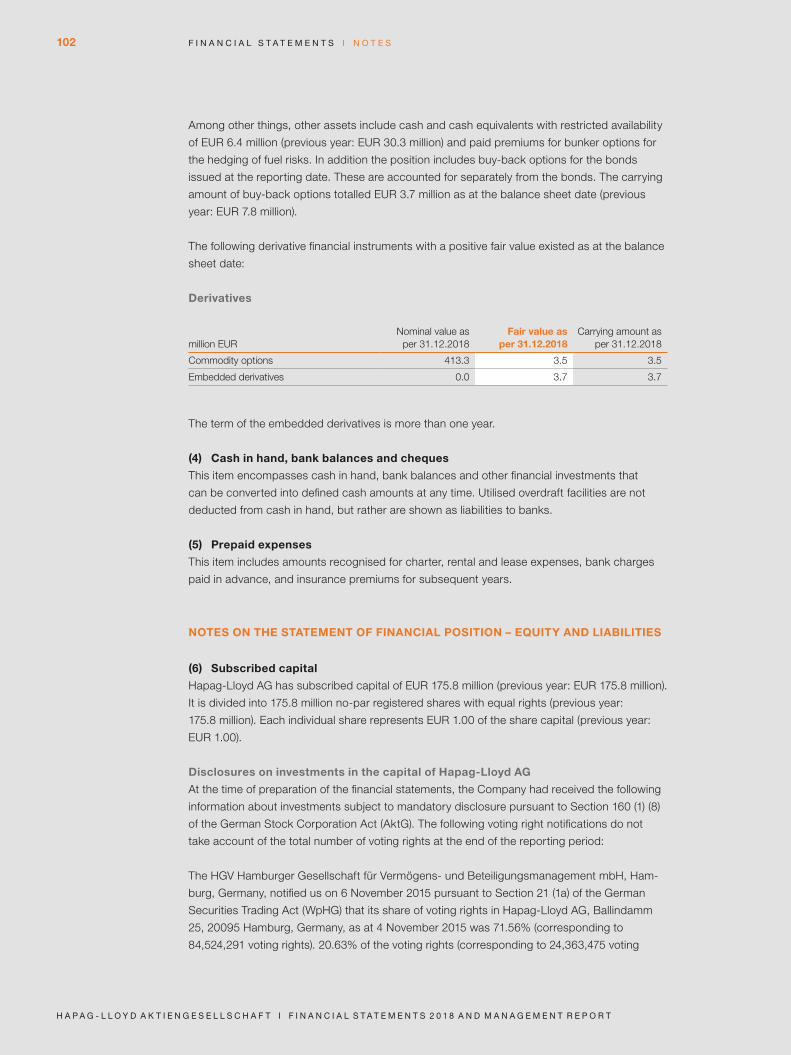
Among other things, other assets include cash and cash equivalents with restricted availability
of EUR 6.4 million (previous year: EUR 30.3 million) and paid premiums for bunker options for
the hedging of fuel risks. In addition the position includes buy-back options for the bonds
issued at the reporting date. These are accounted for separately from the bonds. The carrying
amount of buy-back options totalled EUR 3.7 million as at the balance sheet date (previous
year: EUR 7.8 million).
The following derivative financial instruments with a positive fair value existed as at the balance
sheet date:
Derivatives
million EUR Nominal value as
per 31.12.2018Fair value as
per 31.12.2018Carrying amount as
per 31.12.2018
Commodity options 413.3 3.5 3.5
Embedded derivatives 0.0 3.7 3.7
The term of the embedded derivatives is more than one year.
(4) Cash in hand, bank balances and cheques
This item encompasses cash in hand, bank balances and other financial investments that
can be converted into defined cash amounts at any time. Utilised overdraft facilities are not
deducted from cash in hand, but rather are shown as liabilities to banks.
(5) Prepaid expenses
This item includes amounts recognised for charter, rental and lease expenses, bank charges
paid in advance, and insurance premiums for subsequent years.
NOTES ON THE STATEMENT OF FINANCIAL POSITION – EQUITY AND LIABILITIES
(6) Subscribed capital
Hapag-Lloyd AG has subscribed capital of EUR 175.8 million (previous year: EUR 175.8 million).
It is divided into 175.8 million no-par registered shares with equal rights (previous year:
175.8 million). Each individual share represents EUR 1.00 of the share capital (previous year:
EUR 1.00).
Disclosures on investments in the capital of Hapag-Lloyd AG
At the time of preparation of the financial statements, the Company had received the following
information about investments subject to mandatory disclosure pursuant to Section 160 (1) (8)
of the German Stock Corporation Act (AktG). The following voting right notifications do not
take account of the total number of voting rights at the end of the reporting period:
The HGV Hamburger Gesellschaft für Vermögens- und Beteiligungsmanagement mbH, Ham-
burg, Germany, notified us on 6 November 2015 pursuant to Section 21 (1a) of the German
Securities Trading Act (WpHG) that its share of voting rights in Hapag-Lloyd AG, Ballindamm
25, 20095 Hamburg, Germany, as at 4 November 2015 was 71.56% (corresponding to
84,524,291 voting rights). 20.63% of the voting rights (corresponding to 24,363,475 voting
102 f i n a n c i a L s t a t e M e n t s i n o t e s
H a p a g - L L o y d a k t i e n g e s e L L s c H a f t i f i n a n c i a L s t a t e M e n t s 2 0 1 8 a n d M a n a g e M e n t R e p o R t

rights) are held directly by the Company. 50.94% of the voting rights (corresponding to
60,160,816 voting rights) are attributable to the Company pursuant to Section 22 (2) WpHG
through CSAV Germany Container Holding GmbH and Kühne Maritime GmbH.
The Luksburg Stiftung, Vaduz, Liechtenstein, notified us on 5 November 2015 pursuant to
Section 21 (1a) WpHG that its share of voting rights in Hapag-Lloyd AG, Ballindamm 25, 20095
Hamburg, Germany, as at 4 November 2015 was 71.56% (corresponding to 84,524,291 voting
rights). 40.21% of the voting rights (corresponding to 47,491,548 voting rights) are attributable
to the Company pursuant to Section 22 (2) WpHG through Kühne Maritime GmbH and HGV
Hamburger Gesellschaft für Vermögens- und Beteiligungsmanagement mbH. In accordance
with Section 22 (1) (1) (1) WpHG, 31.35% of the voting rights (corresponding to 37,032,743 vot-
ing rights) are attributable to the Company through CSAV Germany Container Holding GmbH,
Compañía Sud Americana de Vapores S. A., Quiñenco S. A., Andsberg Inversiones Limitada,
Ruana Copper A. G. Agencia Chile and Inversiones Orengo S. A., of which 3% or more are
assigned in each case.
Inversiones Orengo S. A., Santiago, Chile, notified us on 5 November 2015 pursuant to Sec-
tion 21 (1a) WpHG that its share of voting rights in Hapag-Lloyd AG, Ballindamm 25, 20095
Hamburg, Germany, as at 4 November 2015 was 71.56% (corresponding to 84,524,291 voting
rights). 40.21% of the voting rights (corresponding to 47,491,548 voting rights) are attributable
to the Company pursuant to Section 22 (2) WpHG through Kühne Maritime GmbH and HGV
Hamburger Gesellschaft für Vermögens- und Beteiligungsmanagement mbH. In accordance
with Section 22 (1) (1) (1) WpHG, 31.35% of the voting rights (corresponding to 37,032,743 vot-
ing rights) are attributable to the Company through CSAV Germany Container Holding GmbH,
Compañía Sud Americana de Vapores S. A. and Quiñenco S. A., of which 3% or more are
assigned in each case.
Ruana Copper A. G. Agencia Chile, Santiago, Chile, notified us on 5 November 2015 pursuant
to Section 21 (1a) WpHG that its share of voting rights in Hapag-Lloyd AG, Ballindamm 25,
20095 Hamburg, Germany, as at 4 November 2015 was 71.56% (corresponding to 84,524,291
voting rights). 40.21% of the voting rights (corresponding to 47,491,548 voting rights) are attrib-
utable to the Company pursuant to Section 22 (2) WpHG through Kühne Maritime GmbH and
HGV Hamburger Gesellschaft für Vermögens- und Beteiligungsmanagement mbH. In accord-
ance with Section 22 (1) (1) (1) WpHG, 31.35% of the voting rights (corresponding to 37,032,743
voting rights) are attributable to the Company through CSAV Germany Container Holding
GmbH, Compañía Sud Americana de Vapores S. A. and Quiñenco S. A., of which 3% or more
are assigned in each case.
Quiñenco S. A., Santiago, Chile, notified us on 5 November 2015 pursuant to Section 21 (1a)
WpHG that its share of voting rights in Hapag-Lloyd AG, Ballindamm 25, 20095 Hamburg,
Germany, as at 4 November 2015 was 71.56% (corresponding to 84,524,291 voting rights).
40.21% of the voting rights (corresponding to 47,491,548 voting rights) are attributable to the
Company pursuant to Section 22 (2) WpHG through Kühne Maritime GmbH and HGV Ham-
burger Gesellschaft für Vermögens- und Beteiligungsmanagement mbH. In accordance with
Section 22 (1) (1) (1) WpHG, 31.35% of the voting rights (corresponding to 37,032,743 voting
rights) are attributable to the Company through CSAV Germany Container Holding GmbH and
Compañía Sud Americana de Vapores S. A., of which 3% or more are assigned in each case.
103n o t e s i f i n a n c i a L s t a t e M e n t s
H a p a g - L L o y d a k t i e n g e s e L L s c H a f t i f i n a n c i a L s t a t e M e n t s 2 0 1 8 a n d M a n a g e M e n t R e p o R t

Compañía Sud Americana de Vapores S. A., Santiago, Chile, notified us on 5 November 2015
pursuant to Section 21 (1a) WpHG that its share of voting rights in Hapag-Lloyd AG, Ballin-
damm 25, 20095 Hamburg, Germany, as at 4 November 2015 was 71.56% (corresponding to
84,524,291 voting rights). 40.21% of the voting rights (corresponding to 47,491,548 voting
rights) are attributable to the Company pursuant to Section 22 (2) WpHG through Kühne Mari-
time GmbH and HGV Hamburger Gesellschaft für Vermögens- und Beteiligungsmanagement
mbH. In accordance with Section 22 (1) (1) (1) WpHG, 31.35% of the voting rights (correspond-
ing to 37,032,743 voting rights) are attributable to the Company through CSAV Germany Con-
tainer Holding GmbH, of which 3% or more are assigned in each case.
CSAV Germany Container Holding GmbH, Hamburg, Germany, notified us on 5 November
2015 pursuant to Section 21 (1a) of the German Securities Trading Act (WpHG) that its share
of voting rights in Hapag-Lloyd AG, Ballindamm 25, 20095 Hamburg, Germany, as at 4 No-
vember 2015 was 71.56% (corresponding to 84,524,291 voting rights). 31.35% of the voting
rights (corresponding to 37,032,743 voting rights) are held directly by the Company. 40.21% of
the voting rights (corresponding to 47,491,548 voting rights) are attributable to the Company
pursuant to Section 22 (2) WpHG through Kühne Maritime GmbH and HGV Hamburger
Gesellschaft für Vermögens- und Beteiligungsmanagement mbH.
Andsberg Inversiones Limitada, Santiago, Chile, notified us on 5 November 2015 pursuant to
Section 21 (1a) WpHG that its share of voting rights in Hapag-Lloyd AG, Ballindamm 25, 20095
Hamburg, Germany, as at 4 November 2015 was 71.56% (corresponding to 84,524,291 voting
rights). 40.21% of the voting rights (corresponding to 47,491,548 voting rights) are attributable
to the Company pursuant to Section 22 (2) WpHG through Kühne Maritime GmbH and HGV
Hamburger Gesellschaft für Vermögens- und Beteiligungsmanagement mbH. In accordance
with Section 22 (1) (1) (1) WpHG, 31.35% of the voting rights (corresponding to 37,032,743 vot-
ing rights) are attributable to the Company through CSAV Germany Container Holding GmbH,
Compañía Sud Americana de Vapores S. A. and Quiñenco S. A., of which 3% or more are
assigned in each case.
Mr Klaus-Michael Kühne, Switzerland, notified us on 6 November 2015 pursuant to Section 21
(1a) WpHG that his share of voting rights in Hapag-Lloyd AG, Ballindamm 25, 20095 Hamburg,
Germany, as at 4 November 2015 was 72.20% (corresponding to 85,274,291 voting rights).
51.98% of the voting rights (corresponding to 61,396,218 voting rights) are attributable to
Mr Kühne pursuant to Section 22 (2) WpHG through CSAV Germany Container Holding GmbH
and HGV Hamburger Gesellschaft für Vermögens- und Beteiligungsmanagement mbH.
20.22% of the voting rights (corresponding to 23,878,073 voting rights) are attributable to him
pursuant to Section 22 (1) (1) (1) WpHG through Kühne Holding AG and Kühne Maritime GmbH,
of which 3% or more are assigned in each case.
Kühne Holding AG, Schindellegi, Switzerland, notified us on 6 November 2015 pursuant to
Section 21 (1a) WpHG that its share of voting rights in Hapag-Lloyd AG, Ballindamm 25, 20095
Hamburg, Germany, as at 4 November 2015 was 72.20% (corresponding to 85,274,291 voting
rights). 51.98% of the voting rights (corresponding to 61,396,218 voting rights) are attributable
to the Company pursuant to Section 22 (2) WpHG through CSAV Germany Container Holding
GmbH and HGV Hamburger Gesellschaft für Vermögens- und Beteiligungsmanagement mbH.
19.58% of the voting rights (corresponding to 23,128,073 voting rights) are attributable to the
Company through Kühne Maritime GmbH pursuant to Section 22 (1) (1) (1) WpHG, of which 3%
or more are assigned.
104 f i n a n c i a L s t a t e M e n t s i n o t e s
H a p a g - L L o y d a k t i e n g e s e L L s c H a f t i f i n a n c i a L s t a t e M e n t s 2 0 1 8 a n d M a n a g e M e n t R e p o R t

The Free and Hanseatic City of Hamburg, Germany, notified us on 6 November 2015 pursuant
to Section 21 (1a) WpHG that its share of voting rights in Hapag-Lloyd AG, Ballindamm 25,
20095 Hamburg, Germany, as at 4 November 2015 was 71.56% (corresponding to 84,524,291
voting rights). 50.94% of the voting rights (corresponding to 60,160,816 voting rights) are
attributable to the Company pursuant to Section 22 (2) WpHG through Kühne Maritime GmbH
and CSAV Germany Container Holding GmbH. 20.63% of the voting rights (corresponding to
24,363,475 voting rights) are attributable to the Company through HGV Hamburger
Gesellschaft für Vermögens- und Beteiligungsmanagement mbH pursuant to Section 22 (1) (1)
(1) WpHG, of which 3% or more are assigned.
Kühne Maritime GmbH, Hamburg, Germany, notified us on 6 November 2015 pursuant to
Section 21 (1a) WpHG that its share of voting rights in Hapag-Lloyd AG, Ballindamm 25, 20095
Hamburg, Germany, as at 4 November 2015 was 71.56% (corresponding to 84,524,291 voting
rights). 19.58% of the voting rights (corresponding to 23,128,073 voting rights) are held directly
by the Company. 51.98% of the voting rights (corresponding to 61,396,218 voting rights) are
attributable to the Company pursuant to Section 22 (2) WpHG through CSAV Germany Con-
tainer Holding GmbH and HGV Hamburger Gesellschaft für Vermögens- und Beteiligungs-
management mbH.
The Public Investment Fund of the Kingdom of Saudi Arabia, Riyadh, Saudi Arabia, notified us
on 24 May 2017 pursuant to Section 21 (1) WpHG that its share of voting rights in Hapag-Lloyd
AG, Ballindamm 25, 20095 Hamburg, Germany as at 24 May 2017 was 10.14% (corresponding
to 16,637,197 voting rights).
The State of Qatar, acting through the Qatar Investment Authority, Doha, Qatar, notified us on
24 May 2017 pursuant to Section 21 (1) WpHG that its share of voting rights in Hapag-Lloyd
AG, Ballindamm 25, 20095 Hamburg, Germany as at 24 May 2017 was 14.43% (corresponding
to 23,663,648 voting rights). All of the aforementioned voting rights are attributable to the State
of Qatar, acting through the Qatar Investment Authority, Doha, Qatar, pursuant to Section 22
(1) WpHG. The companies through which the voting rights are held are (starting with the top
subsidiary): Qatar Holding LLC, Doha, Qatar, Qatar Holding Luxembourg II S. à. r. l., Luxem-
bourg, Qatar Holding Netherlands B. V., Amsterdam, Netherlands, Qatar Holding Germany
GmbH, Frankfurt am Main, Germany.
Authorised capital
Under a resolution approved at the Annual General Meeting on 29 May 2017, the information
regarding authorised capital in the articles of association was amended. Accordingly, the
Executive Board is authorised, subject to the approval of the Supervisory Board, to increase
the Company’s share capital by up to EUR 23.0 million in the period to 30 April 2022 by issuing
up to 23.0 million new no-par registered shares in exchange for cash and / or non-cash contri-
butions (Authorised Capital 2017). The amendment to the articles of association was entered
on 20 July 2017. As a general rule, subscription rights must be granted to the shareholders.
The new shares can also be taken up by one or more banks, with the obligation to offer them
to the shareholders for subscription. Under certain circumstances and subject to the approval
of the Supervisory Board, the Executive Board is authorised to exclude the subscription rights
of the shareholders in order to except fractional amounts from the subscription right.
105n o t e s i f i n a n c i a L s t a t e M e n t s
H a p a g - L L o y d a k t i e n g e s e L L s c H a f t i f i n a n c i a L s t a t e M e n t s 2 0 1 8 a n d M a n a g e M e n t R e p o R t

The Executive Board made a decision on 28 September 2017, with the approval of the Super-
visory Board on 27 September 2017, to increase the share capital by EUR 11,717,353.00 to
EUR 175,760,293.00 utilising the Authorised Capital 2017 entered on 20 July 2017. The capital
increase was carried out and entered in the commercial register on 17 October 2017.
The Authorised Capital pursuant to the authorisation granted on 29 May 2017 (Authorised
Capital 2017) still amounted to EUR 11,282,647.00 as at 31 December 2018 following partial
utilisation.
(7) Capital reserves and retained earnings
The capital reserves were unchanged compared with the previous year and totalled
EUR 2,497.9 million as at 31 December 2018.
Taking into account the profit of EUR 422.2 million carried forward from 2017 and an annual
net loss of EUR 187.0 million, the annual financial statements of Hapag-Lloyd AG reported
retained earnings of EUR 235.2 million.
At the Annual General Meeting it will be proposed that the retained earnings of EUR 235.2
million be used to pay a dividend of EUR 0.15 per dividend-eligible share and that the retained
earnings of EUR 208.8 million remaining after the distribution totalling EUR 26.4 million be
carried forward to the subsequent year.
(8) Information regarding non-distributable amounts
The difference between the cost of acquisition and the plan assets of pension and pre-
retirement part-time employment provisions as carried at their fair value resulted in a non-
distributable amount totalling EUR 1.4 million (previous year: EUR 2.0 million).
The first-time capitalisation of internally generated intangible fixed assets less the deferred tax
liabilities recognised for them resulted in a non-distributable amount of EUR 2.8 million.
These non-distributable amounts totalling EUR 4.2 million are offset by freely available reserves
in the amount of EUR 1,514.1 million. Freely available reserves comprise the capital reserves
pursuant to Section 272 (2) (4) of the German Commercial Code (HGB).
The difference between the provision method which uses the average market interest rate for
the previous 10 years as at the reporting date of 31 December 2018 (interest rate of 3.21% for
an assumed remaining term of 15 years) for discounting purposes and the provision method
which uses the average market interest rate for the previous 7 years (interest rate of 2.32% for
an assumed remaining term of 15 years) for discounting purposes is EUR 38.4 million.
106 f i n a n c i a L s t a t e M e n t s i n o t e s
H a p a g - L L o y d a k t i e n g e s e L L s c H a f t i f i n a n c i a L s t a t e M e n t s 2 0 1 8 a n d M a n a g e M e n t R e p o R t

(9) Provisions
Provisions for pensions and similar obligations include pension provisions in the amount of
EUR 23.0 million (previous year: EUR 20.2 million) in relation to which the entitlements from
reinsurance arrangements at fair value totalling EUR 10.3 million (previous year: EUR 10.5 mil-
lion) are pledged to the retirees. For pledged reinsurance arrangements, the amortised cost is
the same as the fair value. Expenses relating to the compounding of provisions for pensions
totalling EUR 0.8 million (previous year: EUR 0.8 million) compare with income from the fair
value measurement of the plan assets in the amount of EUR 0.4 million (previous year:
EUR 0.4 million).
The settlement amount for the provisions offset with other plan assets totalled EUR 44.3 million
on 31 December 2018 (previous year: EUR 39.8 million). The cost of all offset assets amounts
to EUR 34.6 million (previous year: EUR 34.7 million), with their fair value amounting to
EUR 35.9 million (previous year: EUR 36.8 million). Expenses relating to the compounding of
provisions for pensions totalling EUR 1.4 million (previous year: EUR 1.5 million) compare with
income from the fair value measurement of the plan assets in the amount of EUR 0.6 million
(previous year: EUR 0.7 million).
The expenses resulting from the change of the discount rate and the utilisation of the new
2018 G Heubeck tables were recognised in the operating result (personnel expenses).
Other provisions totalling EUR 794.9 million (previous year: EUR 593.6 million) include
provisions for outstanding invoices in the amount of EUR 449.4 million (previous year:
EUR 334.4 million), personnel expenses in the amount of EUR 63.1 million (previous year:
EUR 61.6 million), maintenance of leased containers in the amount of EUR 59.5 million
(previous year: EUR 46.1 million) and uninsured damage to third-party property and cargo
totalling EUR 22.4 million (previous year: EUR 22.3 million). These also comprise provisions
for other risks totalling EUR 199.3 million (previous year: EUR 129.2 million), which include
country- specific risks (EUR 78.4 million; previous year: EUR 69.5 million) and obligations
under a guarantee issued for the benefit of a subsidiary for existing pension obligations there
(EUR 10.8 million; previous year: EUR 12.3 million).
Other provisions included the following contingent losses for derivative financial instruments
at the balance sheet date:
Provisions for contingent losses
million EUR Nominal value
as at 31.12.2018Fair value
as at 31.12.2018Carrying amount as at 31.12.2018
Contingent liability from forward exchange contract 1,247.1 –63.7 –63.7
The currency forward contracts generally have a term to maturity of less than one year.
107n o t e s i f i n a n c i a L s t a t e M e n t s
H a p a g - L L o y d a k t i e n g e s e L L s c H a f t i f i n a n c i a L s t a t e M e n t s 2 0 1 8 a n d M a n a g e M e n t R e p o R t

(10) Liabilities
million EUR
31.12.2018 31.12.2017
Total
thereof with remaining duration
Total
thereof with remaining duration
less than
1 year
more than
1 year
thereof more than
5 years
less than
1 year
more than
1 year
thereof more than
5 years
Financial liabilities
Bonds 923.3 23.3 900.0 450.0 923.1 23.1 900.0 450.0
Liabilities to banks 1 1,256.1 203.6 1,052.5 324.6 1,562.5 296.2 1,266.3 478.0
thereof secured by liens and similar rights 1,219.9 193.1 1,026.8 324.3 1,497.9 258.1 1,239.8 478.0
2,179.4 226.9 1,952.5 774.6 2,485.6 319.3 2,166.3 928.0
Other liabilities
Liabilities to affiliated companies 2,278.3 1,374.5 903.8 30.5 1,965.9 1,596.4 369.5 31.1
thereof trade accounts payable 1,314.9 1,314.9 0.0 0.0 1,120.7 1,120.7 0.0 0.0
Liabilities to associated companies 14.3 14.3 0.0 0.0 12.4 12.4 0.0 0.0
Trade accounts payables 600.6 600.6 0.0 0.0 527.4 527.4 0.0 0.0
Other liabilities 1 1,117.4 182.0 935.4 408.1 957.5 159.4 798.1 329.9
thereof for taxes 3.7 3.7 0.0 0.0 2.5 2.5 0.0 0.0
thereof for social security 1.9 1.9 0.0 0.0 1.0 1.0 0.0 0.0
thereof secured by liens and similar rights 1,076.1 149.5 926.6 407.5 934.1 136.0 798.1 329.9
4,010.6 2,171.4 1,839.2 438.6 3,463.2 2,295.6 1,167.6 361.0
Total 6,190.0 2,398.3 3,791.7 1,213.2 5,948.8 2,614.9 3,333.9 1,289.0
1 Due to new information regarding lenders, the corresponding loans were no longer shown under liabilities to banks but under other liabilities. The previous year’s figures were adjusted accordingly.
Under the existing agreements for the financing of fixed assets, in particular ships and contain-
ers, Hapag-Lloyd AG has committed itself to observing specific restrictions customary on the
market with regard to the disposition of these material collateral items. The secured liabilities
amount in total to EUR 2,296.0 million (previous year: EUR 2,432.0 million).
Of all the vessels of which Hapag-Lloyd AG is the beneficial owner, 13 had no encumbrances
and were free of third-party rights at the reporting date. There are mortgages on the remaining
ships of which the Company is the beneficial owner.
108 f i n a n c i a L s t a t e M e n t s i n o t e s
H a p a g - L L o y d a k t i e n g e s e L L s c H a f t i f i n a n c i a L s t a t e M e n t s 2 0 1 8 a n d M a n a g e M e n t R e p o R t

For other liabilities amounting to EUR 697.7 million (previous year: EUR 525.8 million), the
financed containers were assigned to the creditors as collateral. For other liabilities amounting
to EUR 358.5 million (previous year: EUR 408.4 million), the financed container ships were
assigned to the creditors as collateral. As Hapag-Lloyd AG is the economic owner of the con-
tainers and container ships, they are recognised in the balance sheet of Hapag-Lloyd AG
Liabilities to affiliated companies comprise liabilities to subsidiaries arising from ordinary oper-
ating activities and a liability to Hapag-Lloyd Special Finance in the amount of EUR 660.3 mil-
lion (previous year: EUR 587.6 million). This liability relates to the receivables securitisation
programme.
Hapag-Lloyd is subject to interest rate risks, in particular from variable interest bearing financial
debt. In order to minimise the interest risk, the company strives to maintain a balanced ratio
between variable and fixed interest liabilities. In addition to this, since the 2018 financial year,
Hapag-Lloyd has elected to also hedge the interest rate risk using interest rate swaps on the
variable portion of interest rate payments of the underlying transaction.
Some interest rate swaps hedge only a portion of the total nominal volume. The financial liabil-
ities include liabilities from derivative financial instruments in the amount of EUR 0.3 million,
which hedge the interest rate risk from variable interest bearing financial liabilities with a nomi-
nal volume of EUR 443.9 million. The prospective assessment of the effectiveness of the
hedging relationships is based on a sensitivity analysis. The retrospective assessment of the
effectiveness of the hedging relationships is carried out using the hypothetical derivative
method. The interest rate swaps have a term of up to 5 years and show a negative market
value of EUR 5.9 million as at the balance sheet date. The underlying hedges are micro-
hedges.
(11) Deferred income
On the liabilities side, deferred income includes a bond-related difference of EUR 8.9 million
(previous year: EUR 11.5 million). This includes EUR 5.9 million attributable to the buy-back
options accounted for separately (previous year: EUR 7.6 million). These differences are
spread over the entire term of the bonds on a linear basis. Additionally this item contains
accrued premiums totalling EUR 2.9 million from differences between bond´s issuing and
settlement amount.
109n o t e s i f i n a n c i a L s t a t e M e n t s
H a p a g - L L o y d a k t i e n g e s e L L s c H a f t i f i n a n c i a L s t a t e M e n t s 2 0 1 8 a n d M a n a g e M e n t R e p o R t

(12) Contingencies
million EUR 31.12.2018 31.12.2017
Liabilities from guarantees 11.7 47.3
Liabilities from warranties 2,478.3 2,437.1
Total 2,490.0 2,484.4
thereof in favour of affiliated companies 2,490.0 2,484.4
Liabilities relating to warranty agreements are above all the result of bank loans taken out by
subsidiaries of Hapag-Lloyd AG primarily to finance containers and ships, for which Hapag-
Lloyd AG acts as the guarantor. The acquisition of UASC resulted in EUR 2,444.1 million of
such liabilities. A large volume of the loans is secured by ship and container collaterals as well
as ship mortgages. The equivalent values of these securities exceed the outstanding financing
vessel loan amounts and the revenues from the possible utilisation of these securities are suffi-
cient to service any outstanding liabilities. For this reason, the guarantees are not expected to
be utilised.
As part of the newly established THE Alliance partnership, a trust fund was set up in case one
of the partner shipping companies becomes insolvent. In relation to the establishment of the
trust fund, all of the participating parties are required to deposit securities in the amount of
USD 10 million each. In this context, Hapag-Lloyd made a cash payment of EUR 0.8 million
(USD 1 million) to the trust fund. It also furnished a guarantee of USD 9 million.
Furthermore, the establishment of the trust fund included an agreement among the participat-
ing shipping companies which requires them to replenish the fund in the event that a compen-
sation payment uses up the USD 10 million in securities deposited by the shipping company in
question.
As the probability of insolvency of a partner shipping company is currently estimated to be
very low, it is assumed, based on current information, that the securities deposited in the trust
fund will not be utilised and that the requirement to replenish the fund will not be exercised.
Letters of comfort / guarantees
In accordance with the Group structure, capital is allocated centrally through Hapag-Lloyd AG,
which provides the Group companies with liquidity and manages the issuing of guarantees and
letters of comfort for Group companies.
110 f i n a n c i a L s t a t e M e n t s i n o t e s
H a p a g - L L o y d a k t i e n g e s e L L s c H a f t i f i n a n c i a L s t a t e M e n t s 2 0 1 8 a n d M a n a g e M e n t R e p o R t
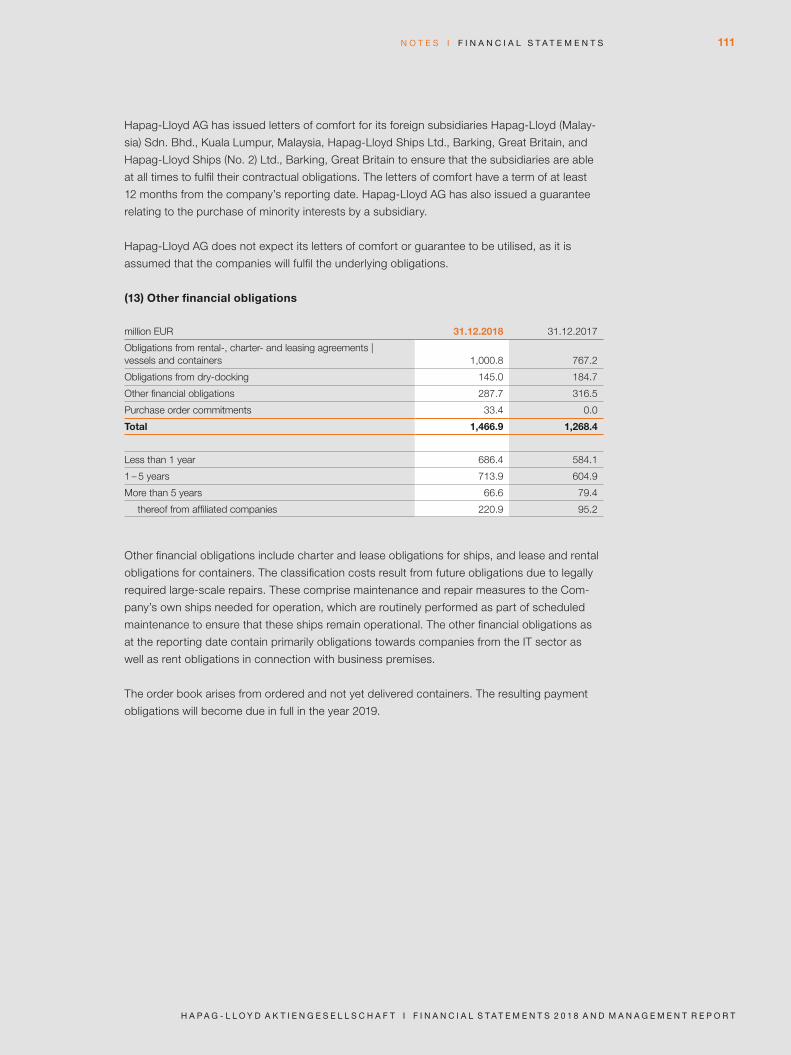
Hapag-Lloyd AG has issued letters of comfort for its foreign subsidiaries Hapag-Lloyd (Malay-
sia) Sdn. Bhd., Kuala Lumpur, Malaysia, Hapag-Lloyd Ships Ltd., Barking, Great Britain, and
Hapag-Lloyd Ships (No. 2) Ltd., Barking, Great Britain to ensure that the subsidiaries are able
at all times to fulfil their contractual obligations. The letters of comfort have a term of at least
12 months from the company’s reporting date. Hapag-Lloyd AG has also issued a guarantee
relating to the purchase of minority interests by a subsidiary.
Hapag-Lloyd AG does not expect its letters of comfort or guarantee to be utilised, as it is
assumed that the companies will fulfil the underlying obligations.
(13) Other financial obligations
million EUR 31.12.2018 31.12.2017
Obligations from rental-, charter- and leasing agreements | vessels and containers 1,000.8 767.2
Obligations from dry-docking 145.0 184.7
Other financial obligations 287.7 316.5
Purchase order commitments 33.4 0.0
Total 1,466.9 1,268.4
Less than 1 year 686.4 584.1
1 – 5 years 713.9 604.9
More than 5 years 66.6 79.4
thereof from affiliated companies 220.9 95.2
Other financial obligations include charter and lease obligations for ships, and lease and rental
obligations for containers. The classification costs result from future obligations due to legally
required large-scale repairs. These comprise maintenance and repair measures to the Com-
pany’s own ships needed for operation, which are routinely performed as part of scheduled
maintenance to ensure that these ships remain operational. The other financial obligations as
at the reporting date contain primarily obligations towards companies from the IT sector as
well as rent obligations in connection with business premises.
The order book arises from ordered and not yet delivered containers. The resulting payment
obligations will become due in full in the year 2019.
111n o t e s i f i n a n c i a L s t a t e M e n t s
H a p a g - L L o y d a k t i e n g e s e L L s c H a f t i f i n a n c i a L s t a t e M e n t s 2 0 1 8 a n d M a n a g e M e n t R e p o R t

NOTES TO THE INCOME STATEMENT
(14) Revenue
Revenue per trade 1
million EUR 1.1. – 31.12.2018 1.1. – 31.12.2017
Latin America 2,560.8 2,193.5
Atlantic 2,028.2 1,874.0
Transpacific 2,104.2 1,790.1
Far East 1,602.0 1,046.4
Middle East 944.5 609.5
EMAO (Europe, Mediterranean, Africa, Oceania) 629.0 496.5
Intra-Asia 452.8 391.3
Revenue not assigned to trades 1,233.9 1,175.6
Total 11,555.4 9,576.9
1 Due to a better understanding, income that was previously netted against transport expenses is now reported as sales revenue. The previous year’s figures were adjusted accordingly.
The transport volume increased from 8,958 TTEU to 11,750 TTEU in the last financial year. The
significant rise in the transport volume of 31.2% is primarily due to the fact that the integration
of UASC’s operating business did not take place until part way through the 2017 financial year.
As a result, the previous year’s figures do not include the transport volumes generated by
UASC prior to its integration. Net freight revenue is broken down according to the trades. The
item “Revenue not attributable to trades” contains primarily income from demurrage and
detention for containers as well as income from charter hire and slot charter revenue.
(15) Other own work capitalised
Research and development costs totalled EUR 18.8 million in the financial year. EUR 2.8 million
of this related to the internally generated intangible assets capitalised in accordance with Sec-
tion 248 (2) of the German Commercial Code (HGB).
(16) Other operating income
million EUR 1.1. – 31.12.2018 1.1. – 31.12.2017
Exchange rate gains 668.2 903.2
Income from the release of provisions 46.2 145.7
Income from the disposal of fixed assets 22.4 2.2
Income form the reduction of value adjustments of receivables 20.5 0.1
Income from recharged costs 20.0 17.4
Other income 35.3 26.0
Total 812.6 1,094.6
Exchange rate gains include income from currency translation (EUR 626.8 million; previous
year: EUR 874.4 million) and from realised exchange rate gains and the valuation of derivative
financial instruments (EUR 41.3 million; previous year: EUR 28.8 million).
112 f i n a n c i a L s t a t e M e n t s i n o t e s
H a p a g - L L o y d a k t i e n g e s e L L s c H a f t i f i n a n c i a L s t a t e M e n t s 2 0 1 8 a n d M a n a g e M e n t R e p o R t

The income from the release of provisions, from the disposal of fixed assets and from the
reduction of value adjustments on receivables in the amount EUR 89.1 million (previous year:
EUR 148.0 million) which is contained in other operating income relates to other periods.
(17) Transport expenses 1
million EUR 1.1. – 31.12.2018 1.1. – 31.12.2017
Costs of raw materials and supplies 1,619.8 1,078.4
Cost of purchased services 8,432.5 7,057.6
Total 10,052.3 8,136.0
1 Due to a better understanding, income that was previously netted against transport expenses is now reported as sales revenue. The previous year’s figures were adjusted accordingly.
The increase in the cost of purchased services was primarily due to the acquisition of UASC’s
container liner business, which was included in full in the figures for 2018 but was only
included pro rata in 2017. Rebates received for port, canal and terminal costs as well as con-
tainer transport costs are deducted from the corresponding transport costs. These rebates
totalled EUR 6.3 million (previous year: EUR 0.1 million) and relate to previous years, which
means they are classified as relating to other periods. Expenses from the slot charter settle-
ments of EUR 7.2 million (previous year: expenses of EUR 6.4 million) relating to the previous
year are also included. These are also classified as relating to other periods.
(18) Personnel expenses / employees
million EUR 1.1. – 31.12.2018 1.1. – 31.12.2017
Wages and salaries 217.6 215.5
Social security, post-employment and other employee benefit costs 59.8 51.0
thereof for pension 24.4 16.8
Total 277.4 266.5
With regard to the changes in personnel expenses in the current financial year compared with
the previous year, we refer to the information on the earnings position in the management
report. The expense relating to other periods resulting from the utilisation of the new 2018 G
Heubeck tables amounted to EUR 1.4 million.
113n o t e s i f i n a n c i a L s t a t e M e n t s
H a p a g - L L o y d a k t i e n g e s e L L s c H a f t i f i n a n c i a L s t a t e M e n t s 2 0 1 8 a n d M a n a g e M e n t R e p o R t
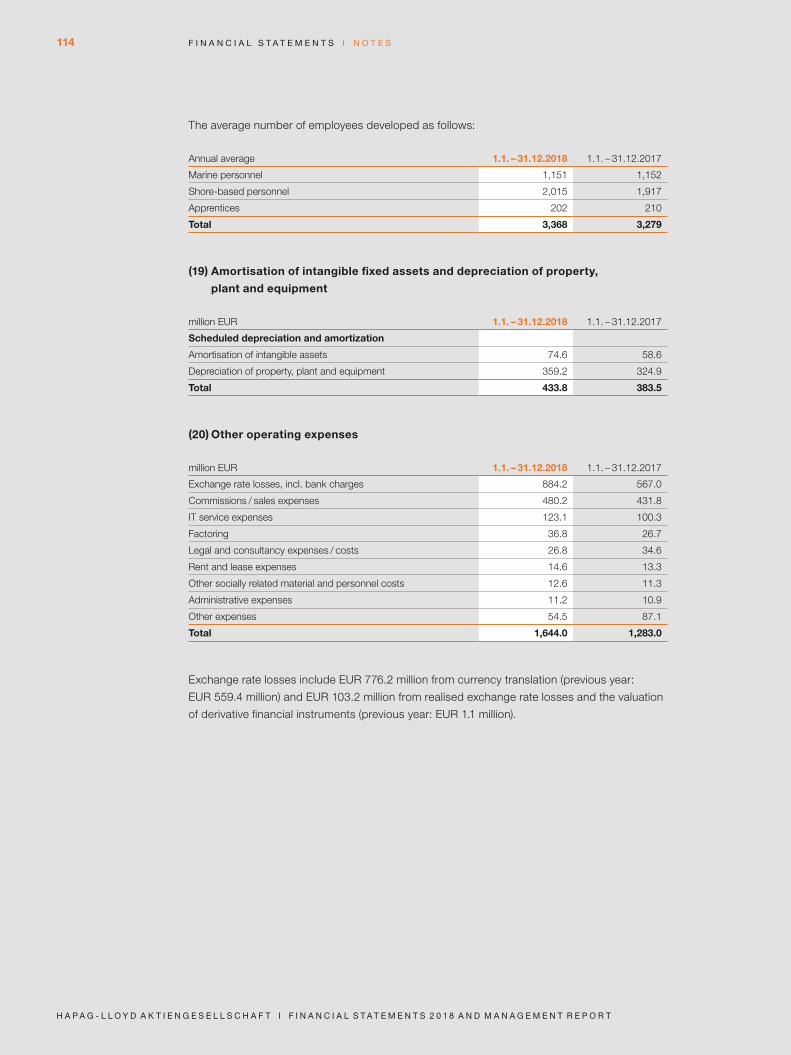
The average number of employees developed as follows:
Annual average 1.1. – 31.12.2018 1.1. – 31.12.2017
Marine personnel 1,151 1,152
Shore-based personnel 2,015 1,917
Apprentices 202 210
Total 3,368 3,279
(19) Amortisation of intangible fixed assets and depreciation of property,
plant and equipment
million EUR 1.1. – 31.12.2018 1.1. – 31.12.2017
Scheduled depreciation and amortization
Amortisation of intangible assets 74.6 58.6
Depreciation of property, plant and equipment 359.2 324.9
Total 433.8 383.5
(20) Other operating expenses
million EUR 1.1. – 31.12.2018 1.1. – 31.12.2017
Exchange rate losses, incl. bank charges 884.2 567.0
Commissions / sales expenses 480.2 431.8
IT service expenses 123.1 100.3
Factoring 36.8 26.7
Legal and consultancy expenses / costs 26.8 34.6
Rent and lease expenses 14.6 13.3
Other socially related material and personnel costs 12.6 11.3
Administrative expenses 11.2 10.9
Other expenses 54.5 87.1
Total 1,644.0 1,283.0
Exchange rate losses include EUR 776.2 million from currency translation (previous year:
EUR 559.4 million) and EUR 103.2 million from realised exchange rate losses and the valuation
of derivative financial instruments (previous year: EUR 1.1 million).
114 f i n a n c i a L s t a t e M e n t s i n o t e s
H a p a g - L L o y d a k t i e n g e s e L L s c H a f t i f i n a n c i a L s t a t e M e n t s 2 0 1 8 a n d M a n a g e M e n t R e p o R t

(21) Financial result
million EUR 1.1. –31.12.2018 1.1. –31.12.2017
Income from associated companies 72.5 41.2
thereof from affiliated companies 41.1 12.9
Income from loans from financial assets 4.5 5.5
thereof from affiliated companies 4.4 5.5
Income from a profit and loss transfer agreement 4.1 5.9
Other interest and similar income 24.5 26.1
thereof from affiliated companies 18.5 14.3
Expenses from the transfer of losses 0.3 0.0
Interest payable and similar expenses 222.9 239.1
thereof from affiliated companies 38.3 9.4
Impairment losses from long-term financial assets and current securities 2.6 6.0
Total –120.2 –166.4
Income from associated companies primarily comprises dividends received from HHLA Con-
tainer Terminal Altenwerder GmbH, Hamburg, Germany, of EUR 30.9 million (previous year:
EUR 22.6 million) and from Hapag-Lloyd Denizasiri Nakliyat A.S, Izmir, Turkey, of EUR 23.5 mil-
lion (previous year: EUR 5.2 million).
The interest expense from pension obligations amounted to EUR 6.9 million (previous year:
EUR 6.9 million). The positive result from the plan assets amounted to EUR 0.8 million (previous
year: EUR 1.1 million). The compounding of provisions with a maturity of more than one year
resulted in an interest expense of EUR 0.7 million (previous year: EUR 0.3 million).
Income from profit and loss transfer agreements essentially comprise income from
Hapag-Lloyd Grundstücksholding GmbH, Hamburg, Germany, of EUR 3.0 million (previous
year: EUR 2.8 million) and from Hamburg-Amerika Linie GmbH, Hamburg, Germany, of
EUR 1.1 million (previous year: EUR 0.8 million).
The impairment of financial assets relates to a foreign subsidiary and was caused by poor
income prospects.
115n o t e s i f i n a n c i a L s t a t e M e n t s
H a p a g - L L o y d a k t i e n g e s e L L s c H a f t i f i n a n c i a L s t a t e M e n t s 2 0 1 8 a n d M a n a g e M e n t R e p o R t

(22) Income taxes
Corporate income tax, the solidarity surcharge, trade tax and paid withholding tax are recog-
nised as income taxes. As in the previous year, a corporate income tax rate of 15.0% and a
solidarity surcharge of 5.5% on corporate income tax applied in the 2018 financial year. The
trade earnings tax rate, which corresponds to the specific applicable municipal assessment
rate, in 2018 and 2017 was 16.5% or 3.3% , insofar as it relates to income from ship operations
in international transport. As a liner shipping company, Hapag-Lloyd AG, has opted for taxa-
tion in accordance with tonnage. Tax liability for tonnage taxation is not calculated using the
actual profits, but rather depends on the net tonnage and the operating days of the Company’s
ship fleet.
Prior-period tax income in the amount of EUR 0.9 million was included in the actual income
taxes (previous year: tax expense of EUR 2.2 million).
Tax expense / income does not include any deferred taxes. Overall, in the 2018 financial year,
there was an (unrecognised) deferred tax asset. This resulted from a corporate income tax
loss carry-forward.
OTHER DISCLOSURES
(23) Transactions with related parties
No significant transactions were effected in the financial year or the previous year which were
not conducted on the basis of normal market terms and conditions.
(24) Group affiliation
Hapag-Lloyd AG is the parent company for the smallest and largest group of companies for
which consolidated financial statements are prepared. The consolidated financial statements
of Hapag-Lloyd AG, Hamburg, Germany, as at 31 December 2018 are to be published in the
online version of the German Federal Gazette.
(25) Executive Board and Supervisory Board remuneration
The total remuneration granted to active Executive Board members in the financial year was
EUR 6.8 million (previous year: EUR 6.2 million). This includes share-based payments with a
fair value of EUR 2.5 million (previous year: EUR 2.2 million) on the date the remuneration was
granted. The active Executive Board members were granted a total of 72,744 virtual shares in
the financial year (previous year: 117,208). The total remuneration for former members of the
Executive Board and their surviving dependants amounted to EUR 1.1 million in the 2018
financial year (previous year: EUR 0.8 million). The emoluments of the active members of the
Supervisory Board amounted to EUR 1.2 million (previous year: EUR 1.1 million).
116 f i n a n c i a L s t a t e M e n t s i n o t e s
H a p a g - L L o y d a k t i e n g e s e L L s c H a f t i f i n a n c i a L s t a t e M e n t s 2 0 1 8 a n d M a n a g e M e n t R e p o R t

Pension provisions for former members of the Executive Board amounted to EUR 19.7 million
(previous year: EUR 18.7 million).
For details of the basic features of Executive Board and Supervisory Board remuneration
and the individual members’ emoluments, please refer to the remuneration report, which is
an integral component of the management report.
Details of the members of the Executive Board and Supervisory Board can be found in
Annexes III and IV to the Notes. Membership of other Supervisory Boards and regulatory
committees within the meaning of Section 125 (1) (5) AktG is listed in Annexe V to the Notes.
(26) Declaration of conformity in accordance with Section 161 AktG
The declaration required under Section 161 AktG was issued by the Executive Board and
Supervisory Board in July 2018 and has been made permanently available to shareholders
on the Company’s website www.hapag-lloyd.com in the “Corporate Governance” section
under “Investor Relations” at https://www.hapag-lloyd.com/en/ir/corporate-governance/
compliance-statement.html.
(27) Total external auditors’ fees
In the 2018 financial year, the following fees were paid to the external auditors KPMG AG
Wirtschaftspruefungsgesellschaft:
million EUR 31.12.2018 31.12.2017
Audit fees for annual audit 2.2 1.9
Audit fees for other assurance services 0.0 0.9
Audit fees for tax consultancy 0.0 0.1
Audit fees for other services 0.0 0.1
Total 2.2 3.0
The fee for audit services rendered by KPMG AG Wirtschaftspruefungsgesellschaft related
primarily to the audit of the consolidated financial statements and the annual financial state-
ments of Hapag-Lloyd AG including legal contractual amendments (thereof EUR 0.2 million
for the previous year).
Other confirmation services concern agreed examination activities in relation to financial
covenants and EMIR auditing in accordance with Section 20 of the German Securities Trad-
ing Act (WpHG).
The tax consultation activities comprise support services in financial year 2017 for the inte-
gration of the UASC Group companies.
The other services comprise support services for quality assurance.
117N o t e s I F I N a N c I a l s t a t e m e N t s
H a p a g - l l o y d a k t I e N g e s e l l s c H a F t I F I N a N c I a l s t a t e m e N t s 2 0 1 8 a N d m a N a g e m e N t r e p o r t

(28) Events after the balance sheet date
On 3 January 2019, a fire broke out in one container on deck of Hapag-Lloyd’s “Yantian
Express”. The 7,510 TEU ship was on its way from Colombo to Halifax. After the fire was con-
tained, the ship was towed to the port of Freeport (Bahamas) where the assessment and the
recovery of cargo is continuing. Potential loss from damage on ship, cargo, bunker, and equip-
ment as well as the rescue cost are either covered by insurance or eligible in the “General
average”. Cost for business interruption are not insured.
On 30 January 2019, 15 February 2019 and 15 March 2019 newly acquired containers were
sold to an investor group as part of Japanese operating leases and subsequently leased back
over a term of seven years, with the option of repurchasing the containers at the end of the
term. The design of the leasing agreements essentially corresponds to a borrowing, combined
with a transfer by way of security of the containers. The refinancing volume associated with
these transactions totalled USD 128.4 million (EUR 113.4 million based on the exchange rates
on January 30, February 15 and March 15, 2019).
On 31 January 2019 the Executive Board of Hapag-Lloyd decided to partly redeem EUR
170 million of its outstanding senior note due 2022. The partly redemption took place on
11 February 2019 at a fixed redemption price of 103.375%. The senior note was issued in
2017 with an aggregate principal amount of EUR 450 million and a coupon of 6.75%.
118 f i n a n c i a L s t a t e M e n t s i n o t e s
H a p a g - L L o y d a k t i e n g e s e L L s c H a f t i f i n a n c i a L s t a t e M e n t s 2 0 1 8 a n d M a n a g e M e n t R e p o R t
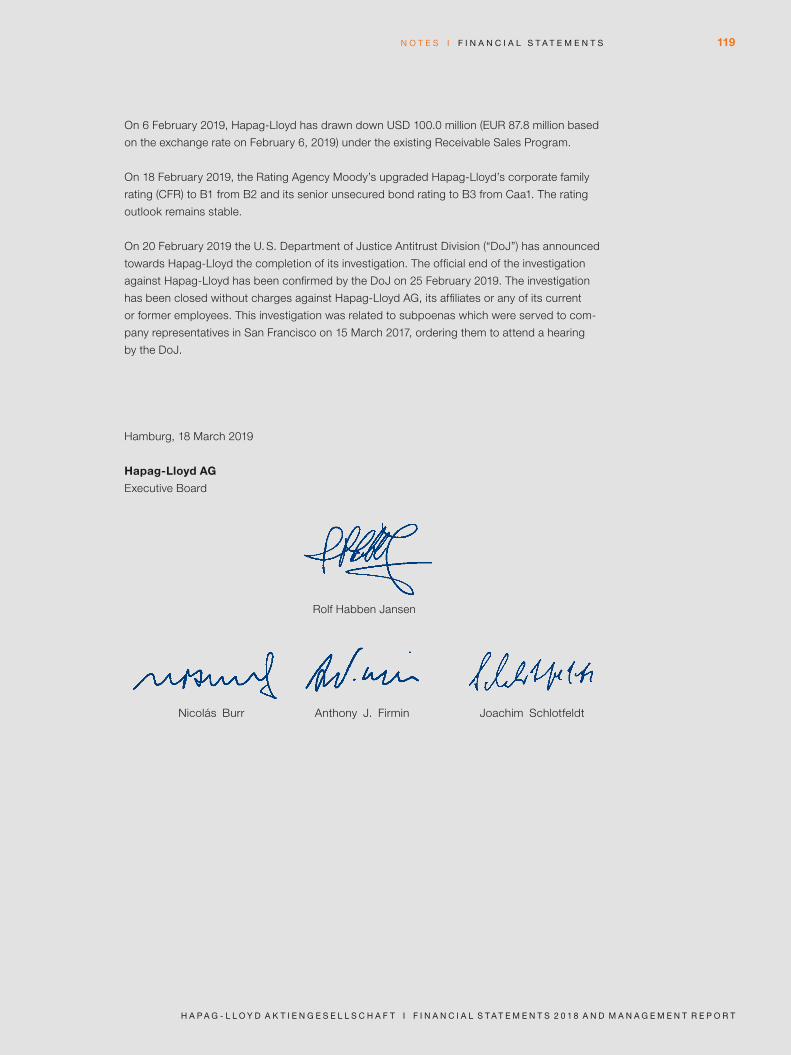
On 6 February 2019, Hapag-Lloyd has drawn down USD 100.0 million (EUR 87.8 million based
on the exchange rate on February 6, 2019) under the existing Receivable Sales Program.
On 18 February 2019, the Rating Agency Moody’s upgraded Hapag-Lloyd’s corporate family
rating (CFR) to B1 from B2 and its senior unsecured bond rating to B3 from Caa1. The rating
outlook remains stable.
On 20 February 2019 the U. S. Department of Justice Antitrust Division (“DoJ”) has announced
towards Hapag-Lloyd the completion of its investigation. The official end of the investigation
against Hapag-Lloyd has been confirmed by the DoJ on 25 February 2019. The investigation
has been closed without charges against Hapag-Lloyd AG, its affiliates or any of its current
or former employees. This investigation was related to subpoenas which were served to com-
pany representatives in San Francisco on 15 March 2017, ordering them to attend a hearing
by the DoJ.
Hamburg, 18 March 2019
Hapag-Lloyd AG
Executive Board
Rolf Habben Jansen
Nicolás Burr Anthony J. Firmin Joachim Schlotfeldt
119n o t e s i f i n a n c i a L s t a t e M e n t s
H a p a g - L L o y d a k t i e n g e s e L L s c H a f t i f i n a n c i a L s t a t e M e n t s 2 0 1 8 a n d M a n a g e M e n t R e p o R t

ANNEXE I
Development of Fixed Assets of Hapag-Lloyd Aktiengesellschaft for the 2018
financial year
million EUR
Historical cost Value adjustments Carrying amounts
1.1.2018 AdditionsReclassi-fications Disposals 31.12.2018 1.1.2018
Amortisation / Depreciation Reclassifications
Total value adjust-ments regarding
disposals 31.12.2018 31.12.2018 31.12.2017
I. Intangible assets
1. Purchased software 32.1 3.0 0.2 – 35.3 29.0 2.5 –0.1 – 31.6 3.7 3.1
2. Purchased concessions, industrial property and similar rights and assets as well as licences in such rights and assets 3.5 – – – 3.5 – – – – – 3.5 3.5
3. Goodwill 1,273.1 0.0 – – 1,273.1 97.5 72.2 – – 169.7 1,103.4 1,175.6
4. Payments received on account of orders 0.0 2.7 – – 2.7 – – – – – 2.7 0.0
1,308.7 5.7 0.2 – 1,314.6 126.5 74.7 –0.1 – 201.3 1,113.3 1,182.2
II. Property, plant and equipment
1. Land, similar rights and buildings including buildings on leasehold land – – – – – – – – – – – –
2. Vessels 4,894.6 3.5 0.0 – 4,898.1 1,172.9 194.7 – – 1,367.6 3,530.5 3,721.7
3. Improvements on leased vessels 5.2 – 0.9 3.6 2.5 5.2 0.4 – 3.6 2.0 0.5 0.0
4. Major spare parts for vessels 3.6 0.2 – – 3.8 2.4 0.2 – – 2.6 1.2 1.2
5. Containers, chassis, gensets 2,019.5 301.9 – 43.6 2,277.8 514.2 161.3 0.0 26.2 649.3 1,628.5 1,505.3
6. Machinery and equipment 9.0 – – – 9.0 3.6 0.9 – – 4.5 4.5 5.4
7. Other equipment and office equipment 20.3 1.3 0.7 0.3 22.0 16.7 1.7 –0.7 0.3 18.8 3.2 3.6
8. Payments received on account of orders 1.8 2.4 –1.0 – 3.2 – – – – – 3.2 1.8
6,954.0 309.3 0.6 47.5 7,216.4 1,715.0 359.2 –0.7 30.1 2,044.8 5,171.6 5,239.0
III. Financial assets
1. Shares in affiliated companies 1,693.9 14.4 0.0 150.9 1,557.4 215.3 2.6 – 150.8 67.1 1,490.3 1,478.6
2. Holdings 319.9 0.0 0.0 4.5 315.4 4.3 – – 4.3 0.0 315.4 315.6
3. Loans to associated companies 94.6 0.0 – 17.7 76.9 – – – – – 76.9 94.6
4. Loans to holdings 1.5 0.1 – 1.5 0.1 1.4 – – 1.4 0.0 0.1 0.1
2,109.9 14.5 – 174.6 1,949.8 221.0 2.6 – 156.5 67.1 1,882.7 1,888.9
10,372.6 329.5 0.8 222.1 10,480.8 2,062.5 436.5 –0.8 186.6 2,313.2 8,167.6 8,310.1
Rounding differences may occur.
120 f i n a n c i a L s t a t e M e n t s i n o t e s
H a p a g - L L o y d a k t i e n g e s e L L s c H a f t i f i n a n c i a L s t a t e M e n t s 2 0 1 8 a n d M a n a g e M e n t R e p o R t

ANNEXE I
Development of Fixed Assets of Hapag-Lloyd Aktiengesellschaft for the 2018
financial year
million EUR
Historical cost Value adjustments Carrying amounts
1.1.2018 AdditionsReclassi-fications Disposals 31.12.2018 1.1.2018
Amortisation / Depreciation Reclassifications
Total value adjust-ments regarding
disposals 31.12.2018 31.12.2018 31.12.2017
I. Intangible assets
1. Purchased software 32.1 3.0 0.2 – 35.3 29.0 2.5 –0.1 – 31.6 3.7 3.1
2. Purchased concessions, industrial property and similar rights and assets as well as licences in such rights and assets 3.5 – – – 3.5 – – – – – 3.5 3.5
3. Goodwill 1,273.1 0.0 – – 1,273.1 97.5 72.2 – – 169.7 1,103.4 1,175.6
4. Payments received on account of orders 0.0 2.7 – – 2.7 – – – – – 2.7 0.0
1,308.7 5.7 0.2 – 1,314.6 126.5 74.7 –0.1 – 201.3 1,113.3 1,182.2
II. Property, plant and equipment
1. Land, similar rights and buildings including buildings on leasehold land – – – – – – – – – – – –
2. Vessels 4,894.6 3.5 0.0 – 4,898.1 1,172.9 194.7 – – 1,367.6 3,530.5 3,721.7
3. Improvements on leased vessels 5.2 – 0.9 3.6 2.5 5.2 0.4 – 3.6 2.0 0.5 0.0
4. Major spare parts for vessels 3.6 0.2 – – 3.8 2.4 0.2 – – 2.6 1.2 1.2
5. Containers, chassis, gensets 2,019.5 301.9 – 43.6 2,277.8 514.2 161.3 0.0 26.2 649.3 1,628.5 1,505.3
6. Machinery and equipment 9.0 – – – 9.0 3.6 0.9 – – 4.5 4.5 5.4
7. Other equipment and office equipment 20.3 1.3 0.7 0.3 22.0 16.7 1.7 –0.7 0.3 18.8 3.2 3.6
8. Payments received on account of orders 1.8 2.4 –1.0 – 3.2 – – – – – 3.2 1.8
6,954.0 309.3 0.6 47.5 7,216.4 1,715.0 359.2 –0.7 30.1 2,044.8 5,171.6 5,239.0
III. Financial assets
1. Shares in affiliated companies 1,693.9 14.4 0.0 150.9 1,557.4 215.3 2.6 – 150.8 67.1 1,490.3 1,478.6
2. Holdings 319.9 0.0 0.0 4.5 315.4 4.3 – – 4.3 0.0 315.4 315.6
3. Loans to associated companies 94.6 0.0 – 17.7 76.9 – – – – – 76.9 94.6
4. Loans to holdings 1.5 0.1 – 1.5 0.1 1.4 – – 1.4 0.0 0.1 0.1
2,109.9 14.5 – 174.6 1,949.8 221.0 2.6 – 156.5 67.1 1,882.7 1,888.9
10,372.6 329.5 0.8 222.1 10,480.8 2,062.5 436.5 –0.8 186.6 2,313.2 8,167.6 8,310.1
Rounding differences may occur.
121n o t e s i f i n a n c i a L s t a t e M e n t s
H a p a g - L L o y d a k t i e n g e s e L L s c H a f t i f i n a n c i a L s t a t e M e n t s 2 0 1 8 a n d M a n a g e M e n t R e p o R t

ANNEXE II
List of the holdings of Hapag-Lloyd AG as at 31 December 2018
Name of the company Registered office Currency unit (CU)
Share-holding
in %Equity
in TCU 10
Net profit / loss for the
year in TCU 10
Head office
Hamburg-Amerika Linie GmbH Hamburg EUR 100.00 63 *
Hapag-Lloyd Grundstücksholding GmbH Hamburg EUR 94.90 30,045 * 13
Hapag-Lloyd Schiffsvermietungsgesellschaft mbH Hamburg EUR 100.00 26 *
Zweite Hapag-Lloyd Schiffsvermietungsgesellschaft mbH Hamburg EUR 100.00 26 *
HHLA Container Terminal Altenwerder GmbH Hamburg EUR 25.10 80,433 *
Hamburg-Amerikanische-Packetfahrt-Gesellschaft mbH Hamburg EUR 100.00 63 *
Europe
Hapag-Lloyd (Austria) GmbH Vienna EUR 100.00 962 –242
Oy Hapag-Lloyd Finland AB Helsinki EUR 100.00 72 55
Hapag-Lloyd (France) S. A. S. Asnieres sur Seine EUR 100.00 4,663 400
Hapag-Lloyd (Ireland) Ltd. Dublin EUR 100.00 180 26
Hapag-Lloyd (Italy) S. R. L. Milano EUR 100.00 702 94
Hapag-Lloyd Polska Sp. z. o. o. Gdynia PLN 100.00 446 –34
Hapag-Lloyd Portugal LDA Lisboa EUR 100.00 182 7
Hapag-Lloyd (Schweiz) AG Basel CHF 100.00 572 54
Hapag-Lloyd Special Finance DAC Dublin USD 100.00 116 21
Hapag-Lloyd (Sweden) AB Gothenburg SEK 100.00 2,458 503
Hapag-Lloyd Spain S. L. Barcelona EUR 90.00 779 173
Hapag-Lloyd (UK) Ltd. Barking GBP 100.00 3,891 123
Norasia Container Lines Ltd. Valetta USD 100.00 ** **
Hapag-Lloyd Denizasiri Nakliyat A. S. Izmir TRY 65.00 88,978 86,278
Hapag-Lloyd (Egypt) Shipping S. A. E. Alexandria EGP 49,0 6 ** **
United Arab Shipping Agency Co. (Polska) Sp. z. o. o. Warsaw PLN 100.00 724 203
United Arab Shipping Agency Company (Italy) S. r. l. Milano EUR 100.00 –956 –1,316
UASAC Nordic A / S Holte DKK 100.00 313 –3,415
UASAC Russia ApS Holte DKK 100.00 –1,240 –35
UASAC Russia llc St. Petersburg RUB 100.00 16 –1
United Arab Shipping Agency Company (CEE) Kft. Budapest EUR 100.00 –79 –8
United Arab Shipping Agency Company (Benelux) B. V. Rotterdam EUR 100.00 570 212
United Arab Shipping Agency Company (Denizcilik Nakliyat) A. S. Istanbul TRY 100.00 34,431 34,147
United Arab Shipping Agency Co. (Egypt) S. A.E Alexandria EGP 49,00 1 –1,163 –2,663
CSAV Denizcilik Acentasi A. S. Istanbul TRY 100.00 2,650 19
UASAC Sweden AB i. L. Göteborg SEK 100.00 ** **
Oy UASAC Finland AB i. L. Helsinki EUR 100.00 ** **
UASAC CEE (Slovakia) s. r.o Bratislava EUR 100.00 –72 1
UASAC Groupement France G. I. E. Marseille EUR 100.00 ** **
United Arab Shipping Agency Co. (United Kingdom) Ltd. i. L. London GBP 49,00 1 ** **
Norddeutscher Lloyd GmbH Bremen EUR 100.00 31 *
122 f i n a n c i a L s t a t e M e n t s i n o t e s
H a p a g - L L o y d a k t i e n g e s e L L s c H a f t i f i n a n c i a L s t a t e M e n t s 2 0 1 8 a n d M a n a g e M e n t R e p o R t

Name of the company Registered office Currency unit (CU)
Share-holding
in %Equity
in TCU 10
Net profit / loss for the
year in TCU 10
Asia
Hapag-Lloyd (Australia) Pty. Ltd. Pyrmont AUD 100.00 2,306 197
Hapag-Lloyd (China) Ltd. Hong Kong HKD 100.00 3,392 892
Hapag-Lloyd (China) Shipping Ltd. Shanghai CNY 100.00 97,541 7,375
Hapag-Lloyd (Japan) K. K. Tokyo JPY 100.00 250,781 11,898
Hapag-Lloyd (Korea) Ltd. Seoul KRW 100.00 1,375,583 88,351
Hapag-Lloyd (Malaysia) Sdn. Bhd. Kuala Lumpur MYR 100.00 151 76
Hapag-Lloyd (New Zealand) Ltd. Auckland NZD 100.00 957 42
Hapag-Lloyd Pte.Ltd. Singapore USD 100.00 5,774 508
Hapag-Lloyd (Taiwan) Ltd. Taipei TWD 100.00 89,575 1,139
Hapag-Lloyd (Thailand) Ltd. Bangkok THB 49.90 6,734 463
Hapag-Lloyd (Vietnam) Ltd. Ho Chi Minh City VND 100.00 5,123 582
Hapag-Lloyd Business Service (Suzhou) Co. Ltd. Suzhou CNV 100.00 ** **
CSAV Group (China) Shipping Co. Ltd. Shanghai CNY 100.00 5,834 –559
United Arab Shipping Co. (Shanghai) Ltd. Shanghai CNY 100.00 7,345 786
United Arab Shipping Co. (Asia) Pte. Ltd. Singapore SGD 100.00 –5,523 –5,817
United Arab Shipping Agency Co. (Asia) Pte Ltd. Singapore USD 100.00 5,134 2,497
United Arab Shipping Co. Holding (Thailand) Ltd. Bangkok THB 49.945 –116 –71
UASC (Thailand) Ltd. Bangkok THB 74.972 7,283 1,777
United Arab Shipping Agency Company (Vietnam) Ltd. Ho Chi Minh City VND 100.00 5,489,957 957,957
United Arab Shipping Agency Company (Hong Kong) Ltd. Hong Kong HKD 100.00 27,013 17,682
Hapag-Lloyd Lanka (Private) Ltd. Colombo LKR 40.00 115,909 172,731 12
United Arab Shipping Agency Company (Thailand) Ltd. Bangkok THB 49.00 –449 –771
United Arab Shipping Agency Company (Malaysia) Sdn. Bhd. Kuala Lumpur MYR 100.00 1,015 97
Middle East
Hapag-Lloyd Africa PTY Ltd. Durban ZAR 100.00 1,002 409
Hapag-Lloyd Global Services Pvt. Ltd. Thane INR 100.00 761,559 110,554 12
Hapag-Lloyd India Private Ltd. Mumbai INR 100.00 259,580 50,660 12
Hapag-Lloyd Middle East Shipping LLC Dubai AED 49,00 1 231 108
Hapag-Lloyd (Ghana) Ltd. Tema GHS 65.00 ** **
Hapag-Lloyd Business Service Center LLP Mumbai INR 100.00 ** **
United Arab Shipping Company Ltd. Dubai USD 100.00 2,329,875 461,686
United Arab Shipping Company for Maritime Services LLC Baghdad IQD 100.00 213,110 161,187
Hapag-Lloyd Pakistan (Pvt.) Ltd. (formerly United Arab Shipping Agency Company Pakistan Pvt. Ltd.) Karachi PKR 100.00 39,190 17,690
United Arab Shipping Agencies Company Private Shareholding Company Amman JOD 50.00 155 30
United Arab Shipping Agency Co. (India) Pvt. Ltd. Chembur INR 100.00 66,999 30,398
United Arab Shipping Agencies Co. LLC (UAE) Dubai USD 49,00 1 20,658 20,061
Hapag-Lloyd Bahrain Co. WLL Manama BHD 49.00 182 32
123n o t e s i f i n a n c i a L s t a t e M e n t s
H a p a g - L L o y d a k t i e n g e s e L L s c H a f t i f i n a n c i a L s t a t e M e n t s 2 0 1 8 a n d M a n a g e M e n t R e p o R t

Name of the company Registered office Currency unit (CU)
Share-holding
in %Equity
in TCU 10
Net profit / loss for the
year in TCU 10
Hapag-Lloyd Qatar WLL (formerly United Arab Shipping Agency Co. (Qatar) WLL) Doha QAR 49.00 7,323 5,823
Hapag-Lloyd Saudi Arabia Ltd. (formerly United Arab Shipping Agencies Co. (Saudi Arabia) Ltd.) Jeddah SAR 60.00 3,187 2,437
Hapag-Lloyd Shipping Company – State of Kuwait K. S. C. C. Kuwait City KWD 49,00 1 229 –516
United Arab Shipping Company Services Ltd. (DIFC) Dubai USD 100.00 23,431 2,992
United Arab Shipping Company Services DMCCO Dubai AED 100.00 ** **
Aratrans Transport and Logistics Service LLC Dubai AED 49,00 1 ** **
Middle East Container Repair Company LLC Dubai AED 49,00 2 37,971 26,561
Djibouti Container Services FZCO Djibouti DJF 19,06 4 853,749 425,426
UASC Services (India) Pvt. Ltd. i. L. Chembur INR 99,99 5 –96,903 –395 12
North America
Hapag-Lloyd (America) LLC Wilmington USD 100.00 6,219 1,863 14
Hapag-Lloyd (Canada) Inc. Montreal CAD 100.00 –1,167 154
Hapag-Lloyd USA LLC Wilmington USD 100.00 335,035 22,612 14
Florida Vessel Management LLC Wilmington USD 75.00 ** **
Texas Stevedoring Services LLC Wilmington USD 50.00 ** **
United Arab Agencies (Inc.) Wilmington USD 100.00 4,745 197
Latin America
Hapag-Lloyd Argentina S. R. L. Buenos Aires ARS 100.00 38,831 34,176
Hapag-Lloyd Colombia Ltda. Bogota COP 100.00 3,713 3,290
Hapag-Lloyd Costa Rica S. A. San Jose CRC 100.00 813,882 4,715
Hapag-Lloyd Guatemala, S. A. Guatemala City GTQ 100.00 990 311
Hapag-Lloyd Mexico S. A. de C. V. Mexico City MXN 100.00 236,425 40,324
Servicios Corporativos Portuarios S. A. de C. V. Mexico City MXN 100.00 –6,971 2,001
Agencias Grupo CSAV Mexico S. A. de C. V. Mexico City MXN 100.00 ** **
Hapag-Lloyd (Peru) S. A. C. Lima PEN 60.00 17,646 30,433
Hapag-Lloyd Venezuela C. A. Caracas VEF 100.00 ** **
Hapag-Lloyd Ecuador S. A. Guayaquil USD 45.00 ** **
Hapag-Lloyd Bolivia S. R. L.Santa Cruz de la Sierra BOB 100.00 ** **
CSAV Austral SpA Santiago de Chile USD 49.00 113,566 11,033
Hapag-Lloyd Chile SpA Valparaíso USD 100.00 4,401 –589
Hapag-Lloyd Uruguay S. A. (formerly CSAV Group Agencies Uruguay S. A.) Montevideo UYU 100.00 16,601 12,755
Libra Serviços de Navegação Limitada (formerly Companhia Libra de Navegacao S. A.) São Paulo BRL 100.00 157,006 22,365
Andes Operador Multimodal Ltda. São Paulo BRL 100.00 ** **
Rahue Investment Co. S. A. Panama City USD 100.00 ** **
Southern Shipmanagement Co. S. A. Panama City USD 100.00 –2,620 –3,556
Southern Shipmanagement (Chile) Ltda. Valparaíso USD 100.00 –2,773 –3,284
Compañía Libra de Navegación (Uruguay) S. A. Montevideo UYU 100.00 ** **
Torksey S. A. Montevideo USD 100.00 ** **
CSAV Ships S. A. Panama City USD 100.00 ** **
Norasia Alya S. A. Panama City USD 100.00 ** **
124 f i n a n c i a L s t a t e M e n t s i n o t e s
H a p a g - L L o y d a k t i e n g e s e L L s c H a f t i f i n a n c i a L s t a t e M e n t s 2 0 1 8 a n d M a n a g e M e n t R e p o R t

Name of the company Registered office Currency unit (CU)
Share-holding
in %Equity
in TCU 10
Net profit / loss for the
year in TCU 10
Servicios de Procesamiento Naviero S. R. L. i. L. Montevideo USD 100.00 ** **
United Arab Shipping Agencies Company Uruguay S. A. (Kiranbir S. A.) Montevideo UYU 60.00 258 –74
Other
CSBC Hull 900 Ltd. Douglas USD 100.00 ** **
Hull 1975 Co. Ltd. Majuro USD 100.00 3,355 2 11
Hull 1976 Co. Ltd. Majuro USD 100.00 1,934 –79 11
Al Wakrah Ltd. George Town USD 100.00 –31 4 13
Al Rayyan Ltd. George Town USD 100.00 –60 –330 13
Qurtuba Ltd. George Town USD 100.00 1,504 –876 13
Dhat Al Salasil Ltd. George Town USD 100.00 –41 –3 13
Hira Ltd. George Town USD 100.00 –41 –4 13
Al Madinah Ltd. George Town USD 100.00 –31 –4 13
Al Mutanabbi Ltd. George Town USD 100.00 –41 –4 13
Manamah Ltd. George Town USD 100.00 –42 –4 13
Al Aziziyah Ltd. George Town USD 100.00 –31 4 13
Busaiteen George Town USD 100.00 –31 –4 13
Al Oyun Ltd. George Town USD 100.00 –32 –4 13
Onayzah Ltd. Valetta EUR 100.00 –1 1 13
Barzan Ltd. Valetta EUR 100.00 –1 1 13
Alula Ltd. Valetta EUR 100.00 –1 1 13
Al Muraykh Ltd. Valetta EUR 100.00 1,588 3,380 15
Tayma Ltd. Valetta EUR 100.00 –1 1 13
Al Zubara Ltd. Valetta EUR 100.00 –1 1 13
Al Jasrah Ltd. Majuro USD 100.00 –1 1 13
Al Nefud Ltd. Valetta EUR 100.00 –1 1 13
Al Riffa Ltd. Valetta EUR 100.00 13,539 –2,872
Al Dahna Ltd. Valetta EUR 100.00 –1 1 13
Jebel Ali Ltd. Valetta EUR 100.00 12,621 –2,756
Tihama Ltd. Valetta EUR 100.00 –1 1 13
Al Qibla Ltd. Valetta USD 100.00 34,349 867 13
Umm Salal Ltd. Valetta EUR 100.00 –1 1 13
Al Jowf Ltd. Valetta USD 100.00 33,968 854 13
Ain Esnan Ltd. Valetta EUR 100.00 –1 1 13
Umm Qarn Ltd. Majuro USD 100.00 –1 1 13
Salahuddin Ltd. Majuro USD 100.00 –1 1 13
Afif Ltd. Majuro USD 100.00 –1 1 13
Linah Ltd. Majuro USD 100.00 –1 1 13
Al Jmeliyah Ltd. Majuro USD 100.00 –1 1 13
Al Nasriyah Ltd. Majuro USD 100.00 –1 1 13
Al Rawdah Ltd. Majuro EUR 100.00 –1 1 16
Al Dhail Ltd. Majuro USD 100.00 –1 1 13
Al Murabba Ltd. Majuro USD 100.00 –1 1 13
Al Mashrab Ltd. Majuro USD 100.00 –1 1 13
Sajid Ltd. Majuro USD 100.00 –1 1 13
UASC Ships (No. 1) Ltd. Dubai USD 100.00 515,233 –10,141
125n o t e s i f i n a n c i a L s t a t e M e n t s
H a p a g - L L o y d a k t i e n g e s e L L s c H a f t i f i n a n c i a L s t a t e M e n t s 2 0 1 8 a n d M a n a g e M e n t R e p o R t

Name of the company Registered office Currency unit (CU)
Share-holding
in %Equity
in TCU 10
Net profit / loss for the
year in TCU 10
UASC Ships (No. 3) Ltd. Dubai USD 100.00 ** **
UASC Ships (No. 4) Ltd. Dubai USD 100.00 104,322 –321
UASC Ships (No. 5) Ltd. Dubai USD 100.00 56,485 –58
UASC Ships (No. 6) Ltd. Dubai USD 100.00 ** **
UASC Ships (No. 7) Ltd. Dubai USD 100.00 25,541 495
UASC Ships (No. 8) Ltd. Dubai USD 100.00 55,852 –1,423
Ship Management No. 1 Ltd. Dubai USD 99.80 25,827 25,777
Ship Management No. 2 Ltd. Dubai USD 99.80 25,723 25,673
Hapag-Lloyd Container Ltd. Barking EUR 100.00 5 1
Hapag-Lloyd Container (No. 2) Ltd. Barking EUR 100.00 4 1
Hapag-Lloyd Container (No. 3) Ltd. Barking EUR 100.00 2 1
Hapag-Lloyd Ships Ltd. Barking EUR 100.00 103 –4
Hapag-Lloyd Ships (No. 2) Ltd. Barking EUR 100.00 –6 –5
Brunswick Investment Co. Inc. Nassau USD 100.00 ** **
CSBC Hull 898 Ltd. Douglas USD 100.00 ** **
Hull 1794 Co. Ltd. Majuro USD 100.00 ** **
Hull 2082 Co. Ltd. Majuro USD 100.00 ** **
Chacabuco Shipping Ltd. Majuro USD 100.00 ** **
Palena Shipping Ltd. Majuro USD 100.00 ** **
Malleco Shipping Co. S. A. Panama City USD 100.00 ** **
Maule Shipping Co. S. A. Panama City USD 100.00 ** **
Khafji Ltd. George Town USD 100.00 ** **
Ash-Shahaniyah Ltd. George Town USD 100.00 ** **
Malik Al Ashtar Ltd. Valetta EUR 100.00 ** **
1 Additional 51.00% are hold by a trustee on behalf of Hapag-Lloyd Group.2 Additional 5.64% are hold by a trustee on behalf of Hapag-Lloyd Group.3 Additional 75.99% are hold by a trustee on behalf of Hapag-Lloyd Group.4 Additional 2.19% are hold by a trustee on behalf of Hapag-Lloyd Group.5 Additional 0.01% are hold by a trustee on behalf of Hapag-Lloyd Group.6 Additional 16.0% are hold by a trustee on behalf of Hapag-Lloyd Group.
10 TCU = in thousands of currency units; financial statements as at 31. December 2017 unless otherwise stated 11 Financial statements as at 30 September 201712 Financial statements as at 31 March 201813 Financial statements as at 31 December 201814 IFRS Package as at 31 December 201815 Financial statements as at 31 December 201616 Financial statements as at 23 May 2018* Profit-and-loss transfer agreement** No financial statements were available for these companies.
126 f i n a n c i a L s t a t e M e n t s i n o t e s
H a p a g - L L o y d a k t i e n g e s e L L s c H a f t i f i n a n c i a L s t a t e M e n t s 2 0 1 8 a n d M a n a g e M e n t R e p o R t
ANNEXE III
Executive Board members of Hapag-Lloyd Aktiengesellschaft
in the 2018 financial year
Rolf Habben Jansen
Chief Executive Officer (CEO), Hamburg
Nicolás Burr
Member of the Executive Board / Chief Financial Officer (CFO), Hamburg
Anthony J. Firmin
Member of the Executive Board / Chief Operating Officer (COO), Hamburg
Joachim Schlotfeldt (since 1 April 2018)
Member of the Executive Board / Chief Personnel and Global Procurement Officer, Hamburg
Thorsten Haeser (until 31 March 2018)
Member of the Executive Board / Chief Commercial Officer (CCO), Hamburg
ANNEXE IV
Supervisory Board members of Hapag-Lloyd Aktiengesellschaft
in the 2018 financial year
Michael Behrendt
(Chairman of the Supervisory Board)
Christine Behle (until 30 September 2018)
Member of the Federal Executive Board, Head of Transport
ver.di – Vereinte Dienstleistungsgewerkschaft, Berlin
(First Deputy Chairwoman of the Supervisory Board until 30 September 2018)
Klaus Schroeter
Union secretary, Federal Division for Transport
(Collective agreement coordination, Division public busses and railway transport),
ver.di – Vereinte Dienstleistungsgewerkschaft, Berlin
(First Deputy Chairman of the Supervisory Board since 6 November 2018)
Oscar Eduardo Hasbún Martínez
Chief Executive Officer
Compañía Sud Americana de Vapores S. A., Santiago de Chile, Chile
(Second Deputy Chairman of the Supervisory Board until 10 July 2018)
Karl Gernandt
Chairman of the Board of Directors
Kühne Holding AG, Schindellegi, Switzerland (Second Deputy Chairman of the Supervisory
Board since 10 July 2018)
127n o t e s i f i n a n c i a L s t a t e M e n t s
H a p a g - L L o y d a k t i e n g e s e L L s c H a f t i f i n a n c i a L s t a t e M e n t s 2 0 1 8 a n d M a n a g e M e n t R e p o R t

Felix Albrecht (since 11 March 2019)
Marine Works Council
Hapag-Lloyd AG, Hamburg
H. E. Sheikh Ali bin Jassim Al-Thani
Advisor to the CEO
Qatar Investment Authority, Qatar
Turqi Alnowaiser (since 23 February 2018)
Head of International Investments
Public Investment Fund, Saudi Arabia
Jutta Diekamp
Deputy Chairwoman of the Works Council for Shipping Operations
Hapag-Lloyd AG, Hamburg
Nicola Gehrt
Head of Investor Relations TUI Group
TUI AG, Hannover
Dr Rainer Klemmt-Nissen
Managing Director
HGV Hamburger Gesellschaft für Vermögens- und Beteiligungsmanagement mbH, Hamburg
(until 31 August 2018)
Joachim Kramer (until 28 February 2019)
Marine Works Council
Hapag-Lloyd AG, Hamburg
Annabell Kröger
Commercial Clerk
Hapag-Lloyd AG, Hamburg
Arnold Lipinski
HR Manager for Shipping Operations
Hapag-Lloyd AG, Hamburg
Sabine Nieswand
Chairwoman of the Works Council
Hapag-Lloyd AG, Hamburg
José Francisco Pérez Mackenna
Chief Executive Officer
Quiñenco S. A., Santiago de Chile, Chile
128 f i n a n c i a L s t a t e M e n t s i n o t e s
H a p a g - L L o y d a k t i e n g e s e L L s c H a f t i f i n a n c i a L s t a t e M e n t s 2 0 1 8 a n d M a n a g e M e n t R e p o R t

Maya Schwiegershausen-Güth (since 26 October 2018)
Head of treaty office of the ITF “flag of convenience“ campaign
Federal department of maritime economy
ver.di Bundesverwaltung, Berlin
Uwe Zimmermann
Commercial Clerk
Hapag-Lloyd AG, Düsseldorf
ANNEXE V
Offices held by members of the Executive Board in supervisory boards and
other comparable supervisory bodies of commercial companies
Rolf Habben Jansen
Stolt-Nielsen Limited – Member of the Board of Directors
World Shipping Council – Supervisory Board Member
Anthony J. Firmin
HHLA Container Terminal Altenwerder GmbH – Supervisory Board Member
SCA Service Center Altenwerder GmbH – Supervisory Board Member
FRANK Beteiligungsgesellschaft mbH – Advisory Board Member
The Britannia Steam Ship Insurance Association Ltd. – Deputy Chairman
Thorsten Haeser (until 31 March 2018)
REVIDERM AG – Supervisory Board Member
Offices held by members of the Supervisory Board in other supervisory boards
and other comparable supervisory bodies of commercial companies
H. E. Sheikh Ali bin Jassim Al-Thani
SCI Elysees 26 – Member of the Board of Directors
Libyan Qatari Bank – Deputy Chairman of the Board of Directors
Qatar Holding LLC – Member of the Board of Directors
Al Rayan Bank – Member of the Board of Directors
Turqi Alnowaiser
Noon Investment – Supervisory Board Member
Saudi Information Technology Company (SITCO) – Supervisory Board Member
Christine Behle (until 30 September 2018)
Deutsche Lufthansa AG – Deputy Chairwoman of the Supervisory Board
Bremer Lagerhaus-Gesellschaft – Aktiengesellschaft von 1877 – Deputy Chairwoman
of the Supervisory Board
Bochum-Gelsenkirchener Straßenbahnen Aktiengesellschaften / Bochum Gelsenkirchener
Bahngesellschaft mbH (since 31 August 2018) – Supervisory Board Member
Dortmunder Stadtwerke AG / Dortmunder Stadtwerke Holding GmbH – Supervisory
Board Member (since July 2018)
129n o t e s i f i n a n c i a L s t a t e M e n t s
H a p a g - L L o y d a k t i e n g e s e L L s c H a f t i f i n a n c i a L s t a t e M e n t s 2 0 1 8 a n d M a n a g e M e n t R e p o R t

Michael Behrendt
Barmenia Allgemeine Versicherungs AG – Deputy Chairman of the Supervisory Board
Barmenia Krankenversicherung AG – Deputy Chairman of the Supervisory Board
Barmenia Lebensversicherung AG – Deputy Chairman of the Supervisory Board
ESSO Deutschland GmbH – Supervisory Board Member
EXXON Mobil Central Europe Holding GmbH – Supervisory Board Member
MAN SE – Supervisory Board Member
MAN Energy Solutions SE – Supervisory Board Member
MAN Truck & Bus AG – Supervisory Board Member
Renk AG – Supervisory Board Member
Nicola Gehrt
TUI Deutschland GmbH – Supervisory Board Member
Karl Gernandt
Kühne + Nagel International AG – Deputy Chairman of the Board of Directors
Kühne Holding AG – President / Chairman of the Board of Directors
Kühne + Nagel (AG & Co.) KG – Chairman of the Supervisory Board
Kühne & Nagel A.G, Luxembourg – Chairman of the Supervisory Board
Kühne Invest AG, Switzerland – Member of the Board of Directors
Kühne Holding (Management) AG – Chairman of the Board of Directors
Kühne Logistics University – Chairman of the Supervisory Board
Kühne Real Estate AG – Chairman of the Board of Directors
LogIndex AG – Member of the Board of Directors
VTG Aktiengesellschaft – Supervisory Board Member
HSV Fußball AG – Supervisory Board Member (until 6 February 2018)
Óscar Eduardo Hasbún Martínez
SM-SAAM S. A. – Member of the Board of Directors
SAAM S. A. – Member of the Board of Directors
SAAM Logistics S. A. – Member of the Board of Directors
SAAM Ports S. A. – Chairman of the Board of Directors
SAAM SMIT Towage Brasil S. A. – Member of the Board of Directors
SAAM SMIT Towage Mexico S. A. DE C. V. – Member of the Board of Directors
SAAM Puertos S. A. – Chairman of the Board of Directors
Florida International Terminal LLC. – Member of the Board of Directors
IQUIQUE Terminal Internacíonal S. A. – Member of the Board of Directors
San Antonio Terminal Internacíonal S. A. – Member of the Board of Directors
San Vicente Terminal Internacíonal S. A. – Member of the Board of Directors
Sociedad Portuaria De Caldera (SPC) S. A. – Member of the Board of Directors
Sociedad Portuaria Granelera De Caldera (SPGC) S. A. – Member of the Board of Directors
Dr Rainer Klemmt-Nissen
Hamburger Hochbahn AG – Supervisory Board Member (until July 2018)
HSH Nordbank AG – Supervisory Board Member (until December 2018)
HSH Beteiligungsmanagement GmbH – Supervisory Board Member (until 22 January 2019)
Vattenfall Wärme Hamburg GmbH – Supervisory Board Member (until July 2018)
HMC Hamburg Messe und Congress GmbH – Supervisory Board Member (until July 2018)
HSH Finanzfonds AöR – Member of the Guarantor Assembly (until September 2018)
130 f i n a n c i a L s t a t e M e n t s i n o t e s
H a p a g - L L o y d a k t i e n g e s e L L s c H a f t i f i n a n c i a L s t a t e M e n t s 2 0 1 8 a n d M a n a g e M e n t R e p o R t

José Francisco Pérez Mackenna
Banchile Corredores de Seguros Limitada – Member of the Board of Directors
Banco de Chile – Member of the Board of Directors
Compañía Cervecerías Unidas S. A. – Member of the Board of Directors
Compañía Cervecerías Unidas Argentina S.A – Member of the Board of Directors
Cervecera CCU Limitada – Member of the Board of Directors
Central Cervecera de Colombia SAS – Member of the Board of Directors
Compañía Industrial Cervecera S. A. – Member of the Board of Directors
Compañía Pisquera de Chile S. A. – Member of the Board of Directors
Compañía Sud Americana de Vapores S. A. – Chairman of the Board of Directors
Embotelladoras Chilenas Unidas S.A – Member of the Board of Directors
Empresa Nacional de Energía S. A. ENEX – Chairman of the Board of Directors
Invexans S. A. – Chairman of the Board of Directors
Invexans Ltd. – Member of the Board of Directors
Inversiones IRSA Limitada – Member of the Board of Directors
Inversiones LQ-SM Limitada – Member of the Board of Directors
Inversiones y Rentas S. A. – Member of the Board of Directors
Nexans S. A. – Member of the Board of Directors
LQ Inversiones Financieras S. A. – Member of the Board of Directors
SAAM S. A. – Member of the Board of Directors
Sociedad Administradora de la Obligación Subordinada SAOS S. A. – Member of
the Board of Directors
Sociedad Matríz del Banco de Chile S. A. – Member of the Board of Directors
Sociedad Matríz SAAM S. A. – Member of the Board of Directors
Sudamericana Agencias Aéreas y Marítimas S. A. – Member of the Board of Directors
Tech Pack S. A. – Chairman of the Board of Directors
Viña San Pedro Tarapacá S. A. – Member of the Board of Directors
Maya Schwiegershausen-Güth
HHLA Hamburger Hafen und Logistik AG – Supervisory Board Member
The Executive Board and Supervisory Board members not listed above do not hold any
offices on other legally required supervisory boards or comparable supervisory bodies of
commercial companies.
131n o t e s i f i n a n c i a L s t a t e M e n t s
H a p a g - L L o y d a k t i e n g e s e L L s c H a f t i f i n a n c i a L s t a t e M e n t s 2 0 1 8 a n d M a n a g e M e n t R e p o R t

RESPONSIBILITY STATEMENT
RESPONSIBILITY STATEMENT PURSUANT TO SECTION 264 (2) AND
SECTION 289 (1) OF THE GERMAN COMMERCIAL CODE (HGB)
We confirm that, to the best of our knowledge and in accordance with the applicable account-
ing principles, the consolidated financial statements of Hapag-Lloyd AG give a true and fair
view of the net asset, financial and earnings position of Hapag-Lloyd AG and that Hapag-Lloyd
AG’s management report includes a fair review of the development and performance of the
business and the position of Hapag-Lloyd AG, together with a description of the principal
opportunities and risks associated with the expected development of Hapag-Lloyd AG.
Hamburg, 18 March 2019
Hapag-Lloyd AG
Executive Board
Rolf Habben Jansen
Nicolás Burr Anthony J. Firmin Joachim Schlotfeldt
132
H a p a g - L L o y d a k t i e n g e s e L L s c H a f t i f i n a n c i a L s t a t e M e n t s 2 0 1 8 a n d M a n a g e M e n t R e p o R t
R e s p o n s i B i L i t y s t a t e M e n t
INDEPENDENT AUDITORS’ REPORT
To Hapag-Lloyd Aktiengesellschaft, Hamburg
REPORT ON THE AUDIT OF THE ANNUAL FINANCIAL STATEMENTS AND
OF THE MANAGEMENT REPORT
Opinions
We have audited the annual financial statements of Hapag-Lloyd Aktiengesellschaft, Hamburg,
which comprise the balance sheet as at 31 December 2018, and the income statement for
the financial year from 1 January to 31 December 2018, and notes to the financial statements,
including the recognition and measurement policies presented therein. In addition, we have
audited the management report of Hapag-Lloyd Aktiengesellschaft, Hamburg, for the financial
year from 1 January 2018 to 31 December 2018.
In our opinion, on the basis of the knowledge obtained in the audit,
• the accompanying annual financial statements comply, in all material respects, with the
requirements of German commercial law applicable to corporations and give a true and fair
view of the assets, liabilities and financial position of the Company as at 31 December 2018,
and of its financial performance for the financial year from 1 January to 31 December 2018,
in compliance with German Legally Required Accounting Principles, and
• the accompanying management report as a whole provides an appropriate view of the
Company’s position. In all material respects, this management report is consistent with the
annual financial statements, complies with German legal requirements and appropriately
presents the opportunities and risks of future development.
Pursuant to Section 322 (3) sentence 1 HGB [Handelsgesetzbuch: German Commercial Code],
we declare that our audit has not led to any reservations relating to the legal compliance of the
annual financial statements and of the management report.
Basis for the Opinions
We conducted our audit of the annual financial statements and of the management report in
accordance with Section 317 HGB and EU Audit Regulation No 537 / 2014 (referred to subse-
quently as ‘EU Audit Regulation’) and in compliance with German Generally Accepted Stand-
ards for Financial Statement Audits promulgated by the Institut der Wirtschaftsprüfer [Institute
of Public Auditors in Germany] (IDW). Our responsibilities under those requirements and princi-
ples are further described in the ‘Auditor’s Responsibilities for the Audit of the Annual Financial
Statements and of the Management Report’ section of our auditor’s report. We are independ-
ent of the Company in accordance with the requirements of European law and German com-
mercial and professional law, and we have fulfilled our other German professional responsibili-
ties in accordance with these requirements. In addition, in accordance with Article 10 (2)
point (f) of the EU Audit Regulation, we declare that we have not provided non-audit services
133i n d e p e n d e n t a U d i t o R ’ s R e p o R t
H a p a g - L L o y d a k t i e n g e s e L L s c H a f t i f i n a n c i a L s t a t e M e n t s 2 0 1 8 a n d M a n a g e M e n t R e p o R t
prohibited under Article 5 (1) of the EU Audit Regulation. We believe that the evidence we have
obtained is sufficient and appropriate to provide a basis for our opinions on the annual financial
statements and on the management report.
Key Audit Matters in the Audit of the Annual Financial Statements
Key audit matters are those matters that, in our professional judgment, were of most signifi-
cance in our audit of the annual financial statements for the financial year from January 1 to
December 31, 2018. These matters were addressed in the context of our audit of the annual
financial statements as a whole, and in forming our opinion thereon, we do not provide a
se parate opinion on these matters.
Impairment testing of the shares in United Arab Shipping Company Ltd.
For the accounting policies applied, we refer to the corresponding section ‘Accounting and
measurement principles – financial assets’ in the notes to the financial statements.
tHe financiaL stateMent Risk
In 2017, Hapag-Lloyd AG acquired 100% of the shares in United Arab Shipping Company Ltd,
Dubai, United Arab Emirates (UASC). The shares in UASC represent a majority of the item enti-
tled ‘shares in affiliated companies’ under financial assets in the balance sheet of Hapag-Lloyd
AG, which amounted to EUR 1,490 million as at 31 December 2018.
The shares in UASC were tested for impairment as at 31 December 2018. For this purpose,
the book value of the shares is compared with the fair value. If the fair value is less than the
book value and impairment is expected to be permanent, the shares are to be written down to
the lower fair value. Hapag-Lloyd AG did not report any impairment losses as at the balance
sheet date.
Checking whether the fair value of the shares is less than the book value as at the reporting
date is a complex process and is based on a range of assumptions and estimates that require
judgement. These relate in particular to projected business development, the expected operat-
ing margins, the consideration of synergies and the cost of capital as key input factors.
There is the risk for the financial statements that the impairment of shares in UASC as at
the reporting date is not identified and the amount reported for the shares in UASC is
thus impaired.
134 i n d e p e n d e n t a U d i t o R ’ s R e p o R t
H a p a g - L L o y d a k t i e n g e s e L L s c H a f t i f i n a n c i a L s t a t e M e n t s 2 0 1 8 a n d M a n a g e M e n t R e p o R t

oUR aUdit appRoacH
Drawing on our valuation experts, we assessed the determination of the fair value of the
shares in UASC as at the reporting date. To this end, we assessed Hapag-Lloyd AG Executive
Board’s plan for the UASC business, compared this to the findings made in the course of our
audit and discussed the results of the analysis with the persons responsible for the business
plan. Since even minor changes to the weighted average cost of capital (WACC) can already
impact the value stated for the shares, we compared the assumptions and parameters under-
lying the WACC, in particular the risk-free rate, market risk premium, beta factor and the coun-
try-risk premium, with our own assumptions and publicly available data as at the reporting
date. Finally, we assessed the calculation method.
oUR concLUsions
The calculation method used for reviewing the impairment testing of the shares is appropriate
and in line with the accounting policies to be applied. The assumptions used are consistent
and appropriate overall.
Impairment testing of goodwill
Please refer to the disclosures in the notes in the ‘Accounting and measurement principles –
Intangible assets’ section for further information on the accounting policies applied.
tHe financiaL stateMent Risk
Goodwill of EUR 1,103 million reported as at 31 December 2018 represents the largest individ-
ual balance sheet item of Hapag-Lloyd AG. The proportionate share of goodwill from acquiring
the operations of container shipping companies CSAV in 2015 und UASC in 2017 is amortised
over a period of 20 years on a straight-line basis owing to the long-term nature of the underly-
ing customer portfolio and the expected synergy potential. In addition, if permanent impair-
ment is expected due to the book value of goodwill exceeding the fair value as at the reporting
date, then the asset must be written down to the lower fair value.
As Hapag-Lloyd AG is the largest operating entity in the Hapag-Lloyd Group and the operating
cash flows of Hapag-Lloyd AG mainly correspond to those of the Group, the recoverability
of goodwill of Hapag-Lloyd AG depends heavily on the future business and earnings develop-
ment of the entire container liner business of the Hapag-Lloyd Group. Impairment testing of
goodwill is complex and based on a range of assumptions that require judgment. Among other
elements, these include key input factors for Hapag-Lloyd AG’s projected business and earn-
ings performance: freight rates, transport volumes, bunker prices, realisation of cost savings
from the measures initiated in the 2018 financial year as part of Strategy 2023, the long-term
revenue level and long-term EBIT margin as well as the WACC applied and the growth dis-
count on the WACC in the terminal value including sensitivity.
There is the risk for the financial statements that the existing permanent impairment loss was
not recognised as at the reporting date.
135i n d e p e n d e n t a U d i t o R ’ s R e p o R t
H a p a g - L L o y d a k t i e n g e s e L L s c H a f t i f i n a n c i a L s t a t e M e n t s 2 0 1 8 a n d M a n a g e M e n t R e p o R t

oUR aUdit appRoacH
By involving our valuation specialists, we have also assessed the appropriateness of Compa-
ny’s key assumptions and calculation methods. For this purpose, we discussed the projected
business and earnings development and the assumed growth discounts with those responsi-
ble for planning. In addition, we reconciled the projected business and earnings performance
with the management planning prepared by the Executive Board and approved by the Super-
visory Board. As even just minor changes to business and earnings performance can signifi-
cantly impact the fair value and the economic conditions in the container shipping industry
continue to be strained, we assessed the consistency of assumptions for the development of
key input factors with external market assessments, findings from comparable businesses
and historical values. In addition, we compared the assumptions and parameters underlying
the WACC, in particular the risk-free rate, the market risk premium and the beta factor with our
own assumptions and publicly available data. To ensure the computational accuracy of the
valuation model used, we verified the Company’s calculations on the basis of selected risk-
based elements. In order to take account of the existing forecast uncertainty, we investigated
the impact of potential changes in the WAAC and earnings performance and the growth dis-
counts on fair value (sensitivity analysis) by calculating alternative scenarios and comparing
these with the Company’s figures. In doing so, we carried out a sensitivity analysis in the form
of a Monte Carlo simulation with respect to the EBIT margin used in perpetual annuity.
oUR concLUsions
The calculation method used for testing goodwill for impairment is appropriate and in line with
the accounting policies to be applied. The Company’s assumptions and parameters used for
measurement are reasonable overall.
Accounting for unfinished voyages
For details on the accounting policies applied, please see the disclosures in the ‘Accounting
and measurement principles – Current assets’ section in the notes to the financial statements.
tHe financiaL stateMent Risk
Transport expenses incurred for voyages unfinished as at the reporting date are capitalised
by Hapag-Lloyd under inventories as unfinished voyages. Trade receivables and revenue from
transport contracts already recorded and which are attributable to unfinished voyages are can-
celled. Expected losses from unfinished voyages reduce the capitalised expenses as part of
the loss-free valuation.
Determining the transport costs incurred in connection with the voyages unfinished as at the
reporting date and the margins underlying the expected loss is a highly complex process.
There is the risk for the financial statements that the revenue and transport costs for unfinished
voyages are not accurately recognised in respect of the cut-off reporting date and the valua-
tion of unfinished voyages is not appropriate.
oUR aUdit appRoacH
We assessed the design, implementation and effectiveness of the controls that are to ensure
accurate recognition cut-off of revenue and transport expenses as at the reporting date. In
addition, we investigated whether the policies defined by Hapag-Lloyd for recognition cut-off
are appropriately structured to ensure the recognition of revenue and transport expenses on
an accrual basis. We assessed the reliability of the analysis from the accounting system on an
136 i n d e p e n d e n t a U d i t o R ’ s R e p o R t
H a p a g - L L o y d a k t i e n g e s e L L s c H a f t i f i n a n c i a L s t a t e M e n t s 2 0 1 8 a n d M a n a g e M e n t R e p o R t

accrual basis by examining representative samples of the underlying documents and the actual
voyage data. We assessed the method of calculating the margins for the valuation of unfin-
ished voyages and the required cut-off procedures at the reporting date and inspected the
model for computational accuracy.
oUR concLUsions
Hapag-Lloyd’s approach with respect to revenue recognition (cut-off) and transport expenses
is appropriate overall.
Responsibilities of Management and the Supervisory Board for the Annual
Financial Statements and the Management Report
Management is responsible for the preparation of annual financial statements that comply, in
all material respects, with the requirements of German commercial law applicable to corpora-
tions, and that the annual financial statements give a true and fair view of the assets, liabilities,
financial position and financial performance of the Company in compliance with German
Legally Required Accounting Principles. In addition, management is responsible for such inter-
nal controls as they, in accordance with German Legally Required Accounting Principles, have
determined necessary to enable the preparation of annual financial statements that are free
from material misstatement, whether due to fraud or error.
In preparing the annual financial statements, management is responsible for assessing the
Company’s ability to continue as a going concern. They also have the responsibility for dis-
closing, as applicable, matters related to the Company’s ability to continue as a going concern.
In addition, they are responsible for financial reporting based on the going-concern basis of
accounting, provided no actual or legal circumstances conflict therewith.
Furthermore, management is responsible for preparing a management report that, as a whole,
provides an appropriate view of the Company’s position and is, in all material respects, con-
sistent with the annual financial statements, complies with German legal requirements and
appropriately presents the opportunities and risks of future development. In addition, manage-
ment is responsible for such arrangements and measures (systems) as they have considered
necessary to enable the preparation of a management report that is in accordance with the
applicable German legal requirements, and to be able to provide sufficient appropriate evi-
dence for the statements made in the management report.
The Supervisory Board is responsible for overseeing the Company’s financial reporting
process for preparing the annual financial statements and management report.
Auditor’s Responsibilities for the Audit of the Annual Financial Statements and
of the Management Report
Our objectives are to obtain reasonable assurance about whether the annual financial state-
ments, as a whole, are free from material misstatement, whether due to fraud or error, and
whether the management report, as a whole, provides an appropriate view of the Company’s
position and, in all material respects, is consistent with the annual financial statements and
the knowledge obtained in the audit, complies with the German legal requirements and ap -
propriately presents the opportunities and risks of future development, as well as to issue an
auditor’s report that includes our opinions on the annual financial statements and on the
management report.
137i n d e p e n d e n t a U d i t o R ’ s R e p o R t
H a p a g - L L o y d a k t i e n g e s e L L s c H a f t i f i n a n c i a L s t a t e M e n t s 2 0 1 8 a n d M a n a g e M e n t R e p o R t

Reasonable assurance is a high level of assurance, but is not a guarantee that an audit con-
ducted in accordance with Section 317 HGB and the EU Audit Regulation and in compliance
with German Generally Accepted Standards for Financial Statement Audits promulgated by
the Institut der Wirtschaftsprüfer (IDW) will always detect a material misstatement. Misstate-
ments can arise from fraud or error and are considered material if, individually or in the aggre-
gate, they could reasonably be expected to influence the economic decisions of users taken
on the basis of these annual financial statements and this management report.
We exercise professional judgement and maintain professional scepticism throughout the
audit. We also:
• Identify and assess the risks of material misstatement of the annual financial statements and
of the management report, whether due to fraud or error, design and perform audit proce-
dures responsive to those risks, and obtain audit evidence that is sufficient and appropriate
to provide a basis for our opinions. The risk of not detecting a material misstatement result-
ing from fraud is higher than for one resulting from error, as fraud may involve collusion, for-
gery, intentional omissions, misrepresentations or the override of internal controls.
• Obtain an understanding of internal control relevant to the audit of the annual financial state-
ments and of arrangements and measures (systems) relevant to the audit of the manage-
ment report in order to design audit procedures that are appropriate in the circumstances,
but not for the purpose of expressing an opinion on the effectiveness of these systems.
• Evaluate the appropriateness of accounting policies used by management and the
reasonableness of estimates made by management and related disclosures.
• Conclude on the appropriateness of management’s use of the going-concern basis of
accounting and, based on the audit evidence obtained, whether a material uncertainty
exists related to events or conditions that may cast significant doubt on the Company’s
ability to continue as a going concern. If we conclude that a material uncertainty exists, we
are required to draw attention in the auditor’s report to the related disclosures in the annual
financial statements and in the management report or, if such disclosures are inadequate,
to modify our respective opinions. Our conclusions are based on the audit evidence
obtained up to the date of our auditor’s report. However, future events or conditions may
cause the Company to cease to be able to continue as a going concern.
• Evaluate the overall presentation, structure and content of the annual financial statements,
including the disclosures, and whether the annual financial statements present the under-
lying transactions and events in a manner that the annual financial statements give a true
and fair view of the assets, liabilities, financial position and financial performance of the
Company in compliance with German Legally Required Accounting Principles.
138 i n d e p e n d e n t a U d i t o R ’ s R e p o R t
H a p a g - L L o y d a k t i e n g e s e L L s c H a f t i f i n a n c i a L s t a t e M e n t s 2 0 1 8 a n d M a n a g e M e n t R e p o R t

• Evaluate the consistency of the management report with the annual financial statements,
its conformity with German law and the view of the Company’s position it provides.
• Perform audit procedures on the prospective information presented by management in the
management report. On the basis of sufficient appropriate audit evidence we evaluate, in
particular, the significant assumptions used by management as a basis for the prospective
information, and evaluate the proper derivation of the prospective information from these
assumptions. We do not express a separate opinion on the prospective information and on
the assumptions used as a basis. There is a substantial unavoidable risk that future events
will differ materially from the prospective information.
We communicate with those charged with governance regarding, among other matters, the
planned scope and timing of the audit and significant audit findings, including any significant
deficiencies in internal control that we identify during our audit.
We also provide those charged with governance with a statement that we have complied with
the relevant independence requirements, and communicate with them all relationships and
other matters that may reasonably be thought to bear on our independence, and where appli-
cable, the related safeguards.
From the matters communicated with those charged with governance, we determine those
matters that were of most significance in the audit of the annual financial statements of the
current period and are therefore the key audit matters. We describe these matters in our
auditor’s report unless law or regulation precludes public disclosure about the matter.
139i n d e p e n d e n t a U d i t o R ’ s R e p o R t
H a p a g - L L o y d a k t i e n g e s e L L s c H a f t i f i n a n c i a L s t a t e M e n t s 2 0 1 8 a n d M a n a g e M e n t R e p o R t

OTHER LEGAL AND REGULATORY REQUIREMENTS
Further Information pursuant to Article 10 of the EU Audit Regulation
We were elected as auditor by the Annual General Meeting on 10 July 2018. We were engaged
by the Audit and Finance Committee on 8 August 2018. We have been the auditor of
Hapag-Lloyd Aktiengesellschaft, Hamburg, as a capital market oriented company without
interruption since the 2015 financial year.
We declare that the opinions expressed in this auditor’s report are consistent with the addi-
tional report to the Audit Committee pursuant to Article 11 of the EU Audit Regulation (long-
form audit report).
RESPONSIBLE GERMAN PUBLIC AUDITOR
The German Public Auditor responsible for the engagement is Dr Victoria Röhricht.
Hamburg, 19 March 2019
KPMG AG
Wirtschaftsprüfungsgesellschaft
[Original German version signed by:]
gez. Madsen gez. Dr. Röhricht
Wirtschaftsprüfer Wirtschaftsprüferin
[German Public Auditor] [German Public Auditor]
140 i n d e p e n d e n t a U d i t o R ’ s R e p o R t
H a p a g - L L o y d a k t i e n g e s e L L s c H a f t i f i n a n c i a L s t a t e M e n t s 2 0 1 8 a n d M a n a g e M e n t R e p o R t

IMPRINT
Hapag-Lloyd AG
Ballindamm 25
20095 Hamburg
Investor Relations
Telefon: +49 40 3001 – 2896
Fax: +49 40 3001 – 72896
Corporate Communications
Telefon: +49 40 3001 – 2529
Fax: +49 40 335360
Concept and Layout
Hapag-Lloyd Corporate Communications
Silvester Group
Druck
optimal media GmbH
www.hapag-lloyd.com

© H
apag
-Llo
yd c
orp
ora
te c
om
mun
icat
ions
03
/ 201
9
Hapag-Lloyd AG · Ballindamm 25 · 20095 Hamburg · www.hapag-lloyd.com