financial statement analysis · financial statement analysis ... 2010 aaaaaaa 1. ... the entire...
TRANSCRIPT

Financial Statement AnalysisyLeverage, Liquidity and SolvencyReid GrossmannReid GrossmannRMG Financial Consulting, Inc
Treatment of Derivatives: A Layman’s GuideMitch TaylorMacquarie Capital (USA) IncMacquarie Capital (USA), Inc
Denver, Colorado,May 6, 2010
aaaaaaa 1

A Tale of Two Meltdowns RMG Financial Consulting
Lehman Brothers
An issue of leverage, solvency, liquidity and confidenceAn issue of leverage, solvency, liquidity and confidence
Constellation Energy Group
An issue of leverage liquidity and confidenceAn issue of leverage, liquidity and confidence
aaaaaaa 2

Lehman Brothers - Leverage and Liquidity RMG Financial Consulting
Assets Under Management (millions)$277,000$282,000
$225,000$175,000
$137 000
Like most of its peers Lehman Brothers had a high degree of leverage (over 30 times) and a balance sheet full of assets of questionable
l$137,000$120,000
YTD Q22008
FYE 2007FYE 2006FYE 2005FYE 2004FYE 2003
value.
Lehman had been postponing the type of asset write downs that many of its peers had been posting since Q4 of 2007.
Total Equity$26,276
$22,490$19,191
$16,794$14,920$13,174
p g Q
Lehman also resisted the need to source additional capital infusions.
It also had less ready liquidity than most
YTD Q22008
FYE 2007FYE 2006FYE 2005FYE 2004FYE 2003
It also had less ready liquidity than most.
Available Liquidity as of Q2 2008:
($ in millions)Total
Facility UsedLC's
IssuedAmount
AvailableCash & Equivalents 6,513$ -$ -$ 6,513$ Facility (2/11) 2,000 - - 2,000 EU F ilit (4/10) 2 500 2 500
Leverage (Assets/Equity)
24.34
30.7326.2424.4223.9423.69
aaaaaaa 3
EU Facility (4/10) 2,500 - - 2,500 Total 11,013$ -$ -$ 11,013$
YTD Q22008
FYE 2007FYE 2006FYE 2005FYE 2004FYE 2003

Lehman Brothers - Solvency RMG Financial Consulting
Tangible Net Worth:($ in millions) Q2 2008 FYE 2007 FYE 2006Total Equity 26,276$ 22,490$ 19,191$ Goodwill & Intangibles (4,101) (4,127) (3,362) Non in stmt Grade Sec (1 630) (1 630) (2 000)Non-invstmt Grade Sec. (1,630) (1,630) (2,000) Subprime Mortgage Pos. (2,800) (5,300) - Tangible Net Worth 17,745$ 11,433$ 13,829$
Inventory Positions Owned:($ in millions) Q2 2008 FYE 2007 FYE 2006
At third quarter-end 2008, preliminary estimates indicated Lehman would record nearly $15 billion in gross valuation adjustments to its mortgage portfolio. Further, the Firm had the following remaining exposures which could still result in
Mortgage & ABS* 72,461$ 89,106$ 57,726$ Government & Agencies 26,988 40,892 47,293 Corporate Debt 49,999 54,098 43,764 Corporate Equities 47,549 58,521 43,087 Real Estate Held for Sale 20,664 21,917 9,408 Commercial Paper 4 757 4 000 2 622
remaining exposures which could still result in significant impairment adjustments.
- Alt-A / Prime $14.6 billion- Subprime / Second Lien $4.0 billion
Oth US RM $2 1 billiCommercial Paper 4,757 4,000 2,622 Derivatives 46,991 44,595 22,696 Total 269,409$ 313,129$ 226,596$
- Other US RM exposures $2.1 billion- European / International $11.1 billion- Commercial mortgage related $36.1 billion- Other ABS 6.5$- Leveraged Finance $28.7 billion, of which $17.8Net Income (millions) g $ , $
billion is high yield or sub-investment grade( )
$4,125$3,941$3,191$2,297$1,699
aaaaaaa 4
($2,408)
YTD Q22008
FYE 2007FYE 2006FYE 2005FYE 2004FYE 2003

Lehman Brothers RMG Financial Consulting
The failure of Lehman resulted from:
It being too highly leveragedThe assets on its balance sheet were overvaluedThe market lost confidence in Lehman’s ability to cover its positionse a e os co de ce e a s ab y o co e s pos o sLehman didn’t have the liquidity to cover its positions
The entire financial system was over leveraged and came close to massive failureThe entire financial system was over-leveraged and came close to massive failure.
Lehman’s peers, who were themselves in a similar situation, had to be bailed out pby equity infusions from and other actions by the US Treasury to keep them afloat.
aaaaaaa 5

CEG – Overview of Company Profile RMG Financial Consulting
Constellation Energy Group (CEG) appeared to be a well-diversified and well-managed merchant energy company with a core regulated utility subsidiary, Baltimore Gas & Electric (BGE). It had been growing steadily, in terms of generation assets as well as trading, for many years and had come out of the energy crisis of 2000 2002 as a strongly positioned
Generating Assets by Fuel Type:(MW ) YE 2008 % YE 2007
Revenues by Segment:
many years and had come out of the energy crisis of 2000 – 2002 as a strongly positioned winner.
(MWs) YE 2008 % YE 2007Coal 3,285 36% 3,253Gas / Oil 1,538 17% 1,155Nuclear 3,869 42% 3,869Hydro / Other 444 5% 451Total Capacity 9,136 8,728
($ in millions) YE 2008 % YE 2007 % YE 2006 %Merchant Energy $16,773 85% $18,745 88% $17,166 89%Reg. Electric 2,680 14% 2,456 12% 2,116 11%Reg. Gas 1,024 5% 963 5% 900 5%Other 253 1% 250 1% 231 1%p y , ,
5%
Generating Assets by Fuel Type:*As of December 31, 2008
Eliminations (912) -5% (1,220) -6% (1,128) -6%Total Revenues $19,818 100% $21,193 100% $19,285 100%
36%
17%
42%
Net Income by Segment:
($ in millions) YE 2008 % YE 2007 % YE 2006 %Merchant Energy ($1,357) NM $678 83% $767 82%Reg. Electric 1 NM 98 12% 120 13%Reg Gas 37 NM 29 4% 37 4%
aaaaaaa 6Coal Gas / Oil Nuclear Hydro / Other
Reg. Gas 37 NM 29 4% 37 4%Other 5 NM 17 2% 12 1%Net Income ($1,314) 100% $822 100% $936 100%

CEG – Historical Financial Summary RMG Financial Consulting
CEG appeared relatively healthy and growing year to year through 2007, and while
aaaaaaa 7
pp y y g g y y gtheir Q2 2008 statements still looked good on the surface, their stock fell from $80 to $60 as soon as the Q2 quarterly reporting was filed – Why?

CEG - Market Reaction to SEC Filings RMG Financial Consulting
aaaaaaa 8

CEG - Commodity Price Volatility RMG Financial Consulting
Commodity Price Volatility – During the first half of 2008, commodity prices increased substantially, and then plummeted during the second half of 2008. This price movement drove wild swings in mark to market values as well as large inflows and outflows of collateralwild swings in mark-to-market values, as well as, large inflows and outflows of collateral postings need to support merchant energy wholesale transactions.
This, together a Q1 reporting error on estimated collateral needs, lead to a critical lack of confidence by investors and trading counterparties
aaaaaaa 9
confidence by investors and trading counterparties.

CEG - Derivative Assets and Liabilities RMG Financial Consulting
As of Q3 2008:
Gross derivative assetsGross derivative assets and liabilities were much larger than the gross trading assets listed on CEG’s balance
As of YE 2008:listed on CEG s balance sheet. CEG’s balance sheet was very highly leveraged.
aaaaaaa 10

CEG – Guarantees and Collateral Issued: RMG Financial Consulting
CEG had also issued more collateral than it had equity on its balance sheet
aaaaaaa 11

CEG - Liquidity Needs if Downgraded RMG Financial Consulting
Risk Management Collateral Error – With the release of CEG’s 10-Q for Q2 2008, the Company reported that it had miscalculated collateral posting requirements in the event of a ratings downgrade. During the first half of 2008, management mistakenly reported and managed liquidity on the basis that a downgrade to junk status would require posting $1.6 billion in additional collateral, when in fact; it would require $3.2 billion. This significant error in risk management controls led to downgrades from two of the three rating agencies inThis significant error in risk management controls led to downgrades from two of the three rating agencies in August and a scramble for additional liquidity sources.
I th i Q2 2008 10 QIn their Q2 2008 10-Q CEG disclosed that they had underestimated their estimates of incremental
ll t l d bcollateral needs by approximately 100%.
aaaaaaa 12

CEG – Available Liquidity RMG Financial Consulting
The question then arose as to whetherCEG h d h d li idit tCEG had enough ready liquidity tosave themselves from a run ofcollateral calls if the company were tobe downgraded.
Available Liquidity as of January 31, 2009:
($ in millions)Total
Facility UsedLC's
Issued AvailableCash & Equivalents 800$ -$ -$ 800$ Credit Facility (07/2012) 3,850 350 3,500 - Credit Facility (11/2009) 1,230 850 - 380Credit Facility (11/2009) 1,230 850 380 Credit Facility (06/2009) 600 600 Credit Facility (09/2013) 350 - 350 Credit Facility (12/2009) 150 - - 150 BGE Facility 400 400 - Total 7,380$ 1,600$ 3,500$ 2,280$ * $3 85 B facility will be reduced to $2 32 B upon EDF transaction
aaaaaaa 13
$3.85 B facility will be reduced to $2.32 B upon EDF transaction
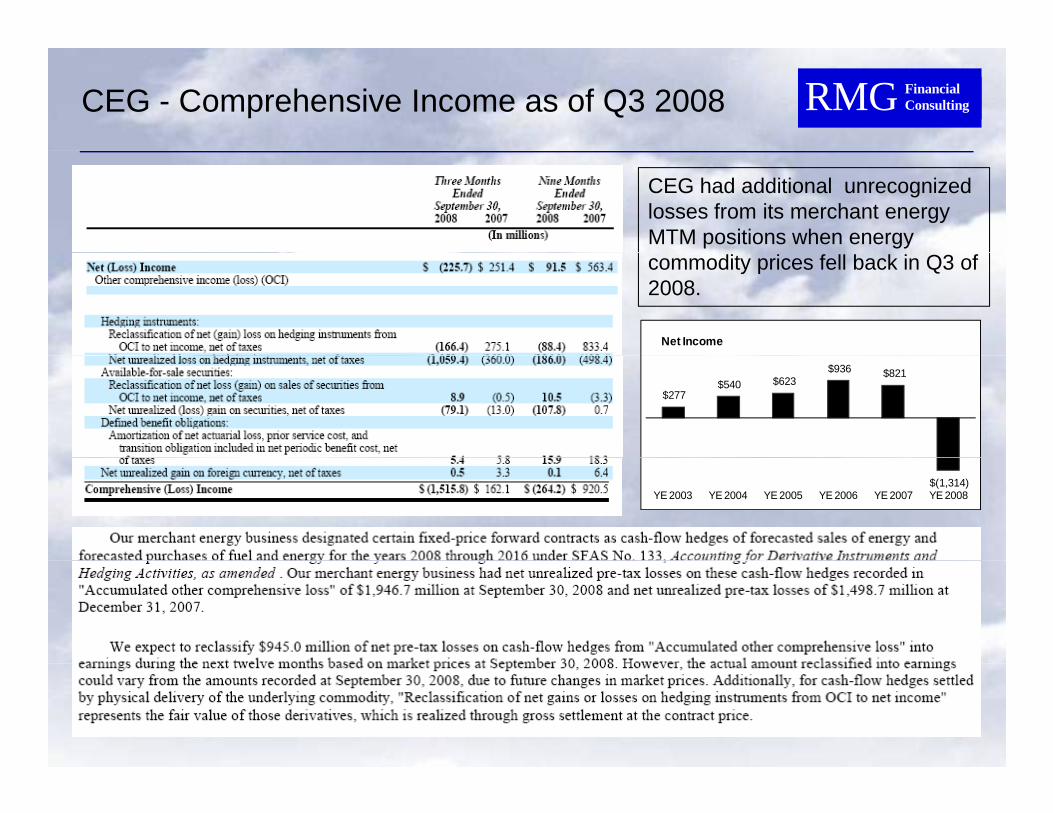
CEG - Comprehensive Income as of Q3 2008 RMG Financial Consulting
CEG had additional unrecognized losses from its merchant energy MTM positions when energy
Net Income
commodity prices fell back in Q3 of 2008.
$277 $540 $623
$936 $821
$(1,314)YE 2003 YE 2004 YE 2005 YE 2006 YE 2007 YE 2008
aaaaaaa 14

Constellation Energy Group RMG Financial Consulting
2008 was a costly year for CEG - Net Income for 2008 was a negative $1.31 billion, d i b l d b f “Oth It ” f lldriven by lower revenues and a number of “Other Items”, as follows:
aaaaaaa 15

Constellation Energy Group RMG Financial Consulting
Since the release of its Q2 10-Q for 2008 CEG began working hard to strengthen its balance sheet, calm investor and counterparty confidence and obtain the liquidity it needs to support its business. Doing so caused the company to find a possible buyer of CEG and to sell off significant portions of its wholesale energy trading business and other assetssignificant portions of its wholesale energy trading business and other assets.
MidAmerican Energy Merger – On December 17, 2008, Constellation announced its decision to terminate the merger agreement with MidAmerican Energy, a subsidiary of Berkshire Hathaway, in order to pursue a different sale transaction with EDF (described below). At the time the merger was originally announced in ( ) g g ySeptember 2008, MidAmerican had provided an immediate $1 billion capital infusion in exchange for 10,000 shares of Series A Preferred Stock. As a result of the merger termination, the Preferred shares were converted into $1 billion of 14% senior notes, due December 2009, 19.9 million shares of common stock in CEG, and $418 million in cash. The cash payment was in lieu of number of common shares which could not be converted as necessary regulatory approvals were not received Additionally Constellation had tonot be converted as necessary regulatory approvals were not received. Additionally, Constellation had to pay MidAmerican $175 million cash as a termination fee.
West Trading & Power & Gas Supply – CEG also divested its Portland-based West trading operations and Alberta-based power and gas customer supply business. p g pp y
Upstream Gas Assets – During 2008, Constellation sold its interests in a number of its upstream natural gas exploration & production assets, which do not require much collateral, but are capital intensive. The Company intends to continue to divest all of these assets, which totals almost 300 Bcfe of proven reserves.
aaaaaaa 16
.

Constellation Energy Group RMG Financial Consulting
International Commodities Business – In January 2009, Constellation announced an agreement to sell this business, which includes coal sourcing, freight, power, natural gas, uranium, and emissions marketing activities outside the United States, to an affiliate of Goldman Sachs. The sale closed on March 23, 2009 and resulted in a pre-tax loss of $334.5 million.p
Uranium Market Participant – In June 2009, CEG sold a uranium market participant that provides marketing services to uranium producers, utilities and an investment fund in the North American and European markets. It appears that this is a company CEG only bought 1 year prior in June 2008 for $105 million
Gas Trading Operations – In February 2009, Constellation announced an agreement to sell its Houston-based downstream gas operations to Macquarie Group. Control of the business was transferred on April 1, 2009. Constellation received $56 million and recorded a net loss of $102.4 million.
Also on April 1, 2009, CEG entered into a gas supply agreement with the buyer of this business to continue to provide the gas needed for CEG’s retail gas customer supply business through March 31, 2011 in a manner that reduces CEG’s collateral obligations. In connection with this agreement, CEG initially posted $160 million of collateral, which was subsequently reduced to $100 million. In addition, the supplier has liens on CEG’s retail gas supply assets and CEG has made investments in the stock of the entity to secureliens on CEG s retail gas supply assets and CEG has made investments in the stock of the entity to secure its obligations under the supply contract.
In connection with these transactions, Constellation benefitted from the return of $1B in collateral t d ith t ti d ti i l tt f dit t t di d d ti i
aaaaaaa 17
posted with counterparties, a reduction in letters of credit outstanding, and a reduction in contingent collateral requirements in the event of a downgrade.

Constellation Energy Group RMG Financial Consulting
Interest in Nuclear Assets – On December 17, 2008, Constellation and EDF entered into a transaction agreement where EDF will purchase a 49.99% interest in the nuclear generation and operation business for $4.5 billion and $150 million of cash received in 2008. In connection with this transaction, EDF provided pConstellation with:
• A “put” agreement where Constellation may sell certain non-nuclear generation facilities to EDF for up to $2 billion in case Constellation needs additional liquidity. This put agreement expires December 31, 2010 The sale of these assets require regulatory approval As of June 30 2009 CEG has received2010. The sale of these assets require regulatory approval. As of June 30, 2009, CEG has received approval for $1.1 billion of assets on an after-tax basis. The Company is awaiting approval on the last asset, which would bring available liquidity up to $1.4 billion on an after-tax basis.
• $1 billion immediate capital by purchasing 10,000 shares of 8% Series B Preferred Stock. These shares will be surrendered to Constellation when the transaction closes and the $1 billion will be credited against the $4.5 billion purchase price. These mandatorily redeemable shares are currently reflected as debt.
• A $600 million interim backstop liquidity facility, which expired as of June 30, 2009.
The completion of this transaction resulted in Constellations nuclear operations to be deconsolidated fromThe completion of this transaction resulted in Constellations nuclear operations to be deconsolidated from its financial statements. The deal was closed late in 2009 and netted CEG $3.5 billion in cash and the company posted an after-tax gain on the transaction of $4.5 billion.
aaaaaaa 18

Constellation Energy Group RMG Financial Consulting
Constellation’s meltdown occurred due to:
The company had become overleveragedThe company had become overleveragedEnergy price swings amplified this leverageCEG’s risk management hit a speed bumpThe market lost confidence in CEG’s ability to cover its positionsCEG’s subsequent losses began to limit its capital
Constellation saved itself by:
Selling off pieces of its trading book to reign in collateral needsTried to sell itself to Warren BuffetFinally sold of half of its nuclear assets to EDF
Had the rating agencies downgraded CEG sooner the company may not have been able to access additional liquidity in time to survived the resulting collateral calls.
aaaaaaa 19
calls.

Treatment of Derivatives: A Layman’s Guide RMG Financial Consulting
As credit analysts for gas / power companies, we analyze a universe of counterparties that make heavy use of derivatives:
• E&P (forward sell oil / gas)• E&P (forward sell oil / gas)• Power generators (forward sell power, buy nat gas / coal)• Ethanol plants (hedge the crush spread)
It is important to be able to strip the effect of non-cash derivative movements out of the income statement. The distortion can be very large, particularly during periods of significant commodity price volatility
We will go through a case study of what sort of adjustments to make using the financial statement of a power generator – Energy Future Competitive Holdings (the TXU business, not incl the regulated distribution operations)
aaaaaaa 20

RMG Financial Consulting
Did ‘Income before income taxes’ really improve from ($9 543mm) toreally improve from ($9,543mm) to $866mm between 2008 and 2009?
What are the “real” earnings results of the company over these two years?
There are serious non-cashThere are serious non cash derivative contaminants buried within:- Net gain (loss) from commodity h d ihedging;- Interest expense and related charges
aaaaaaa 21

Treatment of Derivatives: A Layman’s Guide RMG Financial Consulting
This table (tucked away in Note 15) shows that the company recorded $1,753mm f i ( ti ) i it 2009 i t t t f d i tiof income (or negative expense) in its 2009 income statement from derivatives
The question is … how much of this gain was actually cash settled? And how much is just the change in MTM valuation of the forward volumes?j g
Note the split between commodity contracts (COGS) and interest rate swaps (interest expense)
aaaaaaa 22

Treatment of Derivatives: A Layman’s Guide RMG Financial Consulting
$1,753mm of income seems like a large number. How did the valuation of derivatives move by that much? y
- 3.4Tcf of outright natural gas swaps- 1.0Tcf of natural gas basis swaps- 98,230GWh of power swaps
$
aaaaaaa 23
- $16.3bn of interest rate swapsThese represent hedge volumes as far forward as 2014

RMG Financial Consulting
How can we determine what portion of derivative income / expense was actually realized forexpense was actually realized for the period, and what portion is just a revaluation of forward derivatives?
The cash flow statement is our friend …
aaaaaaa 24

Treatment of Derivatives: A Layman’s Guide RMG Financial Consulting
The cashflow statement tells us that $1,225mm of the income (negative expense) related to commodity derivatives was non-cash. To reconcile to the actual operating cashflow, the cash flow statement adds back this non-cash portion of the derivatives income
aaaaaaa 25Additionally, interest expense has been understated by reporting $696mm of “income” from the positive revaluation of the forward swaps

Treatment of Derivatives: A Layman’s Guide RMG Financial Consulting
OLD NEW OLD NEW31-Dec-09 31-Dec-09 31-Dec-08 31-Dec-08
Operating revenues 7,911 7,911 9,787 9,787
Fuel, purchased power costs and delivery fees (3,934) (3,934) (5,600) (5,600) Net gain (loss) from commodity hedging 1,736 1,736 2,184 2,184 Add: Non-cash commodity derivatives - (1,225) - (2,329) Net commodity margin 5,713 4,488 6,371 4,042 y gOperating costs (693) (693) (677) (677) Depreciation and amortization (1,172) (1,172) (1,092) (1,092) Selling, general and administrative expenses (741) (741) (680) (680) Franchise and revenue-based taxes (108) (108) (109) (109) Impairment of goodwill (70) (70) (8,000) (8,000) Other income 59 59 35 35 Other deductions (63) (63) (1,263) (1,263) Interest income 62 62 59 59 I (2 121) (2 121) (4 187) (4 187)
We have smoothed out the results (a little) by backing out the non-cash derivative
Interest expense (2,121) (2,121) (4,187) (4,187) Add: Non-cash interest rate derivatives - (696) - 1,477 Income (loss) before income taxes 866 (1,055) (9,543) (10,395)
aaaaaaa 26
( ) y gexpenses; we now have a good feel for the real commodity margin, which improved by $446mm. But there are further adjustments to be made …

Treatment of Derivatives: A Layman’s Guide RMG Financial Consulting
OLD NEW OLD NEW31-Dec-09 31-Dec-09 31-Dec-08 31-Dec-08
Operating revenues 7,911 7,911 9,787 9,787
Fuel, purchased power costs and delivery fees (3,934) (3,934) (5,600) (5,600) y ( ) ( ) ( ) ( )Net gain (loss) from commodity hedging 1,736 1,736 2,184 2,184 Add: Non-cash commodity derivatives - (1,225) - (2,329) Net commodity margin 5,713 4,488 6,371 4,042 Operating costs (693) (693) (677) (677) p g ( ) ( ) ( ) ( )Depreciation and amortization (1,172) (1,172) (1,092) (1,092) Selling, general and administrative expenses (741) (741) (680) (680) Franchise and revenue-based taxes (108) (108) (109) (109) Impairment of goodwill (70) (70) (8,000) (8,000) Other income 59 59 35 35 Other deductions (63) (63) (1,263) (1,263) Interest income 62 62 59 59 Interest expense (2,121) (2,121) (4,187) (4,187) Add: Non-cash interest rate derivatives - (696) - 1,477 Income (loss) before income taxes 866 (1,055) (9,543) (10,395)
Add: Depreciation and amortization - 1,581 - 1,549 Add D d i t d hfl h d 183 66
aaaaaaa 27
Add: Dedesignated cashflow hedges 183 66 Add: Impairment of goodwill - 104 - 8,000 Add: Other Deductions (partial) - - - 1,237 Adjusted earnings 866 813 (9,543) 457

Treatment of Derivatives: A Layman’s Guide RMG Financial Consulting
The adjustments that we have made (primarily adding back non-cash derivatives, along with D&A and intangibles) have allowed us to arrive at a true underlyingalong with D&A and intangibles) have allowed us to arrive at a true underlying earnings picture – an increase in annual profit from $0.46bn to $0.78bn, primarily due to the improved commodity margin we observed
Conclusion – the income statement includes a lot of non-cash “noise”. Although it takes some time and effort, the adjustments we talked about do need to be done if we want to paint a picture of what real earnings are
Shortcut – review the earnings press releases issued by public companies. They often set out the GAAP accounting net income, along with an “adjusted EBITDA” result which makes generally the same adjustments that we have undertaken t dtoday
aaaaaaa 28

Treatment of Derivatives: A Layman’s Guide RMG Financial Consulting
aaaaaaa 29

Treatment of Derivatives: A Layman’s Guide RMG Financial Consulting
Questions / discussion? Straight to the bar?
aaaaaaa 30