financial statement analysis of target and tesco
DESCRIPTION
Financial Statement Analysis of Target and TescoGlenny Alawag Michael Mekaru Sung-hee Shin Keoni YamashitaShidler College of Business - ACC 460April 30, 2013TRANSCRIPT

Financial Statement Analysis of Target and Tesco Glenny Alawag Michael Mekaru Sung-hee Shin Keoni Yamashita Shidler College of Business - ACC 460 April 30, 2013 Introduction
Two discount variety stores, Target (U.S.-based) and Tesco (U.K.-based), are compared in this financial statement analysis. Using the annual reports, common-sized financial statements were created, and profitability, liquidity, and solvency ratios for each of the companies were calculated. To further analyze the comparisons, the following general assumptions were made:
1. The industry average ratios are from the RMA Financial Ratio Benchmarks 2011. The ratios are based on NAICS 452990 (All Other General Merchandise Stores) and SIC 5331 (Retail-Variety Stores), where Target and Tesco belong. The ratios apply only to U.S. companies, but it is assumed to apply to foreign companies as well. It is also assumed that these ratios are fixed for the years under the analysis.
2. The fiscal year of Target and Tesco ends in January and February, respectively. For the ratio analysis, the fiscal year is adjusted to represent the calendar year. Thus, Balance Sheet as of February 2012 is herein referred to as year 2011. Tesco’s balance sheet is formatted without the general total labels (e.g., total assets, total current liabilities). These labels were included in the appendix.
Profitability
The profit margins of the two companies are above the industry average (see Table 1). This means that the profit earned by each dollar of sales is higher than the other companies of the retail industry. Target, however, appears to be less profitable than Tesco using this ratio. On the other hand, using the asset turnover ratio, Target is more profitable than Tesco. Also, it should be noted that both companies fall below the industry average.
Ratio Target Tesco
Industry 2011 2010 2011 2010
Profit Margin Asset Turnover Return on Assets Return on Equity Earnings Per Share P-E Ratio Payout Ratio Dividend Yield
4.19% 1.52
6.48% 18.71% $ 4.31 11.6
25.6% 2.21%
4.33% 1.49
6.62% 18.94% $ 4.03 13.5
20.9% 1.55%
4.58% 1.32
6.03% 17.18% $ 0.37 860.54 40.03% 0.05%
4.59% 1.30
5.96% 17.74% $ 0.34
1,154.85 39.15% 0.03%
3.60% 2.6
5.2% 11.01%
NA 16.3
31.55% 2.3%
Table 1: Profitability Ratios For the first 3 ratios, three factors are considered to have major effects to their comparability: PP&E impairment reversal, development cost capitalization, and inventory accounting. To compare the ratios, the profits from continuing operations are used to replace net income.

The first factor is the impairment of Property, Plant and Equipment. To simplify comparison, it is
assumed that the two companies recorded impairment using the difference between carrying value and fair value (i.e., selling cost is immaterial, and fair value equals discounted cash flows). The difference now lies on the recognition of impairment reversal. Because IFRS allows the reversal of impairment, the profit and PP&E book value in an IFRS-prepared financial statement may be higher than in a US GAAP financial statement. The second factor is the capitalization of development costs by Tesco. According to its disclosures, there is an increase of $154 million or a total of $ 1,454 million in its 2011 assets, because of internally generated development costs. In contrast, Target has been classifying all development costs as expense. An adjustment to net income arising from the non-expensed development costs and gains from reversal should reduce the profit margin of Tesco. Also, adjusting the total assets amount as affected by capitalizing development costs and revaluating PP&E, should increase the asset turnover of Tesco. The third factor that could potentially change the profit ratios is inventory cost flow assumption and write-down. This, however, was found with no material effect in comparing Tesco and Target (see Liquidity, par. 1-3). As a result of these, profit margin and asset turnover cannot provide enough information to decide which is more profitable.
The profitability of each dollar invested in assets (ROA) of Target and Tesco compares favorably
with the industry average of 5.2% (see Table 1). These high ROA’s are probably a result of the company’s effective leveraging. Despite the high Debt-to Assets ratio (see Table 3), the companies managed to use the money borrowed from creditors to increase the returns to shareholders. This effective use of leveraging is a good indicator of profitability to shareholders. Compared to Target, Tesco has lower ROA’s for the last two years. This could be dragged even lower if the effects of the two accounting differences discussed before were integrated.
For the remaining profitability ratios, the standard formulae were altered to accommodate
some other differences in financial reporting standards. This is because the complexity of the two businesses varies from one another. First, Tesco reported discontinued operations for 2011 and 2010, whereas Target had no discontinued operations for the same years. These losses and gains could substantially affect the comparability of profitability, because such transaction is not done in the ordinary course of business. Second, all material subsidiaries of Target are wholly-owned, whereas in Tesco’s subsidiaries, minority interest exists. The financial statements are thus reported differently. While the consolidated income of Target is wholly attributable to the parent, Tesco has to report all income, allocated between the parent and non-controlling interest. As a result, the net income (or profits for the year) reported by Tesco is not representative of the real income of the parent. Therefore, for Tesco, net income in the ratios should mean “profit from continuing operations attributable to parent,” cash dividends should refer to “dividends paid to equity owners,” and stockholders’ equity should refer to “equity attributable to the owners of the parent” (see Appendix I).
In terms of stock ownership, Target is less profitable with its 25.6% payout ratio compared to Tesco’s 40.03% and the industry’s 31.55% (see Table 1). However, the dividend relative to the stock price (dividend yield) of Target is close to the industry average and is more than 40 times Tesco’s. The high P-E ratio of Tesco means that a stock earns less than it is priced. It may indicate that Tesco’s stockholders have a bullish outlook for the company, or the stocks are simply overpriced. The basic EPS are not compared, because Target and Tesco do not have the same number of shares outstanding.
Target is more profitable than Tesco to a shareholder’s point of view. In addition, Target’s ratios
seem to be acceptable based on industry average. If the effects of impairment reversal and

development costs are adjusted, Tesco’s ratios would get even worse. Overall, Target is more profitable than Tesco.
Liquidity
A very critical factor in determining profitability and liquidity of retailers is their policy for inventory accounting. As evident in the common-size financial statements, the Cost of Goods Sold accounts for more than 50% (more than 90% in Tesco) of Sales Revenue. Therefore, the choice of cost-flow assumption method and the financial reporting standard is of significant influence to the financial position and results of operations.
Target uses LIFO method, while Tesco uses weighted average cost method. Assuming similar
inflation rate existed for inventories in both companies, Target must be reporting higher cost of goods sold and lower inventory. This would need an adjustment to reflect the difference. However, based on the disclosures of Target, no LIFO provision/reserve was reported because of its immateriality. This means that there is small difference between using the LIFO method and FIFO method, and it follows that the difference between average method and the two is not significant.
Ratio Target Tesco
Industry 2011 2010 2011 2010
Current Ratio Receivables Turnover Average Collection Period Inventory Turnover Day’s Sales on Hand
1.71 11.57 31.56 6.17
59.16
1.63 10.27 35.53 6.19
58.97
0.67 25.88 14.1
17.54 20.81
0.68 28.67 12.73 18.78 19.43
1.8 153.7 2.37 3.3
110.61
Table 2: Liquidity Ratios
Target reports inventory at the LCM, while Tesco reports inventory at the LCNRV. Having lack of information about how the write-down is done, it is assumed that both companies use the same method (e.g., item-by-item basis). It is also assumed that the market value used in Target is close to or equals the net realizable value. A reason to support this is the presence of Inflation in the countries these companies operate in. As long as manufacturing costs follow the inflation trend, replacement cost should be expected to be higher than the original cost. Moreover, the nature of the business (i.e., big-box discount stores) has high inventory turnover (see Table 2). It is less likely that an inventory remains unsold for one year, entailing possible write-down.
Under the inventory turnover, Target has a better performance than the industry. Tesco, however, has more liquid inventory because it sells and replaces inventory 17.54 times a year or every 21 days. The liquidity of receivables of Target and Tesco is below the 153.7 of the industry. This could be the result of Target’s credit card segment and Tesco’s banking segment, which are not available in most retailers of the industry.
Tesco’s ability to pay currently maturing obligations is also affected by foreign exchange fluctuations. The risk of liquidity, however, is being mitigated by Tesco through its cash flow, fair value and net investment hedging instruments. In contrast, Target only has interest rate swaps, because it considers fluctuation gains and losses to be insignificant.

Although Tesco has more liquid inventory and receivables, it has lower current ratio than Target.
Also, unlike Target, Tesco compares less favorably to the industry average. In addition, Tesco has less than 1.0 current ratio (see Table 2) and a negative net current asset (see Appendix F). This would ordinarily indicate that the company has a working capital deficiency and is short of $ 6,386 million current assets to pay current liabilities and upcoming operational expenses. This is attributable to Tesco Bank segment in which all customer deposits are current liabilities. This current ratio is not an effective comparative measure, because Target doesn’t have a banking segment, and the bank’s contribution to the consolidated statements is hardly identifiable and separable.
The receivables and inventory turnovers seem to be better representations of their liquidity. The
ratios were calculated using receivables and inventories related to the retailing segments of the two companies. Based on these ratios, Tesco is more liquid.
Solvency
Because Tesco’s income statement is presented differently, the EBIT used in Times Interest Earned Ratio was adjusted to refer to Tesco’s “Operating profit” plus “Share of post-tax profits of joint ventures and associates” (see Appendix G). Tesco outperforms Target in its ability to pay interest from long-term obligations. Target’s profits can pay 6.15 times the amount of interest, which however, is better than the industry’s 3.0.
Ratio Target Tesco
Industry 2011 2010 2011 2010
Debt to Assets Ratio Times Interest Earned
0.66 6.15
0.65 6.94
0.65 16.91
0.65 11.93
0.67 3.0
Table 3: Solvency Ratios
The debt to assets ratio shows that around two-thirds of the assets of Tesco and Target are from creditors. This is normal for the industry which has 67% (see Table 3). Target’s non-current liabilities went down in 2011. This means that it was either paid or reclassified as current debt. The unsecured debt and other borrowing account classified as current liabilities, however, increased for the year (see Appendix F). Because the cash account also decreased, it appears that the short-term unsecured debt was used as source of funding its investments in property, plant and equipment. Its increased amount of loans must have caused the lower times interest earned ratio, because more interest had to be paid. In contrast, Tesco provides more income and pays lesser finance costs. Therefore, Tesco is in a more solvent position than Target. Conclusion
In conclusion, the differences between U.S. GAAP and U.K. GAAP reporting are not very significant to deter comparability. Adjusting the differences (e.g., presentation, accounting for PP&E

impairment), and avoiding ratios that are affected by irreconcilable differences (e.g., current ratio) made it possible to analyze the two companies. As a result, it was identified that Target is more profitable, but less liquid and solvent than Tesco for the year 2011 and 2010.
References
RMA Financial Benchmark Ratios 2011: 452990 - All Other General Merchandise Stores . (2012). RMA Financial Benchmark Ratios. Retrieved from RIA Checkpoint database.
Target Annual Report 2010. (2011). In SEC. Retrieved April 25, 2013, from
http://www.sec.gov/Archives/edgar/data/27419/000104746911002032/a2201861z10-k.htm
Target Annual Report 2011. (2012). In SEC. Retrieved April 25, 2013, from http://www.sec.gov/Archives/edgar/data/27419/000104746912002714/a2207838z10-k.htm
Target Corp. Historical Prices. (n.d.). In Yahoo! Finance. Retrieved April 25, 2013, from
http://finance.yahoo.com/q/hp?s=TGT+Historical+Prices
Tesco Annual Report and Financial Statements 2011 (2011). In Tesco PLC. Retrieved April 25, 2013, from http://www.tescoplc.com/files/pdf/reports/tesco_annual_report_2011.pdf
Tesco Annual Report and Financial Statements 2012 (2012). In Tesco PLC. Retrieved April 25, 2013, from
http://www.tescoplc.com/files/reports/ar2012/files/pdf/tesco_annual_report_2012.pdf Tesco PLC Historical Prices. (n.d.). In Yahoo! Finance UK & Ireland. Retrieved April 25, 2013, from
http://uk.finance.yahoo.com/q/hp?s=TSCO.


Appendix A: Target Ratios
Profitability 2011 2010 2009
Profit Margin 4.19% 4.33% 3.81%
Asset Turnover 1.52 1.49 1.43
Return on Assets 6.48% 6.62% 5.61%
Return on Equity 18.71% 18.94% 17.12%
- - -
Earnings Per Share 4.31 4.03 3.31
Price-earnings ratio 11.6 13.5 15.7
Payout Ratio 25.6 20.9 19.9
Dividend Yield 2.21% 1.55% 1.27%
Liquidity
Current Ratio 1.71 1.63 1.66
Acid-test Ratio 0.47 0.78 0.81
Receivables Turnover 11.57 10.27 8.69
Average Collection Period 31.56 35.53 42.02
Inventory Turnover '= COGS / Average Inventory 6.17 6.19 6.35
Day's Sales on Hand '= 365 days / Inventory Turnover 59.16 58.97 57.51
Solvency
Debt to total assets ratio '= Total debt / Total Assets 0.66 0.65 0.66
Times interest earned
Ratio 6.15 6.94 5.83
'= Quick Assets / Current Liabilities
'= Net Credit Sales / Average Net Receivables
'= 365 days / Receivable Turnover
'= Earnings Before Interest Expense and Income Tax Expense (EBIT) / Interest
Expense
'= Net Income / Weighted Average CS Outstanding
'= Market price per CS / Earnings per share
'= Cash Dividends / Net Income
'= Dividends Paid Per Share / Market Price of One Share CS at End of Period
'= Current Assets / Current Liabilities
'= Net Income / Net Sales
'= Net Sales / Average Total Assets
'= Net Income / Average Total Assets
'= Net Income / Average Common Equity
'= (Net Income - Preferred Dividends) / Average CS Equity

Appendix B: Target Consolidated Statements of Financial Position
(millions, except footnotes) 2011 2010 2009 2008
Assets
Cash and cash equivalents, including short-term $794 1.70% $1,712 3.92% $2,200 4.94% $864
Credit card receivables, net of allowance of $430 and 5,927 12.71% 6,153 14.08% 6,966 15.64% 8,084
Inventory 7,918 16.98% 7,596 17.38% 7,179 16.12% 6,705
Other current assets 1,810 3.88% 1,752 4.01% 2,079 4.67% 1,835
' Total current assets 16,449 35.28% 17,213 39.38% 18,424 41.37% 17,488
Property and Equipment 0.00% 0.00% 0.00%
Land 6,122 13.13% 5,928 13.56% 5,793 13.01% 5,767
Buildings and improvements 26,837 57.55% 23,081 52.81% 22,152 49.74% 20,430
Fixtures and equipment 5,141 11.03% 4,939 11.30% 4,743 10.65% 4,270
Computer hardware and software 2,468 5.29% 2,533 5.80% 2,575 5.78% 2,586
Construction-in-progress 963 2.07% 567 1.30% 502 1.13% 1,763
Accumulated depreciation (12,382) -26.55% (11,555) -26.44% (10,485) -23.54% (9,060)
Property and Equipment, net 29,149 62.51% 25,493 58.33% 25,280 56.77% 25,756
Other noncurrent assets 1,032 2.21% 999 2.29% 829 1.86% 862
Total Assets $46,630 100.00% $43,705 100.00% $44,533 100.00% $44,106
Liabilities and shareholders' investment
Accounts payable $6,857 14.71% $6,625 15.16% $6,511 14.62% $6,337
Accrued and other current liabilities 3,644 7.81% 3,326 7.61% 3,120 7.01% 2,913
Unsecured debt and other borrowings 3,036 6.51% 119 0.27% 796 1.79% 1,262
Nonrecourse debt collateralized by credit card
receivables 750 1.61% - 0.00% 900 2.02% -
Total current liabilities 14,287 30.64% 10,070 23.04% 11,327 25.44% 10,512
Unsecured debt and other borrowings 13,447 28.84% 11,653 26.66% 10,643 23.90% 12,000
Nonrecourse debt collateralized by credit card
receivables 250 0.54% 3,954 9.05% 4,475 10.05% 5,490
Deferred income taxes 1,191 2.55% 934 2.14% 835 1.88% 455
Other noncurrent liabilities 1,634 3.50% 1,607 3.68% 1,906 4.28% 1,937
Total noncurrent liabilities 16,522 35.43% 18,148 41.52% 17,859 40.10% 19,822
Shareholders' investment
Common stock 56 0.12% 59 0.13% 62 0.14% 63
Additional paid-in capital 3,487 7.48% 3,311 7.58% 2,919 6.55% 2,762
Retained earnings 12,959 27.79% 12,698 29.05% 12,947 29.07% 11,443
Accumulated other comprehensive loss (681) -1.46% (581) -1.33% (581) -1.30% (556)
Total shareholders' investment 15,821 33.93% 15,487 35.44% 15,347 34.46% 13,712
Total liabilities and shareholders' investment $46,630 100.00% $43,705 100.00% $44,533 100.00% $44,106

Appendix C: Target Consolidated Statements of Operations
(millions, except per share data)
Sales $ 68,466 98.00% $ 65,786 97.62% $ 63,435 97.06%
Credit card revenues 1,399 2.00% 1,604 2.38% 1,922 2.94%
Total revenues 69,865 100.00% 67,390 100.00% 65,357 100.00%
Cost of sales 47,860 68.50% 45,725 67.85% 44,062 67.42%
Selling, general and administrative expenses 14,106 20.19% 13,469 19.99% 13,078 20.01%
Credit card expenses 446 0.64% 860 1.28% 1,521 2.33%
Depreciation and amortization 2,131 3.05% 2,084 3.09% 2,023 3.10%
Earnings before interest expense and income taxes 5,322 7.62% 5,252 7.79% 4,673 7.15%
Net interest expense
Nonrecourse debt collateralized by credit card receivables 72 0.10% 83 0.12% 97 0.15%
Other intereset expense 797 1.14% 677 1.00% 707 1.08%
Interest income (3) 0.00% (3) 0.00% (3) 0.00%
Net interest expense 866 1.24% 757 1.12% 801 1.23%
Earnings before income taxes 4,456 6.38% 4,495 6.67% 3,872 5.92%
Provision for income taxes 1,527 2.19% 1,575 2.34% 1,384 2.12%
Net earnings 2,929 4.19% 2,920 4.33% 2,488 3.81%
Basic earnings per share $ 4.31 $ 4.03 $ 3.31
Diluted earnings per share $ 4.28 $ 4.00 $ 3.30
Weighted average common shares outstanding
Basic 679.1 723.6 752.0
Diluted 683.9 729.4 754.8
2011 2010 2009

Appendix D: Target Consolidated Statements of Cash Flows
(millions) 2011 2010 2009
Operating activities
Net earnings $2,929 $2,920 $2,488
Reconcilliation to cash flow
Depreciation and amortization 2,131 2,084 2,023
Share-based compensation expense 90 109 103
Deferred income taxes 371 445 364
Bad debt expense 154 528 1,185
Non-cash (gains)/losses and other, net 22 (145) 143
Changes in operating accounts:
Accounts receivable originated at Target (187) (78) (57)
Inventory (322) (417) (474)
Other current assets (150) (124) (129)
Other noncurrent assets 43 (212) (114)
Accounts payable 232 115 174
Accrued and other current liabilities 218 149 257
Other noncurrent liabilities (97) (103) (82)
Cash flow provided by operations 5,434 5,271 5,881
Investing activities
Expenditures for property and equipment (4,368) (2,129) (1,729)
Proceeds from disposal of property and equipment 37 69 33
Change in accounts receivable originated at third parties 259 363 (10)
Other investments (108) (47) 3
Cash flow required for investing activities 4,180 1,744 1,703
Financing activities
Additions to short-term debt 1,500 - -
Additions to long-term debt 1,994 1,011 -
Reductions of long-term debt (3,125) (2,259) (1,970)
Dividends paid (750) (609) (496)
Repurchase of stock (1,842) (2,452) (423)
Stock option exercises and related tax benefit 89 294 47
Other (6) - -
Cash flow required for financing activities (2,140) (4,015) (2,842)
Effect of exchange rate changes on cash and cash equivalents (32) - -
Net increase (decrease) in cash and cash equivalents (918) (488) 1,336
Cash and cash equivalents at beginning of period 1,712 2,200 864
Cash and cash equivalents at end of period 794 1712 2200

Appendix E: Tesco Ratios
Profitability 2011 2010
Profit Margin 2956 / 64539 4.58% 4.59%
Asset Turnover 64539 / ((50781 + 47206) / 2) 1.32 1.30
Return on Assets 2956 / ((50781 + 47206) / 2) 6.03% 5.96%
Return on Equity 2948 / ((17775 + 16535) / 2) 17.18% 17.74%
Earnings Per Share 2956 / 8021 $0.37 0.35
Price-earnings ratio 318.4 / .37 860.5 1,154.85
Payout Ratio 1180 / 2948 40.03% 0.3915
Dividend Yield (1180 / 2948) / 318.4 0.05% 0.03%
Liquidity
Current Ratio 12863/19249 0.67 0.68
Acid-test Ratio (2305+1243+2657)/19249 0.32 0.33
Receivables Turnover 64539/((2657+2330)/2) 25.88 28.67
Average Collection Period 365/25.88 14.10 12.73
Inventory Turnover '= COGS / Average Inventory 59278/((3598+3162)/2) 17.54 18.78
Day's Sales on Hand '= 365 days / Inventory Turnover 365/17.54 20.81 19.43
Solvency
Debt to total assets ratio '= Total debt / Total Assets 32980/50781 0.65 0.65
Times interest earned
Ratio (3835+417-176)/(417-176) 16.91 11.93
'= Net Credit Sales / Average Net Receivables
'= 365 days / Receivable Turnover
= EBIT / Interest Expense
'= Market price per CS / Earnings per share
'= Cash Dividends to equity owners / Profit from continuing operations-parent
'= Dividends Paid Per Share / Market Price of One Share CS at End of Period
'= Current Assets / Current Liabilities
'= Quick Assets / Current Liabilities
'= Profit from continuing operations / Net Sales
'= Net Sales / Average Total Assets
'= Profit from continuing operations / Average Total Assets
'= Profit from continuing operations- parent / Average Common Equity
'=Profit from continuing operations-parent / Weighted Average CS Outstanding
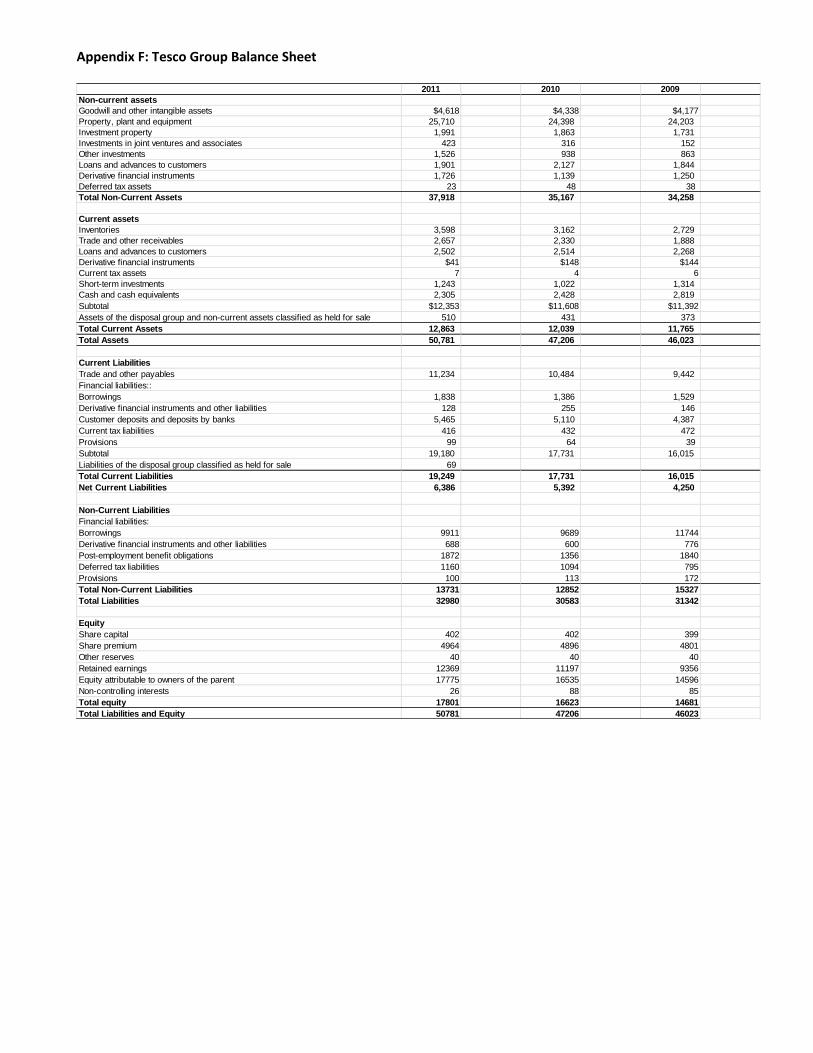
Appendix F: Tesco Group Balance Sheet
2011 2010 2009
Non-current assets
Goodwill and other intangible assets $4,618 $4,338 $4,177
Property, plant and equipment 25,710 24,398 24,203
Investment property 1,991 1,863 1,731
Investments in joint ventures and associates 423 316 152
Other investments 1,526 938 863
Loans and advances to customers 1,901 2,127 1,844
Derivative financial instruments 1,726 1,139 1,250
Deferred tax assets 23 48 38
Total Non-Current Assets 37,918 35,167 34,258
Current assets
Inventories 3,598 3,162 2,729
Trade and other receivables 2,657 2,330 1,888
Loans and advances to customers 2,502 2,514 2,268
Derivative financial instruments $41 $148 $144
Current tax assets 7 4 6
Short-term investments 1,243 1,022 1,314
Cash and cash equivalents 2,305 2,428 2,819
Subtotal $12,353 $11,608 $11,392
Assets of the disposal group and non-current assets classified as held for sale 510 431 373
Total Current Assets 12,863 12,039 11,765
Total Assets 50,781 47,206 46,023
Current Liabilities
Trade and other payables 11,234 10,484 9,442
Financial liabilities::
Borrowings 1,838 1,386 1,529
Derivative financial instruments and other liabilities 128 255 146
Customer deposits and deposits by banks 5,465 5,110 4,387
Current tax liabilities 416 432 472
Provisions 99 64 39
Subtotal 19,180 17,731 16,015
Liabilities of the disposal group classified as held for sale 69
Total Current Liabilities 19,249 17,731 16,015
Net Current Liabilities 6,386 5,392 4,250
Non-Current Liabilities
Financial liabilities:
Borrowings 9911 9689 11744
Derivative financial instruments and other liabilities 688 600 776
Post-employment benefit obligations 1872 1356 1840
Deferred tax liabilities 1160 1094 795
Provisions 100 113 172
Total Non-Current Liabilities 13731 12852 15327
Total Liabilities 32980 30583 31342
Equity
Share capital 402 402 399
Share premium 4964 4896 4801
Other reserves 40 40 40
Retained earnings 12369 11197 9356
Equity attributable to owners of the parent 17775 16535 14596
Non-controlling interests 26 88 85
Total equity 17801 16623 14681
Total Liabilities and Equity 50781 47206 46023
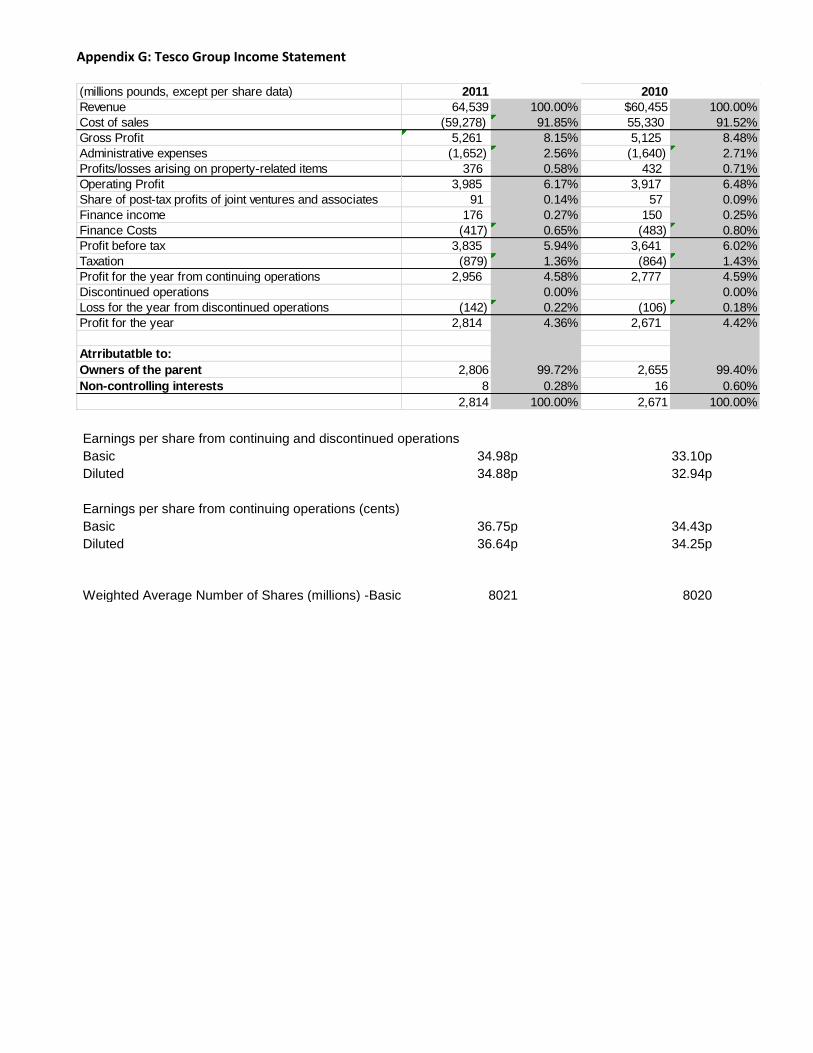
Appendix G: Tesco Group Income Statement
Earnings per share from continuing and discontinued operations Basic 34.98p 33.10p
Diluted 34.88p
32.94p
Earnings per share from continuing operations (cents) Basic 36.75p
34.43p
Diluted 36.64p
34.25p
Weighted Average Number of Shares (millions) -Basic 8021
8020
(millions pounds, except per share data) 2011 2010
Revenue 64,539 100.00% $60,455 100.00%
Cost of sales (59,278) 91.85% 55,330 91.52%
Gross Profit 5,261 8.15% 5,125 8.48%
Administrative expenses (1,652) 2.56% (1,640) 2.71%
Profits/losses arising on property-related items 376 0.58% 432 0.71%
Operating Profit 3,985 6.17% 3,917 6.48%
Share of post-tax profits of joint ventures and associates 91 0.14% 57 0.09%
Finance income 176 0.27% 150 0.25%
Finance Costs (417) 0.65% (483) 0.80%
Profit before tax 3,835 5.94% 3,641 6.02%
Taxation (879) 1.36% (864) 1.43%
Profit for the year from continuing operations 2,956 4.58% 2,777 4.59%
Discontinued operations 0.00% 0.00%
Loss for the year from discontinued operations (142) 0.22% (106) 0.18%
Profit for the year 2,814 4.36% 2,671 4.42%
Atrributatble to:
Owners of the parent 2,806 99.72% 2,655 99.40%
Non-controlling interests 8 0.28% 16 0.60%
2,814 100.00% 2,671 100.00%

Appendix H: Tesco Group Cash Flow Statement
(millions) 2011 2010
Operating activities
Cash generated from operations $5,688 $5,613
Interest paid -531 -614
Corporation tax paid (749) (760)
Net cash generated from operating activities 4,408 4,239
Cash flows from investing activities
Acquisition of subsidiaries, net of cash acquired (65) (89)
Proceeds from sale of PP&E, investment property and non-current assets classified as held for sale 1,141 1,906
Purchase of PP&E and investment property (3,374) (3,178)
Proceeds from sale of intangible assets '- 3
Purchase of intangible assets (334) (373)
Net decrease/(increase) in loans to joint ventures 122 (194)
Investments in joint ventures and associates (49) (174)
Investments in short-term and other investments (1,972) (683)
Proceeds from sale of short-term and other investments 1,205 719
Dividends received from joint ventures and associates 40 62
Interest received 103 128
Net cash used in investing activities (3,183) (1,873)
Cash flows from financing activities
Proceeds from issue of ordinary share capital 69 98
Increase in borrowings 2,905 2,217
Repayment of borrowings (2,720) (4,153)
Repayment of obligations under finance leases (45) (42)
Purchase of non-controlling interests (89) -
Dividends paid to equity owners (1,180) (1,081)
Dividends paid to non-controlling interests (3) (2)
Own shares purchased -303 (31)
Net cash used in financing activities (1,366) (2,994)
Net decrease in cash and cash equivalents (141) (628)
Cash and cash equivalents at beginning of the year 2,428 3,102
Effect of foreign exchange rate changes 24 (46)
Cash and cash equivalents including cash held in disposal group at the end of the year 2,311 2,428
Cash held in disposal group (6) -
Cash and cash equivalents at the end of the year 2,305 2,428

Appendix I: Tesco Additional Information
(millions) Tesco
2011 2010
Dividends paid to equity owners Profits from continuing operations attributable to parent Weighted average stocks
1,180 2,948 8,021
1,081 2,761 8,020
Source: Tesco Annual Report 2011 Notes to Financial Statements Appendix J: Market Stock Price
Target 1/28/2012 1/29/2011 1/30/2010
50.05 54.35 51.91
Tesco 2/28/2012 2/28/2011 2/22/2010
318.4 404.2 419.7
Source: Yahoo! Finance Historical Data
Appendix K: Industry Average
Profitability Industry
Profit Margin 3.60%
Asset Turnover 2.6
Return on Assets 0.052
Return on Equity 11.01%
Earnings Per Share N.A.
Price-earnings ratio 16.3
Payout Ratio 31.55
Dividend Yield 0.023
Liquidity Current Ratio 1.8
Acid-test Ratio 0.40
Receivables Turnover 153.7
Average Collection Period 2.37
Inventory Turnover 3.3
Day's Sales on Hand 110.61
Solvency Debt to total assets ratio 0.67
Times interest earned Ratio 3.00
Source: RMA Financial Ratio Benchmarks 2011