financial slack amongst manufacturing … slack amongst manufacturing smes from australia’s...
TRANSCRIPT

FINANCIAL SLACK AMONGST MANUFACTURING SMEs FROM AUSTRALIA’S
BUSINESS LONGITUDINAL SURVEY: AN EXPLORATORY STUDY
Professor Richard G.P. McMahon,
Head, School of Commerce,
The Flinders University of South Australia,
GPO Box 2100,
Adelaide South Australia 5001.
Telephone: +61 8 82012840
Facsimile: +61 8 82012644
Email: [email protected]
COMMERCE RESEARCH PAPER SERIES NO. 04-7
ISSN: 1441-3906
Acknowledgments
The permission of the Australian Statistician to use confidentialised data from the federal
government’s Business Longitudinal Survey, and to publish findings based on analysis of that
data, is gratefully acknowledged. Thanks are also due to Mr Adrian Zoppa for drawing the
author’s scholarly attention to the issue addressed in the paper. Responsibility for
interpretation of the findings lies solely with the author.

2
FINANCIAL SLACK AMONGST AUSTRALIAN MANUFACTURING SMEs
Abstract
The principal objective in this paper is to examine the nature and significance of
financial slack in a longitudinal panel of 871 small and medium-sized enterprises
(SMEs) in the Australian manufacturing sector over the period 1995-96 to 1997-98.
Financial slack is conceived as a joint condition of high liquidity and unused debt
capacity. Approximately 15 per cent of SMEs in the panel are found to be holding
financial slack in any one year of the study. The demographic profiles, performance
profiles, investment behaviour and financing behaviour of the businesses holding
financial slack are examined in some detail, and are compared with those of the balance
of the sample. The outcomes of the inquiry are found to be difficult to explain within a
strictly financial paradigm. However, a strategic management perspective suggests
some linkages between owner-manager strategic objectives such as independence and
realising lifestyle aspirations, and the incidence of financial slack. The likely
implications of these findings for SME scholarship and policy-making are discussed.
Introduction
The overriding importance of liquidity and cash-flow in small and medium-sized enterprise
(SME) financial management is evident in the somewhat dramatic words of Welsh and White
(1981, p. 29):
A small business can survive a surprisingly long time without a profit. It fails the day it
can’t meet a critical payment. In a small company, the cash flow is more important than
the magnitude of the profit or the ROI. Liquidity is a matter of life or death for the small
business.
In this context, liquidity is considered to be synonymous with the overall level of cash and
near-cash assets such as debtors, stock and marketable securities (referred to collectively as
working capital) held by an SME, augmented with unused borrowing power; and with the
cash inflows and outflows which add to and subtract from the total of these assets.

3
The real concern apparent in the Welsh and White (1981) quotation above is the likely
impact of insufficient liquidity upon the short-term, operational well-being of business
concerns. However, since the early 1980s, there has also been a scholarly interest in the
possible influences of insufficient, or alternatively excessive, liquidity on the longer-term
investment and financing decisions of businesses that ultimately determine their strategic
well-being. Myers and Majluf (1984) draw attention to the possibility that businesses lacking
what they term ‘financial slack’ may need to forgo positive net present value capital projects
because they are unwilling to raise new equity finance on unfavourable terms, leading to an
adverse financial condition referred to as under-investment. Conversely, Jensen (1986)
suggests that managers of businesses with what he terms ‘free cash-flow’ may undertake
negative net present value capital projects rather than return cash to equity holders, leading to
an adverse financial condition referred to as over-investment.
Myers and Majluf (1984) consider financial slack to be liquid assets and riskless
borrowing capacity beyond that needed to meet current operating and debt servicing
requirements. Holding financial slack is essentially a positive net present value investment in
liquidity. Jensen (1986) considers free cash-flow to be excess cash-flow beyond that required
to finance positive net present value projects (including optimal investment in financial slack).
Retaining free cash-flow is essentially a negative net present value investment in liquidity.
Having recognised these differences, Smith and Kim (1994, p. 283) point out that:
Although [financial] slack and free cash flow have precise and distinct definitions, the
concepts are difficult to distinguish empirically. Both involve comparisons of the firm’s
cash generating ability with its investment opportunity schedule.
On this basis then, the term financial slack is loosely used in the title of this paper to broadly
embrace both phenomena. Ultimately, the relatively expansive definition of financial slack
suggested by Brealey et al. (2000, p. 548) is relied upon in the research:

4
Financial slack means cash, marketable securities, readily saleable real assets and ready
access to the debt markets or to bank financing. Ready access basically requires
conservative financing, so that potential lenders see the company’s debt as a safe
investment.
Note that these definitions see financial slack as comprising liquidity and debt capacity.
Conceivably, a business with ready access to the debt market could achieve the financial
flexibility it may require without maintaining an unusually high level of liquid assets.
Alternatively, it is possible that, if a business held sufficient liquid assets, it may not need to
utilise its debt raising ability. However, following the lead of the authors mentioned above,
and many other writers in the field (Donaldson, 1984; Brunner, 1988; Allen, 2000; Triantis,
2000), this research will treat financial slack as a joint condition of high liquidity and unused
debt capacity.
A thorough search of the relevant research literature indicates that, world-wide, there
has been very little consideration of the nature and significance of financial slack amongst
SMEs. Thus, this paper seeks to address a prevailing gap in the SME literature, albeit it an
exploratory manner. The paper proceeds as follows. After summarising the findings of prior
research on the nature and significance of financial slack amongst larger business concerns,
the limited attention to financial slack amongst SMEs is highlighted. The current research
method is then outlined. Thereafter, the findings of the research are presented, followed by
conclusions arising from this investigation.
Prior Research
Nature and Significance of Financial Slack
The seminal work in the literature of agency theory is that of Jensen and Meckling (1976)
who place a great deal of their emphasis on an agency perspective of owner-managed
business enterprises. This work focuses attention upon the economic phenomenon of

5
separation of ownership and control in business concerns, and it contrasts the agency
relationships and problems that might be encountered in smaller owner-managed businesses,
in which ownership and control are typically merged, with those experienced in larger
corporate entities in which the separation of ownership and control is usually greatest. From
this and subsequent works of similar genre (for example those of Myers, 1977; Myers, 1984;
Myers and Majluf, 1984; Jensen, 1986; Stultz, 1990), the issue of the potential impact of
financial slack upon investment and financing decisions of businesses has emerged as a
significant concern for financial theorists. The main thrust of this literature can be
summarised as follows:
• Where a business has a positive net present value investment opportunity, but new
equity would need to be issued in order to undertake the project, managers may reject
the investment because the expected positive net present value could be outweighed by
underpricing of the new equity. The problem arises because of considerable information
asymmetry between managers and potential subscribers to any new equity issue.
Without a full appreciation of the likely benefits of the investment project, and not
completely understanding the reason for the equity issue, potential subscribers could
interpret the issue as ‘bad news’ concerning the business and underprice the equity
accordingly. Thus, under-investment could arise in this circumstance. To avoid this
problem the business would have to purposely build-up sufficient liquidity and/or retain
unused debt capacity, so that a new equity issue could be avoided when an attractive
investment opportunity arises.
• Where a business has substantial free cash-flow, there may be an incentive for managers
– founded on self-interest related to possible rewards from managing a larger, more
diverse business – to undertake negative net present value investment projects in order
to avoid distributions of funds to equity holders. Thus, over-investment could arise in

6
this circumstance. Remedies for this problem include enforcing the distribution of free
cash-flows to equity holders through profit distributions and/or equity repurchases, or
requiring that new investment opportunities be funded with debt.
Taking the integrative perspective of Smith and Kim (1994), under-investment can be seen to
be the consequence of having too little financial slack; while over-investment may be the
result of having too much financial slack. In the words of Triantis (2000, p. 36), ‘The optimal
amount of financial slack permits a firm to finance its profitable investment opportunities, but
no more’. Because of asymmetric information regarding a business’s investment opportunity
set at a particular point in time, identification of the optimum level of financial slack by
outside parties (including researchers) is extremely difficult, if not impossible (Triantis, 2000;
McMahon, 2003).
Key themes relating to financial slack to emerge from the theoretical and empirical
literature primarily concerned with larger businesses include:
• The measurement and valuation of financial slack are problematic (Bourgeois, 1981;
Gentry, 1988; Beranek et al., 1995). In a now dated state-of-the-art review of short-run
financial management, Gentry (1988, p. 49) indicates that ‘We do not have a theory that
explains how much cash a firm should hold or be able to acquire quickly without
affecting its cost’. Gentry (1988, p. 50) goes on to include in his suggestions for future
research the development of a comprehensive index to measure financial slack which
‘should lead to the evolution of a theory that integrates the dimension of liquidity into
the value of the firm’. No response to this agenda item has been discovered in the
subsequent literature, although Bourgeois (1981) had previously made a partial attempt
to do this. And, more than a decade later, Brealey et al. (2000) still include the valuation
of liquidity amongst the ten unsolved problems in finance.

7
• Following on from the previous point, most published research dealing with financial
slack employs proxies of various kinds that attempt to capture, in a necessarily
approximate manner, the apparent existence and/or extent of the phenomenon
(Bourgeois, 1981; Fazzari et al., 1988; Lang et al., 1991; Smith and Kim, 1994;
Beranek et al., 1995; Datta et al., 1996; Jung et al., 1996; Allen, 2000; Ballester et al.,
2001; DeMiguel and Pindado, 2001; Minton and Wruck, 2001; O’Brien, 2003). At the
core of the problem for scholars is the fact that the data required are difficult to obtain,
even for publicly-listed large businesses. For example, Allen (2000, p. 300) points out
that ‘Spare borrowing capacity is not directly observable or reported comprehensively
in a company’s financial statements’. Clearly, the data difficulties facing researchers are
likely to be of much greater magnitude when it comes to SMEs for which reliable and
accessible financial statements may simply not exist.
As far as the liquidity component of financial slack is concerned, stock (absolute or
relative measures) and flow proxies have been variously used. Examples of absolute
stock liquidity proxies include a business’s holdings of cash plus marketable securities;
and also, more broadly, net working capital (Beranek et al., 1995). Commenting on the
second of these proxies, Beranek et al. (1995, pp. 216-217) indicate:
We are struck by the apparent importance of . . . net working capital. Consistently
overlooked by previous investigators, it merits further investigation. On average,
firms tend to draw down current assets that exceed their current liabilities before
embarking on long-term external financing. They may also expend liquid assets in
the Myers-Majluf sense [their first proxy], which are part of net working capital.
But, overall, net working capital is apparently more frequently substituted for
external long-term financing than liquid assets.
Examples of relative stock liquidity proxies include cash and securities readily
convertible into cash scaled by total assets, and also working capital minus inventories

8
scaled by total assets (Fazzari et al., 1988; Datta et al., 1996; Jung et al., 1996). Flow
liquidity measures that have been employed generally attempt to capture cash-flow from
operations by adding back non-cash items (such as depreciation) to operating
profitability (Lang et al., 1991; Smith and Kim, 1994; Beranek et al., 1995; Ballester et
al., 2001; DeMiguel and Pindado, 2001). An example from Beranek et al. (1995) is the
sum of net working capital, net income, depreciation, and proceeds from sales of assets-
in-place, less dividends.
As far as unused debt capacity is concerned, approaches have included simply asking
firms what they consider to be the extent of their further low-risk debt raising ability
(Allen, 2000); or inferring further debt raising capacity from the fact that certain
businesses have low values for some leverage measure (Bourgeois, 1981; Minton and
Wruck, 2001; O’Brien, 2003). Datta et al. (1996) use times interest earned to proxy for
unused debt capacity. Beranek et al. (1995, p. 212) indicate that ‘Excluding default-free
debt is not a serious problem since few manufacturing firms have debt that can qualify
for Moody’s AAA rating, let alone warrant a default-free status’. Beranek et al. (1995,
p. 220) go on:
Slack defined in the Myers and Majluf (1984) sense – marketable securities plus
riskless borrowing capacity – has little influence on external financing. Only by
expanding the definition of slack to include measures such as net working capital
(or net working capital plus depreciation and net income less dividends) do we
observe a preference for internal financing. Apparently firms, on average,
significantly draw down net working capital before turning to the capital markets
to finance capital expenditures.
• The propensity for businesses to hold financial slack is significantly influenced by their
growth potential (Myers, 1977; Baur et al., 1995; Brealey et al., 2000). Myers (1977)
speaks of the value of assets representing growth opportunities, as opposed to assets in

9
place, and their impact on debt policy. In the words of Brealey et al. (2000, p. 548),
‘Financial slack is most valuable to firms with plenty of positive NPV growth
opportunities. That is another reason why growth companies usually aspire to
conservative capital structures’. Baur et al. (1995) also make this point. Baur et al.
(1995, p. 177) additionally distinguish between redeployable assets versus relationship-
specific assets, and they go on ‘if technology dictates that no relationship-specific assets
are needed in the production process, the manager and investor will be indifferent to
acquiring control. In this case, short-term debt will be the least-costly financing choice,
and thus the most appropriate source to use’. Clearly this will have implications for the
apparent level of financial slack held.
• Following on from the previous point, it appears that businesses with higher holdings of
intangible assets, that potentially represent growth opportunities, value financial slack
more highly because such assets are difficult to collateralise (Myers, 1977; Bourgeois,
1981; Myers, 1984; Allen, 2000; Minton and Wruck, 2001; O’Brien; 2003). Myers
(1984, p. 586) indicates that ‘Firms holding valuable intangible assets or growth
opportunities tend to borrow less than firms holding mostly tangible assets’. According
to Allen (2000, p. 305), ‘Companies with intangible and non-collateralizable assets are
more likely to encounter external funding constraints’. Allen (2000) attempts to capture
this dimension using proxies such as research and development (R&D) outlays or
advertising expenditure as a proportion of sales. Minton and Wruck (2001) note that
capital spending to total assets and R&D expenditure to sales are used as proxies for
growth opportunities or asset specificity in other research studies. Minton and Wruck
(2001, p. 7) also find that ‘low leverage firms spend a significantly higher proportion of
sales on research and development than control firms’.

10
Adopting a strategic management perspective, Bourgeois (1981) emphasises
organisational slack as a facilitator of creative or innovative behaviour. More recently,
O’Brien (2003, p. 415) claims that ‘Our empirical analysis yields strong support for the
proposition that financial slack should be a particularly critical strategic imperative for
firms pursuing a competitive strategy premised on innovation. We also demonstrate that
firms pursuing such a strategy that fail to recognise the value of financial slack are
likely to perform poorly.’ O’Brien (2003, p. 416) goes on:
Previous research has pointed out that intense investment in R&D is associated
with lower leverage because these investments create primarily intangible assets,
which cannot serve as good collateral.
and:
Financial slack can help sustain the competitive position of firms competing on
the basis of innovation by helping to ensure: (a) continuous, uninterrupted
investments in R&D; (b) that the funds necessary to launch new products are
available when needed; and (c) that firms can expand their knowledge base
through acquisitions when it is potentially beneficial to do so.
• The holding of financial slack is frequently a transitory phenomenon (Myers and
Majluf, 1984; Ballester et al., 2001; Minton and Wruck, 2001). For example, Minton
and Wruck (2001, pp. 1-2) indicate that:
Seventy percent of low leverage firms eventually drop their conservative financial
policy. Almost 50% of conservative firms substantially increase their leverage
after five years. The vast majority of firms that drop financial conservatism (over
90%) never return to a policy of low leverage.
and:
. . . conservative firms seem to stockpile financial slack or debt capacity. As long
as their internal flow of funds and cash balances are relatively high and
discretionary outlays are low, they maintain low leverage. When the internal flow
of funds surplus falls and/or discretionary outlays increase, low leverage firms

11
drop their conservative financial policy by increasing their long-term leverage.
Thus, conservative firms utilise their ‘stockpiles’ when sources of internal funding
decline and/or to finance acquisitions and capital expenditures.
• The limited empirical evidence on the possible influence of enterprise size upon
propensity to hold financial slack is equivocal (Beranek et al., 1995; Allen, 2000;
Minton and Wruck, 2001). Beranek et al. (1995) were unable to find statistically
significant firm size effects in their research on admittedly large firms. In his study,
Allen (2000, p. 305) hypothesises ‘that small firms are more subject to financial
constraints than large firms and are more likely to have a formal policy of arranging
spare borrowing capacity’. Ultimately, he was unable to support this hypothesis when
examining sample data for Australian, British and Japanese businesses. Again note that
these were not SMEs by conventional criteria. Minton and Wruck (2001) provide weak
evidence that, ceteris paribus, smaller firms are more likely to be financially
conservative.
Financial Slack and SMEs
In his speculations on liquidity and SME financial management, Ang (1992) points out that
working capital management typically occupies a major proportion of an SME owner-
manager's time, and that part of this is devoted to the management of financial slack or excess
liquid funds. Ang (1992) identifies the following factors which are likely to lead to greater
financial slack in an SME:
• Where there is significant information asymmetry in an SME, a temporary cash shortfall
may cause creditors to initiate winding up proceedings more precipitously than might be
the case for a large enterprise. Liquid funds in excess of normal requirements might
therefore be held to reduce the risk of such an outcome.

12
• More so than a larger concern, an SME is prone to unanticipated termination for reasons
other than failure to meet debt obligations. One response to this uncertainty is to
maintain cash reserves that may be used to avoid having to liquidate assets at short
notice on the dissolution of a partnership or when buying out another owner. Coping
with such events is made more difficult for an SME by the greater variability of its
earnings and the absence of a market valuation.
• Substantial cash resources provide an SME with much needed bargaining power in
dealings with outside parties. For example, the business may be more able to outwait a
supplier or a labour union in a stand-off situation. It might also be possible to avoid
excessive monitoring or bonding costs by simply paying off an obligation to a supplier
or a bank.
Ang (1992) then goes on to indicate influences which favour less financial slack in an
SME than in a more managerially constrained larger concern:
• An owner-manager might find more flexibility by minimising an SME’s excess
liquidity through transfers to his or her personal account. The funds could still be
available to the business if needed, but the owner-manager will have created an option
on such action which may or may not be exercised.
• A minimal cash surplus held in an SME would serve to limit agency costs between
owner-managers due to excessive consumption of perquisites. At the same time, the
relatively illiquid position of the business would cause an apparent transfer of agency
costs to creditors who would not be able to dispose of enterprise assets easily in
settlement of outstanding debts.
Despite a thorough international search, no published empirical evidence on the nature,
extent and consequences of financial slack amongst SMEs has been discovered. The only

13
possible source of evidence found comprises research studies examining the financial profiles
of SMEs of different size, industries, growth rates, etc. Hutchinson (1989, p. 6) describes a
financial profile as ‘that set of accounting ratios, available from the firm’s profit and loss
account and balance sheet, which usefully and efficiently summarises the financial aspects of
the firm such as profitability, liquidity and gearing’. The pedigree for this line of inquiry over
the last three decades or so includes most notably the works of Gupta (1969), Walker and
Petty (1978), Boardman et al. (1981), Hutchinson (1987, 1989), Davidson and Dutia (1991),
Osteryoung et al. (1992) and McMahon (2001a).
The published empirical evidence available on SME financial profiles generally
indicates that smaller and/or higher growth SMEs exhibit poorer liquidity (Walker and Petty,
1978; Boardman et al., 1981; Hutchinson, 1987, 1989). Furthermore, smaller and/or higher
growth SMEs typically employ greater proportions of debt that tends to be of shorter term
(Boardman et al., 1981; Hutchinson, 1987, 1989). Hutchinson (1987, 1989) and Davidson and
Dutia (1991), amongst others, believe that the explanation for such differences in financial
profiles with enterprise size and/or growth mainly rests on the existence of a finance gap for
SMEs when it comes to medium- to long-term debt and/or equity capital for development
purposes. Amongst the implications of such findings for this study is that financial slack
could be relatively more valuable for SMEs than for their larger counterparts. Also, given
their circumstances, the accumulation of financial slack may well be less evident amongst
smaller business concerns.
Research Method
The panel data employed in this research are drawn from the Business Longitudinal Survey
(BLS) conducted by the Australian Bureau of Statistics (ABS) on behalf of the federal
government over the four financial years 1994-95 to 1997-98. Costing in excess of $4 million,

14
the BLS was designed to provide information on the growth and performance of Australian
employing businesses, and to identify selected economic and structural characteristics of these
businesses.
The ABS Business Register was used as the population frame for the survey, with
approximately 13,000 business units being selected for inclusion in the 1994-95 mailing of
questionnaires. For the 1995-96 survey, a sub-sample of the original selections for 1994-95
was chosen, and this was supplemented with a sample of new business units added to the
Business Register during 1995-96. The sample for the 1996-97 survey was again in two parts.
The first formed the longitudinal or continuing part of the sample, comprising all those
remaining live businesses from the 1995-96 survey. The second part comprised a sample of
new business units added to the Business Register during 1996-97. A similar procedure was
followed for the 1997-98 survey. Approximately 6,400 business units were surveyed in each
of 1995-96, 1996-97 and 1997-98. The BLS did not employ completely random samples. The
original population (for 1994-95) was stratified by industry and business size, with equal
probability sampling methods being employed within strata. Further stratification by
innovation status, exporting status and growth status took place for the 1995-96 survey.
Data collection in the BLS was achieved through self-administered, structured
questionnaires containing essentially closed questions. Copies of the questionnaires used in
each of the four annual collections can be obtained from the ABS. The questionnaires were
piloted prior to their first use, and were then progressively refined after each collection in the
light of experience. As well as on-going questions, each questionnaire also included once-off
questions dealing with certain matters of policy interest to the federal government at the time
of the collections. Various imputation techniques, including matching with other data files
available to the ABS, were employed to deal with any missing data. Because information
collected in the BLS was sought under the authority of the Census and Statistics Act 1905,

15
and thus provision of appropriate responses to the mailed questionnaires could be legally
enforced by the Australian Statistician, response rates were very high by conventional
research standards – typically exceeding 90 per cent.
The specific BLS data used in this study are included in a Confidentialised Unit Record
File (CURF) released by the ABS on CD-ROM in December, 1999. This CURF contains data
on 9,731 business units employing fewer than 200 persons – broadly representing SMEs in
the Australian context. Restricted industrial classification detail, no geographical indicators,
presentation of enterprise age in ranges, and omission of certain data items obtained in the
BLS all help to maintain the confidentiality of unit records. Furthermore, all financial
variables have been subject to perturbation – a process in which values are slightly varied to
provide further confidentiality protection.
This research is concerned only with the manufacturing sector of the BLS CURF. Over
99 per cent of all businesses in the Australian manufacturing sector are SMEs according to
generally accepted definitions (Australian Bureau of Statistics, 1996). The main reason for
considering only the manufacturing sector is that it is highly probable that cross-industry
differences in the nature of business activities could confound the findings of the study. Such
differences are, to a reasonable extent, controlled for by examining a single (albeit broadly
defined) industry. There are 3,411 manufacturing SMEs in the BLS CURF, representing
approximately 35 per cent of businesses in the file.
Additional focus is provided to the study by considering only manufacturing SMEs
legally organised as proprietary companies. The main reason for this further narrowing of the
unit of analysis is that the research includes comparisons of groupings of manufacturing
SMEs in terms of key financial measures. This becomes problematic if the study sample
contains both incorporated and unincorporated businesses because of the customary
procedural difference in accounting for owners’ wages which are not separately reported in

16
the BLS data. There are 2,413 manufacturing SMEs legally organised as proprietary
companies in the BLS CURF, representing approximately 71 per cent of manufacturing SMEs
in the file. A longitudinal panel of 871 such businesses that were operational in all four years
of the BLS became the sample employed in the study.
Finally, because complete data for the many variables employed in the research are only
available for these periods, the analysis presented in this paper is limited to the 1995-96,
1996-97 and 1997-98 financial years.
Variables used in the research are either categorical in nature or, if metric, have
irregular distributional properties (that is, they are non-normally distributed and/or have
noticeable extreme values or outliers). Transformation of metric variables to produce normal
distributions is not undertaken because of difficulties of interpretation often created by such
procedures. Somewhat arbitrary censoring of extreme values or outliers is similarly avoided.
Accordingly, non-parametric/distribution free techniques of statistical analysis are employed
exclusively. Amongst other attractions, these techniques emphasise the median as a measure
of centrality that is resistant to extreme values or outliers.
Research Findings
Identifying SMEs With Financial Slack
Earlier in the paper it was noted that the measurement and valuation of financial slack are
problematic. Consequently, as in prior research on financial slack amongst larger business
concerns, this study has necessarily taken a pragmatic and admittedly imprecise approach. For
the reasons already given, and because of data limitations, no attempt is made to actually
measure financial slack. Rather, the goal is simply to identify those SMEs in which financial
slack is most likely to exist. The characteristics of these businesses are then compared and
contrasted with those of the remainder of the sample in an attempt to discover more about the
17
phenomenon in an exploratory fashion. This broad approach has been suggested and/or
implemented by prior researchers in the field such as Bourgeios (1981), Ballester et al. (2001)
and Minton and Wruck (2001).
For the purposes of the research, financial slack is loosely conceived as a condition
combining high liquidity and low leverage (or gearing). Specifically, SMEs in the study
sample are considered most likely to exhibit financial slack if they are simultaneously in the
highest quartile for the quick ratio, measured as current assets minus stock divided by current
liabilities, and the lowest quartile for leverage, measured expressing total debt as a percentage
of total funding. The quick ratio is employed because the data do not include information on
the level of cash and near cash assets or the balance of accounts receivable. The use of
quartiles in the method was decided upon after some experimentation with various quantile
splits; the aim being to achieve sufficient cases with ‘extreme’ liquidity/leverage
combinations to underpin statistical comparisons with the rest of the panel. While far from
exact science, this procedure should provide at least a somewhat blurred picture of what
SMEs with financial slack are like from demographic, performance, investment behaviour and
financing behaviour viewpoints – a not unreasonable aspiration in an exploratory study of an
under-researched area of SME financial management.
The outcomes of following the above procedure for identifying SMEs with financial
slack are reflected in the data presented in Table 1.
TAKE IN TABLE 1 ABOUT HERE
Amongst the longitudinal panel of 871 manufacturing SMEs, around 15 per cent are
considered likely to have financial slack. As expected, the median quick ratio for this sub-
sample (2.8 times or more) is consistently higher than for the remainder of the sample (less
than 1.0 times) over the three years of the analysis (p=0.01). Similarly, median total debt to
total funding for the sub-sample (just over 20 per cent) is consistently lower than for the

18
remainder of the sample (approximately 70 per cent) over the three years of the analysis
(p=0.01). The expected liquidity outcome is reinforced by further data for working capital
ratio. The expected debt capacity outcome is reinforced by additional data for interest expense
to sales and times interest earned. Overall, then, the goal of identifying a sub-sample with
high liquidity and low leverage which is strongly differentiated in a statistical sense from the
rest of the panel has been achieved.
In all, there are 209 SMEs in the study sample that are believed to hold financial slack
in at least one of the three years focused upon in the research. Of these, just 69 (33.0 per cent)
appear to have financial slack in all three years. Fifty eight (27.8 per cent) seem to have
financial slack in two years, and 82 (39.2 per cent) look to have financial slack in only one
year. These findings support the proposition made earlier in the paper that the holding of
financial slack tends to be a transitory phenomenon. While beyond the scope of the present
exploratory investigation, plans for further inquiry into the nature and consequences of
transitions in financial slack are discussed in the closing section of the paper.
Demographic Profile for SMEs With Financial Slack
A broadly demographic profile for the derived sub-sample of manufacturing SMEs with
financial slack is presented in Table 2. A statistical comparison with the demographic profile
of the balance of the study sample is also made in this table.
TAKE IN TABLE 2 ABOUT HERE
Examining Table 2, the following observations can be made:
• It would seem that the SMEs with financial slack are slightly older than those in rest of
the panel (p=0.05). The implication could be that the former have had more time to
decide and establish their financial strategies, to accumulate liquid assets beyond normal
levels, and to reduce their dependence upon debt financing.

19
• In terms of employment and sales turnover, there appear to be no statistically significant
differences in enterprise size between those SMEs with financial slack and the
remainder of the sample. However, there is a suggestion that the former are larger in
terms of total assets (p=0.05 or better in two of three years). As will be seen, this is
more likely to be a consequence of accumulating liquid assets than of building up the
level of fixed assets.
• There seem to be no statistically significant differences in employment, sales and asset
growth between SMEs with financial slack and the rest of sample; and, indeed, the
growth achievements of the entire panel over the three years of the analysis appear very
modest. This is an interesting finding because, as indicated earlier, the relevant literature
suggests that SMEs with growth opportunities are more likely to accumulate financial
slack in order to be able to realise these opportunities.
• In a previously published study (McMahon, 2001b) using the same longitudinal panel,
the SMEs are classified as to their dominant development pathway over the four years
of the BLS: lifestyle businesses, capped growth concerns, or high growth (or
entrepreneurial) ventures. From the data presented in Table 2, it appears that SMEs with
financial slack are more likely to be lifestyle concerns than the remainder of the panel
(p=0.05 in two of three years). No consistent statistically significant differences are
evident for capped growth or high growth businesses. Overall, it would seem that
around 80 per cent of the SMEs with financial slack are lifestyle ventures with few, if
any, growth aspirations. The observation at the end of the previous point is again
pertinent.
• The rest of the data items presented in Table 2 relate to the ownership/management
characteristics of the SMEs studied. No statistically significant differences between
those with financial slack and the rest of the sample are indicated.

20
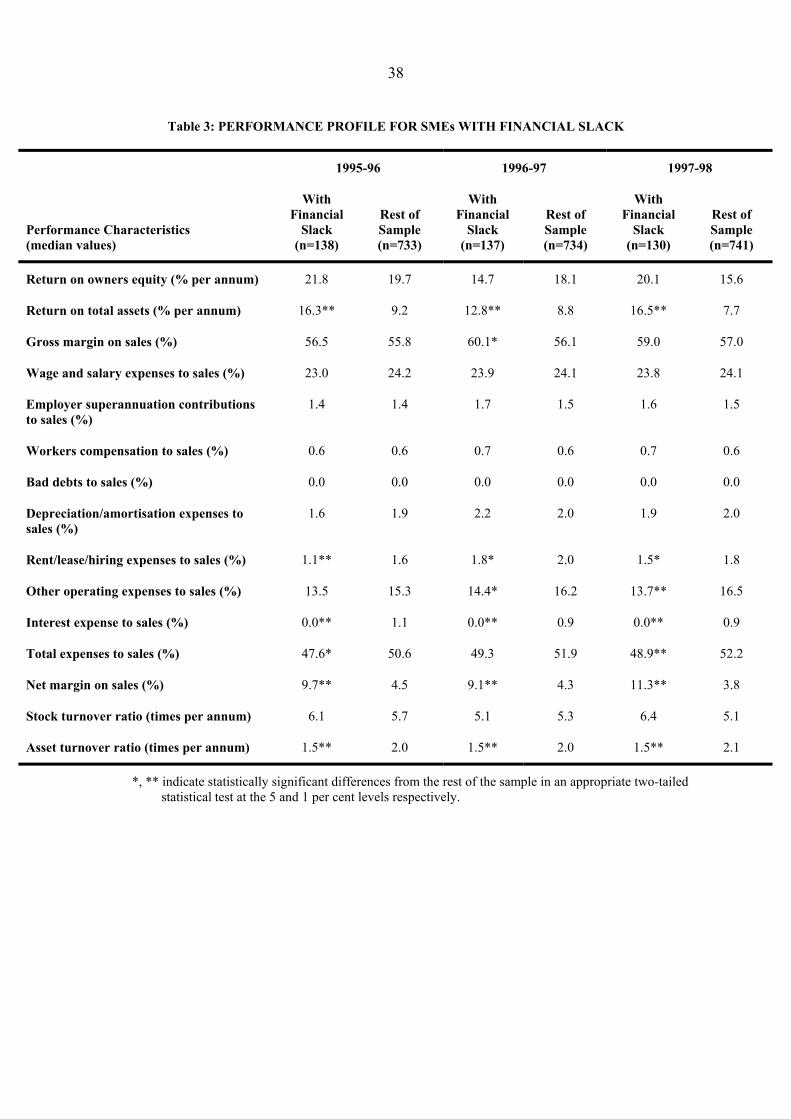
Performance Profile for SMEs With Financial Slack
A financial performance profile for the derived sub-sample of manufacturing SMEs with
financial slack is presented in Table 3. A statistical comparison with the performance profile
of the balance of the study sample is also made in this table.
TAKE IN TABLE 3 ABOUT HERE
Examining Table 3, the following observations can be made:
• As measured by return on total assets, it seems that SMEs with financial slack have
higher operating profitability than the rest of the panel (p=0.01). This does not translate
into a statistically significant difference in overall profitability, as measured by return
on owners equity, principally because of much lower use of leverage by businesses with
financial slack (p=0.01; see Table 1).
• Seeking to explain the finding on operating profitability, it appears that SMEs with
financial slack have higher net margins than the remainder of the sample (p=0.01). This
does not seem to stem from higher gross margins, but from lower total expenses to sales
(p=0.05 or better in two of three years). Reflecting the lower use of leverage amongst
SMEs with financial slack, interest expense to sales looks to be lower amongst these
businesses (p=0.01). Rental/lease/hiring expenses to sales appear lower, suggesting that
SMEs with financial slack are more likely to own the non-current assets they employ
(p=0.05 or better). Finally, other operating expenses to sales seem lower (p=0.05 or
better in two of three years). Overall, the impression is that SMEs with financial slack
exhibit tighter expense control than those in the rest of the panel.
• Counteracting, but not fully eliminating, the benefit of higher net margin, the asset
turnover ratio for SMEs with financial slack looks to be lower than for the remainder of
the sample (p=0.01). Recall that no statistically significant difference in sales turnover
is apparent (see Table 2), meaning that the lower asset turnover ratio must be the
21
consequence of higher asset holdings. As will be seen, this is more likely to be a
consequence of accumulating liquid assets than of building up the level of fixed assets.
Note, however, that no statistically significant difference in stock turnover ratio is
indicated; suggesting that the liquid assets being accumulated are those other than stock
(primarily cash and accounts receivable).
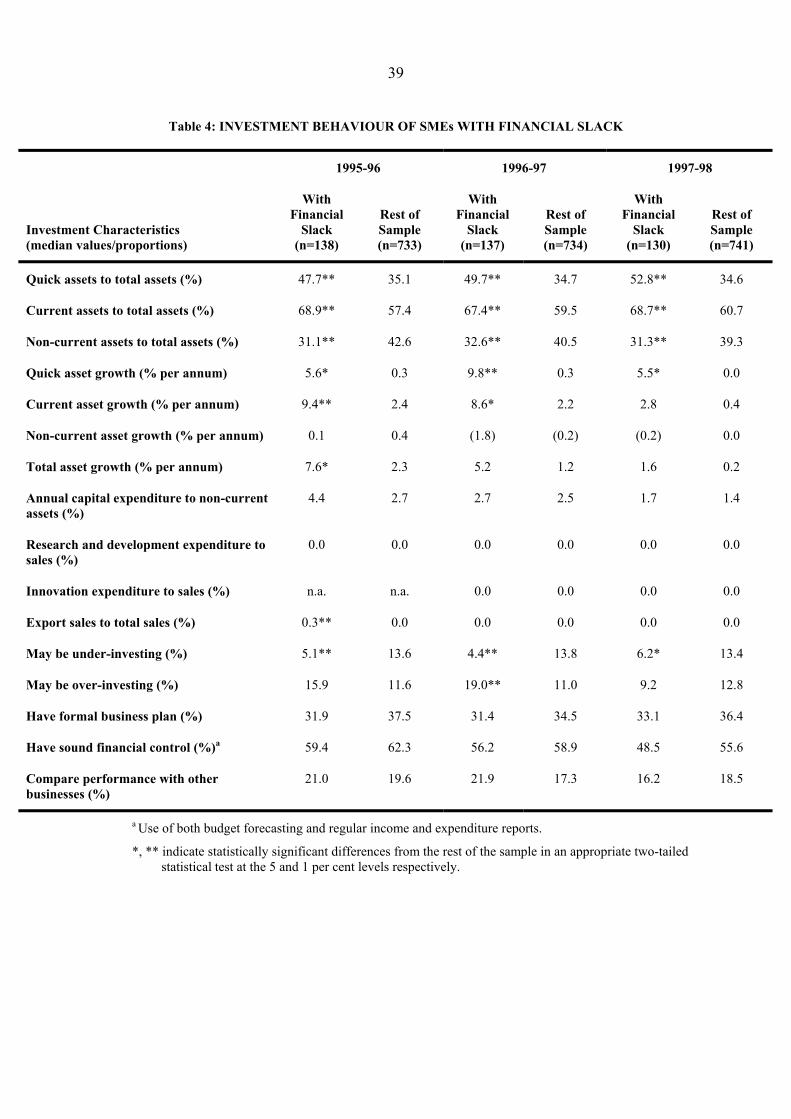
Investment Behaviour of SMEs With Financial Slack
An investment behaviour profile for the derived sub-sample of manufacturing SMEs with
financial slack is presented in Table 4. A statistical comparison with the performance profile
of the balance of the study sample is also made in this table.
TAKE IN TABLE 4 ABOUT HERE
Examining Table 4, the following observations can be made:
• Median quick assets to total assets for SMEs with financial slack (around 50 per cent) is
consistently higher than for the remainder of the panel (approximately 35 per cent) over
the three years of the analysis (p=0.01). This outcome is reinforced by further data for
current assets to total assets (p=0.01). Mirroring the foregoing, median non-current
assets to total assets for SMEs with financial slack (just over 30 per cent) is always
below that for the rest of the sample (around 40 per cent) in the three years studied
(p=0.01). These findings are as expected given the method used to identify SMEs with
financial slack.
• As indicated earlier, there appears to be no statistically significant difference in overall
asset growth between SMEs with financial slack and the remainder of the panel.
However, the median quick asset growth rate (between 5 and 10 per cent per annum) is
consistently higher for SMEs with financial slack than for the rest of the sample
(negligible) over the three years studied (p=0.05 or better). This outcome is reinforced
by further data for current asset growth (p=0.05 or better in two of three years).

22
Together, these two findings relating to short-term asset growth underpin confidence in
the method employed in this research to identify SMEs with financial slack. They
clearly are accumulating liquid assets that add to their financial slack position.
• The relevant literature suggests that SMEs that undertake higher research and
development expenditure and/or more of other forms of innovation expenditure are
those most likely to create growth opportunities to which their investment and financing
strategies would be aligned. The data in Table 4 indicate no statistically significant
differences in research and development expenditure to sales and innovation
expenditure to sales between SMEs with financial slack and those in the remainder of
the panel. Furthermore, the median values for these measures in all three years, and for
all businesses in the longitudinal panel, are zero.
• In a previously published study (McMahon, 2003) using the same longitudinal panel, a
sub-sample of SMEs that may be under-investing in the sense outlined earlier in this
paper is identified. Another sub-sample of SMEs that may be over-investing is also
identified. From the data presented in Table 4, it appears that, in all three years studied,
SMEs with financial slack are less likely to be under-investing than the rest of the
sample (p=0.05 or better). An obvious explanation is that the former have sufficient
liquidity and/or borrowing power that profitable longer-term investment opportunities
can be undertaken when they arise. No consistent statistically significant differences are
evident for over-investing.
• The rest of the data items presented in Table 4 seek to reveal whether financial planning
and control in SMEs with financial slack are more deliberative and formalised than in
the remainder of the panel. No statistically significant differences are indicated.

23
Financing Behaviour of SMEs With Financial Slack
A financing behaviour profile for the derived sub-sample of manufacturing SMEs with
financial slack is presented in Table 5. A statistical comparison with the performance profile
of the balance of the study sample is also made in this table.
TAKE IN TABLE 5 ABOUT HERE
Examining Table 5, the following observations can be made:
• As expected given the method employed in this study, the median level of total debt to
total funding for SMEs with financial slack (just over 20 per cent) is consistently lower
than for the rest of the sample (around 70 per cent) over the three years of the study
(p=0.01). The median level of current debt to total funding for SMEs with financial
slack (just over 15 per cent) is similarly lower than for the remainder of the panel
(between 40 and 50 per cent) over the period of analysis (p=0.01). Finally, the median
level of non-current debt to total funding for SMEs with financial slack (less than 2 per
cent) is lower than for the rest of the sample (between 10 and 20 per cent) over the study
period (p=0.01). The most interesting finding here is that what debt SMEs with financial
slack appear to use is principally short-term in nature. Non-current debt to total funding
of less than 2 per cent is low by any standards for businesses of all kinds.
• Reflecting the generally lower reliance on debt financing amongst SMEs with financial
slack, their debt-related measures such as interest expense to sales and times interest
earned are markedly different from those of the remainder of the panel. The median
level of interest expense to sales for SMEs with financial slack (zero per cent) is
consistently lower than for the rest of the sample (around 1 per cent) over the three
years of the study (p=0.01). And the median level of times interest earned for SMEs
with financial slack (at least 40 times and much higher in some years) is always much

24
higher that for the rest of the sample (around 3 times) over the period of analysis
(p=0.01).
• When the sources of debt employed by SMEs with financial slack are examined, it can
be seen that they are dominated by trade credit and internal provisions (for example,
provisions for employee entitlements). The median level of trade and other creditors to
total debt for SMEs with financial slack (between 40 and 45 per cent) is consistently
higher than for the remainder of the panel (just over 30 per cent) over the three years of
the study (p=0.05 or better). And the median level of provisions to total debt for SMEs
with financial slack (between 8 and 10 per cent) is always higher than for the rest of the
sample (around 1 per cent) over the period of analysis (p=0.01). Most interestingly,
SMEs with financial slack appear to make little or no use of bank debt. The median
level of bank debt to total debt for SMEs with financial slack (zero per cent) is
consistently lower than for the remainder of the panel (as high as 25 per cent) over the
three years of the study (p=0.01). The findings regarding debt-related measures such as
interest expense to sales and times interest earned in the previous point are thus
explained not only in terms of lower debt usage amongst SMEs with financial slack, but
also because the forms of debt that are mainly used by such concerns carry no explicit
interest charges in the normal course of business.
• The rest of the data items presented in Table 5 seek to reveal whether differences seem
to exist between SMEs with financial slack and the rest of the sample with respect to
equity financing. The only difference worthy of note is that, when they seek new equity
finance, SMEs with financial slack appear to raise a greater quantity than is the case for
businesses in the remainder of the panel.
25
Conclusions
The key findings from this exploratory research into financial slack amongst manufacturing
SMEs in the BLS CURF can be summarised as follows (all comparisons made relative to the
remainder of the longitudinal panel):
• Just 15 per cent or so of SMEs appear to hold financial slack as defined for the purposes
of this study (high liquidity plus low gearing or leverage). There is clear evidence that
the SMEs identified with financial slack do have higher than typical holdings of liquid
assets, that they are systematically adding to their holdings of liquid assets, and that
they are following unusually conservative financing policies. The holding of financial
slack seems to be a transitory phenomenon in that only about one-third of these
concerns satisfy the definition in all three years of the study.
• The SMEs with financial slack tend to have been longer established; but, with the
possible exception of asset holdings, appear to be no larger than other businesses in the
study.
• Around 80 per cent of SMEs with financial slack can be viewed as lifestyle concerns
with no substantial evidence of achieved growth in employment, sales or assets over the
study period.
• The SMEs with financial slack do not seem to have particular ownership/management
structures that would distinguish them from other businesses in the study.
• The SMEs with financial slack appear to have superior financial performance on
operations, stemming principally from lower overheads. Amongst other things, this
suggests that they are more able to be self-funding through reinvested profits.
• No evidence has been found which suggests SMEs with financial slack are more likely
to undertake higher outlays on research and development or other forms of innovation
activity leading to enhanced future growth opportunities.

26
• There is evidence that SMEs with financial slack are less likely to be under-investing in
the sense of failing to undertake profitable investment opportunities. On the other hand,
there is no evidence that these concerns are more likely to be over-investing in the sense
of committing excess liquid assets to unprofitable investment opportunities.
• There is no evidence that the standard of financial planning and control in SMEs with
financial slack is any better or any worse than in other businesses in the study sample.
• It would appear that, when SMEs with financial slack do employ debt financing, this is
overwhelmingly short-term in nature, with trade credit and internal provisions
dominating. These concerns seem to use little or no bank finance. The strong overall
impression is that SMEs with financial slack have deliberately minimised their
dependence upon external financing.
• There seem to be no substantial differences in the use of equity financing between
SMEs with financial slack and other businesses in the study sample.
The findings presented above are difficult to understand and explain within a principally
financial paradigm as represented in the earlier sections of this paper. It is arguable, however,
that a strategic management (or business strategy) perspective, as adopted over time by such
scholars as Barnard (1938), March and Simon (1958), Donaldson (1969), Bourgeois (1981),
Baur et al. (1995) and O’Brien (2003), holds more promise as a framework for understanding
the outcomes of the research. According to Bourgeois (1981), the concept of slack was first
introduced to the business literature in 1938 in Chester Barnard’s seminal work The Functions
of the Executive. March and Simon (1958) are attributed with suggesting the label of ‘slack’
for the concept. After reviewing early definitions of slack proposed by a number of leading
strategic management theorists and researchers, Bourgeois (1981, p. 30) proposes the
following integrative definition:

27
Organizational slack is that cushion of actual or potential resources which allows an
organization to adapt successfully to internal pressures for adjustment or to external
pressures for change in policy, as well as to initiate changes in strategy with respect to
the external environment.
Bourgeois (1981) goes on to identify four principal functions for organisational slack as
follows:
• As an inducement for organisational actors to remain within the system.
• As a resource for conflict resolution within the organisation.
• As a buffering mechanism in the organisational work-flow process.
• As a facilitator of certain types of strategic or creative behaviour within the
organisation.
While certainly not without financial dimensions, these functions seem mainly concerned
with achievement of the overall strategic goals of the ownership and/or management of
businesses.
The importance of becoming independent (‘being one’s own boss’), and/or of achieving
a desired lifestyle, as motivations for embarking upon the demanding and often perilous track
of establishing an SME has long been recognised in the relevant research and policy
literatures. Having taken this track, it is understandable that the maintenance of independence
and/or the realisation of lifestyle aspirations become key strategic goals of the owner-
manager(s) concerned. While often not explicitly stated, such deeply felt personal preferences
cannot but influence or shape owner-manager decisions across the range of functional areas
with which they must deal, including financial management. Recalling that the SMEs
identified in this research as holding financial slack have minimised their dependence upon
external financing and are predominantly lifestyle concerns with few if any growth
aspirations, it is plausible that these characteristics are, in fact, reflections of the impact of
owner-manager personal goals upon the financial policies followed.

28
The argument presented in the previous paragraph can be extended to embrace other
widely recognised behavioural traits of SME owner-managers. For instance, observation and
research suggest that such business people place a high premium upon privacy (or even
secrecy) regarding their financial affairs. As indicated earlier, the SMEs identified in this
research as holding financial slack appear to make little or no use of longer-term debt.
Amongst other outcomes, this policy significantly adds to and maintains the information
asymmetry between those within a business and external parties. Short-term debt providers,
such as trade creditors, upon whom these concerns seem to mainly rely, are typically less
demanding of financial information on the past performance and future prospects of
businesses to whom they lend or extend credit.
While SME owner-managers clearly are willing to face the risks of establishing and
running their own businesses, they are nevertheless predominantly risk averse in the usual
financial sense of trading off return and risk. The SMEs identified in this study as holding
financial slack appear to have accepted lower overall financial returns (as reflected in return
on owners equity) in order to lower certain risks. For example, by having above normal
holdings of liquid assets, the spectre of a profitable business failing by running out of cash,
graphically raised in the Welsh and White (1981) quotation in the first paragraph of this
paper, is far less evident. By relying on little or no longer-term debt, and by employing short-
term sources without explicit interest charges, the prospect of insolvency, bankruptcy and
liquidation is greatly diminished. Overall then, the SMEs identified as holding financial slack
have minimised their financial risks, and are then able to focus their efforts in confronting, as
best they can, the business risks inherent in their field of endeavour. Such a strategy is likely
to appeal to SME owner-managers with limited financial knowledge, but who are
operationally competent – a far from uncommon stereotype.

29
An unexpected outcome of this exploratory study is that it has caused the author to
partially reconsider his previous research on types of SMEs that exist and may be encountered
by researchers and policy-makers in their efforts to support this sector of the economy. As
indicated earlier, in a previously published study (McMahon, 2001b) using the same
longitudinal panel, the SMEs are classified as to their dominant development pathway over
the four years of the BLS: lifestyle businesses (about 70 per cent of the panel), capped growth
concerns (around 25 per cent of the panel), or high growth (or entrepreneurial) ventures (no
more than 5 per cent of the panel). The reconsideration now arising relates to lifestyle
concerns. Like many other researchers before him, the present author has tended to view
lifestyle SMEs as marginal, struggling businesses that barely compensate their owner-
managers for their time and effort, and for the risks that they face. The trade-off is, of course,
that a desired lifestyle is achieved. The present research suggests the possibility of there being
two broad types of lifestyle SMEs. The first is the kind just described in a somewhat
pejorative manner, and to which the label ‘life on the edge’ might be attached. The second is
the kind identified in this research as holding financial slack, to which the label ‘the good life’
might be attached. This descriptor is used in three main senses. First, the financial
management policies followed have clearly been moulded to ensure that owner-manager
motivations for starting and operating an SME are realised. Second, the financial management
policies followed, while not particularly sophisticated, result in a financially sound and secure
concern that is less likely to fail, as is the fate of many smaller businesses, especially in
periods of adverse economic conditions. Third, those engaged in advising and supporting
SMEs can, with some justification, point to the financial management policies followed as
representing financial best practice for business concerns that are not intended to develop and
grow beyond a lifestyle configuration.

30
A second unexpected outcome of this research is that it has caused the author to
belatedly concur with a growing number of researchers who caution against attempting to
understand and explain essentially financial phenomena only within a severely limiting
financial paradigm. A landmark study in the SME research literature that steps outside the
financial paradigm in order to address a financial issue is that of Barton and Matthews (1989).
These researchers argue that, especially for smaller businesses, the seemingly intractable
capital structure debate in the financial literature is more amenable to explanation if it is
viewed from a strategic management perspective. Norton (1991, pp. 301-2) strongly supports
this position as follows:
‘Financial management’ is a name for an area of study in business. Explicit in that name
is the overlapping of two usually distinct and separate areas of study; finance and
management. Thus far, finance researchers have ignored the management side of capital
structure decisions. Perhaps this results from a strong overriding belief in impersonal,
efficient markets; the role of management in capital structure decisions is placed in a
black box and conveniently ignored. However, the results of this survey provide
evidence that much occurs in the black box that affects the firm’s capital structure
decisions.
and:
. . . significant progress in capital structure research can occur only if financial
researchers incorporate management theory in their studies. This is especially true in the
case of small-business research, in which the entrepreneur plays a major role in the
firm. (emphasis added)
The present study suggests that such sentiments could usefully apply to financial phenomena
other than capital structure decisions in SMEs, like the issue of financial slack. The rapidly
burgeoning scholarly field of ‘behavioural finance’ is the cumulation of this type of thinking
for businesses of all kinds (Beal et al., 2005).
It has been emphasised throughout this paper that the study described is necessarily an
exploratory inquiry. This, of course, imposes limitations on the usefulness of the research

31
findings which are well known and understood. The exploratory nature of the investigation
also means that there is much that remains to be done before a fuller understanding of the
nature and significance of financial slack in SMEs can be obtained. Unfortunately, the BLS
data are not sufficiently rich to permit a detailed exploration of the conjectured links between
owner-manager motivations and aspirations that shape overall strategic goals and the holding
of financial slack. Qualitative research employing in-depth case studies is most likely needed
for this purpose. However, the BLS data can and will be used to discover more about the
apparent transitory nature of holding financial slack. As indicated earlier in the paper, only
around one-third of SMEs in the longitudinal panel have been identified as holding financial
slack in all three years of the study. In an extension to this work, the circumstances
surrounding the businesses in the sample that appear to have changed their financial slack
status will be closely examined in an attempt to uncover more about the reasons for changing
financial management policy in this manner.
References
Allen, D.E., 2000, ‘Spare debt capacity: company practices in Australia, Britain and Japan’,
Australian Journal of Management, vol. 25, no. 3, pp. 299-326.
Ang, J.S., 1992, ‘On the theory of finance for privately held firms’, The Journal of Small
Business Finance, vol. 1, no. 3, pp. 1-13.
Australian Bureau of Statistics, 1996, Small Business in Australia 1995, Australian
Government Publishing Service, Canberra, Australian Capital Territory.
Ballester, M., Fried, D. and Livnat, J., 2001, ‘Pension plan contributions, free cash flows and
financial slack’, Working Paper, New York University, New York
(http://www.stern.nyu.edu/~jlivnat/research.htn; accessed 13 November, 2001).

32
Barnard, C.I., 1938, The Functions of the Executive, Harvard University Press, Cambridge,
Massachusetts.
Barton, S.L. and Matthews, C.H., 1989, ‘Small firm financing: implications from a strategic
management perspective’, Journal of Small Business Management, vol. 27, no. 1, pp. 1-7.
Baur, M.N., Benkato, O.M. and Smith, K.A., 1995, ‘Financial slack: a strategic control
decision’, Journal of Business Strategies, vol. 12, no. 2, pp. 169-180.
Beal, D., Goyen, M., Shamsuddin, A. and Gibson, B., 2005, Introducing Corporate Finance,
John Wiley & Sons Australia, Milton, Queensland.
Beranek, W., Cornwell, C. and Choi, S., 1995, ‘External financing, liquidity, and capital
expenditures’, Journal of Financial Research, vol. 18, no. 2, pp. 207-222.
Boardman, C.M., Bartley, J.W. and Ratliff, R.L., 1981, ‘Small business growth
characteristics’, American Journal of Small Business, vol. 5, no. 3, pp. 33-45.
Bourgeois, L.J., 1981, ‘On the measurement of organizational slack’, Academy of
Management Review, vol. 6, no. 1, pp. 29-39.
Brealey, R., Myers, S., Partington, G. and Robinson, D., 2000, Principles of Corporate
Finance, 1st Australian edn, McGraw-Hill, Sydney, New South Wales.
Brunner, R.F., 1988, ‘The use of excess cash and debt capacity as a motive for merger’,
Journal of Financial and Quantitative Analysis, vol. 23, no. 2, pp. 199-217.
Datta, S., Iskandar-Datta, M.E. and Zychowicz, E.J., 1996, ‘Managerial self-interest, pension
financial slack and corporate pension funding’, The Financial Review, vol, 31, no. 4, pp.
695-720.
Davidson, W.N. and Dutia, D., 1991, ‘Debt, liquidity, and profitability problems in small
firms’, Entrepreneurship Theory and Practice, vol. 16, no. 1, pp. 53-64.
DeMiguel, A. and Pindado, J., 2001, ‘Determinants of capital structure: new evidence from
Spanish panel data’, Journal of Corporate Finance, vol. 7, no. 1, pp. 77-99.
33
Donaldson, G., 1969, Strategy for Financial Mobility, Harvard Business School Press,
Boston, Massachusetts.
Fazzari, S.M., Hubbard, R.G. and Petersen, B.C., 1988, ‘Financing constraints and corporate
investment’, in W.C. Drainard and G.L. Perry eds Brooking Papers on Economic Activity,
The Brookings Institute, Washington (D.C.), pp. 141-195.
Gentry, J.A., 1988, ‘The state of the art of short-run financial management’, Financial
Management, vol. 17, no. 2, pp. 41-57.
Gupta, M.C., 1969, ‘The effect of size, growth, and industry on the financial structure of
manufacturing companies’, Journal of Finance, vol. 24, no. 3, pp. 517-529
Hutchinson, P.J., 1987, The Financial Profile of Growth Small Firms: An Analysis of the
Accounting Ratios of Australian Companies At and After Flotation, 1964/5 – 1983/4,
Doctor of Philosophy Thesis, University of Bath, Bath, England.
Hutchinson, P.J., 1989, The Financial Profile of Small Firms in Australia, Accounting
Research Study No. 10, Department of Accounting and Financial Management, University
of New England, Armidale, New South Wales.
Jensen, M.C., 1986, ‘Agency cost of free cash flow, corporate finance and takeovers’,
American Economic Review, vol. 76, no. 2, pp. 323-329.
Jensen, M.C. and Meckling, W.H., 1976, ‘Theory of the firm: managerial behavior, agency
costs and ownership structure’, Journal of Financial Economics, vol. 3, no. 4, pp. 305-360.
Jung, K., Kim, Y.C. and Stulz, R.M., 1996, ‘Timing, investment opportunities, managerial
discretion, and the security issue decision’, Journal of Financial Economics, vol. 42, no. 2,
pp. 159-185.
Lang, L.H.P., Stulz, R.M. and Walkling, R.A., 1991, ‘A test of the free cash flow hypothesis’,
Journal of Financial Economics, vol. 29, no. 2, pp. 315-335.

34
March, J.G. and Simon, H.A., 1958, Organizations, John Wiley and Sons, New York, New
York.
McMahon, R.G.P., 2001a, ‘Growth and financial profiles amongst manufacturing SMEs from
Australia’s business longitudinal survey’, Entrepreneurship Theory and Practice, vol. 26,
no. 2, pp. 1-11.
McMahon, R.G.P., 2001b, ‘Deriving an empirical development taxonomy for manufacturing
SMEs using data from Australia’s business longitudinal survey’, Small Business
Economics, vol. 17, no. 3, pp. 197-212.
McMahon, R.G.P., 2003, ‘An exploratory study of under- and over-investment amongst
manufacturing SMEs from Australia’s business longitudinal survey’, International Small
Business Journal, vol. 21, no. 1, pp. 29-53.
Minton, B.A. and Wruck, K.H.,2001, ‘Financial conservatism: evidence on capital structure
from low leverage firms’, Working Paper, Ohio State University, Columbus, Ohio
(http://www.cob.ohio-state.edu/fin/dice/papers/2001/2001-6.pdf; accessed 16 December,
2003).
Myers, S.C., 1977, ‘Determinants of corporate borrowing’, Journal of Financial Economics,
vol. 5, no. 2, pp. 147-175.
Myers, S.C., 1984, ‘The capital structure puzzle’, Journal of Finance, vol. 39, no. 3, pp. 575-
592.
Myers, S.C. and Majluf, N.S., 1984, ‘Corporate financing and investment decisions when
firms have information that investors do not’, Journal of Financial Economics, vol. 13, no.
2, pp. 187-221.
Norton, E., 1991, ‘Capital structure and small public firms’, Journal of Business Venturing,
vol. 6, no. 4, pp. 287-303.

35
O’Brien, J.P., 2003, ‘The capital structure implications of pursuing a strategy of innovation’,
Strategic Management Journal, vol. 24, no. 5, pp. 415-431.
Osteryoung, J.S., Constand, R.L. and Nast, D.A., 1992, ‘Financial ratios in large public and
small private firms’, Journal of Small Business Management, vol. 30, no. 3, pp. 35-46.
Smith, R.L. and Kim, J-H., 1994, ‘The combined effects of free cash flow and financial slack
on bidder and target stock returns’, Journal of Business, vol. 67, no. 2, pp. 281-310.
Stultz, R.M., 1990, ‘Managerial discretion and optimal financing policies’, Journal of
Financial Economics, vol. 26, no. 1, pp. 3-27.
Triantis, G.G., 2000, ‘Financial slack policy and the laws of secured transactions’, Journal of
Legal Studies, vol. 29, no. 1, pp. 35-69.
Walker, E.W. and Petty, J.W., 1978, ‘Financial differences between large and small firms’,
Financial Management, vol. 7, no. 4, pp. 61-68.
Welsh, J.A. and White, J.F., 1981, ‘A small business is not a little big business’, Harvard
Business Review, vol. 59, no. 4, pp. 18-32.

36
Table 1: IDENTIFYING SMEs WITH FINANCIAL SLACK
1995-96 1996-97 1997-98
Financial Slack Indicators (median values)
With Financial
Slack (n=138)
Rest of Sample (n=733)
With Financial
Slack (n=137)
Rest of Sample (n=734)
With Financial
Slack (n=130)
Rest of Sample (n=741)
Liquidity:
Quick ratio (times) 2.8** 0.7 2.9** 0.8 3.0** 0.8
Working capital ratio (times) 3.9** 1.2 3.9** 1.3 4.2** 1.3
Debt Capacity:
Total debt to total funding (%) 21.5** 71.9 22.2** 70.7 21.7** 69.0
Interest expense to sales (%) 0.0** 1.1 0.0** 0.9 0.0** 0.9
Times interest earned (times) 148.3** 2.9 43.0** 3.3 6001.0** 3.2
*, ** indicate statistically significant differences from the rest of the sample in an appropriate two-tailed statistical test at the 5 and 1 per cent levels respectively.

37
Table 2: DEMOGRAPHIC PROFILE FOR SMEs WITH FINANCIAL SLACK
1995-96 1996-97 1997-98
Demographic Characteristics (median values/proportions)
With Financial
Slack (n=138)
Rest of Sample (n=733)
With Financial
Slack (n=137)
Rest of Sample (n=734)
With Financial
Slack (n=130)
Rest of Sample (n=741)
Enterprise age (years) 14-16* 12-14 14-16* 12-14 16-18* 14-16
Total employment (persons) 25.5 23.0 25.0 23.0 22.0 23.0
Sales turnover ($ per annum) 2,950,500 2,507,000 2,800,000 2,718,500 2,364,500 2,814,000
Total assets ($) 2,184,000** 1,273,000 1,964,000* 1,341,500 1,738,500 1,353,000
Employment growth (% per annum) 0.0 0.0 0.0 0.0 0.0 0.0
Sales growth (% per annum) 0.9* 3.4 0.2 1.4 4.1 2.2
Total asset growth (% per annum) 7.6* 2.3 5.2 1.2 1.6 0.2
Lifestyle businesses (%) 78.3 71.1 80.3* 70.7 80.8* 70.7
Capped growth businesses (%) 21.0 23.7 17.5 24.4 16.2* 24.6
High growth businesses (%) 0.7* 5.2 2.2 4.9 3.1 4.7
Working owners (persons) 2.0 2.0 2.0 2.0 2.0 2.0
Other managerial employees (persons) 1.5 1.0 2.0 2.0 2.0 2.0
No working owners (%)a 15.2 13.8 21.2 15.4 22.3 16.9
Working owner controlled (%)b 41.3 38.1 42.3 43.2 44.6 44.0
Only female working owners (%) 2.9 1.5 0.0 1.9 1.5 1.5
Family business (%) 44.9 53.6 50.4 52.6 56.2 51.6
a Businesses are run by professional managers. b Working owners hold more than 50 per cent of equity.
*, ** indicate statistically significant differences from the rest of the sample in an appropriate two-tailed statistical test at the 5 and 1 per cent levels respectively.
38
Table 3: PERFORMANCE PROFILE FOR SMEs WITH FINANCIAL SLACK
1995-96 1996-97 1997-98
Performance Characteristics (median values)
With Financial
Slack (n=138)
Rest of Sample (n=733)
With Financial
Slack (n=137)
Rest of Sample (n=734)
With Financial
Slack (n=130)
Rest of Sample (n=741)
Return on owners equity (% per annum) 21.8 19.7 14.7 18.1 20.1 15.6
Return on total assets (% per annum) 16.3** 9.2 12.8** 8.8 16.5** 7.7
Gross margin on sales (%) 56.5 55.8 60.1* 56.1 59.0 57.0
Wage and salary expenses to sales (%) 23.0 24.2 23.9 24.1 23.8 24.1
Employer superannuation contributions to sales (%)
1.4 1.4 1.7 1.5 1.6 1.5
Workers compensation to sales (%) 0.6 0.6 0.7 0.6 0.7 0.6
Bad debts to sales (%) 0.0 0.0 0.0 0.0 0.0 0.0
Depreciation/amortisation expenses to sales (%)
1.6 1.9 2.2 2.0 1.9 2.0
Rent/lease/hiring expenses to sales (%) 1.1** 1.6 1.8* 2.0 1.5* 1.8
Other operating expenses to sales (%) 13.5 15.3 14.4* 16.2 13.7** 16.5
Interest expense to sales (%) 0.0** 1.1 0.0** 0.9 0.0** 0.9
Total expenses to sales (%) 47.6* 50.6 49.3 51.9 48.9** 52.2
Net margin on sales (%) 9.7** 4.5 9.1** 4.3 11.3** 3.8
Stock turnover ratio (times per annum) 6.1 5.7 5.1 5.3 6.4 5.1
Asset turnover ratio (times per annum) 1.5** 2.0 1.5** 2.0 1.5** 2.1
*, ** indicate statistically significant differences from the rest of the sample in an appropriate two-tailed statistical test at the 5 and 1 per cent levels respectively.
39
Table 4: INVESTMENT BEHAVIOUR OF SMEs WITH FINANCIAL SLACK
1995-96 1996-97 1997-98
Investment Characteristics (median values/proportions)
With Financial
Slack (n=138)
Rest of Sample (n=733)
With Financial
Slack (n=137)
Rest of Sample (n=734)
With Financial
Slack (n=130)
Rest of Sample (n=741)
Quick assets to total assets (%) 47.7** 35.1 49.7** 34.7 52.8** 34.6
Current assets to total assets (%) 68.9** 57.4 67.4** 59.5 68.7** 60.7
Non-current assets to total assets (%) 31.1** 42.6 32.6** 40.5 31.3** 39.3
Quick asset growth (% per annum) 5.6* 0.3 9.8** 0.3 5.5* 0.0
Current asset growth (% per annum) 9.4** 2.4 8.6* 2.2 2.8 0.4
Non-current asset growth (% per annum) 0.1 0.4 (1.8) (0.2) (0.2) 0.0
Total asset growth (% per annum) 7.6* 2.3 5.2 1.2 1.6 0.2
Annual capital expenditure to non-current assets (%)
4.4 2.7 2.7 2.5 1.7 1.4
Research and development expenditure to sales (%)
0.0 0.0 0.0 0.0 0.0 0.0
Innovation expenditure to sales (%) n.a. n.a. 0.0 0.0 0.0 0.0
Export sales to total sales (%) 0.3** 0.0 0.0 0.0 0.0 0.0
May be under-investing (%) 5.1** 13.6 4.4** 13.8 6.2* 13.4
May be over-investing (%) 15.9 11.6 19.0** 11.0 9.2 12.8
Have formal business plan (%) 31.9 37.5 31.4 34.5 33.1 36.4
Have sound financial control (%)a 59.4 62.3 56.2 58.9 48.5 55.6
Compare performance with other businesses (%)
21.0 19.6 21.9 17.3 16.2 18.5
a Use of both budget forecasting and regular income and expenditure reports.
*, ** indicate statistically significant differences from the rest of the sample in an appropriate two-tailed statistical test at the 5 and 1 per cent levels respectively.

40
Table 5: FINANCING BEHAVIOUR OF SMEs WITH FINANCIAL SLACK
1995-96 1996-97 1997-98
Financing Characteristics (median values/proportions/modes)
With Financial
Slack (n=138)
Rest of Sample (n=733)
With Financial
Slack (n=137)
Rest of Sample (n=734)
With Financial
Slack (n=130)
Rest of Sample (n=741)
Current debt to total funding (%) 16.3** 47.9 15.8** 43.9 15.5** 42.8
Non-current debt to total funding (%) 0.8** 12.5 1.5** 17.2 1.4** 15.2
Total debt to total funding (%) 21.5** 71.9 22.2** 70.7 21.7** 69.0
Interest expense to sales (%) 0.0** 1.1 0.0** 0.9 0.0** 0.9
Times interest earned (times) 148.3** 2.9 43.0** 3.3 6001.0** 3.2
Trade and other creditors to total debt (%)
41.5** 30.0 40.0** 31.0 45.5* 33.0
Banks and other financial creditors to total debt (%)
0.0** 25.0 0.0** 24.5 0.0** 17.0
Provisions to total debt (%) 10.0** 1.0 8.0** 0.0 9.5** 1.0
Parent company loans to total debt (%) 0.0 0.0 0.0 0.0 0.0* 0.0
Loans from individuals involved in business (or their families) to total debt (%)
0.0* 0.0 0.0** 0.0 0.0** 0.0
Loans from other individuals to total debt (%)
0.0* 0.0 0.0* 0.0 0.0 0.0
Loans from unrelated businesses to total debt (%)
0.0 0.0 0.0 0.0 0.0 0.0
Other debt financing to total debt (%) 0.0 0.0 0.0 0.0 0.0 0.0
Equity held by working owners (%) 100.0 100.0 95.0 100.0 100.0 100.0
Recently raised new equity (%) 5.1 10.0 5.8 5.4 5.4 3.9
Modal range for equity raised ($) > 1,000,000 100,000 - 500,000
> 1,000,000 100,000 - 500,000
> 1,000,000 100,000 - 500,000
Modal source(s) of equity related business
existing shareholders
family, parent
business, existing
shareholders
family family, existing
shareholders
family, parent
business, existing
shareholders
*, ** indicate statistically significant differences from the rest of the sample in an appropriate two-tailed statistical test at the 5 and 1 per cent levels respectively.