financial section - nipponham.co.jp environment continued to improve on the strength of ... ran...
TRANSCRIPT

Management’s Discussion and Analysis
The Japanese economic picture remained mixed in the year ended
March 31, 2016. On the upside, corporate earnings and the
employment environment continued to improve on the strength of
the government’s economic policies, fueling a mild recovery. On
the downside, however, there were concerns about a slowdown
in China and sluggishness in emerging nations and elsewhere in
the global economy. Personal consumption was again lackluster
as consumer sentiment deteriorated amid a share price plunge in
early 2016 and an uncertain outlook for the world economy,
which overshadowed positives from expanded inbound tourism
demand.
The operating climate in the food industry was again adverse.
This was because while raw material costs stabilized, the domestic
pork and chicken markets weakened, logistics costs rose amid
human resource and transportation vehicle shortages, and
competition intensified.
It was against this backdrop that the Group pushed ahead
with New Medium-Term Management Plan Part 5, launched in
April 2015. This initiative is in line with the aim of “Creating a
stable business model through reform.” Its two management
policies are to “Establish competitive advantages of domestic
businesses” and “Accelerate to a global company.”
Specific measures included reinforcing the domestic farm
business, relocating and constructing cheese plants, as well as
developing and promoting new offerings and cultivating new
personnel under a capital and business alliance formed with Lay
Hong Berhad, a leading Malaysian chicken farming and processing
company.
In July 2015, the Group held its third annual Nipponham
Group Fair at supermarkets and other retailers, ran television
commercials, and otherwise endeavored to boost brand
recognition and sales.
In addition to making progress with efforts to reinforce cost
competitiveness and profitability through productivity gains and
step up risk management, the Group formulated the Nipponham
Group Fundamental Policy on Corporate Governance in November
2015 and further strengthened its management structure.
As a result of these activities, consolidated net sales for the
year increased 2.3%, to ¥1,240,728 million, although operating
income declined 4.3%, to ¥46,340 million. Income before income
taxes and equity in earnings (losses) of associated companies fell
27.8%, to ¥32,139 million. Net income attributable to NH Foods
Ltd. dropped 29.9%, to ¥21,779 million. Foreign exchange losses
and impairment losses of goodwill were the principal factors in
these downturns.
Note: Operating income is calculated by deducting cost of goods sold and selling, general and administrative expenses from net sales, in accordance with Japanese accounting practices.
Net SalesIn hams and sausages, the Group promoted SCHAU ESSEN®
and other mainstay offerings through television commercials and
other vehicles and revamped key brand offerings to drive sales
recoveries for consumer lines. In contrast, intensified price com-
petition, particularly for major convenience store and restaurant
chains, delayed a recovery in sales of commercial products. The
Group increased unit sales of the flagship Utsukushi-no-Kuni
brand during the year-end gift-giving season, but overall unit sales
of gift items were down amid intense overall competition. As such,
sales decreased 5.8%, to ¥141,459 million.
In processed foods, the Group performed well with Ishigama
Kobo® and Kiwami-yaki Hamburg®, the latter being launched in
spring 2016. Sales of the mainstay Chuka Meisai® recovered.
Accordingly, sales rose 4.2%, to ¥221,308 million.
In fresh meats, domestic food company sales volumes rose,
reflecting gains in chicken that offset weaker prices of pork and
chicken. The overseas business climate was adverse, a key factor
being a U.S. pork market downturn that hampered the hog
farming business in that nation. As a result, sales increased 3.7%,
to ¥716,899 million.
In marine products, higher sales of mainstay shrimp and
squid offerings and in-house manufactured goods through major
retail channels offset declines in exports to China of such fish as
Alaska pollock and autumn salmon. Sales thus increased 0.3%,
to ¥94,704 million.
In dairy products, the Group strengthened sales promotions
Overview of Business Results
Financial Section
Forward-Looking Statements
This MD&A includes forecasts regarding targets, strategies, and earnings. These forecasts are based on information available at the current time and contain certain assumptions about the
future. They are subject to numerous external uncertainties in areas such as the economic environment, market trends, and foreign exchange. Actual performance may differ significantly from
the targets in this presentation, and investment decisions should not be based exclusively on them.
Explanation of Company Name
In this annual report, the “Group” refers to NH Foods Ltd. and its subsidiaries unless otherwise indicated.
Regarding a Change to Segments
On April 1, 2016, Nipponham Group established an Overseas Business Division as part of a shift to an organizational structure comprising four business divisions. However, this change has
not been reflected in the information reported in this section.
72 Nipponham Group Annual Report 2016
The operations of the Group consist of three business divisions. The Processed Foods Business Division primarily manufactures and sells hams and sausages, and processed foods. The Fresh Meats Business Division mainly produces and sells fresh meats. The business of the Affiliated Business Division centers on making and selling marine and dairy products.
● Processed Foods Business DivisionIn the hams and sausages business, the division ran television
commercials for SCHAU ESSEN® and other mainstay products
as part of extensive sales promotion activities and revamped key
brand offerings in a drive to turn around sales of consumer lines.
During the year-end gift-giving season, the division increased unit
sales of the flagship Utsukushi-no-Kuni brand, but overall unit
sales of gifts were down from a year earlier amid intense competi-
tion among ham offerings.
In the processed foods business, sales were solid for
Ishigama Kobo®, new Kiwami-yaki Hamburg® launched in spring
2016, and other lines, while sales of the mainstay Chuka Meisai®
recovered. In contrast, there were delays in sales recoveries of
hams and sausages and processed foods businesses as price
competition intensified among commercial products for leading
convenience store chains and restaurants. Overall sales of the
division were thus down from the previous fiscal year.
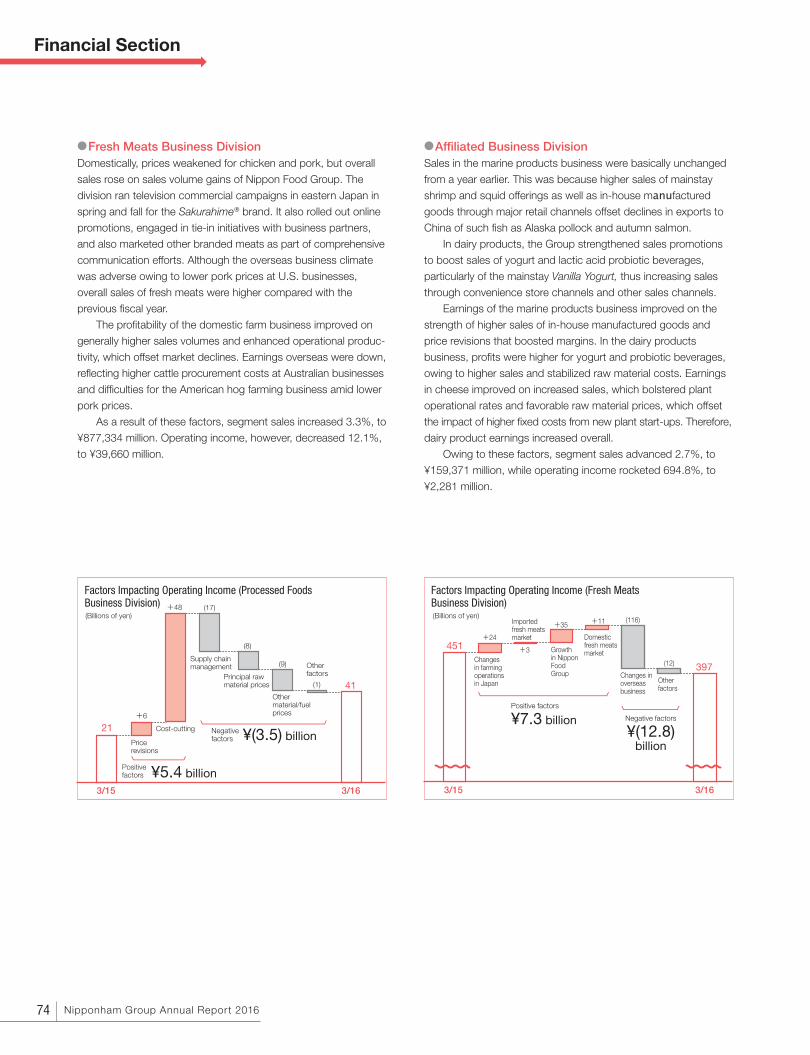
The division boosted earnings by continuing to revise the
product mix and cut costs by consolidating production lines while
streamlining logistics. It also benefited from favorable fuel price
trends.
As a result of such factors, segment sales declined 1.4%, to
¥356,581 million, but operating income surged 88.5%, to ¥4,054
million.
Business Results by Segment
to boost sales of yogurt and lactic acid probiotic beverages,
particularly of the mainstay Vanilla Yogurt, thus increasing sales
through convenience store channels and other sales channels.
Sales of cheese grew, reflecting gains in bakery and restaurant
channels and efforts to reinforce retail channel demand. Sales
therefore advanced 9.9%, to ¥31,396 million.
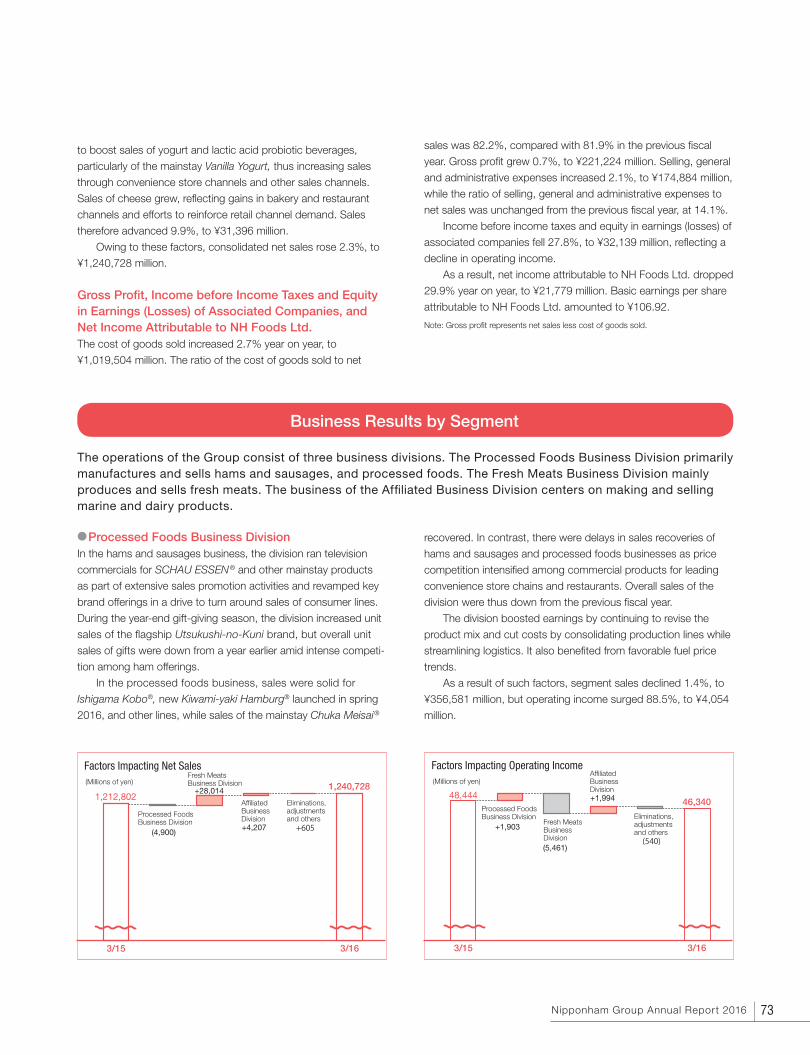
Owing to these factors, consolidated net sales rose 2.3%, to
¥1,240,728 million.
Gross Profit, Income before Income Taxes and Equity in Earnings (Losses) of Associated Companies, and Net Income Attributable to NH Foods Ltd.The cost of goods sold increased 2.7% year on year, to
¥1,019,504 million. The ratio of the cost of goods sold to net
sales was 82.2%, compared with 81.9% in the previous fiscal
year. Gross profit grew 0.7%, to ¥221,224 million. Selling, general
and administrative expenses increased 2.1%, to ¥174,884 million,
while the ratio of selling, general and administrative expenses to
net sales was unchanged from the previous fiscal year, at 14.1%.
Income before income taxes and equity in earnings (losses) of
associated companies fell 27.8%, to ¥32,139 million, reflecting a
decline in operating income.
As a result, net income attributable to NH Foods Ltd. dropped
29.9% year on year, to ¥21,779 million. Basic earnings per share
attributable to NH Foods Ltd. amounted to ¥106.92.
Note: Gross profit represents net sales less cost of goods sold.
1,212,8021,240,728
3/15 3/16
Factors Impacting Net Sales(Millions of yen)
Processed FoodsBusiness Division
(4,900)
Fresh MeatsBusiness Division
+28,014
AffiliatedBusinessDivision+4,207
Eliminations,adjustmentsand others+605
3/15 3/16
48,44446,340
Factors Impacting Operating Income(Millions of yen)
Processed FoodsBusiness Division
+1,903Fresh MeatsBusiness Division(5,461)
AffiliatedBusinessDivision+1,994
Eliminations,adjustmentsand others(540)
73Nipponham Group Annual Report 2016
Financial Section
● Fresh Meats Business DivisionDomestically, prices weakened for chicken and pork, but overall
sales rose on sales volume gains of Nippon Food Group. The
division ran television commercial campaigns in eastern Japan in
spring and fall for the Sakurahime® brand. It also rolled out online
promotions, engaged in tie-in initiatives with business partners,
and also marketed other branded meats as part of comprehensive
communication efforts. Although the overseas business climate
was adverse owing to lower pork prices at U.S. businesses,
overall sales of fresh meats were higher compared with the
previous fiscal year.
The profitability of the domestic farm business improved on
generally higher sales volumes and enhanced operational produc-
tivity, which offset market declines. Earnings overseas were down,
reflecting higher cattle procurement costs at Australian businesses
and difficulties for the American hog farming business amid lower
pork prices.
As a result of these factors, segment sales increased 3.3%, to
¥877,334 million. Operating income, however, decreased 12.1%,
to ¥39,660 million.
● Affiliated Business DivisionSales in the marine products business were basically unchanged
from a year earlier. This was because higher sales of mainstay
shrimp and squid offerings as well as in-house manufactured
goods through major retail channels offset declines in exports to
China of such fish as Alaska pollock and autumn salmon.
In dairy products, the Group strengthened sales promotions
to boost sales of yogurt and lactic acid probiotic beverages,
particularly of the mainstay Vanilla Yogurt, thus increasing sales
through convenience store channels and other sales channels.
Earnings of the marine products business improved on the
strength of higher sales of in-house manufactured goods and
price revisions that boosted margins. In the dairy products
business, profits were higher for yogurt and probiotic beverages,
owing to higher sales and stabilized raw material costs. Earnings
in cheese improved on increased sales, which bolstered plant
operational rates and favorable raw material prices, which offset
the impact of higher fixed costs from new plant start-ups. Therefore,
dairy product earnings increased overall.
Owing to these factors, segment sales advanced 2.7%, to
¥159,371 million, while operating income rocketed 694.8%, to
¥2,281 million.
21
41
Price revisions
¥5.4 billion
¥(3.5) billionCost-cutting
Principal raw material prices
Other material/fuel prices
Other factors
Supply chain management
+6
+48 (17)
(8)
(9)
(1)
3/15 3/16
(Billions of yen)
Factors Impacting Operating Income (Processed Foods Business Division)
Positive factors
Negative factors
397
Positive factors
¥7.3 billion Negative factors
¥(12.8)billion
Growthin NipponFoodGroup
Changesin farmingoperationsin Japan
Importedfresh meatsmarket
Changes in overseas business
Other factors
3/15 3/16
+24
+35
+3
(116)
Domestic fresh meats market
+11
(12)
451
(Billions of yen)
Factors Impacting Operating Income (Fresh Meats Business Division)
74 Nipponham Group Annual Report 2016

Outlook for the Year Ending March 31, 2017
The Group expects economic uncertainty to continue in the year
ahead, as turmoil in global financial markets and other factors
overshadow ongoing benefits from government stimulus mea-
sures. The Group will thus drive forward with New Medium-Term
Management Plan Part 5, launched in the previous fiscal year,
with the aim of “Creating a stable business model through reform.”
The two prime policies of this initiative are to “Establish competitive
advantages of domestic businesses” and “Accelerate to a global
company.”
In the Processed Foods Business Division, the Group expects
a slowdown in costs of raw materials and supplies. Notwithstanding
signs of a gradual recovery in consumption, the operating climate
will most likely remain adverse owing to polarizing patterns and
intensifying competition. Production and marketing operations will
thus collaborate in moving ahead with growth and efficiency
strategies.
Growth strategies will be to reinforce brand clout to ensure
the “Category Leader Strategy” and reinforce area sales and
marketing capabilities. Such efforts seek to boost market share
and profitability by strategically strengthening positions in con-
sumer, commercial, frozen foods, and other specific business
areas to reinforce Group collaboration.
The Group will maintain the level of quality that customers
have come to expect and will reflect their perspectives in product
development to propose new value and build new markets.
Strategies to enhance efficiency will center on installing highly
productive lines, making strategic, forward-looking capital expen-
ditures, and centralizing production to reinforce cost competitive-
ness.
In the Fresh Meats Business Division, the Group expects the
operating climate to remain challenging amid changes in the meat
and grain markets and the volatility in global supply and demand.
The division will therefore reinforce its unique “integration system,”
covering everything from its own farms to sales companies, to
bolster its position in branded meats and further expand its
domestic market share. In addition, the division will bolster its
production and procurement structure to accommodate develop-
ments stemming from the Trans-Pacific Partnership (TPP), Free
Trade Agreements (FTA), and other factors, as well as expand its
efficient sales and delivery systems nationwide.
The Affiliated Business Division will strengthen its manufacturing
and sales capabilities, primarily in the marine and dairy products
businesses, expanding the scale of domestic operations. The
division will invest extensively in manufacturing facilities to boost
production and raise efficiency. It will reinforce raw materials
procurement to enhance and stabilize profitability amid dramatic
swings in raw materials demand and supply. On the sales front,
the focus will be on leveraging in-house manufactured goods
while strengthening customer-driven marketing and development
to produce distinctive products with enhanced value. The division
will also draw on Group synergies to increase brand penetration.
The Group launched the Overseas Business Division in the
fiscal year ending March 31, 2017, to “Accelerate to a global
company,” a key policy of New Medium-Term Management Plan
Part 5. The Group seeks to accelerate a transition to a local
sales-driven business model through the consolidation of
overseas operations that the various business divisions previously
oversaw.
By also leveraging a joint venture announced in March 2016
with Lay Hong Berhad and other resources, the Group aims to
harness its comprehensive strengths in fresh meats, hams and
sausages, processed foods, marine, dairy, and other products to
supply an array of products and services in overseas markets and
expand international sales.
With the harsh operating climate posing numerous challenges,
the Group will make a concerted effort to deploy management
policies and strategies with the aim of “Creating a stable business
model through reform” under New Medium-Term Management
Plan Part 5.
For the year ending March 31, 2017, management targets
consolidated net sales of ¥1,270.0 billion, an increase of 2.4%
year on year. It also anticipates operating income to rise 5.7%, to
¥49.0 billion, income before income taxes and equity in earnings
(losses) of associated companies to increase 36.9%, to ¥44.0
billion, and net income attributable to NH Foods Ltd. to climb
42.3%, to ¥31.0 billion.
75Nipponham Group Annual Report 2016

Analysis of Financial Position
AssetsAt year-end, total assets stood at ¥682,855 million, a rise of 3.2%
from a year earlier. Total current assets rose 1.0%, to ¥360,015
million. A contributing factor was a 17.3% increase in cash and
cash equivalents, to ¥67,321 million, which was partly offset by a
4.0% decline in inventories, to ¥137,395 million. Property, plant
and equipment (less accumulated depreciation) rose 6.2%, to
¥268,172 million, reflecting gains in capital investment.
LiabilitiesAt year-end, total liabilities were ¥321,495 million, 5.4% higher
than a year earlier. Although other current liabilities declined
10.1%, to ¥23,089 million, long-term debt (less current maturities)
climbed 20.9%, to ¥101,771 million, and liability under retirement
and severance programs rose 19.5%, to ¥14,426 million.
Total NH Foods Ltd. Shareholders’ EquityTotal NH Foods Ltd. shareholders’ equity increased 0.8% from
the end of the previous year, to ¥356,353 million. Key factors
included ¥21,779 million in net income attributable to NH Foods
Ltd. shareholders, as well as a ¥9,641 million decrease in
accumulated other comprehensive income (loss), reflecting yen
appreciation and sluggish stock market conditions. Also, interest-
bearing debt rose ¥17,800 million, to ¥154,606 million.
As a result of these factors, the total NH Foods Ltd. share-
holders’ equity ratio declined 1.3 percentage points, to 52.2%.
Note: Interest-bearing debt consists of short-term bank loans, current maturities of long-term debt, and long-term debt, less current maturities (including zero coupon convertible bonds), in the consolidated balance sheets.
Cash Flows● Cash Flows from Operating Activities
Net cash provided by operating activities was ¥52,535 million,
compared with ¥29,681 million a year earlier. This was due largely to
the decreases in net income, depreciation and amortization, and
impairment losses and inventories, which offset decreases in foreign
translation currency adjustments and accrued income taxes.
● Cash Flows from Investing Activities
Net cash used in investing activities was ¥49,139 million, compared
with ¥31,517 million a year earlier, reflecting capital expenditures
and net decrease in cash and cash equivalents resulting from
purchase of business.
● Cash Flows from Financing Activities
Net cash provided by financing activities was ¥8,182 million, com-
pared with net cash used in financing activities of ¥17,187 million
a year earlier. Key factors included an increase in short-term bank
loans as well as proceeds from debt, which offset cash dividends
and repayments of debt.
As a result, cash and cash equivalents at year-end increased
¥9,917 million, to ¥67,321 million.
Capital ExpendituresThe Group has created an “integration system” that covers all
aspects of its operations—from farming to processing, production,
distribution, and sales—and invests in fixed assets as necessary
to enhance, rationalize, and strengthen this system. These
investments totaled approximately ¥36.8 billion (including software)
for the fiscal year. The principal investments are as described below.
● Processed Foods Business Division
The division, primarily Nipponham Factory Ltd., Premium Kitchen
Co., Ltd., and other subsidiaries, used approximately ¥10.0
billion, mainly to expand and upgrade production facilities for
hams and sausages, and processed foods.
● Fresh Meats Business Division
Capital expenditures by the division totaled approximately ¥15.3
billion. This spending included approximately ¥6.6 billion by
Nippon White Farm Co., Ltd., Interfarm Co., Ltd., and other
subsidiaries to upgrade and refurbish breeding facilities; approxi-
mately ¥3.5 billion by Higashi Nippon Food, Inc., Kanto Nippon
Food, Inc., and other subsidiaries to improve operational facilities;
and approximately ¥3.9 billion by Nippon Food Packer, Inc. and
other subsidiaries to upgrade processing and packing facilities.
● Affiliated Business Division
Capital expenditures totaling ¥7.1 billion were made in such areas
as updating production and operational facilities in the marine and
dairy products businesses of Hoko Co., Ltd. and Nippon Luna, Inc.,
among others.
Shareholder Returns PolicyThe Group prioritizes returns to shareholders as one of its most
important management issues and aims to pay dividends that are
commensurate with results as a basic policy. Management seeks
to use retained earnings to fund investments to enhance corporate
value over the long term and to further strengthen the Group’s
financial position.
In keeping with this basic policy, management targets a
consolidated payout ratio of 30%, although it plans a lower
dividend limit of ¥16.00 per share for the time being. Management
will flexibly acquire treasury stock, taking into account growth
investments and financial position, to enhance shareholder value
per share and return on equity.
As stated in Notice of Adjustment to the Forecasts of Business
Results and Dividends, announced on May 2, 2016, management
paid a year-end dividend of ¥33.00 per share of common stock
(for a consolidated payout ratio of 30.9%) for the year ended
March 31, 2016. Based on a projection of ¥31.0 billion in net
income attributable to NH Foods Ltd. for the year ending March
31, 2017, management targets a year-end dividend of ¥46.00 per
share of common stock on a consolidated payout ratio of 30%.
Financial Section
76 Nipponham Group Annual Report 2016

Business Risks
1. Market-Related Risks
The Group’s business centers on fresh meats and fresh meats-
related processed products. As such, in addition to selling fresh
meats, the Group uses fresh meats as raw materials for hams and
sausages, processed foods, and other products. As a conse-
quence, the Group’s operating results and financial condition are
vulnerable to fluctuations in market prices for livestock. Moreover,
the Group’s livestock breeding business, which supplies these
fresh meats, is by nature affected not only by fluctuations in
product prices but also by swings in feed and crude oil prices.
The Group also manufactures marine and dairy products, and is
thus vulnerable to market conditions and fluctuations in the prices
of raw materials used in these businesses.
To counter market-related risks, the Group works to diversify
its product procurement channels, develop high value-added
products, create brands, establish marketing strategies from a
customer perspective, and make use of commodity futures
contracts. The Group also strives to ensure the stable procure-
ment of raw materials in anticipation of product demand and to
maintain appropriate inventories of fresh meats. Such measures
do not, however, guarantee complete avoidance of these risks.
The livestock market and the Group’s operating results and
financial condition may also be significantly affected by outbreaks
of disease—such as BSE, avian influenza, foot-and-mouth
disease, and porcine epidemic diarrhea (PED) virus—as well as by
the imposition of safeguard tariffs, that is, emergency restrictions
on imports.
2. Safety-Related Risks
Based on its Open Quality concept, which emphasizes earning
the trust of customers and responding to their expectations
concerning the safety of its products, the Group has established
Quality Policies: strict compliance with laws and regulations;
creation of a quality and safety assurance network; objective
assessment of product safety; product traceability; and closer
links with customers.
In line with these policies, the Group has built a rigorous
quality assurance framework for which it has obtained recognized
third-party certification (i.e., ISO and HACCP) and a traceability
system for the raw materials used in its fresh meats and processed
food products, which include hams and sausages, thereby
ensuring the safety and security of raw materials and strengthening
its food defense strategy. It has further reinforced its measures for
quality improvement and has endeavored to secure safety and
security. If, despite the best efforts of the Group, problems are
found in any product or service provided by the Group, it will
ensure prompt disclosure and take all necessary measures to
prevent exacerbation of any such problems and ensure the safety
of the customer as our main priority.
However, in the event of a quality issue that falls outside the
scope of these initiatives or has a major impact on society
because, for example, it threatens food safety, the impact thereof
has the potential to affect the Group’s operating results and
financial condition.
3. Risks Related to the Procurement of Materials
The Group strives to increase production efficiency and reduce
inventory losses and distribution costs. However, should the
Group be unsuccessful in offsetting increases in costs related to
the procurement of materials and fuel or to distribution—attribut-
able to such factors as high crude oil prices—or in passing those
costs onto customers by raising product prices, the resulting
increases in costs have the potential to affect the Group’s operating
results and financial condition.
4. Foreign Exchange Risks
The translation into yen of costs, income, and trade receivables
and payables associated with transactions undertaken by the
Group denominated in other currencies may be affected by
fluctuations in currency rates.
To minimize exchange risks, the Group utilizes hedging instru-
ments, including foreign currency forward exchange contracts,
currency swap contracts, currency option contracts, and cross
currency swap contracts. Such measures do not, however, guarantee
protection against the impact of these risks. Moreover, the use of
hedging instruments to minimize foreign exchange risks may
expose the Group to the risk of opportunity loss in the event foreign
exchange market fluctuations exceed management’s estimates.
There is also a risk that translation losses—that is, losses
arising from the translation of the foreign currency-denominated
financial statements of overseas consolidated subsidiaries into
yen—may accumulate in the foreign currency translation adjust-
ments, triggering fluctuations in shareholders’ equity in the
consolidated financial statements. Such fluctuations have the
potential to affect the Group’s operating results and financial
condition.
To hedge risks associated with transactions in foreign currencies,
the Group continually monitors currency markets in accordance
with its exchange risk management policies and periodically
assesses its exposure to foreign exchange risks. All foreign
currency forward exchange contracts, currency swap contracts,
currency option contracts, and cross-currency swap contracts are
carried out based on these policies and on internal regulations
governing transactional authority and transaction amount limits.
Risks with the potential to affect the Group’s operating results and financial condition include, but are not limited to, the following major risks. These risks are related to future events, based on judgments made by the Group as of March 31, 2016.
77Nipponham Group Annual Report 2016

5. Interest Rate Risks
The Group raises the bulk of the funds it requires through loans
from third parties and other forms of interest-bearing debt. Most
of the Group’s interest-bearing debt—¥154.6 billion as of March
31, 2016—is fixed-rate. Accordingly, the Group believes that for
the foreseeable future the direct impact of interest rate increases
will be negligible. Nonetheless, in a high interest-rate environment,
any increase in the Group’s interest burden has the potential to
affect the Group’s operating results and financial condition.
6. Share Price Risks
Marketable securities held by the Group consist principally of the
shares of its business partners. As such, the Group is exposed to
share price risks associated with market price fluctuations. As of
March 31, 2016, these shares represented unrealized gains.
However, share price movements in the future may significantly
affect the Group’s operating results and financial condition.
Additionally, should the value of pension plan assets be
negatively affected by weakness in the stock market, pension
costs may increase and additional pension plan assets may
become necessary.
7. Risks of Impairment Losses on Long-Lived Assets
Should the value of long-lived assets owned by the Group
decrease, necessitating the application of impairment accounting,
resulting losses have the potential to affect the Group’s operating
results and financial condition.
8. Risks Associated with Natural Calamities, Unforeseen
Accidents, and Social Upheaval
The Group has operations in Japan and several other countries.
The geographical locations of these operations involve certain
risks. Any of the following occurrences has the potential to affect
the Group’s operating results and financial condition:
• Earthquake, flood, or other major natural calamity and the
potential impact thereof on the infrastructure, i.e., damage to
roads, harbors, and rail lines and the interruption of gas, water,
and electric power supplies
• Environmental contamination (pollution of the atmosphere,
water, or soil) resulting from an unforeseen accident or chance
occurrence
• Social unrest caused by the spread of an infectious disease,
such as influenza
• Unforeseen establishment of adverse laws or regulations, or the
repealing of laws or regulations
• Unforeseen adverse economic or social event
• Occurrence of social or economic disorder caused by such
events as war, conflict, or terrorist attack
9. Risks of Information Leakage
In line with internal regulations for safeguarding personal information
and governing insider trading, the Group rigorously protects and
manages both the personal information it possesses and critical
corporate information through such measures as compliance
training and hierarchical employee education. The Group has also
formulated measures to ensure the security of its information
system and to respond to the impact of major disasters. Nonethe-
less, information may be leaked, falsified, or lost, in the event of a
natural calamity that exceeds assumptions, an extended interruption
of power supplies, damage to hardware and/or software, a
computer virus, or unauthorized access to the Group’s computer
networks. A protracted breakdown of the Group’s information
systems may also occur. Any of these occurrences has the potential
to affect the Group’s operating results and financial condition.
10. Compliance Risks
The Group strives to maintain a corporate culture that emphasizes
transparency and sound business practices and works continu-
ously to reinforce and instill awareness of compliance matters.
The Group has established a risk management structure that
ensures its ability to respond swiftly to recognized risks.
The Compliance Committee, which is chaired by an executive
who is appointed by the president and representative director of
the parent company, is responsible for ensuring compliance
Groupwide, while the Compliance Department is charged with
deploying ongoing measures aimed at enhancing understanding
among employees and management, as well as with compliance
risk mitigation.
However, should an instance of noncompliance, such as the
failure of an employee or member of management to comply with
a relevant law or regulation, arise, it would have the potential to
affect the Group’s operating results and financial condition.
11. Risks Associated with Environmental Issues
In line with its Environmental Policies, the Group is committed to
conducting its business in a manner that incorporates consider-
ation for the environment, thereby contributing to the realization of
a sustainable society.
The Group has obtained certification under ISO 14001 and is
working to earn certification from other key external organizations.
The Group’s management practices, which include environmental
audits implemented by the CSR Department, also reflect its
commitment to being an environment-friendly organization.
The Group also endeavors to ensure the appropriateness and
transparency of its environmental and other CSR initiatives.
Nonetheless, in the event of an accident, negligence, or other
problem resulting in environmental contamination, the Group may
be obliged to pay for remediation and/or damages. In the event
that existing laws and regulations are revised, the Group may be
obliged to significantly increase environment-related investment.
Either of these occurrences has the potential to affect the Group’s
operating results and financial condition.
Financial Section
78 Nipponham Group Annual Report 2016

Millions of Yen
2016 2015 2014 2013 2012
Net Sales ¥1,240,728 ¥1,212,802 ¥1,122,097 ¥1,022,839 ¥1,017,784
Income before Income Taxes and Equity in Earnings (Losses) of Associated Companies 32,139 44,544 35,303 28,031 26,766
Net Income Attributable to NH Foods Ltd. 21,779 31,048 24,524 16,459 11,655
Total Assets 682,855 661,567 627,220 610,293 589,125
Total NH Foods Ltd. Shareholders’ Equity 356,353 353,664 320,984 293,414 290,020
Interest-Bearing Debt 154,606 136,806 144,963 149,821 139,187
Net Cash Provided by Operating Activities 52,535 29,681 32,952 37,407 26,432
Net Cash Used in Investing Activities (49,139) (31,517) (27,021) (22,384) (19,098)
Free Cash Flow 3,396 (1,836) 5,931 15,023 7,334
Net Cash Provided by (Used in) Financing Activities 8,182 (17,187) (9,373) (10,964) (23,745)
Capital Expenditures 36,799 35,694 29,152 33,285 19,487
Depreciation and Amortization 19,445 18,951 18,649 19,323 23,756
Per Share Amounts: Yen
Basic Earnings per Share Attributable to NH Foods Ltd. Shareholders ¥ 106.92 ¥ 152.43 ¥ 122.11 ¥ 79.42 ¥ 54.79
Diluted Earnings per Share Attributable to NH Foods Ltd. Shareholders ¥ 100.44 ¥ 143.11 ¥ 110.92 ¥ 71.44 ¥ 49.40
Total NH Foods Ltd. Shareholders’ Equity ¥1,749.36 ¥1,736.18 ¥1,575.97 ¥1,474.60 ¥1,363.34
Cash Dividends ¥ 33.00 ¥ 46.00 ¥ 37.00 ¥ 24.00 ¥ 18.00
Financial Indicators: Percent
Return on Equity (ROE) 6.1% 9.2% 8.0% 5.6% 4.1%
Return on Assets (ROA) 4.8% 6.9% 5.7% 4.7% 4.5%
NH Foods Ltd. Shareholders’ Equity Ratio 52.2% 53.5% 51.2% 48.1% 49.2%
Times
Debt/Equity Ratio 0.43 0.39 0.45 0.51 0.48
Interest Coverage Ratio 35.10 24.20 21.30 22.80 14.50
Notes: 1. The above figures are based on the consolidated financial statements prepared in conformity with accounting principles generally accepted in the United States
of America.2. See Note 1 to the consolidated financial statements with respect to the determination of the number of shares in computing the per share amounts attributable
to NH Foods Ltd. shareholders. 3. Certain figures for the years ended on or before March 31, 2014 were adjusted retrospectively as a result of a change in accounting policy about the classifica-
tion of “cash and cash equivalents” for the year ended March 31, 2015.4. Interest-bearing debt consists of short-term bank loans, current maturities of long-term debt and long-term debt, less current maturities (including zero coupon
convertible bonds) in the consolidated balance sheets.5. Capital expenditures represent the additions to tangible and intangible fixed assets.6. Depreciation and amortization consist of depreciation of tangible fixed assets and amortization of intangible fixed assets.7. ROE = (Net income attributable to NH Foods Ltd. / Average total NH Foods Ltd. shareholders’ equity) × 100 ROA = (Income before income taxes and equity in earnings (losses) of Associated Companies / Average total assets) × 100 Free Cash Flow = Net cash provided by operating activities + Net cash used in investing activities NH Foods Ltd. Shareholders' Equity Ratio = (NH Foods Ltd. shareholders’ equity / Total assets) × 100 Debt / Equity Ratio = Interest-bearing debt / NH Foods Ltd. shareholders’ equity Interest Coverage Ratio = Net cash provided by operating activities / Interest paid
Five-Year SummaryNH Foods Ltd. and SubsidiariesFor the Years Ended March 31
79Nipponham Group Annual Report 2016
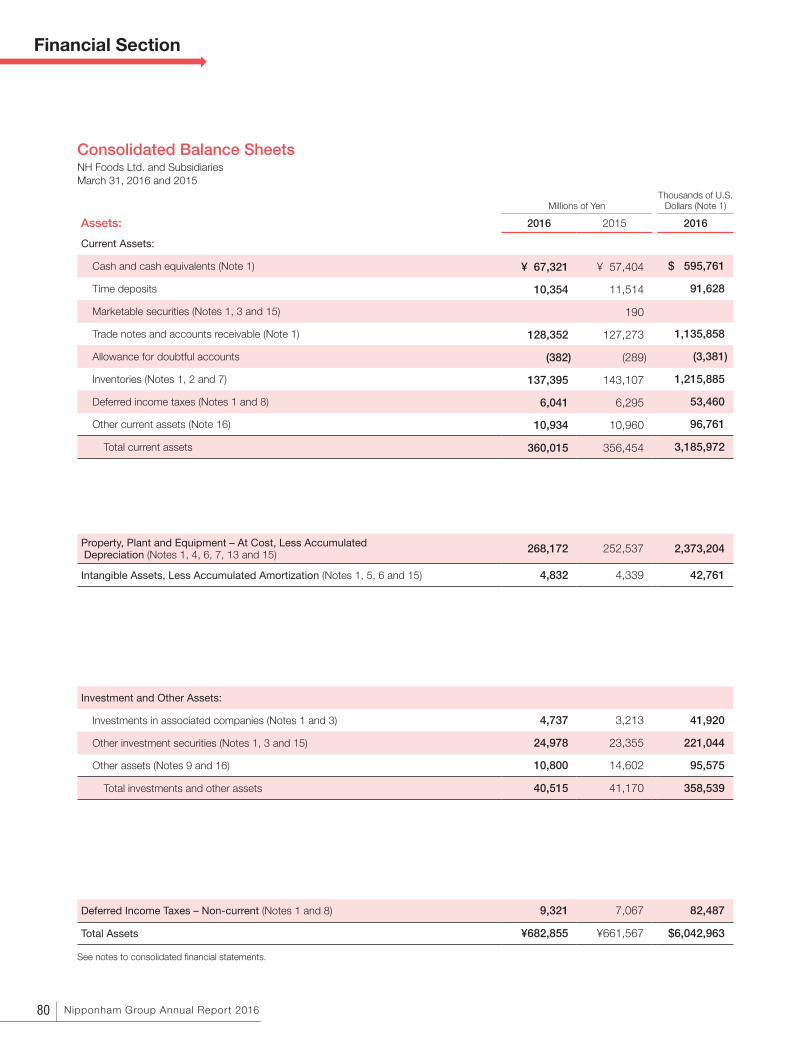
Millions of YenThousands of U.S.
Dollars (Note 1)
Assets: 2016 2015 2016
Current Assets:
Cash and cash equivalents (Note 1) ¥ 67,321 ¥ 57,404 $ 595,761
Time deposits 10,354 11,514 91,628
Marketable securities (Notes 1, 3 and 15) 190
Trade notes and accounts receivable (Note 1) 128,352 127,273 1,135,858
Allowance for doubtful accounts (382) (289) (3,381)
Inventories (Notes 1, 2 and 7) 137,395 143,107 1,215,885
Deferred income taxes (Notes 1 and 8) 6,041 6,295 53,460
Other current assets (Note 16) 10,934 10,960 96,761
Total current assets 360,015 356,454 3,185,972
Property, Plant and Equipment – At Cost, Less Accumulated Depreciation (Notes 1, 4, 6, 7, 13 and 15) 268,172 252,537 2,373,204
Intangible Assets, Less Accumulated Amortization (Notes 1, 5, 6 and 15) 4,832 4,339 42,761
Investment and Other Assets:
Investments in associated companies (Notes 1 and 3) 4,737 3,213 41,920
Other investment securities (Notes 1, 3 and 15) 24,978 23,355 221,044
Other assets (Notes 9 and 16) 10,800 14,602 95,575
Total investments and other assets 40,515 41,170 358,539
Deferred Income Taxes – Non-current (Notes 1 and 8) 9,321 7,067 82,487
Total Assets ¥682,855 ¥661,567 $6,042,963
See notes to consolidated financial statements.
Consolidated Balance SheetsNH Foods Ltd. and SubsidiariesMarch 31, 2016 and 2015
Financial Section
80 Nipponham Group Annual Report 2016
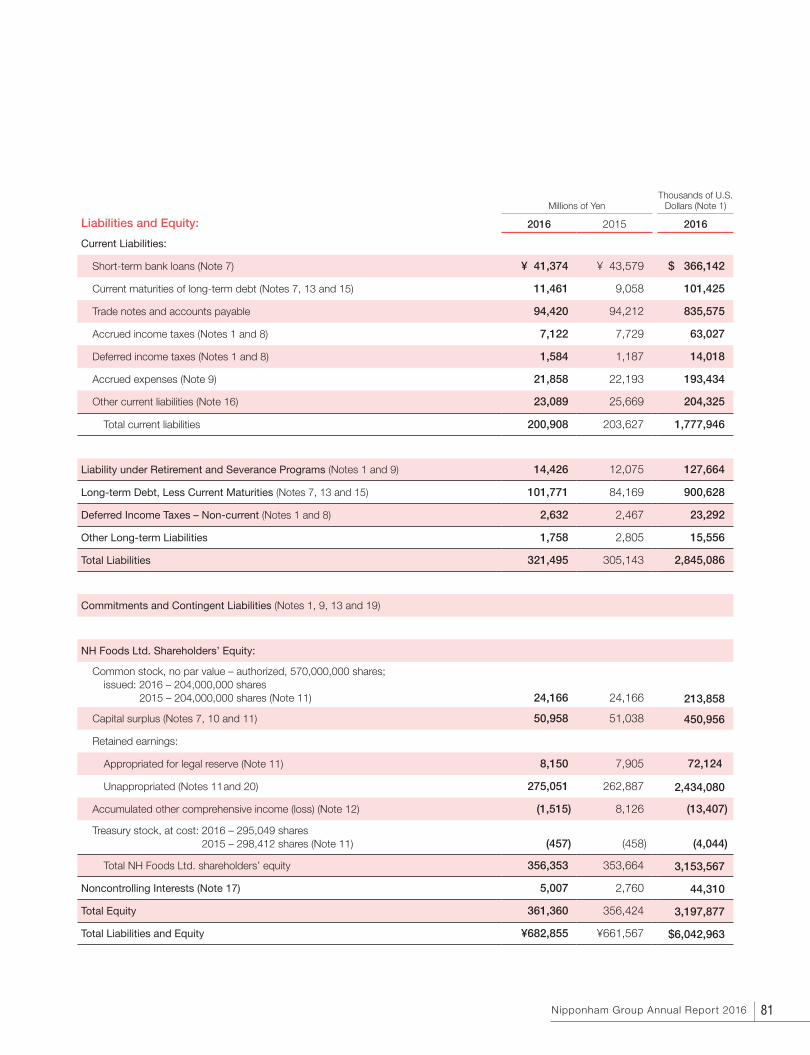
Millions of YenThousands of U.S.
Dollars (Note 1)
Liabilities and Equity: 2016 2015 2016
Current Liabilities:
Short-term bank loans (Note 7) ¥ 41,374 ¥ 43,579 $ 366,142
Current maturities of long-term debt (Notes 7, 13 and 15) 11,461 9,058 101,425
Trade notes and accounts payable 94,420 94,212 835,575
Accrued income taxes (Notes 1 and 8) 7,122 7,729 63,027
Deferred income taxes (Notes 1 and 8) 1,584 1,187 14,018
Accrued expenses (Note 9) 21,858 22,193 193,434
Other current liabilities (Note 16) 23,089 25,669 204,325
Total current liabilities 200,908 203,627 1,777,946
Liability under Retirement and Severance Programs (Notes 1 and 9) 14,426 12,075 127,664
Long-term Debt, Less Current Maturities (Notes 7, 13 and 15) 101,771 84,169 900,628
Deferred Income Taxes – Non-current (Notes 1 and 8) 2,632 2,467 23,292
Other Long-term Liabilities 1,758 2,805 15,556
Total Liabilities 321,495 305,143 2,845,086
Commitments and Contingent Liabilities (Notes 1, 9, 13 and 19)
NH Foods Ltd. Shareholders’ Equity:
Common stock, no par value – authorized, 570,000,000 shares; issued: 2016 – 204,000,000 shares
2015 – 204,000,000 shares (Note 11) 24,166 24,166 213,858
Capital surplus (Notes 7, 10 and 11) 50,958 51,038 450,956
Retained earnings:
Appropriated for legal reserve (Note 11) 8,150 7,905 72,124
Unappropriated (Notes 11 and 20) 275,051 262,887 2,434,080
Accumulated other comprehensive income (loss) (Note 12) (1,515) 8,126 (13,407)
Treasury stock, at cost: 2016 – 295,049 shares 2015 – 298,412 shares (Note 11) (457) (458) (4,044)
Total NH Foods Ltd. shareholders’ equity 356,353 353,664 3,153,567
Noncontrolling Interests (Note 17) 5,007 2,760 44,310
Total Equity 361,360 356,424 3,197,877
Total Liabilities and Equity ¥682,855 ¥661,567 $6,042,963
81Nipponham Group Annual Report 2016
Millions of YenThousands of U.S.
Dollars (Note 1)
2016 2015 2014 2016
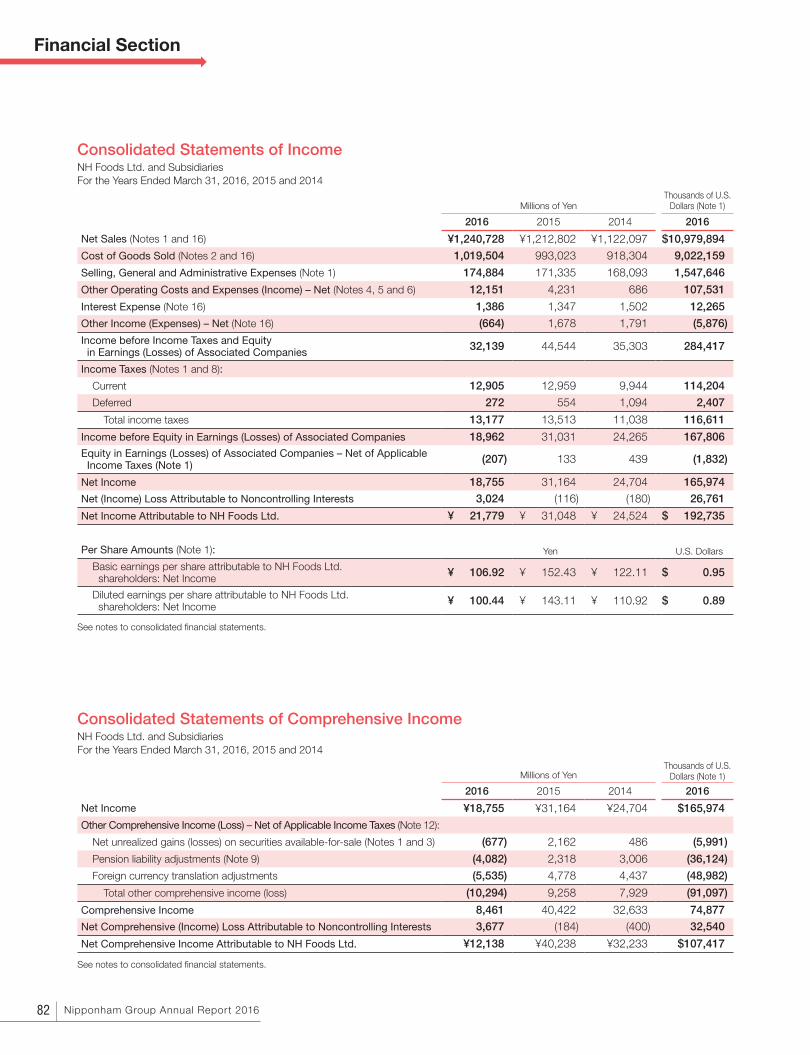
Net Sales (Notes 1 and 16) ¥1,240,728 ¥1,212,802 ¥1,122,097 $10,979,894
Cost of Goods Sold (Notes 2 and 16) 1,019,504 993,023 918,304 9,022,159
Selling, General and Administrative Expenses (Note 1) 174,884 171,335 168,093 1,547,646
Other Operating Costs and Expenses (Income) – Net (Notes 4, 5 and 6) 12,151 4,231 686 107,531
Interest Expense (Note 16) 1,386 1,347 1,502 12,265
Other Income (Expenses) – Net (Note 16) (664) 1,678 1,791 (5,876)
Income before Income Taxes and Equity in Earnings (Losses) of Associated Companies 32,139 44,544 35,303 284,417
Income Taxes (Notes 1 and 8):
Current 12,905 12,959 9,944 114,204
Deferred 272 554 1,094 2,407
Total income taxes 13,177 13,513 11,038 116,611
Income before Equity in Earnings (Losses) of Associated Companies 18,962 31,031 24,265 167,806Equity in Earnings (Losses) of Associated Companies – Net of Applicable Income Taxes (Note 1) (207) 133 439 (1,832)
Net Income 18,755 31,164 24,704 165,974
Net (Income) Loss Attributable to Noncontrolling Interests 3,024 (116) (180) 26,761
Net Income Attributable to NH Foods Ltd. ¥ 21,779 ¥ 31,048 ¥ 24,524 $ 192,735
Per Share Amounts (Note 1): Yen U.S. Dollars
Basic earnings per share attributable to NH Foods Ltd. shareholders: Net Income ¥ 106.92 ¥ 152.43 ¥ 122.11 $ 0.95
Diluted earnings per share attributable to NH Foods Ltd. shareholders: Net Income ¥ 100.44 ¥ 143.11 ¥ 110.92 $ 0.89
See notes to consolidated financial statements.
Millions of YenThousands of U.S.
Dollars (Note 1)
2016 2015 2014 2016
Net Income ¥18,755 ¥31,164 ¥24,704 $165,974
Other Comprehensive Income (Loss) – Net of Applicable Income Taxes (Note 12):
Net unrealized gains (losses) on securities available-for-sale (Notes 1 and 3) (677) 2,162 486 (5,991)
Pension liability adjustments (Note 9) (4,082) 2,318 3,006 (36,124)
Foreign currency translation adjustments (5,535) 4,778 4,437 (48,982)
Total other comprehensive income (loss) (10,294) 9,258 7,929 (91,097)
Comprehensive Income 8,461 40,422 32,633 74,877
Net Comprehensive (Income) Loss Attributable to Noncontrolling Interests 3,677 (184) (400) 32,540
Net Comprehensive Income Attributable to NH Foods Ltd. ¥12,138 ¥40,238 ¥32,233 $107,417
See notes to consolidated financial statements.
Consolidated Statements of Comprehensive IncomeNH Foods Ltd. and SubsidiariesFor the Years Ended March 31, 2016, 2015 and 2014
Consolidated Statements of Income NH Foods Ltd. and SubsidiariesFor the Years Ended March 31, 2016, 2015 and 2014
Financial Section
82 Nipponham Group Annual Report 2016

Millions of Yen
Common Stock
Capital Surplus
Retained Earnings
Appropriated for Legal Reserve
UnappropriatedRetainedEarnings
AccumulatedOther
ComprehensiveIncome (Loss)
TreasuryStock
Total NH Foods Ltd.
Shareholders’Equity
Noncontrolling Interests Total Equity
Balance, April 1, 2013 ¥24,166 ¥50,761 ¥7,518 ¥252,383 ¥(8,773) ¥(32,641) ¥293,414 ¥2,670 ¥296,084Net income 24,524 24,524 180 24,704Other comprehensive income (Note 12) 7,709 7,709 220 7,929Cash dividends (Note 11) (4,775) (4,775) (79) (4,854)Transfer to retained earnings appropriated for legal reserve (Note 11) 230 (230)
Acquisition of treasury stock (Note 11) (30,044) (30,044) (30,044)Conversion of convertible bonds 4,581 25,237 29,818 29,818Disposition of treasury stock (Note 11) (23) 25 2 2Equity component of convertible bonds (Note 7) 336 336 336
Balance, March 31, 2014 24,166 55,655 7,748 271,902 (1,064) (37,423) 320,984 2,991 323,975 Net income 31,048 31,048 116 31,164 Other comprehensive income (Note 12) 9,190 9,190 68 9,258 Cash dividends (Note 11) (7,536) (7,536) (83) (7,619)Transfer to retained earnings appropriated for legal reserve (Note 11) 157 (157)
Acquisition of treasury stock (Note 11) (21) (21) (21)Disposition of treasury stock (Note 11) (57) 56 (1) (1)Cancellation of treasury stock (Note 11) (4,560) (32,370) 36,930 Sales of subsidiary shares (332) (332)
Balance, March 31, 2015 24,166 51,038 7,905 262,887 8,126 (458) 353,664 2,760 356,424 Net income 21,779 21,779 (3,024) 18,755 Other comprehensive loss (Note 12) (9,641) (9,641) (653) (10,294)Cash dividends (Note 11) (9,370) (9,370) (41) (9,411)Transfer to retained earnings appropriated for legal reserve (Note 11) 245 (245)
Acquisition of treasury stock (Note 11) (10) (10) (10)Disposition of treasury stock (Note 11) (10) 11 1 1 Acquisition and capital increase of subsidiaries (Note 17) 6,094 6,094
Others (70) (70) (129) (199)
Balance, March 31, 2016 ¥24,166 ¥50,958 ¥8,150 ¥275,051 ¥(1,515) ¥ (457) ¥356,353 ¥5,007 ¥361,360
Thousands of U.S. Dollars (Note 1)
Common Stock
Capital Surplus
Retained Earnings
Appropriated for Legal Reserve
UnappropriatedRetainedEarnings
AccumulatedOther
ComprehensiveIncome (Loss)
TreasuryStock
Total NH Foods Ltd.
Shareholders’Equity
Noncontrolling Interests Total Equity
Balance, March 31, 2015 $213,858 $451,663 $69,956 $2,326,433 $ 71,911 $(4,053) $3,129,768 $24,426 $3,154,194 Net income 192,735 192,735 (26,761) 165,974 Other comprehensive loss (Note 12) (85,318) (85,318) (5,779) (91,097)Cash dividends (Note 11) (82,920) (82,920) (363) (83,283)Transfer to retained earnings appropriated for legal reserve (Note 11) 2,168 (2,168)
Acquisition of treasury stock (Note 11) (88) (88) (88)Disposition of treasury stock (Note 11) (88) 97 9 9 Acquisition and capital increase of subsidiaries (Note 17) 53,929 53,929
Others (619) (619) (1,142) (1,761)
Balance, March 31, 2016 $213,858 $450,956 $72,124 $2,434,080 $(13,407) $(4,044) $3,153,567 $44,310 $3,197,877
See notes to consolidated financial statements.
Consolidated Statements of Changes in Equity NH Foods Ltd. and SubsidiariesFor the Years Ended March 31, 2016, 2015 and 2014
83Nipponham Group Annual Report 2016

Millions of YenThousands of U.S.
Dollars (Note 1)
2016 2015 2014 2016
Operating Activities:
Net income ¥ 18,755 ¥ 31,164 ¥ 24,704 $ 165,974Adjustments to reconcile net income to net cash provided by operating activities:
Depreciation and amortization 19,926 19,405 19,081 176,336Impairment losses 11,081 3,047 1,738 98,062Income taxes deferred 272 554 1,094 2,407Foreign exchange translation adjustments (3,193) (963) (3,221) (28,257)Decrease (increase) in trade notes and accounts receivable (113) (8,929) 6,339 (1,000)Decrease (increase) in inventories 5,894 (20,259) (8,215) 52,159Decrease (increase) in other current assets (34) (2,260) 2,033 (301)Decrease in trade notes and accounts payable (304) (3,617) (5,504) (2,690)Increase (decrease) in accrued income taxes (598) 3,294 (1,666) (5,292)Increase (decrease) in accrued expenses and other current liabilities 232 8,727 (2,062) 2,053Others—net 617 (482) (1,369) 5,461
Net cash provided by operating activities 52,535 29,681 32,952 464,912Investing Activities:
Capital expenditures (37,604) (34,519) (22,690) (332,779)Proceeds from sales of capital assets 1,839 2,212 2,520 16,274 Increase in time deposits (202) (1,027) (8,383) (1,788)Purchases of marketable securities and other investment securities (2,798) (308) (269) (24,761)Proceeds from sales and maturities of marketable securities and other investment securities 475 2,185 413 4,204
Investments in associated companies (1,891) (16,735)Net increase (decrease) in cash and cash equivalents resulting from purchase of business (8,563) 201 (75,779)
Net increase in cash and cash equivalents resulting from sale of business 358 364Others—net (395) (418) 823 (3,494)Net cash used in investing activities (49,139) (31,517) (27,021) (434,858)
Financing Activities:
Cash dividends (9,411) (7,619) (4,854) (83,283)Increase (decrease) in short-term bank loans 18,506 (18,532) 17,104 163,770Proceeds from debt 30,408 19,631 51,459 269,097Repayments of debt (32,614) (10,646) (43,010) (288,619)Contributions from noncontrolling interests 1,502 13,292
Acquisition of treasury stock (10) (21) (30,044) (88)Others—net (199) 0 (28) (1,762)Net cash provided by (used in) financing activities 8,182 (17,187) (9,373) 72,407
Effect of Exchange Rate Changes on Cash and Cash Equivalents (1,661) 1,499 1,365 (14,700)Net Increase (Decrease) in Cash and Cash Equivalents 9,917 (17,524) (2,077) 87,761Cash and Cash Equivalents at Beginning of the Year 57,404 74,928 77,005 508,000Cash and Cash Equivalents at End of the Year ¥ 67,321 ¥ 57,404 ¥ 74,928 $ 595,761
Additional Cash Flow Information:
Interest paid ¥ 1,496 ¥ 1,229 ¥ 1,548 $ 13,239Income taxes paid 13,165 10,493 11,341 116,504Capital lease obligations incurred 4,686 2,773 2,776 41,469Converted amount into stock of convertible bonds 29,818
See notes to consolidated financial statements.
Consolidated Statements of Cash FlowsNH Foods Ltd. and SubsidiariesFor the Years Ended March 31, 2016, 2015 and 2014
Financial Section
84 Nipponham Group Annual Report 2016
Nature of Operations – The Group (NH Foods Ltd. and its
subsidiaries) is engaged in the production and distribution of
mainly hams & sausages, processed foods, fresh meats, marine
products and dairy products. The Group’s operations are located
principally in Japan.
Basis of Financial Statements – The accompanying consoli-
dated financial statements are stated in Japanese yen, the
currency of the country in which NH Foods Ltd. is incorporated
and operates. The translations of Japanese yen amounts into
United States dollar amounts with respect to the year ended
March 31, 2016 are included solely for the convenience of readers
outside Japan and have been made at the rate of ¥113=$1, the
approximate rate of exchange on March 31, 2016. Such transla-
tions should not be construed as a representation that Japanese
yen amounts could be converted into United States dollars at the
above or any other rate.
The accompanying consolidated financial statements have
been prepared on the basis of accounting principles generally
accepted in the United States of America. Certain adjustments
have been reflected in the accompanying consolidated financial
statements while they have not been entered in the general books
of account of the Group maintained principally in accordance with
Japanese accounting practices.
The preparation of consolidated financial statements in
conformity with accounting principles generally accepted in the
United States of America requires management to make
estimates and assumptions that affect the reported amounts of
assets and liabilities and the disclosure of contingent assets and
liabilities at the date of the financial statements and the reported
amounts of revenues and expenses during the reporting period.
Actual results could differ from those estimates. In order to
conform to the current year’s presentation, prior years’ presenta-
tions have been changed.
Summary of Significant Accounting Policies – Significant
accounting policies applied in the preparation of the accompanying
consolidated financial statements are summarized below:
(1) Consolidation – The consolidated financial statements include
the accounts of NH Foods Ltd., all of its majority-owned directly
or indirectly subsidiaries, and any variable interest entities of which
NH Foods Ltd. and its subsidiaries are the primary beneficiary.
Intercompany transactions and balances are eliminated. Invest-
ments in associated companies (20% to 50% owned) are
accounted for using the equity method of accounting. In preparing
the consolidated financial statements, financial statements with
reporting periods different from the consolidated reporting period
are used for certain subsidiaries. Necessary adjustments are
booked when material intervening events occur and affect the
financial position or result of operations for the period between
the subsidiary’s year-end reporting date and the consolidated
reporting date.
(2) Cash and Cash Equivalents – “Cash and cash equivalents”
consist of cash on hand, demand deposits and highly liquid
investments with original maturities of three months or less.
Effective from April 1, 2014, the Group changed the accounting
policy for classifying the cash and cash equivalents in the
consolidated balance sheets and the consolidated statements of
cash flows. The Group had previously defined the cash and cash
equivalents as cash on hand and demand deposits. The Group
changed its policy to also include time deposits and marketable
securities with original maturities of three months or less within
the scope of cash and cash equivalents. The new policy is more
closely aligned with the Group’s cash management and investment
strategies, thus the Group believes the change in policy is prefer-
able. Under Accounting Standards Codification (“ASC”) of the
U.S. Financial Accounting Standards Board (“FASB”) Topic 250,
“Accounting Changes and Error Corrections,” prior years’
consolidated financial statements were retrospectively adjusted to
reflect this change in accounting principle.
Notes to Consolidated Financial Statements NH Foods Ltd. and SubsidiariesFor the Years Ended March 31, 2016, 2015 and 2014
1. BASIS OF FINANCIAL STATEMENTS AND SUMMARY OF SIGNIFICANT ACCOUNTING POLICIES
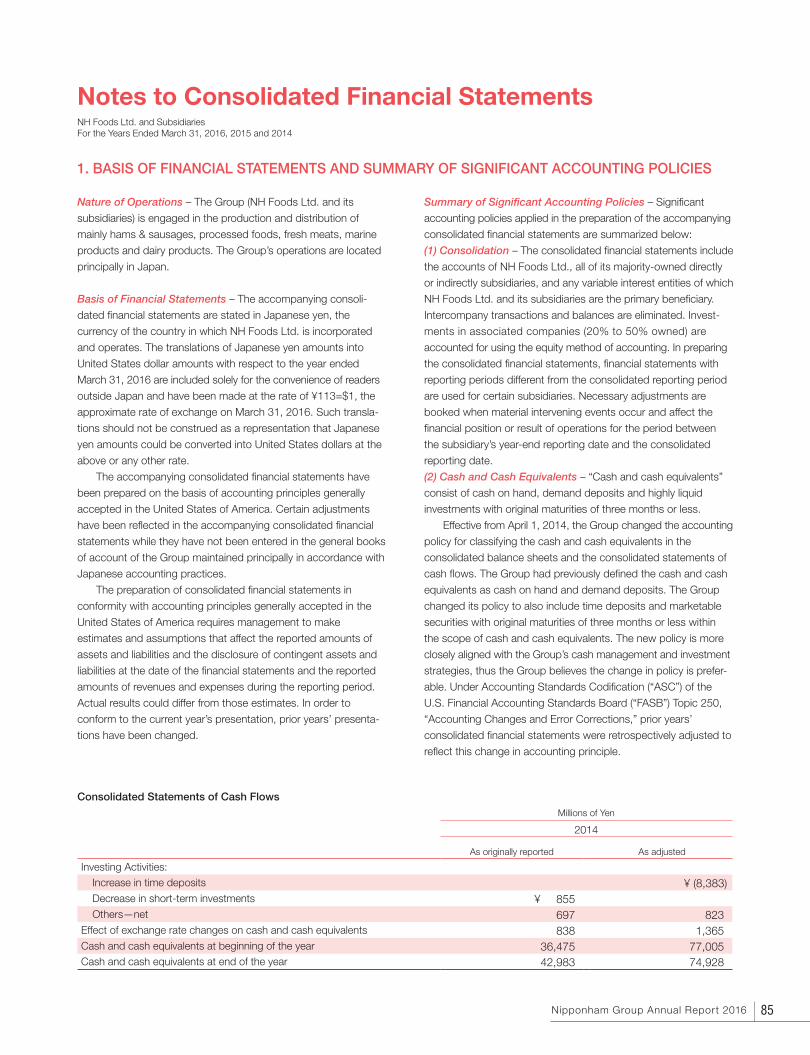
Consolidated Statements of Cash FlowsMillions of Yen
2014
As originally reported As adjusted
Investing Activities:Increase in time deposits ¥ (8,383)Decrease in short-term investments ¥ 855Others—net 697 823
Effect of exchange rate changes on cash and cash equivalents 838 1,365Cash and cash equivalents at beginning of the year 36,475 77,005Cash and cash equivalents at end of the year 42,983 74,928
85Nipponham Group Annual Report 2016

(3) Receivables – The Group grants credit to customers who are
primarily retailers and wholesalers in Japan.
(4) Inventories – Inventories are stated at the lower of cost or
market. Cost is determined by the average cost method.
(5) Marketable Securities and Investments – The Group’s
investments in debt securities and marketable equity securities
(included in marketable securities and other investment securities)
are classified as either Available-for-Sale or Held-to-Maturity
based on the Group’s intent and ability to hold and the nature of
the securities. Investments classified as Available-for-Sale are
reported at fair value with unrealized holding gains and losses,
which are recorded in accumulated other comprehensive income
(loss), net of applicable income taxes. Investments classified as
Held-to-Maturity are recorded at amortized cost. All other invest-
ment securities are stated at cost unless the value is considered
to have been impaired.
The Group regularly reviews investments in debt securities
and marketable equity securities for impairment based on criteria
that include the extent to which the securities’ carrying values
exceed those related market prices, the duration of the market
decline, and the Group’s ability and intent to hold the investments.
Other investment securities stated at cost are reviewed periodically
for impairment.
(6) Depreciation – The straight-line method is used for property,
plant and equipment. Depreciation expense includes depreciation
related to capital lease assets which are depreciated over the
shorter of lease terms or estimated useful lives. The ranges of
estimated useful lives used in the computation of depreciation are
mainly as follows:
Buildings 20-40 years
Machinery and equipment 5-15 years
(7) Impairment of Long-Lived Assets – The Group applies ASC
Topic 360, “Property, Plant, and Equipment” and ASC Topic 205,
“Presentation of Financial Statements.” ASC Topic 360 provides
one accounting model for the impairment or disposal of long-lived
assets. ASC Topic 205 provides the criteria for classifying an
asset as held for sale, defines the scope of business to be
disposed of that qualify for reporting as discontinued operations
and the timing of recognizing losses on such operations.
In accordance with ASC Topic 360, management reviews
long-lived assets for impairment of value whenever events or
changes in circumstances indicate the carrying amount of such
assets may not be recoverable. If the Group determines that they
are unable to recover the carrying value of the assets, the assets
are written down using an appropriate method.
In accordance with ASC Topic 205, the Group presents the
results of discontinued operations as a separate line item in the
consolidated statements of income under income from discontinued
operations – net of applicable income taxes, as it occurs.
(8) Goodwill and Other Intangible Assets – The Group applies
ASC Topic 350, “Intangibles—Goodwill and Other.” ASC Topic
350 requires that goodwill no longer be amortized, but instead be
tested for impairment at least annually. ASC Topic 350 also
requires recognized intangible assets be amortized over their
respective estimated useful lives and tested for impairment. Any
recognized intangible assets determined to have indefinite useful
lives are not to be amortized, but instead are tested for impair-
ment until their lives are determined to no longer be indefinite.
(9) Business Combinations – The Group applies ASC Topic 805,
“Business Combinations.” In accordance with the provisions of
ASC Topic 805, the acquisition of a business is accounted for
using the acquisition method of accounting.
(10) Retirement and Severance Programs – The Group applies
ASC Topic 715, “Compensation—Retirement Benefits,” to account
for the Group’s employee retirement and severance programs.
As allowed under ASC Topic 715, the Group does not
recognize gain or loss on settlement of the pension obligations
when the cost of all settlements during a year is less than or equal
to the sum of the service cost and interest cost components of
net periodic pension cost for the plan for the year.
(11) Fair Value of Financial Instruments – The Group discloses
the fair value of financial instruments in the notes to consolidated
financial statements. When the fair value approximates the book
value, no additional disclosure is made. Fair values are estimated
using quoted market prices, estimates obtained from brokers and
other appropriate valuation techniques based on information
available at March 31, 2016 and 2015.
(12) Fair Value Measurements – The Group applies ASC Topic
820, “Fair value Measurements and Disclosures.” For more
information, see Note 15, “Fair Value Measurements.”
(13) Income Taxes – The Group applies ASC Topic 740, “Income
Taxes.” In accordance with the provisions of ASC Topic 740,
deferred tax assets and liabilities are computed based on the
temporary differences between the financial statement and
income tax bases of assets and liabilities, and tax losses and
credits which can be carried forward, using the enacted tax rate
applicable to periods in which the differences are expected to
affect taxable income. Deferred income tax charges or credits are
based on changes in deferred tax assets and liabilities from period
to period, subject to an ongoing assessment of realization. ASC
Topic 740 also prescribes a recognition threshold and
measurement process for financial statement recognition and
measurement of a tax position taken or expected to be taken
in a tax return.
A provision for income taxes is not recorded on undistributed
earnings of subsidiaries where NH Foods Ltd. considers that such
earnings are permanently invested or where, under the present
Japanese tax law, such earnings would not be subject to
additional taxation should they be distributed to the Group.
The Group recognizes tax-related interest and penalties in
income taxes in the consolidated statements of income.
(14) Per Share Amounts – Basic Earnings Per Share (“EPS”) is
computed by dividing net income attributable to NH Foods Ltd.
by the weighted-average number of common shares outstanding
during the year. Diluted EPS is computed by dividing net income
attributable to NH Foods Ltd. by the sum of the weighted-average
number of common shares outstanding plus the dilutive effect of
shares issuable through stock options and convertible bonds.
Financial Section
86 Nipponham Group Annual Report 2016

(15) Revenue Recognition – The Group recognizes revenue
when the product is received by the customer, at which time title
and risk of loss pass to the customer. Taxes collected from
customers and remitted to governmental authorities are excluded
from revenues in the consolidated statements of income.
(16) Sales Promotion Expenses and Rebates – The Group
accounts for promotion expenses and rebates in accordance with
the provisions of ASC Topic 605, “Revenue Recognition.” ASC
Topic 605 requires that certain sales promotion expenses and
rebates be classified as a reduction of net sales, rather than as
selling, general and administrative expenses.
(17) Advertising – Advertising costs are expensed as incurred
and included in selling, general and administrative expenses.
Advertising expenses amounted to ¥11,104 million ($98,265
thousand), ¥11,187 million and ¥11,221 million for the years
ended March 31, 2016, 2015 and 2014, respectively.
(18) Research and Development – Research and development
costs are expensed as incurred. Research and development
costs amounted to ¥2,689 million ($23,796 thousand), ¥3,354
million and ¥3,424 million for the years ended March 31, 2016,
2015 and 2014, respectively.
(19) Derivative Instruments and Hedging Activities – The Group
accounts for derivative instruments and hedging activities in
accordance with ASC Topic 815, “Derivatives and Hedging.”
ASC Topic 815 requires that all derivative instruments be recog-
nized as assets or liabilities on the balance sheet and measured
at fair value. Changes in the fair value of derivative instruments
are recognized in either income or other comprehensive income,
depending on the designated purpose of the derivative
instruments.
(20) Guarantees – The Group accounts for guarantees in accor-
dance with ASC Topic 460, “Guarantees,” which addresses the
disclosure to be made by a guarantor in its financial statements
about its obligations under guarantees. ASC Topic 460 also
requires the recognition of a liability by a guarantor at the inception
of certain guarantees. ASC Topic 460 requires the guarantor to
recognize at the inception of the guarantee, a liability for the fair
value of the obligation undertaken in issuing the guarantee.
(21) Recent Accounting Pronouncements:
Eliminating the Concept of Extraordinary Items – In January
2015, FASB issued Accounting Standards Update (ASU) 2015-01
which amends ASC 225-20 “Income Statement – Extraordinary
and Unusual Items.” This update eliminates the concept of
extraordinary items and simplifies income statement presentation.
It is effective for fiscal years, and interim periods within those
years, beginning after December 15, 2015. The Group is currently
in the process of evaluating the impact of the adoption on the
consolidated financial statements.
Amendments to the Consolidation Analysis – In February
2015, FASB issued ASU 2015-02 which amends ASC 810
“Consolidation.” This update changes the consolidation analysis
and requires a reporting entity to perform reevaluation whether it
should consolidate certain types of legal entities. It is effective for
fiscal years, and interim periods within those years, beginning
after December 15, 2015, with early adoption permitted. The
Group is currently in the process of evaluating the impact of the
adoption on the consolidated financial statements.
Simplifying the Presentation of Debt Issuance Costs – In April
2015, FASB issued ASU 2015-03 “Imputation of Interest
(Subtopic 835-30): Simplifying the Presentation of Debt Issuance
Costs.” This update specifies that debt issuance costs related to
a recognized debt liability shall be reported in the balance sheet
as a direct deduction from the carrying amount of that debt
liability and that amortization of debt issuance costs also shall be
reported as interest expense. It is effective for fiscal years, and
interim periods within those fiscal years, beginning after December
15, 2015. Early adoption of the amendments in this update is
permitted for financial statements that have not been previously
issued. The Group is currently in the process of evaluating the
impact of the adoption on the consolidated financial statements.
The net income attributable to NH Foods Ltd. and shares used for basic EPS and diluted EPS are reconciled below:
Millions of YenThousands of U.S. Dollars
2016 2015 2014 2016
Net Income (Numerator):
Net income attributable to NH Foods Ltd. ¥21,779 ¥31,048 ¥24,524 $192,735Dilutive effect of convertible bonds 59 56 19 522Diluted net income attributable to NH Foods Ltd. shareholders ¥21,838 ¥31,104 ¥24,543 $193,257
Thousands of Shares
2016 2015 2014
Shares (Denominator):
Average shares outstanding for basic earnings per share 203,701 203,686 200,828Dilutive effect of stock options 173 194 222Dilutive effect of convertible bonds 13,538 13,466 20,226Average shares outstanding for diluted earnings per share 217,412 217,346 221,276
87Nipponham Group Annual Report 2016
Amendments to the Fair Value Disclosures of Investments
Using the Practical Expedient – In May 2015, FASB issued ASU
2015-07 which amends ASC 820 “Fair Value Measurement.” This
update removes the requirements to categorize within the fair
value hierarchy all the investments for which fair value is mea-
sured using the net asset value per share practical expedient. It is
effective for fiscal years, and interim periods within those years,
beginning after December 15, 2015, with early adoption permitted.
The Group is currently in the process of evaluating the impact of
the adoption on the consolidated financial statements.
Simplifying the Measurement of Inventory – In July 2015,
FASB issued ASU 2015-11 “Simplifying the Measurement of
Inventory” which amends ASC 330 “Inventory.” This update
requires an entity to measure inventory within the scope of this
update at the lower of cost and net realizable value. It is effective
for fiscal years, and interim periods within those years, beginning
after December 15, 2016 and an earlier application is permitted.
The Group is currently in the process of evaluating the impact of
the adoption on the consolidated financial statements.
Revenue from Contracts with Customers – In May 2014, FASB
issued ASU 2014-09 “Revenue from Contracts with Customers.”
ASU 2014-09 creates a new Topic 606 “Revenue from Contracts
with Customers” and outlines a single comprehensive model for
entities to use in accounting for revenue arising from contracts with
customers and supersedes most current revenue recognition
guidance of ASC 605 “Revenue Recognition.” An entity should
recognize revenue to depict the transfer of promised goods or
services to customers in an amount that reflects the consideration
to which the entity expects to be entitled in exchange for those
goods or services. ASU 2014-09 also requires the additional
disclosures to enable users of financial statements to understand
the nature, amount, timing and uncertainty of revenue and cash
flows arising from contracts with customers. It is effective for annual
reporting periods, beginning after December 15, 2016, including
interim periods within that reporting period and early adoption is not
permitted. The Group is currently in the process of evaluating the
impact of the adoption on the consolidated financial statements.
Revenue from Contracts with Customers
(Deferral of the Effective Date) – In August 2015, FASB issued
ASU 2015-14 “Revenue from Contracts with Customers – Deferral
of the Effective Date.” This update defers the effective date of ASU
2014-09 “Revenue from Contracts with Customers” for one year
mainly because ASU 2014-09 was issued approximately nine
months later than FASB had anticipated when it selected the
effective date. With this update, ASU 2014-09 will be effective for
annual reporting periods, beginning after December 15, 2017,
including interim periods within that reporting period. Early adoption
of ASU 2014-09 is still permitted but not before the original effective
date for public business entities (annual reporting periods beginning
after December 15, 2016). The Group is currently in the process of
evaluating the impact of the adoption of ASU 2014-09 on the
consolidated financial statements.
Balance Sheet Classification of Deferred Taxes – In November
2015, FASB issued ASU 2015-17 “Income Taxes (Topic 740):
Balance Sheet Classification of Deferred Taxes.” This update
requires that deferred tax liabilities and assets be classified as
noncurrent in a classified balance sheet. It is effective for financial
statements issued for annual periods beginning after December
15, 2016, and interim periods within those annual periods. Earlier
application is permitted for all entities as of the beginning of an
interim or annual reporting period. The Group is currently in the
process of evaluating the impact of the adoption on the consoli-
dated financial statements.
Recognition and Measurement of Financial Assets and
Financial Liabilities – In January 2016, FASB issued ASU
2016-01 which amends ASC 825-10 “Financial Instruments
– Overall.” This update mainly requires equity investments to be
measured at fair value with changes in fair value recognized in net
income and changes related disclosures. It is effective for fiscal
years, and interim periods within those years, beginning after
December 15, 2017. Except for the early application guidance
discussed in this update, early adoption of the amendments is not
permitted. The Group is currently in the process of evaluating the
impact of the adoption on the consolidated financial statements.
Leases – In February 2016, FASB issued ASU 2016-02 “Leases.”
ASU 2016-02 creates a new Topic 842 “Leases” and supersedes
ASC 840 “Leases.” This update mainly requires the recognition of
right-of-use assets and lease liabilities by lessees for those leases
classified as operating leases under previous GAAP. It is effective
for fiscal years, and interim periods within those years, beginning
after December 15, 2018, with early adoption permitted. The
Group is currently in the process of evaluating the impact of the
adoption on the consolidated financial statements.
Simplifying the Transition to the Equity
Method of Accounting – In March 2016, FASB issued ASU
2016-07 “Simplifying the Transition to the Equity Method of
Accounting” which amends ASC 323 “Investments – Equity
Method and Joint Ventures.” This update eliminates the
requirement that an entity retrospectively adopt the equity method
if an investment qualifies for the equity method as a result of an
increase in the level of ownership or degree of influence. It is
effective for fiscal years, and interim periods within those years,
beginning after December 15, 2016 and an earlier adoption is
permitted. The Group is currently in the process of evaluating the
impact of the adoption on the consolidated financial statements.
Financial Section
88 Nipponham Group Annual Report 2016

2. INVENTORIES
Inventories at March 31, 2016 and 2015 consisted of the following:
Millions of YenThousands of U.S. Dollars
2016 2015 2016
Finished goods and merchandise ¥ 85,926 ¥ 91,040 $ 760,407
Raw materials and work-in-process 46,403 47,775 410,646
Supplies 5,066 4,292 44,832
Total ¥137,395 ¥143,107 $1,215,885
The Group recognized losses of ¥1,220 million ($10,796 thousand), ¥1,281 million and ¥689 million from writing inventories down to market,
which were included in cost of goods sold in the consolidated statements of income for the years ended March 31, 2016, 2015 and 2014,
respectively.
3. MARKETABLE SECURITIES AND INVESTMENTS
The table below presents the aggregate cost, gross unrealized holding gains, gross unrealized holding losses and the aggregate fair value of
available-for-sale securities and held-to-maturity securities (included in marketable securities and other investment securities) at March 31,
2016 and 2015:
Millions of Yen Thousands of U.S. Dollars
2016 2015 2016
Cost
Gross Unrealized
Holding Gains
Gross Unrealized
Holding Losses
FairValue Cost
Gross Unrealized
Holding Gains
Gross Unrealized
Holding Losses
FairValue Cost
Gross Unrealized
Holding Gains
Gross Unrealized
Holding Losses
FairValue
Available-for-sale:
Domestic stocks:
Retail industry ¥ 4,662 ¥4,838 ¥ (24) ¥ 9,476 ¥4,624 ¥4,845 ¥(1) ¥ 9,468 $ 41,257 $42,814 $ (212) $ 83,859
Others 6,512 4,481 (322) 10,671 4,661 5,128 (1) 9,788 57,628 39,655 (2,850) 94,433
Mutual funds 250 0 250 250 0 250 2,212 0 2,212
Held-to-maturity:
Japanese government bonds 190 0 190
Total ¥11,424 ¥9,319 ¥(346) ¥20,397 ¥9,725 ¥9,973 ¥(2) ¥19,696 $101,097 $82,469 $(3,062) $180,504
Fair value and gross unrealized holding losses of available-for-sale securities and held-to-maturity securities, aggregated by investment
category and length of time that individual securities had been in a continuous unrealized loss position, at March 31, 2016 and 2015 were
as follows. There were no investments in a continuous unrealized loss position for 12 months or more at March 31, 2016 and 2015:
Millions of Yen Thousands of U.S. Dollars
2016 2015 2016
Less than 12 Months Less than 12 Months Less than 12 Months
Fair Value
Gross Unrealized
Holding Losses Fair Value
Gross Unrealized
Holding Losses Fair Value
Gross Unrealized
Holding Losses
Available-for-sale:
Domestic stocks:
Retail industry ¥ 148 ¥ (24) ¥ 48 ¥(1) $ 1,310 $ (212)
Others 2,750 (322) 39 (1) 24,336 (2,850)
Held-to-maturity:
Japanese government bonds 190 0
Total ¥2,898 ¥(346) ¥277 ¥(2) $25,646 $(3,062)
89Nipponham Group Annual Report 2016

The proceeds from sales of available-for-sale securities were ¥280 million ($2,478 thousand), ¥1,919 million and ¥204 million for the years
ended March 31, 2016, 2015 and 2014, respectively. These sales resulted in gross realized gains and losses as follows:
Millions of YenThousands of U.S. Dollars
2016 2015 2014 2016
Realized gains ¥149 ¥670 ¥86 $1,319
Realized losses 0 (1) 0 0
In determining realized gains and losses, the cost of securities sold was based on the moving average cost of all shares of such security
held at the time of sale.
Non-marketable equity securities, for which there is no practicable method to estimate fair values, were carried at their cost of ¥4,581
million ($40,540 thousand) and ¥3,849 million at March 31, 2016 and 2015, respectively.
The differences of the carrying value of investments in associated companies and NH Foods Ltd.’s equity in their net assets at March
31, 2016 and 2015 were not monetarily significant.
The carrying values and fair values of marketable securities in investments in associated companies at March 31, 2016 and 2015 were
as follows:
Millions of YenThousands of U.S.
Dollars
2016 2015 2016
Carrying values of marketable securities ¥1,891 $16,735
Fair values of marketable securities 3,509 31,053
4. PROPERTY, PLANT AND EQUIPMENT
Property, plant and equipment at March 31, 2016 and 2015 consisted of the following:
Millions of YenThousands of U.S. Dollars
2016 2015 2016
Land ¥ 83,714 ¥ 83,647 $ 740,832
Buildings 292,717 278,958 2,590,416
Machinery and equipment 241,457 233,807 2,136,788
Construction in progress 3,507 6,854 31,035
Total 621,395 603,266 5,499,071
Less accumulated depreciation (353,223) (350,729) (3,125,867)
Property, plant and equipment – net ¥268,172 ¥252,537 $ 2,373,204
Depreciation expense of property, plant and equipment was ¥18,053 million ($159,761 thousand), ¥16,973 million and ¥15,735 million for
the years ended March 31, 2016, 2015 and 2014, respectively. The Group recorded a net loss of ¥1,067 million ($9,442 thousand), a net
loss of ¥1,328 million and a net gain of ¥1,211 million on dispositions of property, plant and equipment, for the years ended March 31,
2016, 2015 and 2014, respectively. The gains and losses for the years ended March 31, 2016, 2015 and 2014 were included in other
operating costs and expenses (income) – net in the consolidated statements of income.
Financial Section
90 Nipponham Group Annual Report 2016

5. INTANGIBLE ASSETS
Intangible assets subject to amortization included in intangible assets in the consolidated balance sheets at March 31, 2016 and 2015
consisted of the following:
Millions of Yen Thousands of U.S. Dollars
2016 2015 2016Gross Carrying
Amount Accumulated Amortization
Gross Carrying Amount
Accumulated Amortization
Gross Carrying Amount
Accumulated Amortization
Software ¥24,077 ¥21,224 ¥23,063 ¥20,334 $213,071 $187,823
Software in progress 346 344 3,062
Other 870 530 875 464 7,699 4,690
Total ¥25,293 ¥21,754 ¥24,282 ¥20,798 $223,832 $192,513
Intangible assets not subject to amortization at March 31, 2016
and 2015 were immaterial.
Amortization expense was ¥1,392 million ($12,319 thousand),
¥1,978 million and ¥2,914 million for the years ended March 31,
2016, 2015 and 2014, respectively.
The weighted average amortization periods of intangible
assets acquired during the years ended March 31, 2016 and
2015 are approximately 10 years and 5 years, respectively.
Estimated amortization expense for the next five years ending
March 31 is as follows:
Changes in the carrying amounts of goodwill for the year ended
March 31, 2016 were an increase of ¥8,556 million ($75,717
thousand) as described in Note 17, and a decrease of ¥866 million
($7,664 thousand) by foreign exchange translation adjustments.
The Group recognized impairment losses of ¥7,690 million
($68,053 thousand) and ¥1,889 million ($16,717 thousand),
respectively, of the goodwill and the other intangible assets
recognized in connection with the acquisition of Ege-Tav Ege Tarım
Hayvancılık Yatırım Ticaret ve Sanayi Anonim irketi (“Ege-Tav”) for
the year ended March 31, 2016.
The Group revised the business plan for Ege-Tav and evaluated
the recoverable amount, as it was expected that the operating
result would not achieve the original plan due to the deterioration of
external environment such as avian influenza and the heightening
of geopolitical risks in Turkey. As a result, the Group reduced the
carrying amount of the goodwill and the other intangible assets to
the fair value amount.
The impairment losses were reported in other operating costs
and expenses (income) – net in the consolidated statements of
income. The fair value is measured by using discounted cash flow
model.
The carrying amounts of goodwill at March 31, 2016 and
2015 and changes in its carrying amounts for the year ended
March 31, 2015 were immaterial to the Group’s operations.
6. IMPAIRMENT OF LONG-LIVED ASSETS
The Group recognized impairment losses of ¥3,391 million
($30,009 thousand) for the year ended March 31, 2016. The
impairment losses relate principally to the Ege-Tav’s intangible
assets except for goodwill and to idle assets which were related
to Processed Foods Business Division and were reported in other
operating costs and expenses (income) – net in the consolidated
statements of income. The impairment losses related to Ege-Tav
are described in Note 5. The impairment losses related to
Processed Foods Business Division were incurred mainly due to a
decline in market value of the assets.
The Group recognized impairment losses of ¥3,047 million for
the year ended March 31, 2015. The impairment losses relate
principally to idle assets and to assets used for business related
to Processed Foods Business Division and were reported in other
operating costs and expenses (income) – net in the consolidated
statements of income. The impairment losses were incurred
mainly due to a decline in market value of the assets and a
reorganization of the production base resulting in the future
disposal of the assets.
The Group recognized impairment losses of ¥1,738 million for
the year ended March 31, 2014. The impairment losses relate
principally to idle assets related to Processed Foods Business
Division and were reported in other operating costs and expenses
(income) – net in the consolidated statements of income. The
impairment losses were incurred mainly due to a decline in market
value of the assets.
The fair value of assets related to Processed Foods Business
Division is calculated based on independent appraisal or market
value whichever the management considers the most appropriate.
Year Ending March 31: Millions of YenThousands of U.S. Dollars
2017 ¥1,149 $10,1682018 874 7,7352019 596 5,2742020 429 3,7962021 231 2,044
91Nipponham Group Annual Report 2016

The euro yen zero coupon convertible bonds due September
2018 have a conversion limitation clause and a call option clause
(cash settlement type). Unconverted portion of these bonds on
September 26, 2018 (maturity date) will be redeemed at 100% of
the face amount. The conversion price of these stock acquisition
rights is ¥2,216.0 ($19.61) and ¥2,227.8, and the increasing
number of common stock upon exercise of the stock acquisition
rights and issuance of new shares is 13,537,906 and 13,466,199
for the years ended March 31, 2016 and 2015, respectively.
As of March 31, 2016 and 2015, the bonds mentioned above
were separately accounted for the equity and liabilities as follows:
Millions of YenThousands of U.S. Dollars
2016 2015 2016
Component of equity:
Carrying amount ¥ 336 ¥ 336 $ 2,973Component of liability:
Principle amount 30,000 30,000 265,487Less unamortized discounts (207) (291) (1,832)Net carrying amount ¥29,793 ¥29,709 $263,655
7. SHORT-TERM BANK LOANS AND LONG-TERM DEBT
The annual interest rates applicable to the short-term bank loans outstanding at March 31, 2016 and 2015 ranged from 0.6% to 4.4% and
0.4% to 6.2%, respectively.
NH Foods Ltd. entered into contracts with financial institutions for committed credit lines.
As of March 31, 2016 and 2015, the amounts of unexercised committed credit lines were as follows:
Millions of YenThousands of U.S. Dollars
2016 2015 2016
Total committed credit lines ¥75,000 ¥75,000 $663,717
Unexercised committed credit lines 74,090 75,000 655,664
Unexercised committed credit lines were available to immediate borrowings.
Long-term debt at March 31, 2016 and 2015 consisted of the following:
Millions of YenThousands of U.S. Dollars
2016 2015 2016
Long-term debt with collateral:
Mainly banks and insurance companies, maturing through 2019, interest rate at 1.5% in 2016 interest rates ranging from 1.5% to 2.1% in 2015
¥ 392 ¥ 682 $ 3,467
Long-term debt without collateral:
Mainly banks and insurance companies, maturing through 2025, interest rates ranging from 0.2% to 1.0% in 2016 and 0.2% to 1.7% in 2015 42,183 23,452 373,301
2.01% bonds due December 2017 10,000 10,000 88,496
0.551% bonds due September 2019 10,000 10,000 88,496
0.934% bonds due September 2022 10,000 10,000 88,496
Euro yen zero coupon convertible bonds due September 2018
Conversion price, ¥2,216.0 per share 29,793 29,709 263,655
Capital lease obligations, interest rates ranging from 0.1% to 3.0% in 2016 maturing through 2035, and from 0.2% to 2.2% in 2015 maturing through 2029
10,864 9,384 96,142
Total 113,232 93,227 1,002,053
Less current maturities (11,461) (9,058) (101,425)
Long-term debt, less current maturities ¥101,771 ¥84,169 $ 900,628
Year Ending March 31: Millions of YenThousands of U.S. Dollars
2017 ¥ 11,461 $ 101,4252018 12,296 108,8142019 31,714 280,6552020 11,361 100,5402021 762 6,743Thereafter 45,638 403,876Total ¥113,232 $1,002,053
At March 31, 2016, the aggregate annual maturities of long-term debt are as follows:
Financial Section
92 Nipponham Group Annual Report 2016

At March 31, 2016, property, plant and equipment with a net
book value of ¥5,585 million ($49,425 thousand) was pledged as
collateral for long-term debt of ¥392 million ($3,467 thousand),
and inventories of ¥637 million ($5,637 thousand) were pledged
as collateral for short-term bank loans of ¥300 million ($2,655
thousand).
Substantially all the short-term and long-term loans from
banks are made under agreements which provide as is customary
in Japan that under certain conditions, the banks may require the
Group to provide collateral (or additional collateral) or guarantors
with respect to the loans, or may treat any collateral, whether
furnished as security for short-term and long-term loans or
otherwise, as collateral for all indebtedness to such banks. Default
provisions of certain agreements grant certain rights of possession
to the banks.
8. INCOME TAXES
Through the application of the consolidated tax filing system, the
amount of taxable income for national income tax purposes is
calculated by combining the taxable income of NH Foods Ltd.
and its wholly owned subsidiaries located in Japan. In addition,
the realizable amounts of deferred tax assets relating to national
income tax as of March 31, 2016 and 2015 were assessed based
on the estimated future taxable income of NH Foods Ltd. and its
wholly owned subsidiaries located in Japan.
Income taxes in Japan applicable to NH Foods Ltd. and
domestic subsidiaries, imposed by the national, prefectural and
municipal governments, in the aggregate resulted in a normal
effective statutory rate of approximately 33.0% for the year ended
March 31, 2016, 36.0% for the year ended 2015 and 38.0% for
the year ended 2014. Foreign subsidiaries are subject to income
taxes of the countries in which they operate.
In accordance with ASC Topic 740, a change in tax laws and
rates requires an adjustment of deferred tax assets and liabilities,
and the difference caused by the adjustment shall be included in
deferred tax expenses.
As a result of the amendments to the Japanese tax regula-
tions enacted into law on March 29, 2016, the normal Japanese
statutory tax rates have been reduced from approximately 33.0%
to 31.0% on and after April 1, 2016. Deferred tax expense
increased by ¥454 million ($4,018 thousand) by the adjustments
of deferred tax assets and liabilities at the date of enactment in
comparison with that before the amendments for the year ended
March 31, 2016.
As a result of the amendments to the Japanese tax regula-
tions enacted into law on March 31, 2015, the normal Japanese
statutory tax rates have been reduced from approximately 36.0%
to 33.0% on and after April 1, 2015 and to 32.0% on and after
April 1, 2016. Deferred tax expense increased by ¥1,183 million
by the adjustments of deferred tax assets and liabilities at the date
of enactment in comparison with that before the amendments for
the year ended March 31, 2015.
As a result of the amendments to the Japanese tax regulations
enacted into law on March 20, 2014, Special Corporation Tax for
Reconstruction has been repealed and the normal Japanese
statutory tax rates have been reduced from approximately 38.0%
to 36.0% on and after April 1, 2014. Deferred tax expense
increased by ¥314 million by the adjustments of deferred tax
assets and liabilities at the date of enactment in comparison with
that before the amendments for the year ended March 31, 2014.
The effective rates of income taxes reflected in the consolidated statements of income differed from the normal Japanese statutory tax
rates for the following reasons:
2016 2015 2014
Normal Japanese statutory tax rates 33.0% 36.0% 38.0%
Increase (decrease) in taxes resulting from:
Difference in foreign subsidiaries tax rates (0.9) (2.1) (3.0)
Change in the valuation allowance (1.3) (6.3) (6.4)
Permanently non-deductible expenses 2.0 0.9 2.1
Tax credit (2.9) (1.3) (1.2)
Tax rate change 2.6 2.7 0.9
Impairment losses of goodwill 7.9
Other – net 0.6 0.4 0.9
Effective income tax rates 41.0% 30.3% 31.3%
93Nipponham Group Annual Report 2016

The approximate effects of temporary differences, net operating loss and tax credit carryforwards that gave rise to deferred tax balances at
March 31, 2016 and 2015 were as follows:
The net changes in the total valuation allowance for the years
ended March 31, 2016 and 2015 were a decrease of ¥916 million
($8,106 thousand) and a decrease of ¥3,275 million, respectively.
At March 31, 2016, the net operating loss carryforwards of
the Group for corporate income tax and local income tax
purposes amounted to ¥8,687 million ($76,876 thousand) and
¥14,339 million ($126,894 thousand), respectively. The net
operating loss carryforwards for corporate income tax and local
income tax purposes subject to expiration in the period from 2017
to 2021 are ¥992 million ($8,779 thousand) and ¥1,418 million
($12,549 thousand), respectively. The remaining balances for
corporate income tax and local income tax purposes, ¥7,695
million ($68,097 thousand) and ¥12,921 million ($114,345 thou-
sand), respectively, will expire in years beyond 2021 or have an
indefinite carryforward period. At March 31, 2016, the Group also
had tax credit carryforwards of ¥417 million ($3,690 thousand), of
which ¥330 million ($2,920 thousand) will expire within five years
while the remaining ¥87 million ($770 thousand) will expire beyond
2021 or have an indefinite carryforward period.
The portion of the undistributed earnings of foreign subsidiaries
which is deemed to be permanently invested amounted to
¥32,226 million ($285,186 thousand) at March 31, 2016.
Provisions are not made for taxes on undistributed earnings and
cumulative translation adjustments of foreign subsidiaries whose
earnings are deemed to be permanently invested.
The Group recognizes tax-related interest and penalties in
income taxes in the consolidated statements of income. Total
amounts of tax-related interest and penalties recognized in the
consolidated statements of income for the years ended March 31,
2016, 2015 and 2014 were not significant.
The Group files income tax returns in Japan and various
foreign tax jurisdictions. NH Foods Ltd. and its major domestic
subsidiaries are no longer subject to, with limited exception,
income tax examinations by tax authorities for years ended on or
before March 31, 2013. Major subsidiaries in the United States,
Australia and other foreign countries are no longer subject to, with
limited exception, income tax examinations by tax authorities for
years ended on or before March 31, 2010.
9. RETIREMENT AND SEVERANCE PROGRAMS
NH Foods Ltd. has a contributory pension plan and a lump-sum
severance indemnities plan to establish a formula for determining
benefits including “point-based benefits system” under which
benefits are calculated based on accumulated points allocated to
employees each year according to their job classification, perfor-
mance and years of service. Market-related interest is added to
the benefit of the contributory pension plan. The pension plans
provide for annuity payments for the periods of 10 to 20 years
commencing with mandatory retirement. NH Foods Ltd. also
introduced a defined contribution pension plan. Certain of NH
Foods Ltd.’s subsidiaries have defined benefit pension plans,
lump-sum severance plans and defined contribution plans.
Assumptions used for those plans were generally the same as
those used for NH Foods Ltd.’s plans.
Millions of YenThousands of U.S. Dollars
2016 2015 2016
Deferred tax assets:
Inventories ¥ 71 ¥ 346 $ 628
Certain accrued prefectural income taxes 657 765 5,814
Accrued bonuses 2,931 3,073 25,938
Liability under retirement and severance programs 7,171 5,589 63,460
Fixed assets 3,891 3,417 34,434
Other temporary differences 3,288 3,292 29,098
Net operating loss and tax credit carryforwards 3,756 4,517 33,239
Total 21,765 20,999 192,611Less valuation allowance (4,361) (5,277) (38,593)
Total deferred tax assets 17,404 15,722 154,018
Deferred tax liabilities:
Securities (2,082) (2,430) (18,425)
Inventories (1,431) (1,119) (12,664)
Investments in subsidiaries (2,161) (2,177) (19,124)
Fixed assets (393) (278) (3,478)
Other temporary differences (191) (10) (1,690)
Total deferred tax liabilities (6,258) (6,014) (55,381)
Net deferred tax assets ¥11,146 ¥ 9,708 $ 98,637
Financial Section
94 Nipponham Group Annual Report 2016

The Group recognized the defined contribution cost of ¥1,800 million ($15,929 thousand), ¥1,760 million and ¥1,629 million for the years
ended March 31, 2016, 2015 and 2014, respectively.
Net periodic benefit cost under the Group’s retirement and severance programs for the years ended March 31, 2016, 2015 and 2014
included the following components:
Millions of YenThousands of U.S. Dollars
2016 2015 2014 2016
Service cost ¥2,734 ¥2,632 ¥2,624 $24,195Interest cost 329 457 455 2,912Expected return on plan assets (808) (584) (527) (7,150)Amortization of prior service credit (160) (272) (303) (1,416)Recognized actuarial loss 372 623 959 3,292Settlement loss 79 25 291 699Net periodic benefit cost ¥2,546 ¥2,881 ¥3,499 $22,532
The following table sets forth various information about the Group’s plans as of March 31, 2016 and 2015:
Millions of YenThousands of U.S. Dollars
2016 2015 2016
Change in the projected benefit obligations:
Projected benefit obligations at the beginning of the year ¥ 53,938 ¥52,384 $ 477,327Service cost 2,734 2,632 24,195Interest cost 329 457 2,912Actuarial loss 3,273 1,749 28,965Benefits paid:
Settlement paid (1,534) (1,774) (13,575)Others (1,445) (1,510) (12,788)
Business combinations 77 681Projected benefit obligations at the end of the year 57,372 53,938 507,717
Change in fair value of plan assets:
Fair value of plan assets at the beginning of the year 47,479 41,870 420,168Actual gain (loss) on plan assets (2,213) 5,578 (19,584)Employer contribution 1,737 1,777 15,372Benefits paid:
Settlement paid (177) (236) (1,566)Others (1,445) (1,510) (12,788)
Fair value of plan assets at the end of the year 45,381 47,479 401,602Funded status at the end of the year ¥(11,991) ¥ (6,459) $(106,115)
Amounts recognized by the Group in the consolidated balance sheets at March 31, 2016 and 2015 consisted of:
Millions of YenThousands of U.S. Dollars
2016 2015 2016
Prepaid benefit cost ¥ 2,358 ¥ 5,595 $ 20,867Accrued expenses (566) (581) (5,009)Accrued benefit liability (13,783) (11,473) (121,973)
¥(11,991) ¥ (6,459) $(106,115)
Amounts recognized by the Group in accumulated other comprehensive loss at March 31, 2016 and 2015 consisted of:
Millions of YenThousands of U.S. Dollars
2016 2015 2016
Actuarial loss ¥13,317 ¥ 7,474 $117,850Prior service credit (1,029) (1,189) (9,106)
¥12,288 ¥ 6,285 $108,744
95Nipponham Group Annual Report 2016

The Group’s accumulated benefit obligations for defined benefit plans at March 31, 2016 and 2015 were as follows:
Millions of YenThousands of U.S. Dollars
2016 2015 2016
Accumulated benefit obligations ¥57,372 ¥53,938 $507,717
The projected benefit obligations and the fair value of the plan assets for the Group’s pension plans with projected benefit obligations in
excess of plan assets, and the accumulated benefit obligations and the fair value of the plan assets for the Group’s pension plans with
accumulated benefit obligations in excess of plan assets were as follows:
Millions of YenThousands of U.S. Dollars
2016 2015 2016
Plans with projected benefit obligations in excess of plan assets:
Projected benefit obligations ¥28,725 ¥13,592 $254,203
Fair value of plan assets 14,376 1,538 127,221
Plans with accumulated benefit obligations in excess of plan assets:
Accumulated benefit obligations 28,725 13,592 254,203
Fair value of plan assets 14,376 1,538 127,221
Amounts recognized by the Group in the other comprehensive income and reclassification adjustments of the other comprehensive income
(loss) for the years ended March 31, 2016, 2015 and 2014 were as follows:
Millions of YenThousands of U.S. Dollars
2016 2015 2014 2016
Current year actuarial (gain) loss ¥6,294 ¥(3,287) ¥(3,750) $55,699
Current year prior service cost 42
Recognition of actuarial loss (451) (648) (1,250) (3,991)
Amortization of prior service credit 160 272 303 1,416
The estimated prior service credit and actuarial loss for the
Group’s defined benefit pension plans that will be amortized from
accumulated other comprehensive loss into net periodic benefit
cost over the next year are summarized as follows:
Millions of YenThousands of U.S. Dollars
Prior service credit ¥(192) $(1,699) Actuarial loss 660 5,841
Assumptions
Weighted-average assumptions used to determine the Group’s
benefit obligations at March 31, 2016 and 2015 were as follows:
2016 2015
Discount rate 0.1% 0.6%
Weighted-average assumptions used to determine the Group’s
net periodic benefit cost for the years ended March 31, 2016,
2015 and 2014 were as follows:
2016 2015 2014Discount rate 0.6% 0.9% 0.9%Expected long-term rate of return on plan assets 2.7% 2.1% 2.0%
NH Foods Ltd. has a contributory pension plan and a lump-sum
severance indemnities plan to establish a formula for determining
benefits including point-based benefits system. Accordingly, rate
of increase in future compensation levels was not used to deter-
mine net periodic benefit cost for the years ended March 31,
2016, 2015 and 2014.
NH Foods Ltd.’s expected long-term rate of return was
determined by estimating the future rate of return of each plan
asset considering actual historical returns.
Assumptions used for plans of NH Foods Ltd.’s subsidiaries
were generally the same as those used for NH Foods Ltd.’s plans.
Plan Assets
The Group’s fundamental policy for the investment of plan assets
is to secure the necessary profit on a long-term basis to enable
the Group to fund the payments for future pension benefits to
eligible participants. Plan assets are allocated in accordance with
the plan assets allocation policy, which is established for the
purpose of achieving a stable rate of return on a medium- to long-
term basis, by taking into account the expected rate of return on
each plan asset, a standard deviation and a correlation coeffi-
cient. The variance between expected long-term return and actual
return on invested plan assets is evaluated on an annual basis.
The plan assets allocation policy is revised, when considered
necessary, to achieve the expected long-term rate of return.
The Group’s portfolio consists of four major components:
approximately 37% is invested in equity securities, approximately
20% is invested in debt securities, approximately 20% is invested
in life insurance company general accounts, and approximately
23% is invested in mutual funds and other investment vehicles.
The equity securities consist primarily of stocks that are listed
on the stock exchanges. The Group investigates the business
condition of the investee companies and appropriately diversifies
investments by industry types and other relevant factors. The
Financial Section
96 Nipponham Group Annual Report 2016
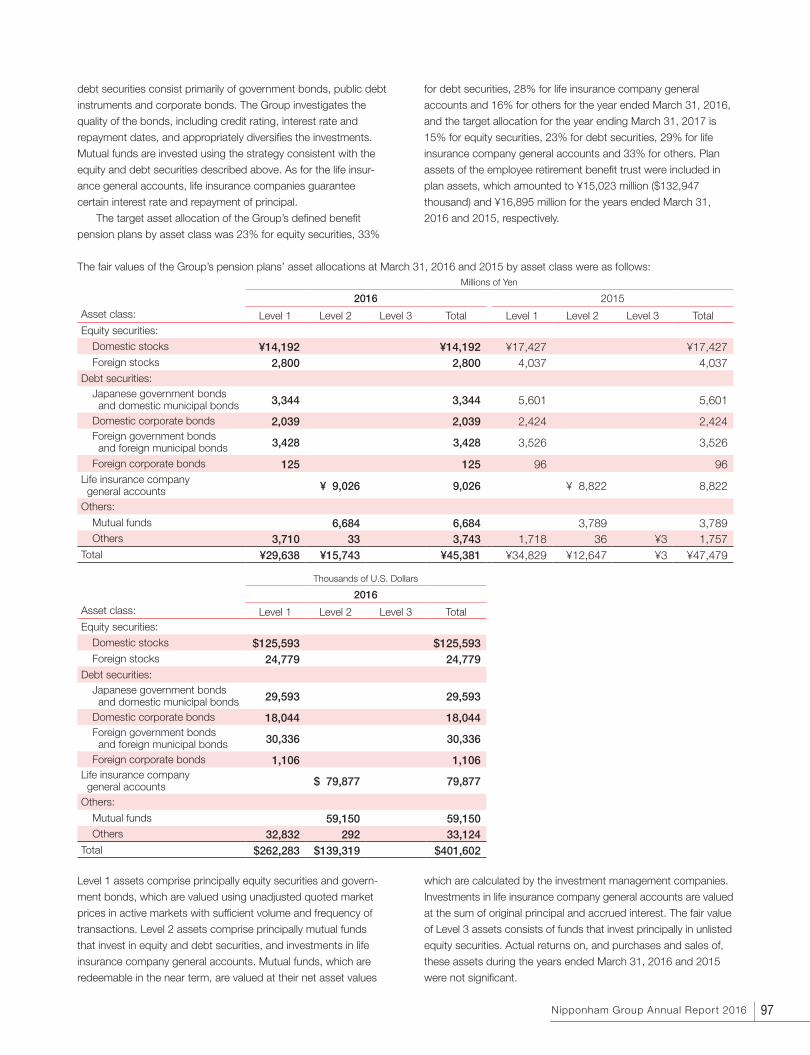
debt securities consist primarily of government bonds, public debt
instruments and corporate bonds. The Group investigates the
quality of the bonds, including credit rating, interest rate and
repayment dates, and appropriately diversifies the investments.
Mutual funds are invested using the strategy consistent with the
equity and debt securities described above. As for the life insur-
ance general accounts, life insurance companies guarantee
certain interest rate and repayment of principal.
The target asset allocation of the Group’s defined benefit
pension plans by asset class was 23% for equity securities, 33%
for debt securities, 28% for life insurance company general
accounts and 16% for others for the year ended March 31, 2016,
and the target allocation for the year ending March 31, 2017 is
15% for equity securities, 23% for debt securities, 29% for life
insurance company general accounts and 33% for others. Plan
assets of the employee retirement benefit trust were included in
plan assets, which amounted to ¥15,023 million ($132,947
thousand) and ¥16,895 million for the years ended March 31,
2016 and 2015, respectively.
The fair values of the Group’s pension plans’ asset allocations at March 31, 2016 and 2015 by asset class were as follows:Millions of Yen
2016 2015Asset class: Level 1 Level 2 Level 3 Total Level 1 Level 2 Level 3 TotalEquity securities:
Domestic stocks ¥14,192 ¥14,192 ¥17,427 ¥17,427Foreign stocks 2,800 2,800 4,037 4,037
Debt securities:Japanese government bonds and domestic municipal bonds 3,344 3,344 5,601 5,601
Domestic corporate bonds 2,039 2,039 2,424 2,424Foreign government bonds and foreign municipal bonds 3,428 3,428 3,526 3,526
Foreign corporate bonds 125 125 96 96Life insurance company general accounts ¥ 9,026 9,026 ¥ 8,822 8,822
Others:
Mutual funds 6,684 6,684 3,789 3,789Others 3,710 33 3,743 1,718 36 ¥3 1,757
Total ¥29,638 ¥15,743 ¥45,381 ¥34,829 ¥12,647 ¥3 ¥47,479
Thousands of U.S. Dollars
2016
Asset class: Level 1 Level 2 Level 3 TotalEquity securities:
Domestic stocks $125,593 $125,593Foreign stocks 24,779 24,779
Debt securities:Japanese government bonds and domestic municipal bonds 29,593 29,593
Domestic corporate bonds 18,044 18,044Foreign government bonds and foreign municipal bonds 30,336 30,336
Foreign corporate bonds 1,106 1,106Life insurance company general accounts $ 79,877 79,877
Others:
Mutual funds 59,150 59,150Others 32,832 292 33,124
Total $262,283 $139,319 $401,602
Level 1 assets comprise principally equity securities and govern-
ment bonds, which are valued using unadjusted quoted market
prices in active markets with sufficient volume and frequency of
transactions. Level 2 assets comprise principally mutual funds
that invest in equity and debt securities, and investments in life
insurance company general accounts. Mutual funds, which are
redeemable in the near term, are valued at their net asset values
which are calculated by the investment management companies.
Investments in life insurance company general accounts are valued
at the sum of original principal and accrued interest. The fair value
of Level 3 assets consists of funds that invest principally in unlisted
equity securities. Actual returns on, and purchases and sales of,
these assets during the years ended March 31, 2016 and 2015
were not significant.
97Nipponham Group Annual Report 2016

Contributions
The Group expects to contribute ¥1,779 million ($15,743 thou-
sand) to the defined benefit pension plans in the year ending
March 31, 2017.
Estimated Future Benefit Payments
The following benefit payments, which reflect expected future
services, as appropriate, are expected to be made by the Group:
Year Ending March 31: Millions of YenThousands of U.S. Dollars
2017 ¥ 2,585 $ 22,8762018 2,684 23,7522019 2,700 23,8942020 2,829 25,0352021 2,709 23,9732022—2026 16,399 145,124
Certain domestic subsidiaries participate in multiemployer plans. This disclosure uses the most recently available information:
The risks of participating in these multiemployer plans are different
from single-employer plans primarily in the following aspects:
• Assets contributed to the multiemployer plan by one employer
may be used to provide benefits to employees of other partici-
pating employers.
• If a participating employer stops contributing to the multiemployer
plan, the unfunded obligations of the multiemployer plan may be
borne by the remaining participating employers.
• If the Group chooses to stop participating in some of those
multiemployer plans, the Group may be required to pay those
plans an amount based on the underfunded status of the
multiemployer plan, referred to as a withdrawal liability.
Plan information for Japan Ham & Sausage Processors
Pension Fund is not publicly available. This fund provides monthly
retirement payments on the basis of the contributions earned by
the participating employees. To the extent that the plan is under-
funded, the future contributions to the plan may increase.
This fund’s financial statements for the year ended February
29, 2016 indicated pension plan assets of ¥27,168 million
($240,425 thousand); underfunded amounts of ¥309 million
($2,735 thousand); and total contributions of all participating
employers of ¥2,114 million ($18,708 thousand).
This fund’s financial statements for the year ended March 31,
2014 indicated pension plan assets of ¥26,273 million; under-
funded amounts of ¥18,065 million; and total contributions of all
participating employers of ¥2,138 million.
Japan Ham & Sausage Processors Pension Fund resolved a
special dissolution of the plan at a conference of representatives
on March 24, 2016 based on Act of Partial Revision of Pension of
the Employees’ Pension Insurance Act which was promulgated on
June 26, 2013. As of March 31, 2016, it was in the process of
application for approval of dissolution. The Group does not expect
that there are costs borne by participating employers associated
with this dissolution.
Plan information for Japan Nationwide Dainty Pension Fund is
not publicly available. This fund provides monthly retirement
payments on the basis of the contributions earned by the partici-
pating employees. To the extent that the plan is underfunded, the
future contributions to the plan may increase.
This fund’s financial statements for the year ended March 31,
2014 indicated pension plan assets of ¥13,933 million; overfunded
amounts of ¥476 million; and total contributions of all participating
employers of ¥1,183 million.
Japan Nationwide Dainty Pension Fund resolved a dissolution
of the plan at a conference of representatives on July 16, 2015,
and dissolved as a result of approval from the Minister of Health,
Labour and Welfare. The Group does not expect that there are
costs borne by participating employers associated with this
dissolution.
Pension Fund:
Year Contributions to Plan Exceeded More Than 5 Percent of Total Contributions (as of March 31 of the Plan’s Year-End)
Japan Ham & Sausage Processors Pension Fund 2015 and 2014
Nationwide Dainty Pension Fund 2015 and 2014
Additionally, the Group provided for directors’ retirement allow-
ances of ¥643 million ($5,691 thousand) and ¥602 million at
March 31, 2016 and 2015, respectively, based on the Group’s
internal regulations.
Contributions of NH Food Ltd.’s subsidiaries
Zone Status Millions of YenThousands of U.S. Dollars
Pension Fund: 2016 2015 2016 2015 2014 2016
Japan Ham & Sausage Processors Pension Fund
At least 80%(February 29, 2016)
Less than 65%(March 31, 2014) ¥245 ¥330 ¥317 $2,168
Nationwide Dainty Pension Fund
At least 80%(March 31, 2014) 34 214 235 301
Total ¥279 ¥544 ¥552 $2,469
Financial Section
98 Nipponham Group Annual Report 2016

10. STOCK-BASED COMPENSATION
On May 9, 2008, the Board of Directors resolved to abolish the stock option plan except for those stock options granted before March 31, 2008.
A summary of option activity under NH Foods Ltd.’s stock option plan at March 31, 2016 and changes during the year then ended were
as follows:
Shares Yen Years Millions of Yen U.S. DollarsThousands of U.S. Dollars
Number of Options Exercise Price
Average Remaining
Contractual LifeAggregate
Intrinsic Value Exercise PriceAggregate
Intrinsic Value
Outstanding at March 31, 2015 175,000 ¥1 $0
Exercised (7,000) 1 0
Outstanding at March 31, 2016 168,000 1 6.7 ¥416 0 $3,681
Exercisable at March 31, 2016 6,000 ¥1 0.7 ¥ 15 $0 $ 133
The total intrinsic values of options exercised during the years ended March 31, 2016, 2015 and 2014 were ¥17 million ($150 thousand), ¥86
million and ¥34 million, respectively.
Cash received from options exercised for the years ended March 31, 2016, 2015 and 2014 was immaterial.
11. EQUITY
Companies in Japan are subject to the Companies Act of Japan
(the “Companies Act”). The significant provisions in the Companies
Act that affect financial and accounting matters are summarized
below:
(a) Dividends
Under the Companies Act, companies in Japan can pay dividends
at any time during the fiscal year in addition to the year-end
dividend upon resolution at the shareholders meeting. For com-
panies in Japan that meet certain criteria such as: (1) having a
Board of Directors, (2) having independent auditors, (3) having an
Audit & Supervisory Board and (4) the term of service of the
directors is prescribed as one year rather than two years of
normal term by its articles of incorporation, the Board of Directors
of such company may declare dividends (except for dividends in
kind) at any time during the fiscal year if the company prescribed
so in its articles of incorporation. NH Foods Ltd. meets all the
above criteria.
The Companies Act permits companies in Japan to distribute
dividends-in-kind (non-cash assets) to shareholders subject to a
certain limitation and additional requirements.
Semiannual interim dividends may also be paid once a year
upon resolution by the Board of Directors if the articles of incorpo-
ration of the company so stipulate. The Companies Act provides
certain limitations on the amounts available for dividends or the
purchase of treasury stock. The limitation is defined as the
amount available for distribution to the shareholders, but the
amount of net assets after dividends must be maintained at no
less than ¥3 million.
The amount available for dividends under the Companies Act
is based on the amount recorded in NH Foods Ltd.’s nonconsoli-
dated books of accounts in accordance with Japanese accounting
practices. The amount available for dividends under the Companies
Act as of March 31, 2016 was ¥108,799 million ($962,823
thousand).
(b) Increases/decreases and transfer of common stock,
reserve and surplus
The Companies Act requires that an amount equal to 10% of
dividends must be appropriated as a legal reserve (a component
of retained earnings) or as additional paid-in capital (a component
of capital surplus) depending on the equity account charged upon
the payment of such dividends until the total of aggregate amount
of legal reserve and additional paid-in capital equals 25% of the
common stock. Under the Companies Act, additional paid-in
capital and legal reserve may be reversed upon resolution of the
shareholders. The Companies Act also provides that common
stock, legal reserve, additional paid-in capital, other capital surplus
and retained earnings can be transferred among the accounts
under certain conditions upon resolution of the shareholders.
(c) Treasury stock and treasury stock acquisition rights
The Companies Act also provides for companies in Japan to
purchase treasury stock and dispose of such treasury stock by
resolution of the Board of Directors. The amount of treasury stock
purchased cannot exceed the amount available for distribution to
the shareholders which is determined by specific formula.
On May 20, 1993, NH Foods Ltd. made a stock split by way of a
free share distribution at the rate of 0.1 shares for each outstanding
share, and 20,703,062 shares were issued to shareholders of
record on March 31, 1993, resulting in no change in the balance of
common stock or capital surplus. Corporations in the United States
issuing shares in similar transactions would be required to account
for them by reducing retained earnings and increasing appropriate
capital accounts by an amount equal to the fair value of the shares
issued. If such United States practice had been applied to the fiscal
1994 free share distribution made by NH Foods Ltd., capital surplus
would have increased by ¥33,746 million with a corresponding
decrease in unappropriated retained earnings.
99Nipponham Group Annual Report 2016
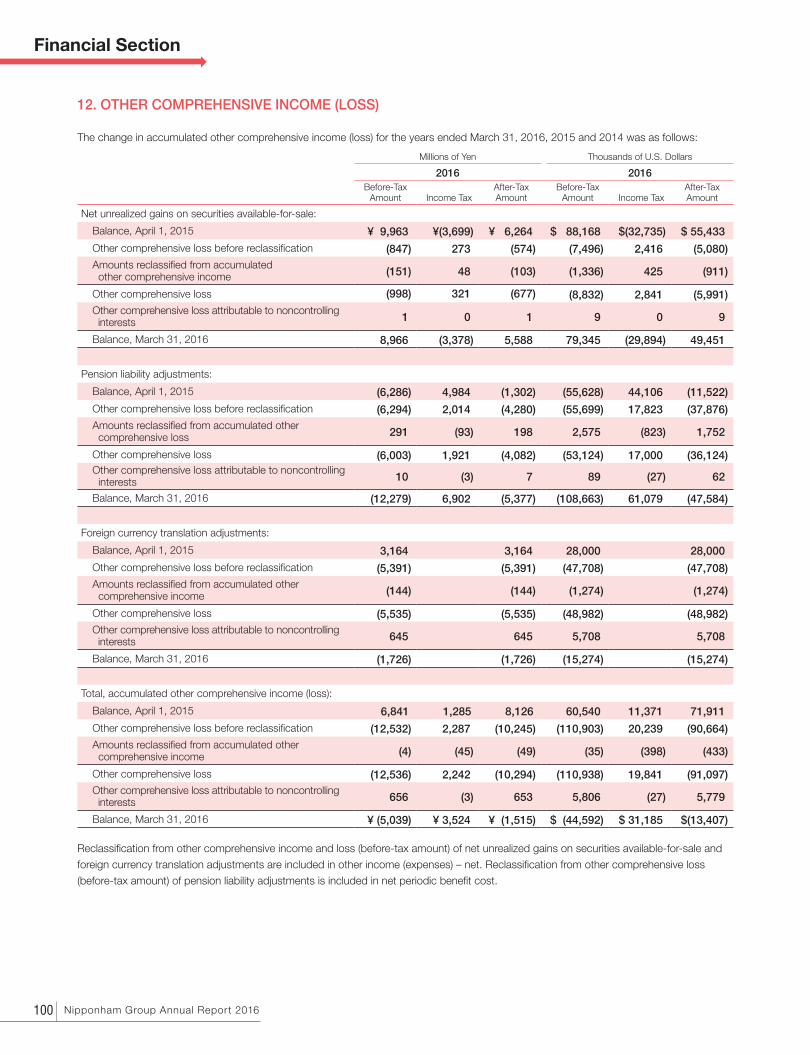
12. OTHER COMPREHENSIVE INCOME (LOSS)
The change in accumulated other comprehensive income (loss) for the years ended March 31, 2016, 2015 and 2014 was as follows:
Millions of Yen Thousands of U.S. Dollars
2016 2016
Before-Tax
Amount Income TaxAfter-TaxAmount
Before-TaxAmount Income Tax
After-TaxAmount
Net unrealized gains on securities available-for-sale:
Balance, April 1, 2015 ¥ 9,963 ¥(3,699) ¥ 6,264 $ 88,168 $(32,735) $ 55,433Other comprehensive loss before reclassification (847) 273 (574) (7,496) 2,416 (5,080)Amounts reclassified from accumulated other comprehensive income (151) 48 (103) (1,336) 425 (911)
Other comprehensive loss (998) 321 (677) (8,832) 2,841 (5,991)Other comprehensive loss attributable to noncontrolling interests 1 0 1 9 0 9
Balance, March 31, 2016 8,966 (3,378) 5,588 79,345 (29,894) 49,451
Pension liability adjustments:
Balance, April 1, 2015 (6,286) 4,984 (1,302) (55,628) 44,106 (11,522)Other comprehensive loss before reclassification (6,294) 2,014 (4,280) (55,699) 17,823 (37,876)Amounts reclassified from accumulated other comprehensive loss 291 (93) 198 2,575 (823) 1,752
Other comprehensive loss (6,003) 1,921 (4,082) (53,124) 17,000 (36,124)Other comprehensive loss attributable to noncontrolling interests 10 (3) 7 89 (27) 62
Balance, March 31, 2016 (12,279) 6,902 (5,377) (108,663) 61,079 (47,584)
Foreign currency translation adjustments:
Balance, April 1, 2015 3,164 3,164 28,000 28,000Other comprehensive loss before reclassification (5,391) (5,391) (47,708) (47,708)Amounts reclassified from accumulated other comprehensive income (144) (144) (1,274) (1,274)
Other comprehensive loss (5,535) (5,535) (48,982) (48,982)Other comprehensive loss attributable to noncontrolling interests 645 645 5,708 5,708
Balance, March 31, 2016 (1,726) (1,726) (15,274) (15,274)
Total, accumulated other comprehensive income (loss):
Balance, April 1, 2015 6,841 1,285 8,126 60,540 11,371 71,911Other comprehensive loss before reclassification (12,532) 2,287 (10,245) (110,903) 20,239 (90,664)Amounts reclassified from accumulated other comprehensive income (4) (45) (49) (35) (398) (433)
Other comprehensive loss (12,536) 2,242 (10,294) (110,938) 19,841 (91,097)Other comprehensive loss attributable to noncontrolling interests 656 (3) 653 5,806 (27) 5,779
Balance, March 31, 2016 ¥ (5,039) ¥ 3,524 ¥ (1,515) $ (44,592) $ 31,185 $(13,407)
Reclassification from other comprehensive income and loss (before-tax amount) of net unrealized gains on securities available-for-sale and
foreign currency translation adjustments are included in other income (expenses) – net. Reclassification from other comprehensive loss
(before-tax amount) of pension liability adjustments is included in net periodic benefit cost.
Financial Section
100 Nipponham Group Annual Report 2016

Millions of Yen
2015
Before-Tax
Amount Income TaxAfter-TaxAmount
Net unrealized gains on securities available-for-sale:
Balance, April 1, 2014 ¥ 6,584 ¥(2,482) ¥ 4,102Other comprehensive income before reclassification 4,133 (1,489) 2,644Amounts reclassified from accumulated other comprehensive income (754) 272 (482)
Other comprehensive income 3,379 (1,217) 2,162Other comprehensive income attributable to noncontrolling interests 0 0 0
Balance, March 31, 2015 9,963 (3,699) 6,264
Pension liability adjustments:
Balance, April 1, 2014 (9,909) 6,288 (3,621)Other comprehensive income before reclassification 3,245 (1,168) 2,077Amounts reclassified from accumulated other comprehensive loss 376 (135) 241
Other comprehensive income 3,621 (1,303) 2,318Other comprehensive income attributable to noncontrolling interests 2 (1) 1
Balance, March 31, 2015 (6,286) 4,984 (1,302)
Foreign currency translation adjustments:
Balance, April 1, 2014 (1,545) (1,545)Other comprehensive income before reclassification 4,776 4,776Amounts reclassified from accumulated other comprehensive loss 2 2
Other comprehensive income 4,778 4,778Other comprehensive income attributable to noncontrolling interests (69) (69)
Balance, March 31, 2015 3,164 3,164
Total, accumulated other comprehensive income (loss):
Balance, April 1, 2014 (4,870) 3,806 (1,064)Other comprehensive income before reclassification 12,154 (2,657) 9,497Amounts reclassified from accumulated other comprehensive loss (376) 137 (239)
Other comprehensive income 11,778 (2,520) 9,258Other comprehensive income attributable to noncontrolling interests (67) (1) (68)
Balance, March 31, 2015 ¥ 6,841 ¥ 1,285 ¥ 8,126
101Nipponham Group Annual Report 2016

Millions of Yen
2014
Before-Tax
Amount Income TaxAfter-TaxAmount
Net unrealized gains on securities available-for-sale:
Balance, April 1, 2013 ¥ 5,823 ¥(2,207) ¥ 3,616Other comprehensive income before reclassification 807 (291) 516Amounts reclassified from accumulated other comprehensive income (46) 16 (30)
Other comprehensive income 761 (275) 486Other comprehensive income attributable to noncontrolling interests 0 0 0
Balance, March 31, 2014 6,584 (2,482) 4,102
Pension liability adjustments:
Balance, April 1, 2013 (14,603) 7,978 (6,625)Other comprehensive income before reclassification 3,750 (1,350) 2,400Amounts reclassified from accumulated other comprehensive loss 947 (341) 606
Other comprehensive income 4,697 (1,691) 3,006Other comprehensive income attributable to noncontrolling interests (3) 1 (2)
Balance, March 31, 2014 (9,909) 6,288 (3,621)
Foreign currency translation adjustments:
Balance, April 1, 2013 (5,764) (5,764)Other comprehensive income before reclassification 4,077 4,077Amounts reclassified from accumulated other comprehensive loss 360 360
Other comprehensive income 4,437 4,437Other comprehensive income attributable to noncontrolling interests (218) (218)
Balance, March 31, 2014 (1,545) (1,545)
Total, accumulated other comprehensive loss:
Balance, April 1, 2013 (14,544) 5,771 (8,773)Other comprehensive income before reclassification 8,634 (1,641) 6,993Amounts reclassified from accumulated other comprehensive loss 1,261 (325) 936
Other comprehensive income 9,895 (1,966) 7,929Other comprehensive income attributable to noncontrolling interests (221) 1 (220)
Balance, March 31, 2014 ¥ (4,870) ¥ 3,806 ¥(1,064)
Financial Section
102 Nipponham Group Annual Report 2016

13. LEASED ASSETS AND RENT EXPENSE
The Group leases certain buildings, machinery and equipment under capital leases. The amounts of these leased assets included in the
consolidated balance sheets at March 31, 2016 and 2015 were as follows:
Millions of YenThousands of U.S. Dollars
2016 2015 2016
Buildings ¥ 6,999 ¥ 5,300 $ 61,938
Machinery and equipment 15,851 14,693 140,274
Total 22,850 19,993 202,212
Less accumulated depreciation (12,247) (11,185) (108,381)
Total ¥10,603 ¥ 8,808 $ 93,831
The following is a schedule of the future minimum lease payments
under capital leases together with the present value of net mini-
mum lease payments which are included in the consolidated
balance sheet at March 31, 2016:
Year Ending March 31: Millions of YenThousands of U.S. Dollars
2017 ¥ 2,944 $ 26,0532018 2,188 19,3632019 1,801 15,9382020 1,360 12,0352021 817 7,230Thereafter 2,413 21,355Total minimum lease payments 11,523 101,974Less amount representing interest (659) (5,832)Present value of net minimum lease payments 10,864 96,142
Less current capital lease obligations (2,839) (25,124)Long-term capital lease obligations ¥ 8,025 $ 71,018
The Group also leases office space, employee housing and office
equipment under operating leases. Rent expense under these
leases amounted to ¥10,514 million ($93,044 thousand), ¥10,177
million and ¥10,264 million for the years ended March 31, 2016,
2015 and 2014, respectively.
Future minimum lease payments under non-cancelable
operating leases as of March 31, 2016 are as follows:
Year Ending March 31: Millions of YenThousands of U.S. Dollars
2017 ¥1,438 $12,7262018 790 6,9912019 574 5,0802020 504 4,4602021 477 4,221Thereafter 2,472 21,876Total minimum lease payments ¥6,255 $55,354
14. FOREIGN CURRENCY TRANSACTION GAINS AND LOSSES
Foreign currency transaction net loss of ¥468 million ($4,142 thousand), net loss of ¥7,952 million and net loss of ¥3,773 million were
included in the determination of net income for the years ended March 31, 2016, 2015 and 2014, respectively.
103Nipponham Group Annual Report 2016

15. FAIR VALUE MEASUREMENTS
ASC Topic 820 clarifies fair value in terms of the price in an orderly transaction between market participants to sell an asset or transfer a
liability at the measurement date. ASC Topic 820 establishes a three-level fair value hierarchy that prioritizes the inputs used to measure fair
value. Under ASC Topic 820, the Group is required to classify certain assets and liabilities based on the following fair value hierarchy:
Level 1 Input — Quoted prices in active markets for identical assets or liabilities that are accessible at the measurement date
Level 2 Input — Inputs other than quoted prices included within Level 1 that are observable for the assets or liabilities, either directly or
indirectly
Level 3 Input — Unobservable inputs for the assets or liabilities
Assets and liabilities measured at fair value on a recurring basis as of March 31, 2016 and 2015 were as follows:
Millions of Yen
2016 2015
Assets: Level 1 Level 2 Level 3 Total Level 1 Level 2 Level 3 TotalDomestic stocks:
Retail industry ¥ 9,476 ¥ 9,476 ¥ 9,468 ¥ 9,468Others 10,671 10,671 9,788 9,788
Mutual funds ¥ 250 250 ¥ 250 250Derivative instruments (see Note 16) 1,502 1,502 2,928 2,928
Total assets ¥20,147 ¥1,752 ¥21,899 ¥19,256 ¥3,178 ¥22,434
Millions of Yen
2016 2015
Liabilities: Level 1 Level 2 Level 3 Total Level 1 Level 2 Level 3 TotalDerivative instruments (see Note 16) ¥74 ¥2,855 ¥2,929 ¥520 ¥520
Total liabilities ¥74 ¥2,855 ¥2,929 ¥520 ¥520
Thousands of U.S. Dollars
2016
Assets: Level 1 Level 2 Level 3 TotalDomestic stocks:
Retail industry $ 83,859 $ 83,859Others 94,433 94,433
Mutual funds $ 2,212 2,212Derivative instruments (see Note 16) 13,292 13,292
Total assets $178,292 $15,504 $193,796
Thousands of U.S. Dollars
2016Liabilities: Level 1 Level 2 Level 3 Total
Derivative instruments (see Note 16) $655 $25,265 $25,920Total liabilities $655 $25,265 $25,920
Valuation processes and techniques used to measure fair value are as follows:
Domestic stocks
Domestic stocks are measured at fair value using quoted prices in active markets for identical assets. These inputs fall within Level 1.
Mutual funds
Mutual funds are measured using observable inputs, such as published prices based on market trends obtained from financial institutions,
and classified as Level 2.
Derivative instruments
Derivative instruments consist of commodity futures contracts, foreign currency forward exchange contracts, interest rate swap contracts,
and cross-currency swap contracts. Commodity futures contracts are measured at fair value using quoted prices in active markets for
identical assets. These inputs fall within Level 1. Foreign currency forward exchange contracts, interest rate swap contracts, and cross-
currency swap contracts are measured at fair value using discounted cash flow model matched to the contractual terms with observable
market data such as forward exchange rates and market interest rates, which fall within Level 2.
Financial Section
104 Nipponham Group Annual Report 2016

The table below shows assets measured at fair value on a nonrecurring basis during the years ended March 31, 2016 and 2015, of which
¥157 million ($1,389 thousand) and ¥23 million have already been sold to a third party for the years ended March 31, 2016 and 2015,
respectively:
Millions of Yen
2016
Level 1 Level 2 Level 3 TotalNon-marketable equity securities ¥ 0 ¥ 0Long-lived assets 651 651Goodwill 0 0
Millions of Yen
2015
Level 1 Level 2 Level 3 TotalNon-marketable equity securities ¥ 10 ¥ 10Long-lived assets 548 548
Thousands of U.S. Dollars
2016
Level 1 Level 2 Level 3 TotalNon-marketable equity securities $ 0 $ 0Long-lived assets 5,761 5,761Goodwill 0 0
Valuation processes and techniques used to measure fair value are as follows:
Non-marketable equity securities
In accordance with ASC Topic 320, “Investments – Debt and Equity Securities,” the Group recognized impairment losses of non-marketable
equity securities when their fair values were below the carrying amounts and the decline in fair values was considered to be other than tempo-
rary. These non-marketable equity securities were measured at fair value using unobservable inputs based mainly on the valuation by the
cost approach, which fell within Level 3.
Long-lived assets
In accordance with ASC Topic 360, the Group recognized impairment losses on long-lived assets when the carrying amounts of the assets
were considered to be unrecoverable. These long-lived assets were measured at fair value using unobservable inputs such as future expected
cash flows and the prices calculated based upon market data for comparable assets, which fell within Level 3.
Goodwill
In accordance with ASC Topic 350, the Group recognized impairment losses on goodwill when the carrying amounts of the assets were
considered to be unrecoverable. Goodwill was measured at fair value using unobservable inputs included in discounted cash flow model,
which fell within Level 3.
The carrying amounts and fair values of financial instruments at March 31, 2016 and 2015 were as follows:
Millions of Yen Thousands of U.S. Dollars
2016 2015 2016
Carrying Amount Fair Value
Carrying Amount Fair Value
Carrying Amount Fair Value
Available-for-sale securities and held-to-maturity securities (see Note 3) ¥ 20,397 ¥ 20,397 ¥ 19,696 ¥ 19,696 $ 180,504 $ 180,504
Derivative instruments:
Assets 1,502 1,502 2,928 2,928 13,292 13,292Liabilities (2,929) (2,929) (520) (520) (25,921) (25,921)
Long-term debt (102,368) (104,241) (83,843) (85,173) (905,911) (922,487)
The carrying values of all other financial instruments approximate
their estimated fair values. The fair values of long-term debt are
estimated using quoted market prices for identical debt or present
values of cash flows using borrowing rates currently available to
NH Foods Ltd. for bank loans with similar terms, which fall within
Level 2.
The Group does not have any significant concentration of
business transacted with an individual counter-party or groups of
counter-parties that could severely impact their operations.
105Nipponham Group Annual Report 2016

16. DERIVATIVE INSTRUMENTS AND HEDGING ACTIVITIES
The Group is exposed to certain risks relating to their ongoing
business operations. The primary risks managed by using
derivative instruments are foreign currency forward exchange rate
risk (principally in U.S. dollars), interest rate risk and commodity
price risk. The Group uses foreign currency forward exchange
contracts, currency swap contracts, currency option contracts
and cross-currency swap contracts to mitigate foreign currency
forward exchange rate risk. NH Foods Ltd. uses interest rate
swap contracts and cross-currency swap contracts to mitigate
interest rate risk relating to floating-rate borrowing. Commodity
futures contracts are entered into to mitigate commodity price risk.
The Group documents its risk management objectives and
strategies for undertaking hedge transactions. All derivative
financial instruments are entered into under these objectives and
strategies and related rules which regulate transactions.
ASC Topic 815 requires the Group to recognize all derivative
instruments as either assets or liabilities at fair value in the
statement of financial position. In accordance with ASC Topic
815, the Group designates certain foreign currency forward
exchange contracts as cash flow hedges of forecasted transac-
tions and designates interest rate swap contracts as cash flow
hedges of future interest payments.
Derivative instruments which do not qualify for hedge accounting
These derivative instruments are used to mitigate foreign currency forward exchange rate risk, interest rate risk and commodity index risk.
The changes in fair value of such derivative instruments are recorded in earnings immediately.
At March 31, 2016 and 2015, contract amounts or notional principal amounts of derivative instruments that do not qualify for hedge
accounting are set forth below:
Millions of YenThousands of U.S. Dollars
2016 2015 2016
Interest rate swap contracts ¥ 3,000 ¥12,586 $ 26,549
Foreign currency forward exchange contracts 75,954 50,417 672,159
Cross-currency swap contracts 2,000 2,000 17,699
Millions of Bushels
2016 2015
Commodity futures contracts (corn) 1.0
Millions of Pounds
2016 2015
Commodity futures contracts (hog) 24.8
The Group also has a policy that derivatives are not used for other than hedging activities.
As of March 31, 2016, the Group had no significant concentration of credit risk.
The Group’s derivative instruments contained no provisions that require the Group’s debt to maintain an investment grade credit rating
from each of the major credit rating agencies.
Financial Section
106 Nipponham Group Annual Report 2016

The location and fair value amounts of derivative instruments on the consolidated balance sheets were as follows:
Millions of Yen
2016Derivative assets Derivative liabilities
Balance Sheet Location Fair Value Balance Sheet Location Fair Value
Derivatives not designated as hedging instruments under ASC Topic 815:
Interest rate swap contracts Other current liabilities ¥ 153
Foreign currency forward exchange contracts Other current assets ¥ 577 Other current liabilities 2,702
Cross-currency swap contracts Other current assets 925
Commodity futures contracts Other current liabilities 74
Total (see Note 15) ¥1,502 ¥2,929
Millions of Yen
2015Derivative assets Derivative liabilities
Balance Sheet Location Fair Value Balance Sheet Location Fair Value
Derivatives not designated as hedging instruments under ASC Topic 815:
Interest rate swap contracts Other current liabilities ¥ 85
Foreign currency forward exchange contracts Other current assets ¥1,804 Other current liabilities 435
Cross-currency swap contracts Other current assets 17Other assets 1,107
Total (see Note 15) ¥2,928 ¥520
Thousands of U.S. Dollars
2016Derivative assets Derivative liabilities
Balance Sheet Location Fair Value Balance Sheet Location Fair Value
Derivatives not designated as hedging instruments under ASC Topic 815:
Interest rate swap contracts Other current liabilities $ 1,354
Foreign currency forward exchange contracts Other current assets $ 5,106 Other current liabilities 23,912
Cross-currency swap contracts Other current assets 8,186
Commodity futures contracts Other current liabilities 655
Total (see Note 15) $13,292 $25,921
107Nipponham Group Annual Report 2016

The effects of derivative instruments not designated or qualifying as hedging instruments under ASC Topic 815 on the consolidated
statements of income for the years ended March 31, 2016, 2015 and 2014 were as follows:
Millions of Yen Thousands of U.S. Dollars
Amount of Gain or (Loss) Recognized in Income on Derivative
Amount of Gain or (Loss) Recognized in Income on Derivative
Location 2016 2016
Interest rate swap contracts Interest expense ¥ (91) $ (805)
Foreign currency forward exchange contracts Net sales 583 5,159
Cost of goods sold (1,358) (12,018)
Cross-currency swap contracts Interest expense 11 97
Other income (expenses) – net (196) (1,735)
Commodity futures contracts Net sales (45) (398)
Cost of goods sold (46) (407)
Total ¥(1,142) $(10,107)
Millions of Yen
Amount of Gain or (Loss) Recognized in Income on Derivative
Location 2015
Interest rate swap contracts Interest expense ¥ (77)Foreign currency forward exchange contracts Net sales (578)
Cost of goods sold 10,697
Cross-currency swap contracts Interest expense 5
Other income (expenses) – net 449
Commodity futures contracts Net sales 514Cost of goods sold (2)
Total ¥11,008
Millions of Yen
Amount of Gain or (Loss) Recognized in Income on Derivative
Location 2014
Interest rate swap contracts Interest expense ¥ (25)Foreign currency forward exchange contracts and currency swap contracts Net sales 299
Cost of goods sold 5,824
Other income (expenses) – net 89
Cross-currency swap contracts Interest expense 24
Other income (expenses) – net 231Commodity futures contracts Cost of goods sold 156
Total ¥6,598
Financial Section
108 Nipponham Group Annual Report 2016

17. BUSINESS COMBINATION
On April 1, 2015, the Group acquired 60% of the outstanding shares of Ege-Tav and it became a subsidiary of the Group. By acquiring the
shares of Ege-Tav, the Group will respond to increasing demand for chicken meats in the Republic of Turkey and also generate a synergistic
effect with its own chicken business in the purpose of developing the Group's presence in Middle Eastern countries, rapidly growing emerging
markets as well as European countries.
The fair value of noncontrolling interests was measured based on the acquired cost deducting control premium. The fair value of the
consideration paid for the controlling interests of Ege-Tav and the noncontrolling interests as of the acquisition date was as follows:
Millions of YenThousands of U.S. Dollars
2016 2016
Fair value of consideration paid (cash) ¥ 8,638 $ 76,442
Fair value of noncontrolling interests 4,592 40,637
Total ¥13,230 $117,079
The Group measures Ege-Tav’s assets acquired and liabilities assumed based on their fair values in accordance with the ASC 805,
“Business Combinations.” The fair value amounts (the adjusted provisional amounts) allocated to assets acquired and liabilities assumed of
Ege-Tav were as follows:
Millions of YenThousands of U.S. Dollars
2016 2016
Cash and cash equivalents ¥ 75 $ 664
Trade notes and accounts receivable 1,527 13,513
Inventories 2,065 18,274
Property, plant and equipment 2,154 19,062
Intangible assets 2,736 24,212
Other assets 228 2,017
Current liabilities (2,166) (19,168)
Long-term liabilities (1,945) (17,212)
Total net assets acquired 4,674 41,362
Goodwill 8,556 75,717
Total ¥13,230 $117,079
Intangible assets of ¥2,231 million ($19,743 thousand) were subject to amortization, which include trade names with a 15 year useful life of
¥873 million ($7,726 thousand) and customer-related intangible assets with a 13 year useful life of ¥1,349 million ($11,938 thousand). An
intangible asset of ¥505 million ($4,469 thousand) was not subject to amortization and relates to poultry related licenses.
The goodwill accounted in connection with this acquisition was included in the Fresh Meats Business Division in Note 18 and was not
deductible for tax purposes.
109Nipponham Group Annual Report 2016

18. SEGMENT INFORMATION
ASC Topic 280, “Segment Reporting” requires a public business entity to report information about operating segments in financial
statements. Operating segments are defined as components of an entity about which separate financial information is available that is
evaluated regularly by the chief operating decision maker in deciding how to allocate resources and in assessing performance. The operating
segments are determined based on the nature of the products and services offered. The Group’s operating segments consist of the follow-
ing three business groups:
Processed Foods Business Division — Production and sales of mainly hams and sausages, and processed foods
Fresh Meats Business Division — Production and sales of mainly fresh meats
Affiliated Business Division — Production and sales of mainly marine products and dairy products
Intersegment transactions are made with reference to prevailing market prices.
The operating segment information at March 31, 2015 and 2014, and for the years then ended has been reclassified to conform to the
current year presentation.
The following table presents certain information regarding the Group’s operating segments at March 31, 2016, 2015 and 2014 and for
the years then ended:
Operating segment information
Millions of Yen
2016Processed
Foods Business Division
Fresh Meats Business Division
Affiliated Business Division Total
Eliminations, adjustments and others Consolidated
Net sales:
External customers ¥328,432 ¥776,008 ¥156,082 ¥1,260,522 ¥ (19,794) ¥1,240,728
Intersegment 28,149 101,326 3,289 132,764 (132,764)
Total 356,581 877,334 159,371 1,393,286 (152,558) 1,240,728
Operating expenses 352,527 837,674 157,090 1,347,291 (152,903) 1,194,388
Segment profit 4,054 39,660 2,281 45,995 345 46,340
Assets 182,186 393,346 68,877 644,409 38,446 682,855
Depreciation and amortization 6,530 9,036 1,648 17,214 2,231 19,445
Capital expenditures 10,040 15,297 7,121 32,458 4,341 36,799
Millions of Yen
2015Processed
Foods Business Division
Fresh Meats Business Division
Affiliated Business Division Total
Eliminations, adjustments and others Consolidated
Net sales:
External customers ¥333,942 ¥744,848 ¥152,198 ¥1,230,988 ¥ (18,186) ¥1,212,802
Intersegment 27,539 104,472 2,966 134,977 (134,977)
Total 361,481 849,320 155,164 1,365,965 (153,163) 1,212,802
Operating expenses 359,330 804,199 154,877 1,318,406 (154,048) 1,164,358
Segment profit 2,151 45,121 287 47,559 885 48,444
Assets 180,897 389,083 62,521 632,501 29,066 661,567
Depreciation and amortization 6,953 8,610 1,462 17,025 1,926 18,951
Capital expenditures 15,405 11,985 6,803 34,193 1,501 35,694
Financial Section
110 Nipponham Group Annual Report 2016

Millions of Yen
2014Processed
Foods Business Division
Fresh Meats Business Division
Affiliated Business Division Total
Eliminations, adjustments and others Consolidated
Net sales:
External customers ¥326,867 ¥666,975 ¥145,186 ¥1,139,028 ¥ (16,931) ¥1,122,097Intersegment 26,295 98,420 2,952 127,667 (127,667)
Total 353,162 765,395 148,138 1,266,695 (144,598) 1,122,097Operating expenses 346,619 738,642 147,140 1,232,401 (146,004) 1,086,397
Segment profit 6,543 26,753 998 34,294 1,406 35,700
Assets 170,374 347,248 54,915 572,537 54,683 627,220Depreciation and amortization 7,026 8,565 1,280 16,871 1,778 18,649Capital expenditures 14,784 8,920 3,893 27,597 1,555 29,152
Thousands of U.S. Dollars
2016Processed
Foods Business Division
Fresh Meats Business Division
Affiliated Business Division Total
Eliminations, adjustments and others Consolidated
Net sales:
External customers $2,906,478 $6,867,327 $1,381,257 $11,155,062 $ (175,168) $10,979,894
Intersegment 249,106 896,690 29,106 1,174,902 (1,174,902)
Total 3,155,584 7,764,017 1,410,363 12,329,964 (1,350,070) 10,979,894Operating expenses 3,119,708 7,413,044 1,390,177 11,922,929 (1,353,124) 10,569,805
Segment profit 35,876 350,973 20,186 407,035 3,054 410,089
Assets 1,612,265 3,480,938 609,531 5,702,734 340,229 6,042,963
Depreciation and amortization 57,788 79,965 14,584 152,337 19,743 172,080
Capital expenditures 88,850 135,372 63,018 287,240 38,415 325,655
1. “Eliminations, adjustments and others” includes unallocated items and intersegment eliminations.
2. Except for a few unallocated items, corporate overhead expenses and profit and loss of certain subsidiaries are allocated to each
reportable operating segment. These subsidiaries provide indirect services and operational support for the Group included in each
reportable operating segment.
3. Segment profit represents net sales less cost of goods sold and selling, general and administrative expenses.
4. Unallocated corporate assets included in “Eliminations, adjustments and others” mainly consist of cash and other investment securities of
NH Foods Ltd.
5. Depreciation and amortization consist of depreciation of property, plant and equipment and amortization of intangible assets.
Depreciation and amortization related to each reportable segment do not include those which are included in the corporate overhead
expenses and profit and loss of certain subsidiaries as describe in 2. above.
6. Capital expenditures represent the additions to property, plant and equipment and intangible assets.
The following table shows reconciliations of the total of the segment profit to income before income taxes and equity in earnings (losses) of
associated companies for the years ended March 31, 2016, 2015 and 2014:
Millions of YenThousands of U.S. Dollars
2016 2015 2014 2016
Segment profit total ¥45,995 ¥47,559 ¥34,294 $407,035
Other operating costs and expenses (income) – net 12,151 4,231 686 107,531
Interest expenses 1,386 1,347 1,502 12,265
Other income (expenses) – net (664) 1,678 1,791 (5,876)
Eliminations, adjustments and others 345 885 1,406 3,054Income before income taxes and equity in earnings (losses) of associated companies ¥32,139 ¥44,544 ¥35,303 $284,417
111Nipponham Group Annual Report 2016
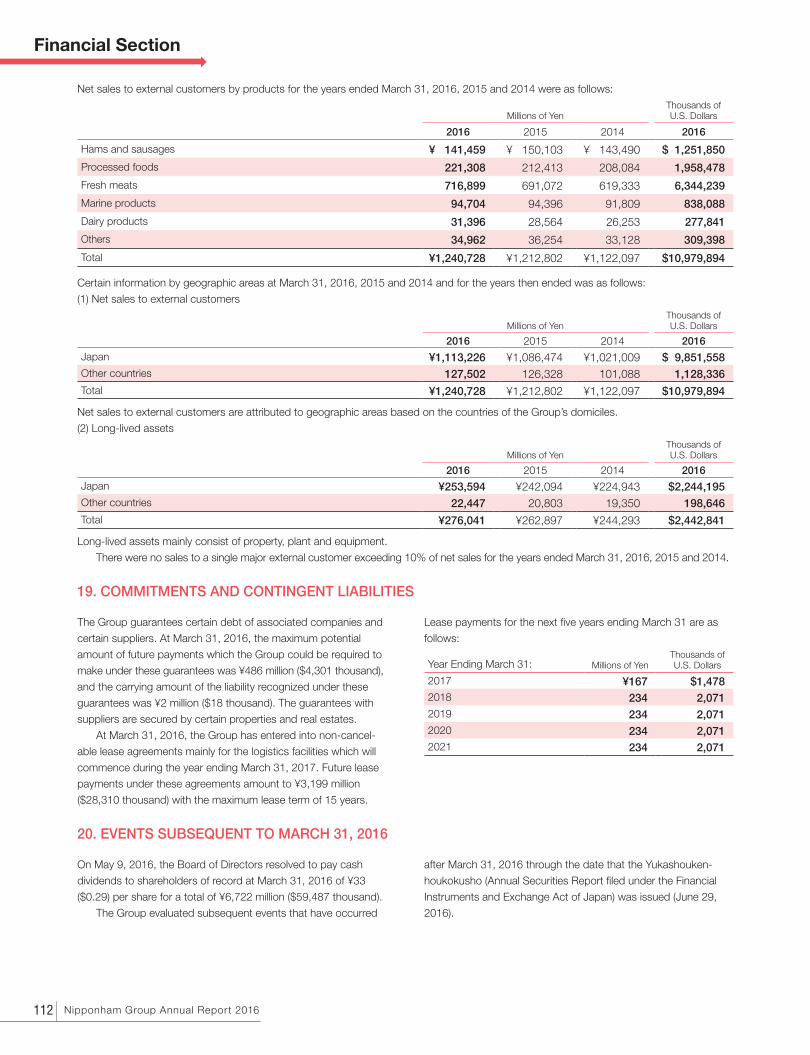
Net sales to external customers by products for the years ended March 31, 2016, 2015 and 2014 were as follows:
Millions of YenThousands of U.S. Dollars
2016 2015 2014 2016
Hams and sausages ¥ 141,459 ¥ 150,103 ¥ 143,490 $ 1,251,850
Processed foods 221,308 212,413 208,084 1,958,478
Fresh meats 716,899 691,072 619,333 6,344,239
Marine products 94,704 94,396 91,809 838,088
Dairy products 31,396 28,564 26,253 277,841
Others 34,962 36,254 33,128 309,398
Total ¥1,240,728 ¥1,212,802 ¥1,122,097 $10,979,894
Certain information by geographic areas at March 31, 2016, 2015 and 2014 and for the years then ended was as follows:
(1) Net sales to external customers
Millions of YenThousands of U.S. Dollars
2016 2015 2014 2016
Japan ¥1,113,226 ¥1,086,474 ¥1,021,009 $ 9,851,558Other countries 127,502 126,328 101,088 1,128,336Total ¥1,240,728 ¥1,212,802 ¥1,122,097 $10,979,894
Net sales to external customers are attributed to geographic areas based on the countries of the Group’s domiciles.
(2) Long-lived assets
Millions of YenThousands of U.S. Dollars
2016 2015 2014 2016
Japan ¥253,594 ¥242,094 ¥224,943 $2,244,195Other countries 22,447 20,803 19,350 198,646Total ¥276,041 ¥262,897 ¥244,293 $2,442,841
Long-lived assets mainly consist of property, plant and equipment.
There were no sales to a single major external customer exceeding 10% of net sales for the years ended March 31, 2016, 2015 and 2014.
19. COMMITMENTS AND CONTINGENT LIABILITIES
The Group guarantees certain debt of associated companies and
certain suppliers. At March 31, 2016, the maximum potential
amount of future payments which the Group could be required to
make under these guarantees was ¥486 million ($4,301 thousand),
and the carrying amount of the liability recognized under these
guarantees was ¥2 million ($18 thousand). The guarantees with
suppliers are secured by certain properties and real estates.
At March 31, 2016, the Group has entered into non-cancel-
able lease agreements mainly for the logistics facilities which will
commence during the year ending March 31, 2017. Future lease
payments under these agreements amount to ¥3,199 million
($28,310 thousand) with the maximum lease term of 15 years.
Lease payments for the next five years ending March 31 are as
follows:
Year Ending March 31: Millions of YenThousands of U.S. Dollars
2017 ¥167 $1,4782018 234 2,0712019 234 2,0712020 234 2,0712021 234 2,071
20. EVENTS SUBSEQUENT TO MARCH 31, 2016
On May 9, 2016, the Board of Directors resolved to pay cash
dividends to shareholders of record at March 31, 2016 of ¥33
($0.29) per share for a total of ¥6,722 million ($59,487 thousand).
The Group evaluated subsequent events that have occurred
after March 31, 2016 through the date that the Yukashouken-
houkokusho (Annual Securities Report filed under the Financial
Instruments and Exchange Act of Japan) was issued (June 29,
2016).
Financial Section
112 Nipponham Group Annual Report 2016

INDEPENDENT AUDITORS’ REPORT
113Nipponham Group Annual Report 2016
Management’s Report on Internal Control
NOTE TO READERS:Following is an English translation of management’s report on internal control over financial reporting filed under the Financial Instruments and Exchange Act of Japan. Readers should be aware that this report is presented merely as supplemental information.
Readers should be particularly aware of the differences between an assessment of internal control over financial reporting (“ICFR”) under the Financial Instruments and Exchange Act (“ICFR under FIEA”) and one conducted under the standards of the Public Company Accounting Oversight Board (United States) (“ICFR under PCAOB”);• In an assessment of ICFR under FIEA, there is detailed guidance on the scope of an assessment of ICFR, such as quantitative guidance on business location
selection and/or account selection. In an assessment of ICFR under PCAOB, there is no such detailed guidance. Accordingly, for the assessment of entity-level internal controls, the companies which represent the top 95% of consolidated net sales and other financial indicators are selected. For the assessment of internal control over business processes, the companies which cover approximately two-thirds of the previous year’s consolidated net sales and cost of goods sold (excluding inter-company transactions) are selected. Additional business processes, if any, which could have a significant impact on financial reporting, are also included in the scope.
• In an assessment of ICFR under FIEA, the scope includes ICFR of equity method investees. In an assessment of ICFR under PCAOB, the scope does not include ICFR of equity method investees.
Management’s Report on Internal Control
1. Matters relating to the basic framework for internal control over financial reporting
Juichi Suezawa, President and Representative Director, and Yoshihide Hata, Vice President and Representative Director, are responsible for designing and operating effective internal control over financial reporting of our company (“the Company”) and have designed and operated internal control over financial reporting of the consolidated financial statements in accordance with the basic framework for internal control set forth in “The Standards and Practice Standards for Management Assessment and Audit of Internal Control Over Financial Reporting” published by the Business Accounting Council.
The internal control is designed to achieve its objectives to the extent reasonable through the effective function and combination of its basic elements. Therefore, there is a possibility that misstatements may not be completely prevented or detected by internal control over financial reporting.
2. Matters relating to the scope of assessment, the basis date of assessment and the assessment procedures
The assessment of internal control over financial reporting was performed as of March 31, 2016, which is the end of this fiscal year. The assessment was performed in accordance with assessment standards for internal control over financial reporting generally accepted in Japan.
In conducting this assessment, we evaluated internal controls which may have a material effect on our entire financial reporting on a consolidation basis (“entity-level controls”) and based on the results of this assessment, we selected business processes to be tested. We analyzed these selected business processes, identified key controls that may have a material impact on the reliability of the Company’s financial reporting, and assessed the design and operation of these key controls. These procedures have allowed us to evaluate the effectiveness of the internal controls of the Company.
We determined the required scope of assessment of internal control over financial reporting for the Company, as well as its consolidated subsid-iaries and equity-method affiliated companies, from the perspective of the materiality that may affect the reliability of their financial reporting. The materiality that may affect the reliability of the financial reporting is determined taking into account the materiality of quantitative and qualitative impacts on financial reporting. In light of the results of the assessment of entity-level controls conducted for the Company and its consolidated subsidiaries, we reasonably determined the scope of assessment of internal control over business processes. Regarding certain consolidated subsidiaries and
equity-method affiliated companies that did not fall within the top 95% in terms of potential financial impact, calculated using net sales and other financial indicators, we concluded that they do not have any material impact on the consolidated financial statements, and thus, did not include them in the scope of assessment of entity-level controls.
Regarding the scope of assessment of internal control over business processes, we selected locations and business units to be tested based on the previous year’s consolidated net sales and cost of sales (after elimination of inter-company transactions), and the top eighteen companies whose net sales and cost of sales reach two-thirds of the total sales and cost of sales on a consolidation basis, were selected as “significant locations and/or business units.” We included in the scope of assessment, at the selected significant locations and/or business units, business processes leading to sales, accounts receivable and inventories as significant accounts that may have a material impact on the business objectives of the Company. Further, in addition to selected significant locations and/or business units, we also selected for testing, as business processes having greater materiality, business processes relating to (i) greater likelihood of material misstatements and/or (ii) significant accounts involving estimates and the management’s judgment and/or (iii) a business or operation dealing with high-risk transac-tions, taking into account their impact on the financial reporting.
3. Matters relating to the results of the assessmentAs a result of the assessment described above, as of the end of this fiscal year, we concluded that the Company’s internal control over financial reporting of the consolidated financial statements was effectively maintained.
4. Supplementary information—
5. Other matters warranting special mention—
Juichi SuezawaPresident and Representative DirectorYoshihide HataVice President and Representative DirectorNH Foods Ltd.
114 Nipponham Group Annual Report 2016

INDEPENDENT AUDITOR’S REPORT
NOTE TO READERS:Following is an English translation of the Independent Auditor’s Report filed under the Financial Instruments and Exchange Act of Japan. Readers should be aware that this report is presented merely as supplemental information.
Readers should be particularly aware of the differences between an audit of internal control over financial reporting (“ICFR”) under the Financial Instruments and Exchange Act (“ICFR under FIEA”) and one conducted under the standards of the Public Company Accounting Oversight Board (United States) (“ICFR under PCAOB”);• In an audit of ICFR under FIEA, the auditors express an opinion on management’s report on ICFR, and do not express an opinion on the Company’s ICFR
directly. In an audit of ICFR under PCAOB, the auditors express an opinion on the Company’s ICFR directly.• In an audit of ICFR under FIEA, there is detailed guidance on the scope of an audit of ICFR, such as quantitative guidance on business location selection and/or
account selection. In an audit of ICFR under PCAOB, there is no such detailed guidance. Accordingly, for the assessment of entity-level internal controls, the companies which represent the top 95% of consolidated net sales and other financial indicators are selected. For the assessment of internal control over business processes, the companies which cover approximately two-thirds of the previous year’s consolidated net sales and cost of goods sold (excluding inter-company transactions) are selected. Additional business processes, if any, which could have a significant impact on financial reporting, are also included in the scope.
• In an audit of ICFR under FIEA, the scope includes ICFR of equity-method investees. In an audit of ICFR under PCAOB, the scope does not include ICFR of equity-method investees.
(TRANSLATION)INDEPENDENT AUDITOR’S REPORT
June 23, 2016To the Board of Directors of NH Foods Ltd.
Deloitte Touche Tohmatsu LLCDesignated Unlimited Liability Partner, Engagement Partner, Certified Public Accountant: Seiichiro AzumaDesignated Unlimited Liability Partner, Engagement Partner, Certified Public Accountant: Koichi SekiguchiDesignated Unlimited Liability Partner, Engagement Partner, Certified Public Accountant: Takashige Ikeda
[Audit of Financial Statements]Pursuant to the first paragraph of Article 193-2 of the Financial Instruments and Exchange Act, we have audited the consolidated financial statements included in the Financial Section, namely, the consolidated balance sheet as of March 31, 2016 of NH Foods Ltd. and its consolidated subsidiaries, and the consoli-dated statements of income, comprehensive income, changes in equity and cash flows for the fiscal year from April 1, 2015 to March 31, 2016, and the related notes and consolidated supplementary schedules.
Management’s Responsibility for the Consolidated Financial StatementsManagement is responsible for the preparation and fair presentation of these consolidated financial statements in accordance with accounting principles generally accepted in the United States of America pursuant to the third paragraph of the Supplementary Provisions of the Cabinet Office Ordinance for Partial Amendment of the Regulations for Terminology, Forms and Preparation Methods of Consolidated Financial Statements (No. 11 of the Cabinet Office Ordinance in 2002), and for such internal control as management determines is necessary to enable the preparation of consolidated financial statements that are free from material misstatement, whether due to fraud or error.
Auditor’s ResponsibilityOur responsibility is to express an opinion on these consolidated financial statements based on our audit. We conducted our audit in accordance with auditing standards generally accepted in Japan. Those standards require that we plan and perform the audit to obtain reasonable assurance about whether the consolidated financial statements are free from material misstatement.
An audit involves performing procedures to obtain audit evidence about the amounts and disclosures in the consolidated financial statements. The procedures selected depend on the auditor’s judgment, including the assess-ment of the risks of material misstatement of the consolidated financial statements, whether due to fraud or error. In making those risk assessments, the auditor considers internal control relevant to the entity’s preparation and fair presentation of the consolidated financial statements in order to design audit procedures that are appropriate in the circumstances, but not for the purpose of expressing an opinion on the effectiveness of the entity’s internal control. An audit also includes evaluating the appropriateness of accounting policies used and the reasonableness of accounting estimates made by management, as well as evaluating the overall presentation of the consolidated financial statements.
We believe that the audit evidence we have obtained is sufficient and appropriate to provide a basis for our audit opinion.
Audit OpinionIn our opinion, the consolidated financial statements referred to above present fairly, in all material respects, the financial position of NH Foods Ltd. and its consolidated subsidiaries as of March 31, 2016, and the results of their operations and their cash flows for the year then ended in accordance with accounting principles generally accepted in the United States of America.
[Audit of Internal Control]Pursuant to the second paragraph of Article 193-2 of the Financial Instruments and Exchange Act, we have audited management’s report on internal control over financial reporting of NH Foods Ltd. as of March 31, 2016.
Management’s Responsibility for the Report on Internal ControlManagement is responsible for designing and operating effective internal control over financial reporting and for the preparation and fair presentation of its report on internal control in accordance with assessment standards for internal control over financial reporting generally accepted in Japan. There is a possibility that misstatements may not be completely prevented or detected by internal control over financial reporting.
Auditor’s ResponsibilityOur responsibility is to express an opinion on management’s report on internal control based on our internal control audit. We conducted our internal control audit in accordance with auditing standards for internal control over financial reporting generally accepted in Japan. Those standards require that we plan and perform the audit to obtain reasonable assurance about whether manage-ment’s report on internal control is free from material misstatement.
An internal control audit involves performing procedures to obtain audit evidence about the results of the assessment of internal control over financial reporting in management’s report on internal control. The procedures selected depend on the auditor’s judgment, including the significance of effects on reliability of financial reporting. An internal control audit includes examining representations on the scope, procedures and results of the assessment of internal control over financial reporting made by management, as well as evalu-ating the overall presentation of management’s report on internal control.
We believe that the audit evidence we have obtained is sufficient and appropriate to provide a basis for our audit opinion.
OpinionIn our opinion, management’s report on internal control over financial reporting referred to above, which represents that the internal control over financial reporting of NH Foods Ltd. as of March 31, 2016 is effectively maintained, presents fairly, in all material respects, the results of the assessment of internal control over financial reporting in accordance with assessment standards for internal control over financial reporting generally accepted in Japan.
InterestOur firm and the engagement partners do not have any interest in NH Foods Ltd. for which disclosure is required under the provisions of the Certified Public Accountants Act.
The above represents a translation, for convenience only, of the original report issued in the Japanese language.
115Nipponham Group Annual Report 2016