financial review - sonova.com · continuous organic growth sonova group sales in 2014/15 grew by...
TRANSCRIPT
Continuous organic growthSonova Group sales in 2014 / 15 grew by 4.3 % in reported Swiss francs or 6.2 % in local currencies, reaching CHF 2,035.1 million. Reported sales and EBITA were adversely impacted by exchange rate fluctuations, which included the strong appreciation of the Swiss franc following the decision by the Swiss National Bank in January 2015 to discontinue its minimum exchange rate policy vis-à-vis the euro. Organic growth represented 5.1 % of sales growth, with acquisitions adding another 1.1 %. About a third of this arose from the acquisition of Comfort Audio, effective October 2014; the remainder represented the addition of various smaller retail distribution businesses, including the full-year effect of such acquisitions made in the previous financial year.
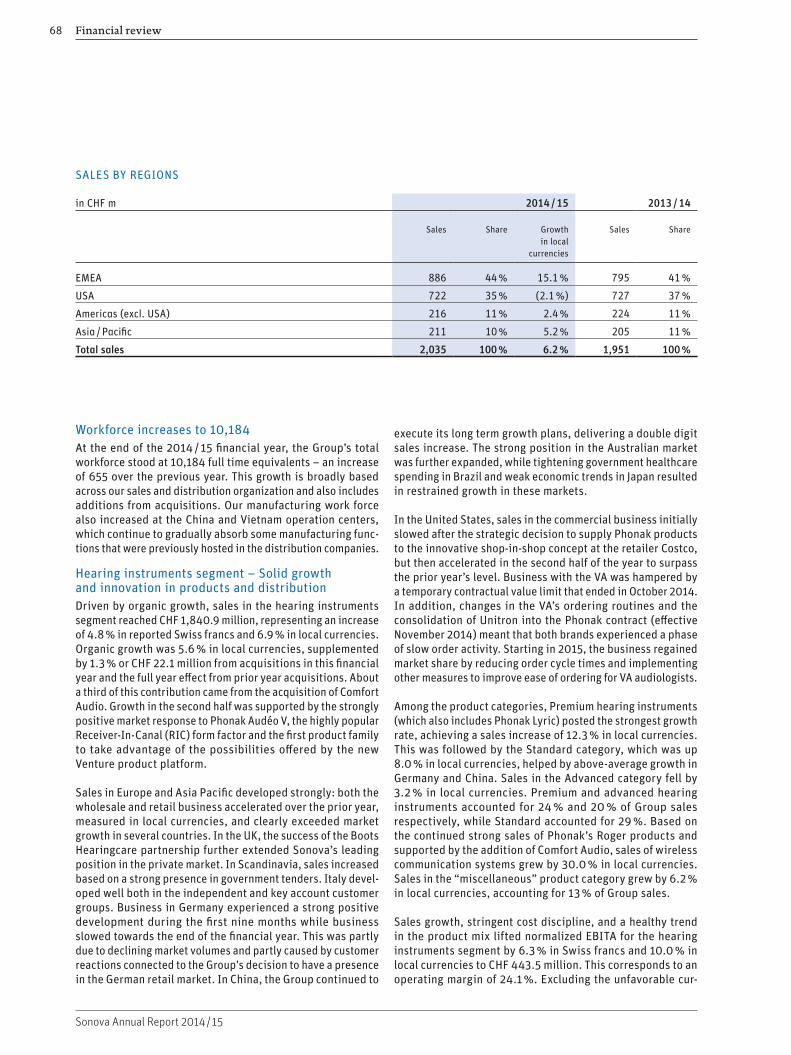
Strong growth in the EMEA region The Europe, Middle East, and Africa region (EMEA), which accounted for 44 % of Group sales, reported a strong 15.1 % sales increase in local currencies, building on the region’s double digit growth in the prior year. Both the hearing instru-ments and the cochlear implants segment showed further acceleration, based broadly across Europe. The hearing instru-ments segment achieved pronounced market share increases in Scandinavia, Italy, and the UK. In Germany, a sales increase was achieved due to strong market growth and market share gains achieved in the first nine months of the financial year, despite a slower pace of business towards the end of the period.
After a strong prior year, the Group’s business in the United States, representing 35 % of total sales, showed a modest decrease of 2.1 % in local currency. This is the result of largely-
expected factors: private-market customer reaction to the adoption of a new commercial distribution channel, along with contractual and supply chain limitations in business with the US Department of Veterans Affairs (VA). These effects abated in the second half of the financial year. In addition, the cochlear implants segment in the US could not increase sales volume over its exceptionally strong prior year. Sales in the rest of the Americas reported only modest sales growth of 2.4 % in local currencies. This mostly reflects stagnant government spending on health care in Brazil and the expected temporary adverse effect of an IT system change on the Group’s Canadian retail business.
The Asia / Pacific region represented 10 % of Group sales and achieved sales growth of 5.2 % in local currencies. This reflects the continued successful execution of Sonova’s China growth strategy as well as strong market development in Australia, partly offset by restrained growth in Japan due to weak eco-nomic trends and the fact that there were no larger orders for cochlear implant systems from government tenders in China this year.
Positive operating margin developmentGross profit reached CHF 1,394.7 million for the year under review (2013 / 14: CHF 1,340.4 million). This figure is normal-ized for non-recurring costs of CHF 7.1 million, including CHF 6.0 million booked for a restructuring provision related to the transfer of approximately 100 hearing aid assembly staff positions from Switzerland to the UK and China and a one-off charge of CHF 1.1 million related to a move from Group-owned to third-party wholesale hearing aid distribution in non-core emerging markets. These measures should serve to further
SONOVA GROUP KEY FIGURES
in CHF m unless otherwise specified 2014 / 15 Change in % 2013 / 14
Sales 2,035.1 4.3 % 1,951.3
EBITA 455.6 5.9 % 430.1
EBITA margin 22.4 % 22.0 %
EPS (CHF) 5.37 5.7 % 5.08
Operating free cash flow 366.4 15.1 % 318.4
ROCE1) 29.1 % 27.7 %
ROE1) 20.2 % 20.3 %
1) For detailed definitions, please refer to “5 Year Key Figures”.
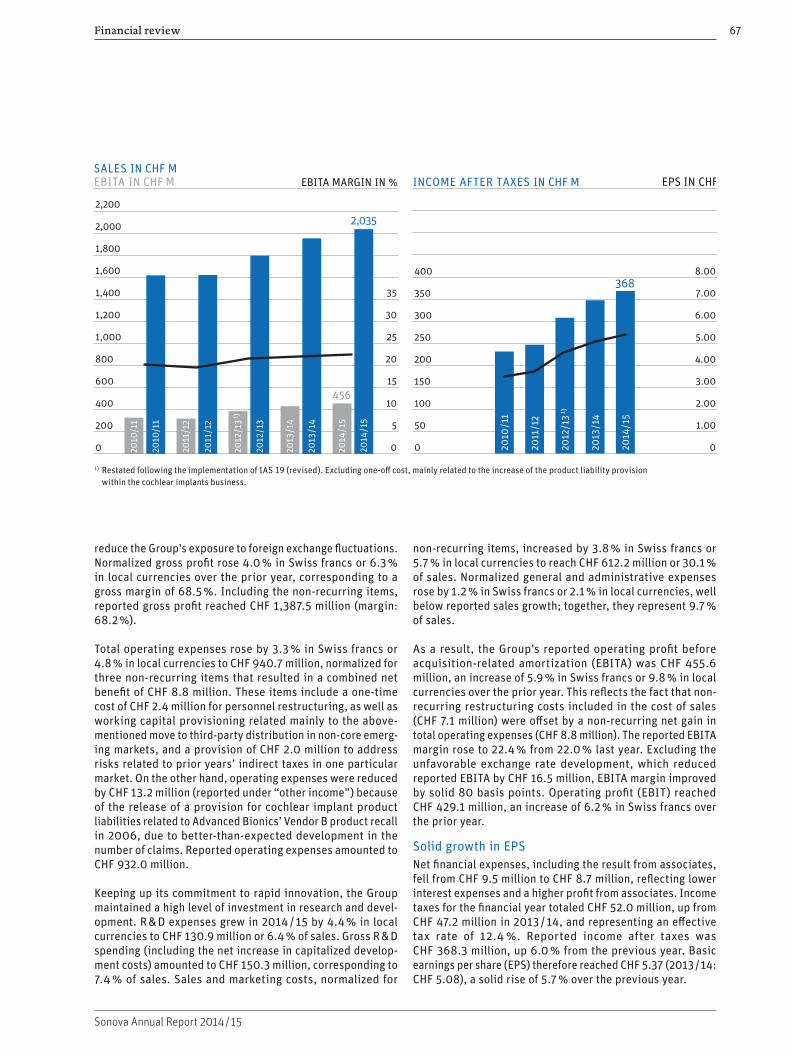
Sonova generated record sales of CHF 2,035.1 million in 2014 / 15, an increase of 4.3 % in reported Swiss francs or 6.2 % in local currencies. Group EBITA rose by 5.9 % in reported Swiss francs and 9.8 % in local currencies to CHF 455.6 million, corresponding to a margin of 22.4 %.
66
Sonova Annual Report 2014 / 15
Financial review
INCOME AFTER TAXES IN CHF M EPS IN CHF
6.00
5.00
4.00
3.00
2.00
1.00
0
300
7.00350
8.00400
250
200
150
100
50
0
368
2014
/15
2010
/11
2011
/12
2012
/13
1 ⁾
2013
/14
SALES IN CHF MEBITA IN CHF M EBITA MARGIN IN %
2,035
456
35
30
25
20
15
10
5
0
1,400
1,600
1,800
2,000
2,200
1,200
1,000
800
600
400
200
0 2010
/11
2011
/12
2013
/14
2014
/15
2010
/11
2011
/12
2013
/14
2014
/15
2012
/13
2012
/13
1 ⁾
reduce the Group’s exposure to foreign exchange fluctuations. Normalized gross profit rose 4.0 % in Swiss francs or 6.3 % in local currencies over the prior year, corresponding to a gross margin of 68.5 %. Including the non-recurring items, reported gross profit reached CHF 1,387.5 million (margin: 68.2 %).
Total operating expenses rose by 3.3 % in Swiss francs or 4.8 % in local currencies to CHF 940.7 million, normalized for three non-recurring items that resulted in a combined net benefit of CHF 8.8 million. These items include a one-time cost of CHF 2.4 million for personnel restructuring, as well as working capital provisioning related mainly to the above-mentioned move to third-party distribution in non-core emerg-ing markets, and a provision of CHF 2.0 million to address risks related to prior years’ indirect taxes in one particular market. On the other hand, operating expenses were reduced by CHF 13.2 million (reported under “other income”) because of the release of a provision for cochlear implant product liabilities related to Advanced Bionics’ Vendor B product recall in 2006, due to better-than-expected development in the number of claims. Reported operating expenses amounted to CHF 932.0 million.
Keeping up its commitment to rapid innovation, the Group maintained a high level of investment in research and devel-opment. R & D expenses grew in 2014 / 15 by 4.4 % in local currencies to CHF 130.9 million or 6.4 % of sales. Gross R & D spending (including the net increase in capitalized develop-ment costs) amounted to CHF 150.3 million, corresponding to 7.4 % of sales. Sales and marketing costs, normalized for
non-recurring items, increased by 3.8 % in Swiss francs or 5.7 % in local currencies to reach CHF 612.2 million or 30.1 % of sales. Normalized general and administrative expenses rose by 1.2 % in Swiss francs or 2.1 % in local currencies, well below reported sales growth; together, they represent 9.7 % of sales.
As a result, the Group’s reported operating profit before acquisition-related amortization (EBITA) was CHF 455.6 million, an increase of 5.9 % in Swiss francs or 9.8 % in local currencies over the prior year. This reflects the fact that non-recurring restructuring costs included in the cost of sales (CHF 7.1 million) were offset by a non-recurring net gain in total operating expenses (CHF 8.8 million). The reported EBITA margin rose to 22.4 % from 22.0 % last year. Excluding the unfavorable exchange rate development, which reduced reported EBITA by CHF 16.5 million, EBITA margin improved by solid 80 basis points. Operating profit (EBIT) reached CHF 429.1 million, an increase of 6.2 % in Swiss francs over the prior year.
Solid growth in EPSNet financial expenses, including the result from associates, fell from CHF 9.5 million to CHF 8.7 million, reflecting lower interest expenses and a higher profit from associates. Income taxes for the financial year totaled CHF 52.0 million, up from CHF 47.2 million in 2013 / 14, and representing an effective tax rate of 12.4 %. Reported income after taxes was CHF 368.3 million, up 6.0 % from the previous year. Basic earnings per share (EPS) therefore reached CHF 5.37 (2013 / 14: CHF 5.08), a solid rise of 5.7 % over the previous year.
1) Restated following the implementation of IAS 19 (revised). Excluding one-off cost, mainly related to the increase of the product liability provision within the cochlear implants business.
Financial review 67
Sonova Annual Report 2014 / 15
Workforce increases to 10,184At the end of the 2014 / 15 financial year, the Group’s total workforce stood at 10,184 full time equivalents – an increase of 655 over the previous year. This growth is broadly based across our sales and distribution organization and also includes additions from acquisitions. Our manufacturing work force also increased at the China and Vietnam operation centers, which continue to gradually absorb some manufacturing func-tions that were previously hosted in the distribution companies.
Hearing instruments segment – Solid growth and innovation in products and distributionDriven by organic growth, sales in the hearing instruments segment reached CHF 1,840.9 million, representing an increase of 4.8 % in reported Swiss francs and 6.9 % in local currencies. Organic growth was 5.6 % in local currencies, supplemented by 1.3 % or CHF 22.1 million from acquisitions in this financial year and the full year effect from prior year acquisitions. About a third of this contribution came from the acquisition of Comfort Audio. Growth in the second half was supported by the strongly positive market response to Phonak Audéo V, the highly popular Receiver-In-Canal (RIC) form factor and the first product family to take advantage of the possibilities offered by the new Venture product platform.
Sales in Europe and Asia Pacific developed strongly: both the wholesale and retail business accelerated over the prior year, measured in local currencies, and clearly exceeded market growth in several countries. In the UK, the success of the Boots Hearingcare partnership further extended Sonova’s leading position in the private market. In Scandinavia, sales increased based on a strong presence in government tenders. Italy devel-oped well both in the independent and key account customer groups. Business in Germany experienced a strong positive development during the first nine months while business slowed towards the end of the financial year. This was partly due to declining market volumes and partly caused by customer reactions connected to the Group’s decision to have a presence in the German retail market. In China, the Group continued to
execute its long term growth plans, delivering a double digit sales increase. The strong position in the Australian market was further expanded, while tightening government healthcare spending in Brazil and weak economic trends in Japan resulted in restrained growth in these markets.
In the United States, sales in the commercial business initially slowed after the strategic decision to supply Phonak products to the innovative shop-in-shop concept at the retailer Costco, but then accelerated in the second half of the year to surpass the prior year’s level. Business with the VA was hampered by a temporary contractual value limit that ended in October 2014. In addition, changes in the VA’s ordering routines and the consolidation of Unitron into the Phonak contract (effective November 2014) meant that both brands experienced a phase of slow order activity. Starting in 2015, the business regained market share by reducing order cycle times and implementing other measures to improve ease of ordering for VA audiologists.
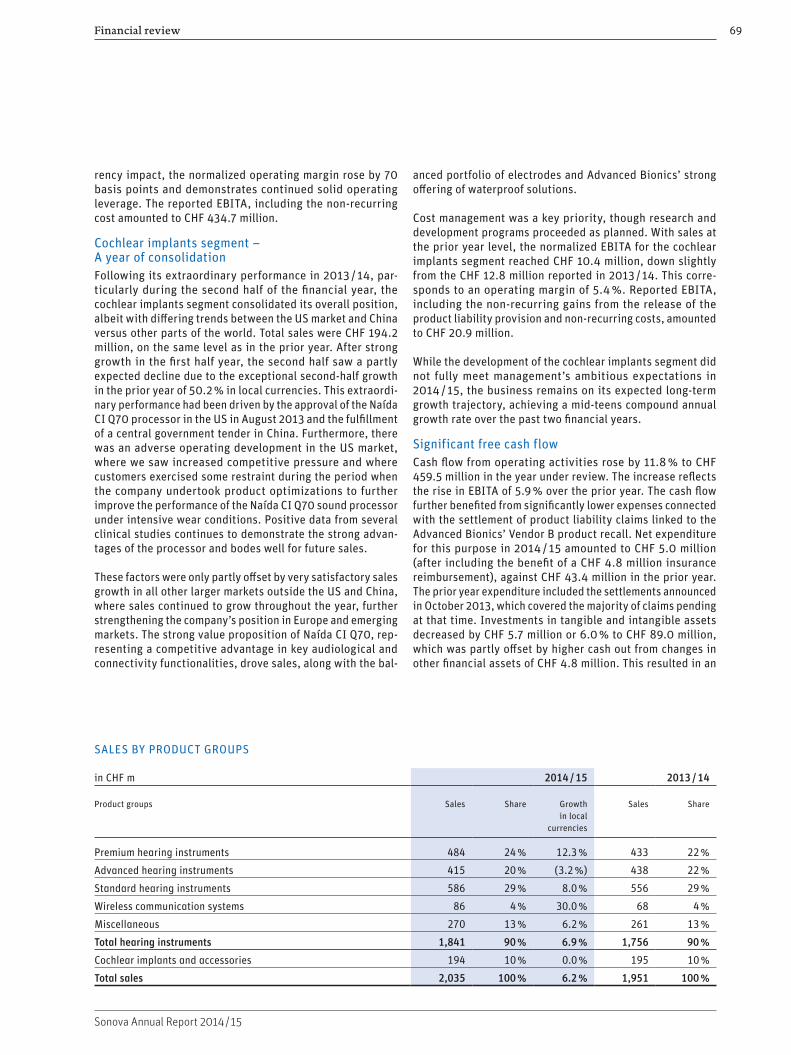
Among the product categories, Premium hearing instruments (which also includes Phonak Lyric) posted the strongest growth rate, achieving a sales increase of 12.3 % in local currencies. This was followed by the Standard category, which was up 8.0 % in local currencies, helped by above-average growth in Germany and China. Sales in the Advanced category fell by 3.2 % in local currencies. Premium and advanced hearing instruments accounted for 24 % and 20 % of Group sales respectively, while Standard accounted for 29 %. Based on the continued strong sales of Phonak’s Roger products and supported by the addition of Comfort Audio, sales of wireless communication systems grew by 30.0 % in local currencies. Sales in the “miscellaneous” product category grew by 6.2 % in local currencies, accounting for 13 % of Group sales.
Sales growth, stringent cost discipline, and a healthy trend in the product mix lifted normalized EBITA for the hearing instruments segment by 6.3 % in Swiss francs and 10.0 % in local currencies to CHF 443.5 million. This corresponds to an operating margin of 24.1 %. Excluding the unfavorable cur-
SALES BY REGIONS
in CHF m 2014 / 15 2013 / 14
Sales Share Growth in local
currencies
Sales Share
EMEA 886 44 % 15.1 % 795 41 %
USA 722 35 % (2.1 %) 727 37 %
Americas (excl. USA) 216 11 % 2.4 % 224 11 %
Asia / Pacific 211 10 % 5.2 % 205 11 %
Total sales 2,035 100 % 6.2 % 1,951 100 %
Financial review68
Sonova Annual Report 2014 / 15
rency impact, the normalized operating margin rose by 70 basis points and demonstrates continued solid operating leverage. The reported EBITA, including the non-recurring cost amounted to CHF 434.7 million.
Cochlear implants segment – A year of consolidationFollowing its extraordinary performance in 2013 / 14, par-ticularly during the second half of the financial year, the cochlear implants segment consolidated its overall position, albeit with differing trends between the US market and China versus other parts of the world. Total sales were CHF 194.2 million, on the same level as in the prior year. After strong growth in the first half year, the second half saw a partly expected decline due to the exceptional second-half growth in the prior year of 50.2 % in local currencies. This extraordi-nary performance had been driven by the approval of the Naída CI Q70 processor in the US in August 2013 and the fulfillment of a central government tender in China. Furthermore, there was an adverse operating development in the US market, where we saw increased competitive pressure and where customers exercised some restraint during the period when the company undertook product optimizations to further improve the performance of the Naída CI Q70 sound processor under intensive wear conditions. Positive data from several clinical studies continues to demonstrate the strong advan-tages of the processor and bodes well for future sales.
These factors were only partly offset by very satisfactory sales growth in all other larger markets outside the US and China, where sales continued to grow throughout the year, further strengthening the company’s position in Europe and emerging markets. The strong value proposition of Naída CI Q70, rep-resenting a competitive advantage in key audiological and connectivity functionalities, drove sales, along with the bal-
anced portfolio of electrodes and Advanced Bionics’ strong offering of waterproof solutions.
Cost management was a key priority, though research and development programs proceeded as planned. With sales at the prior year level, the normalized EBITA for the cochlear implants segment reached CHF 10.4 million, down slightly from the CHF 12.8 million reported in 2013 / 14. This corre-sponds to an operating margin of 5.4 %. Reported EBITA, including the non-recurring gains from the release of the product liability provision and non-recurring costs, amounted to CHF 20.9 million.
While the development of the cochlear implants segment did not fully meet management’s ambitious expectations in 2014 / 15, the business remains on its expected long-term growth trajectory, achieving a mid-teens compound annual growth rate over the past two financial years.
Significant free cash flowCash flow from operating activities rose by 11.8 % to CHF 459.5 million in the year under review. The increase reflects the rise in EBITA of 5.9 % over the prior year. The cash flow further benefited from significantly lower expenses connected with the settlement of product liability claims linked to the Advanced Bionics’ Vendor B product recall. Net expenditure for this purpose in 2014 / 15 amounted to CHF 5.0 million (after including the benefit of a CHF 4.8 million insurance reimbursement), against CHF 43.4 million in the prior year. The prior year expenditure included the settlements announced in October 2013, which covered the majority of claims pending at that time. Investments in tangible and intangible assets decreased by CHF 5.7 million or 6.0 % to CHF 89.0 million, which was partly offset by higher cash out from changes in other financial assets of CHF 4.8 million. This resulted in an
SALES BY PRODUCT GROUPS
in CHF m 2014 / 15 2013 / 14
Product groups
Sales Share Growth in local
currencies
Sales Share
Premium hearing instruments 484 24 % 12.3 % 433 22 %
Advanced hearing instruments 415 20 % (3.2 %) 438 22 %
Standard hearing instruments 586 29 % 8.0 % 556 29 %
Wireless communication systems 86 4 % 30.0 % 68 4 %
Miscellaneous 270 13 % 6.2 % 261 13 %
Total hearing instruments 1,841 90 % 6.9 % 1,756 90 %
Cochlear implants and accessories 194 10 % 0.0 % 195 10 %
Total sales 2,035 100 % 6.2 % 1,951 100 %
Financial review 69
Sonova Annual Report 2014 / 15

operating free cash flow of CHF 366.4 million, up by a strong 15.1 % from the prior year. The cash consideration for acqui-sitions, including earn-out payments for prior period acquisi-tions, amounted to CHF 57.7 million in 2014 / 15, compared to CHF 29.8 million in the prior year. This resulted in a free cash flow of CHF 308.7 million, up 7.0 % from the prior year.
Cash outflow from financing stood at CHF 327.3 million in the period under review, compared to CHF 309.1 million in the previous year. In 2014 / 15, Sonova retired the final CHF 80 million tranche of its financial debt assumed in connection with the acquisition of Advanced Bionics in 2009, rendering the Group essentially debt-free. An installment of CHF 150 million had been paid in the prior year. In December 2014 the Group started a three year share buy-back program and CHF 73.6 million was spent to buy back 546,900 shares. In addition, CHF 19.0 million was spent on the purchase of trea-sury shares to serve the equity-based compensation plans, compared to CHF 39.1 million in the prior year. The cash outflow from financing also reflects the increase in the dividend by CHF 20.2 million.
Maintaining a solid balance sheetReported net working capital was CHF 181.4 million, compared to CHF 190.6 million at the end of the 2013 / 14 financial year. Capital employed was CHF 1,489.5 million, compared to CHF 1,462.9 million in the prior year. Helped by its strong free cash flow, the Group ended the period with a net cash position of CHF 382.3 million, up CHF 70.8 million from CHF 311.5 million at the end of the prior year. The return on capital employed (ROCE) was 29.1 % compared to 27.7 % in the prior year, showing that we are on track to reach our mid-term financial targets.
In light of its solid performance during the 2014 / 15 financial year, as well as the solid financial position of the Sonova Group, the Board of Directors will propose to the Annual General Shareholders’ Meeting on June 16, 2015 a dividend of CHF 2.05. Compared to the prior year, the proposed distri-bution is up 7.9 % and represents a payout ratio of 38 % com-pared to 37 % in the prior year.
Outlook 2015 / 16Continuous customer-driven innovation and building on our strong market positions remain the Sonova Group’s chosen paths to profitable and sustainable growth. We foresee solid sales and earnings increases during 2015 / 16 in both the hearing instruments and cochlear implants segments, with Group sales expected to grow by 7 % – 9 % in local currencies. Growth will be supported by the acquisition of Hansaton Akustik GmbH, which became effective in April 2015.
Financial review70
Sonova Annual Report 2014 / 15
140160
120100806040200
2005 2006 2007 2008 2009 2010 2011 2012 2013 2014 2015
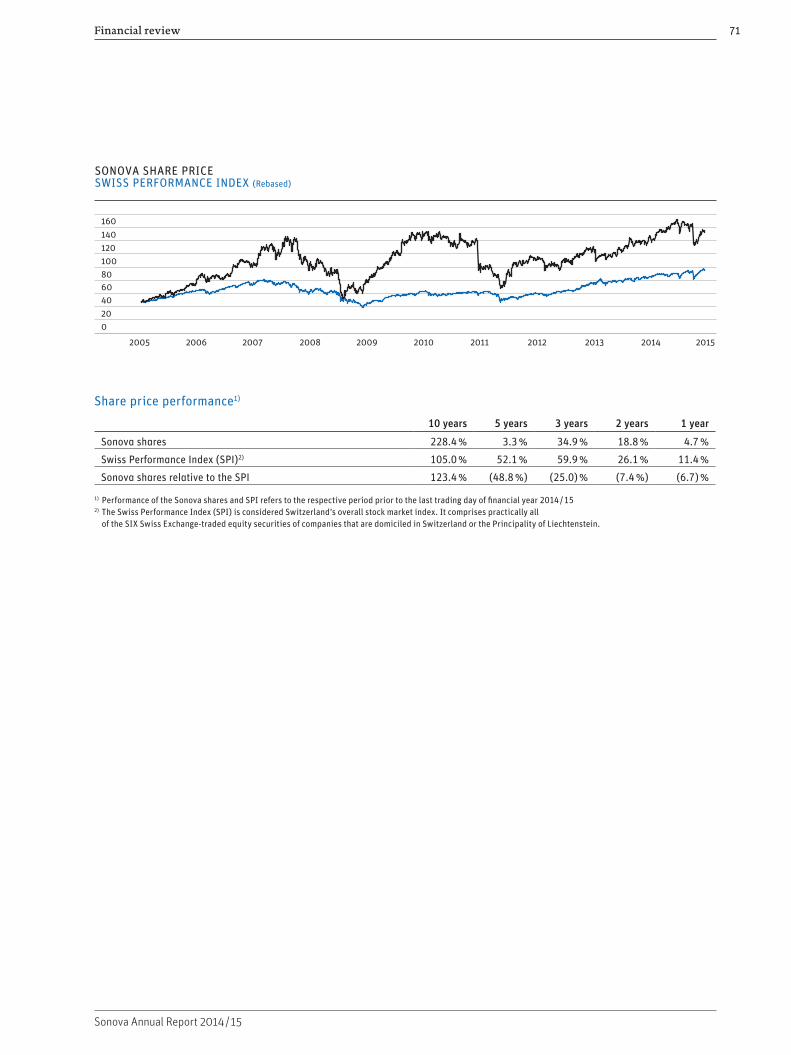
SONOVA SHARE PRICESWISS PERFORMANCE INDEX (Rebased)
Share price performance1)
10 years 5 years 3 years 2 years 1 year
Sonova shares 228.4 % 3.3 % 34.9 % 18.8 % 4.7 %
Swiss Performance Index (SPI)2) 105.0 % 52.1 % 59.9 % 26.1 % 11.4 %
Sonova shares relative to the SPI 123.4 % (48.8 %) (25.0) % (7.4 %) (6.7) %
1) Performance of the Sonova shares and SPI refers to the respective period prior to the last trading day of financial year 2014 / 152) The Swiss Performance Index (SPI) is considered Switzerland’s overall stock market index. It comprises practically all
of the SIX Swiss Exchange-traded equity securities of companies that are domiciled in Switzerland or the Principality of Liechtenstein.
Financial review 71
Sonova Annual Report 2014 / 15
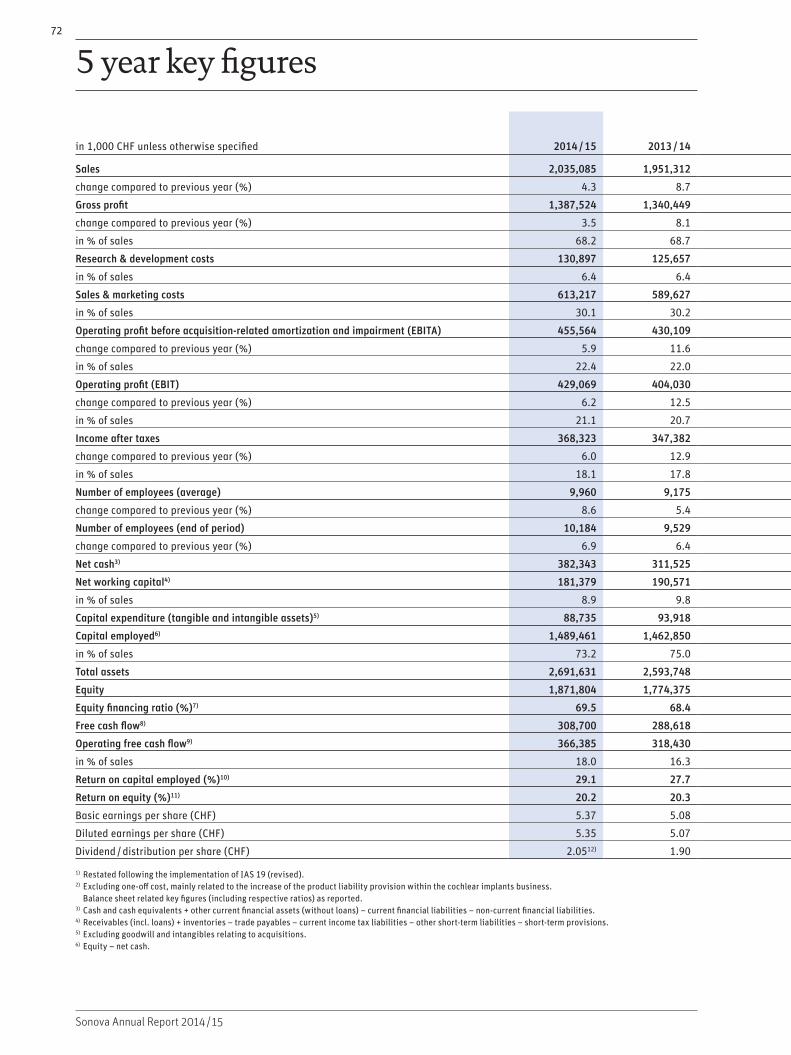
in 1,000 CHF unless otherwise specified 2014 / 15 2013 / 14
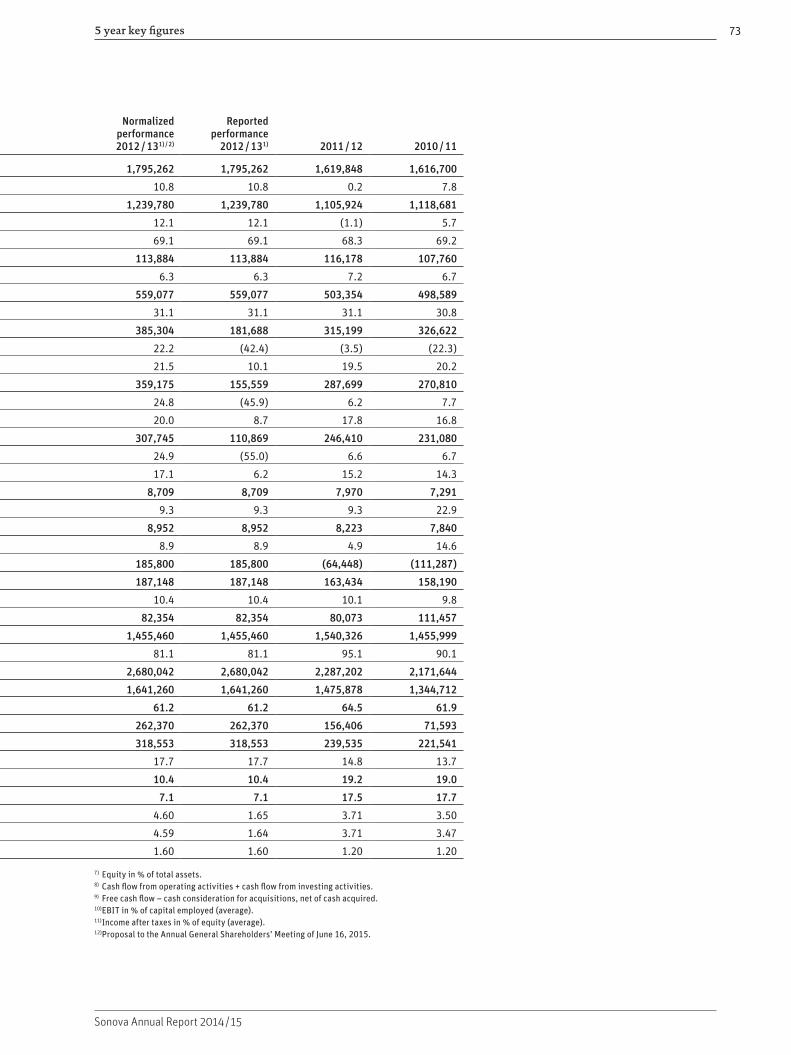
Normalized performance 2012 / 131) / 2)
Reported performance
2012 / 131) 2011 / 12 2010 / 11
Sales 2,035,085 1,951,312 1,795,262 1,795,262 1,619,848 1,616,700
change compared to previous year (%) 4.3 8.7 10.8 10.8 0.2 7.8
Gross profit 1,387,524 1,340,449 1,239,780 1,239,780 1,105,924 1,118,681
change compared to previous year (%) 3.5 8.1 12.1 12.1 (1.1) 5.7
in % of sales 68.2 68.7 69.1 69.1 68.3 69.2
Research & development costs 130,897 125,657 113,884 113,884 116,178 107,760
in % of sales 6.4 6.4 6.3 6.3 7.2 6.7
Sales & marketing costs 613,217 589,627 559,077 559,077 503,354 498,589
in % of sales 30.1 30.2 31.1 31.1 31.1 30.8
Operating profit before acquisition-related amortization and impairment (EBITA) 455,564 430,109 385,304 181,688 315,199 326,622
change compared to previous year (%) 5.9 11.6 22.2 (42.4) (3.5) (22.3)
in % of sales 22.4 22.0 21.5 10.1 19.5 20.2
Operating profit (EBIT) 429,069 404,030 359,175 155,559 287,699 270,810
change compared to previous year (%) 6.2 12.5 24.8 (45.9) 6.2 7.7
in % of sales 21.1 20.7 20.0 8.7 17.8 16.8
Income after taxes 368,323 347,382 307,745 110,869 246,410 231,080
change compared to previous year (%) 6.0 12.9 24.9 (55.0) 6.6 6.7
in % of sales 18.1 17.8 17.1 6.2 15.2 14.3
Number of employees (average) 9,960 9,175 8,709 8,709 7,970 7,291
change compared to previous year (%) 8.6 5.4 9.3 9.3 9.3 22.9
Number of employees (end of period) 10,184 9,529 8,952 8,952 8,223 7,840
change compared to previous year (%) 6.9 6.4 8.9 8.9 4.9 14.6
Net cash3) 382,343 311,525 185,800 185,800 (64,448) (111,287)
Net working capital4) 181,379 190,571 187,148 187,148 163,434 158,190
in % of sales 8.9 9.8 10.4 10.4 10.1 9.8
Capital expenditure (tangible and intangible assets)5) 88,735 93,918 82,354 82,354 80,073 111,457
Capital employed6) 1,489,461 1,462,850 1,455,460 1,455,460 1,540,326 1,455,999
in % of sales 73.2 75.0 81.1 81.1 95.1 90.1
Total assets 2,691,631 2,593,748 2,680,042 2,680,042 2,287,202 2,171,644
Equity 1,871,804 1,774,375 1,641,260 1,641,260 1,475,878 1,344,712
Equity financing ratio (%)7) 69.5 68.4 61.2 61.2 64.5 61.9
Free cash flow8) 308,700 288,618 262,370 262,370 156,406 71,593
Operating free cash flow9) 366,385 318,430 318,553 318,553 239,535 221,541
in % of sales 18.0 16.3 17.7 17.7 14.8 13.7
Return on capital employed (%)10) 29.1 27.7 10.4 10.4 19.2 19.0
Return on equity (%)11) 20.2 20.3 7.1 7.1 17.5 17.7
Basic earnings per share (CHF) 5.37 5.08 4.60 1.65 3.71 3.50
Diluted earnings per share (CHF) 5.35 5.07 4.59 1.64 3.71 3.47
Dividend / distribution per share (CHF) 2.0512) 1.90 1.60 1.60 1.20 1.20
1) Restated following the implementation of IAS 19 (revised).2) Excluding one-off cost, mainly related to the increase of the product liability provision within the cochlear implants business.
Balance sheet related key figures (including respective ratios) as reported.3) Cash and cash equivalents + other current financial assets (without loans) – current financial liabilities – non-current financial liabilities. 4) Receivables (incl. loans) + inventories – trade payables – current income tax liabilities – other short-term liabilities – short-term provisions. 5) Excluding goodwill and intangibles relating to acquisitions. 6) Equity – net cash.
5 year key figures 72
Sonova Annual Report 2014 / 15
in 1,000 CHF unless otherwise specified 2014 / 15 2013 / 14
Normalized performance 2012 / 131) / 2)
Reported performance
2012 / 131) 2011 / 12 2010 / 11
Sales 2,035,085 1,951,312 1,795,262 1,795,262 1,619,848 1,616,700
change compared to previous year (%) 4.3 8.7 10.8 10.8 0.2 7.8
Gross profit 1,387,524 1,340,449 1,239,780 1,239,780 1,105,924 1,118,681
change compared to previous year (%) 3.5 8.1 12.1 12.1 (1.1) 5.7
in % of sales 68.2 68.7 69.1 69.1 68.3 69.2
Research & development costs 130,897 125,657 113,884 113,884 116,178 107,760
in % of sales 6.4 6.4 6.3 6.3 7.2 6.7
Sales & marketing costs 613,217 589,627 559,077 559,077 503,354 498,589
in % of sales 30.1 30.2 31.1 31.1 31.1 30.8
Operating profit before acquisition-related amortization and impairment (EBITA) 455,564 430,109 385,304 181,688 315,199 326,622
change compared to previous year (%) 5.9 11.6 22.2 (42.4) (3.5) (22.3)
in % of sales 22.4 22.0 21.5 10.1 19.5 20.2
Operating profit (EBIT) 429,069 404,030 359,175 155,559 287,699 270,810
change compared to previous year (%) 6.2 12.5 24.8 (45.9) 6.2 7.7
in % of sales 21.1 20.7 20.0 8.7 17.8 16.8
Income after taxes 368,323 347,382 307,745 110,869 246,410 231,080
change compared to previous year (%) 6.0 12.9 24.9 (55.0) 6.6 6.7
in % of sales 18.1 17.8 17.1 6.2 15.2 14.3
Number of employees (average) 9,960 9,175 8,709 8,709 7,970 7,291
change compared to previous year (%) 8.6 5.4 9.3 9.3 9.3 22.9
Number of employees (end of period) 10,184 9,529 8,952 8,952 8,223 7,840
change compared to previous year (%) 6.9 6.4 8.9 8.9 4.9 14.6
Net cash3) 382,343 311,525 185,800 185,800 (64,448) (111,287)
Net working capital4) 181,379 190,571 187,148 187,148 163,434 158,190
in % of sales 8.9 9.8 10.4 10.4 10.1 9.8
Capital expenditure (tangible and intangible assets)5) 88,735 93,918 82,354 82,354 80,073 111,457
Capital employed6) 1,489,461 1,462,850 1,455,460 1,455,460 1,540,326 1,455,999
in % of sales 73.2 75.0 81.1 81.1 95.1 90.1
Total assets 2,691,631 2,593,748 2,680,042 2,680,042 2,287,202 2,171,644
Equity 1,871,804 1,774,375 1,641,260 1,641,260 1,475,878 1,344,712
Equity financing ratio (%)7) 69.5 68.4 61.2 61.2 64.5 61.9
Free cash flow8) 308,700 288,618 262,370 262,370 156,406 71,593
Operating free cash flow9) 366,385 318,430 318,553 318,553 239,535 221,541
in % of sales 18.0 16.3 17.7 17.7 14.8 13.7
Return on capital employed (%)10) 29.1 27.7 10.4 10.4 19.2 19.0
Return on equity (%)11) 20.2 20.3 7.1 7.1 17.5 17.7
Basic earnings per share (CHF) 5.37 5.08 4.60 1.65 3.71 3.50
Diluted earnings per share (CHF) 5.35 5.07 4.59 1.64 3.71 3.47
Dividend / distribution per share (CHF) 2.0512) 1.90 1.60 1.60 1.20 1.20
1) Restated following the implementation of IAS 19 (revised).2) Excluding one-off cost, mainly related to the increase of the product liability provision within the cochlear implants business.
Balance sheet related key figures (including respective ratios) as reported.3) Cash and cash equivalents + other current financial assets (without loans) – current financial liabilities – non-current financial liabilities. 4) Receivables (incl. loans) + inventories – trade payables – current income tax liabilities – other short-term liabilities – short-term provisions. 5) Excluding goodwill and intangibles relating to acquisitions. 6) Equity – net cash.
7) Equity in % of total assets. 8) Cash flow from operating activities + cash flow from investing activities. 9) Free cash flow – cash consideration for acquisitions, net of cash acquired.10) EBIT in % of capital employed (average). 11) Income after taxes in % of equity (average). 12) Proposal to the Annual General Shareholders’ Meeting of June 16, 2015.
5 year key figures 73
Sonova Annual Report 2014 / 15
74
Sonova Annual Report 2014 / 15
Consolidated financial statements
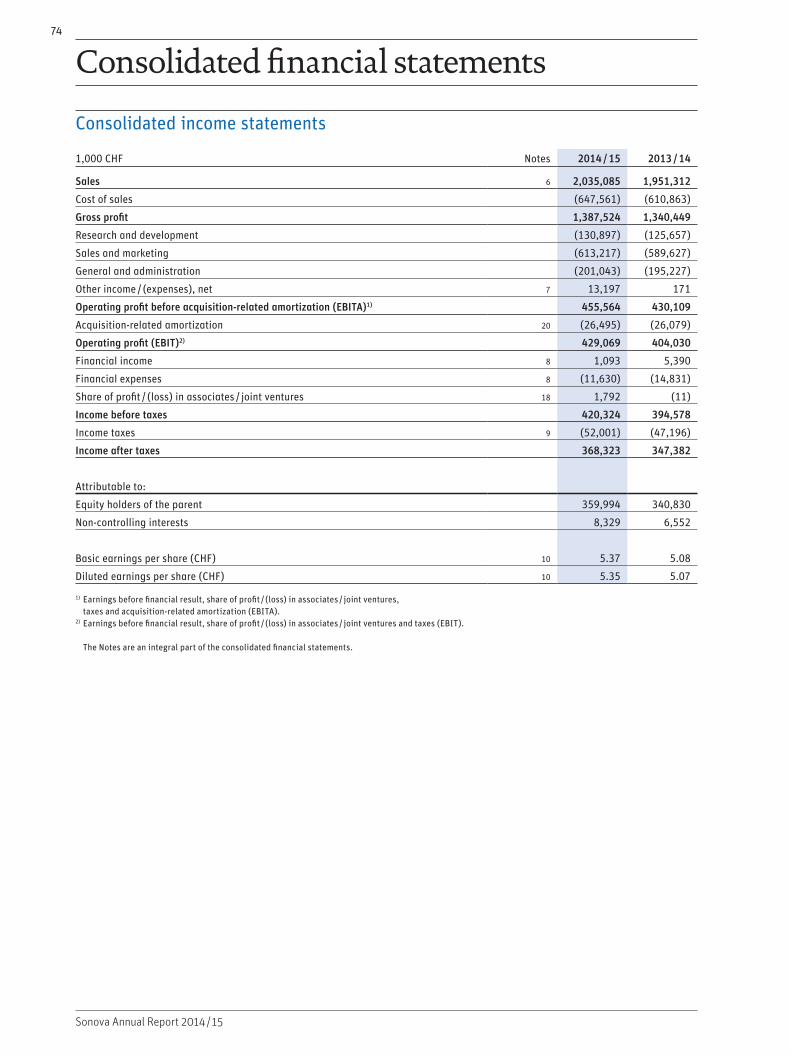
Consolidated income statements
1,000 CHF Notes 2014 / 15 2013 / 14
Sales 6 2,035,085 1,951,312
Cost of sales (647,561) (610,863)
Gross profit 1,387,524 1,340,449
Research and development (130,897) (125,657)
Sales and marketing (613,217) (589,627)
General and administration (201,043) (195,227)
Other income / (expenses), net 7 13,197 171
Operating profit before acquisition-related amortization (EBITA)1) 455,564 430,109
Acquisition-related amortization 20 (26,495) (26,079)
Operating profit (EBIT)2) 429,069 404,030
Financial income 8 1,093 5,390
Financial expenses 8 (11,630) (14,831)
Share of profit / (loss) in associates / joint ventures 18 1,792 (11)
Income before taxes 420,324 394,578
Income taxes 9 (52,001) (47,196)
Income after taxes 368,323 347,382
Attributable to:
Equity holders of the parent 359,994 340,830
Non-controlling interests 8,329 6,552
Basic earnings per share (CHF) 10 5.37 5.08
Diluted earnings per share (CHF) 10 5.35 5.07
1) Earnings before financial result, share of profit / (loss) in associates / joint ventures, taxes and acquisition-related amortization (EBITA).
2) Earnings before financial result, share of profit / (loss) in associates / joint ventures and taxes (EBIT). The Notes are an integral part of the consolidated financial statements.
Consolidated financial statements 75
Sonova Annual Report 2014 / 15
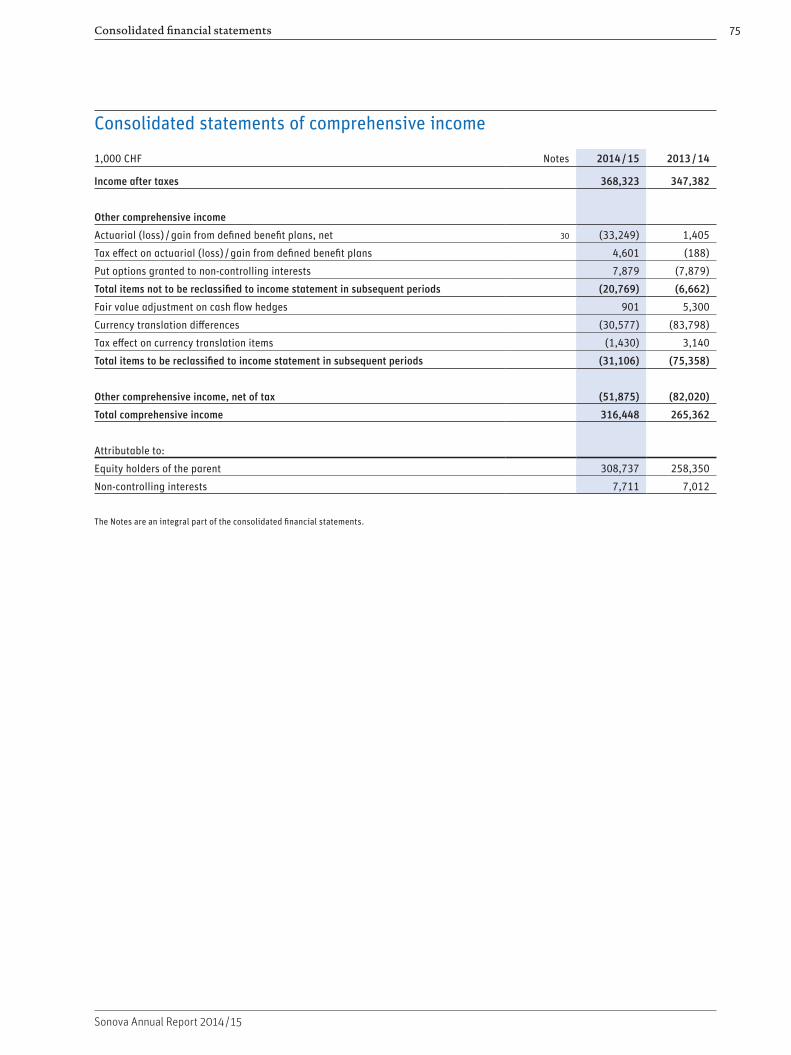
Consolidated statements of comprehensive income
1,000 CHF Notes 2014 / 15 2013 / 14
Income after taxes 368,323 347,382
Other comprehensive income
Actuarial (loss) / gain from defined benefit plans, net 30 (33,249) 1,405
Tax effect on actuarial (loss) / gain from defined benefit plans 4,601 (188)
Put options granted to non-controlling interests 7,879 (7,879)
Total items not to be reclassified to income statement in subsequent periods (20,769) (6,662)
Fair value adjustment on cash flow hedges 901 5,300
Currency translation differences (30,577) (83,798)
Tax effect on currency translation items (1,430) 3,140
Total items to be reclassified to income statement in subsequent periods (31,106) (75,358)
Other comprehensive income, net of tax (51,875) (82,020)
Total comprehensive income 316,448 265,362
Attributable to:
Equity holders of the parent 308,737 258,350
Non-controlling interests 7,711 7,012
The Notes are an integral part of the consolidated financial statements.
Consolidated financial statements76
Sonova Annual Report 2014 / 15
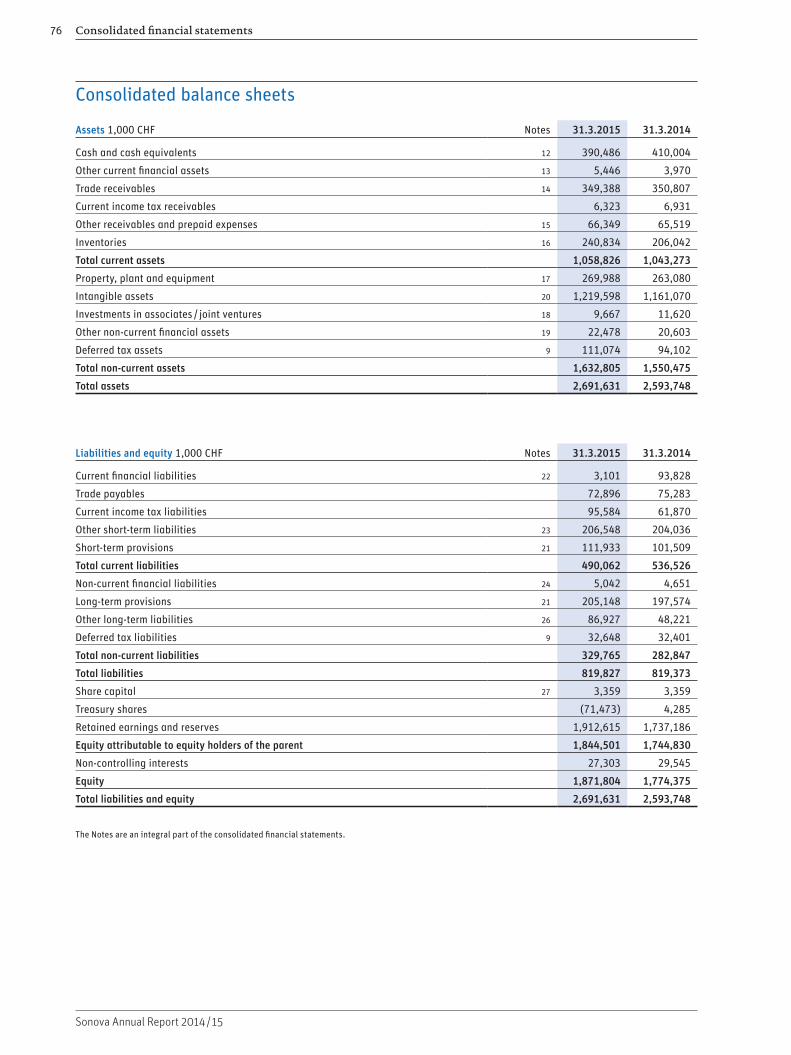
Consolidated balance sheets
Assets 1,000 CHF Notes 31.3.2015 31.3.2014
Cash and cash equivalents 12 390,486 410,004
Other current financial assets 13 5,446 3,970
Trade receivables 14 349,388 350,807
Current income tax receivables 6,323 6,931
Other receivables and prepaid expenses 15 66,349 65,519
Inventories 16 240,834 206,042
Total current assets 1,058,826 1,043,273
Property, plant and equipment 17 269,988 263,080
Intangible assets 20 1,219,598 1,161,070
Investments in associates / joint ventures 18 9,667 11,620
Other non-current financial assets 19 22,478 20,603
Deferred tax assets 9 111,074 94,102
Total non-current assets 1,632,805 1,550,475
Total assets 2,691,631 2,593,748
Liabilities and equity 1,000 CHF Notes 31.3.2015 31.3.2014
Current financial liabilities 22 3,101 93,828
Trade payables 72,896 75,283
Current income tax liabilities 95,584 61,870
Other short-term liabilities 23 206,548 204,036
Short-term provisions 21 111,933 101,509
Total current liabilities 490,062 536,526
Non-current financial liabilities 24 5,042 4,651
Long-term provisions 21 205,148 197,574
Other long-term liabilities 26 86,927 48,221
Deferred tax liabilities 9 32,648 32,401
Total non-current liabilities 329,765 282,847
Total liabilities 819,827 819,373
Share capital 27 3,359 3,359
Treasury shares (71,473) 4,285
Retained earnings and reserves 1,912,615 1,737,186
Equity attributable to equity holders of the parent 1,844,501 1,744,830
Non-controlling interests 27,303 29,545
Equity 1,871,804 1,774,375
Total liabilities and equity 2,691,631 2,593,748
The Notes are an integral part of the consolidated financial statements.
Consolidated financial statements 77
Sonova Annual Report 2014 / 15
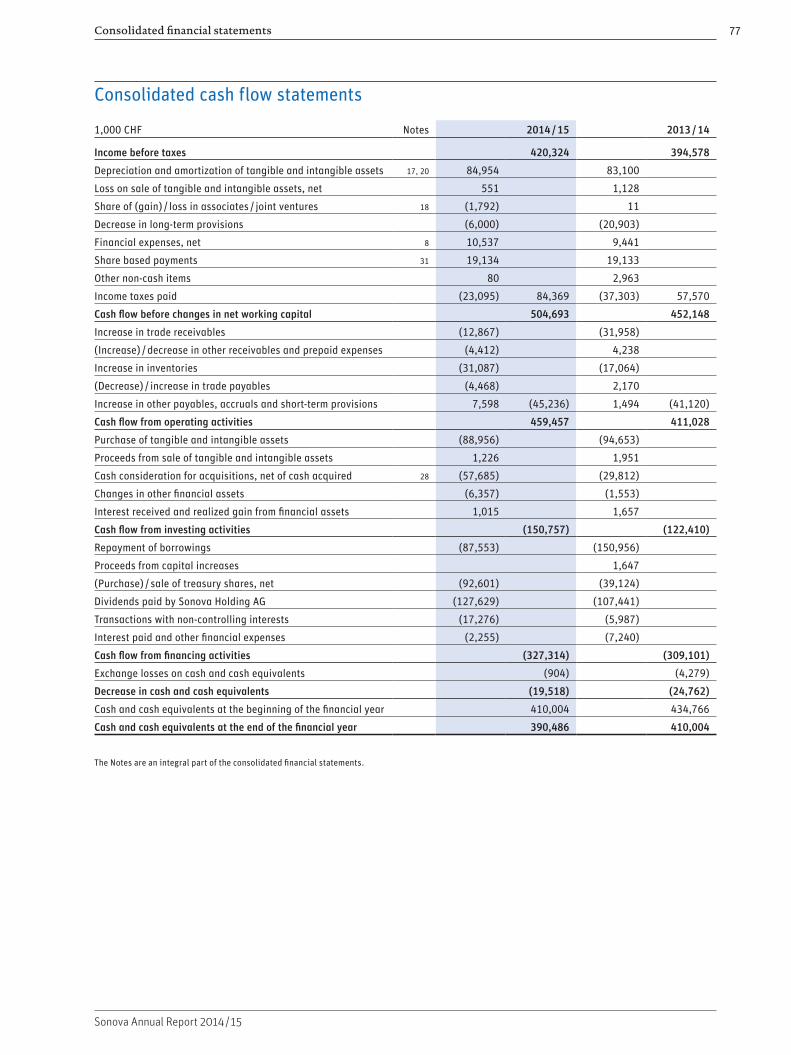
Consolidated cash flow statements
1,000 CHF Notes 2014 / 15 2013 / 14
Income before taxes 420,324 394,578
Depreciation and amortization of tangible and intangible assets 17, 20 84,954 83,100
Loss on sale of tangible and intangible assets, net 551 1,128
Share of (gain) / loss in associates / joint ventures 18 (1,792) 11
Decrease in long-term provisions (6,000) (20,903)
Financial expenses, net 8 10,537 9,441
Share based payments 31 19,134 19,133
Other non-cash items 80 2,963
Income taxes paid (23,095) 84,369 (37,303) 57,570
Cash flow before changes in net working capital 504,693 452,148
Increase in trade receivables (12,867) (31,958)
(Increase) / decrease in other receivables and prepaid expenses (4,412) 4,238
Increase in inventories (31,087) (17,064)
(Decrease) / increase in trade payables (4,468) 2,170
Increase in other payables, accruals and short-term provisions 7,598 (45,236) 1,494 (41,120)
Cash flow from operating activities 459,457 411,028
Purchase of tangible and intangible assets (88,956) (94,653)
Proceeds from sale of tangible and intangible assets 1,226 1,951
Cash consideration for acquisitions, net of cash acquired 28 (57,685) (29,812)
Changes in other financial assets (6,357) (1,553)
Interest received and realized gain from financial assets 1,015 1,657
Cash flow from investing activities (150,757) (122,410)
Repayment of borrowings (87,553) (150,956)
Proceeds from capital increases 1,647
(Purchase) / sale of treasury shares, net (92,601) (39,124)
Dividends paid by Sonova Holding AG (127,629) (107,441)
Transactions with non-controlling interests (17,276) (5,987)
Interest paid and other financial expenses (2,255) (7,240)
Cash flow from financing activities (327,314) (309,101)
Exchange losses on cash and cash equivalents (904) (4,279)
Decrease in cash and cash equivalents (19,518) (24,762)
Cash and cash equivalents at the beginning of the financial year 410,004 434,766
Cash and cash equivalents at the end of the financial year 390,486 410,004
The Notes are an integral part of the consolidated financial statements.
Consolidated financial statements78
Sonova Annual Report 2014 / 15
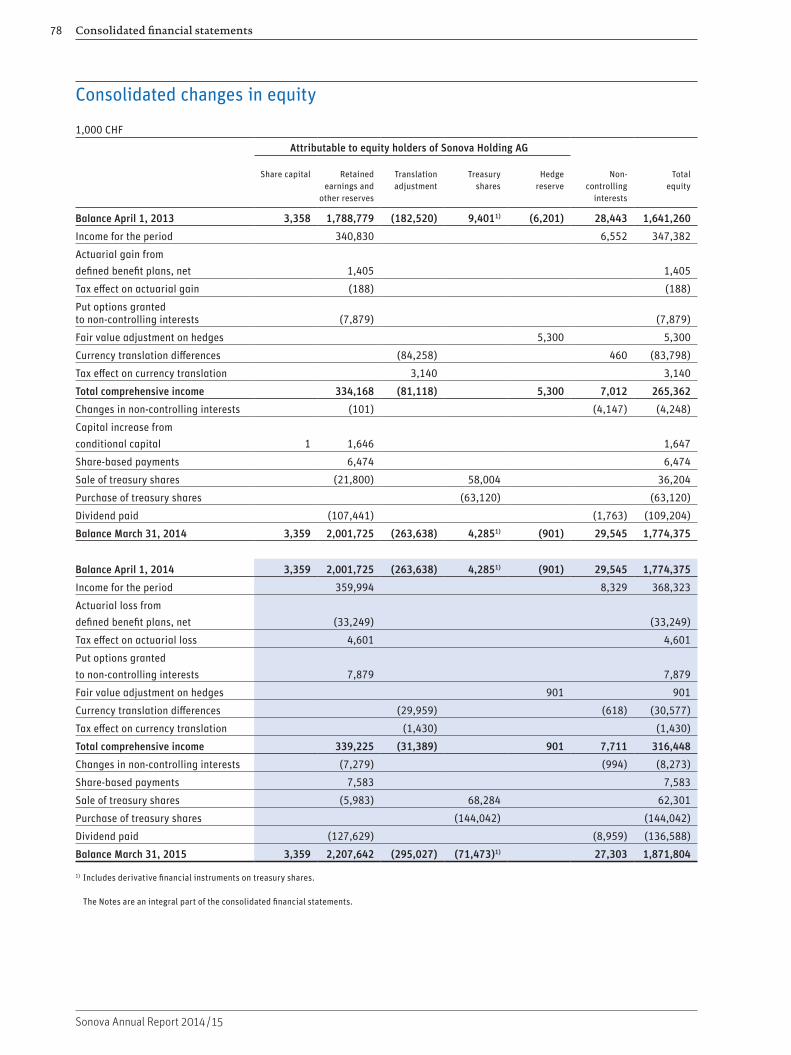
Consolidated changes in equity
1,000 CHF
Attributable to equity holders of Sonova Holding AG
Share capital Retained earnings and
other reserves
Translation adjustment
Treasury shares
Hedge reserve
Non- controlling
interests
Total equity
Balance April 1, 2013 3,358 1,788,779 (182,520) 9,4011) (6,201) 28,443 1,641,260
Income for the period 340,830 6,552 347,382
Actuarial gain from defined benefit plans, net 1,405 1,405
Tax effect on actuarial gain (188) (188)
Put options granted to non-controlling interests (7,879) (7,879)
Fair value adjustment on hedges 5,300 5,300
Currency translation differences (84,258) 460 (83,798)
Tax effect on currency translation 3,140 3,140
Total comprehensive income 334,168 (81,118) 5,300 7,012 265,362
Changes in non-controlling interests (101) (4,147) (4,248)
Capital increase from conditional capital 1 1,646 1,647
Share-based payments 6,474 6,474
Sale of treasury shares (21,800) 58,004 36,204
Purchase of treasury shares (63,120) (63,120)
Dividend paid (107,441) (1,763) (109,204)
Balance March 31, 2014 3,359 2,001,725 (263,638) 4,2851) (901) 29,545 1,774,375
Balance April 1, 2014 3,359 2,001,725 (263,638) 4,2851) (901) 29,545 1,774,375
Income for the period 359,994 8,329 368,323
Actuarial loss from defined benefit plans, net (33,249) (33,249)
Tax effect on actuarial loss 4,601 4,601
Put options granted to non-controlling interests 7,879 7,879
Fair value adjustment on hedges 901 901
Currency translation differences (29,959) (618) (30,577)
Tax effect on currency translation (1,430) (1,430)
Total comprehensive income 339,225 (31,389) 901 7,711 316,448
Changes in non-controlling interests (7,279) (994) (8,273)
Share-based payments 7,583 7,583
Sale of treasury shares (5,983) 68,284 62,301
Purchase of treasury shares (144,042) (144,042)
Dividend paid (127,629) (8,959) (136,588)
Balance March 31, 2015 3,359 2,207,642 (295,027) (71,473)1) 27,303 1,871,804
1) Includes derivative financial instruments on treasury shares. The Notes are an integral part of the consolidated financial statements.

79
Sonova Annual Report 2014 / 15
Notes to the consolidated financial statements as of March 31, 20151. Corporate information
The Sonova Group (the “Group”) specializes in the design, development, manufacture, worldwide distribution and service of technologically advanced hearing systems for adults and children with hearing impairment. The Group operates world-wide and distributes its products in over 90 countries through its own distribution network and through independent dis-tributors. The ultimate parent company is Sonova Holding AG, a limited liability company incorporated in Switzerland. Sonova Holding AG’s registered office is located at Laubis rütistrasse 28, 8712 Stäfa, Switzerland.
2. Basis of consolidated financial statements
The consolidated financial statements of the Group are based on the financial statements of the individual Group companies at March 31 prepared in accordance with uniform accounting policies. The consolidated financial statements have been prepared under the historical cost convention except for the revaluation of certain financial assets at market value, in accordance with International Financial Reporting Standards (IFRS), including International Accounting Standards (IAS) and Interpretations issued by the International Accounting Standards Board (IASB). The consolidated financial statements were approved by the Board of Directors of Sonova Holding AG on May 12, 2015 and are subject to approval by the Annual General Shareholders’ Meeting on June 16, 2015.
The consolidated financial statements include Sonova Holding AG as well as the domestic and foreign subsidiaries over which Sonova Holding AG exercises control. A list of the significant companies which are consolidated is given in Note 35.
The preparation of financial statements requires management to make estimates and assumptions that affect the amounts reported for assets and liabilities and contingent assets and liabilities at the date of the financial statements as well as revenue and expenses reported for the financial year (refer also to Note 2.7, “Significant accounting judgments and esti-mates”). Actual results could differ from these estimates.
2. 1 Changes in accounting policies
The following new standards and amendments have been adopted as of April 1, 2014 without having a significant impact on the Group’s result and financial position:
– IFRS 10 “Consolidated financial statements”; IFRS 12 “Dis-closures of interest in other entities”; IAS 27 “Consolidated and Separate Financial Statement”The amendments to the above mentioned standards are related to investment companies and develop an exemption from the requirement to consolidate subsidiaries. – IAS 32 “Financial Instruments Presentation”This is a clarification related to the offsetting of financial assets and financial liabilities. – IAS 36 “Impairment of Assets”This amendment restricts the requirement to disclose the recoverable amount of an asset to periods in which an impair-ment loss has been recognized or reversed and introduces additional disclosure for measurement based on fair value less costs of disposal in case of an impairment or reversal of an impairment. – IAS 39 “Financial Instruments: Recognition and Measure-ment”The clarification amends IAS 39 to allow a novation of a derivative that is designated as a hedging instrument if the novation is required by legislation or regulation without discontinuing hedge accounting. – Annual improvements of IFRS and interpretations (IFRIC)
Although the Group is still assessing the potential impacts of the various new and revised standards and interpretations that will be effective for the financial year starting April 1, 2015, based on the analysis to date the Group does not expect a significant impact on the Group’s result and financial posi-tion. The Group is also assessing other new and revised stan-dards which are not mandatory until after 2015, notably IFRS 15 “Revenues from Contracts with Customers”.
Consolidated financial statements80
Sonova Annual Report 2014 / 15
2. 2 Principles of consolidationInvestments in subsidiariesInvestments in subsidiaries are fully consolidated. These are entities over which Sonova Holding AG directly or indirectly exercises control. Control exists when the Group is exposed, or has rights, to variable returns from its relationship with an entity and has the power to affect those returns. Control is presumed to exist when the parent owns, directly or in - directly through subsidiaries, more than half of the voting power of an entity unless, in exceptional circumstances, it can be clearly demonstrated that such ownership does not constitute control. For the consolidated entities, 100 % of assets, liabilities, income, and expenses are included. Non-controlling interests in equity and net income or loss are shown separately in the balance sheet and income statement. Changes in the ownership interest of a subsidiary that does not result in a loss of control will be accounted for as an equity transac-tion. Neither goodwill nor any gains or losses will result.
Group Companies acquired during the year are included in the consolidation from the date on which control over the company is transferred to the Group. Group companies divested during the year are excluded from the consolidation as of the date the Group ceases to have control over the company. Inter-company balances and transactions (including unrealized profit on intercompany inventories) are eliminated in full.
Investments in associates and joint venturesInvestments in associates and joint ventures are accounted for using the equity method of accounting. Investments in associates are entities in which Sonova has a significant influ-ence but does not exercise control (usually 20 % – 50 % of voting rights). Joint ventures are joint arrangements whereby two or more parties have rights to the net assets of the arrange-ment.
Under the equity method, the investment in an associate / joint venture is initially recognized at cost (including goodwill on acquisition) and the carrying amount is increased or decreased to recognize Sonova’s share of profit or loss of the associ-ate / joint venture after the acquisition date. When the Group’s share of losses in an associate / joint venture equals or exceeds its interest in the associate / joint venture, no further losses are recognized, unless there is a legal or constructive obliga-tion. In order to apply the equity method the most recent available financial statements of an associate / joint venture are used, however due to practi cability reasons the reporting dates might vary up to three months from the Group’s report-ing date.
2. 3 Currency translation
The consolidated financial statements are expressed in Swiss francs (“CHF”), which is the Group’s presentation currency. The functional currency of each Group company is based on the local economic environment to which an entity is exposed, which is normally the local currency.
Transactions in foreign currencies are accounted for at the rates prevailing on the dates of the transactions. The resulting exchange differences are recorded in the local income state-ments of the Group companies and included in net income.
Monetary assets and liabilities of Group companies which are denominated in foreign currencies are translated using year-end exchange rates. Exchange differences are recorded as an income or expense. Non-monetary assets and liabilities are translated at historical exchange rates. Exchange differences arising on intercompany loans that are considered part of the net investment in a foreign entity are recorded in other com-prehensive income in equity.
When translating foreign currency financial statements into Swiss francs, year-end exchange rates are applied to assets and liabilities, while average annual rates are applied to income statement accounts (see Note 5). Translation differences arising from this process are recorded in other comprehensive income in equity. On disposal of a Group company, the related cumu-lative translation adjustment is transferred from equity to the income statement.
2. 4 Accounting and valuation principles
Cash and cash equivalentsThis item includes cash on hand and cash at banks, bank overdrafts, term deposits and other short-term highly liquid investments with original maturities of three months or less. The consolidated cash flow statement summarizes the move-ments in cash and cash equivalents.
Other current financial assets Other current financial assets consist of financial assets held for trading as well as short-term loans to third parties. Market-able securities within this category are classified as financial assets at fair value through profit or loss (see Note 2.5). Derivatives are classified as held for trading unless they are designated as hedges (see Note 2.6).
Assets in this category are classified as current assets if they are either held for trading or are expected to be realized within 12 months.
Trade receivablesTrade receivables are recorded at original invoice amount less provisions made for doubtful accounts. A provision for doubt-ful accounts is recorded when there is objective evidence that the Group will not be able to collect all amounts due according to the original terms of the invoice. The amount of the provi-sion is the difference between the carrying amount and the recoverable amount, the latter being the present value of expected cash flows.
InventoriesPurchased raw materials, components and finished goods are valued at the lower of cost or net realizable value. To evaluate cost, the standard cost method is applied, which approximates historical cost determined on a first-in first-out basis.
Consolidated financial statements 81
Sonova Annual Report 2014 / 15
Standard costs take into account normal levels of materials, supplies, labor, efficiency, and capacity utilization. Standard costs are regularly reviewed and, if necessary, revised in the light of current conditions. Net realizable value is the estimated selling price in the ordinary course of business less the esti-mated costs of completion (where applicable) and selling expenses. Manufactured finished goods and work-in-process are valued at the lower of production cost or net realiz able value. Provisions are established for slow-moving, obsolete and phase-out inventory.
Property, plant and equipmentProperty, plant and equipment is valued at purchase or manu-facturing cost less accumulated depreciation and any impair-ment in value. Depreciation is calculated on a straight-line basis over the expected useful lifetime of the individual assets or asset categories. Where an asset comprises several parts with different useful lifetimes, each part of the asset is depre-ciated separately over its applicable useful lifetime. The appli-cable useful lifetimes are 25 – 40 years for buildings and 3 – 10 years for production facilities, machinery, equipment, and vehicles. Land is not depreciated. Leasehold improvements are depreciated over the shorter of useful life or lease term.
Subsequent expenditure on an item of tangible assets is capitalized at cost only when it is probable that future economic benefits associated with the item will flow to the Group and the cost of the item can be measured reliably. Expenditure for repair and maintenance which do not increase the estimated useful lifetimes of the related assets are recognized as an expense in the period in which they are incurred.
LeasingThere are no assets that are held under leases which effectively transfer to the Group the risks and rewards of ownership (finance leases). Therefore all leases are classified as operat-ing leases, and payments are recognized as an expense on a straight-line basis over the lease term unless another system-atic basis is more representative of the time pattern of the Group’s benefit.
Intangible assetsPurchased intangible assets such as software, licenses and patents are measured at cost less accumulated amorti zation (applying the straight-line method) and any impairment in value. Software is amortized over a useful lifetime of 3 – 5 years. Intangibles relating to acquisitions of subsidi aries (excluding goodwill) consist generally of technology, client relationships, customer lists, and brand names, and are amor-tized over a period of 3 – 15 years. Other intangible assets are generally amortized over a period of 3 – 10 years. For capital-ized development costs amortization starts when the capital-ized asset is ready for use, which is generally after receipt of approval from regulatory bodies. These assets are amortized over the estimated useful life of 2 – 7 years applying the straight-line method. For in-process capitalized development costs these capitalized costs are tested annually for impair-ment. Except for goodwill, the Sonova Group has no intan-gible assets with an indefinite useful life.
Research and developmentResearch costs are expensed as incurred. Development costs are capitalized only if the identifiable asset is commercially and technically feasible, can be completed, its costs can be measured reliably and will generate probable future economic benefits. Group expenditures which fulfill these criteria are limited to the development of tooling and equipment as well as costs related to the development of cochlear implants. All other development costs are expensed as incurred. In addition to the internal costs (direct personnel and other operating costs, depreciation on research and development equipment and allocated occupancy costs), total costs also include externally contracted development work. Such capital-ized intangibles are recognized at cost less accumulated amor-tization and impairment losses.
Business combinations and goodwillBusiness combinations are accounted for using the acqui sition method of accounting. The cost of a business combination is equal to the fair values, at the date of exchange, of assets given, liabilities incurred or assumed, and equity instruments issued by the Sonova Group, in exchange for control over the acquired company. Any difference between the cost of the business combination and the net fair value of the identifiable assets, liabilities, and contingent liabilities so recognized is treated as goodwill. Goodwill is not amortized, but is assessed for impairment annually, or more frequently if events or changes in circumstances indicate that its value might be impaired. Acquisition-related costs are expensed. For each business combination, the Group recognizes the non-control-ling interests in the acquiree at fair value or at the non-con-trolling interests proportionate share in the recognized amounts of the acquiree’s identifiable net assets.
If a business combination is achieved in stages (control obtained over an associate), the previously held equity inter-est in an associate is remeasured to its acquisition-date fair value and any resulting gain or loss is recognized in “financial income / expenses” in profit or loss.
Other non-current financial assets Other non-current financial assets consist of investments in third parties and long-term receivables from associates and third parties. Investments in third parties are classified as financial assets at fair value through profit or loss and long-term receivables from associates and third parties are classified as loans and receivables (see Note 2.5).
Current financial liabilitiesCurrent financial liabilities consist of short-term bank debt and all other interest bearing debt with a maturity of 12 months or less. Given the short-term nature of these debts they are recorded at nominal value. In addition, current finan-cial liabilities also consist of financial liabilities resulting from earn-out agreements as well as deferred payments from acqui-sitions with a maturity of 12 months or less. In the case of earn-outs, they are classified as financial liabilities at fair value through profit or loss.

Consolidated financial statements82
Sonova Annual Report 2014 / 15
ProvisionsProvisions are recognized when the Group has a present obli-gation (legal or constructive) as a result of a past event, where it is probable that an outflow of resources will be required to settle the obligation, and where a reliable estimate can be made of the amount of the obligation. If the effect of the time value of money is material, provisions are determined by discounting the expected future cash flows.
The Group recognizes provisions for warranty costs to cover any costs arising from the warranty given on its products sold (including costs for legal proceedings and related costs). The provision is calculated using historical and projected data on warranty rates, claim rates and amounts, service costs, remain-ing warranty period and number of hearing aids and implants on which the warranty is still active. Short-term portions of warranty provisions are reclassified to short-term provisions at each reporting date.
Share capitalOrdinary shares are classified as equity. Dividends on ordinary shares are recorded in equity in the period in which they are approved by the parent companies’ shareholders.
In case any of the Group Companies purchases shares of the parent company, the consideration paid is recognized as trea-sury shares and presented as a deduction from equity. Any consideration received from the sale of own shares is recog-nized in equity.
Income taxesIncome taxes include current and deferred income taxes. The Sonova Group is subject to income taxes in numerous jurisdic-tions and significant judgment is required in determining the worldwide provision for income taxes. The multitude of trans-actions and calculations implies estimates and assumptions. The Group recognizes liabilities based on estimates of whether additional taxes will be due.
Where the final tax outcome is different from the amounts that were initially recorded, such differences will impact the income tax and deferred tax provisions in the period in which such determination is made. Deferred tax is recorded on the valu-ation differences (temporary differences) between the tax bases of assets and liabilities and their carrying values in the consolidated balance sheet. Deferred tax assets are recognized to the extent that it is probable that future taxable income will be available against which the temporary differences and tax losses can be offset. Deferred income tax liabilities are provided for on taxable temporary differences arising from investments in subsidiaries, except for deferred income tax liability where the timing of the reversal of the temporary difference is con-trolled by the group and it is probable that the temporary difference will not reverse in the foreseeable future.
Revenue recognitionSales are recognized net of sales taxes and discounts upon delivery of products and services and reasonably assured collectibility of the related receivables.
For hearing instruments sold, as standard industry practice, a trial period is granted to the end consumer. Probable returns
of products are estimated and a corresponding provision is recognized. The portion of goods sold that are expected to be returned are estimated based on historical product return rates. For cochlear implants, sales are generally recognized upon delivery to the hospital.
Sales of service contracts, such as long-term service contracts and extended warranties are separated from the sale of goods and recognized on a straight-line basis over the term of the contract.
Interest income is recognized on a time proportion basis using the effective interest method. Dividend income is recognized when the right to receive payment is established.
Acquisition-related amortizationThe Group is continuously amending its business portfolio with small acquisitions resulting in acquisition-related intan-gibles (see section “Intangible Assets”) and related amortiza-tion charges. The Group discloses acquisition-related amor-tization as a separate line item in the income statement, and identifies EBITA as its key profit metric for internal (refer to Note 6) as well as for external reporting purposes. The func-tional allocation of these acquisition-related amortization costs are further disclosed in Note 20 “Intangible Assets” in the notes to the financial statements.
Segment reportingOperating segments are defined on the same basis as informa-tion is provided to the chief operating decision maker. For the Sonova Group, the Chief Executive Officer (CEO) is the chief operating decision maker, who is responsible for allocating resources and assessing the performance of operating seg-ments. Additional general information regarding the factors used to identify the entity’s reportable segments are disclosed in Note 6.
Impairment of non-financial assetsThe Group assesses at each reporting date whether there is any indication that an asset may be impaired. If any such indication exists, the recoverable amount of the asset is esti-mated. The recoverable amount of an asset or, where it is not possible to estimate the recoverable amount of an individual asset, a cash-generating unit is the higher of its fair value less cost of disposal and its value in use. Value in use is the present value of the future cash flows expected to be derived from an asset or cash-generating unit. If the recoverable amount is lower than the carrying amount, an impairment loss is recog-nized. Impairments of financial assets are described in Note 2.5, Financial assets. For the purpose of impairment testing, goodwill as well as corporate assets are allocated to cash generating units. A goodwill impairment test is performed annually, even if there is no indication of impairment (see section “Business combinations and goodwill”).
Related partiesA party is related to an entity if the party directly or indirectly controls, is controlled by, or is under common control with the entity, has an interest in the entity that gives it significant influence over the entity, has joint control over the entity or is an associate or a joint venture of the entity. In addition, members of the Board of Directors and the Management Board

Consolidated financial statements 83
Sonova Annual Report 2014 / 15
or close members of their families are also considered related parties as well as post-employment plan organizations (pension funds) for the benefit of Sonova employees. No related party exercises control over the Group.
Employee benefitsPension obligations Most employees are covered by post-employment plans spon-sored by corresponding Group companies in the Sonova Group. Such plans are mainly defined contribution plans (future bene-fits are determined by reference to the amount of contributions paid) and are generally administered by autonomous pension funds or independent insurance companies. These pension plans are financed through employer and employee contribu-tions. The Group’s contributions to defined contribution plans are charged to the income statement in the year to which they relate.
Sonova Group also has several defined benefit pension plans, both funded and unfunded. Accounting and reporting of these plans are based on annual actuarial valuations. Defined benefit obligations and service costs are assessed using the projected unit credit method: the cost of providing pensions is charged to the income statement so as to spread the regular cost over the service lives of employees participating in these plans. The pension obligation is measured as the present value of the estimated future outflows using interest rates of govern-ment securities which have terms to maturity approximating the terms of the related liability. Service costs from defined benefit plans are charged to the appropriate income statement heading within the operating results.
A single net interest component is calculated by applying the discount rate to the net defined benefit asset or liability. The net interest component is recognized in the income statement in the financial result.
Actuarial gains and losses, resulting from changes in actua r-ial assumptions and differences between assumptions and actual experiences, are recognized in the period in which they occur in other comprehensive income in equity.
Other long-term benefitsOther long-term benefits mainly comprise length of service compensation benefits in certain Group companies. These benefits are accrued and the corresponding liabilities are included under “Other provisions”. Equity compensation benefitsThe Board of Directors of Sonova Holding AG, the Management Board, and certain management and senior employees of other Group companies participate in equity compensation plans. The fair value of all equity compensation awards granted to employees is determined at the grant date and recorded as an expense over the vesting period (for details refer to Note 31). The expense for equity compen sation awards is charged to the appropriate income statement heading within the operating result and an equivalent increase in equity (for equity-settled compensation) or financial liability (for cash-settled compensa-tion) is recorded. In the case of cash-settled compensation, until the liability is settled it is revalued at each reporting date, recognizing changes in the fair value in the income statement.
2. 5 Financial assets
Sonova classifies its financial assets in the categories financial assets at fair value through profit or loss, loans and receivables. Management determines the classification of its investments at initial recognition. All purchases and sales are recognized on the settlement date.
Financial assets at fair value through profit or lossFinancial assets at fair value through profit or loss consist of cash-settled calls on Sonova shares as a hedge against obliga-tions from warrant appreciation rights (WARs) and share appreciation rights (SARs) allocated to US employees participating in the Executive Equity Award Plan (EEAP) and certain minority investments in hearing aid related businesses. These financial assets are measured at their fair value. Those fair value changes are included in the profit or loss for the period in which they arise.
Loans and receivables Loans and receivables are non-derivative financial assets with fixed or determinable payments that are not quoted in an active market. They arise when the Group provides money, goods or services, directly to a debtor with no intention of trading the receivable. They are included in current assets, except for maturities of more than 12 months, these are classified as non-current assets. Loans are measured at amor-tized cost. Amortized cost is the amount at which the financial asset is measured at initial recognition minus principal repay-ments, plus or minus the cumulative amortization using the effective interest method of any difference between the initial amount and the maturity amount, minus any reduction for impairment or uncollectibility. The effective interest method is a method calculating the amortized cost of a financial asset and allocating the interest income over the relevant period. The effective interest rate is the rate that exactly discounts estimated future cash payments or receipts through the expected lifetime of the financial instrument or, when appro-priate, a shorter period to the net carrying amount of the financial asset.
Impairment of financial assetsA financial asset is impaired if its carrying amount is greater than its estimated recoverable amount. The Group assesses, at each balance sheet date, whether there is any objective evidence that a financial asset may be impaired. If any such evidence exists, the Group estimates the recoverable amount of that asset and recognizes any impairment loss in the income statement. If, in a subsequent period, the amount of the impair-ment loss decreases and the decrease can be objectively related to an event occurring after the write-down, the write-down of the financial asset is reversed. The reversal will not result in a carrying amount of the financial asset that exceeds what the amortized cost would have been, had the impairment not been recognized, at the date the write-down of the finan-cial asset is reversed. The amount of the reversal is included in profit or loss for the financial year.

Consolidated financial statements84
Sonova Annual Report 2014 / 15
2. 6 Derivative financial instruments and hedging
The Group regularly hedges its net exposure from foreign currency balance sheet positions with forward contracts and options. Such contracts are not qualified as cash flow hedges and are therefore not accounted for using hedge accounting. Gains and losses on these transactions are recognized directly in the income statement. The forward and option contracts are entered into and closed within the half-year reporting periods.
In connection with the acquisition of Advanced Bionics, the Group entered into an interest swap agreement to protect the company against rising interest rates. The agreement qualified for hedge accounting and the gain or loss on the hedging instrument was recognized in other comprehensive income in equity. In the 2014 / 15 financial year all of the underlying debt relating to this transaction was paid back and the swap agreement was closed accordingly (for further information refer Note 22).
2. 7 Significant accounting judgments and estimates
Key management judgments made in applying accounting policiesIn the process of applying the Group’s accounting policies, management may be required to make judgments, apart from those involving estimates, which have an effect on the amounts recognized in the financial statements.
These include, but are not limited to, the following areas:
Capitalization of development costsAs outlined under 2.4 “Accounting and valuation principles” the Group capitalizes costs relating to the development of cochlear implants. In determining the commercial as well as the technical feasibility, management judgment may be required.
Business combinationsIn the course of recognizing assets and liabilities from busi-ness combinations management judgments might be required for the following areas:
– Acquisition-related intangibles resulting from technology, customer relationships, client lists or brand names. – Contingent consideration arrangements.
Key accounting estimates and assumptionsPreparation of financial statements in conformity with IFRS requires management to make estimates and assumptions that affect the reported amounts of assets, liabilities, revenue, expenses, and related disclosures. This includes estimates and assumptions in the ordinary course of business as well as non-operating events such as the outcome of pending legal disputes. The estimates and assumptions are continuously evaluated and are based on experience and other factors, including expectations of future events that are believed to be reasonable. Actual results may differ from these estimates and assumptions. The main estimates and assumptions with the potential of causing an adjustment, are discussed below.
Cost of business combinationsA business combination agreement may provide for an adjust-ment to the cost of the combination contingent on future events. If the future events do not occur or the estimate needs to be revised, the cost of a business combination is revised accord-ingly, with a resulting change in the carrying value of goodwill (for business combinations entered into before April 1, 2010) or in the income statement (for business combinations entered into after April 1, 2010). At the end of the financial year 2014 / 15 such liabilities contingent on future events amount to CHF 6.8 million (previous year CHF 8.5 million) and are disclosed under other provisions (for business combinations entered into before April 1, 2010) or other financial liabilities (for business combinations entered into after April 1, 2010).
Intangible assets, including goodwill The Group has intangible assets with a carrying value of CHF 1,219.6 million (previous year CHF 1,161.1 million) as disclosed in Note 20.
Included in the intangible assets is goodwill amounting to CHF 971.5 million (previous year CHF 920.6 million).
Furthermore intangible assets also include capitalized devel-opment costs in the amount of CHF 96.3 million (pre vious year CHF 76.8 million). The Group determines annually, in accordance with the accounting policy stated in Note 2.4, whether any of the assets are impaired. For the impairment tests, estimates are made of the expected future cash flows from the use of the asset or cash-generating unit. The actual cash flows could vary sig-nificantly from these estimates.
Deferred tax assetsThe consolidated balance sheet includes deferred tax assets of CHF 111.1 million (previous year CHF 94.1 million) related to deductible differences and, in certain cases, tax loss carry-forwards, provided that their utilization appears probable. The recoverable value is based on forecasts of the correspond-ing taxable Group company over a period of several years. As actual results may differ from these forecasts, the deferred tax assets may need to be adjusted accordingly.
Consolidated financial statements 85
Sonova Annual Report 2014 / 15
Employee benefit plansThe Sonova Group has various employee benefit plans. Most of its salaried employees are covered by these plans, of which some are defined benefit plans. The present value of the defined benefit obligations at the end of the financial period 2014 / 15 amounts to CHF 350.3 million (previous year CHF 269.1 million) as disclosed in Note 30. This includes CHF 347.1 million (pre-vious year CHF 265.6 million) from the Swiss pension plan. With such plans, actuarial assumptions are made for the purpose of estimating future developments, including esti-mates and assumptions relating to discount rates, and future wage as well as pension trends. Actuaries also use statistical data such as mortality tables and staff turnover rates with a view to determining employee benefit obligations. If these factors change due to a change in economic or market condi-tions, the subsequent results could deviate considerably from the actuarial reports and calculations. Over the medium term such deviations could have an impact on the equity. The car-rying amounts of the plan assets and liabilities in the balance sheet together with a sensitivity analysis considering changes for the main input parameters in the actuarial valuation are set out in Note 30.
Provisions for warranty and returnsOn March 31, 2015 the Group recorded provisions for warranty and returns of CHF 83.0 million (previous year CHF 72.2 million) as disclosed in Note 21.
The calculation of these provisions is based on turnover, past experience and projected number and cost of warranty claims and returns. The actual costs for warranty, claims, and returns may differ from these estimates.
Provision for product liabilitiesThe Sonova Group accounts consider a provision for product liabilities related to products affected by a voluntary cochlear implant product recall of Advanced Bionics LLC in 2006. The provision was substantially increased as per the end of the financial year 2012 / 13. In 2013 / 14 settlement agreements regarding the majority of the then-current filed and unfiled claims related to the before mentioned cochlear implant prod-ucts were signed, which were in line with the underlying assumptions of the provision and did not have an impact on the profit for the financial year 2013 / 14.
As of the end of the financial year 2014 / 15 the provision for the above mentioned cochlear implant product liabilities has been reassessed. Improvements in the expected number and cost of current and future claims led to a reduction of CHF 13.2 million which is contributing to the profit of 2014 / 15 in the same amount (disclosed in the annual income statement in the line “Other income / (expenses), net”).
On March 31, 2015 the provision for the before mentioned cochlear implant product liabilities was CHF 192.5 million (previous year CHF 192.0 million).
The calculation of this provision is based on past experience regarding the number and cost of current and future claims. As actual results may differ from these forecasts, the respec-tive provision may need to be adjusted accordingly.
Other provisions On March 2, 2015 Sonova has announced to transfer a part of its hearing instrument product assembly capacity from Stäfa to other centers while maintaining the production of strategi-cally critical core components in Switzerland. Functions are planned to be gradually transferred over the course of the 2015 / 16 fiscal year, affecting around 100 positions in total. Restructuring cost of CHF 6.0 million have been considered and were included in the annual income statement 2014 / 15 in the line “Cost of sales”.
3. Changes in Group structure
In the financial years 2014 / 15 and 2013 / 14 the Group entered into several business combinations. The companies acquired are in the business of producing and distributing hearing instruments.
With effect of October 2, 2014 Sonova Holding AG acquired 100 % of the shares of Comfort Audio i Halmstad AB (Sweden). Comfort Audio is specialized in the development, manufactur-ing and distribution of assistive listening devices and employs around 90 staff, mainly in Sweden.
The effect of the acquisitions for the financial year 2014 / 15 and 2013 / 14 is disclosed in Note 28.

Consolidated financial statements86
Sonova Annual Report 2014 / 15
4. Number of employees
On March 31, 2015, the Sonova Group employed the full time equivalent of 10,184 people (previous year 9,529). They were engaged in the following regions and activities:
By region 31.3.2015 31.3.2014
Switzerland 1,238 1,189
EMEA (excl. Switzerland) 2,919 2,531
Americas 3,585 3,451
Asia / Pacific 2,442 2,358
Total 10,184 9,529
By activity
Research and development 674 617
Operations 3,755 3,675
Sales and marketing, general and administration 5,755 5,237
Total 10,184 9,529
The average number of employees (full time equivalents) of the Sonova Group for the year was 9,960 (previous year 9,175). Total personnel expenses for the financial year 2014 / 15 amounted to CHF 720.0 million (previous year CHF 675.2 million).
5. Exchange rates
The following main exchange rates were used for currency translation:
31.3.2015 31.3.2014 2014 / 15 2013 / 14
Year-end rates Average rates for the year
AUD 1 0.74 0.82 0.81 0.86
BRL 1 0.30 0.39 0.38 0.41
CAD 1 0.77 0.80 0.82 0.87
CNY 1 0.16 0.14 0.15 0.15
EUR 1 1.04 1.22 1.18 1.23
GBP 1 1.44 1.48 1.50 1.46
JPY 100 0.81 0.86 0.85 0.92
USD 1 0.98 0.89 0.93 0.92
Consolidated financial statements 87
Sonova Annual Report 2014 / 15
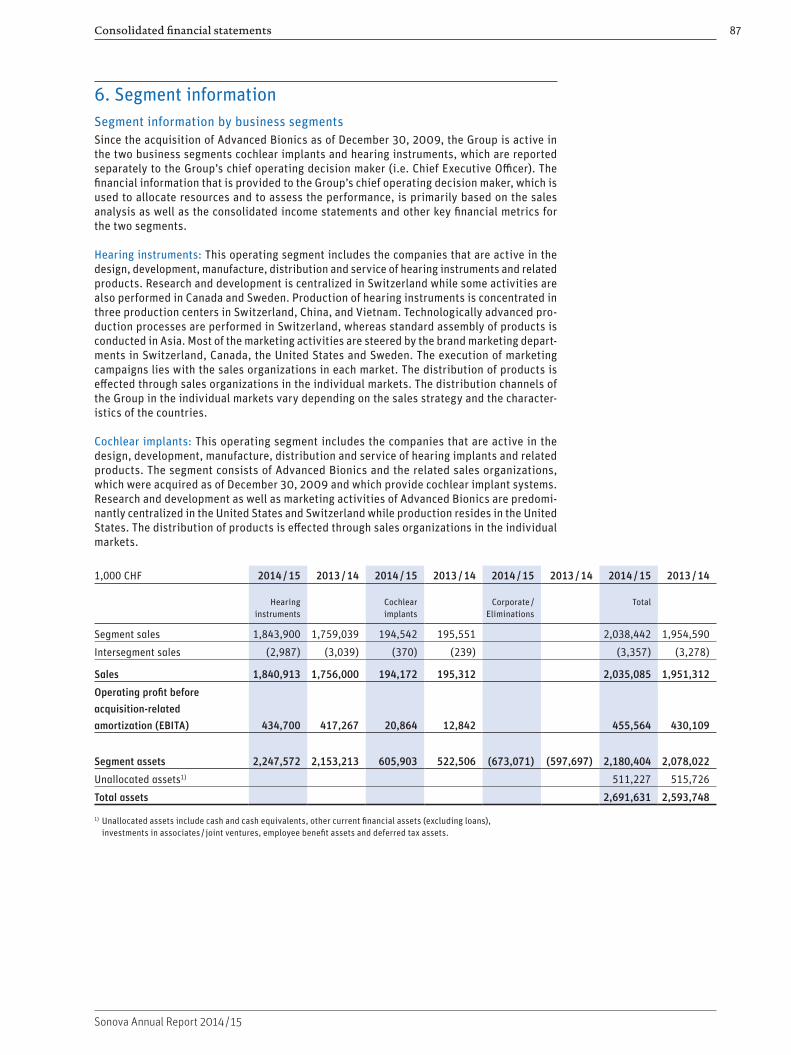
6. Segment informationSegment information by business segmentsSince the acquisition of Advanced Bionics as of December 30, 2009, the Group is active in the two business segments cochlear implants and hearing instruments, which are reported separately to the Group’s chief operating decision maker (i.e. Chief Executive Officer). The financial information that is provided to the Group’s chief operating decision maker, which is used to allocate resources and to assess the performance, is primarily based on the sales analysis as well as the consolidated income statements and other key financial metrics for the two segments.
Hearing instruments: This operating segment includes the companies that are active in the design, development, manufacture, distribution and service of hearing instruments and related products. Research and development is centralized in Switzerland while some activities are also performed in Canada and Sweden. Production of hearing instruments is concentrated in three production centers in Switzerland, China, and Vietnam. Technologically advanced pro-duction processes are performed in Switzerland, whereas standard assembly of products is conducted in Asia. Most of the marketing activities are steered by the brand marketing depart-ments in Switzerland, Canada, the United States and Sweden. The execution of marketing campaigns lies with the sales organizations in each market. The distribution of products is effected through sales organizations in the individual markets. The distribution channels of the Group in the individual markets vary depending on the sales strategy and the character-istics of the countries.
Cochlear implants: This operating segment includes the companies that are active in the design, development, manufacture, distribution and service of hearing implants and related products. The segment consists of Advanced Bionics and the related sales organizations, which were acquired as of December 30, 2009 and which provide cochlear implant systems. Research and development as well as marketing activities of Advanced Bionics are predomi-nantly centralized in the United States and Switzerland while production resides in the United States. The distribution of products is effected through sales organizations in the individual markets.
1,000 CHF 2014 / 15 2013 / 14 2014 / 15 2013 / 14 2014 / 15 2013 / 14 2014 / 15 2013 / 14
Hearing instruments
Cochlear implants
Corporate / Eliminations
Total
Segment sales 1,843,900 1,759,039 194,542 195,551 2,038,442 1,954,590
Intersegment sales (2,987) (3,039) (370) (239) (3,357) (3,278)
Sales 1,840,913 1,756,000 194,172 195,312 2,035,085 1,951,312
Operating profit before acquisition-related amortization (EBITA) 434,700 417,267 20,864 12,842 455,564 430,109
Segment assets 2,247,572 2,153,213 605,903 522,506 (673,071) (597,697) 2,180,404 2,078,022
Unallocated assets1) 511,227 515,726
Total assets 2,691,631 2,593,748
1) Unallocated assets include cash and cash equivalents, other current financial assets (excluding loans), investments in associates / joint ventures, employee benefit assets and deferred tax assets.
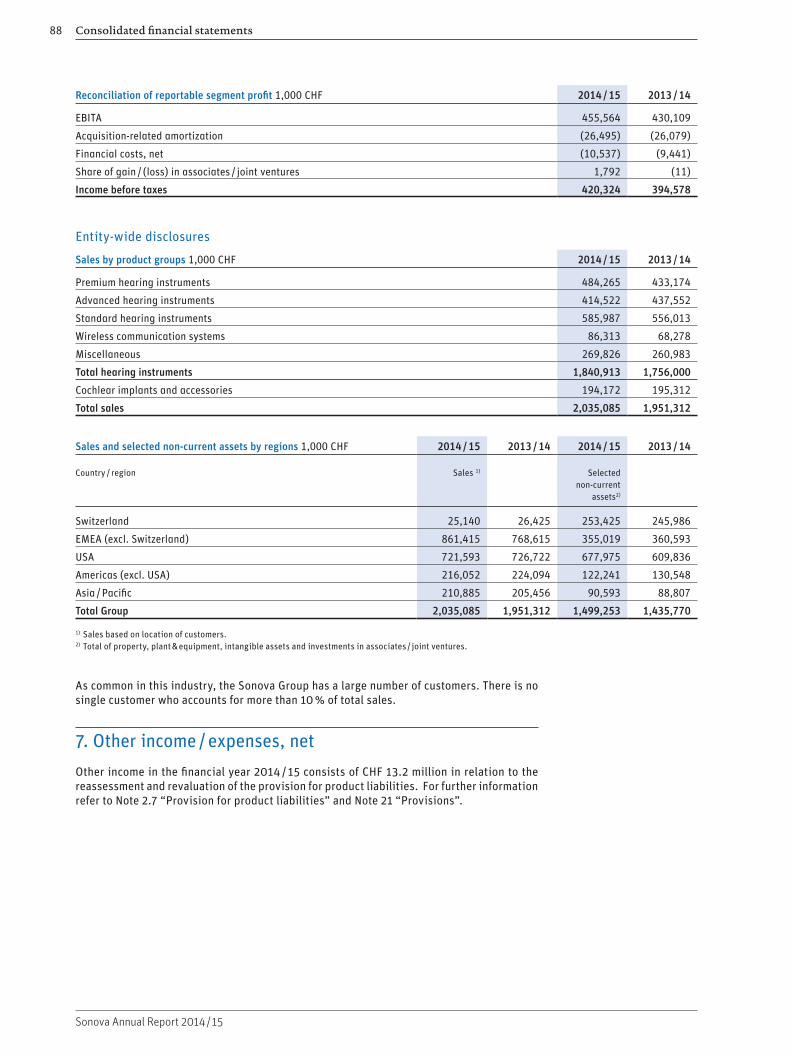
Consolidated financial statements88
Sonova Annual Report 2014 / 15
Reconciliation of reportable segment profit 1,000 CHF 2014 / 15 2013 / 14
EBITA 455,564 430,109
Acquisition-related amortization (26,495) (26,079)
Financial costs, net (10,537) (9,441)
Share of gain / (loss) in associates / joint ventures 1,792 (11)
Income before taxes 420,324 394,578
Entity-wide disclosures
Sales by product groups 1,000 CHF 2014 / 15 2013 / 14
Premium hearing instruments 484,265 433,174
Advanced hearing instruments 414,522 437,552
Standard hearing instruments 585,987 556,013
Wireless communication systems 86,313 68,278
Miscellaneous 269,826 260,983
Total hearing instruments 1,840,913 1,756,000
Cochlear implants and accessories 194,172 195,312
Total sales 2,035,085 1,951,312
Sales and selected non-current assets by regions 1,000 CHF 2014 / 15 2013 / 14 2014 / 15 2013 / 14
Country / region
Sales 1) Selected non-current
assets2)
Switzerland 25,140 26,425 253,425 245,986
EMEA (excl. Switzerland) 861,415 768,615 355,019 360,593
USA 721,593 726,722 677,975 609,836
Americas (excl. USA) 216,052 224,094 122,241 130,548
Asia / Pacific 210,885 205,456 90,593 88,807
Total Group 2,035,085 1,951,312 1,499,253 1,435,770
1) Sales based on location of customers.2) Total of property, plant & equipment, intangible assets and investments in associates / joint ventures.
As common in this industry, the Sonova Group has a large number of customers. There is no single customer who accounts for more than 10 % of total sales.
7. Other income / expenses, net
Other income in the financial year 2014 / 15 consists of CHF 13.2 million in relation to the reassessment and revaluation of the provision for product liabilities. For further information refer to Note 2.7 “Provision for product liabilities” and Note 21 “Provisions”.

Consolidated financial statements 89
Sonova Annual Report 2014 / 15
8. Financial expenses, net1,000 CHF 2014 / 15 2013 / 14
Interest income 1,069 2,130
Other financial income 24 3,260
Total financial income 1,093 5,390
Interest expenses (2,948) (7,641)
Other financial expenses (8,682) (7,190)
Total financial expenses (11,630) (14,831)
Total (10,537) (9,441)
Other financial income in 2013 / 14 includes, amongst other items, the gain from remeasuring previously held equity investments to fair value at date of acquisition of these companies.
Other financial expenses in 2014 / 15 and 2013 / 14 include, amongst other items, the unwind-ing of the discount on provisions and earn-out payments, fair value adjustments of financial instruments as well as the costs for entering into forward foreign currency contracts.
9. Taxes1,000 CHF 2014 / 15 2013 / 14
Income taxes 67,163 28,217
Change in deferred taxes (15,162) 18,979
Total tax expense 52,001 47,196
Reconciliation of tax expense
Income before taxes 420,324 394,578
Group’s expected average tax rate 13.9 % 13.5 %
Tax at expected average rate 58,245 53,313
+ / – Effects of
Expenses not subject to tax, net 4,193 3,256
Changes of unrecognized loss carryforwards / deferred tax assets 3,458 25,853
Local actual tax rate different to Group’s expected average tax rate (20,007) (39,502)
Change in tax rates on deferred tax balances 5,798 80
Prior year adjustments and other items, net 314 4,196
Total tax expense 52,001 47,196
Weighted average effective tax rate 12.4 % 12.0 %
The Group’s expected average tax rate is the aggregate obtained by applying the expected tax rate for each individual jurisdiction to its respective result before taxes.

Consolidated financial statements90
Sonova Annual Report 2014 / 15
Deferred tax assets and (liabilities) 1,000 CHF 31.3.2015
Property, plant & equipment
Intangible assets
Inventories, receivables,
provisions and other liabilities
Tax loss carryforwards
Total
Balance April 1 (6,130) (12,803) 28,236 52,398 61,701
Changes through business combinations (4,101) (4,101)
Deferred taxes recognized in the income statement 190 (3,653) (1,424) 20,049 15,162
Deferred taxes recognized in OCI1) 4,601 4,601
Exchange differences 33 4,451 (2,881) (540) 1,063
Balance March 31 (5,907) (16,106) 28,532 71,907 78,426
Amounts in the balance sheet
Deferred tax assets 111,074
Deferred tax liabilities (32,648)
Total deferred taxes, net 78,426
1) Other comprehensive income.
Deferred tax assets and (liabilities) 1,000 CHF 31.3.2014
Property, plant & equipment
Intangible assets
Inventories, receivables,
provisions and other liabilities
Tax loss carryforwards
Total
Balance April 1 (5,182) (20,232) 44,278 52,092 70,956
Changes through business combinations (2,699) 6 (2,693)
Deferred taxes recognized in the income statement (860) 8,947 (19,555) (7,511) (18,979)
Deferred taxes recognized in OCI1) (188) (188)
Exchange differences (88) 1,181 3,701 7,811 12,605
Balance March 31 (6,130) (12,803) 28,236 52,398 61,701
Amounts in the balance sheet
Deferred tax assets 94,102
Deferred tax liabilities (32,401)
Total deferred taxes, net 61,701
1) Other comprehensive income.
Deferred tax assets have been capitalized based on the projected future performance of the Group companies.
The gross values of unused tax loss carryforwards, which have not been capitalized as deferred tax assets, with their expiry dates are as follows:
1,000 CHF 31.3.2015 31.3.2014
Within 1 – 3 years 41,447 12,244
Within 4 years 28,702 11,097
Within 5 years 9,134 24,515
More than 5 years 334,380 347,671
Total 413,663 395,527
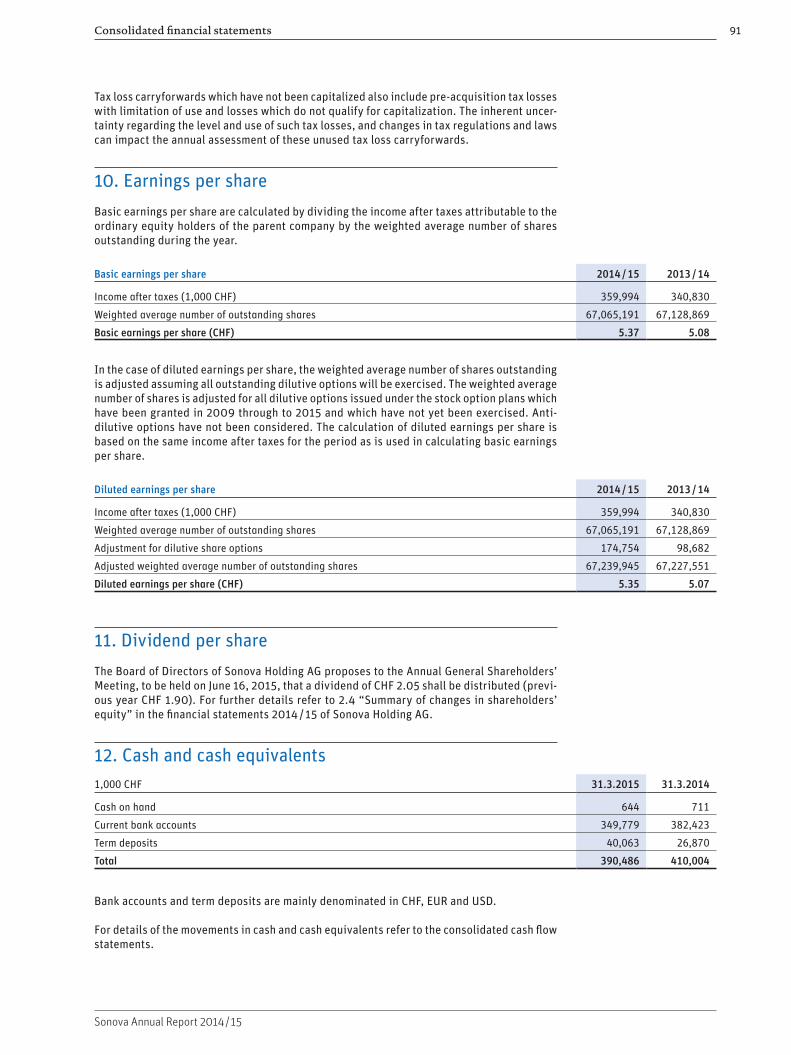
Consolidated financial statements 91
Sonova Annual Report 2014 / 15
Tax loss carryforwards which have not been capitalized also include pre-acquisition tax losses with limitation of use and losses which do not qualify for capitalization. The inherent uncer-tainty regarding the level and use of such tax losses, and changes in tax regulations and laws can impact the annual assessment of these unused tax loss carryforwards.
10. Earnings per share
Basic earnings per share are calculated by dividing the income after taxes attributable to the ordinary equity holders of the parent company by the weighted average number of shares outstanding during the year.
Basic earnings per share 2014 / 15 2013 / 14
Income after taxes (1,000 CHF) 359,994 340,830
Weighted average number of outstanding shares 67,065,191 67,128,869
Basic earnings per share (CHF) 5.37 5.08
In the case of diluted earnings per share, the weighted average number of shares out standing is adjusted assuming all outstanding dilutive options will be exercised. The weighted average number of shares is adjusted for all dilutive options issued under the stock option plans which have been granted in 2009 through to 2015 and which have not yet been exercised. Anti-dilutive options have not been considered. The calculation of diluted earnings per share is based on the same income after taxes for the period as is used in calculating basic earnings per share.
Diluted earnings per share 2014 / 15 2013 / 14
Income after taxes (1,000 CHF) 359,994 340,830
Weighted average number of outstanding shares 67,065,191 67,128,869
Adjustment for dilutive share options 174,754 98,682
Adjusted weighted average number of outstanding shares 67,239,945 67,227,551
Diluted earnings per share (CHF) 5.35 5.07
11. Dividend per share
The Board of Directors of Sonova Holding AG proposes to the Annual General Shareholders’ Meeting, to be held on June 16, 2015, that a dividend of CHF 2.05 shall be distributed (previ-ous year CHF 1.90). For further details refer to 2.4 “Summary of changes in shareholders’ equity” in the financial statements 2014 / 15 of Sonova Holding AG.
12. Cash and cash equivalents1,000 CHF 31.3.2015 31.3.2014
Cash on hand 644 711
Current bank accounts 349,779 382,423
Term deposits 40,063 26,870
Total 390,486 410,004
Bank accounts and term deposits are mainly denominated in CHF, EUR and USD.
For details of the movements in cash and cash equivalents refer to the consolidated cash flow statements.
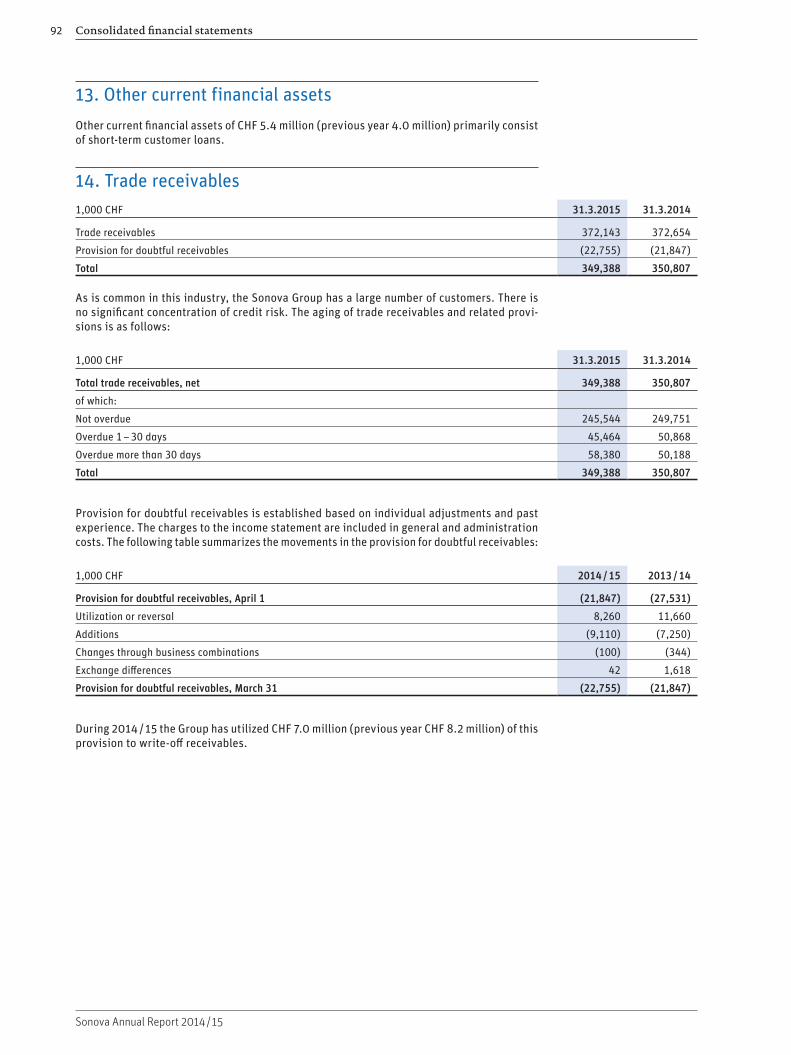
Consolidated financial statements92
Sonova Annual Report 2014 / 15
13. Other current financial assets
Other current financial assets of CHF 5.4 million (previous year 4.0 million) primarily consist of short-term customer loans.
14. Trade receivables 1,000 CHF 31.3.2015 31.3.2014
Trade receivables 372,143 372,654
Provision for doubtful receivables (22,755) (21,847)
Total 349,388 350,807
As is common in this industry, the Sonova Group has a large number of customers. There is no significant concentration of credit risk. The aging of trade receivables and related provi-sions is as follows:
1,000 CHF 31.3.2015 31.3.2014
Total trade receivables, net 349,388 350,807
of which:
Not overdue 245,544 249,751
Overdue 1 – 30 days 45,464 50,868
Overdue more than 30 days 58,380 50,188
Total 349,388 350,807
Provision for doubtful receivables is established based on individual adjustments and past experience. The charges to the income statement are included in general and admini stration costs. The following table summarizes the movements in the provision for doubtful receivables:
1,000 CHF 2014 / 15 2013 / 14
Provision for doubtful receivables, April 1 (21,847) (27,531)
Utilization or reversal 8,260 11,660
Additions (9,110) (7,250)
Changes through business combinations (100) (344)
Exchange differences 42 1,618
Provision for doubtful receivables, March 31 (22,755) (21,847)
During 2014 / 15 the Group has utilized CHF 7.0 million (previous year CHF 8.2 million) of this provision to write-off receivables.

Consolidated financial statements 93
Sonova Annual Report 2014 / 15
The carrying amounts of trade receivables are denominated in the following currencies:
1,000 CHF 31.3.2015 31.3.2014
BRL 28,808 35,504
CAD 23,604 25,351
CHF 15,185 14,572
EUR 93,057 109,597
USD 119,324 108,223
Other 69,410 57,560
Total trade receivables, net 349,388 350,807
15. Other receivables and prepaid expenses 1,000 CHF 31.3.2015 31.3.2014
Other receivables 49,715 49,513
Prepaid expenses 16,634 16,006
Total 66,349 65,519
The largest individual items included in other receivables are recoverable value added taxes and deposits. Prepaid expenses mainly consist of advances to suppliers.
16. Inventories1,000 CHF 31.3.2015 31.3.2014
Raw materials and components 41,851 34,538
Work-in-process 95,965 75,130
Finished products 133,095 128,223
Allowances (30,077) (31,849)
Total 240,834 206,042
Allowances include value adjustments for slow moving, phase out and obsolete stock.
In 2014 / 15, CHF 543.9 million (previous year CHF 528.0 million) were recognized as an expense and included in “cost of sales”.
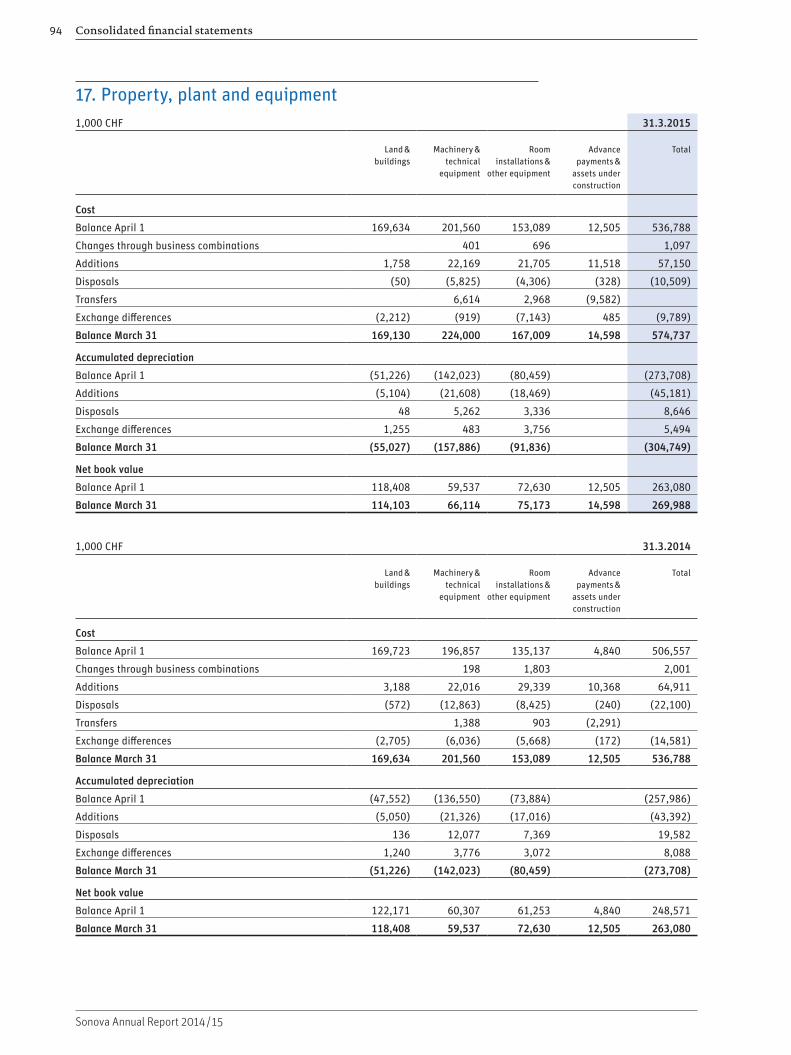
Consolidated financial statements94
Sonova Annual Report 2014 / 15
17. Property, plant and equipment1,000 CHF 31.3.2015
Land & buildings
Machinery & technical
equipment
Room installations &
other equipment
Advance payments &
assets under construction
Total
Cost
Balance April 1 169,634 201,560 153,089 12,505 536,788
Changes through business combinations 401 696 1,097
Additions 1,758 22,169 21,705 11,518 57,150
Disposals (50) (5,825) (4,306) (328) (10,509)
Transfers 6,614 2,968 (9,582)
Exchange differences (2,212) (919) (7,143) 485 (9,789)
Balance March 31 169,130 224,000 167,009 14,598 574,737
Accumulated depreciation
Balance April 1 (51,226) (142,023) (80,459) (273,708)
Additions (5,104) (21,608) (18,469) (45,181)
Disposals 48 5,262 3,336 8,646
Exchange differences 1,255 483 3,756 5,494
Balance March 31 (55,027) (157,886) (91,836) (304,749)
Net book value
Balance April 1 118,408 59,537 72,630 12,505 263,080
Balance March 31 114,103 66,114 75,173 14,598 269,988
1,000 CHF 31.3.2014
Land & buildings
Machinery & technical
equipment
Room installations &
other equipment
Advance payments &
assets under construction
Total
Cost
Balance April 1 169,723 196,857 135,137 4,840 506,557
Changes through business combinations 198 1,803 2,001
Additions 3,188 22,016 29,339 10,368 64,911
Disposals (572) (12,863) (8,425) (240) (22,100)
Transfers 1,388 903 (2,291)
Exchange differences (2,705) (6,036) (5,668) (172) (14,581)
Balance March 31 169,634 201,560 153,089 12,505 536,788
Accumulated depreciation
Balance April 1 (47,552) (136,550) (73,884) (257,986)
Additions (5,050) (21,326) (17,016) (43,392)
Disposals 136 12,077 7,369 19,582
Exchange differences 1,240 3,776 3,072 8,088
Balance March 31 (51,226) (142,023) (80,459) (273,708)
Net book value
Balance April 1 122,171 60,307 61,253 4,840 248,571
Balance March 31 118,408 59,537 72,630 12,505 263,080

Consolidated financial statements 95
Sonova Annual Report 2014 / 15
Property, plant and equipment as of March 31, 2015 was insured against fire for a value of CHF 493.3 million (previous year CHF 492.0 million).
Pledged fixed assets amounted to CHF 0.03 million (previous year CHF 0.03 million).
There are no assets held under finance leases.
18. Investments in associates / joint ventures
The Group’s share in the results as well as in assets and liabilities of associates / joint ventures, all unlisted enterprises, is as follows:
1,000 CHF 2014 / 15 2013 / 14
Current assets 627 642
Non-current assets 1,092 418
Total assets 1,719 1,060
Current liabilities (348) (228)
Non-current liabilities (32) (310)
Total liabilities (380) (538)
Net assets 1,339 522
Income for the year 3,824 4,785
Expenses for the year (2,032) (3,721)
Profit for the year 1,792 1,064
Net book value at year-end 9,667 11,620
Share of gain / (loss) recognized by the Group 1,792 (11)
In the financial year 2014 / 15, the Group acquired additional shares in two (previous year three) previously held equity investments, resulting in a change of control (step up acquisi-tions). Since the change of control, these companies are fully consolidated. The total net book value at the time of gaining control over these two (previous year three) entities amounted to CHF 1.5 million (previous year CHF 6.2 million).
In the financial year 2013 / 14, the Group acquired two associates for a total purchase consid-eration of CHF 1.6 million. The associ ates acquired are in the business of selling hearing instruments.
Sales to associates / joint ventures in the financial year 2014 / 15 amounted to CHF 8.3 million (previous year CHF 10.2 million). At March 31, 2015 trade receivables towards associates / joint ventures amounted to CHF 1.6 million (previous year CHF 4.8 million).
At the end of the financial years 2014 / 15 and 2013 / 14, no material unrecognized losses existed.
Investments with a net book value of CHF 9.7 million (previous year CHF 11.6 million) have a business year different than the Sonova Group. The latest available information for the respec-tive companies are as per December 2014.
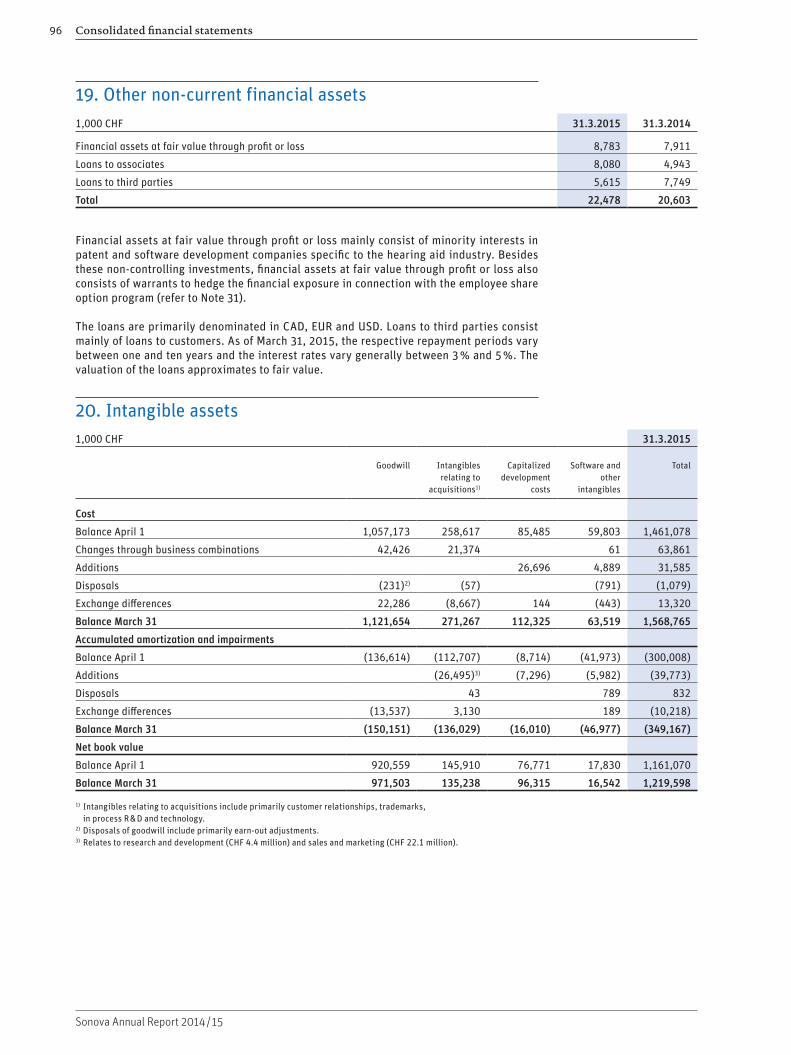
Consolidated financial statements96
Sonova Annual Report 2014 / 15
19. Other non-current financial assets1,000 CHF 31.3.2015 31.3.2014
Financial assets at fair value through profit or loss 8,783 7,911
Loans to associates 8,080 4,943
Loans to third parties 5,615 7,749
Total 22,478 20,603
Financial assets at fair value through profit or loss mainly consist of minority interests in patent and software development companies specific to the hearing aid industry. Besides these non-controlling investments, financial assets at fair value through profit or loss also consists of warrants to hedge the financial exposure in connection with the employee share option program (refer to Note 31).
The loans are primarily denominated in CAD, EUR and USD. Loans to third parties consist mainly of loans to customers. As of March 31, 2015, the respective repayment periods vary between one and ten years and the interest rates vary generally between 3 % and 5 %. The valuation of the loans approximates to fair value.
20. Intangible assets1,000 CHF 31.3.2015
Goodwill Intangibles relating to
acquisitions1)
Capitalized development
costs
Software and other
intangibles
Total
Cost
Balance April 1 1,057,173 258,617 85,485 59,803 1,461,078
Changes through business combinations 42,426 21,374 61 63,861
Additions 26,696 4,889 31,585
Disposals (231)2) (57) (791) (1,079)
Exchange differences 22,286 (8,667) 144 (443) 13,320
Balance March 31 1,121,654 271,267 112,325 63,519 1,568,765
Accumulated amortization and impairments
Balance April 1 (136,614) (112,707) (8,714) (41,973) (300,008)
Additions (26,495)3) (7,296) (5,982) (39,773)
Disposals 43 789 832
Exchange differences (13,537) 3,130 189 (10,218)
Balance March 31 (150,151) (136,029) (16,010) (46,977) (349,167)
Net book value
Balance April 1 920,559 145,910 76,771 17,830 1,161,070
Balance March 31 971,503 135,238 96,315 16,542 1,219,598
1) Intangibles relating to acquisitions include primarily customer relationships, trademarks, in process R & D and technology.
2) Disposals of goodwill include primarily earn-out adjustments.3) Relates to research and development (CHF 4.4 million) and sales and marketing (CHF 22.1 million).
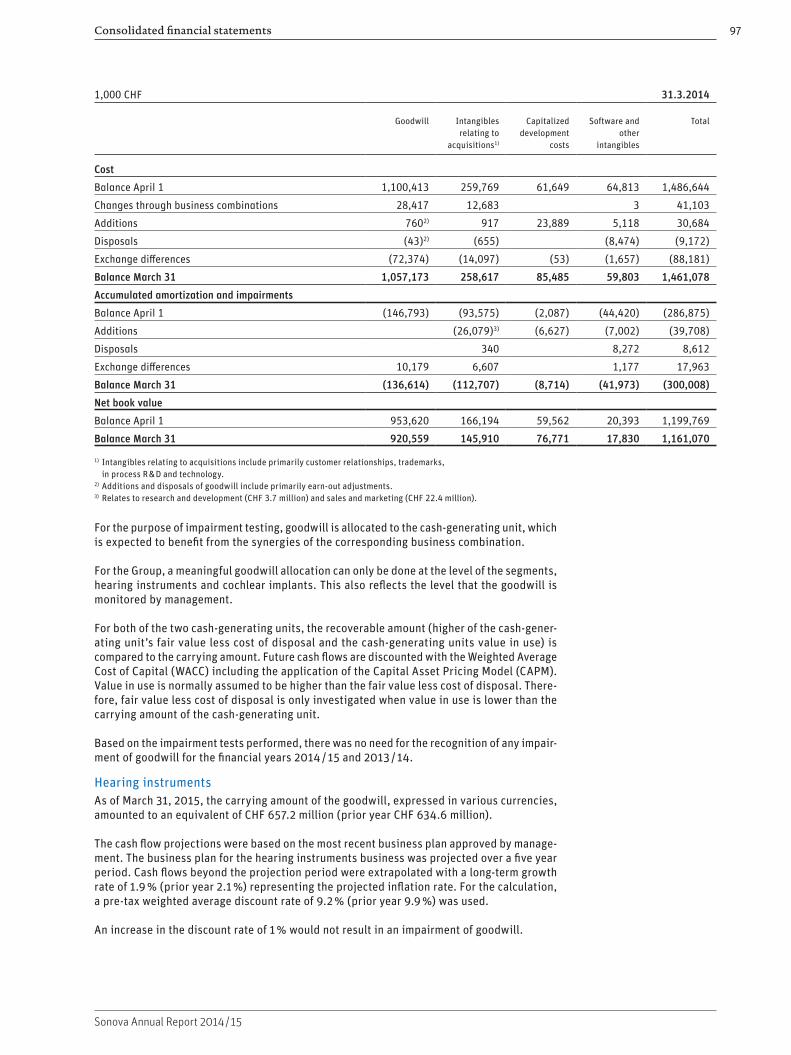
Consolidated financial statements 97
Sonova Annual Report 2014 / 15
1,000 CHF 31.3.2014
Goodwill Intangibles relating to
acquisitions1)
Capitalized development
costs
Software and other
intangibles
Total
Cost
Balance April 1 1,100,413 259,769 61,649 64,813 1,486,644
Changes through business combinations 28,417 12,683 3 41,103
Additions 7602) 917 23,889 5,118 30,684
Disposals (43)2) (655) (8,474) (9,172)
Exchange differences (72,374) (14,097) (53) (1,657) (88,181)
Balance March 31 1,057,173 258,617 85,485 59,803 1,461,078
Accumulated amortization and impairments
Balance April 1 (146,793) (93,575) (2,087) (44,420) (286,875)
Additions (26,079)3) (6,627) (7,002) (39,708)
Disposals 340 8,272 8,612
Exchange differences 10,179 6,607 1,177 17,963
Balance March 31 (136,614) (112,707) (8,714) (41,973) (300,008)
Net book value
Balance April 1 953,620 166,194 59,562 20,393 1,199,769
Balance March 31 920,559 145,910 76,771 17,830 1,161,070
1) Intangibles relating to acquisitions include primarily customer relationships, trademarks, in process R & D and technology.
2) Additions and disposals of goodwill include primarily earn-out adjustments.3) Relates to research and development (CHF 3.7 million) and sales and marketing (CHF 22.4 million).
For the purpose of impairment testing, goodwill is allocated to the cash-generating unit, which is expected to benefit from the synergies of the corresponding business combination.
For the Group, a meaningful goodwill allocation can only be done at the level of the segments, hearing instruments and cochlear implants. This also reflects the level that the goodwill is monitored by management.
For both of the two cash-generating units, the recoverable amount (higher of the cash-gener-ating unit’s fair value less cost of disposal and the cash-generating units value in use) is compared to the carrying amount. Future cash flows are discounted with the Weighted Average Cost of Capital (WACC) including the application of the Capital Asset Pricing Model (CAPM). Value in use is normally assumed to be higher than the fair value less cost of disposal. There-fore, fair value less cost of disposal is only investigated when value in use is lower than the carrying amount of the cash-generating unit.
Based on the impairment tests performed, there was no need for the recognition of any impair-ment of goodwill for the financial years 2014 / 15 and 2013 / 14.
Hearing instrumentsAs of March 31, 2015, the carrying amount of the goodwill, expressed in various currencies, amounted to an equivalent of CHF 657.2 million (prior year CHF 634.6 million).
The cash flow projections were based on the most recent business plan approved by manage-ment. The business plan for the hearing instruments business was projected over a five year period. Cash flows beyond the projection period were extrapolated with a long-term growth rate of 1.9 % (prior year 2.1 %) representing the projected inflation rate. For the calculation, a pre-tax weighted average discount rate of 9.2 % (prior year 9.9 %) was used.
An increase in the discount rate of 1 % would not result in an impairment of goodwill.

Consolidated financial statements98
Sonova Annual Report 2014 / 15
Cochlear implantsAs of March 31, 2015, the carrying amount of the goodwill, expressed in various currencies, amounted to an equivalent of CHF 314.3 million (prior year CHF 286.0 million).
The cash flow projections were based on the most recent business plan approved by manage-ment. The business plan for the Cochlear implants business was projected over a six year period which reflects the long-term development cycle of the implant business. Cash flows beyond the projection period were extrapolated with a long-term growth rate of 1.9 % (prior year 2.1 %) representing the projected inflation rate. For the calculation, a pre-tax weighted average discount rate of 9.1 % (prior year 10.2 %) was used.
An increase in the discount rate of 1 % would not result in an impairment of goodwill.
21. Provisions 1,000 CHF 31.3.2015
Warranty and returns
Reimbursement to customers
Product liabilities
Other Provisions
Total
Balance April 1 72,173 10,705 192,016 24,189 299,083
Changes through business combinations 150 1,505 1,655
Amounts used (45,631) (6,681) (5,030) (6,771) (64,113)
Reversals (7,735) (9) (13,200) (986) (21,930)
Increases 63,929 6,521 12,624 83,074
Present value adjustments 541 541
Exchange differences 156 305 18,177 133 18,771
Balance March 31 83,042 10,841 192,504 30,694 317,081
thereof short-term 63,863 10,841 23,992 13,237 111,933
thereof long-term 19,179 168,512 17,457 205,148
1,000 CHF 31.3.2014
Warranty and returns
Reimbursement to customers
Product liabilities
Other Provisions
Total
Balance April 1 72,150 11,712 249,545 28,947 362,354
Changes through business combinations 20 595 615
Amounts used (48,463) (6,994) (43,382) (7,911) (106,750)
Reversals (337) (85) (1,169) (1,591)
Increases 53,152 6,820 5,397 65,369
Present value adjustments 1,794 1,794
Exchange differences (4,349) (748) (15,941) (1,670) (22,708)
Balance March 31 72,173 10,705 192,016 24,189 299,083
thereof short-term 55,225 10,705 26,613 8,966 101,509
thereof long-term 16,948 165,403 15,223 197,574
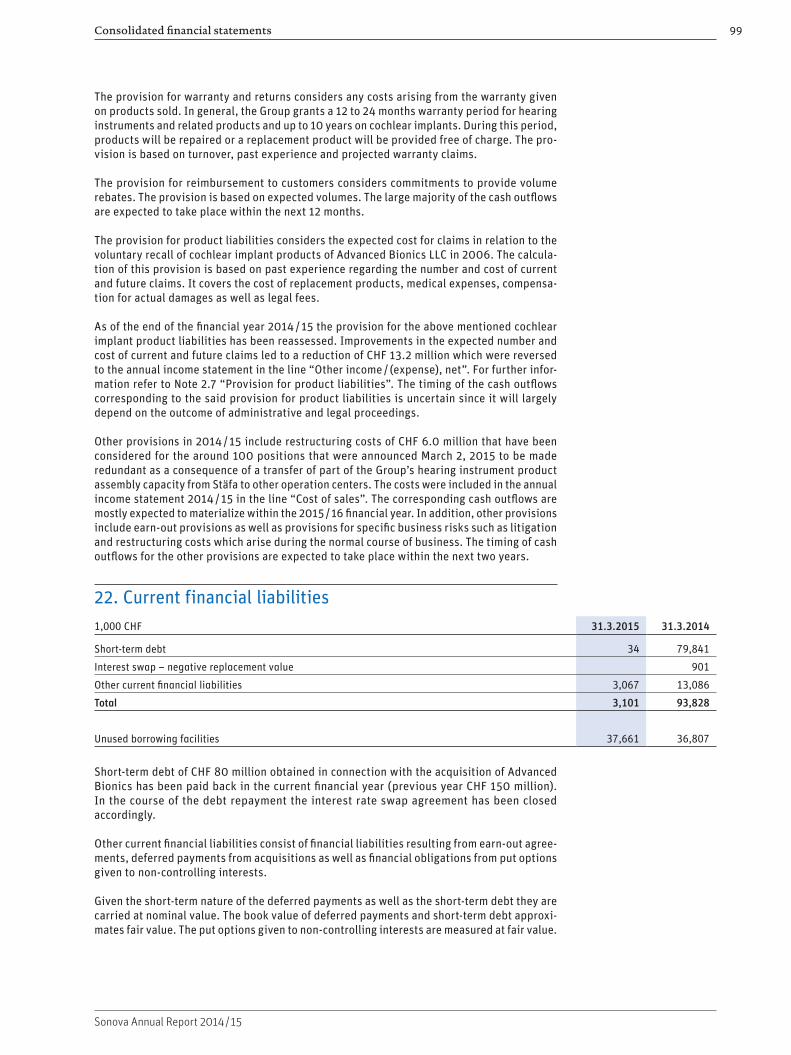
Consolidated financial statements 99
Sonova Annual Report 2014 / 15
The provision for warranty and returns considers any costs arising from the warranty given on products sold. In general, the Group grants a 12 to 24 months warranty period for hearing instruments and related products and up to 10 years on cochlear implants. During this period, products will be repaired or a replacement product will be provided free of charge. The pro-vision is based on turnover, past experience and projected warranty claims.
The provision for reimbursement to customers considers commitments to provide volume rebates. The provision is based on expected volumes. The large majority of the cash outflows are expected to take place within the next 12 months.
The provision for product liabilities considers the expected cost for claims in relation to the voluntary recall of cochlear implant products of Advanced Bionics LLC in 2006. The calcula-tion of this provision is based on past experience regarding the number and cost of current and future claims. It covers the cost of replacement products, medical expenses, compensa-tion for actual damages as well as legal fees.
As of the end of the financial year 2014 / 15 the provision for the above mentioned cochlear implant product liabilities has been reassessed. Improvements in the expected number and cost of current and future claims led to a reduction of CHF 13.2 million which were reversed to the annual income statement in the line “Other income / (expense), net”. For further infor-mation refer to Note 2.7 “Provision for product liabilities”. The timing of the cash outflows corresponding to the said provision for product liabilities is uncertain since it will largely depend on the outcome of administrative and legal proceedings.
Other provisions in 2014 / 15 include restructuring costs of CHF 6.0 million that have been considered for the around 100 positions that were announced March 2, 2015 to be made redundant as a consequence of a transfer of part of the Group’s hearing instrument product assembly capacity from Stäfa to other operation centers. The costs were included in the annual income statement 2014 / 15 in the line “Cost of sales”. The corresponding cash outflows are mostly expected to materialize within the 2015 / 16 financial year. In addition, other provisions include earn-out provisions as well as provisions for specific business risks such as litigation and restructuring costs which arise during the normal course of business. The timing of cash outflows for the other provisions are expected to take place within the next two years.
22. Current financial liabilities1,000 CHF 31.3.2015 31.3.2014
Short-term debt 34 79,841
Interest swap – negative replacement value 901
Other current financial liabilities 3,067 13,086
Total 3,101 93,828
Unused borrowing facilities 37,661 36,807
Short-term debt of CHF 80 million obtained in connection with the acquisition of Advanced Bionics has been paid back in the current financial year (previous year CHF 150 million). In the course of the debt repayment the interest rate swap agreement has been closed accordingly.
Other current financial liabilities consist of financial liabilities resulting from earn-out agree-ments, deferred payments from acquisitions as well as financial obligations from put options given to non-controlling interests.
Given the short-term nature of the deferred payments as well as the short-term debt they are carried at nominal value. The book value of deferred payments and short-term debt approxi-mates fair value. The put options given to non-controlling interests are measured at fair value.
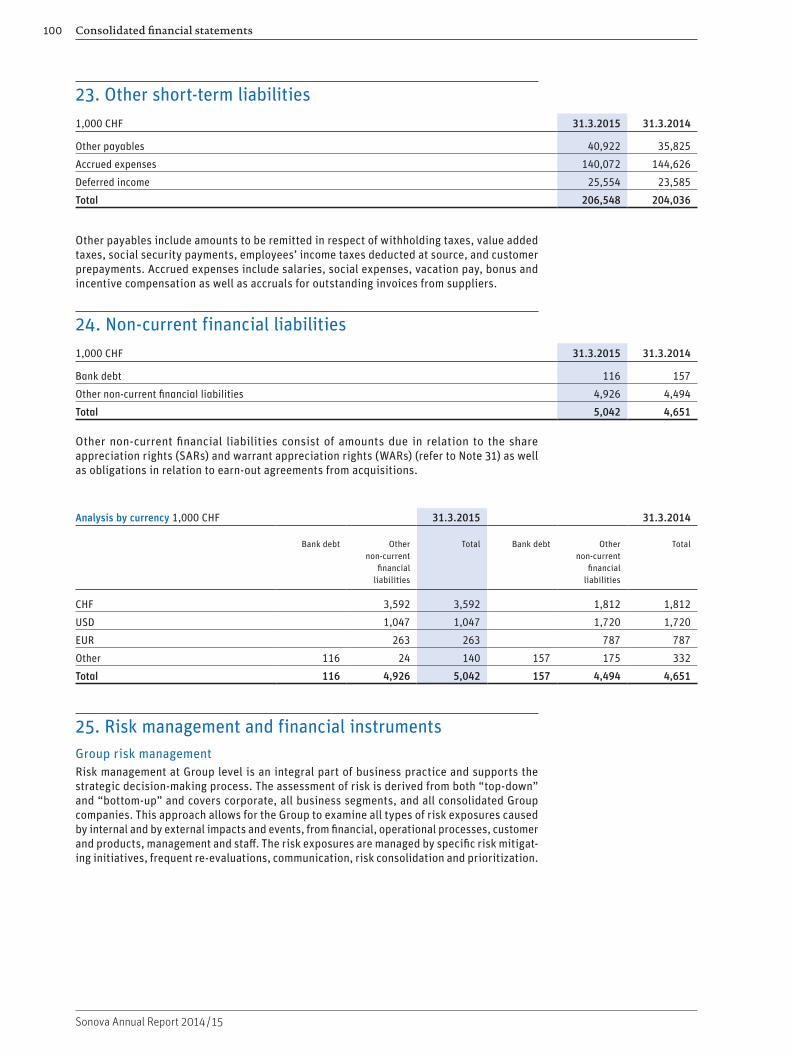
Consolidated financial statements100
Sonova Annual Report 2014 / 15
23. Other short-term liabilities1,000 CHF 31.3.2015 31.3.2014
Other payables 40,922 35,825
Accrued expenses 140,072 144,626
Deferred income 25,554 23,585
Total 206,548 204,036
Other payables include amounts to be remitted in respect of withholding taxes, value added taxes, social security payments, employees’ income taxes deducted at source, and customer prepayments. Accrued expenses include salaries, social expenses, vacation pay, bonus and incentive compensation as well as accruals for outstanding invoices from suppliers.
24. Non-current financial liabilities1,000 CHF 31.3.2015 31.3.2014
Bank debt 116 157
Other non-current financial liabilities 4,926 4,494
Total 5,042 4,651
Other non-current financial liabilities consist of amounts due in relation to the share appreciation rights (SARs) and warrant appreciation rights (WARs) (refer to Note 31) as well as obligations in relation to earn-out agreements from acquisitions.
Analysis by currency 1,000 CHF 31.3.2015 31.3.2014
Bank debt Other non-current
financial liabilities
Total Bank debt Other non-current
financial liabilities
Total
CHF 3,592 3,592 1,812 1,812
USD 1,047 1,047 1,720 1,720
EUR 263 263 787 787
Other 116 24 140 157 175 332
Total 116 4,926 5,042 157 4,494 4,651
25. Risk management and financial instrumentsGroup risk managementRisk management at Group level is an integral part of business practice and supports the strategic decision-making process. The assessment of risk is derived from both “top-down” and “bottom-up” and covers corporate, all business segments, and all consolidated Group companies. This approach allows for the Group to examine all types of risk exposures caused by internal and by external impacts and events, from financial, operational processes, customer and products, management and staff. The risk exposures are managed by specific risk mitigat-ing initiatives, frequent re-evaluations, communication, risk consolidation and prioritization.
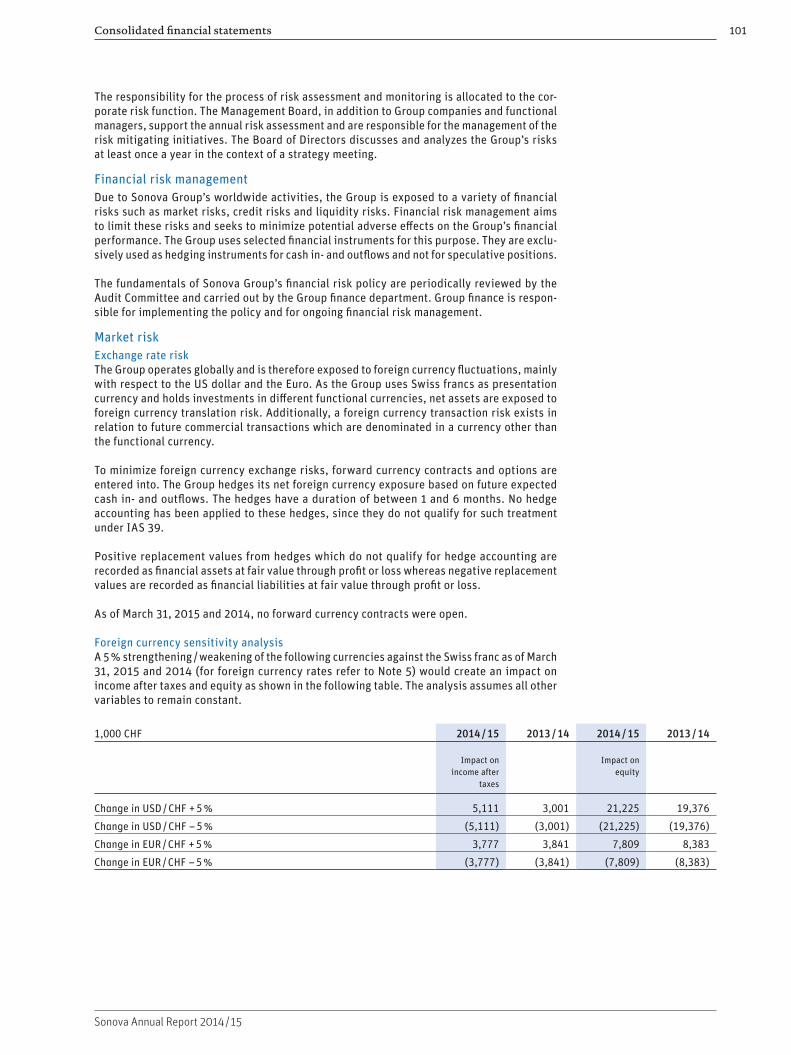
Consolidated financial statements 101
Sonova Annual Report 2014 / 15
The responsibility for the process of risk assessment and monitoring is allocated to the cor-porate risk function. The Management Board, in addition to Group companies and functional managers, support the annual risk assessment and are responsible for the management of the risk mitigating initiatives. The Board of Directors discusses and analyzes the Group’s risks at least once a year in the context of a strategy meeting.
Financial risk managementDue to Sonova Group’s worldwide activities, the Group is exposed to a variety of financial risks such as market risks, credit risks and liquidity risks. Financial risk management aims to limit these risks and seeks to minimize potential adverse effects on the Group’s financial performance. The Group uses selected financial instruments for this purpose. They are exclu-sively used as hedging instruments for cash in- and outflows and not for speculative positions.
The fundamentals of Sonova Group’s financial risk policy are periodically reviewed by the Audit Committee and carried out by the Group finance department. Group finance is respon-sible for implementing the policy and for ongoing financial risk management.
Market riskExchange rate riskThe Group operates globally and is therefore exposed to foreign currency fluctuations, mainly with respect to the US dollar and the Euro. As the Group uses Swiss francs as presentation currency and holds investments in different functional currencies, net assets are exposed to foreign currency translation risk. Additionally, a foreign currency transaction risk exists in relation to future commercial transactions which are denominated in a currency other than the functional currency.
To minimize foreign currency exchange risks, forward currency contracts and options are entered into. The Group hedges its net foreign currency exposure based on future expected cash in- and outflows. The hedges have a duration of between 1 and 6 months. No hedge accounting has been applied to these hedges, since they do not qualify for such treatment under IAS 39.
Positive replacement values from hedges which do not qualify for hedge accounting are recorded as financial assets at fair value through profit or loss whereas negative replacement values are recorded as financial liabilities at fair value through profit or loss.
As of March 31, 2015 and 2014, no forward currency contracts were open.
Foreign currency sensitivity analysisA 5 % strengthening / weakening of the following currencies against the Swiss franc as of March 31, 2015 and 2014 (for foreign currency rates refer to Note 5) would create an impact on income after taxes and equity as shown in the following table. The analysis assumes all other variables to remain constant.
1,000 CHF 2014 / 15 2013 / 14 2014 / 15 2013 / 14
Impact on income after
taxes
Impact on equity
Change in USD / CHF + 5 % 5,111 3,001 21,225 19,376
Change in USD / CHF – 5 % (5,111) (3,001) (21,225) (19,376)
Change in EUR / CHF + 5 % 3,777 3,841 7,809 8,383
Change in EUR / CHF – 5 % (3,777) (3,841) (7,809) (8,383)
Consolidated financial statements102
Sonova Annual Report 2014 / 15
Interest rate riskThe Group has only limited exposure to interest rate changes. The most substantial interest exposure on assets relates to cash and cash equivalents with an average interest-bearing amount for the financial year 2014 / 15 of CHF 353 million (previous year CHF 424 million). If interest rates during the financial year 2014 / 15 had been 1 % higher / lower on these accounts, income before taxes would have been CHF 3.5 million higher / lower (previous year CHF 4.2 million).
Other market risksRisk of price changes of raw materials or components used for production is limited. A change in those prices would not result in financial effects being above the Group’s risk management tolerance level. Therefore, no sensitivity analysis has been conducted.
Credit riskFinancial assets which could expose the Group to a potential concentration in credit risk are principally cash and bank balances, receivables from customers and loans.
Core banking relations are maintained with at least “BBB+” rated (S & P) financial institutions. As of March 31, 2015, the largest balance with a single counterparty amounted to 25 % (previous year 28 %) of total cash and cash equivalents. The Group performs continuous credit checks on its receivables. Due to the customer diversity there is no single credit limit for all customers, however the Group assesses its customers taking into account their financial position, past experience, and other factors. Due to the fragmented customer base (no single customer balance is greater than 10 % of total trade accounts receivable), the Group is not exposed to any significant concentration risk. The same applies to loans to third and related parties.
The Group does not expect any significant losses either from receivables or from other financial assets.
Liquidity riskGroup finance is responsible for centrally managing the net cash / debt position and to ensure that the Group’s obligations can be settled on time. The Group aims to grow further and wants to remain flexible in making time-sensitive investment decisions. This overall objective is included in the asset allocation strategy. A rolling forecast based on the expected cash flows is conducted and updated regularly to monitor and control liquidity.

Consolidated financial statements 103
Sonova Annual Report 2014 / 15
The following table summarizes the contractual maturities of financial liabilities as of March 31, 2015 and 2014:
1,000 CHF 31.3.2015
Due less than 3 months
Due 3 months to
1 year
Due 1 year to 5 years
Due more than 5 years
Total
Short-term debt 34 34
Other current financial liabilities 1,592 1,475 3,067
Trade payables and other short-term liabilities 169,677 97,313 266,990
Total current financial liabilities 171,269 98,822 270,091
Long-term bank debt 104 12 116
Other non-current financial liabilities 4,926 4,926
Total non-current financial liabilities 5,030 12 5,042
Total financial liabilities 171,269 98,822 5,030 12 275,133
1,000 CHF 31.3.2014
Due less than 3 months
Due 3 months to
1 year
Due 1 year to 5 years
Due more than 5 years
Total
Short-term debt 54 79,787 79,841
Derivatives – negative replacement value 901 901
Other current financial liabilities 13,086 13,086
Trade and other short-term liabilities 162,276 46,182 208,458
Total current financial liabilities 162,330 139,956 302,286
Long-term bank debt 116 41 157
Other non-current financial liabilities 4,494 4,494
Total non-current financial liabilities 4,610 41 4,651
Total financial liabilities 162,330 139,956 4,610 41 306,937
Fair value hierarchyThe following table summarizes the financial instruments carried at fair value, by valuation method as of March 31, 2015 and 2014. The different levels have been defined as follows:
Level 1: The fair value of financial instruments traded in active markets is based on quoted market prices at the balance sheet date.
Level 2: The fair value of financial instruments that are not traded in an active market is determined by using valuation techniques. These valuation techniques are based on observable market data, where applicable. If all significant inputs required to fair value an instrument are observable, the instrument is included in level 2.
Level 3: If a significant amount of inputs is not based on observable market data the instrument is included in level 3. For this level other techniques, such as discounted cash flow analysis, are used to determine fair value.
During the reporting period there were no reclassifications between the individual levels.
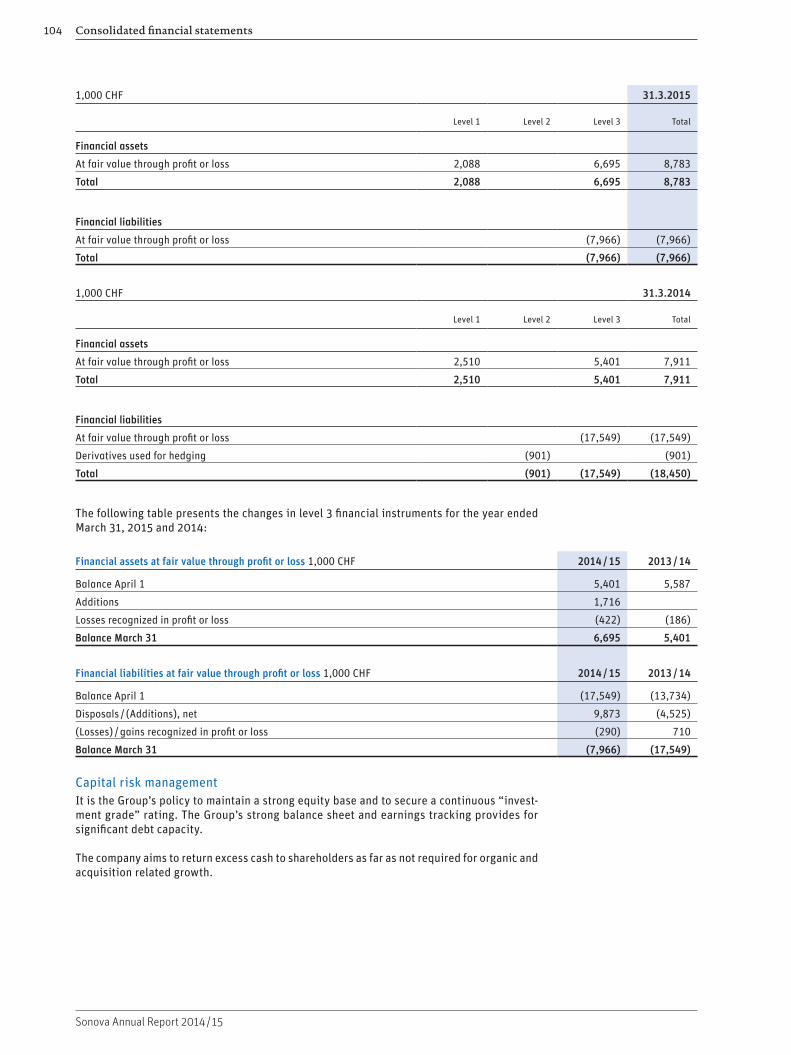
Consolidated financial statements104
Sonova Annual Report 2014 / 15
1,000 CHF 31.3.2015
Level 1 Level 2 Level 3 Total
Financial assets
At fair value through profit or loss 2,088 6,695 8,783
Total 2,088 6,695 8,783
Financial liabilities
At fair value through profit or loss (7,966) (7,966)
Total (7,966) (7,966)
1,000 CHF 31.3.2014
Level 1 Level 2 Level 3 Total
Financial assets
At fair value through profit or loss 2,510 5,401 7,911
Total 2,510 5,401 7,911
Financial liabilities
At fair value through profit or loss (17,549) (17,549)
Derivatives used for hedging (901) (901)
Total (901) (17,549) (18,450)
The following table presents the changes in level 3 financial instruments for the year ended March 31, 2015 and 2014:
Financial assets at fair value through profit or loss 1,000 CHF 2014 / 15 2013 / 14
Balance April 1 5,401 5,587
Additions 1,716
Losses recognized in profit or loss (422) (186)
Balance March 31 6,695 5,401
Financial liabilities at fair value through profit or loss 1,000 CHF 2014 / 15 2013 / 14
Balance April 1 (17,549) (13,734)
Disposals / (Additions), net 9,873 (4,525)
(Losses) / gains recognized in profit or loss (290) 710
Balance March 31 (7,966) (17,549)
Capital risk managementIt is the Group’s policy to maintain a strong equity base and to secure a continuous “invest-ment grade” rating. The Group’s strong balance sheet and earnings tracking provides for significant debt capacity.
The company aims to return excess cash to shareholders as far as not required for organic and acquisition related growth.

Consolidated financial statements 105
Sonova Annual Report 2014 / 15
26. Other long-term liabilities1,000 CHF 31.3.2015 31.3.2014
Long-term deferred income 25,117 23,520
Retirement benefit obligations 61,810 24,701
Total 86,927 48,221
Long-term deferred income relates to long-term service contracts with customers. De ferred income is recognized as a sale over the period of the service contract.
The retirement benefit obligation relates to defined benefit plans. For details refer to Note 30.
27. Movements in share capital
Issued registered shares
Issued registered
shares
Treasury shares1)
Outstanding shares
Balance April 1, 2013 67,151,815 (26,714) 67,125,101
Issue of new shares from conditional capital2) 21,472 21,472
Purchase of treasury shares (564,636) (564,636)
Sale / transfer of treasury shares 581,165 581,165
Balance March 31, 2014 67,173,287 (10,185) 67,163,102
Purchase of treasury shares (562,077) (562,077)
Sale / transfer of treasury shares 571,849 571,849
Purchase of shares intended to be cancelled3) (546,900) (546,900)
Balance March 31, 2015 67,173,287 (547,313) 66,625,974
Nominal value of share capital 1,000 CHF
Share Capital Treasury shares1)
Outstanding share capital
Balance April 1, 2013 3,358 (2) 3,356
Issue of new shares from conditional capital2) 1 1
Purchase of treasury shares (28) (28)
Sale / transfer of treasury shares 29 29
Balance March 31, 2014 3,359 (1) 3,358
Purchase of treasury shares (28) (28)
Sale / transfer of treasury shares 29 29
Purchase of shares intended to be cancelled3) (27) (27)
Balance March 31, 2015 3,359 (27) 3,332
Each share has a nominal value of CHF 0.05.1) Treasury shares are purchased on the open market and are not entitled to dividends. 2) Created for the purpose of the employee share option plan.3) Shares purchased by the Group as part of the share buyback program.
At the Annual General Shareholder’s Meeting on July 7, 2005 the conditional share capital of CHF 264,270 (5,285,400 shares) has been increased by CHF 165,056 (3,301,120 shares) to CHF 429,326 (8,586,520 shares). As of March 31, 2015, 5,322,133 shares (previous year 5,322,133 shares) thereof have not yet been issued. These shares are reserved for long-term incentive plans (2,021,013 shares) as well as for initiatives to increase the company’s finan-cial flexibility (3,301,120 shares).
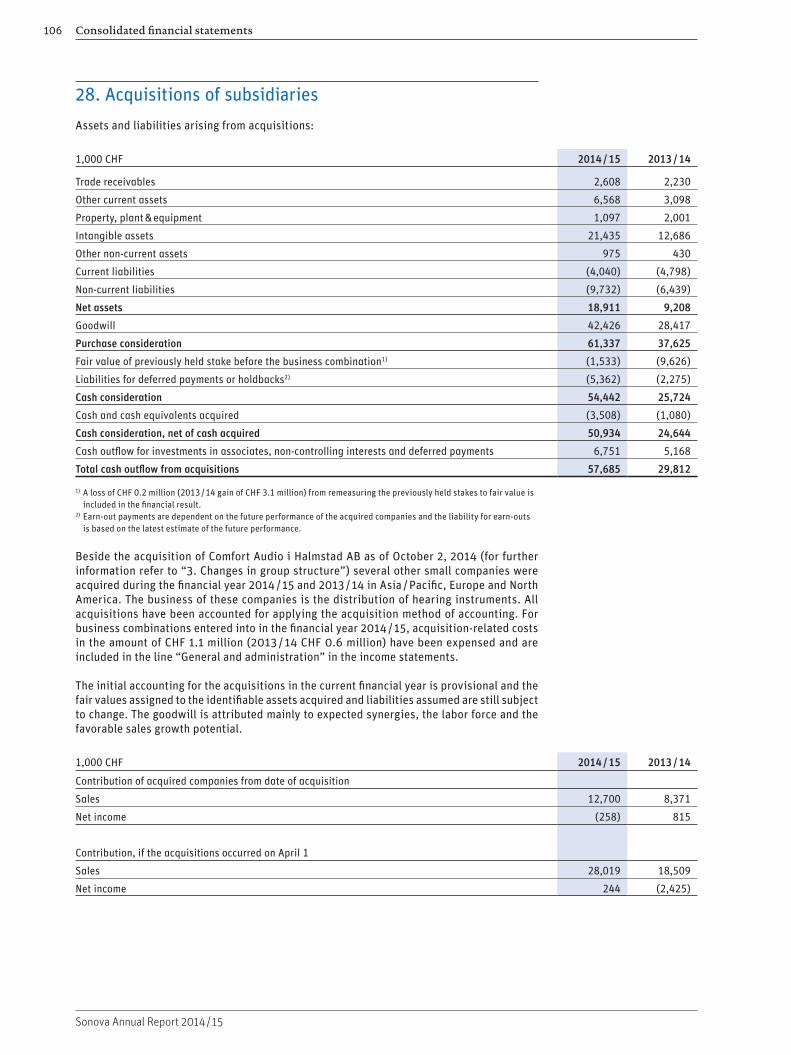
Consolidated financial statements106
Sonova Annual Report 2014 / 15
28. Acquisitions of subsidiaries
Assets and liabilities arising from acquisitions:
1,000 CHF 2014 / 15 2013 / 14
Trade receivables 2,608 2,230
Other current assets 6,568 3,098
Property, plant & equipment 1,097 2,001
Intangible assets 21,435 12,686
Other non-current assets 975 430
Current liabilities (4,040) (4,798)
Non-current liabilities (9,732) (6,439)
Net assets 18,911 9,208
Goodwill 42,426 28,417
Purchase consideration 61,337 37,625
Fair value of previously held stake before the business combination1) (1,533) (9,626)
Liabilities for deferred payments or holdbacks2) (5,362) (2,275)
Cash consideration 54,442 25,724
Cash and cash equivalents acquired (3,508) (1,080)
Cash consideration, net of cash acquired 50,934 24,644
Cash outflow for investments in associates, non-controlling interests and deferred payments 6,751 5,168
Total cash outflow from acquisitions 57,685 29,812
1) A loss of CHF 0.2 million (2013 / 14 gain of CHF 3.1 million) from remeasuring the previously held stakes to fair value is included in the financial result.
2) Earn-out payments are dependent on the future performance of the acquired companies and the liability for earn-outs is based on the latest estimate of the future performance.
Beside the acquisition of Comfort Audio i Halmstad AB as of October 2, 2014 (for further information refer to “3. Changes in group structure”) several other small companies were acquired during the financial year 2014 / 15 and 2013 / 14 in Asia / Pacific, Europe and North America. The business of these companies is the distribution of hearing instruments. All acquisitions have been accounted for applying the acquisition method of accounting. For business combinations entered into in the financial year 2014 / 15, acquisition-related costs in the amount of CHF 1.1 million (2013 / 14 CHF 0.6 million) have been expensed and are included in the line “General and administration” in the income statements.
The initial accounting for the acquisitions in the current financial year is provisional and the fair values assigned to the identifiable assets acquired and liabilities assumed are still subject to change. The goodwill is attributed mainly to expected synergies, the labor force and the favorable sales growth potential.
1,000 CHF 2014 / 15 2013 / 14
Contribution of acquired companies from date of acquisition
Sales 12,700 8,371
Net income (258) 815
Contribution, if the acquisitions occurred on April 1
Sales 28,019 18,509
Net income 244 (2,425)

Consolidated financial statements 107
Sonova Annual Report 2014 / 15
29. Transactions and relations with members of the Management Board and the Board of Directors
1,000 CHF 2014 / 15 2013 / 14 2014 / 15 2013 / 14 2014 / 15 2013 / 14
Management Board
Board of Directors
Total
Short-term employee benefits 9,186 9,282 1,646 1,752 10,832 11,034
Post-employment benefits 934 799 934 799
Share based payments 5,074 5,049 1,352 1,372 6,426 6,421
Total 15,194 15,130 2,998 3,124 18,192 18,254
The total compensation to the Management Board for the reporting period 2014 / 15, as shown above, relates to the 14 current members of the Management Board (one member joined in August 2014). The total compensation to the Management Board for the reporting period 2013 / 14, as shown above, related to 13 members.
The total compensation to the Board of Directors for the reporting period 2014 / 15, as shown above, relates to nine current members (previous year eight members).
During the financial year 2014 / 15 several lease agreements existed between the Group and ARim AG or R-Estate AG. Both companies are owned by Andy Rihs, member of the Board of Directors of Sonova Holding AG. The lease agreements relate to housing, parking, and child care space. In total the related party transactions with Andy Rihs amounted to CHF 0.29 million (previous year CHF 0.35 million).
Transactions between the Group and the various post-employment benefit plans for the employees of the Group are described in Note 30.
Further information in accordance with Swiss law relating to remuneration and ownership of shares and options of the Board of Directors and the Management Board can be found in Note 3.6 of the financial statements of Sonova Holding AG.

Consolidated financial statements108
Sonova Annual Report 2014 / 15
30. Employee benefitsDefined Benefit plansSonova Group’s retirement plans include defined benefit pension plans in Switzerland, Austria, Norway, Canada and Germany. These plans are both funded and unfunded and determined by local regulations using independent actuarial valuations according to IAS 19. Sonova Group’s major defined benefit plan is located in Switzerland which in total accounts for CHF 347.1 million or 99.1 % (previous year 265.6 million or 98.7 %) of Sonova’s defined benefit obligation.
Pension plans in SwitzerlandThe current pension arrangement for employees in Switzerland is made through a plan gov-erned by the Swiss Federal Occupational Old Age, Survivors and Disability Pension Act (BVG). The plan of Sonova’s Swiss companies is administered by a separate legal foundation, which is funded by regular employer and employee contributions defined in the pension fund rules. The Swiss pension plan contains a cash balance benefit which is in essence contribution-based with certain minimum guarantees. Due to these minimum guarantees, the Swiss plan is treated as a defined benefit plan for the purposes of these IFRS financial statements, although it has many of the characteristics of a defined contribution plan. The plan is invested in a diversified range of assets in accordance with the investment strategy and the common criteria of an asset and liability management. A potential under-funding may be remedied by various measures such as increasing employer and employee contributions or reducing prospective benefits.
As of March 31, 2015, 1,288 employees (previous year 1,217 employees) and 82 beneficiaries (previous year 79 beneficiaries) are insured under the Swiss plan. The defined benefit obliga-tion has a duration of 15.5 years (previous year 11.2 years).
The results of all defined benefit plans are summarized below:
Amounts recognized in the balance sheet CHF 1,000 31.3.2015 31.03.2014
Present value of funded obligations (348,529) (266,975)
Fair value of plan assets 288,505 244,429
Net present value of funded plans (60,024) (22,546)
Present value of unfunded obligations (1,786) (2,155)
Total liabilities, net (61,810) (24,701)
Amounts in the balance sheet:
Retirement benefit obligation (61,810) (24,701)
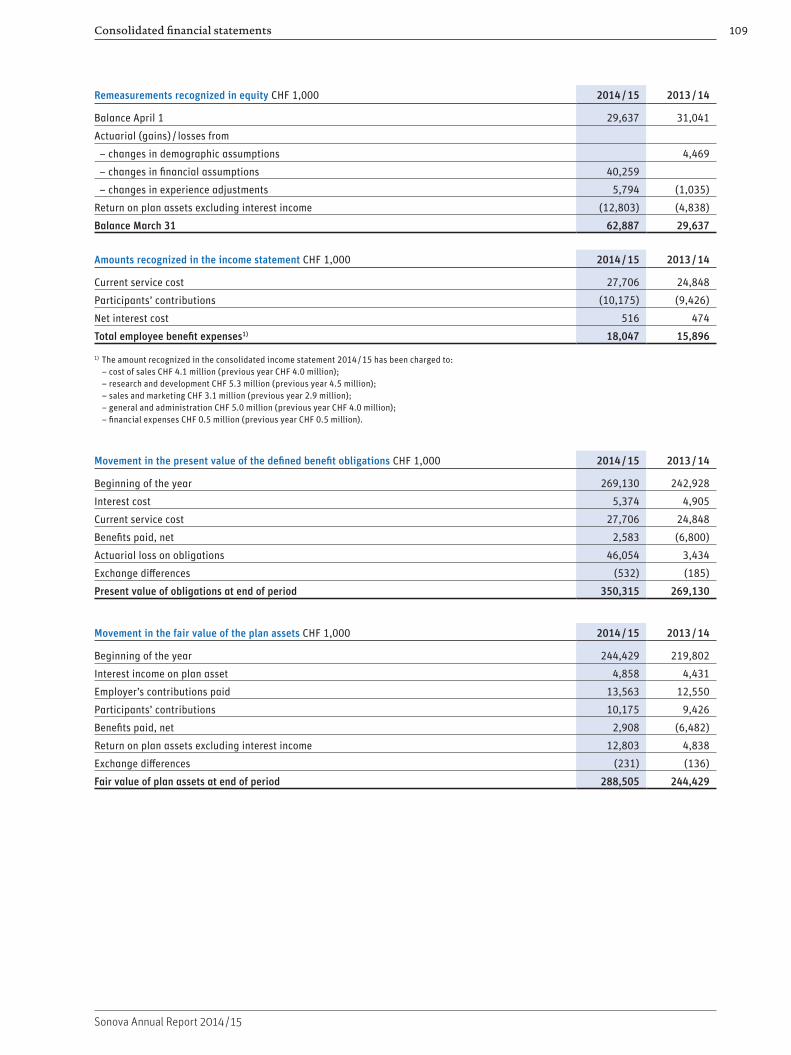
Consolidated financial statements 109
Sonova Annual Report 2014 / 15
Remeasurements recognized in equity CHF 1,000 2014 / 15 2013 / 14
Balance April 1 29,637 31,041
Actuarial (gains) / losses from
– changes in demographic assumptions 4,469
– changes in financial assumptions 40,259
– changes in experience adjustments 5,794 (1,035)
Return on plan assets excluding interest income (12,803) (4,838)
Balance March 31 62,887 29,637
Amounts recognized in the income statement CHF 1,000 2014 / 15 2013 / 14
Current service cost 27,706 24,848
Participants’ contributions (10,175) (9,426)
Net interest cost 516 474
Total employee benefit expenses1) 18,047 15,896
1) The amount recognized in the consolidated income statement 2014 / 15 has been charged to: – cost of sales CHF 4.1 million (previous year CHF 4.0 million); – research and development CHF 5.3 million (previous year 4.5 million); – sales and marketing CHF 3.1 million (previous year 2.9 million); – general and administration CHF 5.0 million (previous year CHF 4.0 million); – financial expenses CHF 0.5 million (previous year CHF 0.5 million).
Movement in the present value of the defined benefit obligations CHF 1,000 2014 / 15 2013 / 14
Beginning of the year 269,130 242,928
Interest cost 5,374 4,905
Current service cost 27,706 24,848
Benefits paid, net 2,583 (6,800)
Actuarial loss on obligations 46,054 3,434
Exchange differences (532) (185)
Present value of obligations at end of period 350,315 269,130
Movement in the fair value of the plan assets CHF 1,000 2014 / 15 2013 / 14
Beginning of the year 244,429 219,802
Interest income on plan asset 4,858 4,431
Employer’s contributions paid 13,563 12,550
Participants’ contributions 10,175 9,426
Benefits paid, net 2,908 (6,482)
Return on plan assets excluding interest income 12,803 4,838
Exchange differences (231) (136)
Fair value of plan assets at end of period 288,505 244,429
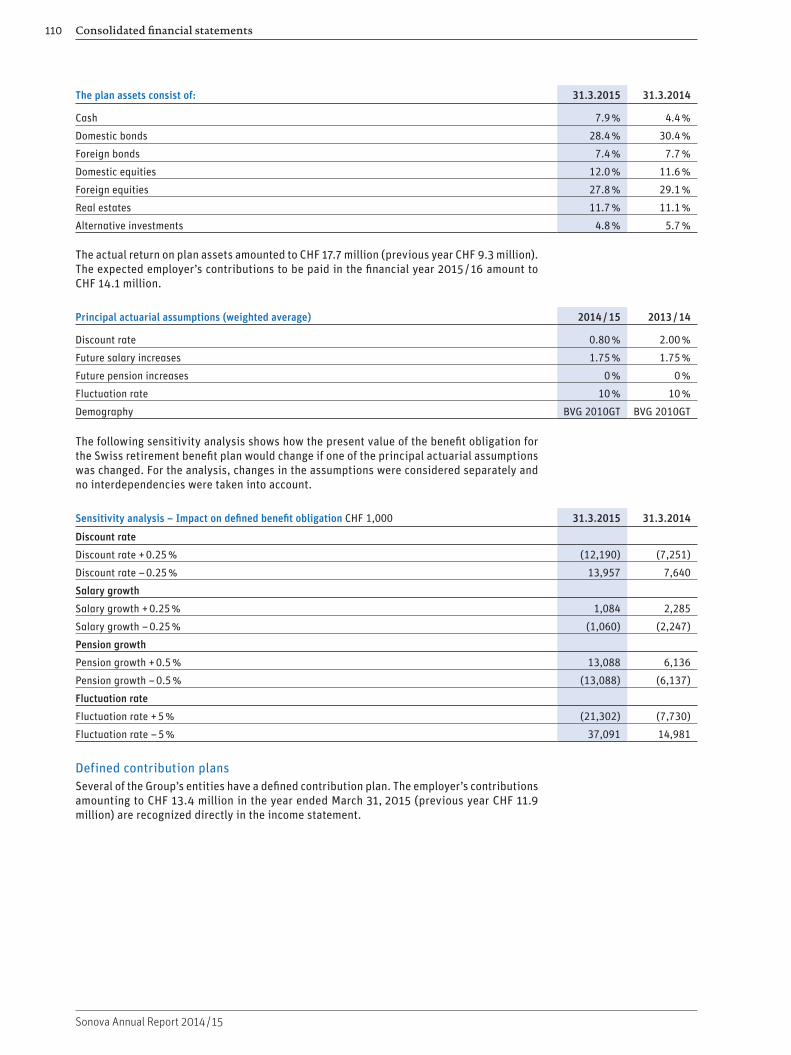
Consolidated financial statements110
Sonova Annual Report 2014 / 15
The plan assets consist of: 31.3.2015 31.3.2014
Cash 7.9 % 4.4 %
Domestic bonds 28.4 % 30.4 %
Foreign bonds 7.4 % 7.7 %
Domestic equities 12.0 % 11.6 %
Foreign equities 27.8 % 29.1 %
Real estates 11.7 % 11.1 %
Alternative investments 4.8 % 5.7 %
The actual return on plan assets amounted to CHF 17.7 million (previous year CHF 9.3 million). The expected employer’s contributions to be paid in the financial year 2015 / 16 amount to CHF 14.1 million.
Principal actuarial assumptions (weighted average) 2014 / 15 2013 / 14
Discount rate 0.80 % 2.00 %
Future salary increases 1.75 % 1.75 %
Future pension increases 0 % 0 %
Fluctuation rate 10 % 10 %
Demography BVG 2010GT BVG 2010GT
The following sensitivity analysis shows how the present value of the benefit obligation for the Swiss retirement benefit plan would change if one of the principal actuarial assumptions was changed. For the analysis, changes in the assumptions were considered separately and no interdependencies were taken into account.
Sensitivity analysis – Impact on defined benefit obligation CHF 1,000 31.3.2015 31.3.2014
Discount rate
Discount rate + 0.25 % (12,190) (7,251)
Discount rate – 0.25 % 13,957 7,640
Salary growth
Salary growth + 0.25 % 1,084 2,285
Salary growth – 0.25 % (1,060) (2,247)
Pension growth
Pension growth + 0.5 % 13,088 6,136
Pension growth – 0.5 % (13,088) (6,137)
Fluctuation rate
Fluctuation rate + 5 % (21,302) (7,730)
Fluctuation rate – 5 % 37,091 14,981
Defined contribution plansSeveral of the Group’s entities have a defined contribution plan. The employer’s contributions amounting to CHF 13.4 million in the year ended March 31, 2015 (previous year CHF 11.9 million) are recognized directly in the income statement.
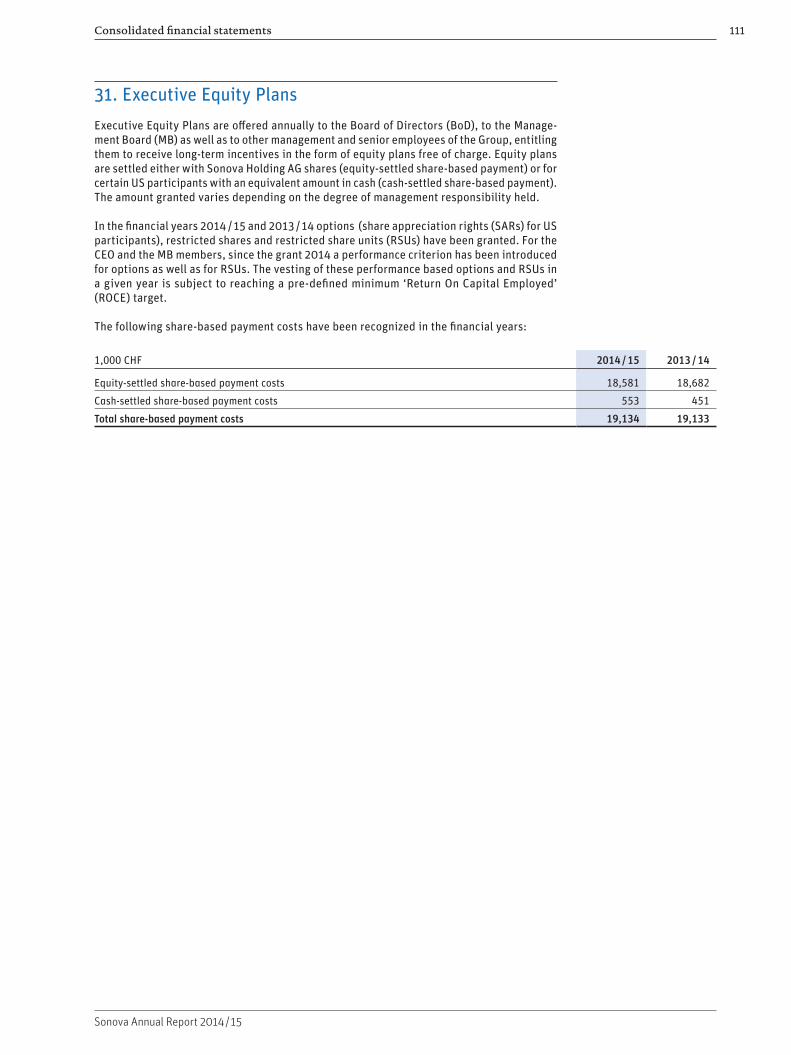
Consolidated financial statements 111
Sonova Annual Report 2014 / 15
31. Executive Equity Plans
Executive Equity Plans are offered annually to the Board of Directors (BoD), to the Manage-ment Board (MB) as well as to other management and senior employees of the Group, entitling them to receive long-term incentives in the form of equity plans free of charge. Equity plans are settled either with Sonova Holding AG shares (equity-settled share-based payment) or for certain US participants with an equivalent amount in cash (cash-settled share-based payment). The amount granted varies depending on the degree of management responsibility held.
In the financial years 2014 / 15 and 2013 / 14 options (share appreciation rights (SARs) for US participants), restricted shares and restricted share units (RSUs) have been granted. For the CEO and the MB members, since the grant 2014 a performance criterion has been introduced for options as well as for RSUs. The vesting of these performance based options and RSUs in a given year is subject to reaching a pre-defined minimum ‘Return On Capital Employed’ (ROCE) target.
The following share-based payment costs have been recognized in the financial years:
1,000 CHF 2014 / 15 2013 / 14
Equity-settled share-based payment costs 18,581 18,682
Cash-settled share-based payment costs 553 451
Total share-based payment costs 19,134 19,133
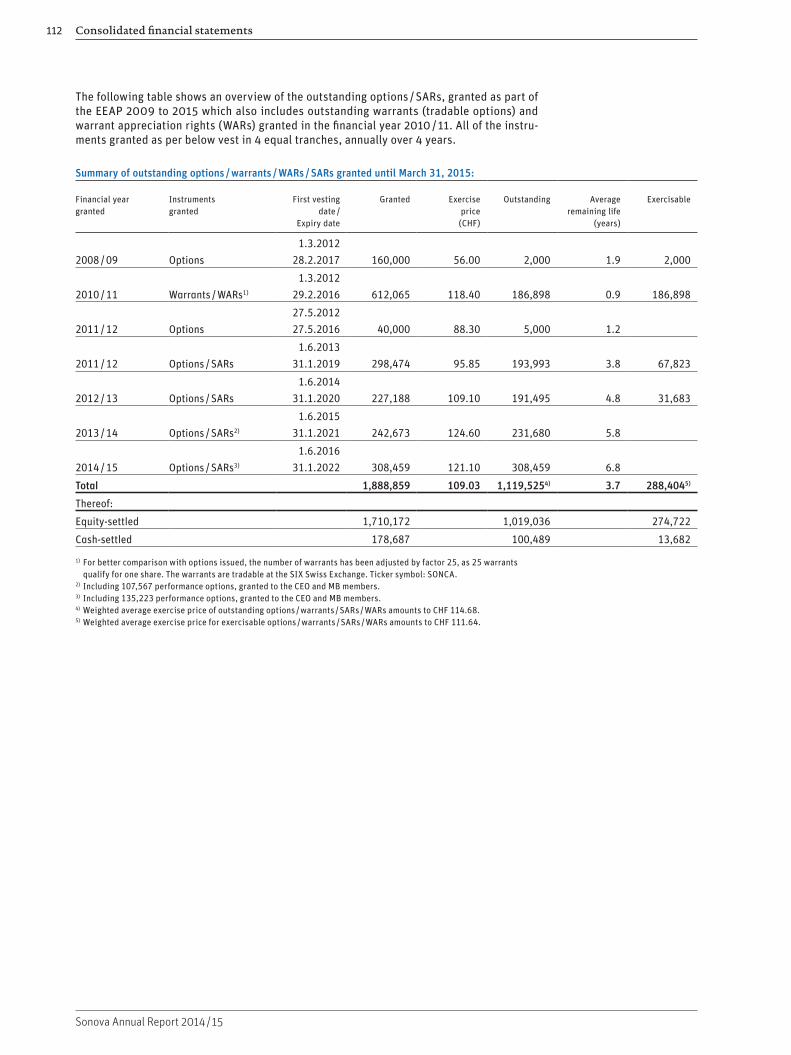
Consolidated financial statements112
Sonova Annual Report 2014 / 15
The following table shows an overview of the outstanding options / SARs, granted as part of the EEAP 2009 to 2015 which also includes outstanding warrants (tradable options) and warrant appreciation rights (WARs) granted in the financial year 2010 / 11. All of the instru-ments granted as per below vest in 4 equal tranches, annually over 4 years.
Summary of outstanding options / warrants / WARs / SARs granted until March 31, 2015:
Financial year granted
Instruments granted
First vesting date /
Expiry date
Granted Exercise price (CHF)
Outstanding Average remaining life
(years)
Exercisable
2008 / 09 Options1.3.2012
28.2.2017 160,000 56.00 2,000 1.9 2,000
2010 / 11 Warrants / WARs1)
1.3.2012 29.2.2016 612,065 118.40 186,898 0.9 186,898
2011 / 12 Options27.5.2012 27.5.2016 40,000 88.30 5,000 1.2
2011 / 12 Options / SARs1.6.2013
31.1.2019 298,474 95.85 193,993 3.8 67,823
2012 / 13 Options / SARs1.6.2014
31.1.2020 227,188 109.10 191,495 4.8 31,683
2013 / 14 Options / SARs2)
1.6.2015 31.1.2021 242,673 124.60 231,680 5.8
2014 / 15 Options / SARs3)
1.6.2016 31.1.2022 308,459 121.10 308,459 6.8
Total 1,888,859 109.03 1,119,5254) 3.7 288,4045)
Thereof:
Equity-settled 1,710,172 1,019,036 274,722
Cash-settled 178,687 100,489 13,682
1) For better comparison with options issued, the number of warrants has been adjusted by factor 25, as 25 warrants qualify for one share. The warrants are tradable at the SIX Swiss Exchange. Ticker symbol: SONCA.
2) Including 107,567 performance options, granted to the CEO and MB members.3) Including 135,223 performance options, granted to the CEO and MB members.4) Weighted average exercise price of outstanding options / warrants / SARs / WARs amounts to CHF 114.68.5) Weighted average exercise price for exercisable options / warrants / SARs / WARs amounts to CHF 111.64.

Consolidated financial statements 113
Sonova Annual Report 2014 / 15
The fair value of options / SARs at grant date was determined by using an “Enhanced American Pricing Model”. The expected volatility is based on historical volatility. The assumptions for valuation used for the options and SARs granted in the financial year 2014 / 2015 and 2013 / 2014 are as follows:
Assumptions for valuation at grant dateExecutive Equity Award Plan 2015
Executive Equity Award Plan 2014
Valuation date 1.2.2015 1.2.2014
Expiry date 31.1.2022 31.1.2021
Share price on grant date CHF 121.10 CHF 124.60
Exercise price CHF 121.10 CHF 124.60
Volatility 25.1 % 27.2 %
Expected dividend yield 2.53 % 2.21 %
Weighted risk free interest rate 0.5 % 0.6 %
Weighted average fair value of options / SARs issued CHF 19.55 CHF 24.46
Options / warrants The exercise price of the options / warrants is equal to the market price of the Sonova share at the SIX Swiss Exchange at grant date. The fair value of the options / warrants granted is estimated at grant date and recorded as an expense over the corresponding vesting period. Assumptions are made regarding the forfeiture rate which is adjusted during the vesting period (including adjustments due to re-assessments of the likely achievements of the ROCE targets for performance options granted to CEO and MB members) to ensure that in the end only a charge for vested amounts occurred. While the options may be exercised between the vesting date and the expiry date of the options, the warrants are tradable and may be sold by the plan participants between the vesting date and the expiry date of the warrants. The trad-able warrants will be exercised at the expiry date. 25 warrants qualify for one share. If options are exercised, one share per option is issued from the conditional share capital or treasury shares are used for fulfillment.
Changes in outstanding options / warrants: 2014 / 15 2013 / 14
Number of options /
warrants1)
Weighted average
exercise price (CHF)
Number of options /
warrants1)
Weighted average
exercise price (CHF)
Outstanding options / warrants at April 1 1,277,473 115.22 1,322,808 106.64
Granted2) 272,224 121.10 215,221 124.60
Exercised / sold3) (507,163) 119.91 (210,872) 70.53
Forfeited (23,498) 113.36 (49,684) 116.91
Outstanding options / warrants at March 31 1,019,036 114.50 1,277,473 115.22
Exercisable at March 31 274,722 111.58 597,551 119.94
1) For better comparison, the number of warrants have been adjusted according to exercise ratio 25:1.2) 2014 / 15 includes 135,223 performance options (previous year 107,567 performance options),
granted to the CEO and MB members.3) Out of the movement for the financial year 2014 / 15, 99,716 (previous year 26,827) relates to options exercised
and 407,447 (previous year 184,045) to warrants sold. Total consideration from options exercised amounted to CHF 10.4 million (previous year CHF 2.2 million). The weighted average share price of the options exercised during the year 2014 / 15 was CHF 137.22 (previous year CHF 80.54).
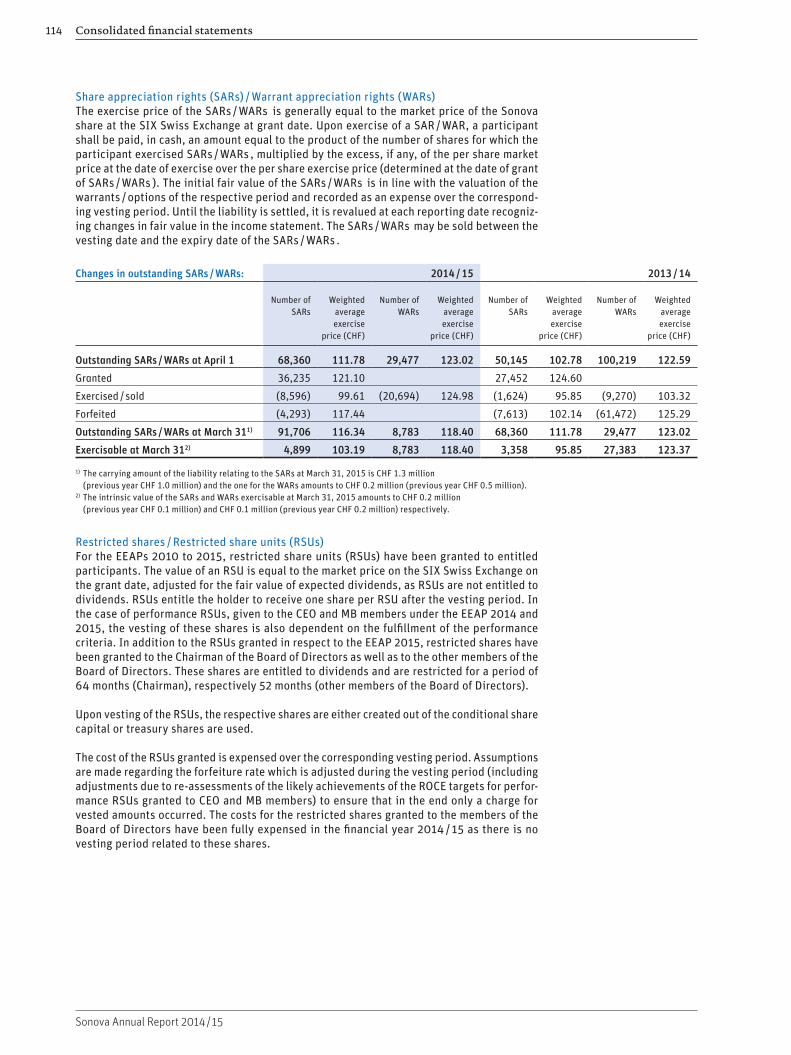
Consolidated financial statements114
Sonova Annual Report 2014 / 15
Share appreciation rights (SARs) / Warrant appreciation rights (WARs) The exercise price of the SARs / WARs is generally equal to the market price of the Sonova share at the SIX Swiss Exchange at grant date. Upon exercise of a SAR / WAR, a participant shall be paid, in cash, an amount equal to the product of the number of shares for which the participant exercised SARs / WARs , multiplied by the excess, if any, of the per share market price at the date of exercise over the per share exercise price (determined at the date of grant of SARs / WARs ). The initial fair value of the SARs / WARs is in line with the valuation of the warrants / options of the respective period and recorded as an expense over the correspond-ing vesting period. Until the liability is settled, it is revalued at each reporting date recogniz-ing changes in fair value in the income statement. The SARs / WARs may be sold between the vesting date and the expiry date of the SARs / WARs .
Changes in outstanding SARs / WARs: 2014 / 15 2013 / 14
Number of SARs
Weighted average exercise
price (CHF)
Number of WARs
Weighted average exercise
price (CHF)
Number of SARs
Weighted average exercise
price (CHF)
Number of WARs
Weighted average exercise
price (CHF)
Outstanding SARs / WARs at April 1 68,360 111.78 29,477 123.02 50,145 102.78 100,219 122.59
Granted 36,235 121.10 27,452 124.60
Exercised / sold (8,596) 99.61 (20,694) 124.98 (1,624) 95.85 (9,270) 103.32
Forfeited (4,293) 117.44 (7,613) 102.14 (61,472) 125.29
Outstanding SARs / WARs at March 311) 91,706 116.34 8,783 118.40 68,360 111.78 29,477 123.02
Exercisable at March 312) 4,899 103.19 8,783 118.40 3,358 95.85 27,383 123.37
1) The carrying amount of the liability relating to the SARs at March 31, 2015 is CHF 1.3 million (previous year CHF 1.0 million) and the one for the WARs amounts to CHF 0.2 million (previous year CHF 0.5 million).
2) The intrinsic value of the SARs and WARs exercisable at March 31, 2015 amounts to CHF 0.2 million (previous year CHF 0.1 million) and CHF 0.1 million (previous year CHF 0.2 million) respectively.
Restricted shares / Restricted share units (RSUs) For the EEAPs 2010 to 2015, restricted share units (RSUs) have been granted to entitled participants. The value of an RSU is equal to the market price on the SIX Swiss Exchange on the grant date, adjusted for the fair value of expected dividends, as RSUs are not entitled to dividends. RSUs entitle the holder to receive one share per RSU after the vesting period. In the case of performance RSUs, given to the CEO and MB members under the EEAP 2014 and 2015, the vesting of these shares is also dependent on the fulfillment of the performance criteria. In addition to the RSUs granted in respect to the EEAP 2015, restricted shares have been granted to the Chairman of the Board of Directors as well as to the other members of the Board of Directors. These shares are entitled to dividends and are restricted for a period of 64 months (Chairman), respectively 52 months (other members of the Board of Directors).
Upon vesting of the RSUs, the respective shares are either created out of the conditional share capital or treasury shares are used. The cost of the RSUs granted is expensed over the corresponding vesting period. Assumptions are made regarding the forfeiture rate which is adjusted during the vesting period (including adjustments due to re-assessments of the likely achievements of the ROCE targets for perfor-mance RSUs granted to CEO and MB members) to ensure that in the end only a charge for vested amounts occurred. The costs for the restricted shares granted to the members of the Board of Directors have been fully expensed in the financial year 2014 / 15 as there is no vesting period related to these shares.

Consolidated financial statements 115
Sonova Annual Report 2014 / 15
Changes in outstanding RSUs: 2014 / 15 2013 / 14
Number of RSUs
Number of RSUs
RSUs at April 1 398,452 352,794
Granted1) 138,138 137,939
Released (83,287) (74,629)
Forfeited (17,830) (17,652)
RSUs at March 31 435,473 398,452
1) 2014 / 15 includes 20,743 performance RSUs, granted to the CEO and MB members (previous year 20,498).
32. Contingent liabilities
At March 31, 2015 and 2014, there were no pledges given to third parties other than in rela-tion to bank loans and mortgages. The bank loan of CHF 470 million, granted in connection with the acquisition of Advanced Bionics, has fully been repaid in the current financial year and therefore the shares of Advanced Bionics are not pledged anymore. A deposit in the amount of CHF 1.1 million has been pledged in relation to a bank guarantee. Mortgages are secured by properties in the amount of CHF 0.1 million (previous year CHF 0.2 million). The net book value of these properties amounts to CHF 0.9 million at March 31, 2015 (previous year CHF 1.1 million). Open purchase orders as of March 31, 2015 and 2014, were related to recurring business activities.
33. Leasing liabilities
At March 31, 2015 the following non-cancellable minimum operating lease obligations existed:
Financial year 1,000 CHF 31.3.2015 31.3.2014
2014 / 15 35,810
2015 / 16 41,191 26,378
2016 / 17 32,451 21,704
2017 / 18 25,843 17,658
2018 / 19 20,664 15,685
2019 / 20 20,656 18,140
thereafter 33,241 14,842
Total 174,046 150,217
The operating lease commitments relate primarily to long-term property lease agreements which are, in general, renewable.
In financial year 2014 / 15, CHF 44.0 million have been recognized as expenses for leases in the consolidated income statement (previous year CHF 48.2 million).
As of March 31, 2015 and 2014, the Group had no financial lease obligations.
34. Events after balance sheet date
On March 2, 2015 the Group announced that it signed an agreement to acquire 100 % of the shares of Hansaton Akustik GmbH. On April 16, 2015, after having received the regulatory approvals, the Group announced the completion of the acquisition. The company has around 200 employees globally, with own centers in Germany, France and the US, and a distribution network in over 70 countries. In calendar year 2014 sales of Hansaton were EUR 42 million. Besides the above mentioned transaction there have been no material events after the balance sheet date.
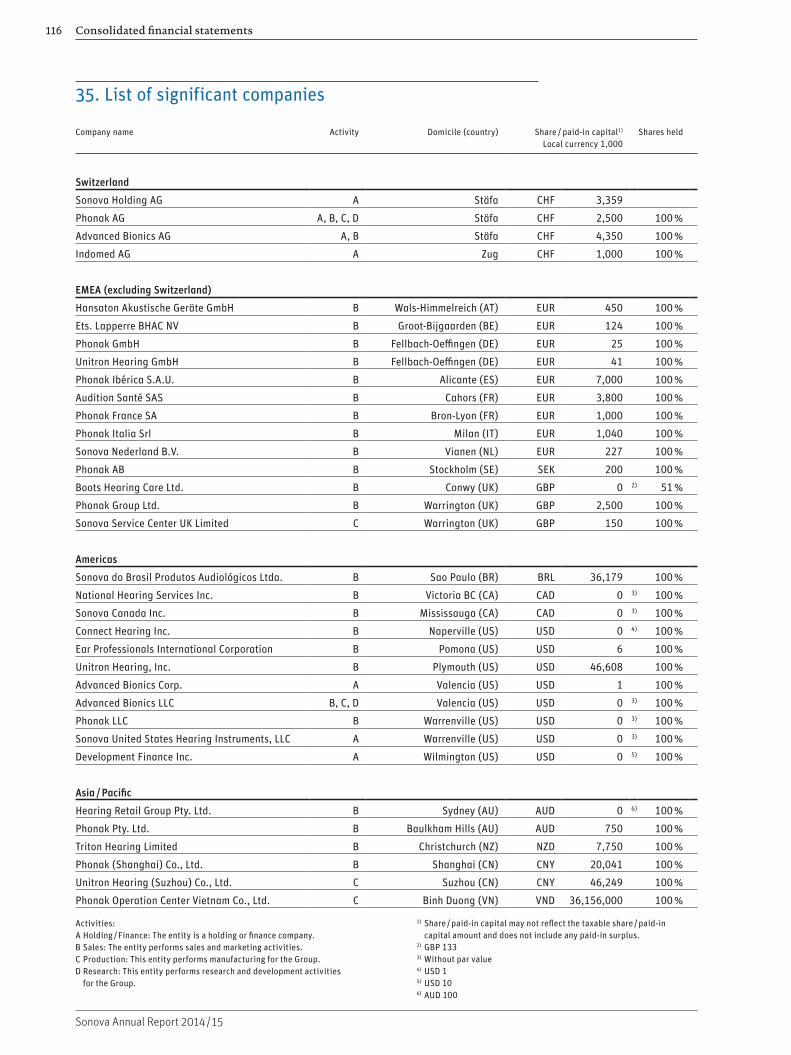
Consolidated financial statements116
Sonova Annual Report 2014 / 15
1) Share / paid-in capital may not reflect the taxable share / paid-in capital amount and does not include any paid-in surplus.
2) GBP 1333) Without par value4) USD 15) USD 106) AUD 100
35. List of significant companies
Company name Activity Domicile (country) Share / paid-in capital1) Local currency 1,000
Shares held
Switzerland
Sonova Holding AG A Stäfa CHF 3,359
Phonak AG A, B, C, D Stäfa CHF 2,500 100 %
Advanced Bionics AG A, B Stäfa CHF 4,350 100 %
Indomed AG A Zug CHF 1,000 100 %
EMEA (excluding Switzerland)
Hansaton Akustische Geräte GmbH B Wals-Himmelreich (AT) EUR 450 100 %
Ets. Lapperre BHAC NV B Groot-Bijgaarden (BE) EUR 124 100 %
Phonak GmbH B Fellbach-Oeffingen (DE) EUR 25 100 %
Unitron Hearing GmbH B Fellbach-Oeffingen (DE) EUR 41 100 %
Phonak Ibérica S.A.U. B Alicante (ES) EUR 7,000 100 %
Audition Santé SAS B Cahors (FR) EUR 3,800 100 %
Phonak France SA B Bron-Lyon (FR) EUR 1,000 100 %
Phonak Italia Srl B Milan (IT) EUR 1,040 100 %
Sonova Nederland B.V. B Vianen (NL) EUR 227 100 %
Phonak AB B Stockholm (SE) SEK 200 100 %
Boots Hearing Care Ltd. B Conwy (UK) GBP 0 2) 51 %
Phonak Group Ltd. B Warrington (UK) GBP 2,500 100 %
Sonova Service Center UK Limited C Warrington (UK) GBP 150 100 %
Americas
Sonova do Brasil Produtos Audiológicos Ltda. B Sao Paulo (BR) BRL 36,179 100 %
National Hearing Services Inc. B Victoria BC (CA) CAD 0 3) 100 %
Sonova Canada Inc. B Mississauga (CA) CAD 0 3) 100 %
Connect Hearing Inc. B Naperville (US) USD 0 4) 100 %
Ear Professionals International Corporation B Pomona (US) USD 6 100 %
Unitron Hearing, Inc. B Plymouth (US) USD 46,608 100 %
Advanced Bionics Corp. A Valencia (US) USD 1 100 %
Advanced Bionics LLC B, C, D Valencia (US) USD 0 3) 100 %
Phonak LLC B Warrenville (US) USD 0 3) 100 %
Sonova United States Hearing Instruments, LLC A Warrenville (US) USD 0 3) 100 %
Development Finance Inc. A Wilmington (US) USD 0 5) 100 %
Asia / Pacific
Hearing Retail Group Pty. Ltd. B Sydney (AU) AUD 0 6) 100 %
Phonak Pty. Ltd. B Baulkham Hills (AU) AUD 750 100 %
Triton Hearing Limited B Christchurch (NZ) NZD 7,750 100 %
Phonak (Shanghai) Co., Ltd. B Shanghai (CN) CNY 20,041 100 %
Unitron Hearing (Suzhou) Co., Ltd. C Suzhou (CN) CNY 46,249 100 %
Phonak Operation Center Vietnam Co., Ltd. C Binh Duong (VN) VND 36,156,000 100 %
Activities:A Holding / Finance: The entity is a holding or finance company.B Sales: The entity performs sales and marketing activities.C Production: This entity performs manufacturing for the Group.D Research: This entity performs research and development activities
for the Group.
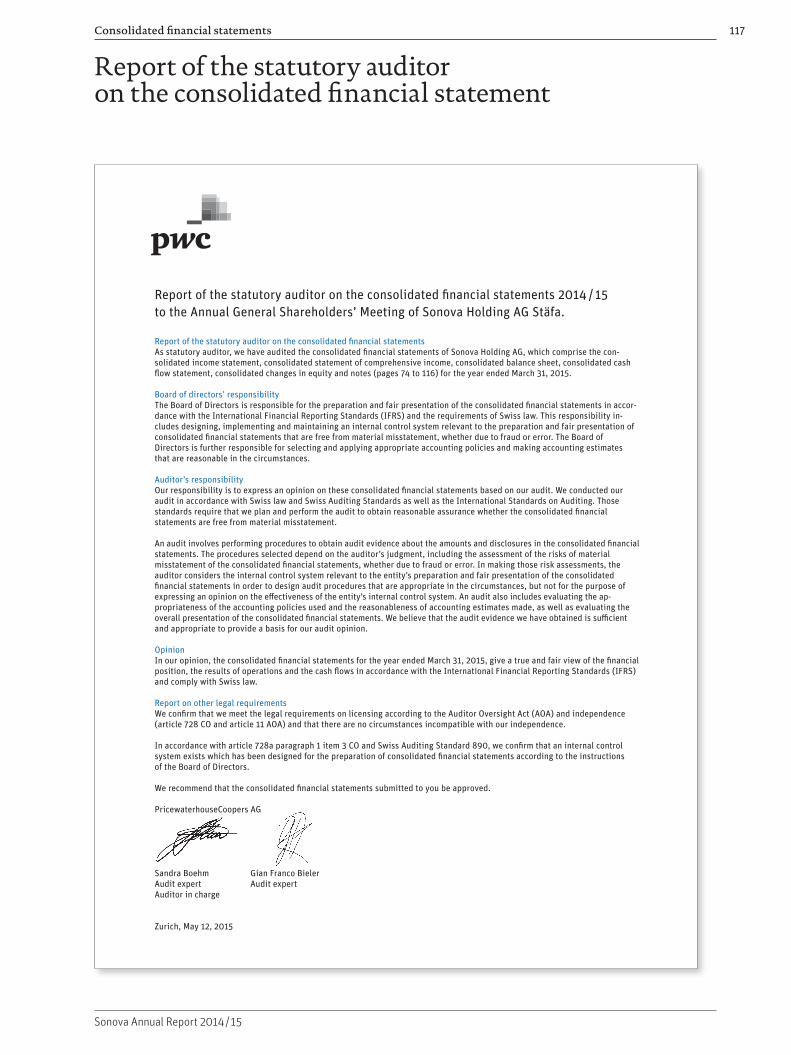
Consolidated financial statements 117
Sonova Annual Report 2014 / 15
Report of the statutory auditor on the consolidated financial statement
Report of the statutory auditor on the consolidated financial statements 2014 / 15 to the Annual General Shareholders’ Meeting of Sonova Holding AG Stäfa.
Report of the statutory auditor on the consolidated financial statementsAs statutory auditor, we have audited the consolidated financial statements of Sonova Holding AG, which comprise the con - solidated income statement, consolidated statement of comprehensive income, consolidated balance sheet, consolidated cash flow statement, consolidated changes in equity and notes (pages 74 to 116) for the year ended March 31, 2015.
Board of directors’ responsibilityThe Board of Directors is responsible for the preparation and fair presentation of the consolidated financial statements in accor- dance with the International Financial Reporting Standards (IFRS) and the requirements of Swiss law. This responsibility in- cludes designing, implementing and maintaining an internal control system relevant to the preparation and fair presentation of consolidated financial statements that are free from material misstatement, whether due to fraud or error. The Board of Directors is further responsible for selecting and applying appropriate accounting policies and making accounting estimates that are reasonable in the circumstances.
Auditor’s responsibilityOur responsibility is to express an opinion on these consolidated financial statements based on our audit. We conducted our audit in accordance with Swiss law and Swiss Auditing Standards as well as the International Standards on Auditing. Those standards require that we plan and perform the audit to obtain reasonable assurance whether the consolidated financial statements are free from material misstatement.
An audit involves performing procedures to obtain audit evidence about the amounts and disclosures in the consolidated financial statements. The procedures selected depend on the auditor’s judgment, including the assessment of the risks of material misstatement of the consolidated financial statements, whether due to fraud or error. In making those risk assessments, the auditor considers the internal control system relevant to the entity’s preparation and fair presentation of the consolidated financial statements in order to design audit procedures that are appropriate in the circumstances, but not for the purpose of expressing an opinion on the effectiveness of the entity’s internal control system. An audit also includes evaluating the ap- propriateness of the accounting policies used and the reasonableness of accounting estimates made, as well as evaluating the overall presentation of the consolidated financial statements. We believe that the audit evidence we have obtained is sufficient and appropriate to provide a basis for our audit opinion.
OpinionIn our opinion, the consolidated financial statements for the year ended March 31, 2015, give a true and fair view of the financial position, the results of operations and the cash flows in accordance with the International Financial Reporting Standards (IFRS) and comply with Swiss law.
Report on other legal requirementsWe confirm that we meet the legal requirements on licensing according to the Auditor Oversight Act (AOA) and independence (article 728 CO and article 11 AOA) and that there are no circumstances incompatible with our independence.
In accordance with article 728a paragraph 1 item 3 CO and Swiss Auditing Standard 890, we confirm that an internal control system exists which has been designed for the preparation of consolidated financial statements according to the instructions of the Board of Directors.
We recommend that the consolidated financial statements submitted to you be approved.
PricewaterhouseCoopers AG
Sandra Boehm Gian Franco BielerAudit expert Audit expertAuditor in charge
Zurich, May 12, 2015
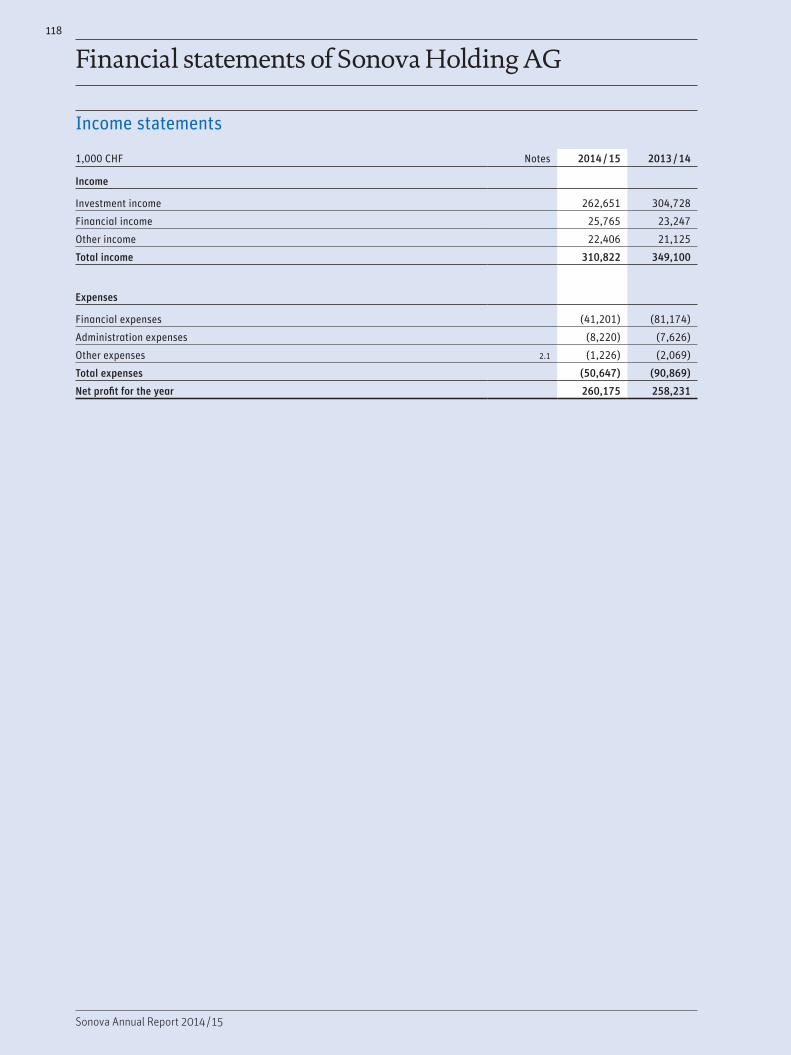
118
Sonova Annual Report 2014 / 15
Financial statements of Sonova Holding AG
Income statements
1,000 CHF Notes 2014 / 15 2013 / 14
Income
Investment income 262,651 304,728
Financial income 25,765 23,247
Other income 22,406 21,125
Total income 310,822 349,100
Expenses
Financial expenses (41,201) (81,174)
Administration expenses (8,220) (7,626)
Other expenses 2.1 (1,226) (2,069)
Total expenses (50,647) (90,869)
Net profit for the year 260,175 258,231
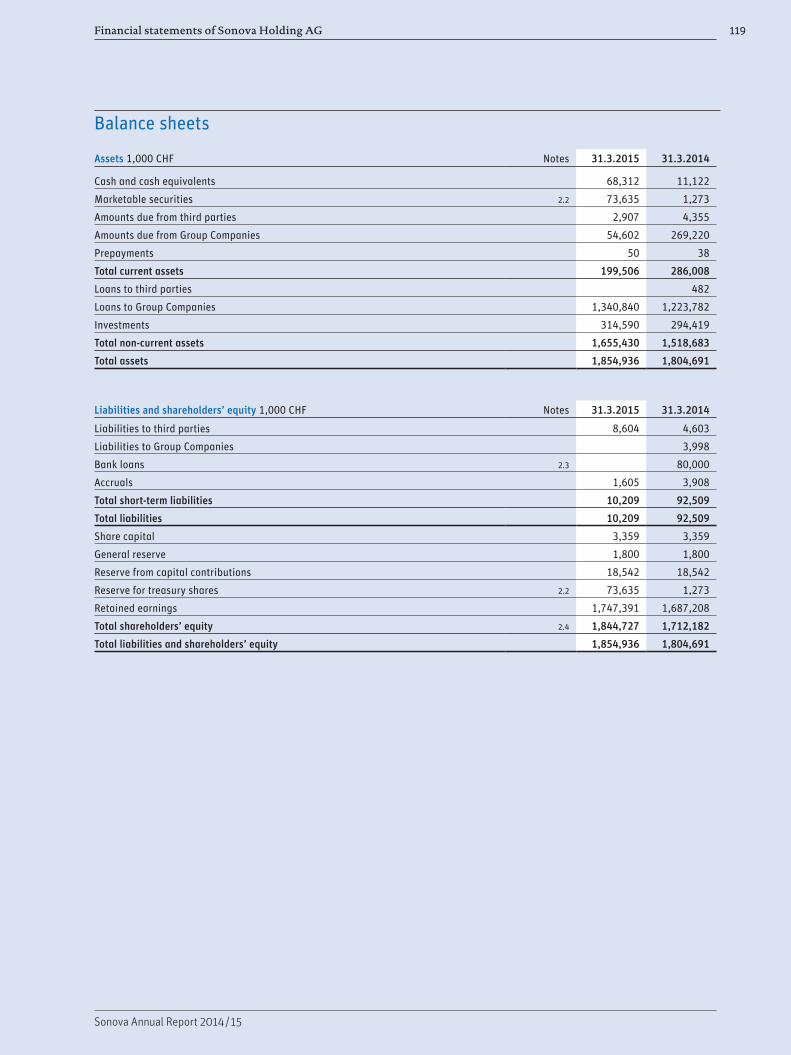
Financial statements of Sonova Holding AG 119
Sonova Annual Report 2014 / 15
Balance sheets
Assets 1,000 CHF Notes 31.3.2015 31.3.2014
Cash and cash equivalents 68,312 11,122
Marketable securities 2.2 73,635 1,273
Amounts due from third parties 2,907 4,355
Amounts due from Group Companies 54,602 269,220
Prepayments 50 38
Total current assets 199,506 286,008
Loans to third parties 482
Loans to Group Companies 1,340,840 1,223,782
Investments 314,590 294,419
Total non-current assets 1,655,430 1,518,683
Total assets 1,854,936 1,804,691
Liabilities and shareholders’ equity 1,000 CHF Notes 31.3.2015 31.3.2014
Liabilities to third parties 8,604 4,603
Liabilities to Group Companies 3,998
Bank loans 2.3 80,000
Accruals 1,605 3,908
Total short-term liabilities 10,209 92,509
Total liabilities 10,209 92,509
Share capital 3,359 3,359
General reserve 1,800 1,800
Reserve from capital contributions 18,542 18,542
Reserve for treasury shares 2.2 73,635 1,273
Retained earnings 1,747,391 1,687,208
Total shareholders’ equity 2.4 1,844,727 1,712,182
Total liabilities and shareholders’ equity 1,854,936 1,804,691

120
Sonova Annual Report 2014 / 15
Notes to the financial statements as of March 31, 20151. General
The financial statements of Sonova Holding AG are prepared in accordance with the principles of Swiss corporate law.
2. Notes to the income statement and balance sheet
2. 1 Other expenses
Other expenses mainly include tax expenses and bank charges.
2. 2 Marketable securities and reserve for treasury shares
Marketable securities include 547,313 treasury shares (previous year 10,185) purchased for a net consideration of CHF 73.6 million (previous year CHF 1.3 million). At March 31, 2015, these shares had a market value of CHF 74.1 million (previous year CHF 1.3 million). Due to the lower of cost or market principle, CHF 73.6 million are considered in the balance sheet. Of the total 547,313 treasury shares, 546,900 shares were purchased by the company as part of the share buyback program.
A reserve for treasury shares in the amount of CHF 73.6 million (previous year CHF 1.3 million) was established which is equal to the cost price. No treasury shares are held by other Group companies.
The following table shows the movement of the reserve for treasury shares and the treasury shares at market value.
Number / 1,000 CHF
Number Reserve for treasury shares
Treasury shares at market value
Balance April 1, 2014 10,185 1,273 1,316
Purchase of treasury shares 1,108,977 144,042 144,042
Sale of treasury shares (571,849) (71,680) (61,526)
Loss from sale of own shares and revaluation (9,781)
Balance March 31, 2015 547,313 73,635 74,051
2. 3 Bank loans
Short-term bank loans of CHF 80 million granted in connection with the acquisition of Advanced Bionics have been paid back in the current financial year (previous year CHF 150 million).
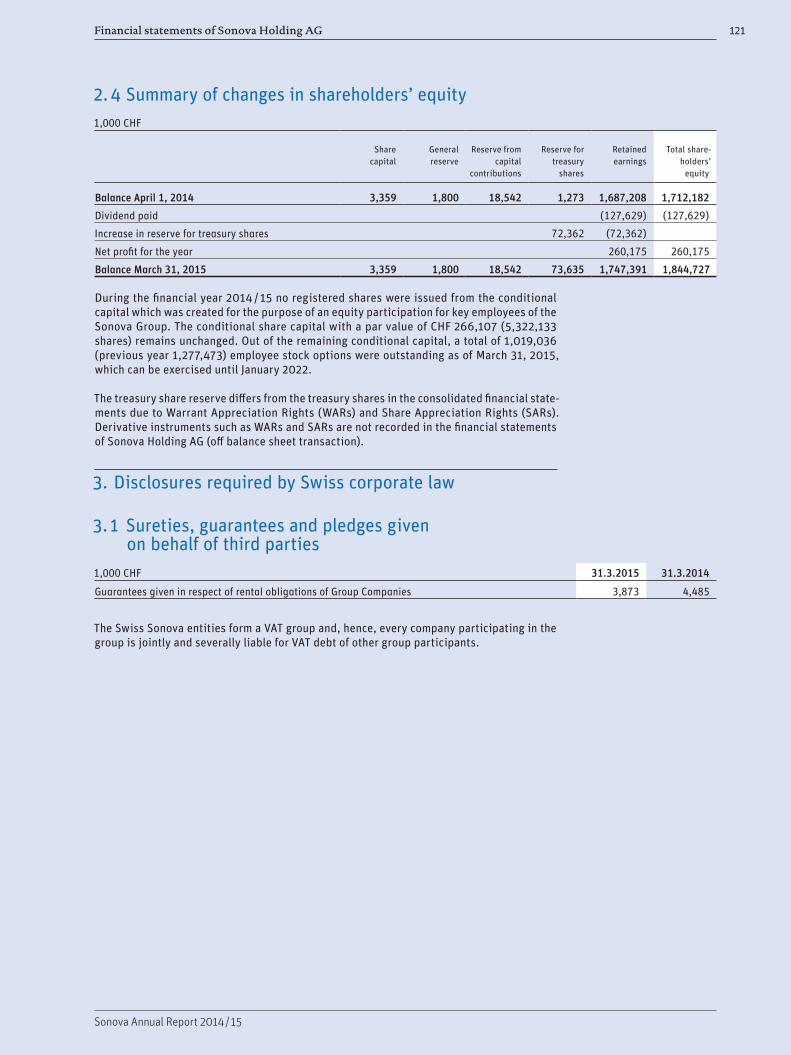
Financial statements of Sonova Holding AG 121
Sonova Annual Report 2014 / 15
2. 4 Summary of changes in shareholders’ equity1,000 CHF
Share capital
General reserve
Reserve from capital
contributions
Reserve for treasury
shares
Retained earnings
Total share- holders’
equity
Balance April 1, 2014 3,359 1,800 18,542 1,273 1,687,208 1,712,182
Dividend paid (127,629) (127,629)
Increase in reserve for treasury shares 72,362 (72,362)
Net profit for the year 260,175 260,175
Balance March 31, 2015 3,359 1,800 18,542 73,635 1,747,391 1,844,727
During the financial year 2014 / 15 no registered shares were issued from the conditional capital which was created for the purpose of an equity participation for key employees of the Sonova Group. The conditional share capital with a par value of CHF 266,107 (5,322,133 shares) remains unchanged. Out of the remaining conditional capital, a total of 1,019,036 (previous year 1,277,473) employee stock options were outstanding as of March 31, 2015, which can be exercised until January 2022.
The treasury share reserve differs from the treasury shares in the consolidated financial state-ments due to Warrant Appreciation Rights (WARs) and Share Appreciation Rights (SARs). Derivative instruments such as WARs and SARs are not recorded in the financial statements of Sonova Holding AG (off balance sheet transaction).
3. Disclosures required by Swiss corporate law
3. 1 Sureties, guarantees and pledges given on behalf of third parties
1,000 CHF 31.3.2015 31.3.2014
Guarantees given in respect of rental obligations of Group Companies 3,873 4,485
The Swiss Sonova entities form a VAT group and, hence, every company participating in the group is jointly and severally liable for VAT debt of other group participants.
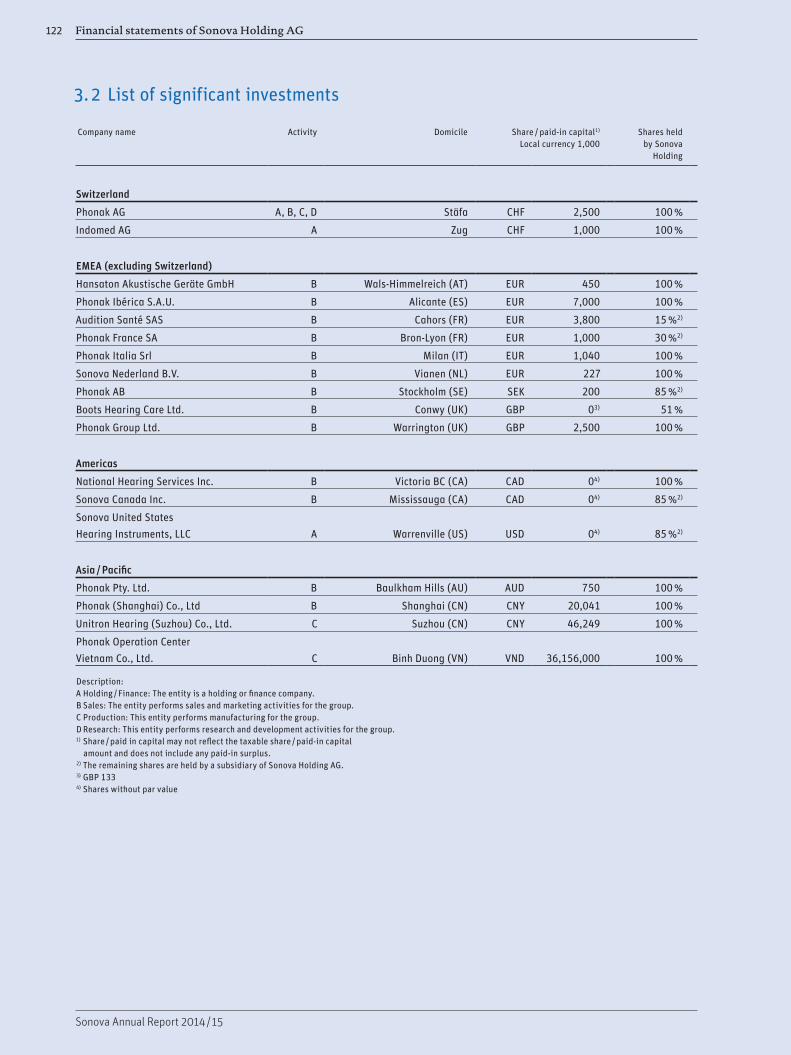
Financial statements of Sonova Holding AG122
Sonova Annual Report 2014 / 15
3. 2 List of significant investments
Company name
Activity
Domicile
Share / paid-in capital1) Local currency 1,000
Shares held by Sonova
Holding
Switzerland
Phonak AG A, B, C, D Stäfa CHF 2,500 100 %
Indomed AG A Zug CHF 1,000 100 %
EMEA (excluding Switzerland)
Hansaton Akustische Geräte GmbH B Wals-Himmelreich (AT) EUR 450 100 %
Phonak Ibérica S.A.U. B Alicante (ES) EUR 7,000 100 %
Audition Santé SAS B Cahors (FR) EUR 3,800 15 %2)
Phonak France SA B Bron-Lyon (FR) EUR 1,000 30 %2)
Phonak Italia Srl B Milan (IT) EUR 1,040 100 %
Sonova Nederland B.V. B Vianen (NL) EUR 227 100 %
Phonak AB B Stockholm (SE) SEK 200 85 %2)
Boots Hearing Care Ltd. B Conwy (UK) GBP 03) 51 %
Phonak Group Ltd. B Warrington (UK) GBP 2,500 100 %
Americas
National Hearing Services Inc. B Victoria BC (CA) CAD 04) 100 %
Sonova Canada Inc. B Mississauga (CA) CAD 04) 85 %2)
Sonova United States Hearing Instruments, LLC A Warrenville (US) USD 04) 85 %2)
Asia / Pacific
Phonak Pty. Ltd. B Baulkham Hills (AU) AUD 750 100 %
Phonak (Shanghai) Co., Ltd B Shanghai (CN) CNY 20,041 100 %
Unitron Hearing (Suzhou) Co., Ltd. C Suzhou (CN) CNY 46,249 100 %
Phonak Operation Center Vietnam Co., Ltd. C Binh Duong (VN) VND 36,156,000 100 %
Description:A Holding / Finance: The entity is a holding or finance company.B Sales: The entity performs sales and marketing activities for the group.C Production: This entity performs manufacturing for the group.D Research: This entity performs research and development activities for the group.1) Share / paid in capital may not reflect the taxable share / paid-in capital
amount and does not include any paid-in surplus.2) The remaining shares are held by a subsidiary of Sonova Holding AG.3) GBP 1334) Shares without par value
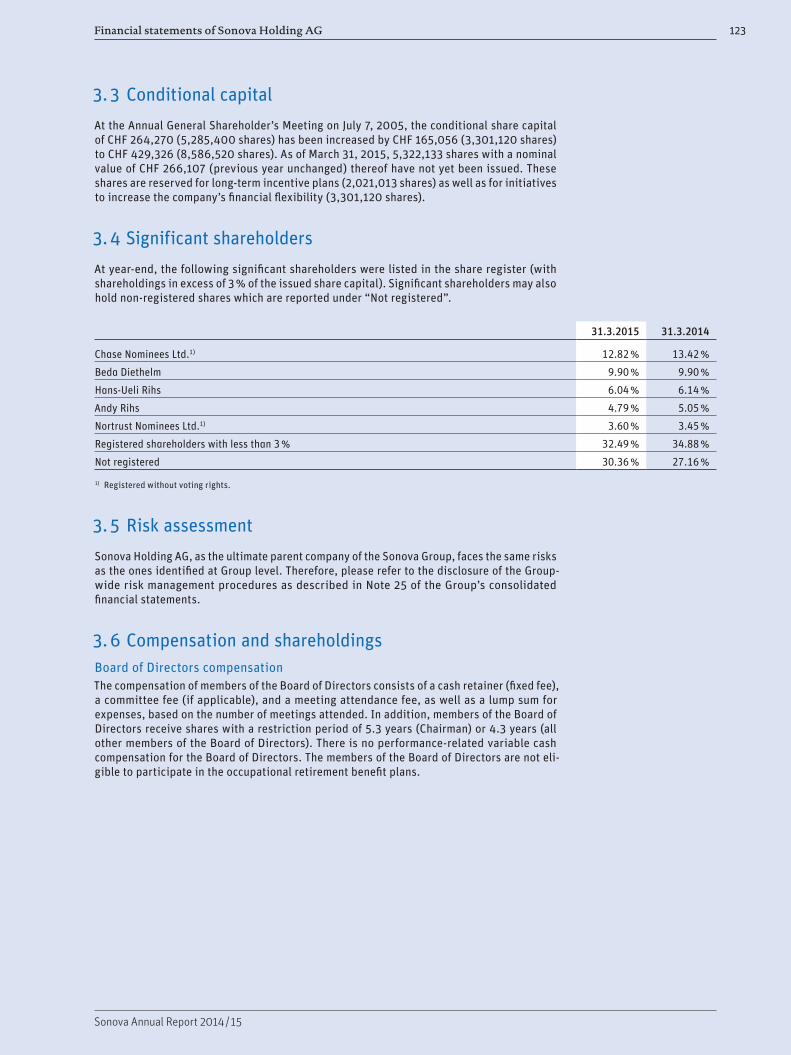
Financial statements of Sonova Holding AG 123
Sonova Annual Report 2014 / 15
3. 3 Conditional capital
At the Annual General Shareholder’s Meeting on July 7, 2005, the conditional share capital of CHF 264,270 (5,285,400 shares) has been increased by CHF 165,056 (3,301,120 shares) to CHF 429,326 (8,586,520 shares). As of March 31, 2015, 5,322,133 shares with a nominal value of CHF 266,107 (previous year unchanged) thereof have not yet been issued. These shares are reserved for long-term incentive plans (2,021,013 shares) as well as for initiatives to increase the company’s financial flexibility (3,301,120 shares).
3. 4 Significant shareholders
At year-end, the following significant shareholders were listed in the share register (with shareholdings in excess of 3 % of the issued share capital). Significant shareholders may also hold non-registered shares which are reported under “Not registered”.
31.3.2015 31.3.2014
Chase Nominees Ltd.1) 12.82 % 13.42 %
Beda Diethelm 9.90 % 9.90 %
Hans-Ueli Rihs 6.04 % 6.14 %
Andy Rihs 4.79 % 5.05 %
Nortrust Nominees Ltd.1) 3.60 % 3.45 %
Registered shareholders with less than 3 % 32.49 % 34.88 %
Not registered 30.36 % 27.16 %
1) Registered without voting rights.
3. 5 Risk assessment
Sonova Holding AG, as the ultimate parent company of the Sonova Group, faces the same risks as the ones identified at Group level. Therefore, please refer to the disclosure of the Group-wide risk management procedures as described in Note 25 of the Group’s consolidated financial statements.
3. 6 Compensation and shareholdingsBoard of Directors compensationThe compensation of members of the Board of Directors consists of a cash retainer (fixed fee), a committee fee (if applicable), and a meeting attendance fee, as well as a lump sum for expenses, based on the number of meetings attended. In addition, members of the Board of Directors receive shares with a restriction period of 5.3 years (Chairman) or 4.3 years (all other members of the Board of Directors). There is no performance-related variable cash compensation for the Board of Directors. The members of the Board of Directors are not eli-gible to participate in the occupational retirement benefit plans.
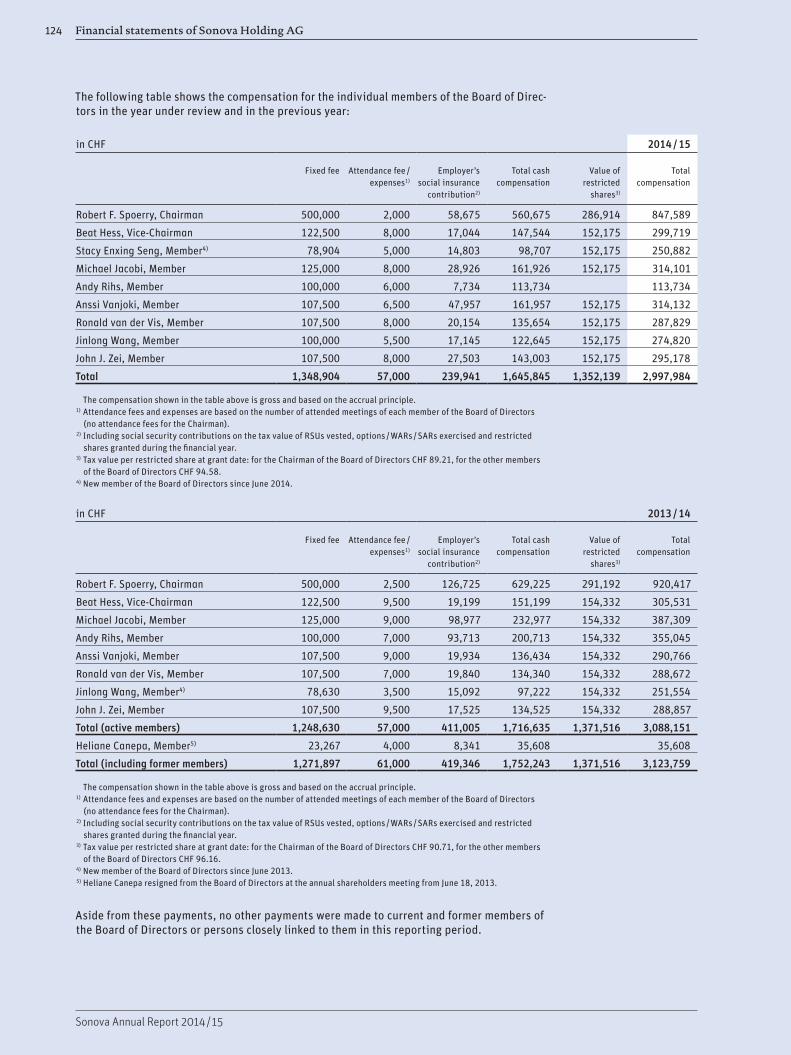
Financial statements of Sonova Holding AG124
Sonova Annual Report 2014 / 15
The following table shows the compensation for the individual members of the Board of Direc-tors in the year under review and in the previous year:
in CHF 2014 / 15
Fixed fee Attendance fee / expenses1)
Employer’s social insurance
contribution2)
Total cash compensation
Value of restricted
shares3)
Total compensation
Robert F. Spoerry, Chairman 500,000 2,000 58,675 560,675 286,914 847,589
Beat Hess, Vice-Chairman 122,500 8,000 17,044 147,544 152,175 299,719
Stacy Enxing Seng, Member4) 78,904 5,000 14,803 98,707 152,175 250,882
Michael Jacobi, Member 125,000 8,000 28,926 161,926 152,175 314,101
Andy Rihs, Member 100,000 6,000 7,734 113,734 113,734
Anssi Vanjoki, Member 107,500 6,500 47,957 161,957 152,175 314,132
Ronald van der Vis, Member 107,500 8,000 20,154 135,654 152,175 287,829
Jinlong Wang, Member 100,000 5,500 17,145 122,645 152,175 274,820
John J. Zei, Member 107,500 8,000 27,503 143,003 152,175 295,178
Total 1,348,904 57,000 239,941 1,645,845 1,352,139 2,997,984
The compensation shown in the table above is gross and based on the accrual principle.1) Attendance fees and expenses are based on the number of attended meetings of each member of the Board of Directors
(no attendance fees for the Chairman).2) Including social security contributions on the tax value of RSUs vested, options / WARs / SARs exercised and restricted
shares granted during the financial year.3) Tax value per restricted share at grant date: for the Chairman of the Board of Directors CHF 89.21, for the other members
of the Board of Directors CHF 94.58.4) New member of the Board of Directors since June 2014.
in CHF 2013 / 14
Fixed fee Attendance fee / expenses1)
Employer’s social insurance
contribution2)
Total cash compensation
Value of restricted
shares3)
Total compensation
Robert F. Spoerry, Chairman 500,000 2,500 126,725 629,225 291,192 920,417
Beat Hess, Vice-Chairman 122,500 9,500 19,199 151,199 154,332 305,531
Michael Jacobi, Member 125,000 9,000 98,977 232,977 154,332 387,309
Andy Rihs, Member 100,000 7,000 93,713 200,713 154,332 355,045
Anssi Vanjoki, Member 107,500 9,000 19,934 136,434 154,332 290,766
Ronald van der Vis, Member 107,500 7,000 19,840 134,340 154,332 288,672
Jinlong Wang, Member4) 78,630 3,500 15,092 97,222 154,332 251,554
John J. Zei, Member 107,500 9,500 17,525 134,525 154,332 288,857
Total (active members) 1,248,630 57,000 411,005 1,716,635 1,371,516 3,088,151
Heliane Canepa, Member5) 23,267 4,000 8,341 35,608 35,608
Total (including former members) 1,271,897 61,000 419,346 1,752,243 1,371,516 3,123,759
The compensation shown in the table above is gross and based on the accrual principle.1) Attendance fees and expenses are based on the number of attended meetings of each member of the Board of Directors
(no attendance fees for the Chairman).2) Including social security contributions on the tax value of RSUs vested, options / WARs / SARs exercised and restricted
shares granted during the financial year.3) Tax value per restricted share at grant date: for the Chairman of the Board of Directors CHF 90.71, for the other members
of the Board of Directors CHF 96.16.4) New member of the Board of Directors since June 2013.5) Heliane Canepa resigned from the Board of Directors at the annual shareholders meeting from June 18, 2013.
Aside from these payments, no other payments were made to current and former members of the Board of Directors or persons closely linked to them in this reporting period.

Financial statements of Sonova Holding AG 125
Sonova Annual Report 2014 / 15
Management Board compensationThe compensation of the Management Board (including the CEO) comprises:
– Fixed base salary– Variable cash compensation (VCC)– Long-term incentive (Executive Equity Award Plan, EEAP)– Additional employee benefits, such as pension benefits and lump sum expenses
At targets, the VCC amounts to 62.5 % of base salary for the CEO and, usually, 50 % for other members of the Management Board. Lower and upper performance thresholds are also set, below which the payout percentage is zero, and above which it is capped at 200 %. Payout levels between the threshold, the target, and the maximum are calculated by linear interpola-tion.
The VCC for the Management Board is based on three categories of performance objectives:Group, business unit, and individual. Group performance objectives are based on the budget; the specific metrics are sales, EBITA, free cash flow (FCF), and earnings per share (EPS). Busi-ness unit performance objectives include sales, EBITA, average sales price (ASP), and oper-ating expenses of the respective business unit.
Group and business unit performance objectives together are weighted at between 60 % and80 % of the overall VCC objectives. The individual performance component is based on the achievement of individual objectives predefined at the beginning of the financial year betweenthe CEO and individual members of the Management Board, and, for the CEO, between the Board of Directors and the CEO. The three to five individual performance objectives for eachmember of the Management Board are weighted at between 20 % and 40 % of the total VCC objectives.
The EEAP is offered annually to members of the Management Board (including the CEO). Gen-erally the grant date is on February 1, each year. The grants are made in the form of options and restricted share units (RSUs) that vest in four equal annual installments over a period of four years, with the first tranche vesting on June 1, of the year following the grant year. Since the financial year 2013 / 14, the grant made under the EEAP to members of the Management Board includes a performance criterion: the vesting of options and RSUs in a given year is subject to achievement of a pre-defined minimum return on capital employed (ROCE) target.
The highest total remuneration for a Management Board member in the year under review was paid to the CEO, Lukas Braunschweiler. His fixed base salary was CHF 800,000 and the target variable cash compensation was CHF 500,000 (62.5 % of the fixed base salary). His effective variable cash payout for performance in the year under review was CHF 491,679, (61.5 % of the fixed base salary ), whereas the maximum potential variable cash payout would have been CHF 1,000,000 (125 % of the fixed base salary). In addition, an equity grant (EEAP) with a 2015 fair value of CHF 849,992, fringe benefits of CHF 24,891, employer’s pension contributions of CHF 126,899 and employer’s social insurance contribution of CHF 110,904 are all reflected in Lukas Braunschweiler’s total remuneration of CHF 2,404,365.
The following table shows the compensation for the CEO (highest compensation) and the other members of the Management Board for the financial year 2014 / 15 and the previous year. Payments to 13 other members (one member joined in August 2014) of the Management Board are covered in the table for the 2014 / 15 financial year. The cumulated effective variable cash payout in % of the cumulated fixed base salary of the other members of the Management Board was 52.5 %. Payments to 12 other members of the Management Board are covered in the table for the 2013 / 14 financial year.

Financial statements of Sonova Holding AG126
Sonova Annual Report 2014 / 15
in CHF 2014 / 15
Fixed salary
Variable salary1)
Fringe benefits
Employer’s pension
contribu-tion
Employer’s social
insurance contribu-
tion2)
Total cash compensation
Value of RSUs3)
Value of options4)
Total compensation
Lukas Braunschweiler, CEO 800,000 491,679 24,891 126,899 110,904 1,554,373 318,692 531,300 2,404,365
Other members of the MB5) 4,398,733 2,309,791 274,350 759,536 823,492 8,565,902 2,111,684 2,112,646 12,790,232
Total 5,198,733 2,801,470 299,241 886,435 934,396 10,120,275 2,430,376 2,643,946 15,194,597
The compensation shown in the table above is gross and based on the accrual principle.1) The variable salary will be paid out after the end of the reporting year.2) Including social security contributions on the tax value of RSUs vested and options / warrants exercised
during the financial year.3) Fair value per RSU at grant date CHF 117.17.4) Fair value per option at grant date CHF 19.55.5) Martin Grieder, GVP Phonak joined the Management Board as of August 2014.
in CHF 2013 / 14
Fixed salary
Variable salary1)
Fringe benefits
Employer’s pension
contribu-tion
Employer’s social
insurance contribu-
tion2)
Total cash compensation
Value of RSUs3)
Value of options4)
Total compensation
Lukas Braunschweiler, CEO 800,000 672,040 24,496 126,764 101,722 1,725,022 318,728 531,247 2,574,997
Other members of the MB5) 3,971,335 2,821,704 247,650 672,182 642,898 8,355,769 2,099,216 2,099,842 12,554,827
Total 4,771,335 3,493,744 272,146 798,946 744,620 10,080,791 2,417,944 2,631,089 15,129,824
The compensation shown in the table above is gross and based on the accrual principle.1) The variable salary will be paid out after the end of the reporting year.2) Including social security contributions on the tax value of RSUs vested and options / warrants exercised
during the financial year.3) Fair value per RSU at grant date CHF 117.96.4) Fair value per option at grant date CHF 24.46.5) Albert Chin-Hwee Lim, VP Region Asia Pacific, Stefan Launer, VP Science & Technology, Jan Metzdorff, VP Unitron,
and Franz Petermann, VP Connect Hearing Group joined the Management Board as of April 2013.
Aside from these payments, no other payments were made to current or former members of the Management Board or persons closely linked to them in this reporting period.
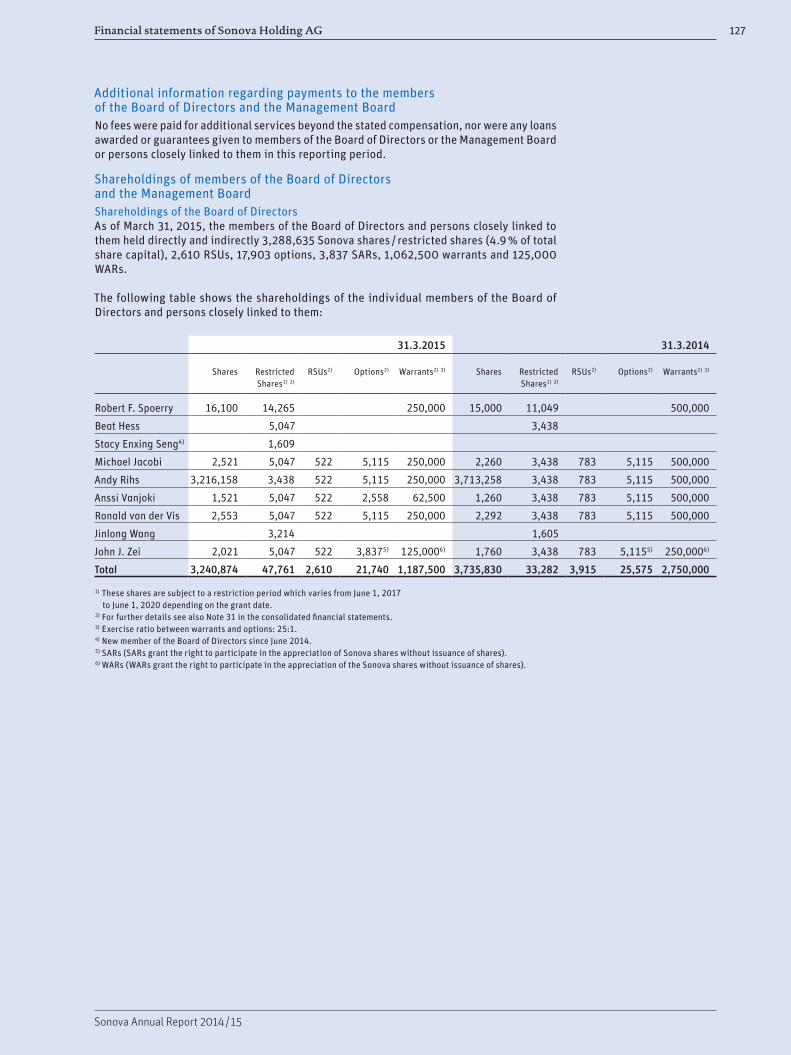
Financial statements of Sonova Holding AG 127
Sonova Annual Report 2014 / 15
Additional information regarding payments to the members of the Board of Directors and the Management BoardNo fees were paid for additional services beyond the stated compensation, nor were any loans awarded or guarantees given to members of the Board of Directors or the Management Board or persons closely linked to them in this reporting period.
Shareholdings of members of the Board of Directors and the Management BoardShareholdings of the Board of DirectorsAs of March 31, 2015, the members of the Board of Directors and persons closely linked to them held directly and indirectly 3,288,635 Sonova shares / restricted shares (4.9 % of total share capital), 2,610 RSUs, 17,903 options, 3,837 SARs, 1,062,500 warrants and 125,000 WARs.
The following table shows the shareholdings of the individual members of the Board of Directors and persons closely linked to them:
31.3.2015 31.3.2014
Shares Restricted Shares1) 2)
RSUs2) Options2) Warrants2) 3) Shares Restricted Shares1) 2)
RSUs2) Options2) Warrants2) 3)
Robert F. Spoerry 16,100 14,265 250,000 15,000 11,049 500,000
Beat Hess 5,047 3,438
Stacy Enxing Seng4) 1,609
Michael Jacobi 2,521 5,047 522 5,115 250,000 2,260 3,438 783 5,115 500,000
Andy Rihs 3,216,158 3,438 522 5,115 250,000 3,713,258 3,438 783 5,115 500,000
Anssi Vanjoki 1,521 5,047 522 2,558 62,500 1,260 3,438 783 5,115 500,000
Ronald van der Vis 2,553 5,047 522 5,115 250,000 2,292 3,438 783 5,115 500,000
Jinlong Wang 3,214 1,605
John J. Zei 2,021 5,047 522 3,8375) 125,0006) 1,760 3,438 783 5,1155) 250,0006)
Total 3,240,874 47,761 2,610 21,740 1,187,500 3,735,830 33,282 3,915 25,575 2,750,000
1) These shares are subject to a restriction period which varies from June 1, 2017 to June 1, 2020 depending on the grant date.
2) For further details see also Note 31 in the consolidated financial statements.3) Exercise ratio between warrants and options: 25:1.4) New member of the Board of Directors since June 2014.5) SARs (SARs grant the right to participate in the appreciation of Sonova shares without issuance of shares).6) WARs (WARs grant the right to participate in the appreciation of the Sonova shares without issuance of shares).
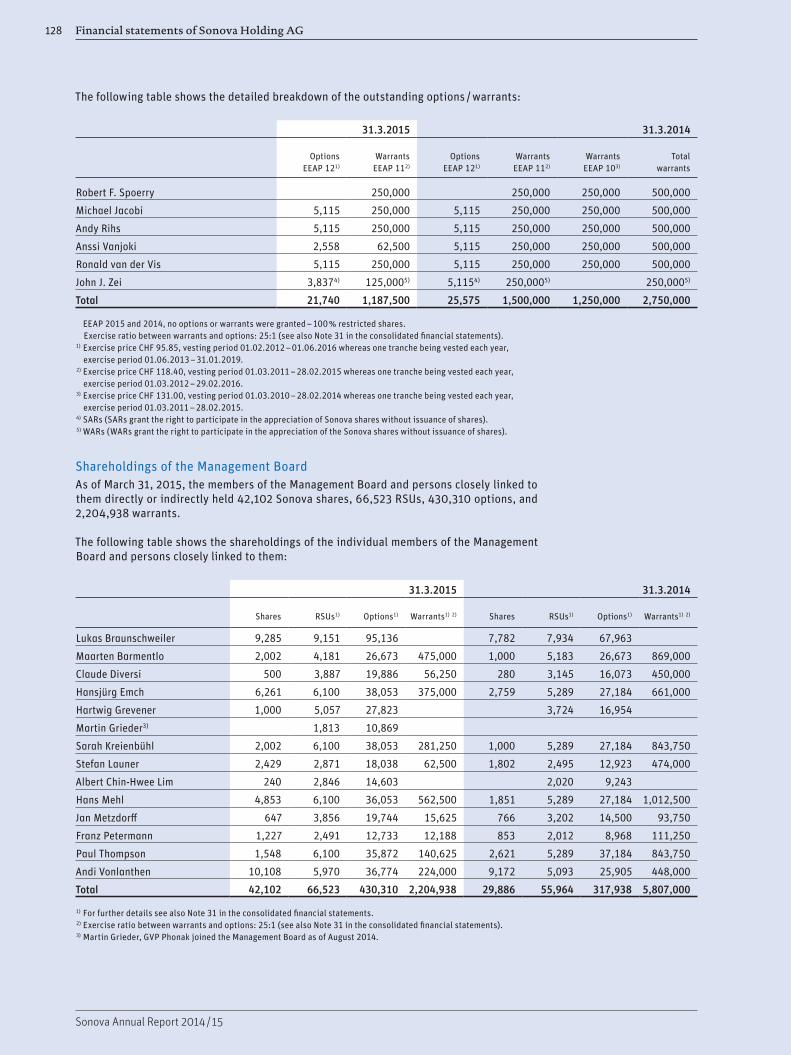
Financial statements of Sonova Holding AG128
Sonova Annual Report 2014 / 15
The following table shows the detailed breakdown of the outstanding options / warrants:
31.3.2015 31.3.2014
Options EEAP 121)
Warrants EEAP 112)
Options EEAP 121)
Warrants EEAP 112)
Warrants EEAP 103)
Total warrants
Robert F. Spoerry 250,000 250,000 250,000 500,000
Michael Jacobi 5,115 250,000 5,115 250,000 250,000 500,000
Andy Rihs 5,115 250,000 5,115 250,000 250,000 500,000
Anssi Vanjoki 2,558 62,500 5,115 250,000 250,000 500,000
Ronald van der Vis 5,115 250,000 5,115 250,000 250,000 500,000
John J. Zei 3,8374) 125,0005) 5,1154) 250,0005) 250,0005)
Total 21,740 1,187,500 25,575 1,500,000 1,250,000 2,750,000
EEAP 2015 and 2014, no options or warrants were granted – 100 % restricted shares. Exercise ratio between warrants and options: 25:1 (see also Note 31 in the consolidated financial statements).
1) Exercise price CHF 95.85, vesting period 01.02.2012 – 01.06.2016 whereas one tranche being vested each year, exercise period 01.06.2013 – 31.01.2019.
2) Exercise price CHF 118.40, vesting period 01.03.2011 – 28.02.2015 whereas one tranche being vested each year, exercise period 01.03.2012 – 29.02.2016.
3) Exercise price CHF 131.00, vesting period 01.03.2010 – 28.02.2014 whereas one tranche being vested each year, exercise period 01.03.2011 – 28.02.2015.
4) SARs (SARs grant the right to participate in the appreciation of Sonova shares without issuance of shares).5) WARs (WARs grant the right to participate in the appreciation of the Sonova shares without issuance of shares).
Shareholdings of the Management Board As of March 31, 2015, the members of the Management Board and persons closely linked to them directly or indirectly held 42,102 Sonova shares, 66,523 RSUs, 430,310 options, and 2,204,938 warrants.
The following table shows the shareholdings of the individual members of the Management Board and persons closely linked to them:
31.3.2015 31.3.2014
Shares RSUs1) Options1) Warrants1) 2) Shares RSUs1) Options1) Warrants1) 2)
Lukas Braunschweiler 9,285 9,151 95,136 7,782 7,934 67,963
Maarten Barmentlo 2,002 4,181 26,673 475,000 1,000 5,183 26,673 869,000
Claude Diversi 500 3,887 19,886 56,250 280 3,145 16,073 450,000
Hansjürg Emch 6,261 6,100 38,053 375,000 2,759 5,289 27,184 661,000
Hartwig Grevener 1,000 5,057 27,823 3,724 16,954
Martin Grieder3) 1,813 10,869
Sarah Kreienbühl 2,002 6,100 38,053 281,250 1,000 5,289 27,184 843,750
Stefan Launer 2,429 2,871 18,038 62,500 1,802 2,495 12,923 474,000
Albert Chin-Hwee Lim 240 2,846 14,603 2,020 9,243
Hans Mehl 4,853 6,100 36,053 562,500 1,851 5,289 27,184 1,012,500
Jan Metzdorff 647 3,856 19,744 15,625 766 3,202 14,500 93,750
Franz Petermann 1,227 2,491 12,733 12,188 853 2,012 8,968 111,250
Paul Thompson 1,548 6,100 35,872 140,625 2,621 5,289 37,184 843,750
Andi Vonlanthen 10,108 5,970 36,774 224,000 9,172 5,093 25,905 448,000
Total 42,102 66,523 430,310 2,204,938 29,886 55,964 317,938 5,807,000
1) For further details see also Note 31 in the consolidated financial statements.2) Exercise ratio between warrants and options: 25:1 (see also Note 31 in the consolidated financial statements).3) Martin Grieder, GVP Phonak joined the Management Board as of August 2014.
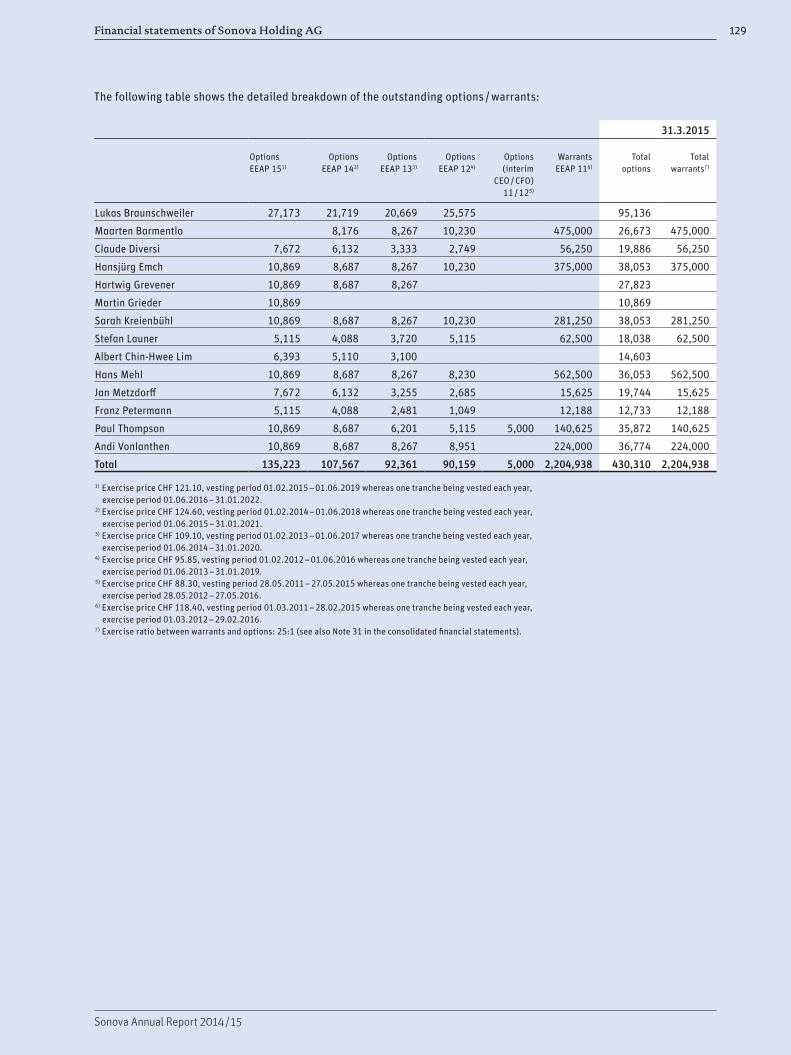
Financial statements of Sonova Holding AG 129
Sonova Annual Report 2014 / 15
The following table shows the detailed breakdown of the outstanding options / warrants:
31.3.2015
Options EEAP 151)
Options EEAP 142)
Options EEAP 133)
Options EEAP 124)
Options (interim
CEO / CFO) 11 / 125)
Warrants EEAP 116)
Total options
Total warrants7)
Lukas Braunschweiler 27,173 21,719 20,669 25,575 95,136
Maarten Barmentlo 8,176 8,267 10,230 475,000 26,673 475,000
Claude Diversi 7,672 6,132 3,333 2,749 56,250 19,886 56,250
Hansjürg Emch 10,869 8,687 8,267 10,230 375,000 38,053 375,000
Hartwig Grevener 10,869 8,687 8,267 27,823
Martin Grieder 10,869 10,869
Sarah Kreienbühl 10,869 8,687 8,267 10,230 281,250 38,053 281,250
Stefan Launer 5,115 4,088 3,720 5,115 62,500 18,038 62,500
Albert Chin-Hwee Lim 6,393 5,110 3,100 14,603
Hans Mehl 10,869 8,687 8,267 8,230 562,500 36,053 562,500
Jan Metzdorff 7,672 6,132 3,255 2,685 15,625 19,744 15,625
Franz Petermann 5,115 4,088 2,481 1,049 12,188 12,733 12,188
Paul Thompson 10,869 8,687 6,201 5,115 5,000 140,625 35,872 140,625
Andi Vonlanthen 10,869 8,687 8,267 8,951 224,000 36,774 224,000
Total 135,223 107,567 92,361 90,159 5,000 2,204,938 430,310 2,204,938
1) Exercise price CHF 121.10, vesting period 01.02.2015 – 01.06.2019 whereas one tranche being vested each year, exercise period 01.06.2016 – 31.01.2022.
2) Exercise price CHF 124.60, vesting period 01.02.2014 – 01.06.2018 whereas one tranche being vested each year, exercise period 01.06.2015 – 31.01.2021.
3) Exercise price CHF 109.10, vesting period 01.02.2013 – 01.06.2017 whereas one tranche being vested each year, exercise period 01.06.2014 – 31.01.2020.
4) Exercise price CHF 95.85, vesting period 01.02.2012 – 01.06.2016 whereas one tranche being vested each year, exercise period 01.06.2013 – 31.01.2019.
5) Exercise price CHF 88.30, vesting period 28.05.2011 – 27.05.2015 whereas one tranche being vested each year, exercise period 28.05.2012 – 27.05.2016.
6) Exercise price CHF 118.40, vesting period 01.03.2011 – 28.02.2015 whereas one tranche being vested each year, exercise period 01.03.2012 – 29.02.2016.
7) Exercise ratio between warrants and options: 25:1 (see also Note 31 in the consolidated financial statements).
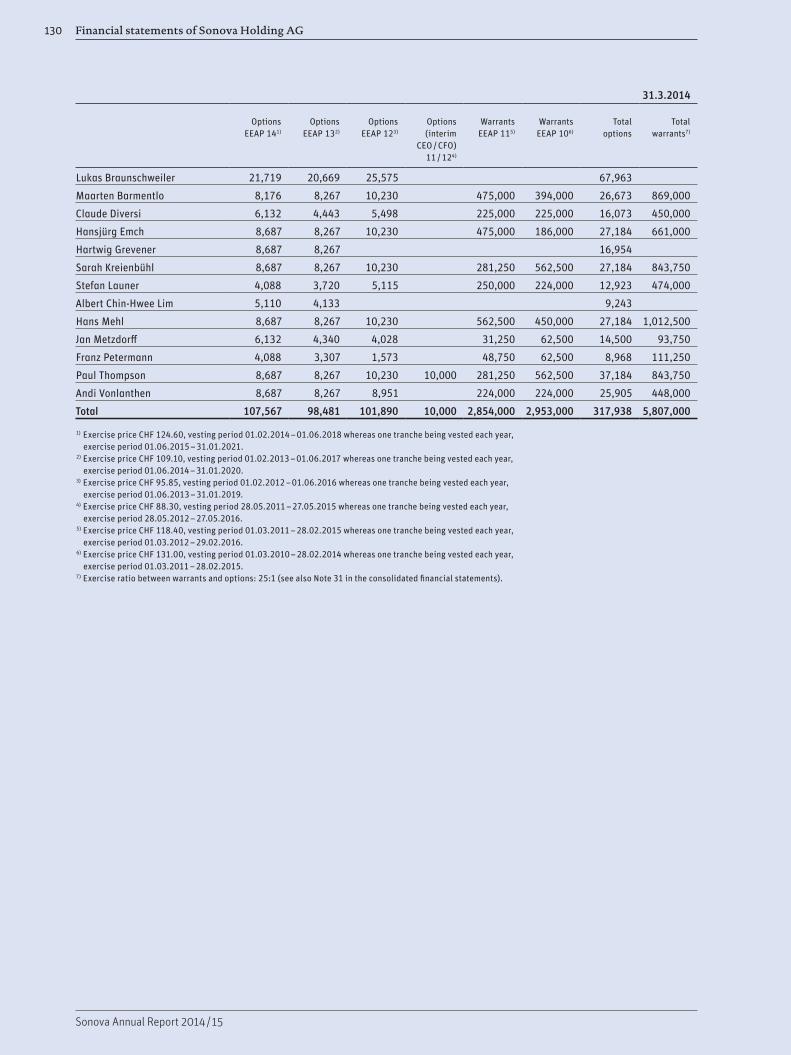
Financial statements of Sonova Holding AG130
Sonova Annual Report 2014 / 15
31.3.2014
Options EEAP 141)
Options EEAP 132)
Options EEAP 123)
Options (interim
CEO / CFO) 11 / 124)
Warrants EEAP 115)
Warrants EEAP 106)
Total options
Total warrants7)
Lukas Braunschweiler 21,719 20,669 25,575 67,963
Maarten Barmentlo 8,176 8,267 10,230 475,000 394,000 26,673 869,000
Claude Diversi 6,132 4,443 5,498 225,000 225,000 16,073 450,000
Hansjürg Emch 8,687 8,267 10,230 475,000 186,000 27,184 661,000
Hartwig Grevener 8,687 8,267 16,954
Sarah Kreienbühl 8,687 8,267 10,230 281,250 562,500 27,184 843,750
Stefan Launer 4,088 3,720 5,115 250,000 224,000 12,923 474,000
Albert Chin-Hwee Lim 5,110 4,133 9,243
Hans Mehl 8,687 8,267 10,230 562,500 450,000 27,184 1,012,500
Jan Metzdorff 6,132 4,340 4,028 31,250 62,500 14,500 93,750
Franz Petermann 4,088 3,307 1,573 48,750 62,500 8,968 111,250
Paul Thompson 8,687 8,267 10,230 10,000 281,250 562,500 37,184 843,750
Andi Vonlanthen 8,687 8,267 8,951 224,000 224,000 25,905 448,000
Total 107,567 98,481 101,890 10,000 2,854,000 2,953,000 317,938 5,807,000
1) Exercise price CHF 124.60, vesting period 01.02.2014 – 01.06.2018 whereas one tranche being vested each year, exercise period 01.06.2015 – 31.01.2021.
2) Exercise price CHF 109.10, vesting period 01.02.2013 – 01.06.2017 whereas one tranche being vested each year, exercise period 01.06.2014 – 31.01.2020.
3) Exercise price CHF 95.85, vesting period 01.02.2012 – 01.06.2016 whereas one tranche being vested each year, exercise period 01.06.2013 – 31.01.2019.
4) Exercise price CHF 88.30, vesting period 28.05.2011 – 27.05.2015 whereas one tranche being vested each year, exercise period 28.05.2012 – 27.05.2016.
5) Exercise price CHF 118.40, vesting period 01.03.2011 – 28.02.2015 whereas one tranche being vested each year, exercise period 01.03.2012 – 29.02.2016.
6) Exercise price CHF 131.00, vesting period 01.03.2010 – 28.02.2014 whereas one tranche being vested each year, exercise period 01.03.2011 – 28.02.2015.
7) Exercise ratio between warrants and options: 25:1 (see also Note 31 in the consolidated financial statements).

Financial statements of Sonova Holding AG 131
Sonova Annual Report 2014 / 15
Appropriation of available earnings
As proposed by the Board of Directors to the Annual General Shareholders’ Meeting of June 16, 2015:
1,000 CHF 31.3.2015 31.3.20141)
Carried forward from previous year 1,559,579 1,427,440
Allocation (to) / from reserve for treasury shares (72,362) 1,537
Net profit for the year 260,175 258,231
Available earnings 1,747,391 1,687,208
Dividend distribution2) (136,583) (127,629)
Balance to be carried forward 1,610,808 1,559,579
1) Approved by the Annual General Shareholders’ Meeting of June 17, 2014.2) If the Annual Shareholders’ Meeting approves the proposed appropriation of available earnings, a gross dividend of
CHF 2.05 per registered share of CHF 0.05 will be paid out (previous year distribution of CHF 1.90).
Reserve from capital contributions
1,000 CHF 31.3.2015 31.3.20141)
Carried forward from previous year 18,542 16,896
Capital increase from conditional capital 1,646
Reserve from capital contributions 18,542 18,542
1) Approved by the Annual General Shareholders’ Meeting of June 17, 2014.
Financial statements of Sonova Holding AG132
Sonova Annual Report 2014 / 15
Report of the statutory auditor on the financial statements
Report of the statutory auditor on the financial statements 2014 / 15 to the Annual General Shareholders’ Meeting of Sonova Holding AG Stäfa
Report of the statutory auditor on the financial statementsAs statutory auditor, we have audited the financial statements of Sonova Holding AG, which comprise the income statement, balance sheet and notes (pages 118 to 131) for the year ended March 31, 2015.
Board of directors’ responsibilityThe Board of Directors is responsible for the preparation of the financial statements in accordance with the requirements of Swiss law and the company’s articles of incorporation. This responsibility includes designing, implementing and maintaining an internal control system relevant to the preparation of financial statements that are free from material misstatement, whether due to fraud or error. The Board of Directors is further responsible for selecting and applying appropriate accounting policies and making accounting estimates that are reasonable in the circumstances.
Auditor’s responsibilityOur responsibility is to express an opinion on these financial statements based on our audit. We conducted our audit in accordance with Swiss law and Swiss Auditing Standards. Those standards require that we plan and perform the audit to obtain reasonable assurance whether the financial statements are free from material misstatement.
An audit involves performing procedures to obtain audit evidence about the amounts and disclosures in the financial statements. The procedures selected depend on the auditor’s judgment, including the assessment of the risks of material misstatement of the financial statements, whether due to fraud or error. In making those risk assessments, the auditor considers the internal control system relevant to the entity’s preparation of the financial statements in order to design audit procedures that are appropriate in the circumstances, but not for the purpose of expressing an opinion on the effectiveness of the entity’s internal control system. An audit also includes evaluating the appropriateness of the accounting policies used and the reasonableness of accounting estimates made, as well as evaluating the overall presentation of the financial statements. We believe that the audit evidence we have obtained is sufficient and appropriate to provide a basis for our audit opinion.
OpinionIn our opinion, the financial statements for the year ended March 31, 2015, comply with Swiss law and the company’s articles of incorporation.
Report on other legal requirementsWe confirm that we meet the legal requirements on licensing according to the Auditor Oversight Act (AOA) and independence (article 728 CO and article 11 AOA) and that there are no circumstances incompatible with our independence.
In accordance with article 728a paragraph 1 item 3 CO and Swiss Auditing Standard 890, we confirm that an internal control system exists which has been designed for the preparation of financial statements according to the instructions of the Board of Directors.
We further confirm that the proposed appropriation of available earnings complies with Swiss law and the company’s articles of incorporation. We recommend that the financial statements submitted to you be approved.
PricewaterhouseCoopers AG
Sandra Boehm Gian Franco BielerAudit expert Audit expertAuditor in charge
Zurich, May 12, 2015