financial results ongc, ovl & mrpl
TRANSCRIPT
Oil & Natural Gas Corporation Ltd.
Financial Results
ONGC, OVL & MRPL
for the quarter ended 31.03.2021
Presentation Overview
1 Performance – ONGC – Q4 FY’21
2
3 Performance – MRPL – Q4 FY’21
Performance – OVL – Q4 FY’21
2

Production Performance
3
Q4 Q3 Q4
FY’21 FY’21 FY’20
Crude oil - ONGC MMT 4.727 4.781 4.912 19.081 19.244
Crude oil-JVs* MMT 0.577 0.577 0.579 2.350 2.726
Condensate/NGL MMT 0.247 0.274 0.328 1.102 1.383
Total Crude oil MMT 5.551 5.632 5.819 22.533 23.353
Gas -ONGC BCM 5.328 5.565 5.828 21.872 23.746
Gas -JVs * BCM 0.256 0.244 0.211 0.944 1.150
Total Gas BCM 5.584 5.809 6.039 22.816 24.896
LPG (Hazira,Uran,
ANK) ’000 MT 231 231 255 937 985
LPG (Dahej) ’000 MT 9 18 6 77 28
Naphtha ’000 MT 233 232 268 941 1,115
Ethane-Propane ’000 MT 39 95 95 242 345
Ethane (Dahej) ’000 MT 135 124 132 483 536
Propane (Dahej &
Hazira) ’000 MT 50 44 52 187 224
Butane (Dahej) ’000 MT 28 25 27 98 125
SKO ’000 MT 5 6 7 33 50
Others ’000 MT 33 34 38 123 138
Total VAPs MMT 0.763 0.809 0.880 3.121 3.546
Total Production MMTOE 11.898 12.250 12.738 48.470 51.795
*Includes NELP Production
FY’20FY’21
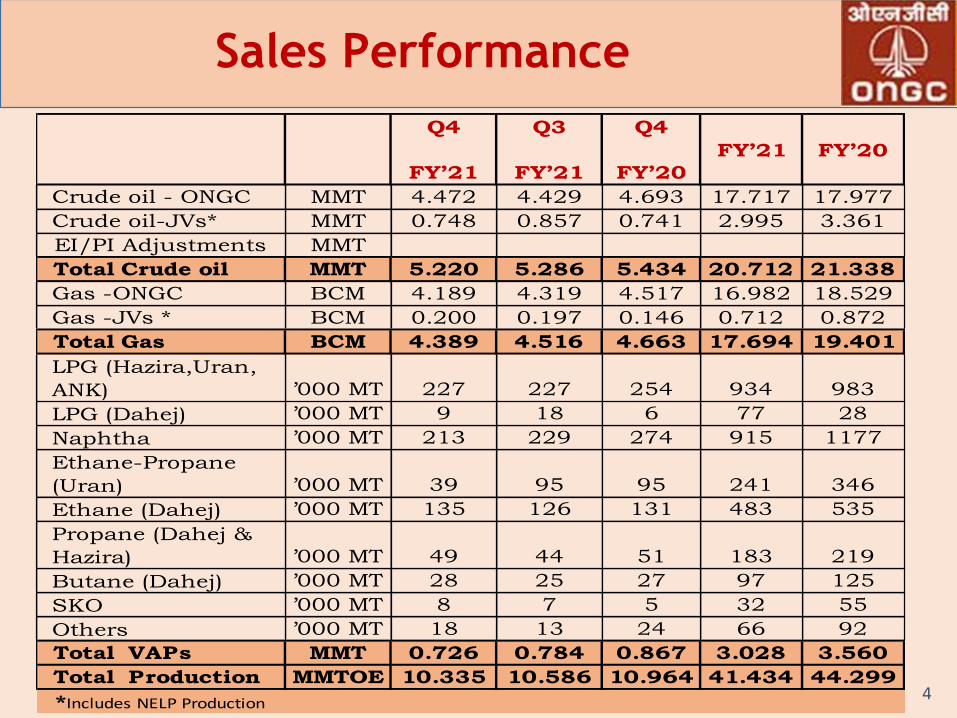
Sales Performance
4
Q4 Q3 Q4
FY’21 FY’21 FY’20
Crude oil - ONGC MMT 4.472 4.429 4.693 17.717 17.977
Crude oil-JVs* MMT 0.748 0.857 0.741 2.995 3.361
EI/PI Adjustments MMT
Total Crude oil MMT 5.220 5.286 5.434 20.712 21.338
Gas -ONGC BCM 4.189 4.319 4.517 16.982 18.529
Gas -JVs * BCM 0.200 0.197 0.146 0.712 0.872
Total Gas BCM 4.389 4.516 4.663 17.694 19.401
LPG (Hazira,Uran,
ANK) ’000 MT 227 227 254 934 983
LPG (Dahej) ’000 MT 9 18 6 77 28
Naphtha ’000 MT 213 229 274 915 1177
Ethane-Propane
(Uran) ’000 MT 39 95 95 241 346
Ethane (Dahej) ’000 MT 135 126 131 483 535
Propane (Dahej &
Hazira) ’000 MT 49 44 51 183 219
Butane (Dahej) ’000 MT 28 25 27 97 125
SKO ’000 MT 8 7 5 32 55
Others ’000 MT 18 13 24 66 92
Total VAPs MMT 0.726 0.784 0.867 3.028 3.560
Total Production MMTOE 10.335 10.586 10.964 41.434 44.299
*Includes NELP Production
FY’20FY’21
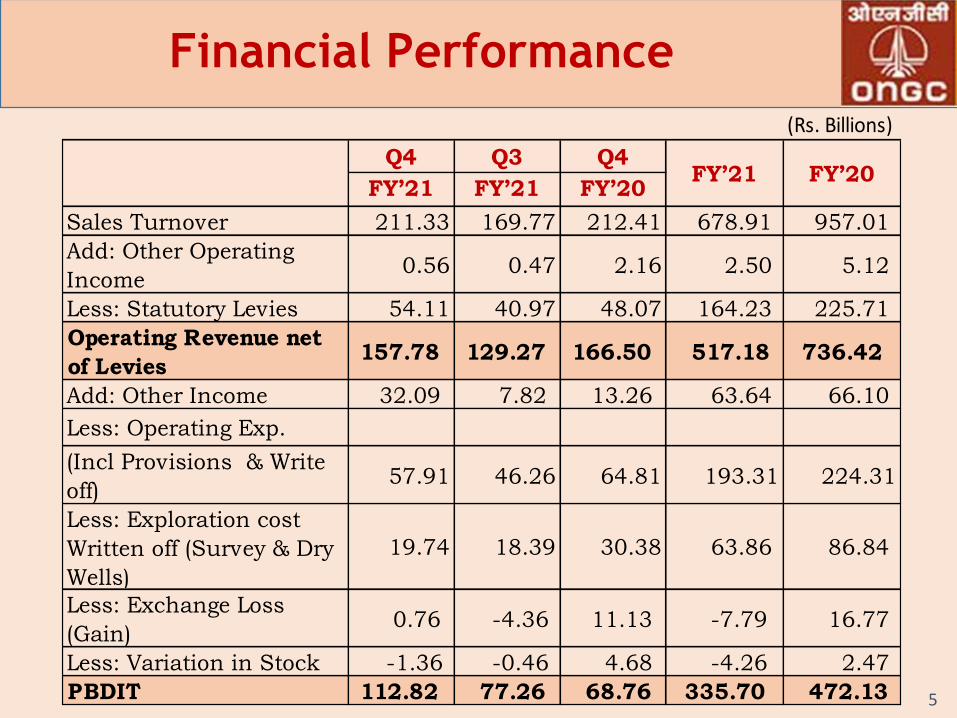
Financial Performance
5
(Rs. Billions)
Q4 Q3 Q4
FY’21 FY’21 FY’20
Sales Turnover 211.33 169.77 212.41 678.91 957.01
Add: Other Operating
Income0.56 0.47 2.16 2.50 5.12
Less: Statutory Levies 54.11 40.97 48.07 164.23 225.71
Operating Revenue net
of Levies 157.78 129.27 166.50 517.18 736.42
Add: Other Income 32.09 7.82 13.26 63.64 66.10
Less: Operating Exp.
(Incl Provisions & Write
off)57.91 46.26 64.81 193.31 224.31
Less: Exploration cost
Written off (Survey & Dry
Wells)
19.74 18.39 30.38 63.86 86.84
Less: Exchange Loss
(Gain) 0.76 -4.36 11.13 -7.79 16.77
Less: Variation in Stock -1.36 -0.46 4.68 -4.26 2.47
PBDIT 112.82 77.26 68.76 335.70 472.13
FY’20FY’21
Financial Performance ...Cont.
6
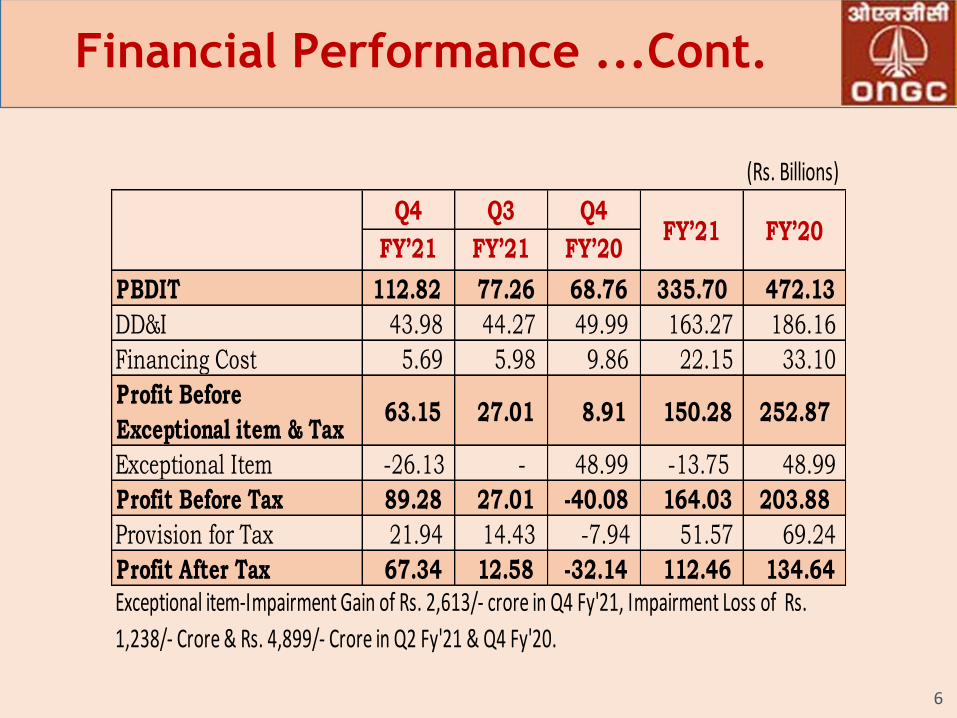
(Rs. Billions)
Q4 Q3 Q4
FY’21 FY’21 FY’20
PBDIT 112.82 77.26 68.76 335.70 472.13
DD&I 43.98 44.27 49.99 163.27 186.16
Financing Cost 5.69 5.98 9.86 22.15 33.10
Profit Before
Exceptional item & Tax 63.15 27.01 8.91 150.28 252.87
Exceptional Item -26.13 - 48.99 -13.75 48.99
Profit Before Tax 89.28 27.01 -40.08 164.03 203.88
Provision for Tax 21.94 14.43 -7.94 51.57 69.24
Profit After Tax 67.34 12.58 -32.14 112.46 134.64
FY’20FY’21
Exceptional item-Impairment Gain of Rs. 2,613/- crore in Q4 Fy'21, Impairment Loss of Rs.
1,238/- Crore & Rs. 4,899/- Crore in Q2 Fy'21 & Q4 Fy'20.
Crude Oil Prices (net of VAT/CST)
7
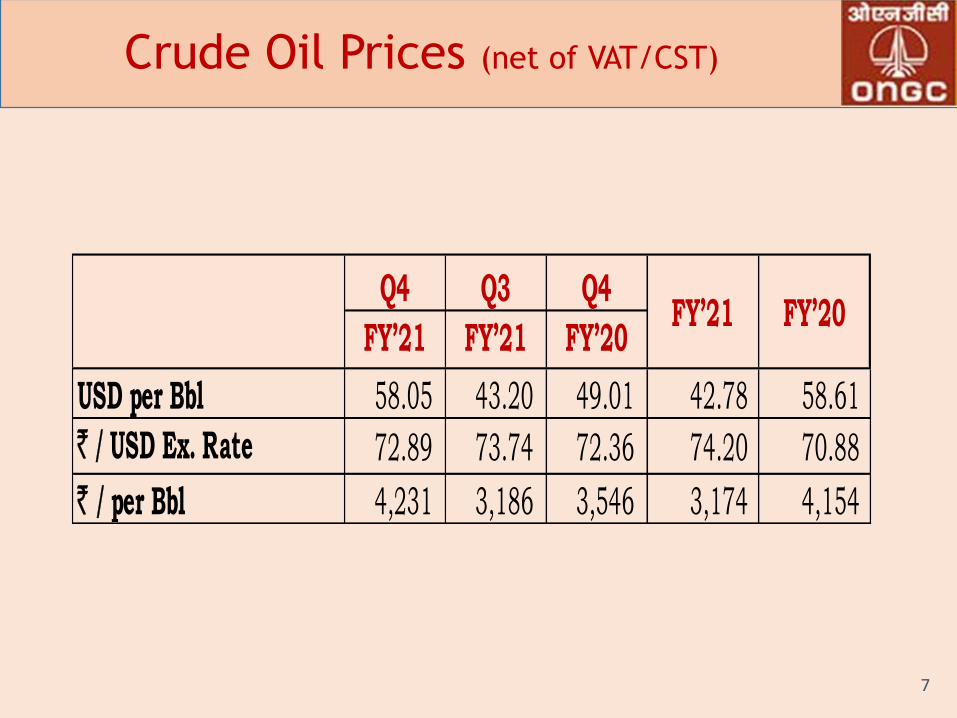
Q4 Q3 Q4
FY’21 FY’21 FY’20
USD per Bbl 58.05 43.20 49.01 42.78 58.61
` / USD Ex. Rate 72.89 73.74 72.36 74.20 70.88
` / per Bbl 4,231 3,186 3,546 3,174 4,154
FY’21 FY’20
Sales Revenue
8
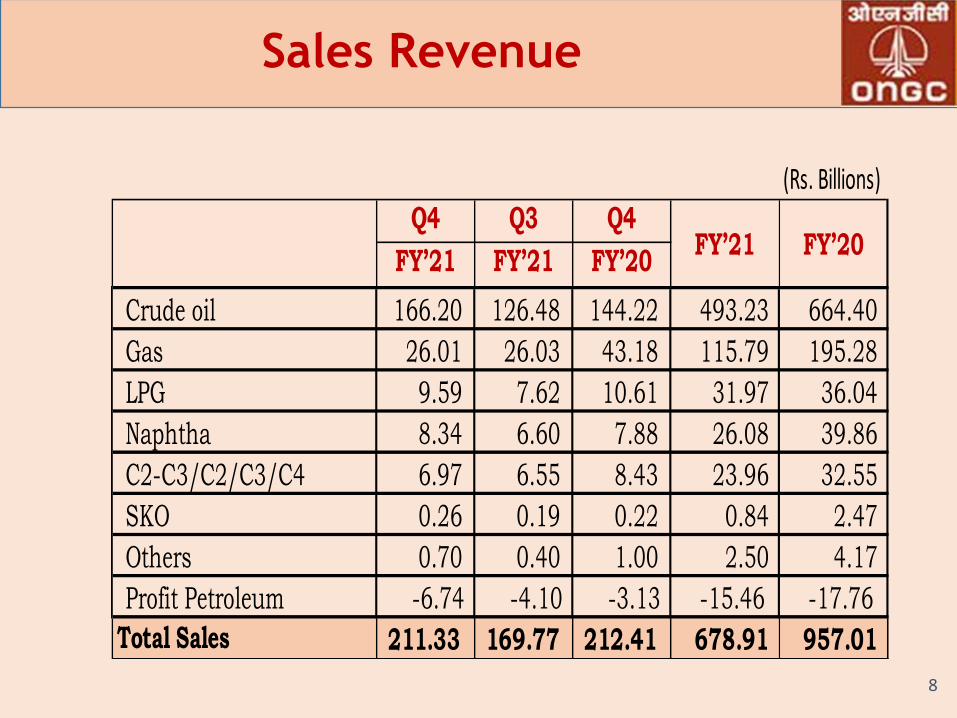
(Rs. Billions)
Q4 Q3 Q4
FY’21 FY’21 FY’20
Crude oil 166.20 126.48 144.22 493.23 664.40
Gas 26.01 26.03 43.18 115.79 195.28
LPG 9.59 7.62 10.61 31.97 36.04
Naphtha 8.34 6.60 7.88 26.08 39.86
C2-C3/C2/C3/C4 6.97 6.55 8.43 23.96 32.55
SKO 0.26 0.19 0.22 0.84 2.47
Others 0.70 0.40 1.00 2.50 4.17
Profit Petroleum -6.74 -4.10 -3.13 -15.46 -17.76
Total Sales 211.33 169.77 212.41 678.91 957.01
FY’20FY’21
Sales Revenue …..Contd.
9
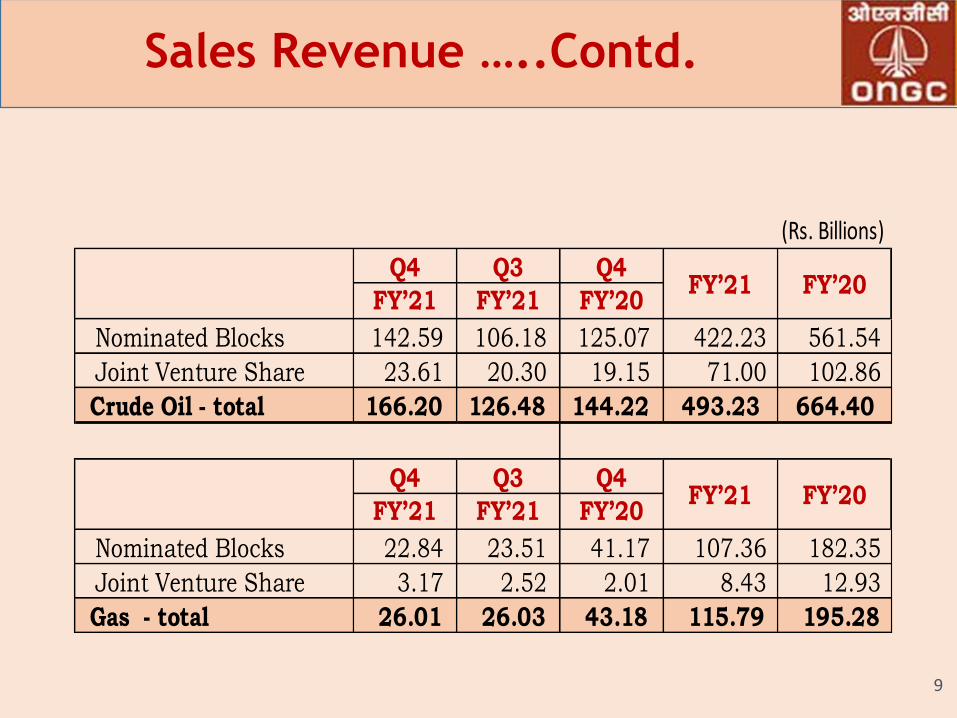
(Rs. Billions)
Q4 Q3 Q4
FY’21 FY’21 FY’20
Nominated Blocks 142.59 106.18 125.07 422.23 561.54
Joint Venture Share 23.61 20.30 19.15 71.00 102.86
Crude Oil - total 166.20 126.48 144.22 493.23 664.40
Q4 Q3 Q4
FY’21 FY’21 FY’20
Nominated Blocks 22.84 23.51 41.17 107.36 182.35
Joint Venture Share 3.17 2.52 2.01 8.43 12.93
Gas - total 26.01 26.03 43.18 115.79 195.28
FY’20
FY’20
FY’21
FY’21
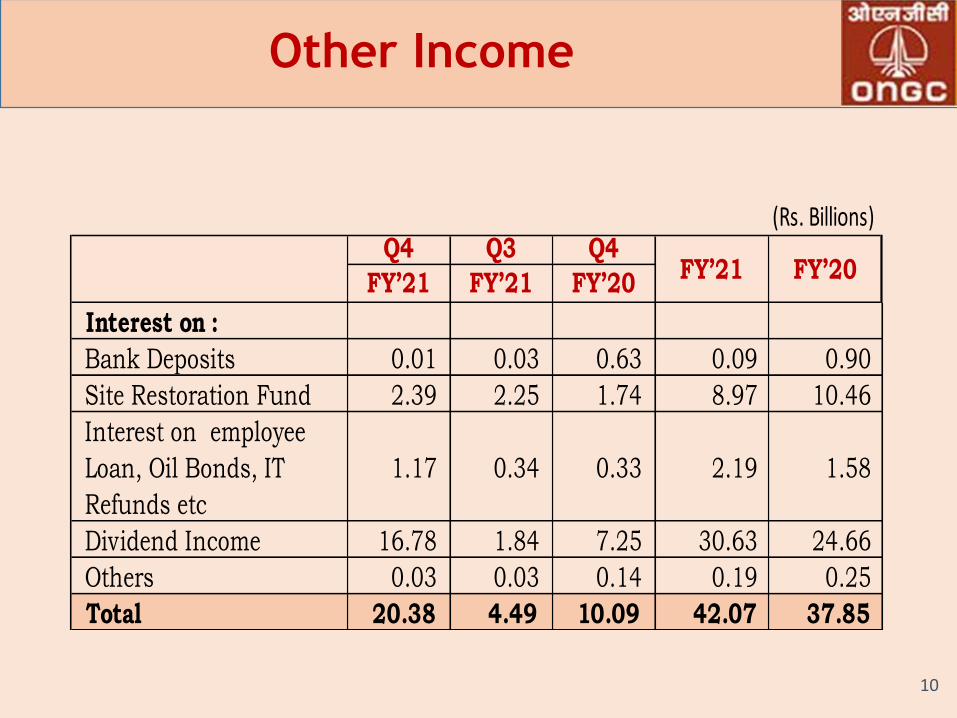
Other Income
10
(Rs. Billions)Q4 Q3 Q4
FY’21 FY’21 FY’20
Interest on :
Bank Deposits 0.01 0.03 0.63 0.09 0.90
Site Restoration Fund 2.39 2.25 1.74 8.97 10.46
Interest on employee
Loan, Oil Bonds, IT
Refunds etc
1.17 0.34 0.33 2.19 1.58
Dividend Income 16.78 1.84 7.25 30.63 24.66
Others 0.03 0.03 0.14 0.19 0.25
Total 20.38 4.49 10.09 42.07 37.85
FY’20FY’21
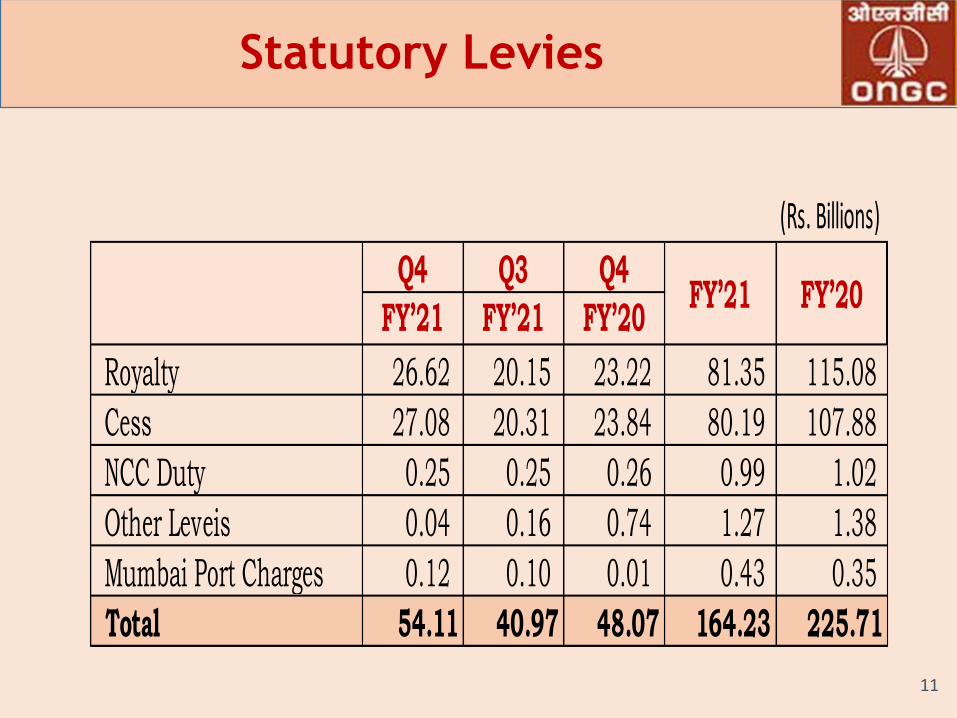
Statutory Levies
11
(Rs. Billions)
Q4 Q3 Q4
FY’21 FY’21 FY’20
Royalty 26.62 20.15 23.22 81.35 115.08
Cess 27.08 20.31 23.84 80.19 107.88
NCC Duty 0.25 0.25 0.26 0.99 1.02
Other Leveis 0.04 0.16 0.74 1.27 1.38
Mumbai Port Charges 0.12 0.10 0.01 0.43 0.35
Total 54.11 40.97 48.07 164.23 225.71
FY’20FY’21
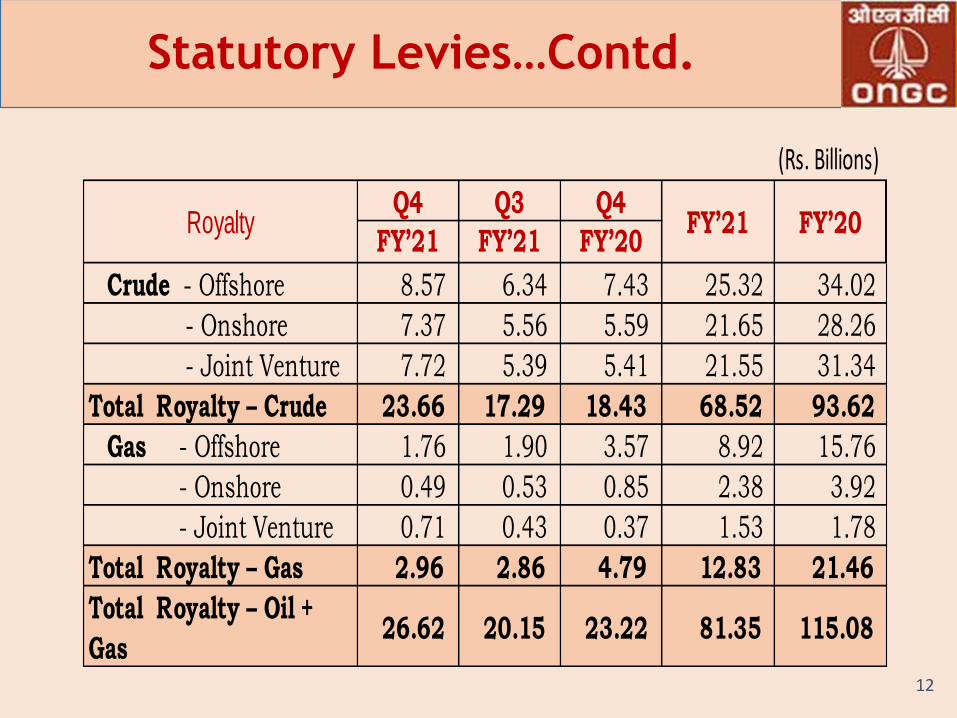
Statutory Levies…Contd.
12
(Rs. Billions)
Q4 Q3 Q4
FY’21 FY’21 FY’20
Crude - Offshore 8.57 6.34 7.43 25.32 34.02
- Onshore 7.37 5.56 5.59 21.65 28.26
- Joint Venture 7.72 5.39 5.41 21.55 31.34
Total Royalty – Crude 23.66 17.29 18.43 68.52 93.62
Gas - Offshore 1.76 1.90 3.57 8.92 15.76
- Onshore 0.49 0.53 0.85 2.38 3.92
- Joint Venture 0.71 0.43 0.37 1.53 1.78
Total Royalty – Gas 2.96 2.86 4.79 12.83 21.46
Total Royalty – Oil +
Gas 26.62 20.15 23.22 81.35 115.08
Royalty FY’20FY’21
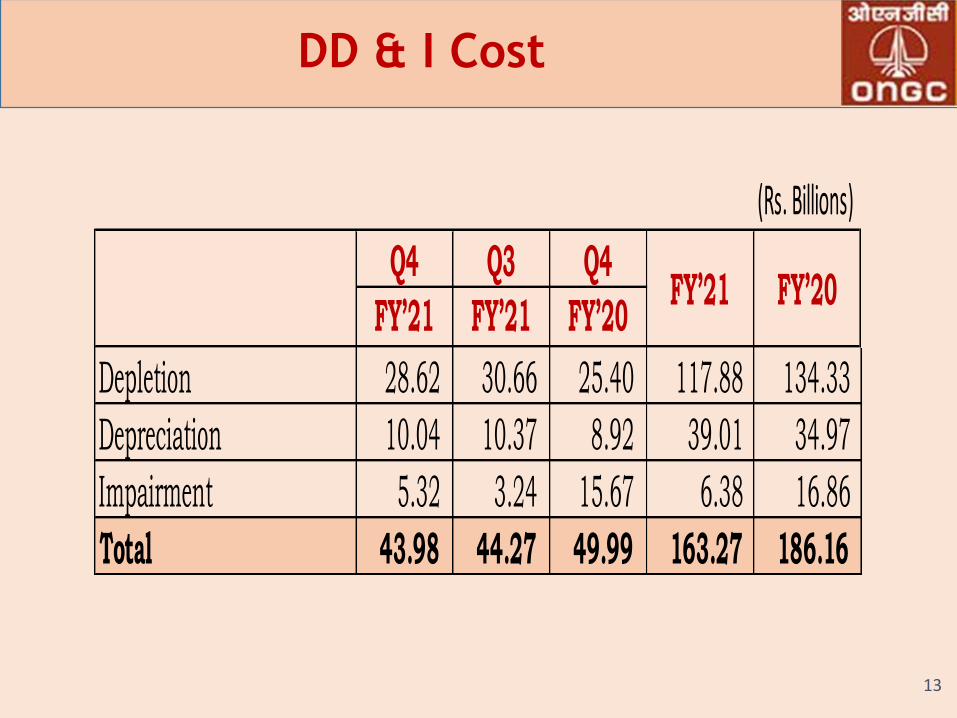
DD & I Cost
13
(Rs. Billions)
Q4 Q3 Q4
FY’21 FY’21 FY’20
Depletion 28.62 30.66 25.40 117.88 134.33
Depreciation 10.04 10.37 8.92 39.01 34.97
Impairment 5.32 3.24 15.67 6.38 16.86
Total 43.98 44.27 49.99 163.27 186.16
FY’20FY’21
ONGC VIDESH Ltd.
14
OVL
Q4 FY’21
Physical & Financial Performance
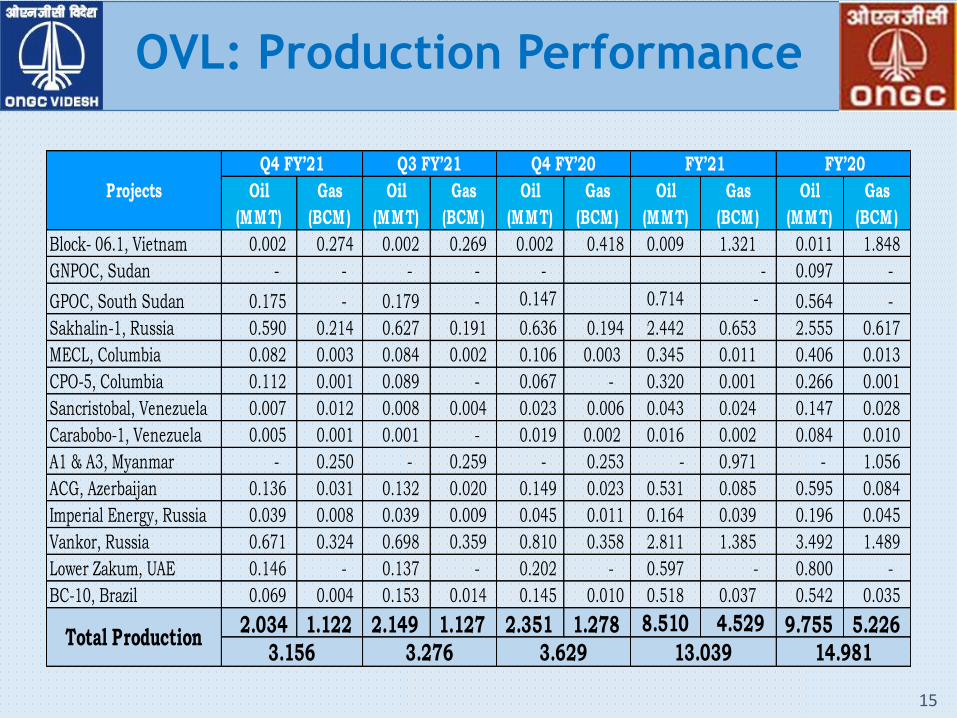
OVL: Production Performance
15
Oil
(MMT)
Gas
(BCM)
Oil
(MMT)
Gas
(BCM)
Oil
(MMT)
Gas
(BCM)
Oil
(MMT)
Gas
(BCM)
Oil
(MMT)
Gas
(BCM)
Block- 06.1, Vietnam 0.002 0.274 0.002 0.269 0.002 0.418 0.009 1.321 0.011 1.848
GNPOC, Sudan - - - - - - 0.097 -
GPOC, South Sudan 0.175 - 0.179 - 0.147 0.714 - 0.564 -
Sakhalin-1, Russia 0.590 0.214 0.627 0.191 0.636 0.194 2.442 0.653 2.555 0.617
MECL, Columbia 0.082 0.003 0.084 0.002 0.106 0.003 0.345 0.011 0.406 0.013
CPO-5, Columbia 0.112 0.001 0.089 - 0.067 - 0.320 0.001 0.266 0.001
Sancristobal, Venezuela 0.007 0.012 0.008 0.004 0.023 0.006 0.043 0.024 0.147 0.028
Carabobo-1, Venezuela 0.005 0.001 0.001 - 0.019 0.002 0.016 0.002 0.084 0.010
A1 & A3, Myanmar - 0.250 - 0.259 - 0.253 - 0.971 - 1.056
ACG, Azerbaijan 0.136 0.031 0.132 0.020 0.149 0.023 0.531 0.085 0.595 0.084
Imperial Energy, Russia 0.039 0.008 0.039 0.009 0.045 0.011 0.164 0.039 0.196 0.045
Vankor, Russia 0.671 0.324 0.698 0.359 0.810 0.358 2.811 1.385 3.492 1.489
Lower Zakum, UAE 0.146 - 0.137 - 0.202 - 0.597 - 0.800 -
BC-10, Brazil 0.069 0.004 0.153 0.014 0.145 0.010 0.518 0.037 0.542 0.035
2.034 1.122 2.149 1.127 2.351 1.278 8.510 4.529 9.755 5.226
Projects
Q3 FY’21 Q4 FY’20 FY’20 FY’21Q4 FY’21
Total Production3.276 3.629 14.98113.039 3.156
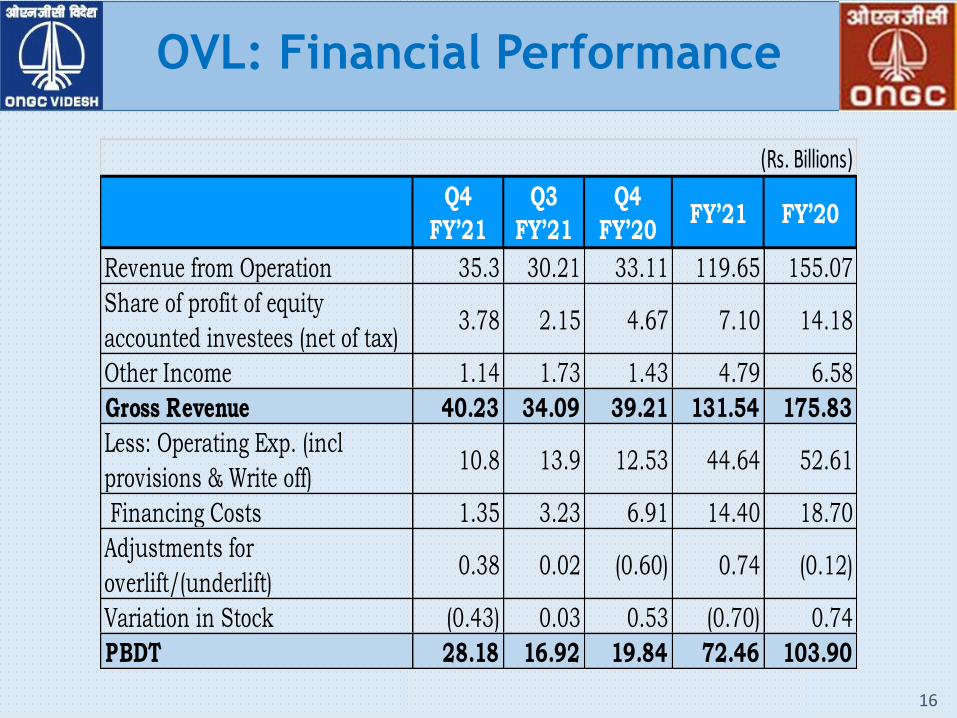
OVL: Financial Performance
16
Q4 Q3 Q4
FY’21 FY’21 FY’20
Revenue from Operation 35.3 30.21 33.11 119.65 155.07
Share of profit of equity
accounted investees (net of tax) 3.78 2.15 4.67 7.10 14.18
Other Income 1.14 1.73 1.43 4.79 6.58
Gross Revenue 40.23 34.09 39.21 131.54 175.83
Less: Operating Exp. (incl
provisions & Write off)10.8 13.9 12.53 44.64 52.61
Financing Costs 1.35 3.23 6.91 14.40 18.70
Adjustments for
overlift/(underlift) 0.38 0.02 (0.60) 0.74 (0.12)
Variation in Stock (0.43) 0.03 0.53 (0.70) 0.74
PBDT 28.18 16.92 19.84 72.46 103.90
(Rs. Billions)
FY’20FY’21
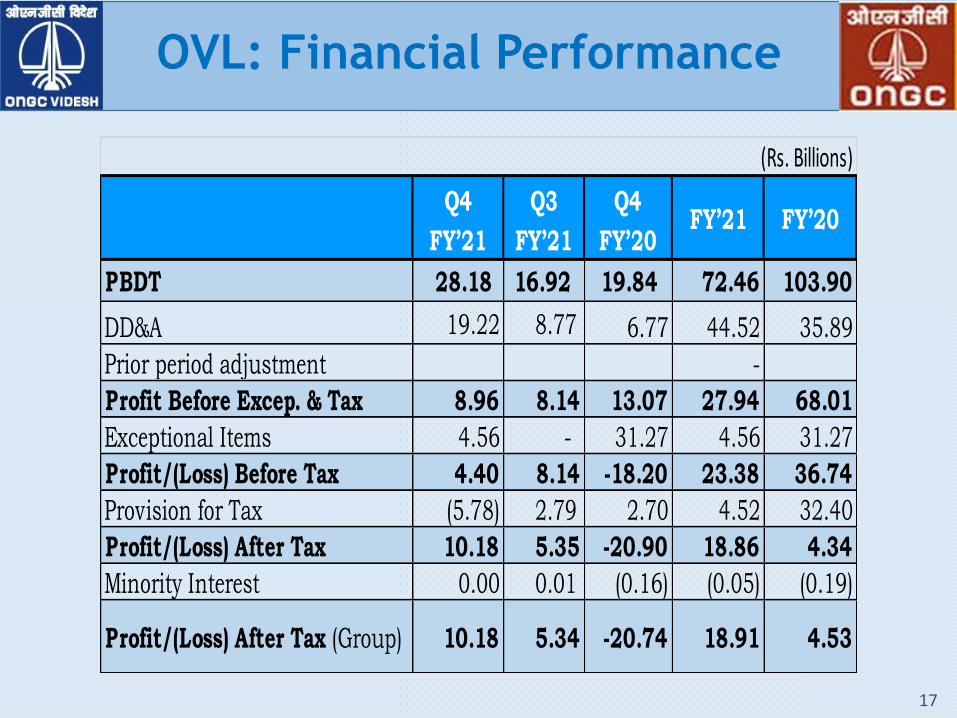
OVL: Financial Performance
17
Q4 Q3 Q4
FY’21 FY’21 FY’20
PBDT 28.18 16.92 19.84 72.46 103.90
DD&A 19.22 8.77 6.77 44.52 35.89
Prior period adjustment -
Profit Before Excep. & Tax 8.96 8.14 13.07 27.94 68.01
Exceptional Items 4.56 - 31.27 4.56 31.27
Profit/(Loss) Before Tax 4.40 8.14 -18.20 23.38 36.74
Provision for Tax (5.78) 2.79 2.70 4.52 32.40
Profit/(Loss) After Tax 10.18 5.35 -20.90 18.86 4.34
Minority Interest 0.00 0.01 (0.16) (0.05) (0.19)
Profit/(Loss) After Tax (Group) 10.18 5.34 -20.74 18.91 4.53
(Rs. Billions)
FY’20FY’21
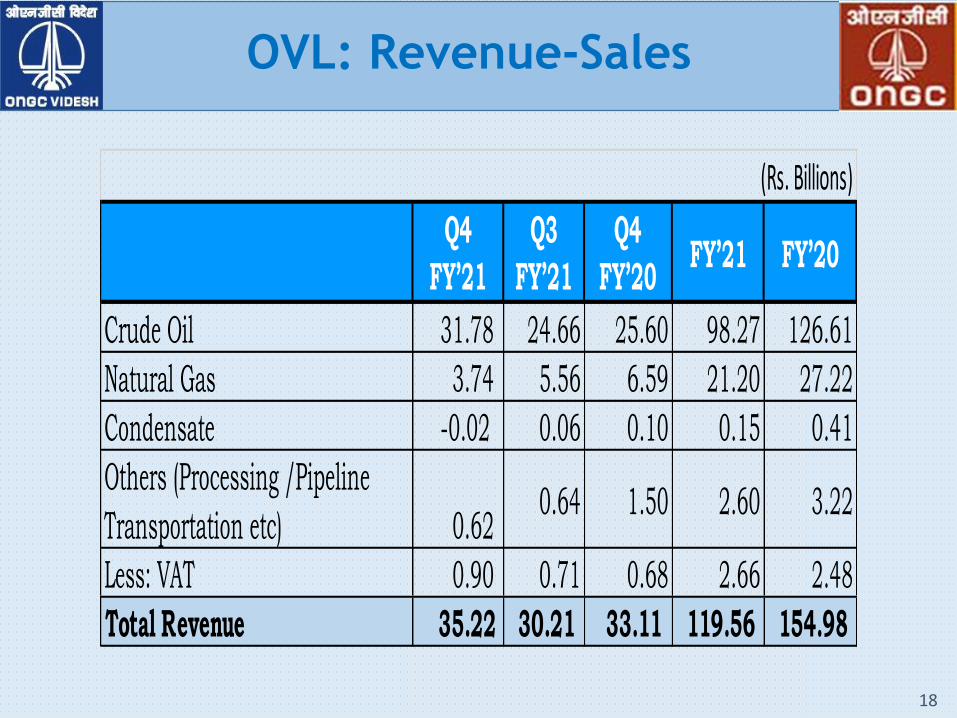
OVL: Revenue-Sales
18
Q4 Q3 Q4
FY’21 FY’21 FY’20
Crude Oil 31.78 24.66 25.60 98.27 126.61
Natural Gas 3.74 5.56 6.59 21.20 27.22
Condensate -0.02 0.06 0.10 0.15 0.41
Others (Processing /Pipeline
Transportation etc) 0.62 0.64 1.50 2.60 3.22
Less: VAT 0.90 0.71 0.68 2.66 2.48
Total Revenue 35.22 30.21 33.11 119.56 154.98
(Rs. Billions)
FY’20FY’21
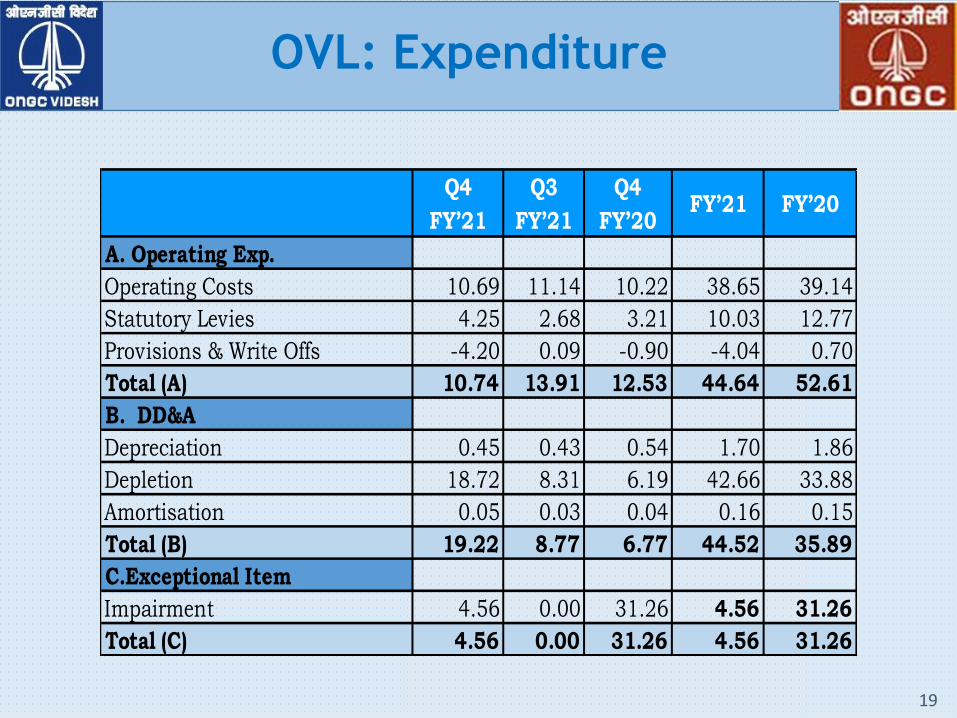
OVL: Expenditure
19
Q4 Q3 Q4
FY’21 FY’21 FY’20
A. Operating Exp.
Operating Costs 10.69 11.14 10.22 38.65 39.14
Statutory Levies 4.25 2.68 3.21 10.03 12.77
Provisions & Write Offs -4.20 0.09 -0.90 -4.04 0.70
Total (A) 10.74 13.91 12.53 44.64 52.61
B. DD&A
Depreciation 0.45 0.43 0.54 1.70 1.86
Depletion 18.72 8.31 6.19 42.66 33.88
Amortisation 0.05 0.03 0.04 0.16 0.15
Total (B) 19.22 8.77 6.77 44.52 35.89
C.Exceptional Item
Impairment 4.56 0.00 31.26 4.56 31.26
Total (C) 4.56 0.00 31.26 4.56 31.26
FY’21 FY’20
Mangalore Refinery and
Petrochemicals Ltd.
20
MRPL
Q4 FY’21
Physical & Financial Performance
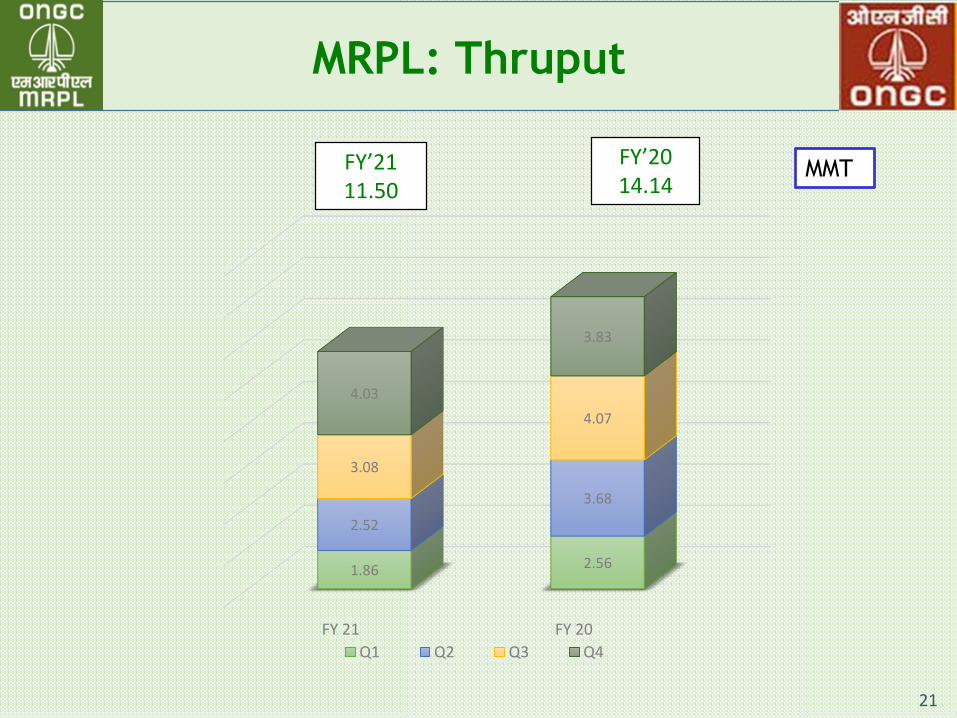
MRPL: Thruput
21
FY 21 FY 20
1.86 2.56
2.52
3.68
3.08
4.07
4.03
3.83
Q1 Q2 Q3 Q4
MMTFY’21 11.50
FY’20 14.14
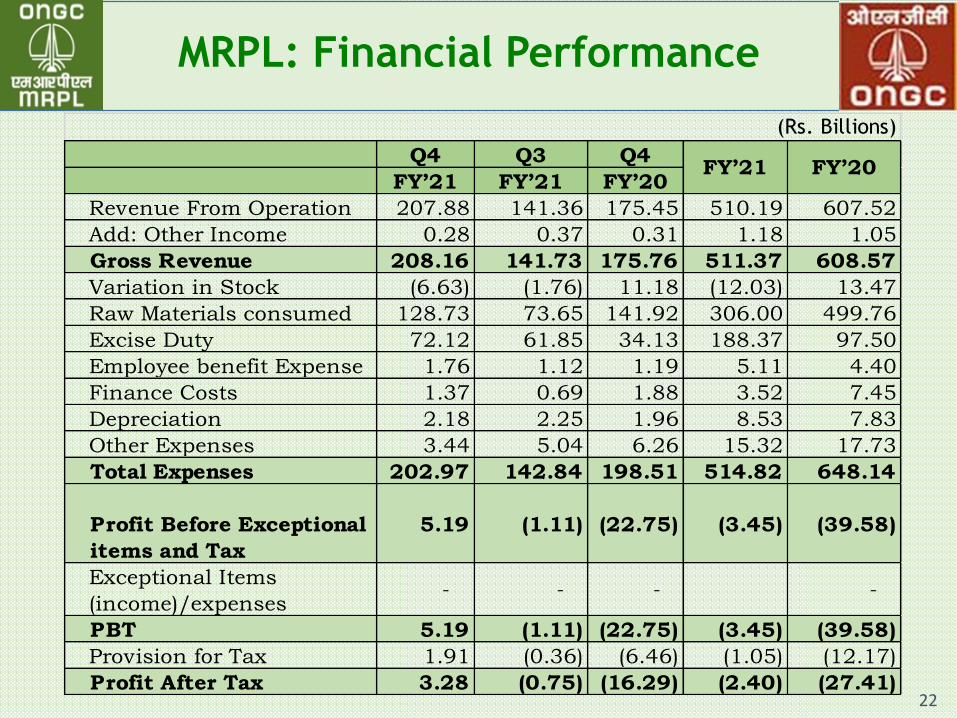
MRPL: Financial Performance
22
Q4 Q3 Q4
FY’21 FY’21 FY’20
Revenue From Operation 207.88 141.36 175.45 510.19 607.52
Add: Other Income 0.28 0.37 0.31 1.18 1.05
Gross Revenue 208.16 141.73 175.76 511.37 608.57
Variation in Stock (6.63) (1.76) 11.18 (12.03) 13.47
Raw Materials consumed 128.73 73.65 141.92 306.00 499.76
Excise Duty 72.12 61.85 34.13 188.37 97.50
Employee benefit Expense 1.76 1.12 1.19 5.11 4.40
Finance Costs 1.37 0.69 1.88 3.52 7.45
Depreciation 2.18 2.25 1.96 8.53 7.83
Other Expenses 3.44 5.04 6.26 15.32 17.73
Total Expenses 202.97 142.84 198.51 514.82 648.14
Profit Before Exceptional
items and Tax
5.19 (1.11) (22.75) (3.45) (39.58)
Exceptional Items
(income)/expenses - - - -
PBT 5.19 (1.11) (22.75) (3.45) (39.58)
Provision for Tax 1.91 (0.36) (6.46) (1.05) (12.17)
Profit After Tax 3.28 (0.75) (16.29) (2.40) (27.41)
(Rs. Billions)
FY’20FY’21

MRPL: Financial Performance.
23
Q4 Q3 Q4
FY’21 FY’21 FY’20
Sales Turnover 207.56 141.32 175.40 509.74 607.29
Less: Excise Duty 72.12 61.85 34.13 188.37 97.50
Net Turnover 135.44 79.47 141.27 321.37 509.79
(Rs. Billions)
FY’20FY’21
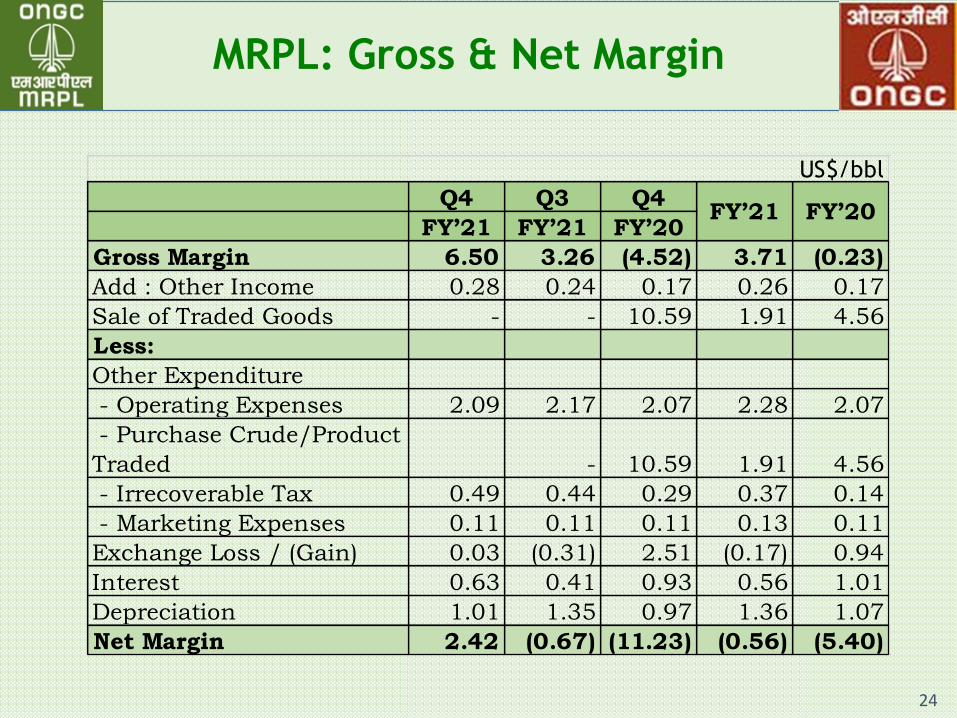
MRPL: Gross & Net Margin
24
Q4 Q3 Q4
FY’21 FY’21 FY’20
Gross Margin 6.50 3.26 (4.52) 3.71 (0.23)
Add : Other Income 0.28 0.24 0.17 0.26 0.17
Sale of Traded Goods - - 10.59 1.91 4.56
Less:
Other Expenditure
- Operating Expenses 2.09 2.17 2.07 2.28 2.07
- Purchase Crude/Product
Traded - 10.59 1.91 4.56
- Irrecoverable Tax 0.49 0.44 0.29 0.37 0.14
- Marketing Expenses 0.11 0.11 0.11 0.13 0.11
Exchange Loss / (Gain) 0.03 (0.31) 2.51 (0.17) 0.94
Interest 0.63 0.41 0.93 0.56 1.01
Depreciation 1.01 1.35 0.97 1.36 1.07
Net Margin 2.42 (0.67) (11.23) (0.56) (5.40)
US$/bbl
FY’20FY’21