financial results of fy2016 third quarter financial results of fy2016 third quarter 2 4 10 11...
TRANSCRIPT

Sumitomo Chemical Co., Ltd.
January 30, 2017
Financial Results
of
FY2016 Third Quarter

Sumitomo Chemical Co., Ltd.
(Cautionary Statement) Statements made in this material with respect to Sumitomo Chemical’s current plans, estimates, strategies and
beliefs that are not historical facts are forward-looking statements about the future performance of Sumitomo
Chemical. These statements are based on management’s assumptions and beliefs in light of the information
currently available to it, and involve risks and uncertainties. The important factors that could cause actual
results to differ materially from those discussed in the forward-looking statements include, but are not limited to,
general economic conditions in Sumitomo Chemical’s markets; demand for, and competitive pricing pressure on,
Sumitomo Chemical’s products in the marketplace; Sumitomo Chemical’s ability to continue to win acceptance
for its products in these highly competitive markets; and movements of currency exchange rates.
Sumitomo Chemical Co., Ltd.

Sumitomo Chemical Co., Ltd.
Financial Summary・・・・・・・・・・・・・・・・・・・・ ・・
Net Sales by Business Segments・・・・・・・・・
Operating Income by Business Segments・
Consolidated Balance Sheets・・・・・・・・・・・・
Consolidated Statements of Cash Flows・
Major Subsidiaries・・・・・・・・・・・・・・・・・・・・・・・・
(Reference: Segment Information)
Net Sales by Business Segments
(Quarterly)・・・・・・・・・・・・・・・・・・・・・・・・・・・・・・
Operating Income by Business Segments
(Quarterly)・・・・・・・・・・・・・・・・・・・・・・・・・・・・・・
Consolidated Financial Results of FY2016 Third Quarter
1
2
4
6
7
8
10
11
Contents
Sumitomo Chemical Co., Ltd.

Sumitomo Chemical Co., Ltd.
Financial Summary
1
Unit; billions of yen
FY2015
3rd Quarter
(year to date)
FY2016
3rd Quarter
(year to date)
Difference Ratio
Net Sales 1,577.8 1,389.8 -188.0 -11.9%
Operating Income 119.5 86.3 -33.3 -27.8%
(Equity in earnings of affiliates,
included in ordinary income)(29.5) (25.8) (-3.7) -
(Net gain / loss on foreign currency transactions,
included in ordinary income)(-1.1) (6.5) (7.6) -
Ordinary Income 143.7 115.0 -28.7 -20.0%
(Extraordinary Gain / Loss) (3.8) (-8.0) (-11.9) -
(Income taxes) (-36.6) (-24.8) (11.8) -
Net income 110.9 82.1 -28.8 -
(Net income attributable to non-controlling interests) (-26.3) (-26.8) (-0.5) -
Net income attributable to owners of the parent 84.6 55.3 -29.3 -34.6%
ROE 10.4% 7.1%
Exchange Rate (yen/USD) 121.74 106.60
Naphtha Price (yen/KL) 45,600 32,300

Sumitomo Chemical Co., Ltd.
Net Sales by Business Segments Ⅰ
2
Unit; billions of yen
FY2015
3rd Quarter
(year to date)
FY2016
3rd Quarter
(year to date)
Difference RatioSales Price
Variance
Shipping
Volume
Variance
Foreign
Currency
Conversion
Variance
Petrochemicals 518.4 414.0 -104.4 -20.1% -54.0 -19.1 -31.3
Energy & Functional Materials 157.1 146.0 -11.1 -7.1% -13.5 5.8 -3.4
IT-related Chemicals 304.7 269.8 -34.9 -11.5% -26.5 32.1 -40.5
Health & Crop Sciences 228.4 191.9 -36.4 -16.0% -20.0 2.4 -18.9
Pharmaceuticals 328.5 329.7 1.2 0.4% -6.0 30.3 -23.1
Others & Adjustments 40.7 38.3 -2.4 -5.8% 0.0 -2.3 -0.0
Total 1,577.8 1,389.8 -188.0 -11.9% -120.0 49.1 -117.1
Overseas Operations 977.6 839.6 -138.1 -14.1%
Overseas Ratio 62.0% 60.4%
*With the changes in reported segments classification methods as of April 1,2016,the amount of the previous period has been modified for purposes of comparison.
(All the segment information are modified in the same manner.)
*With the changes in reported segments classification methods as of April 1,2011,the amount of the previous period has been modified for the purpose of reader’s

Sumitomo Chemical Co., Ltd.
Net Sales by Business Segments Ⅱ
3
Unit; billions of yen
FY2015
3rd Quarter
(year to date)
FY2016
3rd Quarter
(year to date)
Difference Main Factors
Petrochemicals 518.4 414.0 -104.4
・Decline in market prices for petrochemical products and synthetic resins
due to lower feedstock prices
・Decrease in shipments of petrochemical products
・Negative effect of the stronger yen
Energy & Functional
Materials157.1 146.0 -11.1
・Decline in selling prices of aluminum
・Increase in shipments of resorcinol and engineering plastics
IT-related Chemicals 304.7 269.8 -34.9・Increase in shipments of touchscreen panels
・Decline in selling prices of polarizing film and touchscreen panels
・Negative effect of the stronger yen
Health & Crop
Sciences228.4 191.9 -36.4
・Lower market price for feed additive methionine
・Decrease in shipments of crop protection chemicals in overseas market
・Negative effect of the stronger yen
Pharmaceuticals 328.5 329.7 1.2・Sales expansion of Latuda® in North America
・NHI price revision in Japan
・Negative effect of the stronger yen
Others & Adjustments 40.7 38.3 -2.4
Total 1,577.8 1,389.8 -188.0
Sumitomo Chemical Co., Ltd.
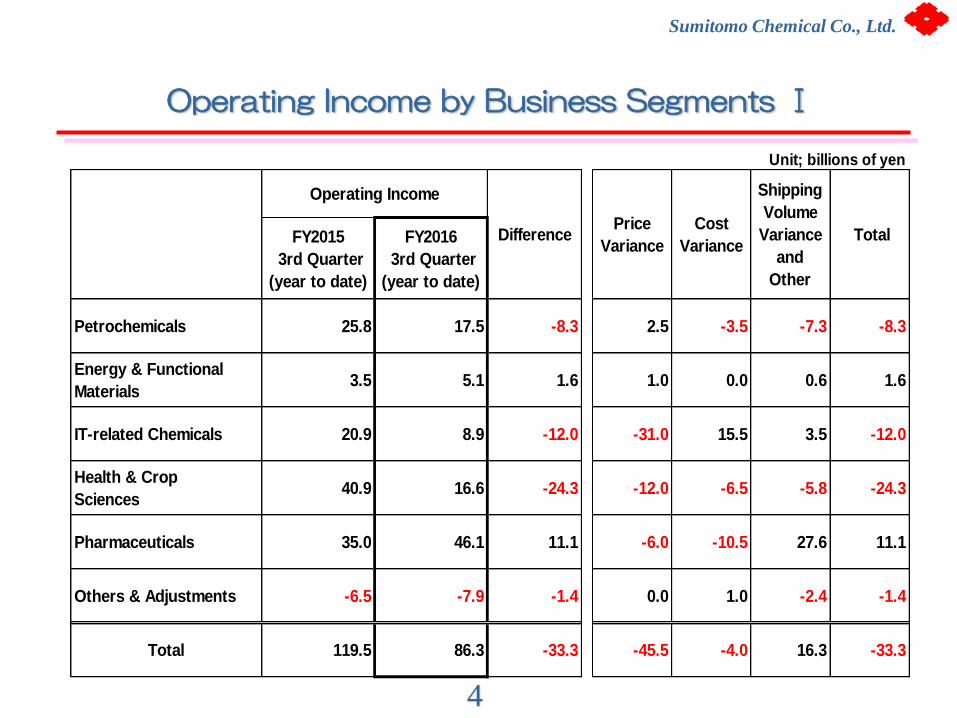
Operating Income by Business Segments Ⅰ
4
Unit; billions of yen
FY2015
3rd Quarter
(year to date)
FY2016
3rd Quarter
(year to date)
Petrochemicals 25.8 17.5 -8.3 2.5 -3.5 -7.3 -8.3
Energy & Functional
Materials3.5 5.1 1.6 1.0 0.0 0.6 1.6
IT-related Chemicals 20.9 8.9 -12.0 -31.0 15.5 3.5 -12.0
Health & Crop
Sciences40.9 16.6 -24.3 -12.0 -6.5 -5.8 -24.3
Pharmaceuticals 35.0 46.1 11.1 -6.0 -10.5 27.6 11.1
Others & Adjustments -6.5 -7.9 -1.4 0.0 1.0 -2.4 -1.4
Total 119.5 86.3 -33.3 -45.5 -4.0 16.3 -33.3
Total
Operating Income
DifferencePrice
Variance
Cost
Variance
Shipping
Volume
Variance
and
Other
Sumitomo Chemical Co., Ltd.
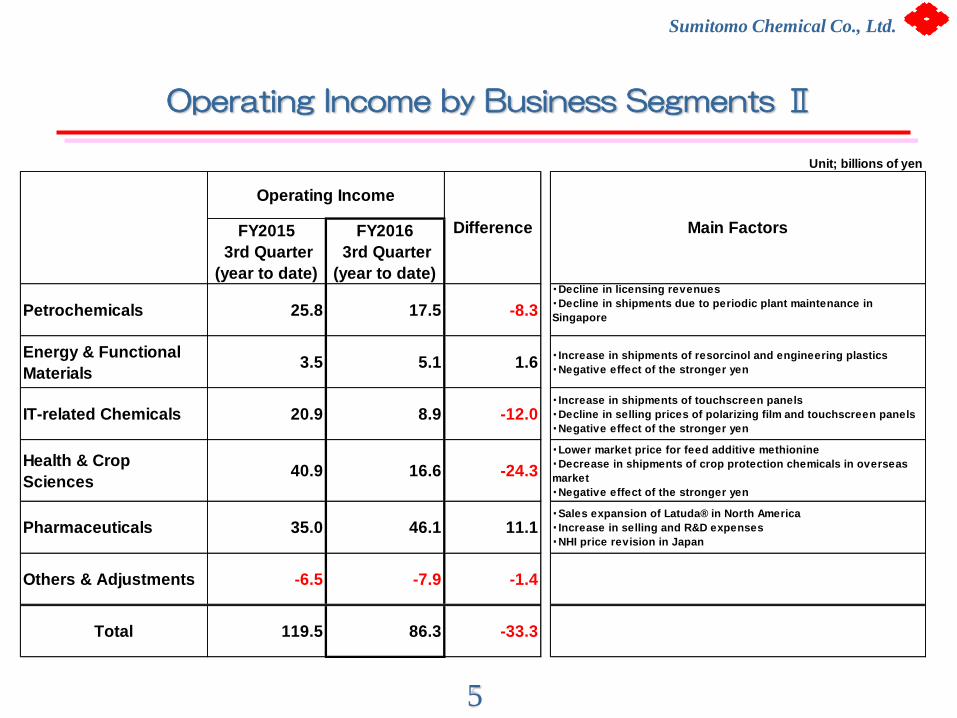
Operating Income by Business Segments Ⅱ
5
Unit; billions of yen
FY2015
3rd Quarter
(year to date)
FY2016
3rd Quarter
(year to date)
Petrochemicals 25.8 17.5 -8.3
・Decline in licensing revenues
・Decline in shipments due to periodic plant maintenance in
Singapore
Energy & Functional
Materials3.5 5.1 1.6
・Increase in shipments of resorcinol and engineering plastics
・Negative effect of the stronger yen
IT-related Chemicals 20.9 8.9 -12.0・Increase in shipments of touchscreen panels
・Decline in selling prices of polarizing film and touchscreen panels
・Negative effect of the stronger yen
Health & Crop
Sciences40.9 16.6 -24.3
・Lower market price for feed additive methionine
・Decrease in shipments of crop protection chemicals in overseas
market
・Negative effect of the stronger yen
Pharmaceuticals 35.0 46.1 11.1・Sales expansion of Latuda® in North America
・Increase in selling and R&D expenses
・NHI price revision in Japan
Others & Adjustments -6.5 -7.9 -1.4
Total 119.5 86.3 -33.3
Operating Income
Difference Main Factors

Sumitomo Chemical Co., Ltd.
Consolidated Balance Sheets
6
Unit; billions of yen
31-Mar-16 31-Dec-16 Difference 31-Mar-16 31-Dec-16 Difference
Current Assets 1,187.9 1,230.5 42.6 Liabilities 1,571.4 1,694.6 123.2
Cash and cash equivalents 215.6 211.6 -4.0Trade notes and accounts
payable205.2 220.1 14.9
Trade notes and accounts
receivable414.8 398.9 -15.9 Interest-bearing Liabilities 831.5 951.2 119.7
Inventories 402.3 428.7 26.5 Others 534.7 523.2 -11.4
Others 155.3 191.2 35.9 Net Assets 1,090.8 1,143.1 52.4
Non-current Assets 1,474.2 1,607.3 133.1 Shareholders' equity 643.7 677.2 33.5
Property, plant and equipment 642.2 662.1 20.0Accumulated other
comprehensive income123.2 113.7 -9.4
Intangible assets 187.3 286.1 98.9 Non-controlling interests 323.9 352.2 28.3
Investment and other assets 644.8 659.0 14.2
Total 2,662.2 2,837.8 175.6 Total 2,662.2 2,837.8 175.6
28.8% 27.9% -0.9%Shareholders' equity ratio

Sumitomo Chemical Co., Ltd.
Consolidated Statements of Cash Flows
7
Unit; billions of yen
FY2015
3rd Quarter
(year to date)
FY2016
3rd Quarter
(year to date)
Difference
169.2 85.3 -83.9
-34.3 -168.4 -134.0
134.9 -83.0 -217.9
-47.4 80.3 127.7
-3.7 -1.3 2.5
83.7 -4.0 -87.7
284.0 211.6 -72.4Cash and cash equivalents
(at December 31)
Cash flows from operating activities
Cash flows from investing activities
Free cash flows
Cash flows from financing activities
Effect of exchange rate changes on cash
and cash equivalents
Net change in cash and cash equivalents

Sumitomo Chemical Co., Ltd.
Major Subsidiaries
8
FY2015
3rd Quarter
(year to date)
FY2016
3rd Quarter
(year to date)
The Polyolefin Company (Singapore)
(millions of USD)
Petrochemical Corporation of
Singapore
(millions of USD)
Rabigh Refining and Petrochemical
Company
(millions of SAR)
Dongwoo Fine-Chem
(billions of KRW)
Valent U.S.A. and Subsidiaries
(millions of USD)
Decreased due to a decline in selling
prices caused by lower feedstock
prices, and a temporary shutdown of an
ethane cracker
930 788
1,902 1,639
22,818 17,659
Company
Net Sales
Profit Trends
Maintaining due to better margins
Maintaining due to better margins
1,668 1,619
517 517
Decreased due to lower selling price
and other factors despite higher sales
volume
Decreased due to difference of product
mix
Sumitomo Chemical Co., Ltd. Sumitomo Chemical Co., Ltd.
(Reference : Segment Information)
9

Sumitomo Chemical Co., Ltd.
Net Sales by Business Segments (Quarterly)
10
Unit; billions of yen
1Q 2Q 3Q 4Q 1Q 2Q 3Q 1st Half2nd Half
(estimated)
Petrochemicals 198.5 163.6 156.3 138.7 137.0 128.7 148.4 265.7 294.3
Energy & Functional
Materials52.5 52.6 52.0 51.9 47.0 47.5 51.5 94.4 115.6
IT-related Chemicals 104.1 104.0 96.6 79.8 86.0 88.7 95.1 174.7 180.3
Health & Crop
Sciences82.0 75.2 71.1 130.7 64.0 61.8 66.1 125.8 214.2
Pharmaceuticals 106.2 108.8 113.5 107.0 111.7 102.6 115.5 214.3 220.7
Others & Adjustments 13.4 15.0 12.4 16.0 10.9 14.7 12.7 25.6 34.4
Total 556.6 519.3 501.9 524.0 456.6 444.0 489.3 900.5 1,059.5
FY2015 FY2016FY2016

Sumitomo Chemical Co., Ltd.
Operating Income by Business Segments (Quarterly)
11
Unit; billions of yen
1Q 2Q 3Q 4Q 1Q 2Q 3Q 1st Half2nd Half
(estimated)
Petrochemicals 6.9 6.4 12.4 3.0 1.8 4.9 10.9 6.7 10.3
Energy & Functional
Materials0.0 2.3 1.2 -0.7 0.7 1.5 3.0 2.2 0.8
IT-related Chemicals 7.3 8.8 4.8 -1.0 1.4 1.1 6.5 2.5 3.5
Health & Crop
Sciences16.1 10.9 13.8 36.6 9.1 3.8 3.7 12.9 44.1
Pharmaceuticals 5.8 13.5 15.7 7.7 15.3 12.6 18.2 27.9 20.1
Others & Adjustments -3.0 -0.9 -2.6 -0.7 -3.0 -1.8 -3.2 -4.8 -6.2
Total 33.2 41.1 45.3 44.9 25.3 21.9 39.0 47.3 72.7
FY2015 FY2016FY2016