financial results for q1 fy06/22
TRANSCRIPT

Financial Results for Q1 FY06/22(July 1 to September 30, 2021)
[Non-Consolidated]
Announced on Nov 8, 2021
Intelligent Wave Inc.

Financial Results Q1 FY06/22
Key initiatives in Q1 FY06/22
Forecast for FY06/22
Reference

Copyright © 2021, INTELLIGENT WAVE INC. All rights reserved.
Q1 FY06/22:Overview of results YoY comparison
3
Q1 FY06/21 Q1 FY06/22 Change
Net sales 2,298 2,251 -47 -2.0%
Operating
income134 126 -8 -6.0%
Ordinary
income128 124 -4 -3.1%
Net income 83 82 -1 -1.2%
Million yen

Copyright © 2021, INTELLIGENT WAVE INC. All rights reserved.
Q1 FY06/22 Sales by segment category
4
Q1 FY06/21 Q1 FY06/22 Change
Net Sales 2,298 2,251 -47
System Development 1,113 1,170 +57
Maintenance 315 360 +45
In-house products 144 131 -13
Cloud service 224 243 +19
Hardware 208 79 -129
Third-party products 110 69 -41
Security products 181 198 +17
(+) Steadily increase in System Development and Cloud service
(△) Decrease in sales of Hardware for new development projects and
Third-party products.
Million yen
Copyright © 2021, INTELLIGENT WAVE INC. All rights reserved.
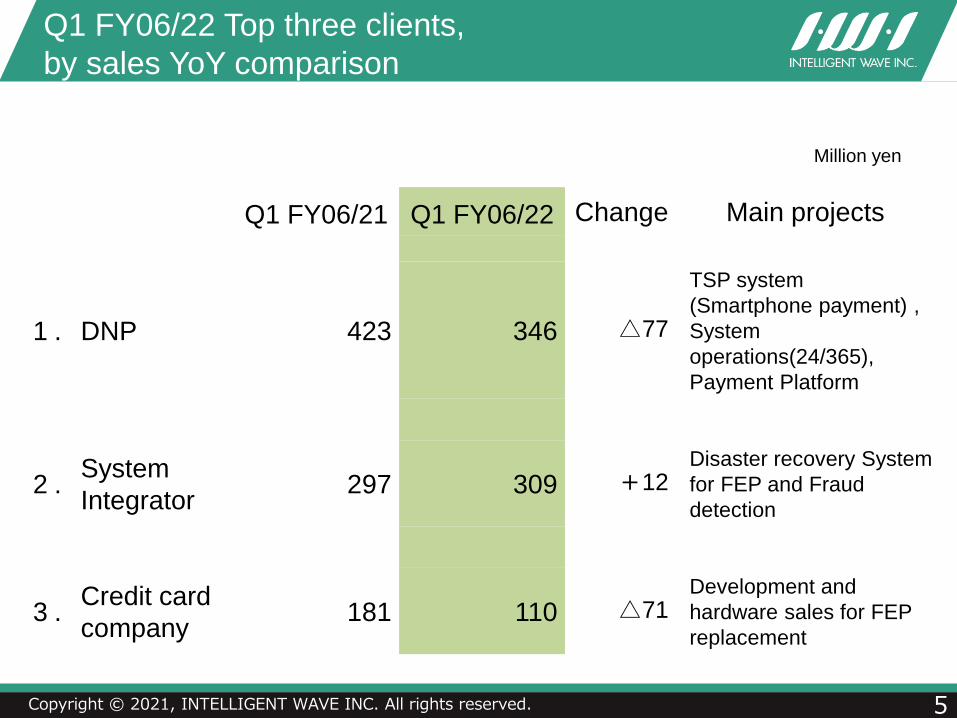
Q1 FY06/21 Q1 FY06/22 Change Main projects
1 . DNP 423 346 △77
TSP system
(Smartphone payment) ,
System
operations(24/365),
Payment Platform
2 .System
Integrator297 309 +12
Disaster recovery System
for FEP and Fraud
detection
3 .Credit card
company181 110 △71
Development and
hardware sales for FEP
replacement
Q1 FY06/22 Top three clients,
by sales YoY comparison
5
Million yen

Copyright © 2021, INTELLIGENT WAVE INC. All rights reserved.
2,298 2,251
5.8% 5.6%
(+) Steadily increase in System Development
Improved profitability from Maintenance and Cloud service
(△) Decreased in sales of hardware. Increased in SG & A expenses
Q1 FY06/21 Q1 FY06/22
(Increase)⚫ Steadily increase in System Development
Improved profitability from Maintenance and
Cloud service
(Decrease)⚫ Decreased in sales of hardware⚫ Increased in SG & A expenses
Q1 FY06/22 Operating income
6
■…Net Sales
●…Operating margin
-8 YoYMillion yen
Reasons for changes

Financial Results Q1 FY06/22
Key initiatives in Q1 FY06/22
Forecast for FY06/22
Reference
Copyright © 2021, INTELLIGENT WAVE INC. All rights reserved.
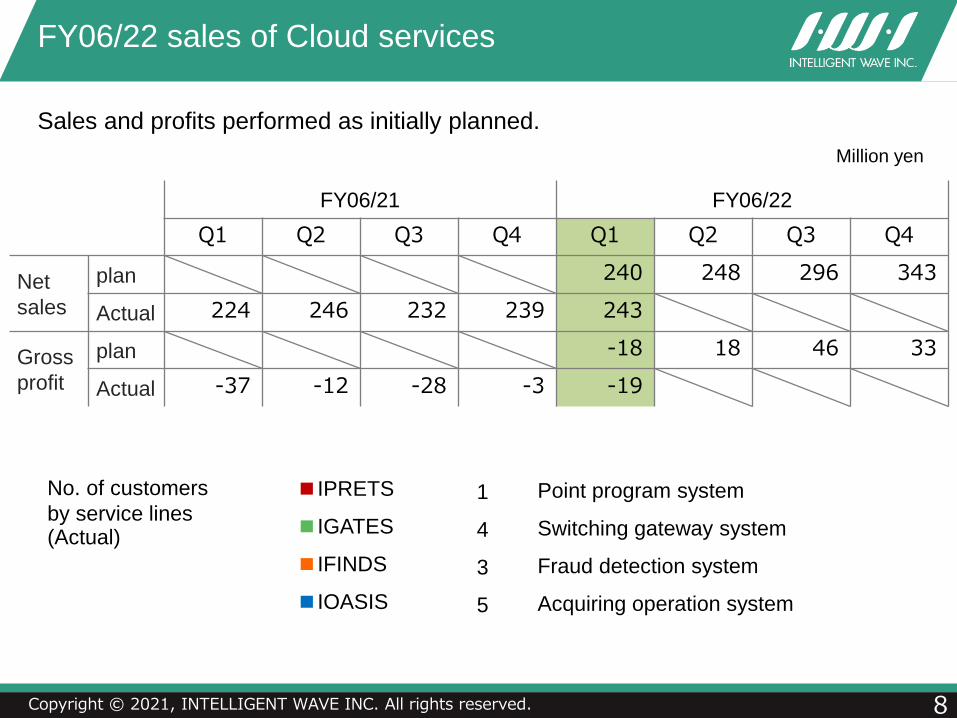
Sales and profits performed as initially planned.
FY06/22 sales of Cloud services
8
Million yen
No. of customers
by service lines(Actual)
■IPRETS 1 Point program system
■IGATES 4 Switching gateway system
■IFINDS 3 Fraud detection system
■IOASIS 5 Acquiring operation system
FY06/21 FY06/22
Q1 Q2 Q3 Q4 Q1 Q2 Q3 Q4
Net
sales
plan 240 248 296 343
Actual 224 246 232 239 243
Gross
profit
plan -18 18 46 33
Actual -37 -12 -28 -3 -19

Copyright © 2021, INTELLIGENT WAVE INC. All rights reserved.
FY06/22 Orders of Cloud services
9
2,000
1,130
0 500 1,000 1,500 2,000 2,500 3,000
FY06/23
FY06/22
reference)Current sales prospect ■…Forecast Plan ■ … Prospect
Received 2 orders for IOASIS in the first quarter. Promised to acquire new additional
orders in the second quarter consecutively.These orders will be booked as sales starting from FY06/23.
FY06/21 FY06/22
1Q 2Q 3Q 4Q 1Q 2Q 3Q 4Q
Orders on hand 133 73 79 483 1,000
Amount of orders 1,934 1,762 1,609 1,853 2,611
Million yen

Copyright © 2021, INTELLIGENT WAVE INC. All rights reserved.
Next Generation Fraud Detection Service
10
■Deployed new AI-technology to FARIS,
partnering with an AI-security start-up from the US
In September 2021, we employed to FARIS scoring service
AI-engine called 'RIME' developed by AI-security start-up, Robust Intelligence (HQ: California,
United States). We started sales activity for introduction.
【FARIS Scoring Service】
the service utilizing AI with
advanced algorithm to improve
accuracy of scoring system
The trends of cashless society promotion and increase of non-face-to-face payment
transaction expands the incident of fraudulent card use. We develop and strengthen
next generation fraud detection service 'FARIS', based on our experience and
knowledge as the top vendor in the market.
Started sales of a
credit card fraud
detection system
1999
Started sales of
SaaS business of
fraud detection
2017
・ordered by 2 companies
・POC progressing in 3
companies
On-premise
development+
Rule-based method
Sophisticate
AI scoring
method
Cloud service+
Rule-based method
Cloud service+
AI scoring method

Copyright © 2021, INTELLIGENT WAVE INC. All rights reserved.
For Broadcasting industry (New Business)
11
① Promoting IP flow monitoring solution, EoM
■EoM:
■ The companies which has
purchased EoM
Visualizes and monitors IP flow data between broadcasting sites.
Realizes ultra high-speed and bulk data processing by utilizing hardware
equipped with FPGA.
・TV Asahi
・Japan Digital Service (JDS)
・QVC Japan
・Yleisradio Oy(Finland's public
broadcaster, Yle)
② Developing solution to monitor and control network in whole
broadcasting master system, “SmartOchestrator (tentative)” * Being uncovered on events, November

Copyright © 2021, INTELLIGENT WAVE INC. All rights reserved.
Financial System Business /
Information Security Business
12
■ IWI started security assessment service based on white-hacker's
insight (October, 2021)
The assessment, provided by Ierae Security Inc. (HQ: Tokyo) enables companies to assess
their own security from attacker's point of view.
We propose innovative security measurements and find the security hole which cannot be
visible with conventional security assessment.
■ Matsui Securities Co. Ltd. has introduced the integrated ID
management tool 'Evidian' (August, 2021)
Evidian, which over 900 companies and 5M users use, is the leading solution in ID
management tools. Matsui Securities has introduced it, aiming for reducing workloads of ID
management and user's authorization.
The promotion of tele-work and DX leads to increase of opportunities of systems and
cloud services investment in industreies. We provide services to address issues on
workloads of ID/ password/ access management and security measurement.
Related news
Financial Results Q1 FY06/22
Key initiatives in Q1 FY06/22
Forecast for FY06/22
Reference
Copyright © 2021, INTELLIGENT WAVE INC. All rights reserved.
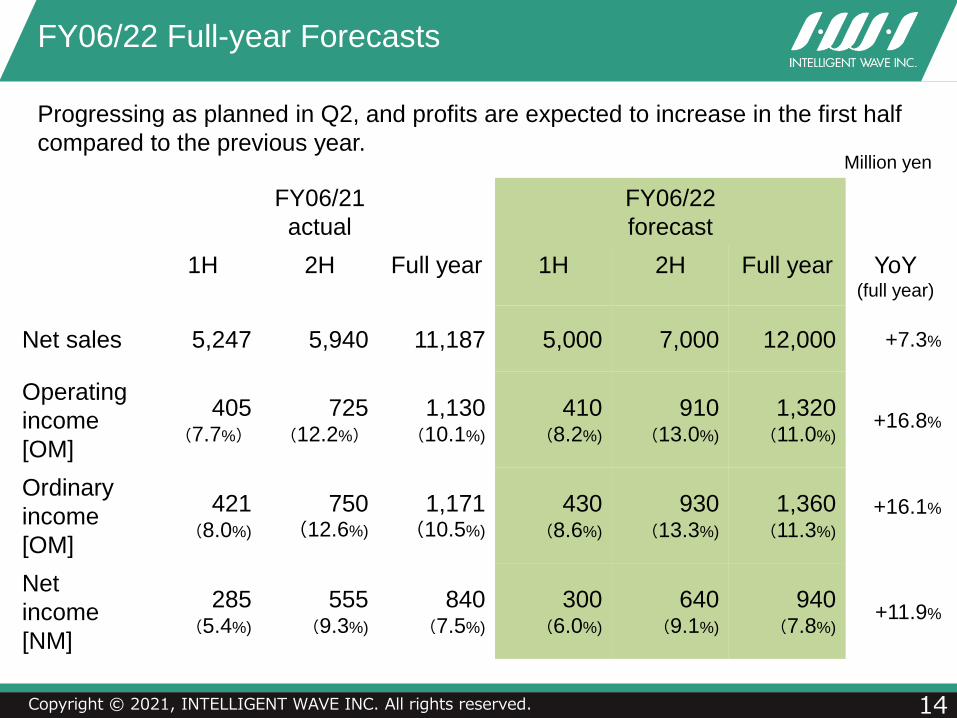
FY06/22 Full-year Forecasts
14
Progressing as planned in Q2, and profits are expected to increase in the first half
compared to the previous year.
FY06/21
actual
FY06/22
forecast
1H 2H Full year 1H 2H Full year YoY(full year)
Net sales 5,247 5,940 11,187 5,000 7,000 12,000 +7.3%
Operating
income
[OM]
405(7.7%)
725(12.2%)
1,130(10.1%)
410 (8.2%)
910 (13.0%)
1,320(11.0%)
+16.8%
Ordinary
income
[OM]
421(8.0%)
750(12.6%)
1,171(10.5%)
430 (8.6%)
930 (13.3%)
1,360(11.3%)
+16.1%
Net
income
[NM]
285(5.4%)
555(9.3%)
840(7.5%)
300 (6.0%)
640 (9.1%)
940(7.8%)
+11.9%
Million yen
Copyright © 2021, INTELLIGENT WAVE INC. All rights reserved.
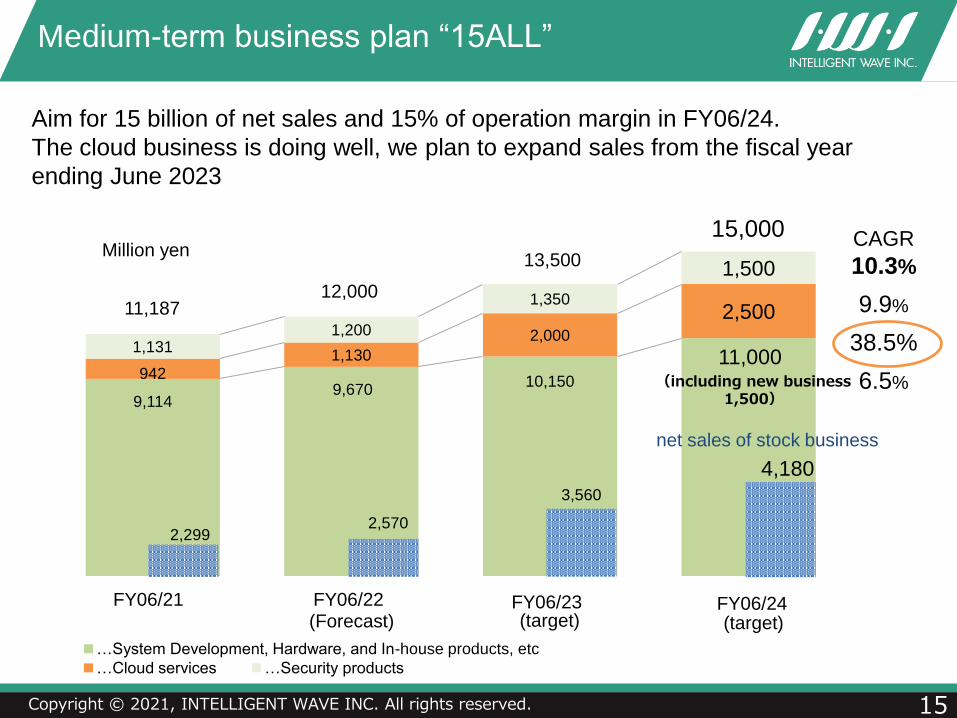
Medium-term business plan “15ALL”
15
Aim for 15 billion of net sales and 15% of operation margin in FY06/24.
The cloud business is doing well, we plan to expand sales from the fiscal year
ending June 2023
9,114 9,670
10,150
11,000 942
1,130
2,000
2,500
1,131 1,200
1,350
1,500
11,18712,000
13,500
15,000
■…System Development, Hardware, and In-house products, etc
■…Cloud services ■…Security products
(including new business 1,500)
CAGR
10.3%
9.9%
38.5%
6.5%
2,299
4,180
2,570
3,560
FY06/21 FY06/22 FY06/23 FY06/24(Forecast) (target) (target)
Million yen
net sales of stock business

Copyright © 2021, INTELLIGENT WAVE INC. All rights reserved.
Status of listing on the prime market
28th July, 2021 Received notification about the primary judge for the listing requirements for Prime market from TSE
criteria Our company Listing requirements
No. of Tradable Shares (units) 124,495 20,000
Tradable Share Market Cap (bn.) 83 100
Tradable Share Ratio (%) 47.2 35.0
Trading Value (mil.) 47 20
・Dec., 2021 (planned) Apply to be listed on the Prime Market
・4th Apr., 2022 Being listed on the Prime Market
・During the transitional period,
1)Enhance the corporate value by executing mid-term business plan “15 ALL”
2) Strengthen shareholder returns
・28th July, 2021 Announced the policy to select to be listed in the Prime market.
16
【schedule】
Financial Results Q1 FY06/22
Key initiatives in Q1 FY06/22
Forecast for FY06/22
Reference

Copyright © 2021, INTELLIGENT WAVE INC. All rights reserved.
1,534 1,512 1,679 1,559 2,080 1,851 2,039
1,629 1,816
1,769 1,873 1,321 1,732
2,061 2,075 1,882
1,540 1,485
2,016 2,401
2,202 2,026
1,934 1,762 1,609
1,853
2,611
5,319
5,786
5,202 5,317
6,075 5,688
5,530
5,022
5,912
1Q 2Q 3Q 4Q 1Q 2Q 3Q 4Q 1Q
Orders on hand
18
Million yen
FY06/20 FY06/21 FY06/22
■…Cloud services ■…System development ■…Security products, Hardware, In-house products, etc
Copyright © 2021, INTELLIGENT WAVE INC. All rights reserved.
2,402
3,016
2,254
3,230 3,056
2,562 2,660 2,612
2,829
1Q 2Q 3Q 4Q 1Q 2Q 3Q 4Q 1Q
Amount of orders
19
Million yen
FY06/20 FY06/21 FY06/22

Copyright © 2021, INTELLIGENT WAVE INC. All rights reserved.
FY06/21
actual
FY06/22
forecast
1H 2H Full year 1H 2H Full year YoY(full year)
Net Sales 5,247 5,940 11,187 5,000 7,000 12,000 +7.3%
System
Development2,437 2,835 5,272 2,713 3,137 5,850 +11.0%
Maintenance 647 710 1,357 725 715 1,440 +6.1%
In-house
products209 126 335 265 135 400 +19.4%
Cloud service 470 472 942 489 641 1,130 +20.0%
Hardware 872 766 1,638 188 1,542 1,730 +5.6%
Third-party
products240 269 509 120 130 250 △50.9%
Security
products369 762 1,131 500 700 1,200 +6.1%
FY06/22: Forecasts Sales by segment category
20
Million yen
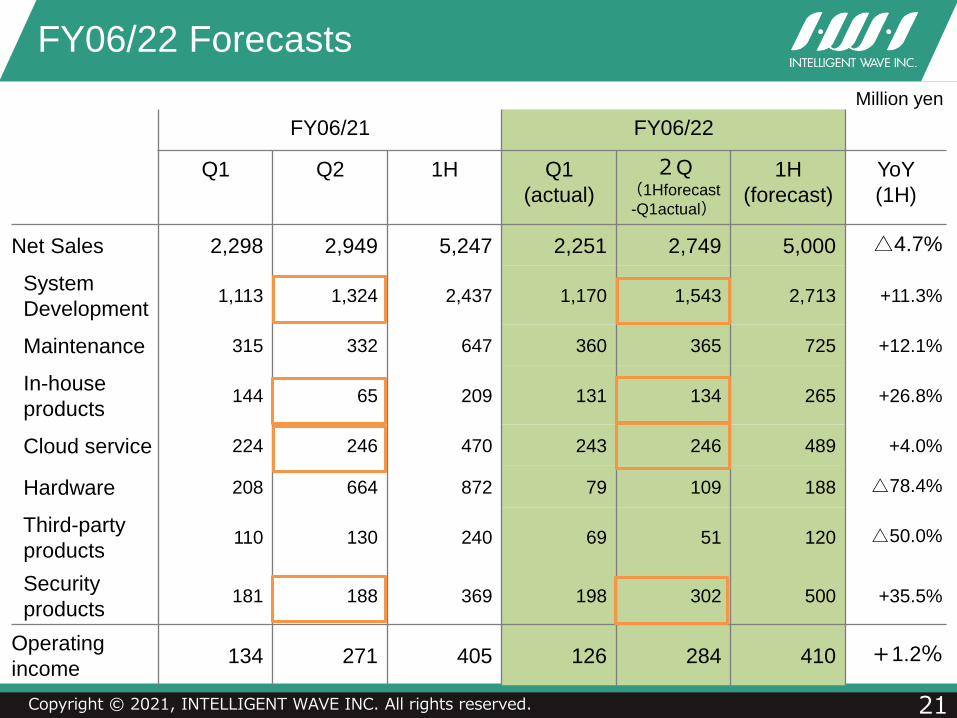
Copyright © 2021, INTELLIGENT WAVE INC. All rights reserved.
FY06/21 FY06/22
Q1 Q2 1H Q1
(actual)
2Q(1Hforecast
-Q1actual)
1H
(forecast)
YoY
(1H)
Net Sales 2,298 2,949 5,247 2,251 2,749 5,000 △4.7%
System
Development1,113 1,324 2,437 1,170 1,543 2,713 +11.3%
Maintenance 315 332 647 360 365 725 +12.1%
In-house
products144 65 209 131 134 265 +26.8%
Cloud service 224 246 470 243 246 489 +4.0%
Hardware 208 664 872 79 109 188 △78.4%
Third-party
products110 130 240 69 51 120 △50.0%
Security
products181 188 369 198 302 500 +35.5%
Operating
income134 271 405 126 284 410 +1.2%
FY06/22 Forecasts
21
Million yen

Copyright © 2021, INTELLIGENT WAVE INC. All rights reserved.
Historical net sales (Stock/Flow)
22
1,098 1,427 1,761
2,074 2,299
603
7,371
9,176 8,682 8,846 8,888
1,648
8,469
10,603 10,443 10,920 11,187
2,251 13.0%
13.5%16.9%
19.0% 20.6%
26.8%
the rate of stock businessMillion yen
■Stock ■Flow
FY06/17 FY06/18 FY06/19 FY06/20 FY06/21Q1
FY06/21
Stock 1,098 1,427 1,761 2,074 2,299 603
(YoY) +30.0% +23.4% +17.8% +10.8% +11.9%
Flow 7,371 9,176 8,682 8,846 8,888 1,648
(YoY) +24.5% -5.4% +1.9% +0.5% -6.3%
* Stock: categories with contracts that allow us to record sales of a fixed amount on a regular basisFlow : categories with contracts that are not stationary in terms of the amount and timing
Copyright © 2021, INTELLIGENT WAVE INC. All rights reserved.
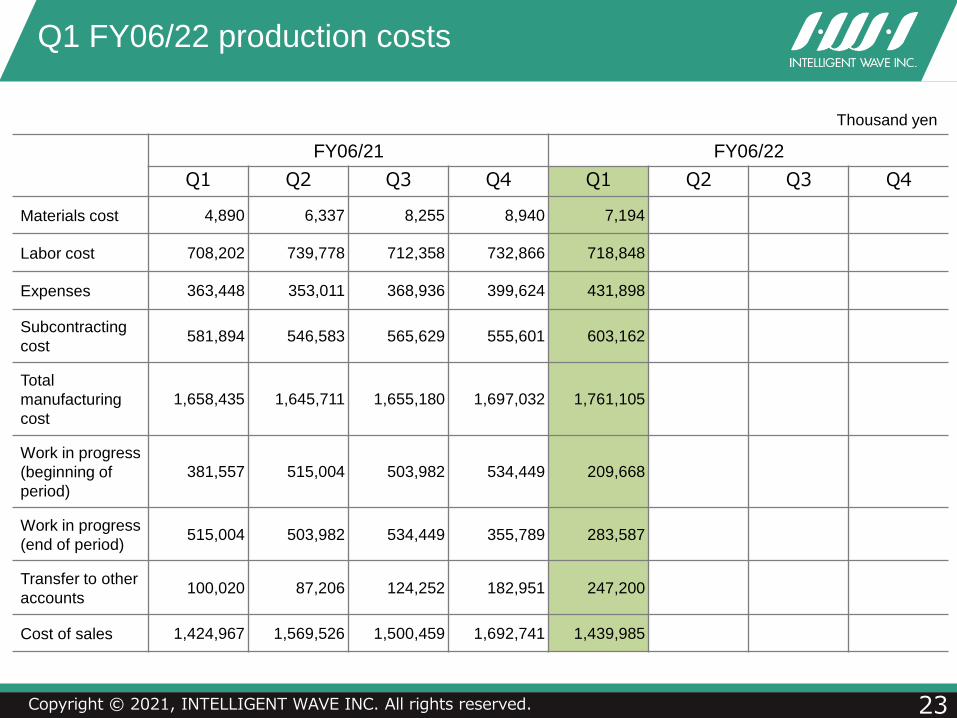
FY06/21 FY06/22
Q1 Q2 Q3 Q4 Q1 Q2 Q3 Q4
Materials cost 4,890 6,337 8,255 8,940 7,194
Labor cost 708,202 739,778 712,358 732,866 718,848
Expenses 363,448 353,011 368,936 399,624 431,898
Subcontracting
cost581,894 546,583 565,629 555,601 603,162
Total
manufacturing
cost
1,658,435 1,645,711 1,655,180 1,697,032 1,761,105
Work in progress
(beginning of
period)
381,557 515,004 503,982 534,449 209,668
Work in progress
(end of period)515,004 503,982 534,449 355,789 283,587
Transfer to other
accounts100,020 87,206 124,252 182,951 247,200
Cost of sales 1,424,967 1,569,526 1,500,459 1,692,741 1,439,985
Q1 FY06/22 production costs
23
Thousand yen

Copyright © 2021, INTELLIGENT WAVE INC. All rights reserved.
Q1 FY06/22 SG&A expenses
24
FY06/21 FY06/22
Q1 Q2 Q3 Q4 Q1 Q2 Q3 Q4
Salaries 287,425 323,927 312,972 339,842 290,810
Training and
recruiting5,321 17,463 13,352 16,789 10,332
Rent 17,621 17,615 17,918 18,164 18,793
Advertising 1,586 4,239 3,228 7,145 12,691
R&D 8,723 22,254 19,250 30,232 9,301
Depreciation and
amortization9,457 9,952 10,291 10,674 9,570
Thousand yen
Q1 FY06/21 Q1 FY06/22 Change
SG&A 454 493 +13
salaries +3
Training and recruiting +5
Advertising +11
Research and development +0
Others +20
(breakdown)
Million yen

Copyright © 2021, INTELLIGENT WAVE INC. All rights reserved.
21年6月期末 営業活動 投資活動 財務活動 22年6月期1Q末
Q1 FY06/22 Cash flows
25
4,307
+387
△3274,099
△268
124224502
-113-84
-186
-213
-69
-324
Million yen
Cash and cash equivalents
30-Jun-21
Cash and cash equivalents
30-Sep-21Operating activities Investing activities Financing activities
JPY 208mn decrease
Dividends
Purchase of
intangible assets
Purchase of PP&E
Income before taxes
D&A
A/R decrease
A/P decrease
Inventory increase
Income taxes paid

Copyright © 2021, INTELLIGENT WAVE INC. All rights reserved.
Revised the category of sales
26
Category
System
DevelopmentFlow
Maintenance Stock
In-house
productsFlow
Cloud service Stock
Hardware Flow
Third-party
productsFlow
Security
productsFlow
Category FY09/2021
Software Development Flow 888 39.4%
In-house products Flow 128 5.7%
System Service Flow 8 0.4%
Third-party products Flow 29 1.3%
Sum of “flow” type sales 1,055 46.9%
Maintenance Stock 624 27.7%
Maintenance of
Third-party productsStock 142 6.3%
Own Services Stock 308 13.7%
Oher Services Stock 120 5.3%
Sum of “stock” type sales 1,196 53.1%
We have revised categories to show the classification of sales based on the so-
called “stock” and “flow” type in more precise than before. Judged from the type
of contract and the actual status of the services, we have classified projects and
contracts that can generate a certain amount of sales on a regular basis as
“stock” and the rest of those as “flow”.
Old Category New Category Million yen
Copyright © 2021, INTELLIGENT WAVE INC. All rights reserved.
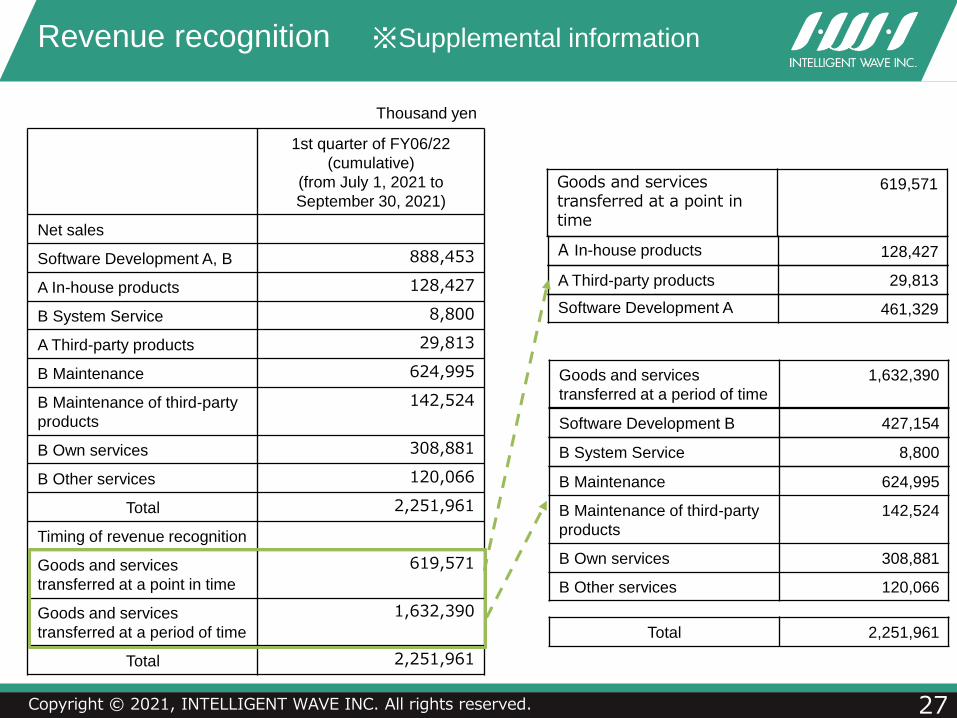
Revenue recognition ※Supplemental information
27
1st quarter of FY06/22
(cumulative)
(from July 1, 2021 to
September 30, 2021)
Net sales
Software Development A, B 888,453
A In-house products 128,427
B System Service 8,800
A Third-party products 29,813
B Maintenance 624,995
B Maintenance of third-party
products
142,524
B Own services 308,881
B Other services 120,066
Total 2,251,961
Timing of revenue recognition
Goods and services
transferred at a point in time
619,571
Goods and services
transferred at a period of time
1,632,390
Total 2,251,961
Goods and services transferred at a point in time
619,571
A In-house products 128,427
A Third-party products 29,813
Software Development A 461,329
Goods and services
transferred at a period of time
1,632,390
B System Service 8,800
B Maintenance 624,995
B Maintenance of third-party
products
142,524
B Own services 308,881
B Other services 120,066
Software Development B 427,154
Total 2,251,961
Thousand yen

Copyright © 2021, INTELLIGENT WAVE INC. All rights reserved.
4,844
5,5055,891
5,2575,174
7,137
6,3676,695
5,527
4,9564,762
5,241
5,870
6,5586,160
7,205
8,469
10,603
10,443
10,92011,187
1,5281,854
1,177
371678
1,482
389 417228 358 321
131
(677)
145484
731 702 547921 1,0361,130
01 02 03 04 05 06 07 08 09 10 11 12 13 14 15 16 17 18 19 20 21
Historical performance
28
■…Net sales ■ …Operating income
Million yen
Note: Consolidated results are shown through FY06/15.
Copyright © 2021, INTELLIGENT WAVE INC. All rights reserved.
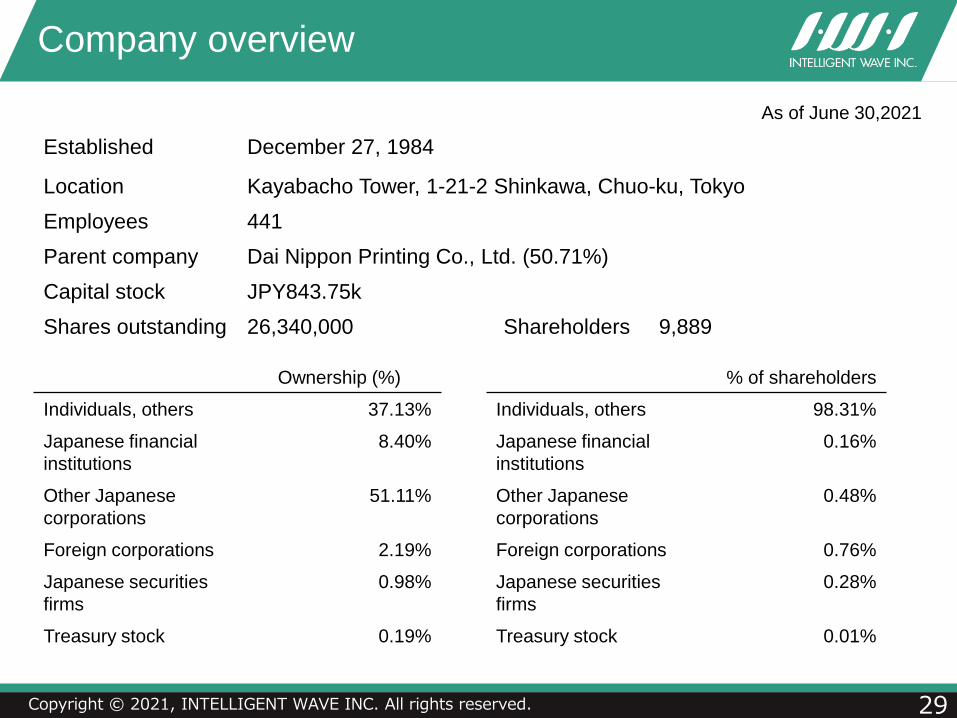
Company overview
29
As of June 30,2021
Established December 27, 1984
Location Kayabacho Tower, 1-21-2 Shinkawa, Chuo-ku, Tokyo
Employees 441
Parent company Dai Nippon Printing Co., Ltd. (50.71%)
Capital stock JPY843.75k
Shares outstanding 26,340,000 Shareholders 9,889
Ownership (%)
Individuals, others 37.13%
Japanese financial
institutions
8.40%
Other Japanese
corporations
51.11%
Foreign corporations 2.19%
Japanese securities
firms
0.98%
Treasury stock 0.19%
% of shareholders
Individuals, others 98.31%
Japanese financial
institutions
0.16%
Other Japanese
corporations
0.48%
Foreign corporations 0.76%
Japanese securities
firms
0.28%
Treasury stock 0.01%

These materials were produced to provide information concerning the company and its businesses. They
are not intended as a solicitation for investment in securities issued by Intelligent Wave Inc.
The opinions, forecasts, and other forward-looking statements in these materials are based on the
company’s judgment at the time they were produced, and Intelligent Wave Inc. makes no guarantees
concerning the accuracy and completeness of the information contained herein. Please be aware that this
information may also be revised without prior notice in the future.
Intelligent Wave Inc.
Management Planning Office E-mail: [email protected]