financial results - arcelormittal south africa · employers, contractors, communities for a full...
TRANSCRIPT

FINANCIAL RESULTS for the year ended December 2015

www.arcelormittalsa.com OVERVIEW
Agenda
Overview – CEO, Paul O’Flaherty
Steel market prognosis – CEO, Paul O’Flaherty
Operating results – CEO, Paul O’Flaherty
Financial synopsis – CFO, Dean Subramanian
Other key issues and outlook – CEO, Paul O’Flaherty
Questions – CEO and team
2

Paul O’Flaherty, CEO OVERVIEW
www.arcelormittalsa.com OVERVIEW
Key messages
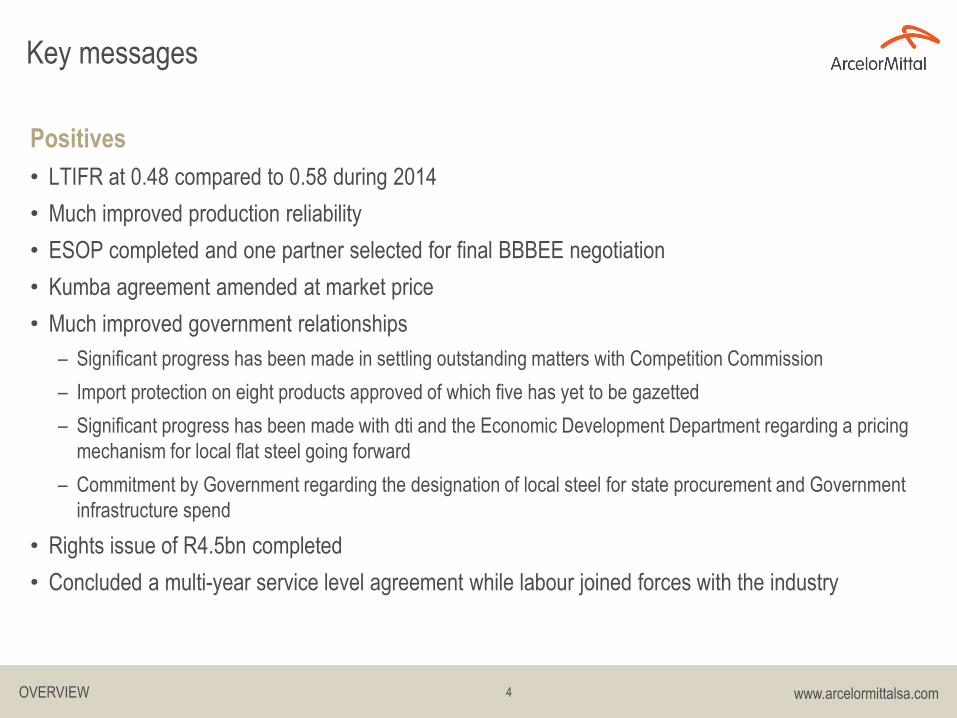
Positives
• LTIFR at 0.48 compared to 0.58 during 2014
• Much improved production reliability
• ESOP completed and one partner selected for final BBBEE negotiation
• Kumba agreement amended at market price
• Much improved government relationships
– Significant progress has been made in settling outstanding matters with Competition Commission
– Import protection on eight products approved of which five has yet to be gazetted
– Significant progress has been made with dti and the Economic Development Department regarding a pricing
mechanism for local flat steel going forward
– Commitment by Government regarding the designation of local steel for state procurement and Government
infrastructure spend
• Rights issue of R4.5bn completed
• Concluded a multi-year service level agreement while labour joined forces with the industry
4

www.arcelormittalsa.com OVERVIEW
Key messages
Challenges
• Two fatal incidents involving contracted employees
• Net loss of R8 635m
• Impairments of R4 254m
• Net cash outflow from operating and investing activities – R 2 247m
• Once off items of R2 558m consisting mainly of:
– Competition Commission R1 245m
– Thabazimbi mine closure costs R682m
– Recognition of deferred stripping asset R568m
• Future of Saldanha Works being reviewed – 84% has been impaired
• Continued flood of cheap imports
5

www.arcelormittalsa.com OVERVIEW
Flat and long steel products are further processed by downstream manufacturers. Coke and
Chemicals produces commercial-grade coke for use by the ferro-alloy industry as well as
selling steelmaking by-products.
We produce at five plants:
Vanderbijlpark, Saldanha, Newcastle, Vereeniging and Pretoria
73% of our sales are domestic (based on tonnage)
Our value creation model
6
Inputs
Natural capital
Raw materials consumed
2013 2014 2015
Iron ore 6 607kt 6 562kt 6 541kt
Coal 4 461kt 4 700kt 4 074kt
Purchased scrap 973kt 879kt 793kt
Fluxes 1 474kt 1 612kt 1 658kt
Energy
Electricity
consume(TWh) 3.67 3. 52 3.40
Water intake
Water intake (Mℓ) 17 515 18 774 18 418
Human and intellectual capital
2013† 2014† 2015†
Employees 9 016* 8 825* 9 315*
Hired labour 1 729 1 411 106
Service contractors 4 375 3 316 2 417
Training spend R138m R151m R202m
† As at 31 December
* Permanently employed
Financial capital
2013 2014 2015
Equity R20 694m R20 722m R13 472m
Borrowings R906m R1 000m R5 029m
Financial capital Shareholders, investors, employees
2013 2014 2015
Revenue R32 421m R34 852m R31 141m
Ebitda R1 768m R1 258m (R809m)
Profit from operations R47m (R301m) (R4 736m)
Ebitda margin 5.5% 3.6% (2.6%)
Manufactured capital
Customers
2013 2014 2015
Flat steel products sold 2 771kt 2 981kt 2 678kt
Domestic market 2 003kt 1 951kt 1 915kt
Export market 768kt 1 030kt 763kt
Long steel products sold 1 459kt 1 259kt 1 459kt
Domestic market 1 123kt 1 051kt 1 124kt
Export market 336kt 208kt 329kt
Coke and Chemicals sold
Market coke 545kt 466kt 451kt
Tar 109kt 110kt 96kt
Other 994kt 1 323kt 1 120kt
Social capital
Local communities, suppliers, local business
2013 2014 2015
Socio-economic development R37.4m R16.3m R12.6m
Procurement spend R29 612m* R32 275m* R29 047m
Direct GDP 1% 1% 0.7%
Indirect GDP contribution R11 000m
(0.4%)
R11 000m
(0.4%)
R15 200m
(0.4%)
Economic value contribution R32 421m R34 852m R31 141m
Taxes contributed R1 500m R870m R618m
Procurement spend
- QSE and EME R2 000m R2 500m R 2 800m
*Restated from R25 000m and R26 786m, as reported in the 2014 integrated annual
report, to include imports
Intellectual capital
Customers, employees
Investments in tailored steel products enables local manufacture of
wind towers and has cut the cost of solar installations by 16%
Outputs and outcomes Trade-offs
In 2015, to stay in business, our utmost priority
was to minimise losses – and to preserve cash. The imperative to preserve financial capital meant significant trade-offs; most were financial
capital positive but negative for other capitals.
Our business model – 1928 to 2015
We are Africa’s largest steel producer with an almost 90-year legacy of producing the
products that form the backbone of our nation’s economy. With facilities at Vanderbijlpark,
Saldanha, Newcastle, Vereeniging and Pretoria, we have the capacity to produce 6.5 million
tonnes of liquid steel.
Our new steel sales environment, 2016
In 2015 and early 2016 the
South African authorities
imposed import duties on a range of flat and long
steel products
We envisage that, from
2016 a steel pricing
regime will apply with
prices of flat steel being
determined according to
an agreed formula. From
2016, we envisage that
government will
commit itself to
localise primary steel in designated sectors for
infrastructural spend
2013 2014 2015
Total South African steel market (kt) 5 400 4 900 5 000
ArcelorMittal South Africa’s domestic steel sales (kt) 3 126 3 002 3 039
In 2015 we sold our products domestically as follows:
Construction (%)
Metal products (%)
Automotive and assembly (%)
Mining and agriculture (%)
60
20
11
9
Plate Hot rolled coil
Coiled rounds
Flats, reinforced bar rounds, angles and
blooms
Flats, rails, joists, rounds, angles,
billets and channels
Caster Billet mill
Raw materials
Electric arc furnace (Decommissioned)
Blast furnaces
Hot strip mill
We produce three types of products
Flat steel
products
Long steel
products
Coke and
chemicals
Key:
t = Tonnes
kt = Kilotonnes
TWh = Terawatt hour
Kℓ = Kilolitres
Mℓ = Megalitre
Commercial Coke
Human capital
Employees, contractors
2013 2014 2015
Safety: LTIFR 0.56 0.58 0.48
Safety: Fatalities 0 4 2
Salaries and wages R3 408m R3 764m R4 027m
Manufactured capital
Capital expenditure in 2015 was
R1 153 million (2014 : R2 798 million)
Social capital
Our CSI spend decreased from
R16.3 million to R12.6 million
Procurement spend fell by
10% to R29 billion
Restructuring of our long steel
products division saved R73 million
Human capital
Social capital
This year we spent over
R37 million on socio-economic enterprise and supplier
development
Manufactured capital
To preserve cash we cut back on planned
steel production by 1 400 tonnes
Natural capital
Spend on mitigating our environmental
impact was R65 million (lower than R320 million projected at end-2014)
Natural capital
Employers, contractors, communities
For a full list of our environmental outputs, see page 12 of our
integrated annual report

Paul O’Flaherty, CEO STEEL MARKET PROGNOSIS

www.arcelormittalsa.com STEEL MARKET PROGNOSIS
Raw material basket (RMB)
• The RMB declined by 37% during 2015 mainly as result
of iron ore decreasing by 43% followed by scrap slipping
33% and coking coal contracting 23%
• Although the RMB shed $105/t, steel prices have
slipped by $173/t (HRC) and $148/t (rebar) thinning the
HRC spread to only $146/t ($215/t) and for rebar to
$122/t ($165/t) - the reason for the demise in the
industry
– WSD estimate that in 2015 the net loss on marginal costs for
non-Chinese steel mills were making on exports were $19/t
while for Chinese mills it was $80/t
– WSD believe that it is not the plan of Chinese mills to out-
survive their offshore competitors, but rather an unintended
consequence of their unique relationships with municipalities
giving great support to the steel producers
• Prices of most commodities fell as result of slowing
emerging market growth and subdued Chinese demand
– Iron ore and coking coal fell to its lowest levels in eight and
nine years respectively while Chinese coke slipped 26%
– Brent crude prices plunged 50% amid a supply surge
Raw material environment - Global
8
$0
$200
$400
$600
$800
RMB HRC price Rebar price
HRC spread Rebar spread
International RMB compared to HRC & rebar prices
International 2015 Change on 2014
Iron ore (CFR North China) $56/t -43%
Scrap (Asia HMS) $235/t -33%
Pellets (fob) $85/t -33%
Hard coking coal (fob Australia) $88/t -23%
Coke (fob China) $147/t -26%
Tin (fob) $16 093/t -27%
Sources: Platts, AME, AMS and TEX Report
HR
C &
Reb
ar p
rices
and
flat
ste
el R
MB
($/
t)

www.arcelormittalsa.com STEEL MARKET PROGNOSIS
Raw material price environment – ArcelorMittal South Africa
2015 • Average R/$ exchange rate weakened 18% in 2015
• In contrast to the large drop in iron ore prices, our
iron ore costs rose 2% in ZAR but declined 16% in
USD
• Agreement has been reached with Kumba to amend
the pricing mechanism terms of the current
agreement from a cost-based price to an export
parity price (EPP) with effect from 1 Oct 2015
calculated on the basis of the Platts 62% Fe CFR
China Fines Index and with discounts at certain price
levels
– If the agreement was implemented retrospectively from
Jan 2015 and the total volumes of 4mt purchased from
Kumba were priced at EPP, the benefit for AMSA would
have been around R560m pre-tax
2016
• Excess Chinese steel capacity and continued
slowing economic growth are expected to pressurise
raw material prices in 2016
9
Change in USD values
Change in ZAR values
ArcelorMittal South Africa 2015 Change on 2014
Iron ore (for) R742/t +2%
Scrap (delivered) R2 106/t -32%
Pellets (delivered) R1 310/t -19%
Local non met coal (delivered) R1 175/t -4%
Imported met coal (delivered) R1 968/t -4%
Local met coal (delivered) R967/t -43%
HRC domestic price R6 732/t -11%
Rebar domestic price R6 255/t -16%
Change in values from 2014 to 2015
-43%
-16% -23%
-33%
-7%
-15%
-35%
-33%
6%
2%
-4%
-32%
11%
1%
-11%
-16%
-46% -36% -26% -16% -6% 4%
SA Inflation
International iron ore ($/t)
AMSA iron ore ($/t)
International coal ($/t)
AMSA Imported coal ($/t)
International scrap ($/t)
AMSA Scrap ($/t)
Electricity
Natural gas
International HRC price ($/t)
AMSA HRC domestic price ($/t)
International rebar price ($/t)
AMSA rebar domestic price ($/t) -29%
-26%
-43%
-19%
Sources: Platts, AME, AMS and TEX Report

www.arcelormittalsa.com STEEL MARKET PROGNOSIS
Sales environment - Global
Global • World steel crude output in 2015 contracted by 3% to
about 1 630mt from 1 657mt with China, North
America, Japan and Russia being the main
contributors to the decline countered by increases
from India, South Korea and other smaller producers
China • Provisional numbers indicate that China has cut its
annual crude steel production to 800mt, down 20mt
from 2014 while apparent steel consumption declined
by 39mt creating some 20mt in excess for exports –
the exact increase in Chinese exports for 2015
• Exports of primary carbon steel into Africa from
China increased by 36% in 2015 with North Africa
showing the strongest growth of 54%
• Exports of Chinese steel into SA climbed 38% but
was front loaded reaching a peak early 2015 of
93ktpm in H1 while H2 came in at 59ktpm – Chinese
exports now constitute 68% of our steel imports as
opposed to 35% some four years ago
10
Chinese steel industry
Chinese steel exports into Africa
Chi
nese
ste
el e
xpor
ts to
Afr
ica
(kt)
SA
Chi
nese
ste
el im
port
s as
% o
f sub
Sah
ara
impo
rts
Chi
nese
ste
el o
utpu
t & c
onsu
mpt
ion
(kt)
Chi
nese
ste
el e
xpor
ts (k
t)
-
20 000
40 000
60 000
80 000
100 000
-
200 000
400 000
600 000
800 000
2009 2010 2011 2012 2013 2014 2015
Apparent consumption Excess output Net exports
Source: Morgan Stanley data were used to compile the graphs
0%
3%
6%
9%
12%
15%
-
2 000 000
4 000 000
6 000 000
8 000 000
10 000 000
2009 2010 2011 2012 2013 2014 2015
North Africa Other sub-Sahara SA SA weight of total Africa

www.arcelormittalsa.com STEEL MARKET PROGNOSIS
Sales environment – Domestic
Flat • Total sales of flat steel products into the domestic
market increased by 2% during 2015 but imports
increased by 34% to above 1mt which took their
market share up to 35%, three times higher than the
value six years ago
• The increase in imports is solely as result of a surge
in HRC, galvanised and tinplate volumes
Long • Total sales of long steel products into the domestic
market declined by 8% during 2015 but imports
increased by 42% to limit the drop in apparent
consumption to -4% - import market share now at
12%
• Import volume expansion were mainly in sections
and other bars & rods
Total apparent consumption • Total sales declined by 9% in 2015 but imports
surged by 35% to limit the apparent consumption
move to less than 1%
11
Apparent consumption - sales plus imports (flat)
Apparent consumption - sales plus imports (long)
App
aren
t con
sum
ptio
n (t
) A
ppar
ent c
onsu
mpt
ion
(t)
-
200 000
400 000
600 000
800 000
1 000 000
2009 2010 2011 2012 2013 2014 2015
Total domestic sales Imports
-
100 000
200 000
300 000
400 000
500 000
600 000
700 000
2009 2010 2011 2012 2013 2014 2015
Total domestic sales Imports
Source : SAISI actuals up to 2008, thereafter AMSA estimates

www.arcelormittalsa.com STEEL MARKET PROGNOSIS
Sales environment - Domestic (continued)
Industrial groups • Steel sales by local producers to the domestic end
market during 2015 reached 3.8mt, 8% below the
level seen in 2014 and the fourth consecutive
contraction – the 2015 decline influenced also by the
flood of imports
• Ignoring the spike over the period 2006 to 2008,
each group maintained its weighting although
manufacturing and building & construction showed
an overall gain
• However, analysing the make-up of manufacturing
based on estimates, the following can be noted:
– Structural metal lost market share mainly because of
lower construction activity
– Automotive gained market as its demand for steel
increased stemming from government incentives
– Packaging lost its dependence on steel as the
beverage can industry moved across to aluminium
– Cable and wire products increased its demand for
steel marginally as a result of some gains to the
automotive, energy and machinery sectors
12
Steel sales by local producers to industrial groups (t)
Steel consumption trends in manufacturing
0
1 000 000
2 000 000
3 000 000
4 000 000
5 000 000
Mining Manufacturing Building & Construction Other
13%
5%
41%
29%
11% 16%
21% 25%
0%
20%
40%
Packaging Structural metal AgriculturalAutomotive White goods Cable & wire productsFastners Other
Source : SAISI actuals up to 2008, thereafter AMSA estimates

Paul O’Flaherty, CEO OPERATING RESULTS

www.arcelormittalsa.com OPERATING RESULTS
EBITDA from segments (Rm)
2014 2015
Flat steel products
EBITDA margin
Net realised price R/t
EBITDA cost R/t
535
2.2%
R7 226
R8 019
(1 269)
-6.4%
R6 891
R7 907
Long steel products
EBITDA margin
Net realised price R/t
EBITDA cost R/t
16
0.1%
R7 585
R9 845
(348)
-3.2%
6 423
R7 722
Coke and Chemicals EBITDA margin
428 20.9%
427 +23.7%
Corporate and other* 279 381
Total EBITDA EBITDA margin
1 258 3.6%
(809) -2.6%
14
*Include funding of the ‘Cell Captive’

www.arcelormittalsa.com OPERATING RESULTS
Main steel cost drivers (R/t liquid steel produced)
Flat Long
Cost item 2015
Change
on
2014
2015
Weight 2015
Change
on
2014
2015
Weight
Raw materials 3 291 +7.3% 47.0% 2 605 -22.2% 46.0%
Auxiliaries & consumables 2 039 +10.2% 29.2% 1 510 -9.9% 26.6%
Fixed cost 1 661 +12.8% 23.8% 1 553 -3.7% 27.4%
Total
Liquid steel (000t)
Average exchange rate (ZAR)
Average net realised price R/t
6 992
3 144
12.76
R6 891
+9.4%
-12.3%
-17.7%
-4.6%
100.0%
5 669
1 694
12.76
R6 423
-14.6%
+82.0%
-17.7%
-15.3%
100.0%
15

www.arcelormittalsa.com OPERATING RESULTS
ArcelorMittal South Africa - Steel production and shipment
volumes
Production • Liquid steel production was 4 839kt, an increase of
321kt compared to last year - higher production at Newcastle after the reline of the blast furnace in 2014 partly countered by demand driven production cutbacks
• Capacity utilisation was at 74% compared to 70% in 2014 with poor demand curbing any potential utilisation increases
Shipments • Total sales volumes were down by 3% compared to
2014 with domestic sales increasing 1% and exports decreasing 12% driven mainly by very low steel prices
• SA economy still face challenging times because of the weak manufacturing, mining and construction sectors
• Domestic steel market negatively affected by rising cheap imports, high operational costs (energy, labour, poor rail infrastructure) and disruptions in electricity supply
16
1 52
6
1 90
2
2 03
8
1 77
5
2 15
4
1 90
6
1 87
5
1 67
9
1 53
5
1 69
4
1 71
9
1 86
7
1 70
7
1 43
7
851
1 02
8
1 00
8
852
922
471 85
2
684 94
6
921
667
265 85
7
838
59%
73% 76% 66% 77%
59% 68% 63%
73% 80%
74% 65%
80%
69%
0%
20%
40%
60%
80%
100%
0
500
1000
1500
2000
2500
2009 2010 2011 2012 2013 2014 2015
Flat Production Long Production Total Utilisation
Production (000t)
931
1147
1310
1026
1326
1142
1198
1025
1095
908
969
982
983
932
417 363
462 550
495 461 505
410 266 502 536 494 375 388
458 536
595 483
594 445
640 1113
611 512 565 486 578 546
263 358
333
282 167
78
194 177
151 185 125
83 96 233
67% 70% 71% 64% 74% 75% 72% 72% 80% 67% 70% 72% 77% 70%
0%
20%
40%
60%
80%
100%
0
500
1000
1500
2000
2500
3000
2009 2010 2011 2012 2013 2014 2015
Flat Domestic Flat Export Long Domestic
Long Export Domestic Percentage
Shipments (000t)
www.arcelormittalsa.com OPERATING RESULTS
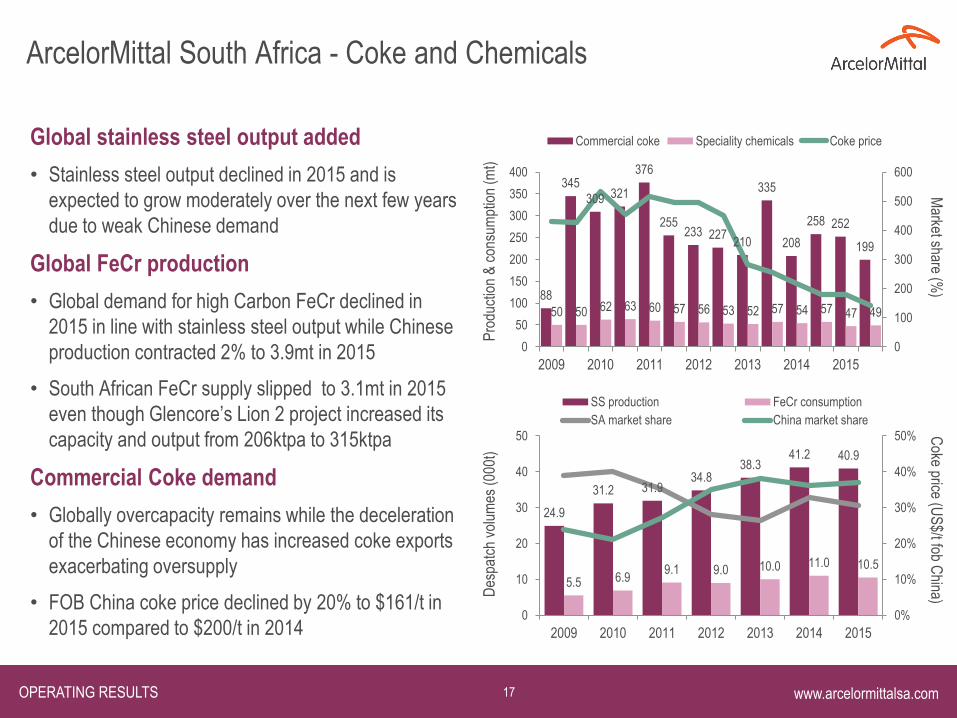
ArcelorMittal South Africa - Coke and Chemicals
Global stainless steel output added
• Stainless steel output declined in 2015 and is
expected to grow moderately over the next few years
due to weak Chinese demand
Global FeCr production
• Global demand for high Carbon FeCr declined in
2015 in line with stainless steel output while Chinese
production contracted 2% to 3.9mt in 2015
• South African FeCr supply slipped to 3.1mt in 2015
even though Glencore’s Lion 2 project increased its
capacity and output from 206ktpa to 315ktpa
Commercial Coke demand
• Globally overcapacity remains while the deceleration
of the Chinese economy has increased coke exports
exacerbating oversupply
• FOB China coke price declined by 20% to $161/t in
2015 compared to $200/t in 2014
17
88
345
309 321
376
255 233 227
210
335
208
258 252
199
50 50 62 63 60 57 56 53 52 57 54 57 47 49
0
100
200
300
400
500
600
0
50
100
150
200
250
300
350
400
2009 2010 2011 2012 2013 2014 2015
Commercial coke Speciality chemicals Coke price
24.9
31.2 31.9 34.8
38.3 41.2 40.9
5.5 6.9 9.1 9.0 10.0 11.0 10.5
0%
10%
20%
30%
40%
50%
0
10
20
30
40
50
2009 2010 2011 2012 2013 2014 2015
SS production FeCr consumption
SA market share China market share
Pro
duct
ion
& c
onsu
mpt
ion
(mt)
D
espa
tch
volu
mes
(00
0t)
Coke price (U
S$/t fob C
hina) M
arket share (%)

www.arcelormittalsa.com OPERATING RESULTS
2014 2015
Maintenance & expansion 2 640 991
Environment 63 65
Other 95 97
Total expenditure 2 798 1 153
18
Main projects completed during 2015 • Vanderbijlpark - 3rd ladle furnace at steel plant to increase throughput by 200ktpa at a cost of R102.4m, Battery 7
collecting-main replacement at a cost of R18.0m
• Newcastle - Construction of a new BOF slag disposal site (environmental project) at a cost of R45.2m, coke
battery N2 emergency repair at a cost of R27.6m, and replace BOF slag filter presses at a cost of R22.9m
Main on-going projects during 2015 • Vanderbijlpark - Battery 4 bracing and end flue repair, replace BOF off-gas coolers (2015 spent R15.3m),
producing double reduce material (2015 spent R15.5m)
• Newcastle - Blast furnace reline (2015 spent R72m), replace 33kV panels and breakers (2015 spent R10.9m),
rebuild boiler 2 (2015 spent R7.7m)
• Saldanha - Procure one tube bundle set for the Midrex (2015 spent R15.8m)
• Coke & Chemicals - Battery N2 bracing and end flue repair (2015 spent R17.5m), tar plant environmental
compliance (2015 spent R13.7m)
ArcelorMittal South Africa - Capital expenditure (Rm)

www.arcelormittalsa.com OPERATING RESULTS
ArcelorMittal South Africa - Capital expenditure (Rm) (continued)
Capex budget for 2016 is R2 525m
• Maintenance - Coke batteries N2 and V4 end flue and bracing repairs plus ongoing maintenance at all plants
• Economic footprint - Conversion of the Vdbp continuous annealing line to a galvanising line plus a new paint line
to serve the automotive and construction industries
• Energy saving projects - Build a new boiler at Vdbp to supply steam to the under utilised 40MW power plant
(12MW gain) and implement various energy saving projects at all operating units, including a new blast furnace
gas holder at Vdbp
• Environmental projects - R260m was included in the budget for air emission compliance and water and waste
management
Capex plans for the next five years dependent on Government commitment
• Maintenance - Maintain plant and improve plant reliability, coke battery life extension investment and reline of the
Saldanha Corex furnace
• Economic footprint - Conversion of a Newcastle bloom caster to a billet caster (cost saving and capacity
increase), the continuous annealing line to a galvanising line plus a new paint line to be completed by 2018 at
Vdbp
• Energy saving projects - Continued investment in energy saving projects to curb input cost
• Environmental projects - Continued investment directed towards legal compliance and to improve working
conditions for employees
19

CFO, Dean Subramanian FINANCIAL SYNOPSIS

www.arcelormittalsa.com FINANCIAL SYNOPSIS
Headline earnings (Rm)
2014 2015
Revenue 34 852 31 141
EBITDA 1 258 (809)
Depreciation and amortisation (1 410) (1 369)
Once-off items (149) (2 558)
Loss from operations (301) (4 736)
Impairment - (4 254)
Finance and investment income 17 175
Finance costs (605) (1 208)
Equity earnings 191 195
Gain recognised on loss of interest over former associate 80 -
Income tax credit 460 1 193
Loss after tax (158) (8 635)
Add back
Impairment - 4 254
Gain recognised on loss of interest over former associate (80) -
Loss / (profit) on disposal / scrapping of assets 29 5
(Profit) on disposal of assets of an associate (16) -
Tax effect (2) (994)
Headline (loss) (227) (5 370)
- In US$m (21) (421)
21

www.arcelormittalsa.com FINANCIAL SYNOPSIS
Impairments 2014 2015
Saldanha – property plant & equipment - (3 574)
Vereeniging (Vaal meltshop & forge) - property plant & equipment - (370)
Northern Cape Iron Ore mining operations - (302)
ArcelorMittal Analytical Laboratories - (8)
Total - (4 254)
Once-off items and impairments (Rm)
Once-off item 2014 2015
Thabazimbi mine closure cost - (682)
Tshikondeni mine closure cost (50) 23
Vereeniging closure cost - (86)
Competition Commission settlement - (1 245)
Write-off of pre-stripping asset - (568)
Restructuring cost (90) -
Onerous contract Sandton office (9) -
Total (149) (2 558)
22

www.arcelormittalsa.com FINANCIAL SYNOPSIS
Cash flow (Rm)
2014 2015
Cash generated from operations before working capital 1 186 (1 911)
Working capital 1 019 1 647
Capex (2 713) (1 256)
Net finance cost (354) (537)
Investments 37 (8)
Tax (84) (40)
Dividend received 61 114
Proceeds on scrapping of assets 1 2
Realised forex (17) (258)
Increase of borrowings and finance lease 77 3 937
Cash flow (787) 1 690
Effect of forex rate change on cash 50 20
Net cash flow (737) 1 710
Cash in bank 454 2 164
Short term loans (1 000) (5 029)
Net cash / (borrowings) (546) (2 865)
23

www.arcelormittalsa.com FINANCIAL SYNOPSIS
Working capital movement (Rm)
2014 2015
Inventories (41) 1 112
Finished products (303) (178)
Work-in-progress 300 348
Raw materials 68 981
Plant spares and stores (106) (39)
Receivables 568 (87)
Payables 638 1 152
Utilisation of provisions (146) (530)
Working capital movement 1 019 1 647
24

www.arcelormittalsa.com FINANCIAL SYNOPSIS
R 3 037
R 485
R 1 635
R 85
R 1 041
R 80
R 977 R 791 R 810
R 448 R 641
-R 1 450
R 464 R 735
-2000
-1000
0
1000
2000
3000
2010 2011 2012 2013 2014 2015
Reline impact EBITDA
EBITDA history – six monthly (Rm)
25

www.arcelormittalsa.com FINANCIAL SYNOPSIS
Net debt evolution – six monthly (Rm)
26
Excluding promissory notes, TSR and suppliers finance
R 5 148 R 3 476 R 2 603 R 419 R 550 R 884 R 1 106 R 285
-R 594 -R 546 -R 2 522 -R 2 865
-3000
-1000
1000
3000
5000
2010 2011 2012 2013 2014 2015

www.arcelormittalsa.com FINANCIAL SYNOPSIS
Key result drivers – EBITDA bridge (Rm)
27
587 5 273
48
297
2 587
1 258
(809)
Act
ual 2
014
Sal
es v
olum
e
Sal
es p
rices
Effi
cien
cies
Oth
er p
urch
ase
pric
e va
rianc
e
Cok
e &
Che
mic
als
Fix
ed c
ost &
oth
er
Act
ual 2
015
Paul O’Flaherty, CEO OTHER KEY ISSUES AND OUTLOOK

www.arcelormittalsa.com OTHER KEY ISSUES AND OUTLOOK
Outlook for H1 2016
Expect higher production and sales volumes following the seasonal slowdown
Expect international steel prices to remain low for at least the first half of 2016
Future profitability is highly dependent on the current initiatives being successfully concluded
• Requisite tariffs as applied for
• Use of local steel for government infrastructure projects
• Fair pricing model
Exchange rate plays important role
Above factors together with us producing to full economic capacity and reducing costs, should
contribute positively to our results
Expected to successfully conclude on the BBBEE deal
Saldanha operation to be reviewed in the next six to nine months
29

Paul O’Flaherty, CEO QUESTIONS