financial report q2 2016 - bdc.ca · and make public a quarterly financial report. the standard on...
TRANSCRIPT

September 30, 2015
SECOND QUARTER
SECOND QUARTER

2
BDC | QUARTERLY FINANCIAL REPORT – SECOND QUARTER 2016 (ended September 30, 2015)
EXECUTIVE SUMMARY
T he Canadian economy grew slightly in June
and July and should complete 2015 with
modest growth. Low world commodity prices
continue to dampen investment in the energy
and mining sectors. As well, other sectors are seeing
a decline in investment that may signal a lack of
confidence in the economy. On the plus side,
Canadian exports rebounded this summer, thanks
largely to a stronger U.S. economy and a weaker
Canadian dollar. Demand for our exports should
continue to be robust for the rest of this year and this
will be the key economic driver for Canada. Finally,
strong employment numbers have led to a significant
rise in consumer spending. Full-time employment has
jumped by 120,000 jobs since the beginning of the
year and by 200,000 over the last 12 months.
Business lending continues at a strong pace but is
showing signs of slowing down. As of August 2015,
total business credit had increased by 7.7% over 12
months, by 4.4% over three months and by 2.4% over
one month. Short-term credit from chartered banks
increased by 3.6% over three months but declined in
August by 3.6%.(1) Long-term credit from chartered
banks increased during the same period.
Looking forward, the Canadian economy is on track
for modest growth throughout 2015. The International
Monetary Fund (IMF) just revised its GDP forecast for
Canada downward from 1.5% to 1.0%. The
Consensus Survey is projecting growth of 1.1% for
2015. However, the outlook is uneven across the
country.
The oil-producing provinces (Alberta, Saskatchewan,
and Newfoundland and Labrador) are feeling the
brunt of declining investment triggered by sharply
falling commodity prices. These provinces will likely
record negative or zero growth this year.
On the other hand, a growth spurt in manufacturing
combined with higher exports to the U.S. will be a
boon to the economies of Quebec, Ontario, Manitoba
and British Columbia. These provinces will
experience stronger growth in 2015.
In this context, BDC works to ensure that small and
medium-sized businesses have the support they need
to grow and succeed. Clients of Financing(2) accepted
$1.2 billion in loans this quarter, the same amount as
last year.
As at September 30, 2015, Financing’s(2) loan
portfolio, before allowance for credit losses, stood at
$19.5 billion, a 3.2% increase since March 31, 2015.
BDC continued to focus on small loans while also
meeting the need for larger loans, notably by
medium-sized businesses, and participating in
financial transactions with other financial institutions.
During the quarter, 3,088 clients of Financing and
Growth & Transition Capital accepted loans of
$500,000 or less for a total of $278.7 million,
compared to 1,989 clients and $210.0 million for the
same period last year. For the six months ended
September 30, 2015, 5,672 clients accepted loans of
$500,000 or less for a total of $534.9 million,
compared to 4,052 clients and $425.5 million last
year.
(1) Source of data in this paragraph: Bank of Canada.
(2) Unless otherwise indicated, Financing excludes Growth & Transition Capital.
The Business Development Bank of Canada (BDC) is a Crown corporation wholly owned by the Government of Canada.
Our mission is to help create and develop Canadian businesses through financing, venture capital and consulting services, with a focus on small and medium-sized enterprises.
When entrepreneurs succeed, they make an irreplaceable contribution to Canada’s economy. Supporting them is in our national interest.
3
BDC | QUARTERLY FINANCIAL REPORT – SECOND QUARTER 2016 (ended September 30, 2015)
EXECUTIVE SUMMARY
Growth & Transition Capital continued to support the
growth plans of Canadian entrepreneurs through its
diverse product offerings, with clients accepting
$59.8 million in financing in the second quarter, for a
total of $120.8 million for the six-month period,
compared to $58.1 million and $92.7 million,
respectively, for the same periods last year.
To support innovative Canadian companies and
create the conditions for success in the venture
capital ecosystem, Venture Capital authorized
investments totalling $37.7 million in the second
quarter, compared to $30.1 million in the same period
last year. For the six-month period ended
September 30, a total of $93.2 million was authorized,
compared to $70.3 million in the same period last
year.
BDC Capital’s Strategic Investments and
Partnerships (SIP) team continued to develop
initiatives to support key areas of the venture capital
ecosystem. It makes investments in specialized
funds, accelerators and graduates of accelerators. As
at September 30, 2015, the SIP team had invested in
136 start-ups, representing $22.0 million.
During the quarter, BDC continued the deployment of
the Venture Capital Action Plan (VCAP), a federal
government initiative to invest $400 million to
increase private-sector venture capital financing for
high-potential, innovative Canadian businesses.
VCAP authorized $15.0 million in investments during
the second quarter, for a total of $25.9 million for the
six-month period ended September 30, 2015. VCAP
continued to show strong momentum; the funds of
funds have raised a total of $1.1 billion to date. As at
September 30, 2015, the total VCAP portfolio stood at
$83.6 million, compared to $47.6 million as at March
31, 2015.
BDC is maintaining its role in the securitization
market, where small and medium-sized enterprises
(SMEs) access financing for the vehicles and
equipment they need to improve productivity. As at
September 30, total asset-backed securities stood at
$499.4 million, compared to $407.7 million as at
March 31. For the six-month period ended September
30, 2015, disbursements totalled $196.2 million,
compared to $107.7 million for the same period last
year.
During the second quarter, BDC’s newly created unit
called BDC Advantage continued to build a team of
experts dedicated to helping high-impact firms and to
offer a full range of non-financial services to
entrepreneurs, together with its existing Consulting
business.
In the second quarter of fiscal 2016, BDC posted
consolidated net income of $140.8 million,(3)
compared to $137.1 million(3) for the same period last
year. The increase was mostly attributable to lower
net realized losses on subordinate financing
investments. Net income for the first half of fiscal
2016 was $311.8 million,(4) $53.0 million higher than
the $258.8(4) million recorded last year.
For the quarter, consolidated total comprehensive
income was $116.9 million, compared to
$102.8 million for the same period last year. The
decrease in other comprehensive loss was mostly
due to lower remeasurement loss on the net defined
benefit asset or liability. Refer to the consolidated
comprehensive income section for further information.
For the six-month period, total comprehensive income
was $359.8 million, compared to $197.7 million for the
same period last year.
During the second quarter, BDC signed an agreement
to provide the Laurentian Bank of Canada with a
guarantee on a portfolio of commercial equipment
financing of up to $300 million that will focus mainly
on the manufacturing, oil and gas, and forestry
sectors. Through this Portfolio Guarantee Program,
BDC will indirectly increase its reach and provide
SMEs with more access to capital.
(3) Including $2.0 million and $1.3 million in net loss attributable to non-controlling interests for fiscal 2016 and 2015, respectiv ely .
(4) Including $1.3 million and $1.0 million in net loss attributable to non-controlling interests for fiscal 2016 and 2015, respectiv ely .

4
BDC | QUARTERLY FINANCIAL REPORT – SECOND QUARTER 2016 (ended September 30, 2015)
EXECUTIVE SUMMARY
In August, BDC signed a partnership agreement
with Futurpreneur Canada and the Royal Bank of
Canada (RBC). This will allow Futurpreneur
Canada to provide more loans to aspiring young
entrepreneurs. The partnership involves RBC
extending a $20 million line of credit 100%
guaranteed by BDC so Futurpreneur Canada can
borrow a portion of the loan capital it provides to
young entrepreneurs.

BDC | QUARTERLY FINANCIAL REPORT – SECOND QUARTER 2016 (ended September 30, 2015)
TABLE OF CONTENTS
6 Management Discussion and Analysis
6 Context of the Quarterly Financial Report
6 Risk Management
7 Analysis of Financial Results
17 Consolidated Financial Statements
From time to time, we make written or oral forward-looking statements. We may make forward-looking statements in this quarterly financial report. These forward-looking statements include, but
are not l imited to, statements about objectives and strategies for achieving objectives, as well as statements about outlooks, plans, expectations, anticipations, estimates and intentions.
By their very nature, forward-looking statements involve numerous factors and assumptions, and
they are subject to inherent risks and uncertainties, both general and specific. These uncertainties give rise to the possibil ity that predictions, forecasts, projections and other elements of forward -
looking statements will not be achieved. A number of important factors could cause actual results
to differ materially from the expectations expressed.

6
BDC | QUARTERLY FINANCIAL REPORT – SECOND QUARTER 2016 (ended September 30, 2015)
MANAGEMENT DISCUSSION AND ANALYSIS
CONTEXT OF THE QUARTERLY FINANCIAL REPORT
The Financial Administration Act requires that all departments and parent Crown corporations prepare
and make public a quarterly financial report. The Standard on Quarterly Financial Reports for Crown
Corporations is issued by the Treasury Board of Canada Secretariat to provide parent Crown
corporations with the form and content of the quarterly financial report under the authority of section
131.1 of the Financial Administration Act. There is no requirement for an audit or review of the financial
statements included in the quarterly financial report. Therefore, the condensed quarterly Consolidated
Financial Statements included in this report have not been audited or reviewed by an ex ternal auditor.
RISK MANAGEMENT
Risk is an inherent feature of the financial sector. BDC uses sound practices of enterprise risk
management (ERM).
BDC manages risk through the development and communication of policies; the establishment of formal
risk reviews and approval processes; and the establishment of limits and delegation of authorities. The
Board of Directors and its Credit and Risk Committee review quarterly ERM reports and monitor the
effectiveness of BDC’s ERM practices. In each line of business, management ensures that governance
activities, controls, processes and procedures are consistent with BDC’s sound ERM practices.
No significant changes were made to BDC’s ERM practices and no new risks were identified during the
quarter ended September 30, 2015.

7
BDC | QUARTERLY FINANCIAL REPORT – SECOND QUARTER 2016 (ended September 30, 2015)
MANAGEMENT DISCUSSION AND ANALYSIS
ANALYSIS OF FINANCIAL RESULTS
Analysis of financial results is provided to enable a reader to assess BDC’s results of operations and
financial condition for the three-month and the six-month periods ended September 30, 2015, compared
to the corresponding periods of the prior fiscal year. This analysis also includes comments about
significant variances from BDC’s fiscal 2016–20 Corporate Plan, when applicable.
BDC reports on six business segments: Financing, Growth & Transition Capital, Venture Capital, BDC
Advantage, Securitization and Venture Capital Action Plan (VCAP). BDC Advantage is a newly created
segment that comprises non-financial activities, including Consulting and High-Impact Firms. Refer to
BDC Advantage results and Note 12—Segmented Information to the financial statements for more
information. All amounts are in Canadian dollars, unless otherwise specified, and are based on unaudited
condensed quarterly Consolidated Financial Statements prepared in accordance with Internat ional
Financial Reporting Standards (IFRS).
This analysis should be read in conjunction with the unaudited condensed quarterly Consolidated
Financial Statements included in this report and the audited annual Consolidated Financial Statements in
the fiscal 2015 Annual Report.
Consolidated net income
Three months ended September 30
BDC reported consolidated net income of $140.8 million for the second quarter ended
September 30, 2015, comprising $142.8 million attributable to BDC’s shareholder and a net loss of $2.0
million to non-controlling interests. This compares to $137.1 million in consolidated net income for the
second quarter of fiscal 2015, of which a net loss of $1.3 million was attributable to non-controlling
interests.
($ in millions) F2016 F2015 F2016 F2015
Financing 121.8 120.8 243.2 239.6
Growth & Transition Capital 16.5 13.0 21.6 16.3
Venture Capital 11.9 10.3 66.1 15.3
BDC Advantage (7.5) (5.8) (15.0) (11.2)
Securitization 0.6 1.0 1.2 2.0
Venture Capital Action Plan (2.5) (2.2) (5.3) (3.2)
Net income 140.8 137.1 311.8 258.8
Net income attributable to:
BDC's shareholder 142.8 138.4 313.1 259.8
Non-controlling interests (2.0) (1.3) (1.3) (1.0)
Net income 140.8 137.1 311.8 258.8
Three months ended
September 30
Six months ended
September 30

8
BDC | QUARTERLY FINANCIAL REPORT – SECOND QUARTER 2016 (ended September 30, 2015)
MANAGEMENT DISCUSSION AND ANALYSIS
Net income in the second quarter of fiscal 2016 was higher than in the corresponding period of fiscal
2015, due primarily to higher net income from Growth & Transition Capital. Refer to the Growth &
Transition Capital section of this analysis for further information.
Six months ended September 30
BDC’s consolidated net income was $311.8 million for the six months ended September 30, 2015, which
was higher than the $258.8 million recorded for the same period last year.
Currently, BDC expects its consolidated net income for fiscal 2016 to exceed the Corporate Plan target of
$423 million.
Consolidated comprehensive income
Three and six months ended September 30
Consolidated total comprehensive income for the second quarter was $116.9 million, comprising $140.8
million in consolidated net income and $23.9 million in other comprehensive loss. For the six-month
period ended September 30, 2015, BDC reported total comprehensive income of $359.8 million,
comprising $311.8 million in net income and $48.0 million in other comprehensive income.
($ in millions) F2016 F2015 F2016 F2015
Net income 140.8 137.1 311.8 258.8
Other comprehensive income (loss)
Items that may be reclassified subsequently
to net income
Net change in unrealized gains (losses)
on available-for-sale assets (0.8) (0.4) (1.3) (0.9)
Net change in unrealized gains (losses)
on cash flow hedges 0.1 (0.5) (0.9) (1.0)
Total items that may be reclassified
subsequently to net income (0.7) (0.9) (2.2) (1.9)
Items that will not be reclassified to net income
Remeasurements of net defined
benefit asset or liability (23.2) (33.4) 50.2 (59.2)
Other comprehensive income (loss) (23.9) (34.3) 48.0 (61.1)
Total comprehensive income 116.9 102.8 359.8 197.7
Total comprehensive income attributable to:
BDC's shareholder 118.9 104.1 361.1 198.7
Non-controlling interests (2.0) (1.3) (1.3) (1.0)
Total comprehensive income 116.9 102.8 359.8 197.7
Three months ended
September 30
Six months ended
September 30

9
BDC | QUARTERLY FINANCIAL REPORT – SECOND QUARTER 2016 (ended September 30, 2015)
MANAGEMENT DISCUSSION AND ANALYSIS
BDC recorded other comprehensive loss of $23.9 million and other comprehensive income of $48.0
million, respectively, for the second quarter and the six-month period ended September 30, 2015,
compared to other comprehensive loss of $34.3 million and $61.1 million for the same periods last year.
Remeasurements of net defined benefit asset or liability of $23.2 million contributed to the decrease in
other comprehensive loss in the second quarter compared to the same period last year. For the most
part, these losses were caused by lower returns on pension plan assets, partially offset by higher
discount rates used to value the net defined benefit asset or liability .
Financing results
Three and six months ended September 30
Financing’s net income was $121.8 million for the second quarter of fiscal 2016 and $243.2 million for the
six-month period ended September 30, 2015, compared to $120.8 million and $239.6 million,
respectively, for the same periods last year. The increase in profitability was mostly due to higher net
interest and fee income, mainly driven by portfolio growth. During the second quarter of fiscal 2016, a
$10.0 million provision for collective credit losses was recorded, mainly to reflect the growth of the
($ in millions) F2016 F2015 F2016 F2015
Net interest and fee income 242.4 223.3 479.2 442.7
Provision for credit losses (33.5) (19.3) (61.6) (36.7)
Net gains (losses) on other
financial instruments 2.4 (0.3) 3.6 (1.1)
Income before operating and
administrative expenses 211.3 203.7 421.2 404.9
Operating and administrative expenses 89.5 82.9 178.0 165.3
Net income from Financing 121.8 120.8 243.2 239.6
As % of average portfolio F2016 F2015 F2016 F2015
Net interest and fee income 5.0 4.9 5.0 4.9
Provision for credit losses (0.7) (0.4) (0.6) (0.4)
Net gains (losses) on other
financial instruments - - - -
Income before operating and
administrative expenses 4.3 4.5 4.4 4.5
Operating and administrative expenses 1.8 1.8 1.8 1.8
Net income from Financing 2.5 2.7 2.6 2.7
Three months ended
September 30
Six months ended
September 30
Three months ended
September 30
Six months ended
September 30

10
BDC | QUARTERLY FINANCIAL REPORT – SECOND QUARTER 2016 (ended September 30, 2015)
MANAGEMENT DISCUSSION AND ANALYSIS
portfolio. Despite the increase in the provision for credit losses, the level of losses remained low, at 0.6%
of the average portfolio for the six-month period ended September 30, 2015.
Operating and administrative expenses for both the three-month and six-month periods ended
September 30, 2015, were higher than those in the corresponding periods last year. This was mainly due
to higher staff levels, as BDC has launched an initiative aimed at increasing its presence in Western
Canada and Ontario, to ensure that entrepreneurs in these regions are not under-served. However, as a
percentage of the average portfolio, operating and administrative expenses were comparable to those in
the same period last year.
Growth & Transition Capital results
Three months ended September 30
Growth & Transition Capital’s net income for the second quarter of fiscal 2016 was $16.5 million,
compared to net income of $13.0 million for the same period last year.
Net revenue on investments of $22.6 miillion for the second quarter was higher than the $6.3 million
recorded last year, mainly due to lower write-offs ($10.9 million), higher realized gains on investments
($2.0 million), higher net interest income ($2.8 million) and higher fee and other income ($0.6 million).
The net change in unrealized appreciation of investments of $1.2 million for the quarter included the
following:
> a $0.3 million net fair value appreciation ($1.2 million net fair value appreciation for the same
period last year); and
($ in millions) F2016 F2015 F2016 F2015
Net revenue on investments 22.6 6.3 42.0 20.1
Net change in unrealized appreciation
(depreciation) of investments 1.2 13.0 (5.8) 9.1
Income before operating and
administrative expenses 23.8 19.3 36.2 29.2
Operating and administrative expenses 7.3 6.3 14.6 12.9
Net income from
Growth & Transition Capital 16.5 13.0 21.6 16.3
Net income attributable to:
BDC's shareholder 15.8 12.8 20.6 15.6
Non-controlling interests 0.7 0.2 1.0 0.7
Net income from
Growth & Transition Capital 16.5 13.0 21.6 16.3
Three months ended
September 30
Six months ended
September 30
11
BDC | QUARTERLY FINANCIAL REPORT – SECOND QUARTER 2016 (ended September 30, 2015)
MANAGEMENT DISCUSSION AND ANALYSIS
> a reversal of net fair value depreciation due to net realized losses totalling $0.9 million (reversal
of net fair value depreciation due to net realized losses of $11.8 million for the same period last
year).
Six months ended September 30
For the six months ended September 30, 2015, Growth & Transition Capital recorded net income of
$21.6 million, higher than the $16.3 million recorded for the same period last year.
Net revenue on investments was $21.9 million higher than the $20.1 million recorded in the same period
last year due to higher net interest income as a result of portfolio growth ($2.8 million), lower fee and
other income ($0.3 million), higher realized gains on investments ($1.2 million) and lower write-offs net of
recovery ($18.2 million),
The net change in unrealized depreciation of investments of $5.8 million for the six months ended
September 30, 2015, included the following:
> a $5.0 million net fair value depreciation ($4.0 million net fair value depreciation for the same
period last year); and
> a reversal of net fair value appreciation due to net realized gains totalling $0.8 million (reversal of
net fair value depreciation due to net realized losses of $13.1 million for the same period last
year).
Operating and administrative expenses amounted to $14.6 million, higher than the $12.9 million recorded
last year as a result of higher staff levels required to fully support the growth and transition plans of
companies in all areas of Canada.

12
BDC | QUARTERLY FINANCIAL REPORT – SECOND QUARTER 2016 (ended September 30, 2015)
MANAGEMENT DISCUSSION AND ANALYSIS
Venture Capital results
Three months ended September 30
During the second quarter of fiscal 2016, Venture Capital recorded net income of $11.9 million, compared
to net income of $10.3 million for the same period last year. The increase in net income was mainly due
to higher net revenue on investments and higher net unrealized foreign exchange gains on investments,
offset by a decrease in unrealized appreciation of investments.
Net revenue on investments increased by $19.8 million, primarily due to higher net realized gains on
investments and lower write-offs.
The net change in unrealized depreciation of investments of $17.5 million was $36.5 million lower than
the $19.0 million net change in unrealized appreciation recorded last year and included the following:
> a $9.1 million net fair value depreciation of the portfolio ($14.3 million net fair value appreciation
for the same period last year); and
> a reversal of net fair value appreciation on divested investments and write-offs totalling
$8.4 million (a reversal of $4.7 million of net fair value depreciation on divested investments and
write-offs for the same period last year).
Six months ended September 30
For the six months ended September 30, 2015, Venture Capital recorded net income of $66.1 million,
compared to net income of $15.3 million for the same period last year.
($ in millions) F2016 F2015 F2016 F2015
Net revenue (loss) on investments 14.0 (5.8) 16.9 (5.2)
Net change in unrealized appreciation
(depreciation) of investments (17.5) 19.0 40.2 29.8
Net unrealized foreign exchange
gains (losses) on investments 20.8 9.0 19.4 2.8
Net gains (losses) on other
financial instruments (0.4) (6.7) (0.1) (1.7)
Income before operating and
administrative expenses 16.9 15.5 76.4 25.7
Operating and administrative expenses 5.0 5.2 10.3 10.4
Net income from Venture Capital 11.9 10.3 66.1 15.3
Net income attributable to:
BDC's shareholder 14.5 11.8 68.4 17.0
Non-controlling interests (2.6) (1.5) (2.3) (1.7)
Net income from Venture Capital 11.9 10.3 66.1 15.3
Three months ended
September 30
Six months ended
September 30

13
BDC | QUARTERLY FINANCIAL REPORT – SECOND QUARTER 2016 (ended September 30, 2015)
MANAGEMENT DISCUSSION AND ANALYSIS
Net revenue on investments was $16.9 million for the six months ended September 30, 2015, compared
to net loss on investments of $5.2 million for the same period last year.
The net change in unrealized appreciation of investments of $40.2 million for the six-month period ended
September 30, 2015, included the following:
> a $46.0 million net fair value appreciation of the portfolio ($24.3 million fair value appreciation for
the same period last year); and
> a reversal of net fair value appreciation on divested investments and write-offs totalling $5.8
million (a reversal of $5.5 million of net fair value depreciation for the same period last year).
Net unrealized foreign exchange gains or losses on investments were due to foreign exchange
fluctuations on the U.S. dollar. During the third quarter of fiscal 2015, BDC discontinued hedging U.S.
dollar investments and only uses foreign exchange contracts to hedge U.S. dollar proceeds expected to
be received.
BDC Advantage results
Three and six months ended September 30
During the first quarter of fiscal 2016, BDC undertook the first steps in setting up a team of experts
dedicated to helping high-impact firms and created a new unit called BDC Advantage. BDC’s existing
consulting services were also moved into the new unit. This team will work in collaboration with third
parties to facilitate high-impact firms’ access to other services that exist—or need to be developed—in
the entrepreneurial ecosystem. The initial focus of the team will be on the following areas:
˃ Develop the ability to provide long-term, unbiased advice. We will expand our advisory team with
highly experienced individuals who can help entrepreneurs assess their needs, and provide
advice on a long-term and objective basis.
˃ Develop a service offering specifically tailored for high-impact firms. To address the challenges
faced by high-impact firms, in addition to its existing service offerings, new BDC offerings could
include formal management training, peer-to-peer networking and other highly tailored non-
financial services. We will offer these services by leveraging our own expert resources and
consultant networks, and by partnering with third-party organizations.
BDC Advantage provides its non-financial services on a fee-for-service basis. However, management
maintains that, given the nature of the market segments in which we operate, full cost recovery cannot be
($ in millions) F2016 F2015 F2016 F2015
Revenue 3.6 4.5 7.2 8.6
Operating and administrative expenses 11.1 10.3 22.2 19.8
Net loss from BDC Advantage (7.5) (5.8) (15.0) (11.2)
Three months ended
September 30
Six months ended
September 30

14
BDC | QUARTERLY FINANCIAL REPORT – SECOND QUARTER 2016 (ended September 30, 2015)
MANAGEMENT DISCUSSION AND ANALYSIS
expected on these activities. Management believes that BDC’s non-financial services have a significant
positive impact on Canadian small and medium-sized enterprises and the broader economy.
BDC Advantage’s net loss was $7.5 million for the second quarter of fiscal 2016, compared to a $5.8
million net loss recorded for the same quarter last year. Cumulative net loss for the six-month period
ended September 30, 2015, was $15.0 million, compared to $11.2 million for the same period last year.
Revenues were $3.6 million and $7.2 million, respectively, for the second quarter and the first six months
of fiscal 2016, lower than the $4.5 million and $8.6 million recorded for the same periods last year.
On a year-to-date basis, operating and administrative expenses of $22.2 million were $2.4 million higher
than those recorded in the same period of fiscal 2015, as BDC continued to allocate resources and build
a team of experts to offer a range of non-financial support to entrepreneurs, including high-impact firms.
Securitization results
Three and six months ended September 30
Net income from Securitization for the second quarter of fiscal 2016 was $0.6 million, for a total of $1.2
million for the six-month period ended September 30, 2015. These figures compare to net income from
Securitization of $1.0 million and $2.0 million, respectively, for the same periods last year.
The decrease in income was due to lower net interest and fee income as a result of a decrease in the
yield.
Operating and administrative expenses for the three-month and six-month periods ended September 30,
2015, were slightly higher than those reported for the same period last year.
($ in millions) F2016 F2015 F2016 F2015
Net interest and fee income 1.2 1.5 2.3 2.9
Income before operating and
administrative expenses 1.2 1.5 2.3 2.9
Operating and administrative expenses 0.6 0.5 1.1 0.9
Net income from Securitization 0.6 1.0 1.2 2.0
Three months ended
September 30
Six months ended
September 30

15
BDC | QUARTERLY FINANCIAL REPORT – SECOND QUARTER 2016 (ended September 30, 2015)
MANAGEMENT DISCUSSION AND ANALYSIS
Venture Capital Action Plan results
Three and six months ended September 30
During the second quarter of fiscal 2016, Venture Capital Action Plan (VCAP) recorded a net loss of $2.5
million, mostly as a result of a net change in unrealized depreciation of investments of $2.5 million. For
the six months ended September 30, 2015, VCAP recorded a net loss of $5.3 million, compared to a net
loss of $3.2 million for the same period last year. These losses were anticipated early in the program.
On a year-to-date basis, operating and administrative expenses of $0.4 million were comparable to those
recorded in the same period of fiscal 2015.
Consolidated Statement of Financial Position and Cash Flows
As at September 30, 2015, total BDC assets amounted to $22.0 billion, an increase of $0.9 billion from
March 31, 2015, mainly due to the increase in loans and investments.
At $19.0 billion, the loan portfolio represented BDC’s largest asset ($19.5 billion in gross portfolio and a
$0.5 billion allowance for credit losses). The gross loan portfolio grew by 3.2% in the six months after
March 31, 2015.
As for BDC’s investment portfolios, the subordinate financing portfolio stood at $670.7 million, compared
to $642.8 million as at March 31, 2015. Net investment disbursements accounted for most of the increase
in this portfolio. The venture capital portfolio was $827.5 million as at September 30, 2015, compared to
$709.6 million as at March 31, 2015. The increase in this portfolio was mainly due to net investment
disbursements and to gains on conversion of the U.S. dollar portfolio. The venture capital action plan
portfolio stood at $83.6 million, compared to $47.6 million as at March 31, 2015. Investment
disbursements accounted for most of the increase.
The asset-backed securities (ABS) portfolio stood at $499.4 million, compared to $407.7 million as at
March 31, 2015. The increase in the portfolio was due to net disbursements of securities purchased
under the Funding Platform for Independent Lenders (F-PIL) program.
($ in millions) F2016 F2015 F2016 F2015
Net revenue (loss) on investments 0.2 0.1 0.1 0.2
Net change in unrealized appreciation
(depreciation) of investments (2.5) (2.1) (5.0) (3.0)
Income (loss) before operating and
administrative expenses (2.3) (2.0) (4.9) (2.8)
Operating and administrative expenses 0.2 0.2 0.4 0.4
Net income (loss) from
Venture Capital Action Plan (2.5) (2.2) (5.3) (3.2)
Three months ended
September 30
Six months ended
September 30

16
BDC | QUARTERLY FINANCIAL REPORT – SECOND QUARTER 2016 (ended September 30, 2015)
MANAGEMENT DISCUSSION AND ANALYSIS
Derivative assets of $48.7 million and derivative liabilities of $6.6 million reflected the fair value of
derivative financial instruments as at September 30, 2015. Net derivative fair value decreased by
$3.7 million, compared to the fair value as at March 31, 2015, primarily due to a decrease in fair value, as
well as to maturities and redemptions.
As at September 30, 2015, BDC recorded a net defined benefit asset of $131.6 million related to the
registered pension plan, and a net defined benefit liability of $200.0 million for the other plans, for a total
net defined benefit liability of $68.4 million. This represents a decrease of $50.9 million compared to the
total net defined benefit liability as at March 31, 2015, primarily as the result of remeasurement gains on
the net defined benefit asset or liability recorded during the six-month period ended September 30, 2015.
Refer to page 9 of this report for further information on remeasurements of net defined benefit asset or
liability.
BDC holds cash and cash equivalents in accordance with its Treasury Risk Policy. The Bank’s liquidities,
which ensure funds are available to meet BDC’s cash outflows, totalled $672.4 million as at
September 30, 2015, compared to $667.1 million as at March 31, 2015. For the six-month period ended
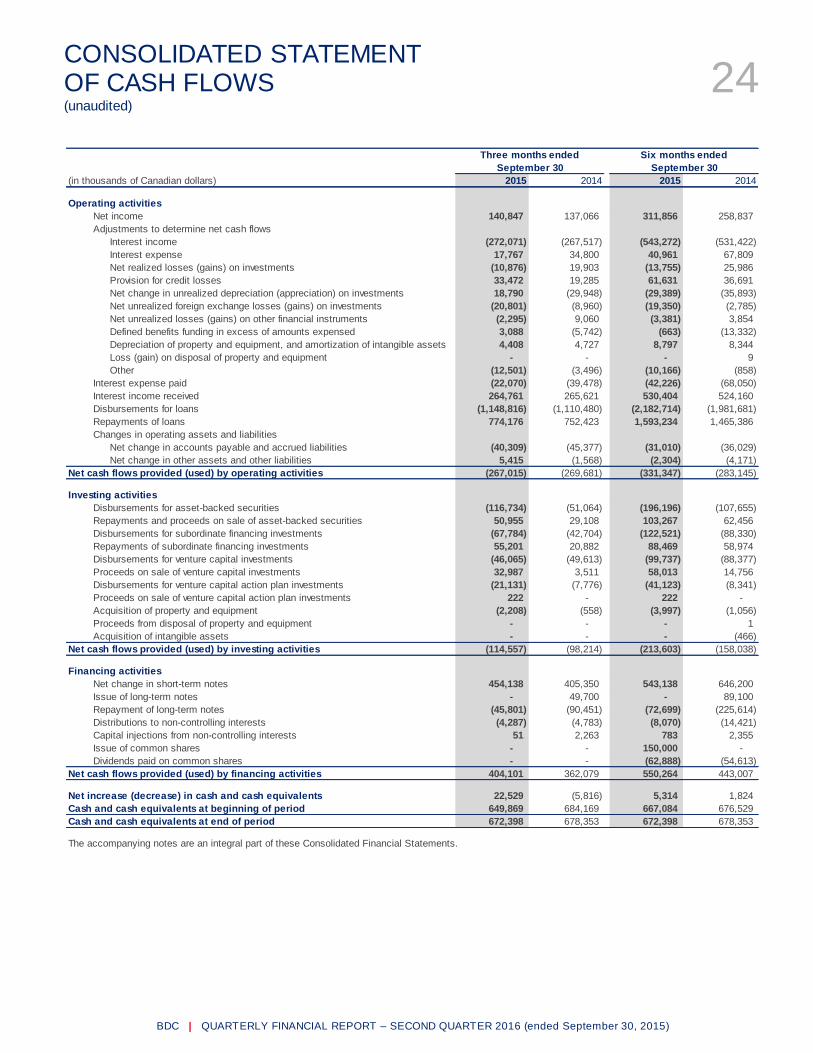
September 30, 2015, cash flow used by investing activities amounted to $213.6 million, as a result of net
disbursements of subordinate financing and venture capital investments, and ABS. Financing activities
provided $550.3 million in cash flow, mainly as a result of the issuance of short-term notes and common
shares, partially offset by the repayment of long-term notes and the payment of dividends, while
operating activities used $331.3 million, mainly due to the increase in the loans portfolio.
As at September 30, 2015, BDC funded its portfolios and liquidities with borrowings of $16.4 billion and
total equity of $5.2 billion. Borrowings comprised $16.0 billion in short-term notes and $0.4 billion in long-
term notes.

BDC | QUARTERLY FINANCIAL REPORT – SECOND QUARTER 2016 (ended September 30, 2015)
CONSOLIDATED FINANCIAL STATEMENTS (unaudited, in thousands of Canadian dollars)
18 Management’s Responsibility for Financial Information
19 Consolidated Statement of Financial Position
20 Consolidated Statement of Income
21 Consolidated Statement of Comprehensive Income
22 Consolidated Statement of Changes in Equity
24 Consolidated Statement of Cash Flows
25 Notes to the Consolidated Financial Statements
25 Note 1 BDC General Description 25 Note 2 Basis of Preparation 25 Note 3 Significant Accounting Policies
26 Note 4 Significant Accounting Judgements, Estimates
and Assumptions 27 Note 5 Classification and Fair Value of Financial
Instruments 30 Note 6 Asset-Backed Securities 31 Note 7 Loans 32 Note 8 Subordinate Financing Investments 33 Note 9 Venture Capital Investments
34 Note 10 Venture Capital Action Plan Investments 34 Note 11 Share Capital 35 Note 12 Segmented Information 38 Note 13 Guarantees
38 Note 14 Commitments 40 Note 15 Related Party Transactions

18
BDC | QUARTERLY FINANCIAL REPORT – SECOND QUARTER 2016 (ended September 30, 2015)
MANAGEMENT’S RESPONSIBILITY FOR FINANCIAL INFORMATION Management is responsible for the preparation and fair presentation of these condensed quarterly Consolidated Financial Statements in accordance with the Treasury Board of Canada Standard on Quarterly Financial Reports for Crown Corporations, and for such internal controls as management determines are necessary to enable the preparation of condensed quarterly Consolidated Financial Statements that are free from material misstatement. Management is also responsible for ensuring all other information in this quarterly financial report is consistent, where appropriate, with the quarterly Consolidated Financial Statements.
Based on our knowledge, these unaudited condensed quarterly Consolidated Financial Statements present fairly, in all material respects, the financial position, results of operations and cash flows of the corporation, as at the date of and for the periods presented in the condensed quarterly Consolidated Financial Statements.
Michael Denham President and Chief Executive Officer
Paul Buron, CPA, CA Executive Vice President, Chief Financial and Risk Officer
Montreal, Canada November 4, 2015

19
BDC | QUARTERLY FINANCIAL REPORT – SECOND QUARTER 2016 (ended September 30, 2015)
CONSOLIDATED STATEMENT OF FINANCIAL POSITION (unaudited)
September 30, March 31,
(in thousands of Canadian dollars) Notes 2015 2015
ASSETS
Cash and cash equivalents 672,398 667,084
Derivative assets 48,655 53,322
Loans and investments
Asset-backed securities 6 499,404 407,731
Loans 7 18,962,791 18,414,044
Subordinate financing investments 8 670,651 642,810
Venture capital investments 9 827,540 709,639
Venture capital action plan investments 10 83,552 47,643
Total loans and investments 21,043,938 20,221,867
Property and equipment 24,926 24,435
Intangible assets 43,670 48,961
Net defined benefit asset 131,630 100,429
Other assets 17,765 12,919
Total assets 21,982,982 21,129,017
LIABILITIES AND EQUITY
Liabilities
Accounts payable and accrued liabilities 70,986 101,996
Derivative liabilities 6,648 7,515
Borrowings
Short-term notes 15,977,878 15,435,747
Long-term notes 469,916 548,709
Total borrowings 16,447,794 15,984,456
Net defined benefit liability 199,987 219,664
Other liabilities 38,808 36,266
Total liabilities 16,764,223 16,349,897
Equity
Share capital 11 2,288,400 2,138,400
Contributed surplus 27,778 27,778
Retained earnings 2,870,916 2,570,454
Accumulated other comprehensive income 5,677 7,934
Equity attributable to BDC's shareholder 5,192,771 4,744,566
Non-controlling interests 25,988 34,554
Total equity 5,218,759 4,779,120
Total liabilities and equity 21,982,982 21,129,017
Guarantees (Note 13)
Commitments (Note 14)
The accompanying notes are an integral part of these Consolidated Financial Statements.

20
BDC | QUARTERLY FINANCIAL REPORT – SECOND QUARTER 2016 (ended September 30, 2015)
CONSOLIDATED STATEMENT OF INCOME (unaudited)
(in thousands of Canadian dollars) 2015 2014 2015 2014
Interest income 272,071 267,517 543,272 531,422
Interest expense 17,767 34,800 40,961 67,809
Net interest income 254,304 232,717 502,311 463,613
NET_REAL_INV Net realized gains (losses) on investments 10,876 (19,903) 13,755 (25,986)
Consulting revenue 3,618 4,486 7,172 8,605
Fee and other income 15,114 12,476 24,588 23,042
Net realized gains (losses) on other financial instruments (210) 2,038 189 1,075
Net revenue 283,702 231,814 548,015 470,349
Provision for credit losses (33,472) (19,285) (61,631) (36,691)
Net change in unrealized appreciation (depreciation) of investments (18,790) 29,948 29,389 35,893
Net unrealized foreign exchange gains (losses) on investments 20,801 8,960 19,350 2,785
Net unrealized gains (losses) on other financial instruments 2,295 (9,060) 3,381 (3,854)
Income before operating and administrative expenses 254,536 242,377 538,504 468,482
Salaries and benefits 81,376 73,942 161,994 145,970
Premises and equipment 11,695 12,119 23,313 22,770
Other expenses 20,618 19,250 41,341 40,905
Operating and administrative expenses 113,689 105,311 226,648 209,645
Net income 140,847 137,066 311,856 258,837
Net income attributable to:
BDC's shareholder 142,778 138,354 313,135 259,773
Non-controlling interests (1,931) (1,288) (1,279) (936)
Net income 140,847 137,066 311,856 258,837
The accompanying notes are an integral part of these Consolidated Financial Statements and Note 12 provides additional information on
segmented net income.
Six months endedThree months ended
September 30September 30

21
BDC | QUARTERLY FINANCIAL REPORT – SECOND QUARTER 2016 (ended September 30, 2015)
CONSOLIDATED STATEMENT OF COMPREHENSIVE INCOME (unaudited)
(in thousands of Canadian dollars) 2015 2014 2015 2014
Net income 140,847 137,066 311,856 258,837
Other comprehensive income (loss)
Items that may be reclassified subsequently to net income
Net change in unrealized gains (losses) on available-for-sale assets (868) (415) (1,262) (872)
OCI_UNREAL_CFH Net unrealized gains (losses) on cash flow hedges 141 (322) (907) (752)
OCI_CFH_RECLASS Reclassification to net income of losses (gains) on cash flow hedges (44) (119) (88) (238)
Net change in unrealized gains (losses) on cash flow hedges 97 (441) (995) (990)
Total items that may be reclassified subsequently to net income (771) (856) (2,257) (1,862)
Items that will not be reclassified to net income
OCI_PENSION Remeasurements of net defined benefit asset or liability (23,171) (33,360) 50,215 (59,200)
Other comprehensive income (loss) (23,942) (34,216) 47,958 (61,062)
Total comprehensive income 116,905 102,850 359,814 197,775
Total comprehensive income attributable to:
BDC's shareholder 118,836 104,138 361,093 198,711
Non-controlling interests (1,931) (1,288) (1,279) (936)
Total comprehensive income 116,905 102,850 359,814 197,775
The accompanying notes are an integral part of these Consolidated Financial Statements.
September 30 September 30
Six months endedThree months ended

22
BDC | QUARTERLY FINANCIAL REPORT – SECOND QUARTER 2016 (ended September 30, 2015)
CONSOLIDATED STATEMENT OF CHANGES IN EQUITY For the three-month period ended September 30 (unaudited)
Equity
attributable Non-
Share Contributed Retained Available- Cash flow to BDC's controlling Total
(in thousands of Canadian dollars) capital surplus earnings for-sale assets hedges Total shareholder interests equity
Balance as at June 30, 2015 2,288,400 27,778 2,751,309 3,553 2,895 6,448 5,073,935 32,155 5,106,090
Total comprehensive income
Net income 142,778 142,778 (1,931) 140,847
Other comprehensive income (loss)
Net change in unrealized gains (losses) on available-for-sale assets (868) (868) (868) (868)
Net change in unrealized gains (losses) on cash flow hedges 97 97 97 97
Remeasurements of net defined benefit asset or liability (23,171) (23,171) (23,171)
Other comprehensive income (loss) - - (23,171) (868) 97 (771) (23,942) - (23,942)
Total comprehensive income - - 119,607 (868) 97 (771) 118,836 (1,931) 116,905
Distributions to non-controlling interests (4,287) (4,287)
Capital injections from non-controlling interests 51 51
Transactions with owner, recorded directly in equity - - - - - - - (4,236) (4,236)
Balance as at September 30, 2015 2,288,400 27,778 2,870,916 2,685 2,992 5,677 5,192,771 25,988 5,218,759
Equity
attributable Non-
Share Contributed Retained Available- Cash flow to BDC's controlling Total
(in thousands of Canadian dollars) capital surplus earnings for-sale assets hedges Total shareholder interests equity
Balance as at June 30, 2014 2,138,400 27,778 2,208,245 1,750 2,697 4,447 4,378,870 41,945 4,420,815
Total comprehensive income
Net income 138,354 138,354 (1,288) 137,066
Other comprehensive income (loss)
Net change in unrealized gains (losses) on available-for-sale assets (415) (415) (415) (415)
Net change in unrealized gains (losses) on cash flow hedges (441) (441) (441) (441)
Remeasurements of net defined benefit asset or liability (33,360) (33,360) (33,360)
Other comprehensive income (loss) - - (33,360) (415) (441) (856) (34,216) - (34,216)
Total comprehensive income - - 104,994 (415) (441) (856) 104,138 (1,288) 102,850
Distributions to non-controlling interests (4,783) (4,783)
Capital injections from non-controlling interests 2,263 2,263
Transactions with owner, recorded directly in equity - - - - - - - (2,520) (2,520)
Balance as at September 30, 2014 2,138,400 27,778 2,313,239 1,335 2,256 3,591 4,483,008 38,137 4,521,145
The accompanying notes are an integral part of these Consolidated Financial Statements.
Accumulated other comprehensive income (loss)
Accumulated other comprehensive income (loss)

23
BDC | QUARTERLY FINANCIAL REPORT – SECOND QUARTER 2016 (ended September 30, 2015)
CONSOLIDATED STATEMENT OF CHANGES IN EQUITY For the six-month period ended September 30
(unaudited) Equity
attributable Non-
Share Contributed Retained Available- Cash flow to BDC's controlling Total
(in thousands of Canadian dollars) capital surplus earnings for-sale assets hedges Total shareholder interests equity
Balance as at March 31, 2015 2,138,400 27,778 2,570,454 3,947 3,987 7,934 4,744,566 34,554 4,779,120
Total comprehensive income
Net income 313,135 313,135 (1,279) 311,856
Other comprehensive income (loss)
Net change in unrealized gains (losses) on available-for-sale assets (1,262) (1,262) (1,262) (1,262)
Net change in unrealized gains (losses) on cash flow hedges (995) (995) (995) (995)
Remeasurements of net defined benefit asset or liability 50,215 50,215 50,215
Other comprehensive income (loss) - - 50,215 (1,262) (995) (2,257) 47,958 - 47,958
Total comprehensive income - - 363,350 (1,262) (995) (2,257) 361,093 (1,279) 359,814
Issuance of shares 150,000 150,000 150,000
Dividends on common shares (62,888) (62,888) (62,888)
Distributions to non-controlling interests (8,070) (8,070)
Capital injections from non-controlling interests 783 783
Transactions with owner, recorded directly in equity 150,000 - (62,888) - - - 87,112 (7,287) 79,825
Balance as at September 30, 2015 2,288,400 27,778 2,870,916 2,685 2,992 5,677 5,192,771 25,988 5,218,759
Equity
attributable Non-
Share Contributed Retained Available- Cash flow to BDC's controlling Total
(in thousands of Canadian dollars) capital surplus earnings for-sale assets hedges Total shareholder interests equity
Balance as at March 31, 2014 2,138,400 27,778 2,167,279 2,207 3,246 5,453 4,338,910 51,139 4,390,049
Total comprehensive income
Net income 259,773 259,773 (936) 258,837
Other comprehensive income (loss)
Net change in unrealized gains (losses) on available-for-sale assets (872) (872) (872) (872)
Net change in unrealized gains (losses) on cash flow hedges (990) (990) (990) (990)
Remeasurements of net defined benefit asset or liability (59,200) (59,200) (59,200)
Other comprehensive income (loss) - - (59,200) (872) (990) (1,862) (61,062) - (61,062)
Total comprehensive income - - 200,573 (872) (990) (1,862) 198,711 (936) 197,775
Dividends on common shares (54,613) (54,613) (54,613)
Distributions to non-controlling interests (14,421) (14,421)
Capital injections from non-controlling interests 2,355 2,355
Transactions with owner, recorded directly in equity - - (54,613) - - - (54,613) (12,066) (66,679)
Balance as at September 30, 2014 2,138,400 27,778 2,313,239 1,335 2,256 3,591 4,483,008 38,137 4,521,145
The accompanying notes are an integral part of these Consolidated Financial Statements.
Accumulated other comprehensive income (loss)
Accumulated other comprehensive income (loss)
24
BDC | QUARTERLY FINANCIAL REPORT – SECOND QUARTER 2016 (ended September 30, 2015)
CONSOLIDATED STATEMENT OF CASH FLOWS (unaudited)
(in thousands of Canadian dollars) 2015 2014 2015 2014
Operating activities
Net income 140,847 137,066 311,856 258,837
Adjustments to determine net cash flows
Interest income (272,071) (267,517) (543,272) (531,422)
Interest expense 17,767 34,800 40,961 67,809
Net realized losses (gains) on investments (10,876) 19,903 (13,755) 25,986
Provision for credit losses 33,472 19,285 61,631 36,691
Net change in unrealized depreciation (appreciation) on investments 18,790 (29,948) (29,389) (35,893)
Net unrealized foreign exchange losses (gains) on investments (20,801) (8,960) (19,350) (2,785)
Net unrealized losses (gains) on other financial instruments (2,295) 9,060 (3,381) 3,854
Defined benefits funding in excess of amounts expensed 3,088 (5,742) (663) (13,332)
Depreciation of property and equipment, and amortization of intangible assets 4,408 4,727 8,797 8,344
Loss (gain) on disposal of property and equipment - - - 9
Other (12,501) (3,496) (10,166) (858)
Interest expense paid (22,070) (39,478) (42,226) (68,050)
Interest income received 264,761 265,621 530,404 524,160
Disbursements for loans (1,148,816) (1,110,480) (2,182,714) (1,981,681)
Repayments of loans 774,176 752,423 1,593,234 1,465,386
Changes in operating assets and liabilities
Net change in accounts payable and accrued liabilities (40,309) (45,377) (31,010) (36,029)
Net change in other assets and other liabilities 5,415 (1,568) (2,304) (4,171)
Net cash flows provided (used) by operating activities (267,015) (269,681) (331,347) (283,145)
Investing activities
Disbursements for asset-backed securities (116,734) (51,064) (196,196) (107,655)
Repayments and proceeds on sale of asset-backed securities 50,955 29,108 103,267 62,456
Disbursements for subordinate financing investments (67,784) (42,704) (122,521) (88,330)
Repayments of subordinate financing investments 55,201 20,882 88,469 58,974
Disbursements for venture capital investments (46,065) (49,613) (99,737) (88,377)
Proceeds on sale of venture capital investments 32,987 3,511 58,013 14,756
Disbursements for venture capital action plan investments (21,131) (7,776) (41,123) (8,341)
Proceeds on sale of venture capital action plan investments 222 - 222 -
Acquisition of property and equipment (2,208) (558) (3,997) (1,056)
Proceeds from disposal of property and equipment - - - 1
Acquisition of intangible assets - - - (466)
Net cash flows provided (used) by investing activities (114,557) (98,214) (213,603) (158,038)
Financing activities
Net change in short-term notes 454,138 405,350 543,138 646,200
Issue of long-term notes - 49,700 - 89,100
Repayment of long-term notes (45,801) (90,451) (72,699) (225,614)
Distributions to non-controlling interests (4,287) (4,783) (8,070) (14,421)
Capital injections from non-controlling interests 51 2,263 783 2,355
Issue of common shares - - 150,000 -
Dividends paid on common shares - - (62,888) (54,613)
Net cash flows provided (used) by financing activities 404,101 362,079 550,264 443,007
Net increase (decrease) in cash and cash equivalents 22,529 (5,816) 5,314 1,824
Cash and cash equivalents at beginning of period 649,869 684,169 667,084 676,529
Cash and cash equivalents at end of period 672,398 678,353 672,398 678,353
The accompanying notes are an integral part of these Consolidated Financial Statements.
September 30 September 30
Three months ended Six months ended

25
BDC | QUARTERLY FINANCIAL REPORT – SECOND QUARTER 2016 (ended September 30, 2015)
NOTES TO THE CONSOLIDATED FINANCIAL STATEMENTS (unaudited, in thousands of Canadian dollars)
1. BDC GENERAL DESCRIPTION The Business Development Bank of Canada is a Crown corporation that was established by an Act of Parliament on
December 20, 1974, as the Federal Business Development Bank and continued under its current name by an Act of
Parliament that was enacted on July 13, 1995. The Business Development Bank of Canada is incorporated in
Canada and wholly owned by the Government of Canada.
The objectives of the Business Development Bank of Canada and its subsidiaries (together, BDC) are to promote and
assist in the establishment and development of business enterprises in Canada, with a focus on small and medium-
sized enterprises, by providing a range of complementary lending and investment services, as well as consulting
services. BDC offers Canadian companies services tailored to meet their current needs while earning an appropriate
return on equity, which is used to further BDC’s activities. BDC does not receive appropriations from the Government
of Canada.
2. BASIS OF PREPARATION
BDC’s condensed quarterly Consolidated Financial Statements are in compliance with the Standard on Quarterly
Financial Reports for Crown Corporations, as required by the Financial Administration Act and issued by the Treasury
Board of Canada Secretariat.
BDC’s condensed quarterly Consolidated Financial Statements follow the same basis of preparation as our audited
Consolidated Financial Statements for the year ended March 31, 2015. For complete information on the basis of
preparation, refer to page 55 of our 2015 Annual Report.
These condensed quarterly Consolidated Financial Statements have been prepared using International Financial
Reporting Standards (IFRS). The condensed quarterly Consolidated Financial Statements have also been prepared
in accordance with the accounting policies BDC expects to use in its annual Consolidated Financial Statements for
the year ending March 31, 2016. If BDC changes the application of these policies, it may result in a restatement of
these condensed quarterly Consolidated Financial Statements.
These condensed quarterly Consolidated Financial Statements have been prepared using International Financial
Reporting Standards (IFRS) and were approved for issue by the Board of Directors on November 4, 2015.
3. SIGNIFICANT ACCOUNTING POLICIES
BDC’s condensed quarterly Consolidated Financial Statements follow the same accounting policies as our audited
Consolidated Financial Statements for the year ended March 31, 2015. These policies have been consistently applied
to all periods presented in these condensed quarterly Consolidated Financial Statements and have been applied
consistently by all entities consolidated by BDC.
These condensed quarterly Consolidated Financial Statements must be read in conjunction with BDC’s 2015 Annual Report and the accompanying notes, as set out on pages 55 to 109 of our 2015 Annual Report.
26
BDC | QUARTERLY FINANCIAL REPORT – SECOND QUARTER 2016 (ended September 30, 2015)
NOTES TO THE CONSOLIDATED FINANCIAL STATEMENTS (unaudited, in thousands of Canadian dollars)
4. SIGNIFICANT ACCOUNTING JUDGEMENTS, ESTIMATES
AND ASSUMPTIONS
Preparation of the condensed quarterly Consolidated Financial Statements as per IFRS requires management to
make judgements and use estimates and assumptions that affect the application of accounting policies and the
reported amounts of assets, liabilities, income and expenses.
Significant changes in the underlying assumptions could result in signi ficant changes to these estimates.
Consequently, management reviews these assumptions regularly. Revisions to accounting estimates are recognized
in the period in which the estimates are revised and in any future period affected.
For information about the significant judgements, estimates and assumptions that have the most significant effect on
the amounts recognized in the condensed quarterly Consolidated Financial Statements, refer to page 65 of our 2015
Annual Report.

27
BDC | QUARTERLY FINANCIAL REPORT – SECOND QUARTER 2016 (ended September 30, 2015)
NOTES TO THE CONSOLIDATED FINANCIAL STATEMENTS (unaudited, in thousands of Canadian dollars)
5. CLASSIFICATION AND FAIR VALUE OF FINANCIAL INSTRUMENTS
CLASSIFICATION OF FINANCIAL INSTRUMENTS
The following tables summarize the classification of BDC’s financial instruments as at September 30, 2015, and
March 31, 2015.
September 30, 2015
Note
Held-for-
trading
Designated as
at FVTPL
Available-
for-sale
Cash flow
hedges
Loans and
receivables
Financial
liabilities Total
Financial assetsCash and cash equivalents 672,398 672,398 Derivative assets 45,961 2,694 48,655 Asset-backed securities 6 6,118 493,286 499,404 Loans 7 18,962,791 18,962,791 Subordinate financing investments 8 670,651 670,651 Venture capital investments 9 827,540 827,540 Venture capital action plan investments 10 83,552 83,552
Other assets(2) 10,206 10,206
Total financial assets 45,961 1,587,861 493,286 2,694 19,645,395 - 21,775,197
Financial liabilitiesAccounts payable and accrued liabilities 70,986 70,986 Derivative liabilities 6,648 6,648 Short-term notes 15,977,878 15,977,878 Long-term notes 291,068 178,848 469,916
Other liabilities(2) 27,845 27,845
Total financial liabilities 6,648 291,068 - - - 16,255,557 16,553,273
March 31, 2015
Note
Held-for-
trading
Designated as
at FVTPL
Available-
for-sale
Cash flow
hedges
Loans and
receivables
Financial
liabilities Total
Financial assets
Cash and cash equivalents 667,084 667,084
Derivative assets 49,666 3,656 53,322
Asset-backed securities 6 3,688 404,043 407,731
Loans 7 18,414,044 18,414,044
Subordinate financing investments 8 642,810 642,810
Venture capital investments 9 709,639 709,639
Venture capital action plan investments 10 47,643 47,643
Other assets(2) 8,200 8,200
Total financial assets 49,666 1,403,780 404,043 3,656 19,089,328 - 20,950,473
Financial liabilities
Accounts payable and accrued liabilities 101,996 101,996
Derivative liabilities 7,515 7,515
Short-term notes 15,435,747 15,435,747
Long-term notes 304,453 244,256 548,709
Other liabilities(2) 27,568 27,568
Total financial liabilities 7,515 304,453 - - - 15,809,567 16,121,535 (1)
Fair value through profit or loss.(2)
Certain items within the other assets and other liabilities categories on the Consolidated Statement of Financial Position are not considered to be financial instruments.
Measured at fair value Measured at amortized cost
FVTPL(1)
FVTPL(1)
Measured at fair value Measured at amortized cost

28
BDC | QUARTERLY FINANCIAL REPORT – SECOND QUARTER 2016 (ended September 30, 2015)
NOTES TO THE CONSOLIDATED FINANCIAL STATEMENTS (unaudited, in thousands of Canadian dollars)
FAIR VALUE OF FINANCIAL INSTRUMENTS
All financial instruments measured at fair value must be categorized into one of three hierarchy levels for disclosure
purposes. Each level is based on the observability of the inputs used to measure the fair value of assets and liabilities
and is defined below:
> level 1—fair values based on quoted prices (unadjusted) observed in active markets for identical assets or
liabilities;
> level 2—fair values based on inputs other than quoted prices in active markets that are either directly or
indirectly observable; and
> level 3—fair values based on valuation techniques with one or more significant unobservable market inputs.
There were no transfers between levels 1 and 2 or between levels 2 and 3 in the reporting periods. BDC’s policy is to
recognize transfers between levels 1 and 3 when private investments become publicly traded or public investments
become private investments during the reporting periods.
The following tables present financial instruments carried at fair value categorized by hierarchy levels.
September 30,
2015
Total
Level 1 Level 2 Level 3 fair value
Assets
Derivative assets 48,655 48,655
Asset-backed securities 499,404 499,404
Subordinate financing investments 871 669,780 670,651
Venture capital investments 12,142 815,398 827,540
Venture capital action plan investments 83,552 83,552
13,013 548,059 1,568,730 2,129,802
Liabilities
Derivative liabilities 6,648 6,648
Long-term notes designated as at FVTPL(1)291,068 291,068
- 297,716 - 297,716 (1)
Fair value through profit or loss.
Fair value measurements using

29
BDC | QUARTERLY FINANCIAL REPORT – SECOND QUARTER 2016 (ended September 30, 2015)
NOTES TO THE CONSOLIDATED FINANCIAL STATEMENTS (unaudited, in thousands of Canadian dollars)
The following tables present the changes in fair value measurement for financial instruments included in level 3 of the
fair value hierarchy.
March 31,
2015
Total
Level 1 Level 2 Level 3 fair value
Assets
Derivative assets 53,322 53,322
Asset-backed securities 407,731 407,731
Subordinate financing investments 607 642,203 642,810
Venture capital investments 1,871 707,768 709,639
Venture capital action plan investments 47,643 47,643
2,478 461,053 1,397,614 1,861,145
Liabilities
Derivative liabilities 7,515 7,515
Long-term notes designated as at FVTPL(1)304,453 304,453
- 311,968 - 311,968 (1)
Fair value through profit or loss.
Fair value measurements using
September 30,
2015
Subordinate Venture Venture capital
financing capital action plan
investments investments investments Total
Fair value as at April 1, 2015 642,203 707,768 47,643 1,397,614
Net realized gains (losses) on investments (392) 13,875 - 13,483
Net change in unrealized
appreciation (depreciation) of investments (6,099) 43,952 (4,992) 32,861
Net unrealized foreign exchange
gains (losses) on investments - 19,230 - 19,230
Disbursements for investments 122,521 96,482 41,123 260,126
Repayments of investments and other (88,453) (56,294) (222) (144,969)
Transfers from level 3 to level 1 - (9,615) - (9,615)
Fair value as at September 30, 2015 669,780 815,398 83,552 1,568,730

30
BDC | QUARTERLY FINANCIAL REPORT – SECOND QUARTER 2016 (ended September 30, 2015)
NOTES TO THE CONSOLIDATED FINANCIAL STATEMENTS (unaudited, in thousands of Canadian dollars)
6. ASSET-BACKED SECURITIES
No asset-backed securities were impaired as at September 30 or March 31, 2015.
September 30,
2015
March 31,
2015
Available-for-sale
Principal amount 490,601 400,096
Cumulative fair value appreciation (depreciation) 2,685 3,947
Carrying value 493,286 404,043
Yield 1.82% 2.02%
Fair value through profit or loss
Principal amount 6,057 3,609
Cumulative fair value appreciation (depreciation) 61 79
Carrying value 6,118 3,688
Yield 7.04% 7.65%
Asset-backed securities 499,404 407,731
March 31,
2015
Subordinate Venture Venture capital
financing capital action plan
investments investments investments Total
Fair value as at April 1, 2014 575,993 489,038 5,169 1,070,200
Net realized gains (losses) on investments (23,010) (8,873) - (31,883)
Net change in unrealized
appreciation (depreciation) of investments 9,600 30,118 (3,591) 36,127
Net unrealized foreign exchange
gains (losses) on investments - 27,737 - 27,737
Disbursements for investments 218,335 190,004 46,165 454,504
Repayments of investments and other (138,715) (16,385) (100) (155,200)
Transfers from level 3 to level 1 - (3,871) - (3,871)
Fair value as at March 31, 2015 642,203 707,768 47,643 1,397,614

31
BDC | QUARTERLY FINANCIAL REPORT – SECOND QUARTER 2016 (ended September 30, 2015)
NOTES TO THE CONSOLIDATED FINANCIAL STATEMENTS (unaudited, in thousands of Canadian dollars)
7. LOANS
The following tables provide loans outstanding by contractual maturity date.
Allowance for credit losses
Concentrations of total loans outstanding
Within 1 year 1 to 5 years Over 5 years
Total gross
amount
Collective
allowance
Individual
allowance
Total
allowance
Total net
amount
Performing 150,900 2,191,231 16,655,081 18,997,212 (360,000) - (360,000) 18,637,212
Impaired 20,688 63,550 440,625 524,863 - (199,284) (199,284) 325,579
Loans as at September 30, 2015 171,588 2,254,781 17,095,706 19,522,075 (360,000) (199,284) (559,284) 18,962,791
Within 1 year 1 to 5 years Over 5 years
Total gross
amount
Collective
allowance
Individual
allowance
Total
allowance
Total net
amount
Performing 186,646 2,078,792 16,187,973 18,453,411 (350,000) - (350,000) 18,103,411
Impaired 7,856 62,270 420,430 490,556 - (179,923) (179,923) 310,633
Loans as at March 31, 2015 194,502 2,141,062 16,608,403 18,943,967 (350,000) (179,923) (529,923) 18,414,044
Balance at beginning of period 529,923 508,250
Write-offs (30,679) (71,983)
Effect of discounting (6,917) (12,788)
Recoveries and other 5,326 10,521
497,653 434,000
Provision for credit losses 61,631 95,923
Balance at end of period 559,284 529,923
September 30,
2015
March 31,
2015
Geographic distribution
Newfoundland and Labrador 846,853 790,243
Prince Edward Island 53,975 53,344
Nova Scotia 504,135 490,936
New Brunswick 469,473 469,044
Quebec 6,300,998 6,243,857
Ontario 4,984,641 4,812,779
Manitoba 629,189 600,946
Saskatchewan 658,841 633,566
Alberta 2,848,476 2,644,485
British Columbia 2,103,777 2,080,226
Yukon 93,163 97,397
Northwest Territories and Nunavut 28,554 27,144
Total loans outstanding 19,522,075 18,943,967
March 31,
2015
September 30,
2015

32
BDC | QUARTERLY FINANCIAL REPORT – SECOND QUARTER 2016 (ended September 30, 2015)
NOTES TO THE CONSOLIDATED FINANCIAL STATEMENTS (unaudited, in thousands of Canadian dollars)
8. SUBORDINATE FINANCING INVESTMENTS
BDC maintains a medium- to high-risk portfolio of subordinate financing investments. The following table summarizes
outstanding subordinate financing investments by their contractual maturity date.
Concentrations of total subordinate financing investments
Industry sector
Manufacturing 4,371,292 4,186,626
Wholesale and retail trade 3,936,882 3,843,068
Service industries 2,543,912 2,455,093
Tourism 2,506,367 2,491,385
Commercial properties 2,153,946 2,183,966
Construction 1,652,879 1,560,146
Transportation and storage 1,133,676 1,089,428
Resources 722,508 680,730
Other 500,613 453,525
Total loans outstanding 19,522,075 18,943,967
March 31,
2015
September 30,
2015
Within 1 year 1 to 5 years Over 5 years Total cost
Total
fair value
As at September 30, 2015 79,607 503,748 108,252 691,607 670,651
As at March 31, 2015 80,350 480,167 97,460 657,977 642,810
Geographic distribution Fair value Cost Fair value Cost
Newfoundland and Labrador 5,084 3,761 5,063 3,831
Nova Scotia 16,977 16,983 15,888 16,592
New Brunswick 24,742 21,941 22,352 20,355
Quebec 270,345 291,276 253,105 269,482
Ontario 230,416 230,717 212,234 212,103
Manitoba 12,734 8,040 11,617 8,270
Saskatchewan 8,000 7,429 6,462 5,485
Alberta 69,601 77,011 88,517 92,540
British Columbia 29,038 30,601 23,855 25,470
Yukon 2,672 2,744 2,613 2,744
Northwest Territories and Nunavut 1,042 1,104 1,104 1,105
Subordinate financing investments 670,651 691,607 642,810 657,977
March 31,
2015
September 30,
2015
33
BDC | QUARTERLY FINANCIAL REPORT – SECOND QUARTER 2016 (ended September 30, 2015)
NOTES TO THE CONSOLIDATED FINANCIAL STATEMENTS (unaudited, in thousands of Canadian dollars)
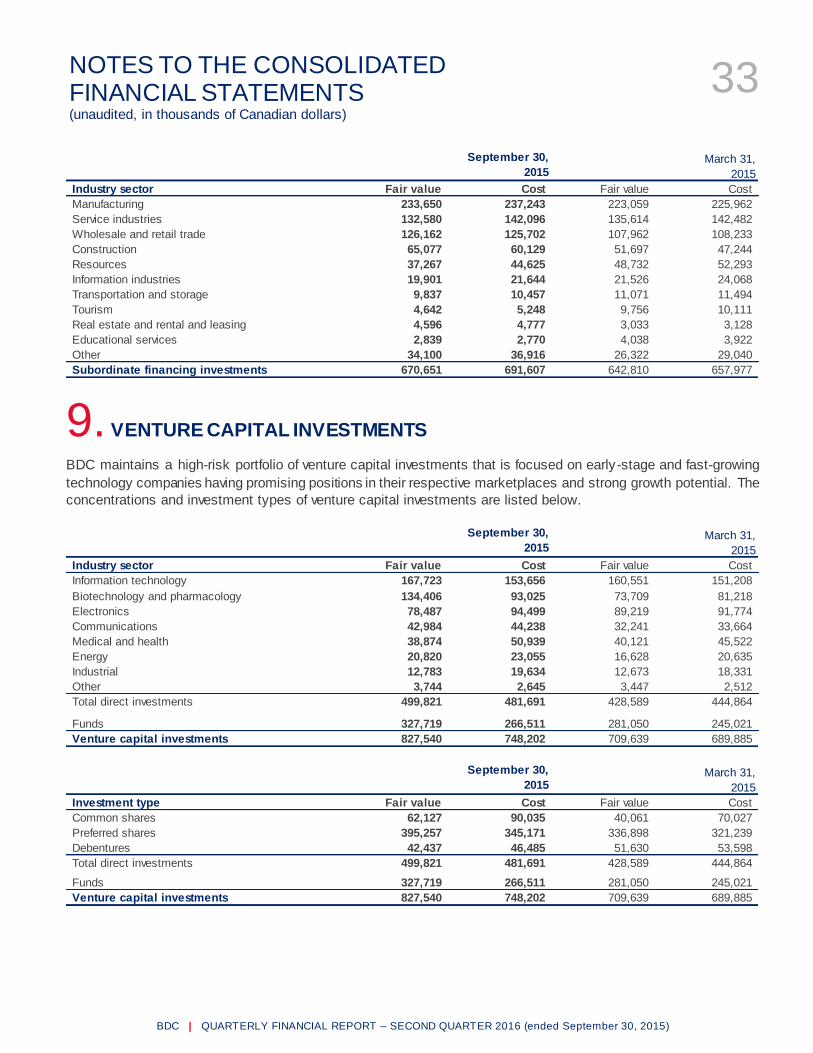
9. VENTURE CAPITAL INVESTMENTS
BDC maintains a high-risk portfolio of venture capital investments that is focused on early-stage and fast-growing
technology companies having promising positions in their respective marketplaces and strong growth potential. The
concentrations and investment types of venture capital investments are listed below.
Industry sector Fair value Cost Fair value Cost
Manufacturing 233,650 237,243 223,059 225,962
Service industries 132,580 142,096 135,614 142,482
Wholesale and retail trade 126,162 125,702 107,962 108,233
Construction 65,077 60,129 51,697 47,244
Resources 37,267 44,625 48,732 52,293
Information industries 19,901 21,644 21,526 24,068
Transportation and storage 9,837 10,457 11,071 11,494
Tourism 4,642 5,248 9,756 10,111
Real estate and rental and leasing 4,596 4,777 3,033 3,128
Educational services 2,839 2,770 4,038 3,922
Other 34,100 36,916 26,322 29,040
Subordinate financing investments 670,651 691,607 642,810 657,977
March 31,
2015
September 30,
2015
Industry sector Fair value Cost Fair value Cost
Information technology 167,723 153,656 160,551 151,208
Biotechnology and pharmacology 134,406 93,025 73,709 81,218
Electronics 78,487 94,499 89,219 91,774
Communications 42,984 44,238 32,241 33,664
Medical and health 38,874 50,939 40,121 45,522
Energy 20,820 23,055 16,628 20,635
Industrial 12,783 19,634 12,673 18,331
Other 3,744 2,645 3,447 2,512
Total direct investments 499,821 481,691 428,589 444,864
Funds 327,719 266,511 281,050 245,021
Venture capital investments 827,540 748,202 709,639 689,885
September 30,
2015 March 31,
2015
Investment type Fair value Cost Fair value Cost
Common shares 62,127 90,035 40,061 70,027
Preferred shares 395,257 345,171 336,898 321,239
Debentures 42,437 46,485 51,630 53,598
Total direct investments 499,821 481,691 428,589 444,864
Funds 327,719 266,511 281,050 245,021
Venture capital investments 827,540 748,202 709,639 689,885
September 30,
2015 March 31,
2015

34
BDC | QUARTERLY FINANCIAL REPORT – SECOND QUARTER 2016 (ended September 30, 2015)
NOTES TO THE CONSOLIDATED FINANCIAL STATEMENTS (unaudited, in thousands of Canadian dollars)
10. VENTURE CAPITAL ACTION PLAN INVESTMENTS
Venture Capital Action Plan is a federal government initiative to invest $400 million to increase private sector venture capital financing for high-potential, innovative Canadian businesses.
Venture Capital Action Plan invests primarily in early-stage and mid-stage venture capital funds, and directly in
companies across Canada. Venture Capital Action Plan supports the creation of large private sector-led funds of
funds and also assists existing high-performing funds in partnership with institutional investors, corporate strategic
investors and interested provinces.
As at September 30, 2015, the fair value of venture capital action plan investments stood at $83,552 ($47,643 as at
March 31, 2015), and their cost was $92,668 ($51,767 as at March 31, 2015).
11. SHARE CAPITAL
An unlimited number of common shares, having a par value of $100 each, is authorized. As at September 30, 2015,
there were 22,884,000 common shares outstanding (21,384,000 as at March 31, 2015).
During the six-month period ended September 30, 2015, BDC issued 1,500,000 common shares for $150.0 million.
Statutory limitations
As per the BDC Act, the debt-to-equity ratio cannot exceed 12:1. In addition, the paid-in capital, the contributed
surplus and any proceeds that have been prescribed as equity (such as hybrid capital instruments) must not exceed
$3.0 billion. As at September 30, 2015, and March 31, 2015, BDC met both of these statutory limitation requirements.
Capital adequacy
Treasury Board of Canada Secretariat provides guidelines to BDC on its capital adequacy ratios. BDC must maintain
overall capital and allowance for credit losses sufficient to ensure that BDC can withstand unfavourable economic
circumstances without requiring additional government funding. During the six-month period ended
September 30, 2015, and for the fiscal year ended March 31, 2015, BDC complied with its capital adequacy
guidelines.
35
BDC | QUARTERLY FINANCIAL REPORT – SECOND QUARTER 2016 (ended September 30, 2015)
NOTES TO THE CONSOLIDATED FINANCIAL STATEMENTS (unaudited, in thousands of Canadian dollars)
12. SEGMENTED INFORMATION BDC has six reportable segments, as described below, which are the Bank’s business lines. Each business line offers
different products and services, and is managed separately based on BDC’s management and internal reporting
structure.
The following summary describes the operations of each of the Bank’s reportable segments.
> Financing provides secured, partially secured and unsecured loans with a focus on small and medium-sized
enterprises across Canada.
> Growth & Transition Capital provides subordinate financing by way of flexible debt, with or without
convertible features, and equity-type financing.
> Venture Capital provides investments to cover every stage of a technology-based company’s development
cycle, from seed funding to expansion. BDC also makes indirect investments via venture capital investment
funds.
> BDC Advantage supports high-impact firms and provides consulting services, group programs and other
services related to business activities.
˃ Securitization purchases investments in asset-backed securities through the Funding Platform for
Independent Lenders (F-PIL). These securities are backed by vehicle and equipment loans and leases, as
well as dealer floor plan loans. BDC also provides fully secured loans to small and medium-sized finance and
leasing companies.
˃ Venture Capital Action Plan supports the creation of large private sector-led funds of funds and also assists
existing high-performing funds in partnership with institutional investors, corporate strategic investors and
interested provinces.
The assumptions and methodologies used in BDC’s reporting framework are periodically reviewed by management to
ensure they remain valid. BDC’s main allocation methods are described below.
Interest expense is allocated to each operating segment based on its business portfolio and the capital attributed to
the segment. The attribution of capital to BDC’s business segments is ma intained in accordance with the capital
adequacy ratios provided by the Treasury Board of Canada Secretariat and is consistently aligned with the economic
risks of each specific business segment.
Operating and administrative expenses include costs incurred directly by the business segments. Indirect costs
incurred at the enterprise level are attributed to each segment using management’s internal reporting framework.
Loan and investment portfolios are managed separately based on BDC’s business segments. None of the other
assets or liabilities are managed by segment.

36
BDC | QUARTERLY FINANCIAL REPORT – SECOND QUARTER 2016 (ended September 30, 2015)
NOTES TO THE CONSOLIDATED FINANCIAL STATEMENTS (unaudited, in thousands of Canadian dollars)
The following tables present financial information regarding the results of each reportable segment.
Three months ended
September 30, 2015
BDC Financing
Growth &
Transition
Capital
Venture
Capital
BDC
Advantage Securitization
Venture
Capital
Action Plan
Interest income 272,071 253,980 15,868 - - 2,223 -
Interest expense 17,767 15,610 1,134 - - 1,023 -
Net interest income 254,304 238,370 14,734 - - 1,200 -
Net realized gains (losses) on investments 10,876 - (562) 11,438 - - -
Consulting revenue 3,618 - - - 3,618 - -
Fee and other income 15,114 3,984 8,456 2,515 - 17 142
Net realized gains (losses) on other financial instruments (210) 44 - (254) - - -
Net revenue (loss) 283,702 242,398 22,628 13,699 3,618 1,217 142
Provision for credit losses (33,472) (33,472) - - - - -
Net change in unrealized appreciation (depreciation) of investments (18,790) - 1,197 (17,481) - (11) (2,495)
Net unrealized foreign exchange gains (losses) on investments 20,801 - - 20,801 - - -
Net unrealized gains (losses) on other financial instruments 2,295 2,394 - (99) - - -
Income (loss) before operating and administrative expenses 254,536 211,320 23,825 16,920 3,618 1,206 (2,353)
Salaries and benefits 81,376 63,710 6,268 3,623 7,062 517 196
Premises and equipment 11,695 10,248 407 359 642 26 13
Other expenses 20,618 15,546 623 1,037 3,385 45 (18)
Operating and administrative expenses 113,689 89,504 7,298 5,019 11,089 588 191
Net income (loss) 140,847 121,816 16,527 11,901 (7,471) 618 (2,544)
Net income (loss) attributable to:
BDC's shareholder 142,778 121,816 15,822 14,537 (7,471) 618 (2,544)
Non-controlling interests (1,931) - 705 (2,636) - - -
Net income (loss) 140,847 121,816 16,527 11,901 (7,471) 618 (2,544)
Business segment portfolio at end of period 21,043,938 18,952,487 670,651 827,540 - 509,708(1)83,552
(1) Securitization's portfolio at the end of the period included $10,304 in loans and $499,404 in asset-backed securities.
Three months ended
September 30, 2014
BDC Financing
Growth &
Transition
Capital
Venture
Capital
BDC
Advantage Securitization
Venture
Capital
Action Plan
Interest income 267,517 251,641 13,817 - - 2,059 -
Interest expense 34,800 32,342 1,886 - - 572 -
Net interest income 232,717 219,299 11,931 - - 1,487 -
Net realized gains (losses) on investments (19,903) - (13,542) (6,361) - - -
Consulting revenue 4,486 - - - 4,486 - -
Fee and other income 12,476 4,035 7,888 458 - 2 93
Net realized gains (losses) on other financial instruments 2,038 604 - 1,434 - - -
Net revenue (loss) 231,814 223,938 6,277 (4,469) 4,486 1,489 93
Provision for credit losses (19,285) (19,285) - - - - -
Net change in unrealized appreciation (depreciation) of investments 29,948 - 13,031 19,042 - (13) (2,112)
Net unrealized foreign exchange gains (losses) on investments 8,960 - - 8,960 - - -
Net unrealized gains (losses) on other financial instruments (9,060) (970) - (8,090) - - -
Income (loss) before operating and administrative expenses 242,377 203,683 19,308 15,443 4,486 1,476 (2,019)
Salaries and benefits 73,942 58,223 5,062 3,761 6,328 402 166
Premises and equipment 12,119 10,729 375 418 563 19 15
Other expenses 19,250 13,968 815 1,001 3,401 43 22
Operating and administrative expenses 105,311 82,920 6,252 5,180 10,292 464 203
Net income (loss) 137,066 120,763 13,056 10,263 (5,806) 1,012 (2,222)
Net income (loss) attributable to:
BDC's shareholder 138,354 120,763 12,825 11,782 (5,806) 1,012 (2,222)
Non-controlling interests (1,288) - 231 (1,519) - - -
Net income (loss) 137,066 120,763 13,056 10,263 (5,806) 1,012 (2,222)
Business segment portfolio at end of period 19,313,133 17,731,257 595,304 595,200 - 380,834 10,538

37
BDC | QUARTERLY FINANCIAL REPORT – SECOND QUARTER 2016 (ended September 30, 2015)
NOTES TO THE CONSOLIDATED FINANCIAL STATEMENTS (unaudited, in thousands of Canadian dollars)
Six months ended
September 30, 2015
BDC Financing
Growth &
Transition
Capital
Venture
Capital
BDC
Advantage Securitization
Venture
Capital
Action Plan
Interest income 543,272 507,942 31,017 - - 4,313 -
Interest expense 40,961 36,498 2,449 - - 2,014 -
Net interest income 502,311 471,444 28,568 - - 2,299 -
Net realized gains (losses) on investments 13,755 - (392) 14,147 - - -
Consulting revenue 7,172 - - - 7,172 - -
Fee and other income 24,588 7,766 13,856 2,791 - 22 153
Net realized gains (losses) on other financial instruments 189 269 - (80) - - -
Net revenue (loss) 548,015 479,479 42,032 16,858 7,172 2,321 153
Provision for credit losses (61,631) (61,631) - - - - -
Net change in unrealized appreciation (depreciation) of investments 29,389 - (5,835) 40,234 - (18) (4,992)
Net unrealized foreign exchange gains (losses) on investments 19,350 - - 19,350 - - -
Net unrealized gains (losses) on other financial instruments 3,381 3,376 - 5 - - -
Income (loss) before operating and administrative expenses 538,504 421,224 36,197 76,447 7,172 2,303 (4,839)
Salaries and benefits 161,994 126,740 12,281 7,500 14,140 952 381
Premises and equipment 23,313 20,393 824 741 1,277 52 26
Other expenses 41,341 30,923 1,464 2,059 6,781 99 15
Operating and administrative expenses 226,648 178,056 14,569 10,300 22,198 1,103 422
Net income (loss) 311,856 243,168 21,628 66,147 (15,026) 1,200 (5,261)
Net income (loss) attributable to:
BDC's shareholder 313,135 243,168 20,632 68,422 (15,026) 1,200 (5,261)
Non-controlling interests (1,279) - 996 (2,275) - - -
Net income (loss) 311,856 243,168 21,628 66,147 (15,026) 1,200 (5,261)
Business segment portfolio at end of period 21,043,938 18,952,487 670,651 827,540 - 509,708(1)83,552
(1) Securitization's portfolio at the end of the period included $10,304 in loans and $499,404 in asset-backed securities.
Six months ended
September 30, 2014
BDC Financing
Growth &
Transition
Capital
Venture
Capital
BDC
Advantage Securitization
Venture
Capital
Action Plan
Interest income 531,422 497,921 29,479 - - 4,022 -
Interest expense 67,809 62,935 3,791 - - 1,083 -
Net interest income 463,613 434,986 25,688 - - 2,939 -
Net realized gains (losses) on investments (25,986) - (19,760) (6,226) - - -
Consulting revenue 8,605 - - - 8,605 - -
Fee and other income 23,042 7,736 14,138 969 - 3 196
Net realized gains (losses) on other financial instruments 1,075 240 - 835 - - -
Net revenue (loss) 470,349 442,962 20,066 (4,422) 8,605 2,942 196
Provision for credit losses (36,691) (36,691) - - - - -
Net change in unrealized appreciation (depreciation) of investments 35,893 - 9,079 29,802 - (16) (2,972)
Net unrealized foreign exchange gains (losses) on investments 2,785 - - 2,785 - - -
Net unrealized gains (losses) on other financial instruments (3,854) (1,329) - (2,525) - - -
Income (loss) before operating and administrative expenses 468,482 404,942 29,145 25,640 8,605 2,926 (2,776)
Salaries and benefits 145,970 114,543 10,645 7,437 12,258 752 335
Premises and equipment 22,770 20,064 714 826 1,097 38 31
Other expenses 40,905 30,681 1,507 2,103 6,428 116 70
Operating and administrative expenses 209,645 165,288 12,866 10,366 19,783 906 436
Net income (loss) 258,837 239,654 16,279 15,274 (11,178) 2,020 (3,212)
Net income (loss) attributable to:
BDC's shareholder 259,773 239,654 15,558 16,931 (11,178) 2,020 (3,212)
Non-controlling interests (936) - 721 (1,657) - - -
Net income (loss) 258,837 239,654 16,279 15,274 (11,178) 2,020 (3,212)
Business segment portfolio at end of period 19,313,133 17,731,257 595,304 595,200 - 380,834 10,538

38
BDC | QUARTERLY FINANCIAL REPORT – SECOND QUARTER 2016 (ended September 30, 2015)
NOTES TO THE CONSOLIDATED FINANCIAL STATEMENTS (unaudited, in thousands of Canadian dollars)
13. GUARANTEES
BDC issues “letters of credit, loan guarantees and portfolio guarantees” (guarantees) to support businesses. Those
guarantees represent BDC’s obligation to make payments to third parties if clients are unable to meet their
contractual commitments. The total amount of available guarantees totalled $353.5 million as at September 30, 2015
($31.7 million as at March 31, 2015). This amount is not representative of the maximum potential amount of future
payments to be required for these guarantees, which is estimated to be significantly less than the available amount.
Currently, there is no provision recorded, as defaults are deemed improbable.
14. COMMITMENTS
Loans
Undisbursed amounts of authorized loans were $2,465,977 as at September 30, 2015 ($530,138 fixed rate;
$1,935,839 floating rate) and are expected to be disbursed within the next 12 months. The weighted average effective
interest rate was 4.58% on loan commitments (4.62% as at March 31, 2015). The following tables present
undisbursed amounts of authorized loans, by location and industry.
Commitments, by geographic distribution
Newfoundland and Labrador 61,448 88,431
Prince Edward Island 1,145 525
Nova Scotia 48,696 55,930
New Brunswick 24,626 22,499
Quebec 605,958 545,479
Ontario 693,553 643,218
Manitoba 70,763 67,579
Saskatchewan 68,975 66,173
Alberta 609,783 568,549
British Columbia 275,716 193,659
Yukon 3,807 2,172
Northwest Territories and Nunavut 1,507 1,026
Total 2,465,977 2,255,240
Commitments, by industry sector
Manufacturing 571,104 519,240
Wholesale and retail trade 372,495 319,899
Tourism 316,067 322,222
Construction 279,350 247,874
Service industries 268,034 248,614
Resources 246,739 254,214
Transportation and storage 181,289 91,765
Commercial properties 103,956 103,386
Other 126,943 148,026
Total 2,465,977 2,255,240
March 31,
2015
March 31,
2015
September 30,
2015
September 30,
2015

39
BDC | QUARTERLY FINANCIAL REPORT – SECOND QUARTER 2016 (ended September 30, 2015)
NOTES TO THE CONSOLIDATED FINANCIAL STATEMENTS (unaudited, in thousands of Canadian dollars)
Subordinate financing
Undisbursed amounts of authorized subordinate financing investments were $63,330 as at September 30, 2015
($24,564 fixed rate; $38,766 floating rate) and are expected to be disbursed within the next 12 months. The weighted
average effective interest rate (excluding non-interest returns) was 10.21% on investment commitments (9.87% as at
March 31, 2015). The following tables present undisbursed amounts of authorized investments, by location and
industry.
Venture capital
Undisbursed amounts of authorized venture capital investments were $330,485 as at September 30, 2015, and were
related to the following industry sectors.
Industry sector
Biotechnology and pharmacology 12,946 3,671
Information technology 7,308 3,750
Electronics 6,115 1,205
Medical and health 4,000 7,000
Industrial 500 1,000
Total direct investments 30,869 16,626
External funds 299,616 320,456
Venture capital investments 330,485 337,082
September 30,
2015
March 31,
2015
Commitments, by geographic distribution
Newfoundland and Labrador 209 255
New Brunswick 2,000 -
Quebec 16,114 23,570
Ontario 19,000 32,556
Saskatchewan 8,400 4,400
Alberta 15,200 2,650
British Columbia 2,407 4,230
Total 63,330 67,661
Commitments, by industry sector
Service industries 24,806 16,288
Manufacturing 17,477 19,350
Wholesale and retail trade 8,225 9,832
Construction 3,950 4,780
Resources 3,300 4,800
Information industries 3,067 4,061
Educational services 600 -
Transportation and storage 300 300
Real estate and rental and leasing 205 -
Other 1,400 8,250
Total 63,330 67,661
March 31,
2015
March 31,
2015
September 30,
2015
September 30,
2015
40
BDC | QUARTERLY FINANCIAL REPORT – SECOND QUARTER 2016 (ended September 30, 2015)
NOTES TO THE CONSOLIDATED FINANCIAL STATEMENTS (unaudited, in thousands of Canadian dollars)
Venture capital action plan
Undisbursed amounts of authorized venture capital action plan investments were $257,755 as at September 30, 2015
($272,979 as at March 31, 2015).
Asset-backed securities
The undisbursed amount of authorized asset-backed securities was $309,000 as at September 30, 2015 ($227,000
as at March 31, 2015).
Leases
BDC has future minimum lease commitments under operating leases related to the rental of premises.
15. RELATED PARTY TRANSACTIONS
As at September 30, 2015, BDC had $15,975.0 million outstanding in short-term notes and $178.4 million outstanding
in long-term notes (excluding accrued interest) with Her Majesty the Queen in Right of Canada acting through the
Minister of Finance ($15,432.0 million in short-term notes and $243.7 million in long-term notes as at
March 31, 2015).
Accrued interest on borrowings included $2.8 million payable to the Minister of Finance as at September 30, 2015
($3.9.million as at March 31, 2015).
BDC recorded $17.8 million in interest expense, related to the borrowings from the Minister of Finance, for the second
quarter and $41.2 million for the six months ended September 30, 2015. Last year’s comparative figures for the same
period were $34.5 million and $66.8 million, respectively.
In addition, no borrowings with the Minister of Finance were repurchased in the first six months of fiscal 2016
(borrowings with the Minister of Finance repurchased resulted in a net realized loss of $0.5 million for the same
period last year).
BDC is also related to all Government of Canada-created departments, agencies and Crown corporations. BDC
enters into transactions with these entities in the normal course of business, under terms and conditions similar to
those that apply to unrelated parties.

Business Development Bank of Canada Head Office 5 Place Ville-Marie, Suite 300 Montreal, Quebec H3B 5E7 T 1 877 BDC-BANX (232-2269) F 1 877 329-9232
For our business centres, please visit www.bdc.ca