financial report - novartis · financial report contents ... the following items that exceed a ......
TRANSCRIPT

156 | Novartis Annual Report 2017
Financial ReportContentsFINANCIAL REPORT
Operating and financial review 2017 156
Results of operations 157
Factors affecting comparability of year-on-year results of operations 162
Free cash flow 163
Liquidity, cash flow and capital resources 164
Contractual obligations 165
Effects of currency fluctuations 166
Condensed consolidated balance sheets 168
Critical accounting policies and estimates 170
Factors affecting results of operations 175
Non-IFRS measures as defined by Novartis 179
Summary of quarterly and Group financial data 184
Novartis Group consolidated financial statements 186
Notes to the Novartis Group consolidated financial statements 191
Report of Novartis management on internal control over financial reporting 255
Report of the statutory auditor on the consolidated financial statements of Novartis AG 256
Financial statements of Novartis AG 262
Notes to the financial statements of Novartis AG 264
Appropriation of available earnings of Novartis AG as per balance sheet and declaration of dividend 271
Report of the statutory auditor on the financial statements of Novartis AG 272
Operating and financial review 2017This operating and financial review should be read together with the Group’s consolidated financial state-ments in this Annual Report, which have been prepared in accordance with International Financial Reporting Standards (IFRS) as published by the International Accounting Standards Board, and with the sections on performance and innovation on pages 22 to 63 of this Annual Report.
Risk overview
Our financial results are affected to varying degrees by external factors. Loss of market exclusivity and the intro-duction of branded and generic competitors could sig-nificantly erode sales of our innovative products. Our ability to grow depends on the success of our research and development efforts to replenish our pipeline, as well as on the commercial acceptance of our products in the markets. Increased pricing pressure could impact our ability to generate returns and invest for the future.
We have a significant global compliance program in place, but any failure to comply with local laws could lead to substantial liabilities. There are strict regulatory requirements surrounding our manufacturing processes, which introduce a greater chance for disruptions and lia-bilities. With products sold in approximately 155 coun-tries, our ability to hedge against foreign exchange fluc-tuations could have a significant effect on our reported results. We carry a significant amount of goodwill and other intangible assets on our consolidated balance sheet, and may incur significant impairment charges in the future. We pay taxes in numerous countries, and tax authorities around the world have increased their scru-tiny of company tax filings. In addition, tax reform initia-tives by the OECD, EU, Switzerland and the US, will require us to continually assess our organizational struc-ture against tax policy trends, and could lead to an increased risk of international tax disputes and an increase in our effective tax rate, and could adversely affect our financial results. We may also fail to take advantage of rapid progress in digital technologies and in the development of new business models, and third parties may enter the healthcare field and could supplant our business.
For more detail on these trends and how they could impact our results, see details starting on page 175.
Novartis Annual Report 2017 | 157FINANCIAL REPORTOperating and financial review 2017
Results of operationsIn evaluating the Group’s performance, we consider not only the IFRS results, but also certain non-IFRS mea-sures, including core results and constant currency results. These measures assist us in evaluating our ongo-ing performance from year to year and we believe this additional information is useful to investors in under-standing the performance of our business.
The Group’s core results – including core operating income, core net income and core earnings per share – exclude fully the amortization and impairment charges of intangible assets except software, and certain acqui-sition-related items. The following items that exceed a threshold of USD 25 million are also excluded: integra-tion and divestment related income and expenses, divestment gains and losses, restructuring charges/releases and related items, legal related items, impair-ments of property, plant and equipment and financial assets, as well as income and expense items that man-agement deems exceptional and that are or are expected to accumulate within the year to be over a USD 25 mil-lion threshold. A reconciliation between IFRS results and core results is shown on pages 181-183.
We present information about our net sales and other key figures relating to operating and net income in con-stant currencies (cc). We calculate constant currency net sales and operating income by applying the prior-year average exchange rates to current financial data expressed in local currencies in order to estimate an elim-ination of the impact of foreign exchange rate movements.
The core results, constant currencies and other non-IFRS measures are explained in more detail starting on page 179 and are not intended to be substitutes for the equivalent measures of financial performance prepared in accordance with IFRS. These measures may differ from similarly titled non-IFRS measures of other compa-nies.
Group overview
Novartis delivered solid performance in 2017 as strong sales of our growth drivers, including Cosentyx, Entresto and other recently launched products, continued to off-set the impact of generic competition for our cancer treatment Gleevec/Glivec, which lost patent protection in the United States and Europe during 2016. Our results underscore the breadth and strength of our product port-folio and highlight our success at steering through the patent expiration of one of our biggest-selling drugs.
By division, our 2017 sales were varied. In constant currencies (cc), which removes the impact of exchange rate movements, Innovative Medicines Division sales increased by 2% cc (+1% in USD). Sandoz is expanding access to biosimilars, and we have a leading portfolio with five biosimilars now on the market, however Sandoz net sales were down by 2% cc (–1% in USD) due to fierce price competition in the United States. Alcon made significant progress on its turnaround, returning to growth and building momentum toward the end of the year delivering sales growth of 4% cc ( +4% USD).
Net sales in 2017 for Novartis were USD 49.1 billion, up 1% in reported terms and up 2% in constant curren-cies. Sales volumes increased 7%, as growth drivers such as Cosentyx (USD 2.1 billion; +84%, +82% cc), Entresto (USD 507 million; +198%, +195% cc), Promacta/Revolade (USD 867 million; +37%, +37% cc) and Tafinlar + Mekinist (USD 873 million; +30%, 29% cc) were partly offset by the negative impact of generic competition (-3 percentage points) and pricing (-2 percentage points).
Operating income in 2017 was USD 8.6 billion (+4%, +7% cc) as growth drivers, productivity, lower amortiza-tion and a gain from achievement of a sales milestone related to the 2015 Vaccines divestment to GSK more than offset generic erosion. Operating income margin was 17.6% of net sales.
Net income was USD 7.7 billion (+15%, +12% cc), ben-efiting from growth in operating income and higher income from our stake in GSK Consumer Healthcare Holdings Ltd. The prior year also included USD 0.3 bil-lion exceptional charges related to Venezuela. For more information see page 166.
Basic earnings per share were USD 3.28 (+16%, +14% cc), up more than net income in constant currencies, benefiting from our share buyback program.
Free cash flow amounted to USD 10.4 billion (+10% USD) compared to USD 9.5 billion in 2016. The increase was mainly driven by favorable working capital changes, lower legal settlement payments out of provisions and lower taxes paid, partly offset by the decrease in oper-ating income adjusted for non-cash items and higher net investments.

158 | Novartis Annual Report 2017
Key figures
Change in
Change constant
Year ended Year ended in USD currencies
(USD millions unless indicated otherwise) Dec 31, 2017 Dec 31, 2016 % %
Net sales to third parties 49 109 48 518 1 2
Other revenues 1 026 918 12 11
Cost of goods sold – 17 175 – 17 520 2 2
Gross profit 32 960 31 916 3 4
Marketing & Sales – 12 861 – 11 998 – 7 – 7
Research & Development – 8 972 – 9 039 1 1
General & Administration – 2 136 – 2 194 3 2
Other income 1 969 1 927 2 1
Other expense – 2 331 – 2 344 1 0
Operating income 8 629 8 268 4 7
Return on net sales (%) 17.6 17.0
Income from associated companies 1 108 703 58 58
Interest expense – 777 – 707 – 10 – 12
Other financial income and expense 39 – 447 nm nm
Income before taxes 8 999 7 817 15 12
Taxes – 1 296 – 1 119 – 16 – 13
Net income 7 703 6 698 15 12
Attributable to:
Shareholders of Novartis AG 7 703 6 712 15 12
Non-controlling interests 0 – 14 nm nm
Basic earnings per share (USD) 3.28 2.82 16 14
Free cash flow 10 428 9 455 10
nm = not meaningful
Net sales by segment
The following table provides an overview of net sales to third parties by segment:
Change in
Change constant
Year ended Year ended in USD currencies
(USD millions) Dec 31, 2017 Dec 31, 2016 % %
Innovative Medicines 33 025 32 562 1 2
Sandoz 10 060 10 144 – 1 – 2
Alcon 6 024 5 812 4 4
Net sales to third parties 49 109 48 518 1 2
Additional comments on the changes in the net sales by division can be found starting on page 22.
Operating income
The following table provides an overview of operating income by segment:
Change in
Change constant
Year ended % of Year ended % of in USD currencies
(USD millions) Dec 31, 2017 net sales Dec 31, 2016 net sales % %
Innovative Medicines 7 782 23.6 7 426 22.8 5 7
Sandoz 1 368 13.6 1 445 14.2 – 5 – 7
Alcon – 190 – 3.2 – 132 – 2.3 – 44 – 14
Corporate – 331 – 471 30 27
Operating income 8 629 17.6 8 268 17.0 4 7

Novartis Annual Report 2017 | 159FINANCIAL REPORTOperating and financial review 2017
Operating income was USD 8.6 billion (+4%, +7% cc) as growth drivers, productivity, lower amortization and a gain from achievement of a sales milestone related to the 2015 Vaccines divestment to GSK more than offset generic erosion. Operating income margin in constant currencies increased 0.8 percentage points compared to the prior year; currency had a negative impact of 0.2 percentage points resulting in an increase of 0.6 percentage points to 17.6% of net sales.
Additional comments on the changes in operating income by division can be found starting on page 22.
Corporate income and expense, which includes the cost of Group management and central services, amounted to a net expense of USD 331 million (+30%, +27% cc) in 2017 compared to a net expense of USD 471 million in the prior year. The favorable decrease in expense was mainly due to a gain from achievement of a sales milestone related to the 2015 Vaccines divestment to GSK, partly offset by lower gains from divestment in real estate and lower contributions from the captive insurance companies.
Core operating income key figures1
Change in
Change constant
Year ended Year ended in USD currencies
(USD millions unless indicated otherwise) Dec 31, 2017 Dec 31, 2016 % %
Core gross profit 36 578 35 806 2 3
Core Marketing & Sales – 12 865 – 11 991 – 7 – 7
Core Research & Development – 8 313 – 8 402 1 1
Core General & Administration – 2 135 – 2 120 – 1 – 2
Core other income 778 753 3 2
Core other expense – 1 193 – 1 059 – 13 – 13
Core operating income 12 850 12 987 – 1 0
As % of net sales 26.2 26.8
1 An explanation of non-IFRS measures and reconciliation tables can be found starting on page 179.
The adjustments made to operating income to arrive at core operating income amounted to USD 4.2 billion (2016: USD 4.7 billion), less than in the prior year due to lower amortization and a gain from achievement of a sales milestone related to the 2015 Vaccines divestment to GSK.
Excluding these items, Core operating income was USD 12.9 billion (–1%, 0% cc). Core operating income margin in constant currencies decreased 0.3 percent-age points, mainly due to generic competition for
Gleevec/Glivec, and higher launch investments, which were partially offset by expanded gross margin and productivity improvements. Currency exchange rates had an additional negative impact of 0.3 percentage points, yielding a net decrease of 0.6 percentage points to 26.2% of net sales. Additional comments on the changes in the core operating income by division can be found starting on page 22.
The following table provides an overview of core operating income by segment:
Change in
Change constant
Year ended % of Year ended % of in USD currencies
(USD millions) Dec 31, 2017 net sales Dec 31, 2016 net sales % %
Innovative Medicines 10 330 31.3 10 354 31.8 0 2
Sandoz 2 080 20.7 2 071 20.4 0 – 1
Alcon 857 14.2 850 14.6 1 5
Corporate – 417 – 288 – 45 – 53
Core operating income 12 850 26.2 12 987 26.8 – 1 0

160 | Novartis Annual Report 2017
Research and development of Innovative Medicines Division
The following table provides an overview of the reported and core research and development expense of the Innovative Medicines Division:
Change in
Change constant
Year ended Year ended in USD currencies
(USD millions unless indicated otherwise) Dec 31, 2017 Dec 31, 2016 % %
Research and Exploratory Development1 – 2 749 – 2 739 0 0
Confirmatory Development1 – 4 881 – 4 970 2 2
Total Innovative Medicines Division Research and Development expense – 7 630 – 7 709 1 1
As % of Innovative Medicines net sales to third parties 23.1 23.7
Core Research and Exploratory Development1,2 – 2 623 – 2 637 1 1
Core Confirmatory Development1,2 – 4 426 – 4 475 1 1
Total Core Innovative Medicines Division Research and Development expense – 7 049 – 7 112 1 1
As % of Innovative Medicines net sales to third parties 21.3 21.8
1 Certain prior year amounts have been reclassified for comparative purposes.2 Core excludes impairments, amortization and certain other items.
Innovative Medicines Division Research and Exploratory Development expense amounted to USD 2.7 billion in 2017, in line with the prior year. Confirmatory Develop-ment expense decreased by 2% (+2% cc) to USD 4.9 bil-lion compared to USD 5.0 billion in 2016, driven by resource allocation and continued productivity efforts, including the benefit of the creation of the Novartis Global Drug Development (GDD) organization.
Total Core Research and Development expense in the Innovative Medicines Division as a percentage of sales decreased by 0.7 percentage points in constant currencies mainly due to resource allocation and contin-ued productivity efforts. Currency exchange rates had a negative impact of 0.2 percentage points, yielding a net decrease of 0.5 percentage points to 21.3% of net sales.
Non-operating income and expense
The following table provides an overview of non-operating income and expense:
Change in
Change constant
Year ended Year ended in USD currencies
(USD millions unless indicated otherwise) Dec 31, 2017 Dec 31, 2016 % %
Operating income 8 629 8 268 4 7
Income from associated companies 1 108 703 58 58
Interest expense – 777 – 707 – 10 – 12
Other financial income and expense 39 – 447 nm nm
Income before taxes 8 999 7 817 15 12
Taxes – 1 296 – 1 119 – 16 – 13
Net income 7 703 6 698 15 12
Basic EPS (USD) 3.28 2.82 16 14
nm = not meaningful
Income from associated companies increased to USD 1.1 billion, compared to USD 703 million in the prior year. The increase was due to higher income recognized from our investment in GSK Consumer Health-care Holdings Ltd. (GSK Consumer Healthcare).
The estimated income from our investment in GSK Consumer Healthcare in 2017 amounted to USD 629 mil-lion compared to USD 234 million in 2016. The increase
is due to improved operational results of USD 89 million, an estimate of a one-time deferred tax income of USD 237 million, arising from a change in a Swiss can-tonal statutory tax rate, and a positive prior year adjust-ment of USD 47 million based on the actual audited results for 2016, compared to a negative prior year adjustment of USD 22 million recognized in 2016 for 2015.

Novartis Annual Report 2017 | 161FINANCIAL REPORTOperating and financial review 2017
The estimated income from our investment in Roche in 2017 amounted to USD 456 million (2016: USD 464 million), which reflected our estimated share of income for 2017 of USD 523 million (2016: USD 532 million) off-set by the negative prior year adjustment of USD 67 mil-lion, based on actual 2016 results (2016: negative prior year adjustment of USD 68 million, based on actual 2015 results).
Interest expense increased to USD 777 million from USD 707 million in the prior year due to higher outstand-ing debt.
Other financial income and expense amounted to an income of USD 39 million compared to an expense of USD 447 million in the prior-year, mainly on account of exceptional charges related to Venezuela of USD 305 million in 2016, as well as higher currency losses in 2016. For more information see “Effects of currency fluctua-tions” on page 166.
The tax rate increased to 14.4% from 14.3% in the prior year. On December 22, 2017, the US enacted tax reform legislation (Tax Cuts and Jobs Act), which among
other provisions, reduced the US corporate tax rate from 35% to 21%, effective January 1, 2018. This required a revaluation of the deferred tax assets and liabilities and a portion of current tax payables to the newly enacted tax rate at the date of enactment, which resulted in a net tax expense of USD 61 million (0.7%). In addition, a change in a Swiss cantonal statutory tax rate resulted in a one-time income from our share in GSK Consumer Healthcare the impact of which decreased the tax rate by 0.4%.
Excluding the impact of these rate changes the reported tax rate for 2017 would have been 14.1% com-pared to 14.3% in the prior year.
Net income was USD 7.7 billion (+15%, +12% cc), ben-efiting from growth in operating income and higher income from our stake in GSK Consumer Healthcare Holdings Ltd. The prior year also included the excep-tional charges related to Venezuela.
Basic earnings per share were USD 3.28 (+16%, +14% cc), up more than net income in constant currencies, benefiting from our share buyback program.
Core non-operating income and expense
The following table provides an overview of core non-operating income and expense:
Change in
Change constant
Year ended Year ended in USD currencies
(USD millions unless indicated otherwise) Dec 31, 2017 Dec 31, 2016 % %
Core operating income 12 850 12 987 – 1 0
Core income from associated companies 1 335 1 134 18 18
Core interest expense – 777 – 707 – 10 – 12
Core other financial income and expense 39 – 99 nm nm
Core income before taxes 13 447 13 315 1 2
Core taxes – 2 056 – 2 001 – 3 – 4
Core net income 11 391 11 314 1 2
Core basic EPS (USD) 4.86 4.75 2 3
nm = not meaningful
Core income from associated companies increased to USD 1.3 billion from USD 1.1 billion in the prior-year period. The core income contribution from GSK Consumer Healthcare Holdings Ltd., increased to USD 479 million in 2017 from USD 369 million in the prior-year period, and the core income contribution from Roche increased to USD 832 million from USD 760 million.
Core other financial income and expense amounted to an income of USD 39 million, compared to an expense of USD 99 million in 2016, mainly on account of lower currency losses. In the prior year, the exceptional charges of USD 0.3 billion related to Venezuela were excluded from the 2016 core other financial expense.
The core tax rate (core taxes as a percentage of core pre-tax income) increased to 15.3% from 15.0% in the prior year.
Core net income was USD 11.4 billion (+1%, +2% cc), benefiting from higher core income from associated companies. Core earnings per share were USD 4.86 (+2%, +3% cc), reflecting the benefit of our share buyback program.

162 | Novartis Annual Report 2017
Factors affecting comparability of year-on-year results of operationsThe comparability of the year-on-year results of our operations for the total Group can be significantly affected by acquisitions and divestments. The transac-tions of significance during 2017 and 2016 are mentioned below.
Significant transactions in 2017
INNOVATIVE MEDICINES – ACQUISITION OF ZIARCO GROUP LIMITED
On January 20, 2017, Novartis acquired Ziarco Group Limited (Ziarco), a privately held company in the United Kingdom, focused on the development of novel treat-ments in dermatology. This acquisition adds a once-daily oral H4 receptor antagonist in development for atopic dermatitis, commonly known as eczema, to complement the Novartis dermatology portfolio and pipeline. The fair value of the total purchase consideration was USD 420 million. The amount consisted of an initial cash payment of USD 325 million and the net present value of the con-tingent consideration of USD 95 million, due to Ziarco shareholders, which they are eligible to receive upon the achievement of specified development milestones. The purchase price allocation resulted in net identifiable assets of USD 395 million and goodwill of USD 25 mil-lion. Results of operations since the date of acquisition were not material.
INNOVATIVE MEDICINES – ACQUISITION OF ENCORE VISION, INC.
On January 20, 2017, Novartis acquired Encore Vision, Inc. (Encore), a privately-held company in Fort Worth, Texas, in the United States, focused on the development of a novel treatment in presbyopia. The fair value of the total purchase consideration was USD 456 million. The amount consisted of an initial cash payment of USD 366 million and the net present value of the contingent con-sideration of USD 90 million, due to Encore sharehold-ers, which they are eligible to receive upon the achieve-ment of specified development and commercialization milestones. The purchase price allocation resulted in net identifiable assets of USD 389 million and goodwill of USD 67 million. Results of operations since the date of acquisition were not material.
Significant transactions in 2016
ALCON – ACQUISITION OF TRANSCEND MEDICAL, INC.On February 17, 2016, Alcon entered into an agreement to acquire Transcend Medical, Inc. (Transcend), a pri-vately-held, US-based company focused on developing minimally-invasive surgical devices to treat glaucoma. The transaction closed on March 23, 2016, and the fair value of the total purchase consideration was USD 332 million. The amount consisted of an initial cash payment of USD 240 million and the net present value of the con-tingent consideration of USD 92 million due to Transcend shareholders, which they are eligible to receive upon the achievement of specified development and commercial-ization milestones. The purchase price allocation resulted in net identifiable assets of USD 294 million and good-will of USD 38 million. The 2016 results of operations since the date of acquisition were not material.
INNOVATIVE MEDICINES – ACQUISITION OF REPRIXYS PHARMACEUTICALS CORPORATION
On November 18, 2016, Novartis acquired Reprixys Phar-maceuticals Corporation (Reprixys), a privately held, US-based company specializing in the development of therapeutics in certain hematologic and inflammatory disorders, following receipt of results of the SUSTAIN study. The initial interest of 19% was adjusted to its fair value of USD 64 million through the consolidated income statement at acquisition date. This re-measurement resulted in a gain of USD 53 million.
The fair value of the total purchase consideration for acquiring the 81% stake Novartis did not already own amounted to USD 268 million. The amount consisted of an initial cash payment of USD 194 million and the net present value of the contingent consideration of USD 74 million due to Reprixys shareholders, which they are eligible to receive upon the achievement of specified development and commercialization milestones. The purchase price allocation resulted in net identifiable assets of USD 332 million. No goodwill was recognized. The 2016 results of operations since the date of acqui-sition were not material.
For further details on significant transactions, see Note 2 to the Group consolidated financial statements.
Novartis Annual Report 2017 | 163FINANCIAL REPORTOperating and financial review 2017
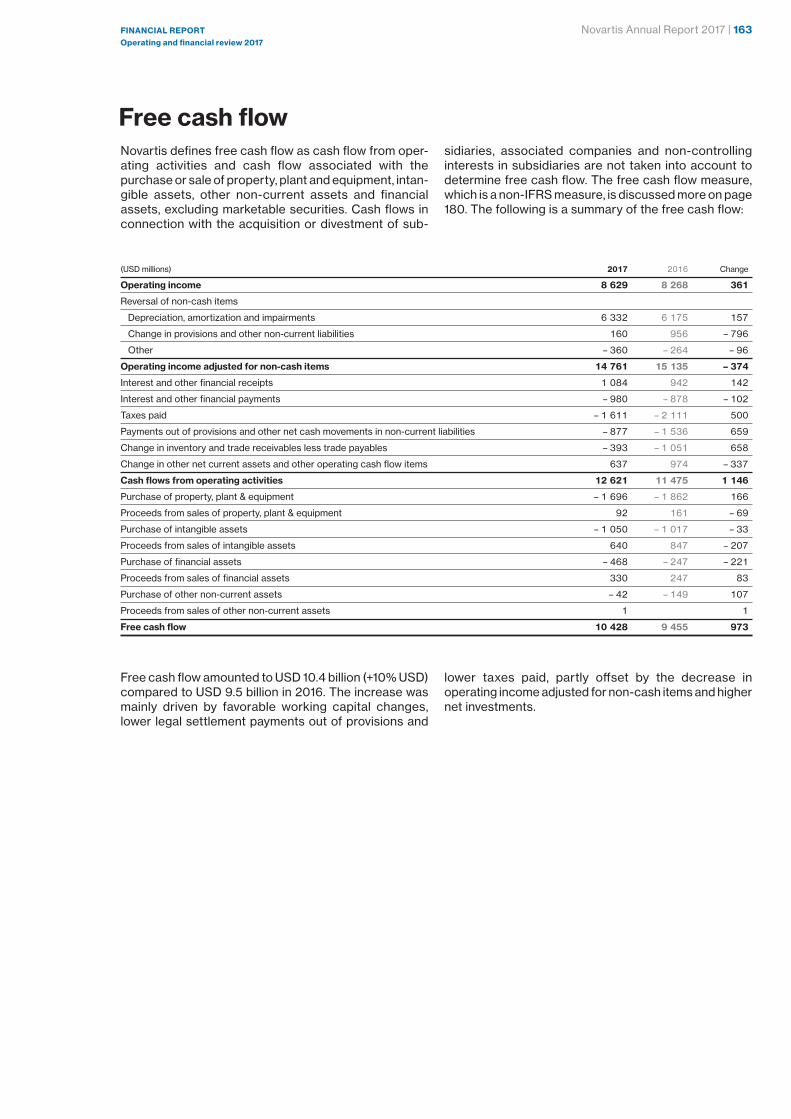
Free cash flowNovartis defines free cash flow as cash flow from oper-ating activities and cash flow associated with the purchase or sale of property, plant and equipment, intan-gible assets, other non-current assets and financial assets, excluding marketable securities. Cash flows in connection with the acquisition or divestment of sub-
sidiaries, associated companies and non-controlling interests in subsidiaries are not taken into account to determine free cash flow. The free cash flow measure, which is a non-IFRS measure, is discussed more on page 180. The following is a summary of the free cash flow:
(USD millions) 2017 2016 Change
Operating income 8 629 8 268 361
Reversal of non-cash items
Depreciation, amortization and impairments 6 332 6 175 157
Change in provisions and other non-current liabilities 160 956 – 796
Other – 360 – 264 – 96
Operating income adjusted for non-cash items 14 761 15 135 – 374
Interest and other financial receipts 1 084 942 142
Interest and other financial payments – 980 – 878 – 102
Taxes paid – 1 611 – 2 111 500
Payments out of provisions and other net cash movements in non-current liabilities – 877 – 1 536 659
Change in inventory and trade receivables less trade payables – 393 – 1 051 658
Change in other net current assets and other operating cash flow items 637 974 – 337
Cash flows from operating activities 12 621 11 475 1 146
Purchase of property, plant & equipment – 1 696 – 1 862 166
Proceeds from sales of property, plant & equipment 92 161 – 69
Purchase of intangible assets – 1 050 – 1 017 – 33
Proceeds from sales of intangible assets 640 847 – 207
Purchase of financial assets – 468 – 247 – 221
Proceeds from sales of financial assets 330 247 83
Purchase of other non-current assets – 42 – 149 107
Proceeds from sales of other non-current assets 1 1
Free cash flow 10 428 9 455 973
Free cash flow amounted to USD 10.4 billion (+10% USD) compared to USD 9.5 billion in 2016. The increase was mainly driven by favorable working capital changes, lower legal settlement payments out of provisions and
lower taxes paid, partly offset by the decrease in operating income adjusted for non-cash items and higher net investments.

164 | Novartis Annual Report 2017
Liquidity, cash flow and capital resourcesThe following table summarizes the Group’s cash flow:
(USD millions) 2017 2016 Change
Cash flows from operating activities 12 621 11 475 1 146
Cash flows used in investing activities from continuing operations – 2 979 – 2 693 – 286
Cash flows used in investing activities from discontinued operations – 140 – 748 608
Cash flows used in financing activities – 7 733 – 5 314 – 2 419
Effect of exchange rate changes on cash and cash equivalents 84 – 387 471
Net change in cash and cash equivalents 1 853 2 333 – 480
Change in marketable securities, commodities, time deposits and derivative financial instruments – 145 – 3 – 142
Change in current and non-current financial debts and derivative financial instruments – 4 730 – 1 871 – 2 859
Change in net debt – 3 022 459 – 3 481
Net debt at January 1 – 16 025 – 16 484 459
Net debt at December 31 – 19 047 – 16 025 – 3 022
Cash flows from operating activities amounted to USD 12.6 billion, compared to USD 11.5 billion in 2016. The increase of USD 1.1 billion was mainly driven by favor-able working capital changes, lower legal settlement payments out of provisions and lower taxes paid, partly offset by the decrease in net income adjusted for non-cash items.
Cash flows used in investing activities from continu-ing operations amounted to USD 3.0 billion in 2017. This amount included cash outflows for the purchase of prop-erty, plant and equipment of USD 1.7 billion, for intangi-ble assets of USD 1.1 billion, for financial assets and other non-current assets of USD 0.5 billion and for acquisi-tions and divestments of businesses, net (mainly the Ziarco Group Limited and Encore Vision, Inc. acquisi-tions) of USD 0.8 billion. This was partly offset by cash inflows from the sale of property, plant and equipment, intangible assets and financial assets of USD 1.1 billion.
In 2016, cash flows used in investing activities from continuing operations amounted to USD 2.7 billion. This amount included cash outflows for the purchase of prop-erty, plant and equipment of USD 1.9 billion, for intangi-ble assets of USD 1.0 billion, for financial assets and other non-current assets of USD 0.4 billion and for acquisi-tions and divestments of businesses, net (including the Transcend Medical, Inc. and Reprixys Pharmaceuticals Corporation acquisitions) of USD 0.8 billion. This was partly offset by cash inflows from the sale of property, plant and equipment, intangible assets and financial assets of USD 1.3 billion and from the net proceeds from sales of marketable securities and commodities of USD 0.1 billion.
Cash flows used in investing activities from discon-tinued operations, which consists of payments out of provisions related to the portfolio transformation trans-actions, amounted to USD 0.1 billion, compared to USD 0.7 billion in 2016, which also included capital gains taxes.
The cash flows used in financing activities amounted to USD 7.7 billion, compared to USD 5.3 billion in 2016. The 2017 amount included cash outflows for the dividend payment of USD 6.5 billion and for net treasury share
transactions of USD 5.2 billion. The net cash inflows from current and non-current financial debts of USD 4.0 bil-lion were mainly from the issuance of bonds denomi-nated in US dollar and euro for a notional amount of USD 3.0 billion and EUR 1.85 billion (USD 2.0 billion), respectively, partially offset by the repayment of current and non-current financial debt of USD 0.9 billion.
The 2016 cash flows used in financing activities amounted to USD 5.3 billion, which included cash out-flows for the dividend payment of USD 6.5 billion and for net treasury share transactions of USD 0.9 billion. The net cash inflows from current and non-current financial debts of USD 2.1 billion was mainly from the increase in short-term borrowings of USD 1.8 billion and from the issuance of two euro denominated bonds for total pro-ceeds of USD 1.9 billion, partially offset by the repayment at maturity of a euro denominated bond of USD 1.7 bil-lion.
Group net debt
Group net debt consists of:
(USD millions) 2017 2016 Change
Non-current financial debts – 23 224 – 17 897 – 5 327
Current financial debts
and derivative financial
instruments – 5 308 – 5 905 597
Total financial debt – 28 532 – 23 802 – 4 730
Less liquidity
Cash and cash equivalents 8 860 7 007 1 853
Marketable securities,
commodities, time deposits
and derivative financial
instruments 625 770 – 145
Total liquidity 9 485 7 777 1 708
Net debt at December 31 – 19 047 – 16 025 – 3 022
Group net debt increased to USD 19.0 billion at the end of 2017 from USD 16.0 billion at the end of 2016, mainly due to increased borrowings.

Novartis Annual Report 2017 | 165FINANCIAL REPORTOperating and financial review 2017
Total financial debt increased by USD 4.7 billion to USD 28.5 billion at December 31, 2017, from USD 23.8 billion at December 31, 2016.
Non-current financial debt increased by USD 5.3 bil-lion to USD 23.2 billion at December 31, 2017 from USD 17.9 billion at December 2016, mainly due to the issuance of bonds in the first quarter that are denomi-nated in US dollar and euro for a notional amount of USD 3.0 billion and EUR 1.85 billion (USD 2.0 billion), respectively.
Current financial debt decreased by USD 0.6 billion to USD 5.3 billion at December 31, 2017, from USD 5.9 billion at December 31, 2016, mainly due to a reduction in short-term borrowings. Overall current financial debt consists of the current portion of non-current financial debt of USD 0.4 billion and other short-term borrowings of USD 4.9 billion, including derivatives and commercial paper.
Novartis has two US commercial paper programs under which it can issue up to USD 9.0 billion in the aggregate of unsecured commercial paper notes. Novartis also has a Japanese commercial paper program under which it can issue up to JPY 150 billion (approxi-mately USD 1.3 billion) of unsecured commercial paper notes. Commercial paper notes totaling USD 2.3 billion under these three programs were outstanding as per December 31, 2017. Novartis further has a committed credit facility of USD 6.0 billion, entered into on Septem-ber 23, 2015. This credit facility is provided by a syndi-cate of banks and is intended to be used as a backstop for the US commercial paper programs. It matures in September 2020 and was undrawn as per December 31, 2017.
The long-term credit rating for the company contin-ues to be double-A (Moody’s Aa3; Standard & Poor’s AA–; Fitch AA).
We are not aware of any significant demands to change the level of liquidity needed to support our nor-mal business activities. We make use of various borrow-ing facilities provided by several financial institutions. We also successfully issued various bonds in previous years (including 2016 and 2017), and raised funds through our commercial paper programs. In addition, reverse repur-chasing agreements are contracted and Novartis has entered into credit support agreements with various banks for derivative transactions.
The maturity schedule of our net debt can be found in Note 28 to the consolidated financial statements on page 249.The following table provides a breakdown of liquidity and financial debt by currency:
Liquidity and financial debt by currency (as of December 31)
Financial Financial
Liquidity Liquidity debt in % debt in %
in % 2017 1 in % 2016 1 2017 2 2016 2
US dollar (USD) 77 77 63 66
Euro (EUR) 8 9 20 13
Swiss franc (CHF) 5 5 11 13
Japanese yen (JPY) 1 4 5
Other 9 9 2 3
100 100 100 100
1 Liquidity includes cash and cash equivalents, marketable securities, commodities and time deposits.
2 Financial debt includes non-current and current financial debt.
Contractual obligationsThe following table summarizes the Group’s contractual obligations and other commercial commitments, as well as the effect these obligations and commitments are expected to have on the Group’s liquidity and cash flow in future periods:
Payments due by period
Less than After
(USD millions) Total 1 year 2–3 years 4–5 years 5 years
Non-current financial debt, including current portion 23 583 359 5 170 4 679 13 375
Interest on non-current financial debt, including current portion 6 244 620 977 788 3 859
Operating leases 3 169 309 384 255 2 221
Unfunded pensions and other post-employment benefit plans 2 179 121 249 257 1 552
Research & Development potential milestone commitments 4 306 780 1 535 1 154 837
Property, plant & equipment purchase commitments 318 247 71
Acquisition of business and intangible asset commitments 1 4 000 4 000
Total contractual cash obligations 43 799 6 436 8 386 7 133 21 844
1 For acquisition of business commitments, please refer to Note 2 to the Group consolidated financial statements.
The Group intends to fund the Research & Development, Property, plant & equipment and intangible asset pur-chase commitments with internally generated resources.
The Group intends to fund the acquisition of business (USD 3.9 billion) mainly through external short- and long-term debt.

166 | Novartis Annual Report 2017
Effects of currency fluctuationsWe transact our business in many currencies other than the US dollar, our reporting currency.
The following provides an overview of net sales and operating expenses for our operations based on IFRS values for 2017 and 2016 for currencies most important to the Group:
2017 2016
Operating Operating
Net sales expenses Net sales expenses
Currency % % % %
US dollar (USD) 37 42 38 43
Euro (EUR) 26 22 26 23
Swiss franc (CHF) 2 15 2 15
Japanese yen (JPY) 6 4 7 5
Chinese yuan (CNY) 4 3 4 3
British pound (GBP) 2 2 3 2
Canadian dollar (CAD) 3 1 3 1
Brazilian real (BRL) 2 1 2 1
Australian dollar (AUD) 2 1 2 1
Russian ruble (RUB) 2 1 1 1
Other currencies 14 8 12 5
Operating expenses in the above table include Cost of goods sold, Marketing & Sales, Research & Development, General & Administration, Other income and Other expense.
We prepare our consolidated financial statements in US dollars. As a result, fluctuations in the exchange rates between the US dollar and other currencies can have a significant effect on both the Group’s results of operations as well as on the reported value of our assets, liabilities and cash flows. This in turn may significantly affect reported earnings (both positively and negatively) and the comparability of period-to-period results of operations.
For purposes of our consolidated balance sheets, we translate assets and liabilities denominated in other cur-rencies into US dollars at the prevailing market exchange rates as of the relevant balance sheet date. For purposes of the Group’s consolidated income and cash flow state-ments, revenue, expense and cash flow items in local currencies are translated into US dollars at average exchange rates prevailing during the relevant period. As a result, even if the amounts or values of these items remain unchanged in the respective local currency, changes in exchange rates have an impact on the amounts or values of these items in our consolidated financial statements.
Because our expenditures in Swiss francs are sig-nificantly higher than our revenues in Swiss francs, vol-atility in the value of the Swiss franc can have a signifi-cant impact on the reported value of our earnings, assets and liabilities, and the timing and extent of such volatility
can be difficult to predict. In addition, there is a risk that certain countries could take steps that could significantly impact the value of their currencies.
There is also a risk that certain countries could devalue their currency. If this occurs, it could impact the effective prices we would be able to charge for our products and also have an adverse impact on both our consolidated income statement and balance sheet. The Group is exposed to a potential adverse devaluation risk on its inter-company funding and total investment in certain subsid-iaries operating in countries with exchange controls.
The most significant country in this respect was Ven-ezuela, where the Group incurred significant foreign exchange losses in 2015 and 2016.
Subsidiaries whose functional currencies have expe-rienced a cumulative inflation rate of more than 100% over the past three years apply the rules of IAS 29 “Finan-cial Reporting in Hyperinflationary Economies”. Gains and losses incurred upon adjusting the carrying amounts of non-monetary assets and liabilities for inflation are recognized in the income statement. The subsidiaries in Venezuela restate non-monetary items in the balance sheet in line with the requirements of IAS 29.
The Group’s subsidiaries in Venezuela are experienc-ing a significant reduction in approvals for remittance of US dollars outside the country at the exchange rate avail-able for imports of specific goods and services of national priority, including medicines and medical supplies. Since November 2016, the Group has applied the floating rate of DICOM (Sistema de Divisa Comple-mentaria) to translate the financial statements of its Venezuelan subsidiaries. This change from the rate appli-cable for imports of specific goods and services of national priority to the floating rate of DICOM resulted in a USD 0.3 billion revaluation loss on the outstanding intercompany balances in 2016. The net outstanding intercompany payable balance of Venezuela sub sidiaries was not significant at December 31, 2017 and at Decem-ber 31, 2016, due to reserves against the intercompany balances.
The Group manages its global currency exposure by engaging in hedging transactions where management deems appropriate, after taking into account the natural hedging afforded by our global business activity. For 2017, we entered into various contracts that change in value with movements in foreign exchange rates to pre-serve the value of assets, commitments and expected transactions. We use forward contracts and foreign currency options to hedge. For more information on how these transactions affect our consolidated financial statements and on how foreign exchange rate exposure is managed, see Notes 1, 5, 15 and 28 to the Group’s consolidated financial statements.

Novartis Annual Report 2017 | 167FINANCIAL REPORTOperating and financial review 2017
The following table sets forth the foreign exchange rates of the US dollar against key currencies used for foreign currency translation when preparing the Group’s consolidated financial statements:
Average for year Year-end
USD per unit 2017 2016 Change in % 2017 2016 Change in %
Australian dollar (AUD) 0.766 0.744 3 0.779 0.722 8
Brazilian real (BRL) 0.313 0.288 9 0.302 0.307 – 2
Canadian dollar (CAD) 0.771 0.755 2 0.797 0.741 8
Swiss franc (CHF) 1.016 1.015 0 1.024 0.978 5
Chinese yuan (CNY) 0.148 0.151 – 2 0.154 0.144 7
Euro (EUR) 1.129 1.107 2 1.195 1.051 14
British pound (GBP) 1.288 1.355 – 5 1.347 1.227 10
Japanese yen (JPY (100)) 0.892 0.922 – 3 0.888 0.854 4
Russian ruble (RUB (100)) 1.715 1.498 14 1.734 1.648 5
The following table provides a summary of the currency impact on key Group figures due to their conversion into USD, the Group’s reporting currency, of the financial data from entities reporting in non-US dollars. Constant
currency (cc) calculations apply the exchange rates of the prior year to the current year financial data for entities reporting in non-US dollars.
Currency impact on key figures
Change in Percentage Change in Percentage
constant Change in point currency constant Change in point currency
currencies % USD % impact currencies % USD % impact
2017 2017 2017 2016 2016 2016
Net sales 2 1 – 1 0 – 2 – 2
Operating income 7 4 – 3 – 3 – 8 – 5
Net income 12 15 3 1 – 5 – 6
Core operating income 0 – 1 – 1 – 2 – 6 – 4
Core net income 2 1 – 1 – 3 – 6 – 3
For additional information on the effects of currency fluctuations, see Note 28 to the Group’s consolidated financial statements.
168 | Novartis Annual Report 2017
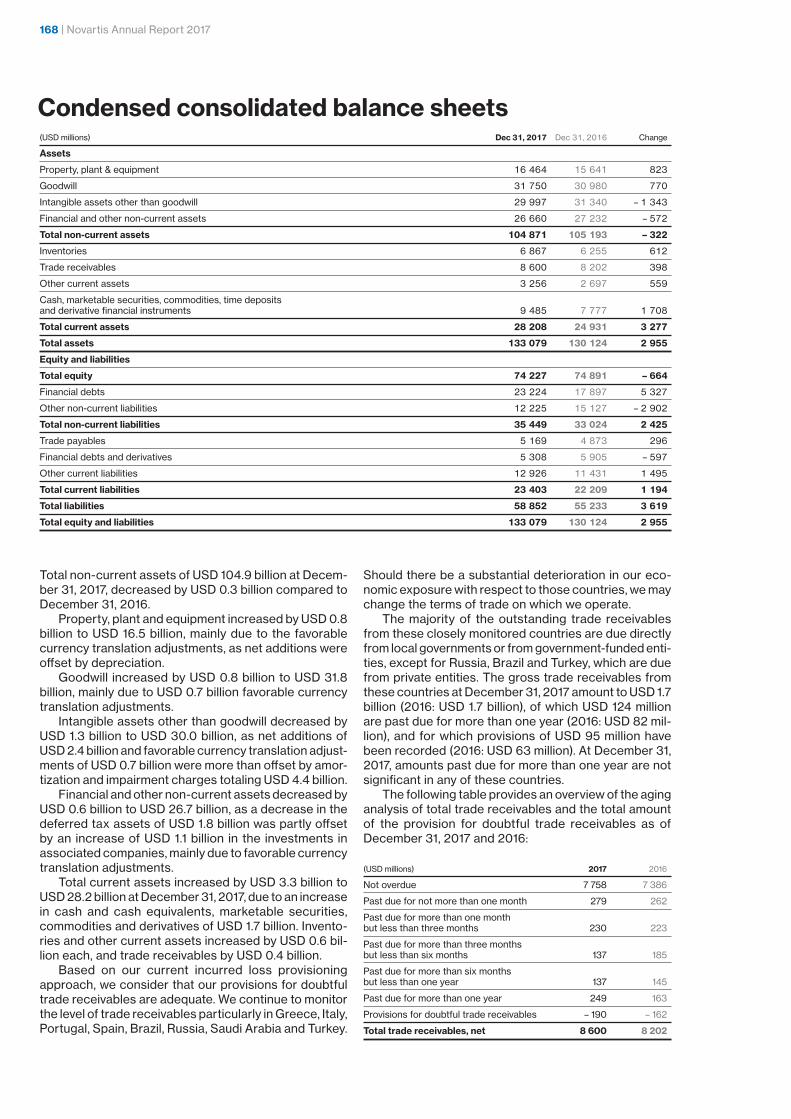
Condensed consolidated balance sheets(USD millions) Dec 31, 2017 Dec 31, 2016 Change
Assets
Property, plant & equipment 16 464 15 641 823
Goodwill 31 750 30 980 770
Intangible assets other than goodwill 29 997 31 340 – 1 343
Financial and other non-current assets 26 660 27 232 – 572
Total non-current assets 104 871 105 193 – 322
Inventories 6 867 6 255 612
Trade receivables 8 600 8 202 398
Other current assets 3 256 2 697 559
Cash, marketable securities, commodities, time deposits
and derivative financial instruments 9 485 7 777 1 708
Total current assets 28 208 24 931 3 277
Total assets 133 079 130 124 2 955
Equity and liabilities
Total equity 74 227 74 891 – 664
Financial debts 23 224 17 897 5 327
Other non-current liabilities 12 225 15 127 – 2 902
Total non-current liabilities 35 449 33 024 2 425
Trade payables 5 169 4 873 296
Financial debts and derivatives 5 308 5 905 – 597
Other current liabilities 12 926 11 431 1 495
Total current liabilities 23 403 22 209 1 194
Total liabilities 58 852 55 233 3 619
Total equity and liabilities 133 079 130 124 2 955
Total non-current assets of USD 104.9 billion at Decem-ber 31, 2017, decreased by USD 0.3 billion compared to December 31, 2016.
Property, plant and equipment increased by USD 0.8 billion to USD 16.5 billion, mainly due to the favorable currency translation adjustments, as net additions were offset by depreciation.
Goodwill increased by USD 0.8 billion to USD 31.8 billion, mainly due to USD 0.7 billion favorable currency translation adjustments.
Intangible assets other than goodwill decreased by USD 1.3 billion to USD 30.0 billion, as net additions of USD 2.4 billion and favorable currency translation adjust-ments of USD 0.7 billion were more than offset by amor-tization and impairment charges totaling USD 4.4 billion.
Financial and other non-current assets decreased by USD 0.6 billion to USD 26.7 billion, as a decrease in the deferred tax assets of USD 1.8 billion was partly offset by an increase of USD 1.1 billion in the investments in associated companies, mainly due to favorable currency translation adjustments.
Total current assets increased by USD 3.3 billion to USD 28.2 billion at December 31, 2017, due to an increase in cash and cash equivalents, marketable securities, commodities and derivatives of USD 1.7 billion. Invento-ries and other current assets increased by USD 0.6 bil-lion each, and trade receivables by USD 0.4 billion.
Based on our current incurred loss provisioning approach, we consider that our provisions for doubtful trade receivables are adequate. We continue to monitor the level of trade receivables particularly in Greece, Italy, Portugal, Spain, Brazil, Russia, Saudi Arabia and Turkey.
Should there be a substantial deterioration in our eco-nomic exposure with respect to those countries, we may change the terms of trade on which we operate.
The majority of the outstanding trade receivables from these closely monitored countries are due directly from local governments or from government-funded enti-ties, except for Russia, Brazil and Turkey, which are due from private entities. The gross trade receivables from these countries at December 31, 2017 amount to USD 1.7 billion (2016: USD 1.7 billion), of which USD 124 million are past due for more than one year (2016: USD 82 mil-lion), and for which provisions of USD 95 million have been recorded (2016: USD 63 million). At December 31, 2017, amounts past due for more than one year are not significant in any of these countries.
The following table provides an overview of the aging analysis of total trade receivables and the total amount of the provision for doubtful trade receivables as of December 31, 2017 and 2016:
(USD millions) 2017 2016
Not overdue 7 758 7 386
Past due for not more than one month 279 262
Past due for more than one month
but less than three months 230 223
Past due for more than three months
but less than six months 137 185
Past due for more than six months
but less than one year 137 145
Past due for more than one year 249 163
Provisions for doubtful trade receivables – 190 – 162
Total trade receivables, net 8 600 8 202

Novartis Annual Report 2017 | 169FINANCIAL REPORTOperating and financial review 2017
There is also a risk that certain countries could devalue their currency. Currency exposures are described in more detail in the “Effects of currency fluctuations” sec-tion on page 166.
Trade payables increased by USD 0.3 billion to USD 5.2 billion, and other current liabilities increased by USD 1.5 billion to USD 12.9 billion.
Current income tax liabilities increased by USD 0.1 billion to USD 1.7 billion. While there is some uncertainty about the final taxes to be assessed in our major coun-tries, we believe that our estimated amounts for current income tax liabilities, including amounts related to uncer-tain tax positions, are appropriate based on currently known facts and circumstances.
In our key countries, Switzerland and the United States, assessments have been agreed by the tax authorities up to 2014 in Switzerland and up to 2012 in the United States, with the exception of one open United States position related to the 2007 tax filing and one for the 2010 tax filing.
Other non-current liabilities which include deferred tax liabilities, provisions and other non-current liabilities decreased by USD 2.9 billion to USD 12.2 billion at Decem-ber 31, 2017, mainly due to a reduction of the pension obli-gations of USD 1.3 billion resulting from actuarial gains and a change in the accounting for a component of the Swiss pension plan from defined benefit to defined con-tribution plan.
Novartis believes that its total provisions are ade-quate based upon currently available information. How-ever, given the inherent difficulties in estimating liabilities in this area, Novartis may incur additional costs beyond the amounts provided. Management believes that such additional amounts, if any, would not be material to the Group’s financial condition but could be material to the results of operations or cash flows in a given period.
The Group’s equity decreased by USD 0.7 billion to USD 74.2 billion at December 31, 2017, compared to USD 74.9 billion at December 31, 2016. The decrease was mainly on account of USD 6.5 billion for the dividend pay-ment and net treasury share purchases of USD 5.3 billion. These amounts resulting from transactions with share-holders were partially offset by net income of USD 7.7 bil-lion, favorable currency translation differences of USD 2.2 billion, net actuarial gains from defined benefit plans of USD 0.9 billion, and equity-based compensation of USD 0.6 billion.
The Group’s liquidity amounted to USD 9.5 billion at December 31, 2017, compared to USD 7.8 billion at December 31, 2016, and net debt increased to USD 19.0 billion at December 31, 2017, compared to USD 16.0 bil-lion at December 31, 2016. The debt/equity ratio increased to 0.38:1 at December 31, 2017, compared to 0.32:1 at December 31, 2016.
Summary of equity movements attributable to Novartis AG shareholders
Number of outstanding shares (in millions) Issued share capital and reserves attributable to Novartis AG shareholders
2017 2016 Change
2017 2016 Change USD millions USD millions USD millions
Balance at beginning of year 2 374.1 2 373.9 0.2 74 832 77 046 – 2 214
Shares acquired to be canceled – 66.2 – 10.3 – 55.9 – 5 270 – 784 – 4 486
Other share purchases – 3.8 – 2.6 – 1.2 – 304 – 208 – 96
Exercise of options and employee transactions 4.6 4.1 0.5 255 214 41
Equity-based compensation 8.8 9.0 – 0.2 612 664 – 52
Dividends – 6 495 – 6 475 – 20
Net income of the year attributable to shareholders
of Novartis AG 7 703 6 712 991
Impact of change in ownership of consolidated entities – 7 7
Other comprehensive income attributable to shareholders
of Novartis AG 2 835 – 2 330 5 165
Balance at end of year 2 317.5 2 374.1 – 56.6 74 168 74 832 – 664
During 2017, 13.4 million treasury shares for USD 0.9 bil-lion were delivered as a result of options being exercised and physical share deliveries related to equity-based participation plans (2016: 13.1 million shares for USD 0.9 billion). Novartis repurchased in total 66.2 million shares for USD 5.3 billion on the SIX Swiss Exchange second trading line under the CHF 10 billion share buyback authority approved at the 2016 Annual General Meeting (AGM) (2016: 10.3 million shares for USD 0.8 billion). This included 56.4 million shares bought for USD 4.5 billion under the up-to USD 5.0 billion share buyback announced
in January 2017, and 9.8 million shares bought for USD 0.8 billion to offset the dilutive impact from equity-based par-ticipation plans (2016: 10.3 million shares for USD 0.8 bil-lion). In addition, 3.8 million shares for USD 0.3 billion were acquired from employees, which were previously granted to them under the respective programs (2016: 2.6 million for USD 0.2 billion). No shares were repurchased on the SIX Swiss Exchange first trading line in 2017 and 2016. With these transactions, the total number of shares out-standing decreased by 56.6 million shares in 2017 (2016: increase of 0.2 million shares).

170 | Novartis Annual Report 2017
Critical accounting policies and estimatesOur significant accounting policies are set out in Note 1 to the Group’s consolidated financial statements, which are prepared in accordance with International Financial Reporting Standards (IFRS) as issued by the Interna-tional Accounting Standards Board (IASB).
Given the uncertainties inherent in our business activ-ities, we must make certain estimates and assumptions that require difficult, subjective and complex judgments. Because of uncertainties inherent in such judgments, actual outcomes and results may differ from our assump-tions and estimates, which could materially affect the Group’s consolidated financial statements. Application of the following accounting policies requires certain assumptions and estimates that have the potential for the most significant impact on our consolidated financial statements.
Deductions from revenues
As is typical in the pharmaceutical industry, our gross sales are subject to various deductions which are pri-marily composed of rebates and discounts to retail cus-tomers, government agencies, wholesalers, health insur-ance companies and managed healthcare organizations. These deductions represent estimates of the related obligations, requiring the use of judgement when esti-mating the effect of these sales deductions on gross sales for a reporting period. These adjustments are deducted from gross sales to arrive at net sales.
The following summarizes the nature of some of these deductions and how the deduction is estimated. After recording these, net sales represent our best esti-mate of the cash that we expect to ultimately collect. The US market has the most complex arrangements related to revenue deductions.
United States specific healthcare plans and program rebatesThe United States Medicaid Drug Rebate Program is administered by State governments using State and Fed-eral funds to provide assistance to certain vulnerable and needy individuals and families. Calculating the rebates to be paid related to this program involves inter-preting relevant regulations, which are subject to chal-lenge or change in interpretative guidance by govern-ment authorities. Provisions for estimating Medicaid rebates are calculated using a combination of historical experience, product and population growth, product pricing and the mix of contracts and specific terms in the individual State agreements.
The United States Federal Medicare Program, which funds healthcare benefits to individuals age 65 or older and certain disabilities, provides prescription drug ben-efits under Part D section of the program. This benefit is provided and administrated through private prescrip-tion drug plans. Provisions for estimating Medicare Part D rebates are calculated based on the terms of indi-vidual plan agreements, product sales and population growth, product pricing and the mix of contracts.
We offer rebates to key managed healthcare and pri-vate plans in an effort to sustain and increase market share of our products, and to ensure patient access.
These programs provide a rebate after the plans have demonstrated they have met all terms and conditions set forth in their contract with us. These rebates are esti-mated based on the terms of individual agreements, his-torical experience, product pricing, and projected prod-uct growth rates. These provisions are adjusted based on established processes and experiences from filing data with individual states and plans.
There is often a time lag of several months between us recording the revenue deductions and our final accounting for them.
Non-United States specific healthcare plans and program rebatesIn certain countries other than the US, we provide rebates to governments and other entities. These rebates are often mandated by laws or government regulations.
In several countries, especially in Europe and Austra-lia, we enter into innovative pay-for- performance arrange-ments with certain healthcare providers. Under these agreements, we may be required to make refunds to the healthcare providers or to provide additional medicines free of charge if anticipated treatment outcomes do not meet predefined targets. Potential refunds and the deliv-ery of additional medicines at no cost are estimated and recorded as a deduction of revenue at the time the related revenues are recorded. Estimates are based on historical experience and clinical data. In cases where historical experience and clinical data are not sufficient for a reliable estimation of the outcome, revenue recog-nition would be deferred until such history would be avail-able. In addition, we offer global patient assistance pro-grams.
There is often a time lag of several months between us recording the revenue deductions and our final accounting for them.
Non-healthcare plans and program rebates, returns and other deductionsWe offer rebates to purchasing organizations and other direct and indirect customers to sustain and increase market share, and to ensure patient access to our prod-ucts. Since rebates are contractually agreed upon, the related provisions are estimated based on the terms of the individual agreements, historical experience, and projected product growth rates.
Charge-backs occur where our subsidiaries have arrangements with indirect customers to sell products at prices that are lower than the price charged to whole-salers. A charge-back represents the difference between the invoice price to the wholesaler and the indirect cus-tomer’s contract price. We account for vendor charge-backs by reducing revenue for the estimate of charge-backs attributable to a sale transaction. Provisions for estimated charge-backs are calculated using a combi-nation of factors such as historical experience, product growth rates, payments, product pricing, level of inven-tory in the distribution channel, the terms of individual agreements and our estimate of the claims processing time lag.
When we sell a product providing a customer the right to return it, we record a provision for estimated sales returns based on our sales return policy and historical

Novartis Annual Report 2017 | 171FINANCIAL REPORTOperating and financial review 2017
return rates. Other factors considered include actual product recalls, expected marketplace changes, the remaining shelf life of the product, and the expected entry of generic products. In 2017, sales returns amounted to approximately 1% of gross product sales. If sufficient experience is not available, sales are only recorded based on evidence of product consumption or when the right of return has expired.
We enter into distribution service agreements with major wholesalers, which provide a financial disincentive for the wholesalers to purchase product quantities in excess of current customer demand. Where possible, we adjust shipping patterns for our products to maintain wholesalers’ inventory levels consistent with underlying patient demand.
We offer cash discounts to customers to encourage prompt payment. Cash discounts are estimated and accrued at the time of invoicing and are deducted from revenue.
Following a decrease in the price of a product, we generally grant customers a “shelf stock adjustment” for their existing inventory for the relevant product. Provi-sions for shelf stock adjustments, which are primarily
relevant within the Sandoz Division, are determined at the time of the price decline or at the point of sale, if the impact of a price decline on the products sold can be reasonably estimated based on the customer’s inventory levels of the relevant product.
Other sales discounts, such as consumer coupons and co-pay discount cards, are offered in some markets. The estimated amounts of these discounts are recorded at the time of sale, or when the coupons are issued, and are estimated utilizing historical experience and the spe-cific terms for each program. If a discount for a proba-ble future transaction is offered as part of a sales trans-action then an appropriate portion of revenue is deferred to cover this estimated obligation.
We adjust provisions for revenue deductions period-ically to reflect actual experience. To evaluate the ade-quacy of provision balances, we use internal and exter-nal estimates of the inventory in transit, the level of inventory in the distribution and retail channels actual claims data received and the time lag for processing rebate claims. External data sources include reports from wholesalers and third-party market data purchased by Novartis.
The following table shows the worldwide extent of our revenue deductions provisions and related payment experiences for the Innovative Medicines, Sandoz and Alcon Divisions:
Provisions for deductions from revenue
Income statement charge
Effect of Change in
Revenue currency provisions Revenue
deductions translation offset against deductions
provisions at and business Payments/ Adjustments gross trade provisions at
(USD millions) January 1 combinations utilizations of prior years Current year receivables December 31
2017
US-specific healthcare plans and program rebates 1 461 – 3 684 – 62 3 875 1 590
Non-US-specific healthcare plans and program rebates 1 020 131 – 1 954 80 2 186 – 107 1 356
Non-healthcare plans and program-related rebates,
returns and other deductions 1 702 65 – 11 814 – 127 12 045 – 145 1 726
Total 2017 4 183 196 – 17 452 – 109 18 106 – 252 4 672
2016
US-specific healthcare plans and program rebates 1 165 – 3 203 7 3 492 1 461
Non-US-specific healthcare plans and program rebates 1 024 – 31 – 1 844 – 26 1 883 14 1 020
Non-healthcare plans and program-related rebates,
returns and other deductions 1 601 – 19 – 11 142 – 117 11 383 – 4 1 702
Total 2016 3 790 – 50 – 16 189 – 136 16 758 10 4 183

172 | Novartis Annual Report 2017
The table below shows the gross to net sales reconciliation for our Innovative Medicines Division:
Gross to net sales reconciliation
Income statement charge
Charged directly
Charged through without being
revenue deduction recorded in revenue
provisions deduction provisions Total In % of
USD millions USD millions USD millions gross sales
2017
Innovative Medicines gross sales subject to deductions 43 994 100.0
US-specific healthcare plans and program rebates – 3 303 – 3 303 – 7.5
Non-US-specific healthcare plans and program rebates – 1 722 – 956 – 2 678 – 6.1
Non-healthcare plans and program-related rebates, returns and other deductions – 2 698 – 2 290 – 4 988 – 11.3
Total Innovative Medicines gross to net sales adjustments – 7 723 – 3 246 – 10 969 – 24.9
Innovative Medicines net sales 2017 33 025 75.1
2016
Innovative Medicines gross sales subject to deductions 42 630 100.0
US-specific healthcare plans and program rebates – 3 051 – 3 051 – 7.2
Non-US-specific healthcare plans and program rebates – 1 352 – 885 – 2 237 – 5.2
Non-healthcare plans and program-related rebates, returns and other deductions – 2 736 – 2 044 – 4 780 – 11.2
Total Innovative Medicines gross to net sales adjustments – 7 139 – 2 929 – 10 068 – 23.6
Innovative Medicines net sales 2016 32 562 76.4
Surgical equipment revenue
Surgical equipment is often sold together with other products and services under a single contract. The total consideration is allocated to the separate elements based on their relative fair values. Revenue is recognized once the recognition criteria have been met for each ele-ment of the contract.
For surgical equipment, in addition to cash and instal-ment sales, revenue is recognized under finance and operating lease arrangements. Arrangements in which Novartis transfers substantially all the risks and rewards incidental to ownership to the customer are treated as finance lease arrangements. Revenue from finance lease arrangements is recognized at amounts equal to the fair values of the equipment, which approximate the present values of the minimum lease payments under the arrange-ments. As interest rates embedded in lease arrange-ments are approximately market rates, revenue under finance lease arrangements is comparable to revenue for outright sales. Finance income for arrangements in excess of twelve months is deferred and subsequently recognized based on a pattern that approximates the use of the effective interest method and recorded in “Other income”. Operating lease revenue for equipment rentals is recognized on a straight-line basis over the lease term.
Impairment of goodwill, intangible assets and property, plant and equipmentWe review long-lived intangible assets and property, plant and equipment for impairment whenever events or changes in circumstance indicate that the asset’s bal-ance sheet carrying amount may not be recoverable. Goodwill, the Alcon brand name and other currently not amortized intangible assets are reviewed for impairment at least annually.
An asset is generally considered impaired when its balance sheet carrying amount exceeds its estimated recoverable amount, which is defined as the higher of its fair value less costs of disposal and its value in use. Usu-ally, Novartis adopts the fair value less costs of disposal method for its impairment evaluation. In most cases no directly observable market inputs are available to mea-sure the fair value less costs of disposal. Therefore, an estimate of fair value less costs of disposal is derived indirectly and is based on net present value techniques utilizing post-tax cash flows and discount rates. In the limited cases where the value in use method is applied, net present value techniques are utilized using pre-tax cash flows and discount rates.

Novartis Annual Report 2017 | 173FINANCIAL REPORTOperating and financial review 2017
Fair value reflects estimates of assumptions that mar-ket participants would be expected to use when pricing the asset and for this purpose management considers the range of economic conditions that are expected to exist over the remaining useful life of the asset. The esti-mates used in calculating net present values are highly sensitive, and depend on assumptions specific to the nature of the Group’s activities with regard to:• amount and timing of projected future cash flows;• behavior of competitors (launch of competing products,
marketing initiatives, etc.);• probability of obtaining regulatory approvals;• future tax rates;• appropriate royalty rate for the Alcon brand name;• appropriate terminal growth rate; and• appropriate discount rate.
Due to the above factors and those further described in Note 1, actual cash flows and values could vary signifi-cantly from forecasted future cash flows and related val-ues derived using discounting techniques.
The recoverable amount of the grouping of cash gen-erating units to which goodwill and indefinite life intan-gible assets are allocated is based on fair value less costs of disposal. The valuations are derived from applying dis-counted future cash flows based on key assumptions, including the terminal growth rate and discount rate. For additional information see Note 10 starting on page 214.
In 2017, intangible asset impairment charges of USD 709 million were recognized, of which USD 591 million was recorded in the Innovative Medicines Division, USD 61 million in the Sandoz Division, and USD 57 million in the Alcon Division.
In 2016, intangible asset impairment charges for con-tinuing operations of USD 591 million were recognized, of which USD 522 million was recorded in the Innovative Medicines Division, USD 65 million in the Sandoz Divi-sion, and USD 4 million in the Alcon Division.
In 2017 and in 2016, there were no reversals of pri-or-year impairment charges.
Goodwill and other intangible assets represent a sig-nificant part of our consolidated balance sheet, primar-ily due to acquisitions. Although no significant additional impairments are currently anticipated, impairment eval-uation could lead to material impairment charges in the future. For more information, see Note 10 to the Group’s consolidated financial statements.
Additionally, net impairment charges for property, plant and equipment during 2017 amounted to USD 157 million (2016: USD 102 million).
Trade receivables
Trade receivables are initially recognized at their invoiced amounts including any related sales taxes less adjust-ments for estimated revenue deductions such as rebates, charge-backs and cash discounts.
Provisions for doubtful trade receivables are estab-lished once there is an indication that it is likely that a loss will be incurred. These provisions represent the dif-ference between the trade receivable’s carrying amount in the consolidated balance sheet and the estimated net collectible amount. Significant financial difficulties of a customer, such as probability of bankruptcy, financial reorganization, default or delinquency in payments are considered indicators that recovery of the trade receiv-able is doubtful. Trade receivable balances include sales to drug wholesalers, retailers, private health systems, government agencies, managed care providers, phar-macy benefit managers and government-supported healthcare systems. Novartis continues to monitor sov-ereign debt issues and economic conditions in Greece, Italy, Portugal, Spain, Brazil, Russia, Saudi Arabia, Tur-key and other countries, and evaluates trade receivables in these countries for potential collection risks. Substan-tially all of the trade receivables overdue from Greece, Italy, Portugal, Spain and Saudi Arabia are due directly from local governments or from government-funded enti-ties. Deteriorating credit and economic conditions as well as other factors in these countries have resulted in, and may continue to result in an increase in the average length of time that it takes to collect these trade receiv-ables and may require Novartis to re-evaluate the col-lectability of these trade receivables in future periods.
Contingent consideration
In a business combination or divestment of a business, it is necessary to recognize contingent future payments to previous owners, representing contractually defined potential amounts as a liability or asset. Usually for Novartis these are linked to milestone or royalty pay-ments related to certain assets and are recognized as a financial liability or financial asset at their fair value, which is then re-measured at each subsequent reporting date. These estimations typically depend on factors such as technical milestones or market performance and are adjusted for the probability of their likelihood of payment, and if material, are appropriately discounted to reflect the impact of time.
Changes in the fair value of contingent consideration liabilities in subsequent periods are recognized in the consolidated income statement in “Cost of goods sold” for currently marketed products and in “Research & Development” for In-Process Research and Develop-ment (IPR&D). Changes in contingent consideration assets are recognized in “Other income” or “Other expense”, depending on its nature.
The effect of unwinding the discount over time is rec-ognized for contingent liabilities in “Interest expense” and for contingent assets in “other financial income and expense” in the consolidated income statement.

174 | Novartis Annual Report 2017
Impairment of associated companies accounted for at equityNovartis considers investments in associated companies for impairment evaluation whenever objective evidence indicates the net investment may be impaired, including when a quoted share price indicates a fair value less than the per-share balance sheet carrying value for the investment.
If the recoverable amount of the investment is esti-mated to be lower than the balance sheet carrying amount an impairment charge is recognized for the difference in the consolidated income statement under “Income from associated companies”.
Retirement and other post-employment benefit plansWe sponsor pension and other post-employment bene-fit plans in various forms that cover a significant portion of our current and former associates. For post-employ-ment plans with defined benefit obligations, we are required to make significant assumptions and estimates about future events in calculating the expense and the present value of the liability related to these plans. These include assump-tions about the interest rates we apply to estimate future defined benefit obligations and net periodic pension expense, as well as rates of future pension increases. In addition, our actuarial consultants provide our management with historical statistical information such as withdrawal and mortality rates in connection with these estimates.
Assumptions and estimates used by the Group may differ materially from the actual results we experience due to changing market and economic conditions, higher or lower withdrawal rates, and longer or shorter life spans of participants among other factors. For example, in 2017, a decrease in the interest rate we apply in determining the present value of the defined benefit obligations of one-quarter of one percent would have increased our year-end defined benefit pension obligation for plans in Switzerland, United States, United Kingdom, Germany and Japan, which represent 94% of the Group total defined benefit pension obligation, by approximately USD 0.8 bil-lion. Similarly, if the 2017 interest rate had been one quar-ter of one percentage point lower than actually assumed, the net periodic pension cost for pension plans in these countries, which represent about 82% of the Group’s total net periodic pension cost for pension plans, would have increased by approximately USD 23 million. Depending on events, such differences could have a material effect on our total equity. For more information on obligations under retirement and other post-employment benefit plans and underlying actuarial assumptions, see Note 24 to the Group’s consolidated financial statements.
Provisions and Contingencies
A number of Group companies are involved in various gov-ernment investigations and legal proceedings (intellectual property, sales and marketing practices, product liability, commercial, employment and wrongful discharge, envi-ronmental claims, etc.) arising out of the normal conduct of their businesses. For more information, see Note 19 and Note 27 to the Group’s consolidated financial statements.
We record provisions for legal proceedings when it is probable that a liability has been incurred and the amount can be reliably estimated. These provisions are adjusted periodically as assessments change or addi-tional information becomes available. For significant product liability cases, the provision is actuarially deter-mined based on factors such as past experience, amount and number of claims reported, and estimates of claims incurred but not yet reported.
Provisions are recorded for environmental remedia-tion costs when expenditure on remedial work is proba-ble and the cost can be reliably estimated. Remediation costs are provided for under “Non-current liabilities” in the Group’s consolidated balance sheet.
Provisions relating to estimated future expenditure for liabilities do not usually reflect any insurance or other claims or recoveries, since these are only recognized as assets when the amount is reasonably estimable and collection is virtually certain.
Research & Development
Internal Research & Development costs are fully charged to the consolidated income statement in the period in which they are incurred. We consider that regulatory and other uncertainties inherent in the development of new products preclude the capitalization of internal develop-ment expenses as an intangible asset usually until mar-keting approval from the regulatory authority is obtained in a relevant major market, such as for the United States, the European Union, Switzerland or Japan.
Healthcare contributions
In many countries, our subsidiaries are required to make contributions to the countries’ healthcare costs as part of programs other than the ones mentioned above under deductions from revenues. The amounts to be paid depend on various criteria such as the subsidiary’s mar-ket share or sales volume compared to certain targets. Considerable judgment is required in estimating these contributions, as not all data is available when the estimates need to be made.
The largest of these healthcare contributions relates to the US Healthcare Reform fee, which was introduced in 2011. This fee is an annual levy to be paid by US phar-maceutical companies, including various Novartis sub-sidiaries, based on each company’s qualifying sales as a percentage of the prior year’s government-funded pro-gram sales. This pharmaceutical fee levy is recognized in “Other expense”.
In addition, effective 2013, the United States govern-ment implemented a medical device sales tax that is lev-ied on the Alcon Division’s United States sales of prod-ucts which that considered surgical devices under the law. This medical device tax is initially included in the cost of inventory as, for Alcon, the tax is usually levied on intercompany sales. It is expensed as cost of goods sold when the inventory is sold to third parties. In Decem-ber 2015, Congress enacted a law that included a two-year moratorium on applying the medical device excise tax, which expired on December 31, 2017. On January 22, 2018, the US Congress extended the moratorium for an additional two years.

Novartis Annual Report 2017 | 175FINANCIAL REPORTOperating and financial review 2017
Taxes
We prepare and file our tax returns based on an inter-pretation of tax laws and regulations, and we record esti-mates based on these judgments and interpretations. Our tax returns are subject to examination by the com-petent taxing authorities, which may result in an assess-ment being made requiring payments of additional tax, interest or penalties. Since Novartis uses its intellectual property globally to deliver goods and services, the transfer prices within the Group as well as arrangements between subsidiaries to finance research and develop-ment and other activities may be challenged by the national tax authorities in any of the jurisdictions in which Novartis operates. Therefore, inherent uncertainties exist in our estimates of our tax positions, but we believe that our estimated amounts for current and deferred tax assets or liabilities, including any amounts related to any uncertain tax positions, are appropriate based on cur-rently known facts and circumstances.
New accounting pronouncements
See Note 1 to the Group’s consolidated financial state-ments.
Internal control over financial reportingThe Group’s management has assessed the effective-ness of internal control over financial reporting. The Group’s independent statutory auditor also issued an opinion on the effectiveness of internal control over financial reporting. Both the Group’s management and its external auditors concluded that the Group main-tained, in all material respects, effective internal control over financial reporting as of December 31, 2017.
Factors affecting results of operationsWe believe that our strategy, which is anchored in our company’s tradition of leadership in innovation, positions us well to take advantage of trends shaping the future of the industry. These trends range from advances in sci-ence and technology that are opening new frontiers for research and development (R&D), to the growing and graying of populations that are boosting demand for chronic disease treatments (see page 15).
At the same time, these trends contribute to certain risks and uncertainties in our operations. Anticipating and managing these risks can influence our ability to deliver strong financial performance and meet the needs of patients, healthcare providers, payors, regulators and shareholders.
Approach to risk management
The Risk Committee of the Board ensures the Group has implemented an appropriate and effective risk manage-ment system and process. It reviews with management and Internal Audit the identification, prioritization and management of the risks, the accountabilities and roles of the functions involved in risk management, the risk portfolio and the related actions implemented by man-agement. The Risk Committee informs the Board of Directors on a periodic basis.
The Group Risk Office coordinates and aligns the risk management processes, and reports to the Risk Com-mittee on a regular basis on risk assessment and risk management. Organizational and process measures have been designed to identify and mitigate risks at an early stage. Organizationally, the responsibility for risk assessment and management is allocated to the divi-sions, organizational units, and functions, with special-ized Corporate functions, such as Group Finance, Group Legal, Group Quality Assurance, Corporate Health, Safety and Environment, Business Continuity Manage-ment, Integrity & Compliance and the Business Practices Office providing support and controlling the effective-ness of risk management in these areas.
Financial risk management is described in more detail in Note 28 to the Group consolidated financial state-ments.
Risk factors
Loss of exclusivity for patented productsPharmaceutical companies routinely face generic com-petition when their products lose patent or other intel-lectual property protection, and Novartis is no exception. Major products of our Innovative Medicines Division, as well as certain products of our Alcon and Sandoz Divisions, are protected by patent or other intellectual property rights, allowing us to exclusively market those products. The loss of exclusivity has had, and will con-tinue to have, an adverse effect on our results. In 2017, the impact of generic competition on our net sales amounted to approximately USD 2.0 billion.
Some of our best-selling products face or are expected to face considerable competition due to the expiration of patent or other intellectual property protection. For exam-ple, we faced generic competition for Gleevec/Glivec in the United States, European Union and Japan throughout 2017, which will continue. Patent protection for our Sandostatin products has expired and generic versions of Sandostatin SC are available in the United States, Euro-pean Union and Japan. Diovan and Co-Diovan/Diovan HCT, which had long been our best-selling products, have generic competitors in the United States, European Union and Japan. Looking forward, intellectual property protecting a number of our major products will expire at various times in the coming years, raising the likelihood of further generic competition. Among our products expected to begin losing intellectual property in key countries during the next three years are Gilenya, our everolimus products (Afinitor/Votubia and Certican/ Zortress), Exjade/Jadenu and Lucentis.
To counter the impact of patent expirations, we con-tinuously invest in R&D to rejuvenate our portfolio. For example, in 2017, we invested 18.3% of total net sales in

176 | Novartis Annual Report 2017
R&D. One measure of the output of our efforts is the per-formance of our growth drivers, including Cosentyx and Entresto, the launches of Kisqali, Kymriah and Rydapt in 2017, and the newly launched Sandoz biosimilars. Novartis also has a number of late-stage product candi-dates in its pipeline with the potential to come to market in the next few years.
Ability to deliver new productsOur ability to maintain and grow our business and to replace revenue and income lost to generic and other competition depends in part on the success of our R&D activities in identifying and developing new treatments, that address unmet medical needs, are accepted by patients and physicians, and are reimbursed by payors.
Developing new healthcare products and bringing them to market is a costly, lengthy and uncertain pro-cess. R&D for a new product in our Innovative Medicines Division can take 15 years or more, from discovery to commercial launch. With time limits on intellectual prop-erty protections, the longer it takes to develop a prod-uct, the less time we may have to recoup our costs. During each stage of development, there is a significant risk that we will encounter obstacles. They may cause a delay or add substantial expense, limit the potential for commercial success, or force us to abandon a product in which we have invested substantial amounts of time and money.
In addition, as healthcare costs continue to rise, gov-ernments and payors around the world are increasingly focused on health outcomes, rewarding new products that represent truly breakthrough innovation versus those that offer an incremental benefit over other prod-ucts in the same therapeutic class. This has led to requests for more clinical trial data than has been required in the past, the inclusion of significantly higher numbers of patients in clinical trials, and more detailed analyses of the trials. As a result, despite significant efforts by health authorities such as the FDA to acceler-ate the development of new drugs, the already lengthy and expensive process of obtaining regulatory approv-als and reimbursement for pharmaceutical products has become even more challenging.
Our Sandoz Division faces similar challenges, partic-ularly in the development of biosimilars. While Sandoz was a pioneer in introducing biosimilars to the European market in 2006, and was the first company to win approval for a biosimilar under the new regulatory path-way in the United States in 2015, many countries still lack fully developed regulatory frameworks for the develop-ment and approval of biosimilars. Further delays in estab-lishing regulatory frameworks, or any other difficulties that may arise in the development or marketing of bio-similars, could put at risk the significant investments that Sandoz has made, and will continue to make, in this area.
Our Alcon Division faces medical device develop-ment and approval processes that are often similarly dif-ficult. As part of its growth plan, Alcon has taken steps to accelerate innovation. It has started to see the results of its efforts, with the approval and launch of intraocular lens innovations in 2016 and 2017, including Clareon and PanOptix IOLs, AutonoMe and Ultrasert IOL delivery systems, and, ReSTOR Toric IOL with ACTIVEFOCUS optical design, as well as CyPass micro-stent and a multifocal version of Dailies Total1. But there is no
certainty that Alcon will continue to be successful in these efforts, and if it is not, there could be a material adverse effect on the success of the Alcon Division, and on the Group as a whole.
In spite of our significant investments, there can be no guarantee that our R&D activities will produce com-mercially viable new products that will enable us to grow our business and replace revenue and income lost to competition.
Commercial success of key productsOur ability to grow depends not only on our pipeline deliv-ery, but also on our commercial success, particularly with respect to our key growth drivers, which we consider to be an indicator of our ability to renew our portfolio. The commercial success of these products could be impacted at any time by a number of factors, including new com-petitors, changes in doctors’ prescribing habits, pricing pressure, manufacturing issues, and loss of intellectual property protection. In addition, our revenue could be significantly impacted by the timing and rate of commer-cial acceptance of new products.
All of our businesses face intense competition from new products and scientific advances from competitors. Physicians, patients and payors may choose competitor products instead of ours if they perceive them to be bet-ter in terms of efficacy, safety, cost or convenience.
In particular, our Alcon Division and our US Sandoz business each has suffered declines in sales and profits in recent years due at least in part to increased compe-tition for its products, although Alcon’s results improved in 2017, returning to growth. There can be no certainty either that Sandoz US sales will recover, or that Alcon’s improved results will be repeated in the coming years. In any event, such competition and the costs of our efforts to improve these businesses’ performance, as well as other factors, can be expected to affect the busi-ness, financial condition or results of operations of these organizations, at least in the near term. In addition, despite the devotion of significant resources to our efforts to improve the performance of Alcon and Sandoz US, those efforts may ultimately prove insufficient.
Pricing and reimbursementAround the world, governments and payors continue to struggle with rising healthcare costs as aging popula-tions contribute to increased prevalence of chronic dis-eases. There have also been examples of significant con-troversies about prices for pharmaceuticals that some members of the public have considered excessive. These factors have intensified the pressures we face regard-ing the prices we charge for our drugs, and our ability to establish satisfactory rates of reimbursement for our products by governments, insurers and other payors.
In our Sandoz Division, for example, sales declined in 2017 due to intense industry pricing pressure in the US. Sales growth outside the United States was unable to fully compensate.
We expect scrutiny to continue in 2018, and the fol-lowing years, as governments and insurers around the world strive to reduce healthcare costs through steps such as restricting access to higher-priced new medi-cines, increasing coinsurance or copays owed by patients for medicines, increasing the use of generics, and impos-ing price cuts. In this environment, we believe it is more

Novartis Annual Report 2017 | 177FINANCIAL REPORTOperating and financial review 2017
important than ever to demonstrate the value that true innovation brings to the healthcare system.
To manage these pressures, we are investing in real-world data and analytics to provide additional evidence of the health benefits of our products, exploring new technologies and patient management services, and partnering with payors to develop and scale out-comes-based commercial models. For example, we are working with customers on flexible pricing approaches where we are fully compensated only if a drug succeeds in meeting certain performance targets.
Business practicesIn recent years, there has been a trend of increasing gov-ernment investigations and litigation against companies operating in our industry, including in the United States and other countries. We are obligated to comply with the laws of all countries in which we operate, as well as any new requirements that may be imposed upon us. But beyond legal requirements, we strive to meet evolving public expectations for ethical behavior. We have a sig-nificant global compliance program in place, and we devote substantial time and resources to efforts to ensure that our business is conducted in a legal and pub-licly acceptable manner. Despite these efforts, any fail-ure to comply with the law could lead to substantial lia-bilities that may not be covered by insurance and could affect our business and reputation.
Governments and regulatory authorities worldwide are also increasingly challenging practices previously considered to be legal and compliant. For example, spon-soring doctors to attend medical conferences has long been used by pharmaceutical companies to help raise awareness of the latest advances in medicine. One of our goals in 2017 was to find better and more inclusive ways to reach a broader cross-section of this commu-nity. We have therefore started to employ technology to supplement face-to-face meetings and bring the expe-rience of international congresses to the local level.
Responding to these challenges and new regulations is costly. Investigations and litigation may affect our rep-utation, create a risk of potential exclusion from govern-ment reimbursement programs in the United States and other countries, and potentially lead to large damage payments and agreements intended to regulate com-pany behavior. This is why we continued to strengthen the Integrity & Compliance function in 2017. The function now has 473 employees, and is headed by our Chief Eth-ics and Compliance Officer, who reports directly to the CEO of Novartis. The Chief Ethics and Compliance Offi-cer is also Head of Litigation, reporting to the Group Gen-eral Counsel of Novartis. By bringing the Integrity & Com-pliance and Legal functions closer together, we can evaluate facts that might be at issue in lawsuits to deter-mine if additional compliance actions or policies are war-ranted. We expect this will help us constantly improve our compliance activities.
Supply continuityThe production of pharmaceutical products and medi-cal devices can be highly complex, and any manufactur-ing issue compromising supply or quality could have seri-ous consequences for the health of patients. For this reason, there are strict regulatory requirements sur-rounding our manufacturing processes, which, in addi-
tion to our own high quality standards, introduce a greater chance for disruptions and liabilities. Any significant fail-ure by us or our third party suppliers to comply with these requirements or the health authorities’ expectations, may cause us to shut down the production facilities or pro-duction lines. Alternately, we may be forced to shut them down by a government health authority.
Beyond regulatory requirements, many of our prod-ucts involve technically sophisticated manufacturing pro-cesses or require specialized raw materials. For exam-ple, biologic products, produced from living plant or animal micro-organisms comprise a significant portion of our product portfolio. For biologic products, slight deviations in the production process could lead to pro-duction failures or recalls. Our portfolio also includes a number of sterile products such as oncology treatments, which are technically complex to manufacture and require strict environmental controls. There is a greater chance of production failures and supply interruptions for such products.
Given the complexity of our manufacturing processes, we have worked for several years to adopt a single high-quality standard across the company. We believe these efforts are having an impact. The results of inspec-tions by regulatory agencies in 2017 were consistent with the year before. Out of a total of 217 inspections, all but two (99%) were without major findings.
Foreign exchange fluctuationsChanges in exchange rates between the US dollar, our reporting currency, and other currencies can have a sig-nificant effect on our reported sales, costs and earnings, as well as on the reported value of our assets, liabilities and cash flows.
For example, because our expenditures in Swiss francs are significantly higher than our revenue in Swiss francs, volatility in the value of the Swiss franc can have a significant impact on our reported results, and the tim-ing and extent of such volatility can be difficult to predict.
There is also a risk that certain countries could take steps that could significantly impact the value of their currencies, such as withdrawing from trade agreements or common currencies. In addition, countries facing local financial difficulties, including countries experiencing high inflation rates and highly indebted countries facing large capital outflows, may impose controls on the exchange of foreign currency. Such exchange controls could limit our ability to distribute retained earnings from our local affiliates, or to pay intercompany payables due from those countries.
To mitigate the risk posed by foreign exchange fluc-tuations, we engage in hedging transactions where man-agement deems appropriate, after taking into account the natural hedging afforded by our global business activity.
Intangible assets and goodwillWe carry a significant amount of goodwill and other intangible assets on our consolidated balance sheet, pri-marily due to acquisitions, including the acquisition of Alcon and the oncology assets acquired from GSK. As a result, we may incur significant impairment charges if the fair value of intangible assets and groupings of cash generating units containing goodwill are less than their carrying value on the Group’s consolidated balance sheet at any point in time.

178 | Novartis Annual Report 2017
We regularly review our long-lived intangible and tan-gible assets for impairment. In 2017, for example, we recorded intangible asset impairment charges of USD 709 million, including the cost of discontinuing the development of RLX030 (serelaxin). Impairment testing may lead to additional impairment charges in the future. Any significant impairment charges could have a mate-rial adverse effect on our results of operations and finan-cial condition.
TaxOur worldwide operations are taxed under the laws of the jurisdictions in which we operate. However, the inte-grated nature of our worldwide operations can produce conflicting claims from revenue authorities in different countries as to the profits to be taxed in the individual countries, including disputes relating to transfer pricing. The majority of the jurisdictions in which we operate have double tax treaties with other foreign jurisdictions, which provide a framework for mitigating the impact of double taxation on our revenues and capital gains. However, mechanisms developed to resolve such conflicting claims are largely untried, and can be expected to be very lengthy.
In recent years, tax authorities around the world have increased their scrutiny of company tax filings, and have become more rigid in exercising any discretion they may have. As part of this, the Organization for Economic Co-operation and Development (OECD) has proposed a number of tax law changes under its Base Erosion and Profit Shifting (BEPS) Action Plans to address issues of transparency, coherence and substance.
At the same time, the European Commission is final-izing its Anti Tax Avoidance Directive, which seeks to prevent tax avoidance by companies and to ensure that companies pay appropriate taxes in the markets where profits are effectively made and business is effectively performed. The European Commission also continues to extend the application of its policies seeking to limit fiscal aid by Member States to particular companies, and the related investigation of the Member States’ practices regarding the issuance of rulings on tax matters relating to individual companies.
These OECD and EU tax reform initiatives also need local country implementation, including in our home country of Switzerland, which may result in significant changes to established tax principles. Although we have taken steps to be in compliance with the evolving OECD and EU tax initiatives, and will continue to do so, signifi-cant uncertainties remain as to the outcome of these efforts.
In addition, in the United States, the president on December 22, 2017, signed into law the Tax Cuts and Jobs Act of 2017, which includes substantial changes to the US taxation of individuals and businesses. Although the new law substantially decreased tax rates applica-ble to corporations, we do not yet know what all of the consequences of this new statute will be, including whether the law will have any unintended consequences. In particular, significant uncertainties remain as to how the US government will implement the new law, includ-ing with respect to the tax qualification of interest deduc-tions, the concept of a territorial tax regime, royalty pay-ments and cost of goods sold.
In general, such tax reform efforts, including with respect to tax base or rate, transfer pricing, intercom-pany dividends, cross border transactions, controlled corporations, and limitations on tax relief allowed on the interest on intercompany debt, will require us to contin-ually assess our organizational structure against tax pol-icy trends, and could lead to an increased risk of inter-national tax disputes and an increase in our effective tax rate, and could adversely affect our financial results.
IT security, data integrity and data privacyWe are heavily dependent on critical, complex and inter-dependent information technology (IT) systems, includ-ing internet-based systems, to support business pro-cesses.
The size and complexity of our IT systems, and in some instances their age, make them potentially vulner-able to external and internal security incidents, break-downs, malicious intrusions, cybercrimes, including State-sponsored cybercrimes, malware, misplaced and lost data, programming and human errors, and other sim-ilar events. Although we have devoted and continue to devote significant resources and management attention to cybersecurity and to business continuity efforts, like many companies, we have experienced certain of these events and expect to continue to experience them in the future, as the external cyber-attack threaat only keeps growing. We believe that the data security incidents we have experienced to date have not resulted in significant disruptions to our operations, and have not had a signif-icant adverse effect on our results of operations, or on third parties. However, we may not be able to prevent breakdowns or breaches in our systems and we may not be able to prevent such events from having a material adverse effect on our business, financial condition, results of operation, or reputation.
In addition, our routine business operations, includ-ing through the use of information technologies such as the Internet, social media, mobile technologies, and tech-nology-based medical devices, increasingly involve our gathering personal information (including sensitive per-sonal information) about patients, vendors, customers, employees, collaborators and others. Breaches of our systems or those of our third-party contractors, or other failures to protect such information, could expose such people’s personal information to unauthorized persons. Any such event could give rise to significant potential lia-bility and reputational harm, including potentially sub-stantial monetary penalties. We also make significant efforts to ensure that any international transfers of per-sonal data are done in compliance with applicable law. Any additional restraints that may be placed on our abil-ity to transfer such data could have a material adverse effect on our business, financial condition, results of operations and reputation.
Transformational technologies and business modelsRapid progress in digital technologies and in the devel-opment of new business models is substantially trans-forming numerous industries around the world, while sometimes quickly rendering established businesses uncompetitive or obsolete. To take advantage of these opportunities, Novartis has embarked upon a digital transformation strategy, with the goal of making Novartis

Novartis Annual Report 2017 | 179FINANCIAL REPORTOperating and financial review 2017
an industry leader in leveraging advanced analytics and other new technologies. At the same time, there is a risk that other companies with specialized expertise or busi-ness models may enter the healthcare field, potentially disrupting our relationships with patients, healthcare pro-fessionals, customers, distributors and suppliers, with unknown potential consequences for us.
If we should fail to succeed in our efforts at a digital transformation of our company, then there is a risk that we may fail to create the innovative new products, tools or techniques that such technologies may make possi-
ble, or may fail to create them as quickly and efficiently as such technologies may enable. We may also lose opportunities to engage with our stakeholders and to profit from improved business processes, and may lose the resources devoted to these efforts to transform our business. At the same time, should third parties suc-cessfully enter the healthcare field with disruptive new technologies or business models, then we potentially may see our business supplanted in whole or in part by these new entrants.
Non-IFRS measures as defined by NovartisNovartis uses certain non-IFRS metrics when measur-ing performance, especially when measuring current year results against prior periods, including core results, constant currencies, free cash flow and net debt.
Despite the use of these measures by management in setting goals and measuring the Group’s performance, these are non-IFRS measures that have no standardized meaning prescribed by IFRS. As a result, such measures have limits in their usefulness to investors.
Because of their non-standardized definitions, the non-IFRS measures (unlike IFRS measures) may not be comparable to the calculation of similar measures of other companies. These non-IFRS measures are pre-sented solely to permit investors to more fully understand how the Group’s management assesses underlying per-formance. These non-IFRS measures are not, and should not be viewed as, a substitute for IFRS measures.
As an internal measure of Group performance, these non-IFRS measures have limitations, and the Group’s performance management process is not solely restricted to these metrics.
Core results
The Group’s core results – including core operating income, core net income and core earnings per share – exclude fully the amortization and impairment charges of intangible assets, except software, and certain acqui-sition-related items. The following items that exceed a threshold of USD 25 million are also excluded: integra-tion and divestment related income and expenses, divestment gains and losses, restructuring charges/releases and related items, legal related items, impair-ments of property, plant and equipment and financial assets, as well as income and expense items that man-agement deems exceptional and that are or are expected to accumulate within the year to be over a USD 25 mil-lion threshold.
Novartis believes that investor understanding of the Group’s performance is enhanced by disclosing core measures of performance since they exclude items that can vary significantly from year to year, the core mea-sures enable better comparison of business perfor-mance across years. For this same reason, Novartis uses these core measures in addition to IFRS and other mea-sures as important factors in assessing the Group’s per-formance.
The following are examples of how these core mea-sures are utilized:• In addition to monthly reports containing financial infor-
mation prepared under IFRS, senior management receives a monthly analysis incorporating these core measures.
• Annual budgets are prepared for both IFRS and core measures.
A limitation of the core measures is that they provide a view of the Group’s operations without including all events during a period, such as the effects of an acqui-sition, divestments, or amortization/impairments of pur-chased intangible assets and restructurings.
Constant currencies
Changes in the relative values of non-US currencies to the US dollar can affect the Group’s financial results and financial position. To provide additional information that may be useful to investors, including changes in sales volume, we present information about our net sales and various values relating to operating and net income that are adjusted for such foreign currency effects.
Constant currency calculations have the goal of elim-inating two exchange rate effects so that an estimate can be made of underlying changes in the consolidated income statement excluding the impact of fluctuations in exchange rates:• The impact of translating the income statements of
consolidated entities from their non-USD functional currencies to USD
• The impact of exchange rate movements on the major transactions of consolidated entities performed in cur-rencies other than their functional currency
We calculate constant currency measures by translating the current year’s foreign currency values for sales and other income statement items into USD, using the aver-age exchange rates from the prior year and comparing them to the prior year values in USD.
We use these constant currency measures in evalu-ating the Group’s performance, since they may assist us in evaluating our ongoing performance from year to year. However, in performing our evaluation, we also consider equivalent measures of performance that are not affected by changes in the relative value of currencies.

180 | Novartis Annual Report 2017
Growth rate calculation
For ease of understanding, Novartis uses a sign conven-tion for its growth rates such that a reduction in operat-ing expenses or losses compared to the prior year is shown as a positive growth.
Free cash flow
Free cash flow is presented as additional information because management believes it is a useful supplemen-tal indicator of the Group’s ability to operate without reli-ance on additional borrowing or use of existing cash. Free cash flow is a measure of the net cash generated that is available for debt repayment, investment in stra-tegic opportunities and for returning to shareholders. Free cash flow is a non-IFRS measure, which means it should not be interpreted as a measure determined under IFRS. Free cash flow is not intended to be a sub-stitute measure for cash flow from operating activities as determined under IFRS.
Novartis defines free cash flow as cash flow from operating activities and cash flow associated with the purchase or sale of property, plant and equipment, as well as intangible, other non-current and financial assets, excluding marketable securities. The definition of free cash flow used by Novartis does not include amounts related to changes in investments in associated compa-nies or related acquisitions or divestments of subsidiar-ies.
Net debt
Net debt is presented as additional information because management believes it is a useful supplemental indica-tor of the Group’s ability to pay dividends, to meet finan-cial commitments and to invest in new strategic oppor-tunities, including strengthening its balance sheet. Net debt is a non-IFRS measure, which means it should not be interpreted as a measure determined under IFRS.
Novartis defines net debt as current and non-current financial debt less cash and cash equivalents, current investments and derivative financial instruments.
Novartis Cash Value Added
Novartis Cash Value Added (NCVA) is a metric that is based on what the company assesses to be its cash flow return less a capital charge on gross operating assets. NCVA is used as the primary internal financial measure for determining payouts under the Long-Term Perfor-mance Plan introduced in 2014. More information on NCVA is presented as part of the Compensation Report on page 130.
Additional information
EBITDANovartis defines earnings before interest, tax, depreci-ation and amortization (EBITDA) as operating income from continuing operations excluding depreciation of property, plant and equipment (including any related impairment charges) and amortization of intangible assets (including any related impairment charges).
(USD millions) 2017 2016 Change
Operating income 8 629 8 268 361
Depreciation of property,
plant & equipment 1 520 1 489 31
Amortization of intangible
assets 3 690 3 861 – 171
Impairments of property,
plant & equipment, and
intangible assets 866 693 173
EBITDA 14 705 14 311 394
Enterprise valueEnterprise value represents the total amount that share-holders and debt holders have invested in Novartis, less the Group’s liquidity.
(USD millions
unless indicated otherwise) Dec 31, 2017 Dec 31, 2016 Change
Market capitalization 195 541 172 048 23 493
Non-controlling interests 59 59 0
Financial debts and
derivatives 28 532 23 802 4 730
Liquidity – 9 485 – 7 777 – 1 708
Enterprise value 214 647 188 132 26 515
Enterprise value/EBITDA 15 13

Novartis Annual Report 2017 | 181FINANCIAL REPORTOperating and financial review 2017
2017 and 2016 reconciliation from IFRS results to core results
Innovative Medicines Sandoz Alcon Corporate Group
(USD millions unless indicated otherwise) 2017 2016 2017 2016 2017 2016 2017 2016 2017 2016
IFRS Operating income 7 782 7 426 1 368 1 445 – 190 – 132 – 331 – 471 8 629 8 268
Amortization of intangible assets 2 243 2 440 454 460 901 901 3 598 3 801
Impairments
Intangible assets 591 522 61 65 57 4 709 591
Property, plant & equipment
related to the Group-wide
rationalization of manufacturing sites 7 1 60 – 7 67 – 6
Other property, plant & equipment 77 76 13 8 90 84
Financial assets 18 29 197 99 226 117
Total impairment charges 675 617 134 66 86 4 197 99 1 092 786
Acquisition or divestment of
businesses and related items
- Income – 2 – 68 – 115 – 229 – 117 – 297
- Expense 32 41 130 223 162 264
Total acquisition or divestment of
businesses and related items, net 30 – 27 15 – 6 45 – 33
Other items
Divestment gains – 368 – 608 – 6 – 48 – 368 – 662
Restructuring and related items
- Income – 53 – 41 – 7 – 23 – 4 – 4 – 1 – 5 – 65 – 73
- Expense 268 418 134 123 34 33 29 65 465 639
Legal-related items
- Income – 21 – 99 – 21 – 99
- Expense 35 205 61 96 205
Additional income – 534 – 61 – 3 – 51 – 13 – 372 – 22 – 960 – 96
Additional expense 273 84 6 20 61 46 100 339 251
Total other items – 400 – 102 124 100 60 77 – 298 90 – 514 165
Total adjustments 2 548 2 928 712 626 1 047 982 – 86 183 4 221 4 719
Core operating income 10 330 10 354 2 080 2 071 857 850 – 417 – 288 12 850 12 987
as % of net sales 31.3% 31.8% 20.7% 20.4% 14.2% 14.6% 26.2% 26.8%
Income from associated companies – 1 23 6 1 086 697 1 108 703
Core adjustments to income from
associated companies, net of tax 1 226 431 227 431
Interest expense – 777 – 707
Other financial income and expense 1 39 – 99
Taxes, adjusted for above items (core taxes) – 2 056 – 2 001
Core net income 11 391 11 314
Core net income attributable
to shareholders of Novartis AG 11 391 11 307
Core basic EPS (USD) 2 4.86 4.75
1 Adjusted for charges of USD 0.3 billion in 2016 related mainly to devaluation losses in Venezuela.2 Earnings per share (EPS) is calculated on the amount of net income attributable to shareholders of Novartis AG.

182 | Novartis Annual Report 2017
2017 and 2016 reconciliation from Group IFRS results to Group core results
Acquisition or
Amortization divestment of
of intangible businesses and
2017 (USD millions unless indicated otherwise) IFRS results assets 1 Impairments 2 related items 3 Other items 4 Core results
Gross profit 32 960 3 401 92 125 36 578
Operating income 8 629 3 598 1 092 45 – 514 12 850
Income before taxes 8 999 3 974 1 093 45 – 664 13 447
Taxes 5 – 1 296 – 2 056
Net income 7 703 11 391
Basic EPS (USD) 6 3.28 4.86
The following are adjustments to arrive at Core Gross Profit
Cost of goods sold – 17 175 3 401 92 125 – 13 557
The following are adjustments to arrive at Core Operating Income
Marketing & Sales – 12 861 – 4 – 12 865
Research & Development – 8 972 197 680 – 218 – 8 313
General & Administration – 2 136 1 – 2 135
Other income 1 969 – 9 – 117 – 1 065 778
Other expense – 2 331 329 162 647 – 1 193
The following are adjustments to arrive at Core Income before taxes
Income from associated companies 1 108 376 1 – 150 1 335
1 Amortization of intangible assets: Cost of goods sold includes recurring amortization of acquired rights to in-market products and other production-related intangible assets; Research & Development includes the recurring amortization of acquired rights for technology platforms; Income from associated companies includes USD 376 million for the Novartis share of the estimated Roche core items.
2 Impairments: Cost of goods sold and Research & Development include impairment charges related to intangible assets; Research & Development and Other expense include impairment charges related to financial assets; Research & Development, Other income and Other expense include reversals and charges related to the impairment of property, plant and equipment.
3 Acquisition or divestment of businesses and related items, including restructuring and integration charges: Other income and Other expense include transitional service-fee income and expenses and other items related to the portfolio transformation.
4 Other items: Cost of goods sold, Other Income and Other expense include net restructuring and other charges related to the Group-wide rationalization of manufacturing sites; Cost of goods sold, Research & Development, General & Administration, Other income and Other expense include other restructuring income and charges and related items; Marketing & Sales includes an income from the release of a provision; Research & Development includes fair value adjustments to contingent consideration liabilities; Other income and Other expense include legal-related items; Other income also includes a gain from a Swiss pension plan amendment, product and financial asset divestment gains, a partial reversal of a prior period charge, an income from a settlement of a contract dispute and a fair value adjustment to contingent consideration sales milestone receivables; Other expense also includes a provision for contract termination costs, a charge for onerous contracts and an amendment to the Swiss Pension Plan; Income from associated companies includes an adjustment of USD 150 million for the Novartis share of the estimated GSK Consumer Healthcare Holdings Ltd. core items.
5 Taxes on the adjustments between IFRS and core results take into account, for each individual item included in the adjustment, the tax rate that will finally be applicable to the item based on the jurisdiction where the adjustment will finally have a tax impact. Generally, this results in amortization and impairment of intangible assets and acquisition-related restructuring and integration items having a full tax impact. There is usually a tax impact on other items, although this is not always the case for items arising from legal settlements in certain jurisdictions. Adjustments related to income from associated companies are recorded net of any related tax effect. Due to these factors and the differing effective tax rates in the various jurisdictions, the tax on the total adjustments of USD 4.4 billion to arrive at the core results before tax amounts to USD 760 million. The average tax rate on the adjustments is 17.1%.
6 Earnings per share (EPS) is calculated on the amount of net income attributable to shareholders of Novartis AG.

Novartis Annual Report 2017 | 183FINANCIAL REPORTOperating and financial review 2017
Acquisition or
Amortization divestment of
of intangible businesses and
2016 (USD millions unless indicated otherwise) IFRS results assets 1 Impairments 2 related items 3 Other items 4 Core results
Gross profit 31 916 3 758 96 36 35 806
Operating income 8 268 3 801 786 – 33 165 12 987
Income before taxes 7 817 4 097 786 – 33 648 13 315
Taxes 5 – 1 119 – 2 001
Net income 6 698 11 314
Basic EPS (USD) 6 2.82 4.75
The following are adjustments to arrive at Core Gross Profit
Other revenues 918 – 50 868
Cost of goods sold – 17 520 3 758 96 86 – 13 580
The following are adjustments to arrive at Core Operating Income
Marketing & Sales – 11 998 7 – 11 991
Research & Development – 9 039 43 495 99 – 8 402
General & Administration – 2 194 74 – 2 120
Other income 1 927 – 10 – 297 – 867 753
Other expense – 2 344 205 264 816 – 1 059
The following are adjustments to arrive at Core Income before taxes
Income from associated companies 703 296 135 1 134
Other financial income and expense – 447 348 – 99
1 Amortization of intangible assets: Cost of goods sold includes recurring amortization of acquired rights to in-market products and other production-related intangible assets; Research & Development includes the recurring amortization of acquired rights for technology platforms; Income from associated companies includes USD 296 million for the Novartis share of the estimated Roche core items.
2 Impairments: Cost of goods sold and Research & Development include impairment charges related to intangible assets; Other income includes impairment reversals of property, plant and equipment; Other expense includes impairment charges related to property, plant and equipment, and financial assets.
3 Acquisition or divestment of businesses and related items, including restructuring and integration charges: Other income and Other expense include transitional service-fee income and expenses and other items related to the portfolio transformation; Other income also includes a gain from the revaluation of a previously held financial investment in a newly acquired company.
4 Other items: Other revenues include an early release of deferred income associated with a collaboration agreement; Cost of goods sold, Other income and Other expense include net restructuring and other charges related to the Group-wide rationalization of manufacturing sites; Research & Development, Marketing & Sales, Other income and Other expense include other restructuring income and charges; Cost of goods sold and Research & Development include adjustments of contingent considerations; General & Administration, Other income and Other expense include items related to setup costs for Novartis Business Services; Other income and Other expense also include legal settlements and changes in provisions; Other income also includes gains from product divestments, other income related to the portfolio transformation and a gain related to the sale of real estate; Other expense also includes a charge as a result of a pension plan amendment, a charge for an indirect tax settlement and other costs; Income from associated companies includes USD 135 million for the Novartis share of the estimated GSK Consumer Healthcare Holdings Ltd. core items; Other financial income and expense relates mainly to devaluation losses in Venezuela.
5 Taxes on the adjustments between IFRS and core results take into account, for each individual item included in the adjustment, the tax rate that will finally be applicable to the item based on the jurisdiction where the adjustment will finally have a tax impact. Generally, this results in amortization and impairment of intangible assets and acquisition-related restructuring and integration items having a full tax impact. There is usually a tax impact on other items, although this is not always the case for items arising from legal settlements in certain jurisdictions. Adjustments related to income from associated companies are recorded net of any related tax effect. Due to these factors and the differing effective tax rates in the various jurisdictions, the tax on the total adjustments for continuing operations of USD 5.5 billion to arrive at the core results before tax amounts to USD 882 million. The average tax rate on the adjustments is 16.0%.
6 Earnings per share (EPS) is calculated on the amount of net income attributable to shareholders of Novartis AG.

184 | Novartis Annual Report 2017
Summary of quarterly and Group financial dataSummary of quarterly financial data for 2017 and 2016
(USD millions unless indicated otherwise) Q1 Q2 Q3 Q4 2017 Q1 Q2 Q3 Q4 2016
Net sales to third parties 11 539 12 242 12 413 12 915 49 109 11 600 12 470 12 126 12 322 48 518
Other revenues 246 252 279 249 1 026 210 209 215 284 918
Cost of goods sold – 4 105 – 4 258 – 4 323 – 4 489 – 17 175 – 4 212 – 4 451 – 4 368 – 4 489 – 17 520
Gross profit 7 680 8 236 8 369 8 675 32 960 7 598 8 228 7 973 8 117 31 916
Marketing & Sales – 2 989 – 3 240 – 3 168 – 3 464 – 12 861 – 2 741 – 3 067 – 2 944 – 3 246 – 11 998
Research & Development – 2 169 – 2 062 – 2 239 – 2 502 – 8 972 – 2 041 – 2 190 – 2 224 – 2 584 – 9 039
General & Administration – 483 – 566 – 510 – 577 – 2 136 – 564 – 582 – 456 – 592 – 2 194
Other income 445 480 424 620 1 969 777 239 530 381 1 927
Other expense – 562 – 568 – 519 – 682 – 2 331 – 578 – 535 – 610 – 621 – 2 344
Operating income 1 922 2 280 2 357 2 070 8 629 2 451 2 093 2 269 1 455 8 268
Income from associated companies 215 215 262 416 1 108 127 203 217 156 703
Interest expense – 180 – 192 – 197 – 208 – 777 – 185 – 180 – 174 – 168 – 707
Other financial income and expense – 10 12 14 23 39 – 41 – 3 – 38 – 365 – 447
Income before taxes 1 947 2 315 2 436 2 301 8 999 2 352 2 113 2 274 1 078 7 817
Taxes – 282 – 336 – 353 – 325 – 1 296 – 341 – 307 – 329 – 142 – 1 119
Net income 1 665 1 979 2 083 1 976 7 703 2 011 1 806 1 945 936 6 698
Attributable to:
Shareholders of Novartis AG 1 666 1 980 2 081 1 976 7 703 2 011 1 804 1 940 957 6 712
Non-controlling interests – 1 – 1 2 0 0 0 2 5 – 21 – 14
Basic earnings per share (USD) 0.70 0.84 0.89 0.85 3.28 0.85 0.76 0.81 0.40 2.82
Net sales to third parties by segment
Innovative Medicines 7 692 8 275 8 302 8 756 33 025 7 729 8 387 8 173 8 273 32 562
Sandoz 2 430 2 451 2 584 2 595 10 060 2 445 2 577 2 517 2 605 10 144
Alcon 1 417 1 516 1 527 1 564 6 024 1 426 1 506 1 436 1 444 5 812
Net sales to third parties 11 539 12 242 12 413 12 915 49 109 11 600 12 470 12 126 12 322 48 518
Operating income by segment
Innovative Medicines 1 721 2 075 2 179 1 807 7 782 2 180 1 866 2 020 1 360 7 426
Sandoz 343 330 390 305 1 368 346 380 354 365 1 445
Alcon – 43 – 19 – 50 – 78 – 190 31 7 – 50 – 120 – 132
Corporate – 99 – 106 – 162 36 – 331 – 106 – 160 – 55 – 150 – 471
Operating income 1 922 2 280 2 357 2 070 8 629 2 451 2 093 2 269 1 455 8 268
Core operating income 3 010 3 235 3 382 3 223 12 850 3 261 3 332 3 381 3 013 12 987
Core net income 2 690 2 866 3 017 2 818 11 391 2 788 2 930 2 938 2 658 11 314
Core basic earnings per share (USD) 1.13 1.22 1.29 1.21 4.86 1.17 1.23 1.23 1.12 4.75
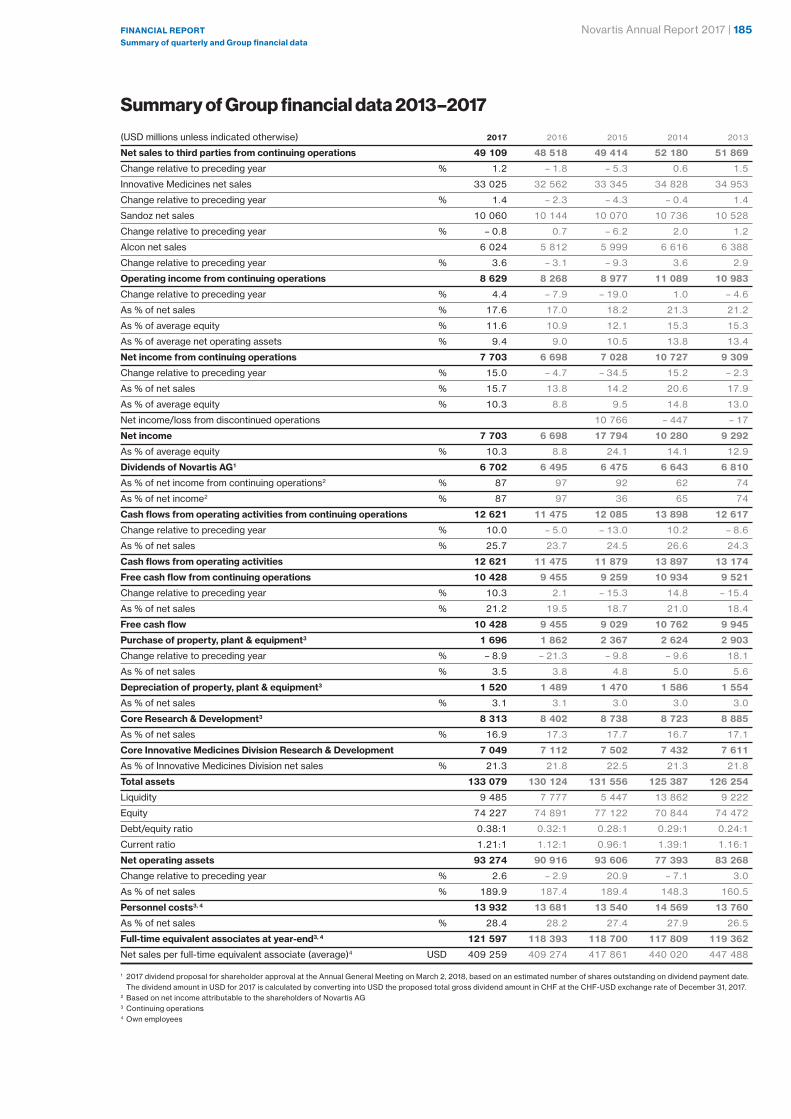
Novartis Annual Report 2017 | 185FINANCIAL REPORTSummary of quarterly and Group financial data
Summary of Group financial data 2013–2017
(USD millions unless indicated otherwise) 2017 2016 2015 2014 2013
Net sales to third parties from continuing operations 49 109 48 518 49 414 52 180 51 869
Change relative to preceding year % 1.2 – 1.8 – 5.3 0.6 1.5
Innovative Medicines net sales 33 025 32 562 33 345 34 828 34 953
Change relative to preceding year % 1.4 – 2.3 – 4.3 – 0.4 1.4
Sandoz net sales 10 060 10 144 10 070 10 736 10 528
Change relative to preceding year % – 0.8 0.7 – 6.2 2.0 1.2
Alcon net sales 6 024 5 812 5 999 6 616 6 388
Change relative to preceding year % 3.6 – 3.1 – 9.3 3.6 2.9
Operating income from continuing operations 8 629 8 268 8 977 11 089 10 983
Change relative to preceding year % 4.4 – 7.9 – 19.0 1.0 – 4.6
As % of net sales % 17.6 17.0 18.2 21.3 21.2
As % of average equity % 11.6 10.9 12.1 15.3 15.3
As % of average net operating assets % 9.4 9.0 10.5 13.8 13.4
Net income from continuing operations 7 703 6 698 7 028 10 727 9 309
Change relative to preceding year % 15.0 – 4.7 – 34.5 15.2 – 2.3
As % of net sales % 15.7 13.8 14.2 20.6 17.9
As % of average equity % 10.3 8.8 9.5 14.8 13.0
Net income/loss from discontinued operations 10 766 – 447 – 17
Net income 7 703 6 698 17 794 10 280 9 292
As % of average equity % 10.3 8.8 24.1 14.1 12.9
Dividends of Novartis AG1 6 702 6 495 6 475 6 643 6 810
As % of net income from continuing operations2 % 87 97 92 62 74
As % of net income2 % 87 97 36 65 74
Cash flows from operating activities from continuing operations 12 621 11 475 12 085 13 898 12 617
Change relative to preceding year % 10.0 – 5.0 – 13.0 10.2 – 8.6
As % of net sales % 25.7 23.7 24.5 26.6 24.3
Cash flows from operating activities 12 621 11 475 11 879 13 897 13 174
Free cash flow from continuing operations 10 428 9 455 9 259 10 934 9 521
Change relative to preceding year % 10.3 2.1 – 15.3 14.8 – 15.4
As % of net sales % 21.2 19.5 18.7 21.0 18.4
Free cash flow 10 428 9 455 9 029 10 762 9 945
Purchase of property, plant & equipment3 1 696 1 862 2 367 2 624 2 903
Change relative to preceding year % – 8.9 – 21.3 – 9.8 – 9.6 18.1
As % of net sales % 3.5 3.8 4.8 5.0 5.6
Depreciation of property, plant & equipment3 1 520 1 489 1 470 1 586 1 554
As % of net sales % 3.1 3.1 3.0 3.0 3.0
Core Research & Development3 8 313 8 402 8 738 8 723 8 885
As % of net sales % 16.9 17.3 17.7 16.7 17.1
Core Innovative Medicines Division Research & Development 7 049 7 112 7 502 7 432 7 611
As % of Innovative Medicines Division net sales % 21.3 21.8 22.5 21.3 21.8
Total assets 133 079 130 124 131 556 125 387 126 254
Liquidity 9 485 7 777 5 447 13 862 9 222
Equity 74 227 74 891 77 122 70 844 74 472
Debt/equity ratio 0.38:1 0.32:1 0.28:1 0.29:1 0.24:1
Current ratio 1.21:1 1.12:1 0.96:1 1.39:1 1.16:1
Net operating assets 93 274 90 916 93 606 77 393 83 268
Change relative to preceding year % 2.6 – 2.9 20.9 – 7.1 3.0
As % of net sales % 189.9 187.4 189.4 148.3 160.5
Personnel costs3, 4 13 932 13 681 13 540 14 569 13 760
As % of net sales % 28.4 28.2 27.4 27.9 26.5
Full-time equivalent associates at year-end3, 4 121 597 118 393 118 700 117 809 119 362
Net sales per full-time equivalent associate (average)4 USD 409 259 409 274 417 861 440 020 447 488 1 2017 dividend proposal for shareholder approval at the Annual General Meeting on March 2, 2018, based on an estimated number of shares outstanding on dividend payment date.
The dividend amount in USD for 2017 is calculated by converting into USD the proposed total gross dividend amount in CHF at the CHF-USD exchange rate of December 31, 2017.2 Based on net income attributable to the shareholders of Novartis AG3 Continuing operations4 Own employees

186 | Novartis Annual Report 2017
Novartis Group consolidated financial statementsConsolidated income statements(For the years ended December 31, 2017, 2016 and 2015)
(USD millions unless indicated otherwise) Note 2017 2016 2015
Net sales to third parties from continuing operations 3 49 109 48 518 49 414
Sales to discontinued segments 26
Net sales from continuing operations 3 49 109 48 518 49 440
Other revenues 1 026 918 947
Cost of goods sold – 17 175 – 17 520 – 17 404
Gross profit from continuing operations 32 960 31 916 32 983
Marketing & Sales – 12 861 – 11 998 – 11 772
Research & Development – 8 972 – 9 039 – 8 935
General & Administration – 2 136 – 2 194 – 2 475
Other income 1 969 1 927 2 049
Other expense – 2 331 – 2 344 – 2 873
Operating income from continuing operations 3 8 629 8 268 8 977
Income from associated companies 4 1 108 703 266
Interest expense 5 – 777 – 707 – 655
Other financial income and expense 5 39 – 447 – 454
Income before taxes from continuing operations 8 999 7 817 8 134
Taxes 6 – 1 296 – 1 119 – 1 106
Net income from continuing operations 7 703 6 698 7 028
Net income from discontinued operations 29 10 766
Net income 7 703 6 698 17 794
Attributable to:
Shareholders of Novartis AG 7 703 6 712 17 783
Non-controlling interests 0 – 14 11
Basic earnings per share (USD) from continuing operations 3.28 2.82 2.92
Basic earnings per share (USD) from discontinued operations 4.48
Total basic earnings per share (USD) 7 3.28 2.82 7.40
Diluted earnings per share (USD) from continuing operations 3.25 2.80 2.88
Diluted earnings per share (USD) from discontinued operations 4.41
Total diluted earnings per share (USD) 7 3.25 2.80 7.29
The accompanying Notes form an integral part of the consolidated financial statements.

Novartis Annual Report 2017 | 187FINaNcIal RepORTNovartis Group consolidated financial statements
Consolidated statements of comprehensive income(For the years ended December 31, 2017, 2016 and 2015)
(USD millions) Note 2017 2016 2015
Net income 7 703 6 698 17 794
Other comprehensive income to be eventually recycled into the consolidated income statement:
Fair value adjustments on marketable securities, net of taxes 8.1 38 – 113 28
Fair value adjustments on deferred cash flow hedges, net of taxes 8.1 12 15 20
Total fair value adjustments on financial instruments, net of taxes 8.1 50 – 98 48
Novartis share of other comprehensive income
recognized by associated companies, net of taxes – 37 671 – 48
Net investment hedge – 237
Currency translation effects 8.2 2 210 – 2 391 – 1 662
Total of items to eventually recycle 1 986 – 1 818 – 1 662
Other comprehensive income never to be recycled into the consolidated income statement:
Actuarial gains/(losses) from defined benefit plans, net of taxes 8.3 851 – 515 – 147
Total comprehensive income 10 540 4 365 15 985
Attributable to:
Shareholders of Novartis AG 10 538 4 382 15 977
Continuing operations 10 538 4 382 5 238
Discontinued operations 10 739
Non-controlling interests 2 – 17 8
The accompanying Notes form an integral part of the consolidated financial statements.
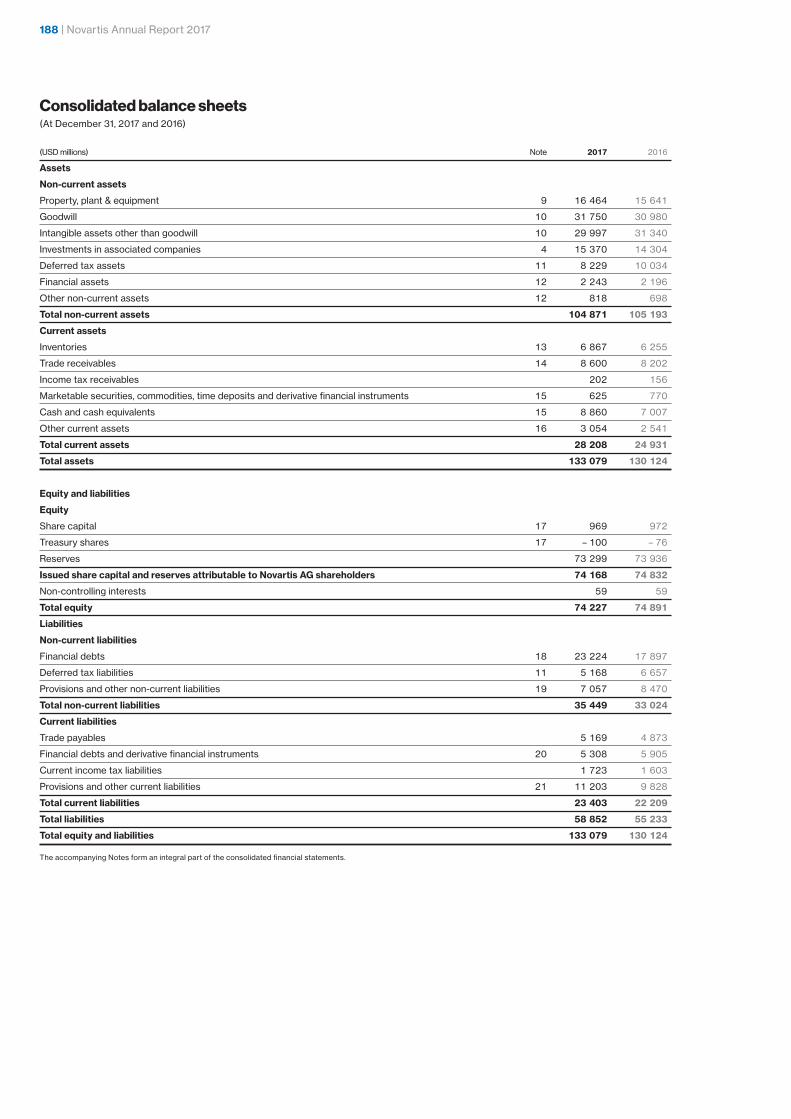
188 | Novartis Annual Report 2017
Consolidated balance sheets(At December 31, 2017 and 2016)
(USD millions) Note 2017 2016
assets
Non-current assets
Property, plant & equipment 9 16 464 15 641
Goodwill 10 31 750 30 980
Intangible assets other than goodwill 10 29 997 31 340
Investments in associated companies 4 15 370 14 304
Deferred tax assets 11 8 229 10 034
Financial assets 12 2 243 2 196
Other non-current assets 12 818 698
Total non-current assets 104 871 105 193
current assets
Inventories 13 6 867 6 255
Trade receivables 14 8 600 8 202
Income tax receivables 202 156
Marketable securities, commodities, time deposits and derivative financial instruments 15 625 770
Cash and cash equivalents 15 8 860 7 007
Other current assets 16 3 054 2 541
Total current assets 28 208 24 931
Total assets 133 079 130 124
equity and liabilities
equity
Share capital 17 969 972
Treasury shares 17 – 100 – 76
Reserves 73 299 73 936
Issued share capital and reserves attributable to Novartis aG shareholders 74 168 74 832
Non-controlling interests 59 59
Total equity 74 227 74 891
liabilities
Non-current liabilities
Financial debts 18 23 224 17 897
Deferred tax liabilities 11 5 168 6 657
Provisions and other non-current liabilities 19 7 057 8 470
Total non-current liabilities 35 449 33 024
current liabilities
Trade payables 5 169 4 873
Financial debts and derivative financial instruments 20 5 308 5 905
Current income tax liabilities 1 723 1 603
Provisions and other current liabilities 21 11 203 9 828
Total current liabilities 23 403 22 209
Total liabilities 58 852 55 233
Total equity and liabilities 133 079 130 124
The accompanying Notes form an integral part of the consolidated financial statements.

Novartis Annual Report 2017 | 189FINaNcIal RepORTNovartis Group consolidated financial statements
Consolidated statements of changes in equity(For the years ended December 31, 2017, 2016 and 2015)
Issued share
capital and
reserves
attributable Non-
Share Treasury Retained Total value to Novartis controlling Total
(USD millions) Note capital shares earnings adjustments shareholders interests equity
Total equity at January 1, 2015 1 001 – 103 72 433 – 2 565 70 766 78 70 844
Net income 17 783 17 783 11 17 794
Other comprehensive income 8 – 48 – 1 758 – 1 806 – 3 – 1 809
Total comprehensive income 17 735 – 1 758 15 977 8 15 985
Dividends 17.1 – 6 643 – 6 643 – 6 643
Purchase of treasury shares 17.2 – 33 – 6 086 – 6 119 – 6 119
Reduction of share capital – 10 15 – 5
Exercise of options and employee transactions 17.2 14 1 578 1 592 1 592
Equity-based compensation 17.2 6 809 815 815
Decrease of treasury share repurchase
obligation under a share buyback trading plan 17.4 658 658 658
Changes in non-controlling interests 17.3 – 10 – 10
Fair value adjustments related to divestments 8 – 100 100
Total of other equity movements – 10 2 – 9 789 100 – 9 697 – 10 – 9 707
Total equity at December 31, 2015 991 – 101 80 379 – 4 223 77 046 76 77 122
Net income 6 712 6 712 – 14 6 698
Other comprehensive income 8 671 – 3 001 – 2 330 – 3 – 2 333
Total comprehensive income 7 383 – 3 001 4 382 – 17 4 365
Dividends 17.1 – 6 475 – 6 475 – 6 475
Purchase of treasury shares 17.2 – 7 – 985 – 992 – 992
Reduction of share capital – 19 25 – 6
Exercise of options and employee transactions 17.2 2 212 214 214
Equity-based compensation 17.2 5 659 664 664
Impact of change in ownership of consolidated entities 17.5 – 7 – 7 – 7
Fair value adjustments related to divestments 8 – 12 12
Total of other equity movements – 19 25 – 6 614 12 – 6 596 – 6 596
Total equity at December 31, 2016 972 – 76 81 148 – 7 212 74 832 59 74 891
Net income 7 703 7 703 7 703
Other comprehensive income 8 – 37 2 872 2 835 2 2 837
Total comprehensive income 7 666 2 872 10 538 2 10 540
Dividends 17.1 – 6 495 – 6 495 – 6 495
Purchase of treasury shares 17.2 – 36 – 5 538 – 5 574 – 5 574
Reduction of share capital – 3 5 – 2
Exercise of options and employee transactions 17.2 2 253 255 255
Equity-based compensation 17.2 5 607 612 612
Changes in non-controlling interests 17.3 – 2 – 2
Total of other equity movements – 3 – 24 – 11 175 – 11 202 – 2 – 11 204
Total equity at December 31, 2017 969 – 100 77 639 – 4 340 74 168 59 74 227
The accompanying Notes form an integral part of the consolidated financial statements.

190 | Novartis Annual Report 2017
Consolidated cash flow statements(For the years ended December 31, 2017, 2016 and 2015)
(USD millions) Note 2017 2016 2015
Net income from continuing operations 7 703 6 698 7 028
Reversal of non-cash items 22.1 7 058 8 437 9 070
Dividends received from associated companies and others 987 899 432
Interest received 97 43 34
Interest paid – 708 – 723 – 646
Other financial receipts 714
Other financial payments – 272 – 155 – 23
Taxes paid 1 – 1 611 – 2 111 – 2 454
cash flows before working capital and provision changes from continuing operations 13 254 13 088 14 155
Payments out of provisions and other net cash movements in non-current liabilities – 877 – 1 536 – 1 207
Change in net current assets and other operating cash flow items 22.2 244 – 77 – 863
cash flows from operating activities from continuing operations 12 621 11 475 12 085
Cash flows used in operating activities from discontinued operations 1 – 188
Total cash flows from operating activities 12 621 11 475 11 897
Purchase of property, plant & equipment – 1 696 – 1 862 – 2 367
Proceeds from sales of property, plant & equipment 92 161 237
Purchase of intangible assets – 1 050 – 1 017 – 1 138
Proceeds from sales of intangible assets 640 847 621
Purchase of financial assets – 468 – 247 – 264
Proceeds from sales of financial assets 330 247 166
Purchase of other non-current assets – 42 – 149 – 82
Proceeds from sales of other non-current assets 1 1
Divestments of interests in associated companies 29
Acquisitions and divestments of businesses, net 22.3 – 784 – 765 – 16 507
Purchase of marketable securities and commodities – 580 – 530 – 595
Proceeds from sales of marketable securities and commodities 549 622 262
cash flows used in investing activities from continuing operations – 2 979 – 2 693 – 19 666
Cash flows used in/from investing activities from discontinued operations 1 22.4 – 140 – 748 8 882
Total cash flows used in investing activities – 3 119 – 3 441 – 10 784
Dividends paid to shareholders of Novartis AG – 6 495 – 6 475 – 6 643
Acquisition of treasury shares – 5 490 – 1 109 – 6 071
Proceeds from exercise options and other treasury share transactions 252 214 1 581
Increase in non-current financial debts 22.5 4 933 1 935 4 596
Repayment of non-current financial debts 22.5 – 188 – 1 696 – 3 086
Change in current financial debts 22.5 – 755 1 816 451
Impact of change in ownership of consolidated entities 0 – 6 0
Dividends paid to non-controlling interests and other financing cash flows 10 7 – 4
cash flows used in financing activities – 7 733 – 5 314 – 9 176
Effect of exchange rate changes on cash and cash equivalents 84 – 387 – 286
Net change in cash and cash equivalents 1 853 2 333 – 8 349
Cash and cash equivalents at January 1 7 007 4 674 13 023
cash and cash equivalents at December 31 8 860 7 007 4 674
The accompanying Notes form an integral part of the consolidated financial statements.
1 In 2016, the total net tax payment amounted to USD 2 299 million, of which USD 188 million was included in the cash flows used in investing activities from discontinued operations. In 2015, the total net tax payment amounted to USD 3 325 million, of which a refund of USD 94 million was included in the cash flows used in operating activities from discontinued
operations, and a USD 965 million payment in the cash flows from investing activities of discontinued operations.

Novartis Annual Report 2017 | 191FINaNcIal RepORTNotes to the Novartis Group consolidated financial statements
Notes to the Novartis Group consolidated financial statements1. Significant accounting policiesThe Novartis Group (Novartis or Group) is a multinational group of companies specializing in the research, develop-ment, manufacturing and marketing of a broad range of healthcare products led by innovative pharmaceuticals and also including eye care products and cost-saving generic pharmaceuticals. It is head quartered in Basel, Switzerland.
The consolidated financial statements of the Group are prepared in accordance with International Financial Reporting Standards (IFRS) as issued by the Interna-tional Accounting Standards Board (IASB). They are pre-pared in accordance with the historical cost convention except for items that are required to be accounted for at fair value.
The Group’s financial year-end is December 31, which is also the annual closing date of the individual entities’ financial statements incorporated into the Group’s con-solidated financial statements.
The preparation of financial statements requires management to make certain estimates and assump-tions, either at the balance sheet date or during the year that affect the reported amounts of assets and liabilities, including any contingent amounts, as well as of revenues and expenses. Actual outcomes and results could differ from those estimates and assumptions.
Listed below are accounting policies of significance to Novartis or, in cases where IFRS provides alternatives, the option adopted by Novartis.
Scope of consolidation
The consolidated financial statements include all enti-ties, including structured entities, over which Novartis AG, Basel, Switzerland, directly or indirectly has control (generally as a result of owning more than 50% of the entity’s voting interest). Consolidated entities are also referred to as “subsidiaries”.
In cases where Novartis does not fully own a subsid-iary, it has elected to value any remaining outstanding non-controlling interest at the time of acquiring control of the subsidiary at its proportionate share of the fair value of the net identified assets.
The contribution of a business to an associate or joint venture is accounted for by applying the option under IFRS that permits the accounting for the retained inter-est of the business contributed at its net book value at the time of the contribution.
Investments in associated companies (generally defined as investments in entities in which Novartis holds between 20% and 50% of voting shares or over which it otherwise has significant influence) and joint ventures are accounted for using the equity method, except for selected venture fund investments for which the Group has elected to apply the method of fair value through the consolidated income statement.
Foreign currencies
The consolidated financial statements of Novartis are presented in US dollars (USD). The functional currency of subsidiaries is generally the local currency of the respective entity. The functional currency used for the reporting of certain Swiss and foreign finance entities is USD instead of their respective local currencies. This reflects the fact that the cash flows and transactions of these entities are primarily denominated in these curren-cies.
For subsidiaries not operating in hyperinflationary economies, the subsidiary’s results, financial position and cash flows that do not have USD as their functional currency are translated into USD using the following exchange rates:• Income, expense and cash flows using for each month
the average exchange rate with the US dollar values for each month being aggregated during the year.
• Balance sheets using year-end exchange rates.• Resulting exchange rate differences are recognized in
other comprehensive income.
The only hyperinflationary economy applicable to Novartis is Venezuela. The financial statements of the major subsidiaries in this country are first adjusted for the effect of inflation, with any gain or loss on the net monetary position recorded in the related functional lines in the consolidated income statement and then trans-lated into USD.
Acquisition of assets
Acquired assets are initially recognized on the balance sheet at cost if they meet the criteria for capitalization. If acquired as part of a business combination, the fair value of identified assets represents the cost for these assets. If separately acquired, the cost of the asset includes the purchase price and any directly attributable costs for bringing the asset into the condition to operate as intended. Expected costs for obligations to disman-tle and remove property, plant and equipment when it is no longer used are included in their cost.
Property, plant and equipment
Property, plant and equipment are depreciated on a straight-line basis in the consolidated income statement over their estimated useful lives. Leasehold land is depre-ciated over the period of its lease, whereas freehold land is not depreciated. The related depreciation expense is included in the costs of the functions using the asset.

192 | Novartis Annual Report 2017
Property, plant and equipment are assessed for impairment whenever there is an indication that the balance sheet carrying amount may not be recoverable using cash flow projections for the useful life.
The following table shows the respective useful lives for property, plant and equipment:
Useful life
Buildings 20 to 40 years
Machinery and other equipment
Machinery and equipment 7 to 20 years
Furniture and vehicles 5 to 10 years
Computer hardware 3 to 7 years
Government grants obtained for construction activities, including any related equipment, are deducted from the gross acquisition cost to arrive at the balance sheet car-rying value of the related assets.
Goodwill and intangible assets
GoodwillGoodwill arises in a business combination and is the excess of the consideration transferred to acquire a busi-ness over the underlying fair value of the net identified assets acquired. It is allocated to groups of cash-gener-ating units (CGUs) which are usually represented by the reported segments. Goodwill is tested for impairment annually at the level of these groups of CGUs, and any impairment charges are recorded under “Other Expense” in the consolidated income statement.
Intangible assets available-for-useNovartis has the following classes of available-for-use intangible assets: Currently marketed products; Market-ing know-how; Technologies; Other intangible assets (including computer software) and the Alcon brand name.
Currently marketed products represent the compos-ite value of acquired intellectual property, patents, and distribution rights and product trade names.
Marketing know-how represents the value attribut-able to the expertise acquired for marketing and distrib-uting Alcon surgical products.
Technologies represent identified and separable acquired know-how used in the research, development and production processes.
Significant investments in internally developed and acquired computer software are capitalized and included in the “Other” category and amortized once available for use.
The Alcon brand name is shown separately, as it is the only Novartis intangible asset that is available for use with an indefinite useful life. Novartis considers that it is appropriate that the Alcon brand name has an indefinite life since Alcon-branded products have a history of strong revenue and cash flow performance, and Novartis has the intent and ability to support the brand with spend-ing to maintain its value for the foreseeable future.
Except for the Alcon brand name, intangible assets available for use are amortized over their estimated use-ful lives on a straight-line basis and evaluated for poten-
tial impairment whenever facts and circumstances indi-cate that their carrying value may not be recoverable. The Alcon brand name is not amortized, but evaluated for potential impairment annually.
The following table shows the respective useful lives for available-for-use intangible assets and the location in the consolidated income statement in which the respective amortization and any potential impairment charge is recognized:
Income statement location
for amortization and
Useful life impairment charges
Currently marketed products 5 to 20 years “Cost of goods sold”
Marketing know-how 25 years “Cost of goods sold”
Technologies 10 to 20 years “Cost of goods sold”
or “Research
and Development”
Other (including 3 to 7 years In the respective
computer software) functional expense
Alcon brand name Not amortized, Not applicable
indefinite useful life
Intangible assets not yet available-for-useAcquired research and development intangible assets, which are still under development and have accordingly not yet obtained marketing approval, are recognized as In-Process Research & Development (IPR&D).
IPR&D is not amortized, but evaluated for potential impairment on an annual basis or when facts and circum-stances warrant. Any impairment charge is recorded in the consolidated income statement under “Research & Development”. Once a project included in IPR&D has been successfully developed, it is transferred to the “Currently marketed products” category.
Impairment of goodwill and intangible assetsAn asset is considered impaired when its balance sheet carrying amount exceeds its estimated recoverable amount, which is defined as the higher of its fair value less costs of disposal and its value in use. Usually, Novartis applies the fair value less costs of disposal method for its impairment assessment. In most cases, no directly observable market inputs are available to measure the fair value less costs of disposal. Therefore, an estimate is derived indirectly and is based on net pres-ent value techniques utilizing post-tax cash flows and discount rates. In the limited cases where the value in use method would be applied, net present value tech-niques would be applied using pre-tax cash flows and discount rates.
Fair value less costs of disposal reflects estimates of assumptions that market participants would be expected to use when pricing the asset or CGUs, and for this pur-pose, management considers the range of economic conditions that are expected to exist over the remaining useful life of the asset.
The estimates used in calculating the net present val-ues are highly sensitive and depend on assumptions spe-cific to the nature of the Group’s activities with regard to:

Novartis Annual Report 2017 | 193FINaNcIal RepORTNotes to the Novartis Group consolidated financial statements
• Amount and timing of projected future cash flows• Long-term sales forecasts for periods of up to 25 years• Actions of competitors (launch of competing products,
marketing initiatives, etc.)• Sales erosion rates after the end of patent or other
intellectual property rights protection and timing of the entry of generic competition
• Outcome of R&D activities (compound efficacy, results of clinical trials, etc.)
• Amount and timing of projected costs to develop IPR&D into commercially viable products
• Probability of obtaining regulatory approval• Future tax rate• Appropriate royalty rate for the Alcon Brand name• Appropriate terminal growth rate• Appropriate discount rate
Generally, for intangible assets with a definite useful life Novartis uses cash flow projections for the whole useful life of these assets. For goodwill and the Alcon brand name, Novartis generally utilizes cash flow projections for a five-year period based on management forecasts, with a terminal value based on cash flow projections usu-ally in line with inflation rates for later periods. Probabil-ity-weighted scenarios are typically used.
Discount rates used consider the Group’s estimated weighted average cost of capital, adjusted for specific country and currency risks associated with cash flow projections to approximate the weighted average cost of capital of a comparable market participant.
Due to the above factors, actual cash flows and val-ues could vary significantly from forecasted future cash flows and related values derived using discounting tech-niques.
Impairment of associated companies accounted for at equityNovartis considers investments in associated compa-nies for impairment evaluation whenever objective evi-dence indicates the net investment may be impaired, including when a quoted share price indicates a fair value less than the per-share balance sheet carrying value for the investment.
If the recoverable amount of the investment is esti-mated to be lower than the balance sheet carrying amount an impairment charge is recognized for the dif-ference in the consolidated income statement under “Income from associated companies”.
Cash and cash equivalents, marketable securities, commodities and non-current financial assets Cash and cash equivalents include highly liquid invest-ments with original maturities of three months or less, which are readily convertible to known amounts of cash. Bank overdrafts are usually presented within current financial debts on the consolidated balance sheet, except in cases where a right of offset has been agreed with a bank, which then allows for presentation on a net basis.
Marketable securities are financial assets consisting principally of equity and debt securities as well as fund investments. Marketable securities held for short-term purposes are principally traded in liquid markets and are classified as marketable securities on the consolidated balance sheet. Marketable securities held for long-term strategic purposes are classified as non-current finan-cial assets on the consolidated balance sheet.
Marketable securities are initially recorded at fair value on their trade date, which is different from the set-tlement date when the transaction is ultimately effected. Quoted securities are re-measured at each reporting date to fair value based on current market prices. If the market for a financial asset is not active or no market is available, fair values are established using valuation tech-niques. The majority of non-quoted investments are val-ued initially at fair value through the established purchase price between a willing buyer and seller. Non-quoted investments are subsequently adjusted based on values derived from using discounted cash flow analysis or other pricing models. These investment values are what is known as “Level 3” in the fair value hierarchy.
The Group has classified all its equity and quoted debt securities as well as fund investments as available-for-sale, as they are not acquired to generate profit from short-term fluctuations in price. Unrealized gains, except exchange gains related to quoted debt instruments, are recorded as a fair value adjustment in the consolidated statement of comprehensive income. They are recog-nized in the consolidated income statement when the financial asset is sold, at which time the gain is trans-ferred either to “Other financial income and expense”, for the marketable securities held for short-term non-stra-tegic purposes, or to “Other income”, for all other equity securities and fund investments. Exchange gains related to quoted debt instruments are immediately recognized in the consolidated income statement under “Other financial income and expense”.
A security is assessed for impairment when its mar-ket value at the balance sheet date is less than initial cost reduced by any previously recognized impairment. Impairments on equity securities, quoted debt securities and fund investments, and exchange rate losses on quoted debt securities in a foreign currency that are held for short-term non-strategic purposes are recorded in “Other financial income and expense”. Impairments are recorded for all other equity securities and other fund investments in “Other expense” in the consolidated income statement.
Commodities include gold bullion or coins which are valued at the lower of cost or fair value using current market prices. The changes in fair value below cost are immediately recorded in “Other financial income and expense”.
Other non-current financial assets, including loans held for long-term strategic purposes, are carried at amortized cost, which reflects the time value of money less any allowances for uncollectable amounts. For these financial assets, impairments and exchange rate losses are included in “Other expense” in the consolidated income statement and exchange rate gains and interest income using the effective interest rate method are included in “Other income” in the consolidated income statement.

194 | Novartis Annual Report 2017
Derivative financial instruments
Derivative financial instruments are initially recognized in the balance sheet at fair value and are re-measured to their current fair value at the end of each subsequent reporting period. The valuation of a forward exchange rate contract is based on the discounted cash flow model, using interest curves and spot rates at the report-ing date as observable inputs.
Options are valued based on a modified Black-Scholes model using volatility and exercise prices as major observable inputs.
The Group utilizes derivative financial instruments for the purpose of hedging to reduce the volatility in the Group’s performance due to the exposure of various types of business risks. To mitigate these risks, the Group enters into certain derivative financial instruments. The risk reduction is obtained because the derivative’s value or cash flows are expected, wholly or partly, to offset changes in the value or cash flows of the recognized assets or liabilities. The overall strategy is aiming to mit-igate the currency and interest exposure risk of positions that are contractually agreed and to partially mitigate the exposure risk of selected anticipated transactions.
Certain derivative financial instruments meet the criteria for hedge accounting treatment. A prerequisite for obtaining this accounting-hedge relationship is exten-sive documentation on inception and proving on a regu-lar basis that the economic hedge is effective for account-ing purposes. Other derivative financial instruments do not meet the criteria to qualify for hedge accounting. Changes in the fair value of those derivative instruments are recognized immediately in “Other financial income and expense” in the consolidated income statement.
In addition, the Group has designated certain long-term debt components as hedges of the translation risk arising on certain net investments in foreign operations. On consolidation, foreign currency differences arising on long-term debt designated as net investment hedges of a foreign operation are recognized in other compre-hensive income and accumulated in currency translation effects, to the extent that the hedge is effective. The for-eign currency differences arising from hedge ineffective-ness are recognized in the income statement in “Other financial income and expense”.
When a hedged net investment is disposed of, the proportionate portion of the cumulative amount recog-nized in equity in relation to the hedged net investment is transferred to the income statement as an adjustment to the profit or loss on disposal.
Inventories
Inventory is valued at acquisition or production cost determined on a first-in first-out basis. This value is used for the “Cost of goods sold” in the consolidated income statement. Unsalable inventory is fully written off in the consolidated income statement under “Cost of goods sold”.
Trade receivables
Trade receivables are initially recognized at their invoiced amounts, including any related sales taxes less adjust-ments for estimated revenue deductions such as rebates, chargebacks and cash discounts.
Provisions for doubtful trade receivables are estab-lished once there is an indication that it is likely that a loss will be incurred. These provisions represent the difference between the trade receivable’s carrying amount in the consolidated balance sheet and the esti-mated net collectible amount. Significant financial diffi-culties of a customer, such as probability of bankruptcy, financial reorganization, default or delinquency in pay-ments are considered indicators that recovery of the trade receivable is doubtful. Charges for doubtful trade receivables are recognized in the consolidated income statement within “Marketing & Sales” expenses.
Legal and environmental liabilities
Novartis and its subsidiaries are subject to contingen-cies arising in the ordinary course of business such as patent litigation, environmental remediation liabilities and other product-related litigation, commercial litigation, and governmental investigations and proceedings. Provisions are recorded where a reliable estimate can be made of the probable outcome of legal or other dis-putes against the subsidiary.
Contingent consideration
In a business combination or divestment of a business, it is necessary to recognize contingent future payments to previous owners, representing contractually defined potential amounts as a liability or asset. Usually for Novartis, these are linked to milestone or royalty pay-ments related to certain assets and are recognized as a financial liability or financial asset at their fair value, which is then re-measured at each subsequent reporting date. These estimations typically depend on factors such as technical milestones or market performance and are adjusted for the probability of their likelihood of payment, and if material, are appropriately discounted to reflect the impact of time.
Changes in the fair value of contingent consideration liabilities in subsequent periods are recognized in the consolidated income statement in “Cost of goods sold” for currently marketed products and in “Research & Development” for IPR&D. Changes in contingent consid-eration assets are recognized in “Other income” or “Other expense”, depending on its nature.
The effect of unwinding the discount over time is rec-ognized for contingent liabilities in “Interest expense” and for contingent assets in “other financial income and expense” in the consolidated income statement.

Novartis Annual Report 2017 | 195FINaNcIal RepORTNotes to the Novartis Group consolidated financial statements
Defined benefit pension plans and other post-employment benefitsThe liability in respect of defined benefit pension plans and other post-employment benefits is the defined ben-efit obligation calculated annually by independent actu-aries using the projected unit credit method. The current service cost for such post- employment benefit plans is included in the personnel expenses of the various func-tions where the associates are employed, while the net interest on the net defined benefit liability or asset is recognized as “Other expense” or “Other income”.
Treasury shares
Treasury shares are initially recorded at fair value on their trade date which is different from the settlement date, when the transaction is ultimately effected. Treasury shares are deducted from consolidated equity at their nominal value of CHF 0.50 per share. Differences between the nominal amount and the transaction price on purchases or sales of treasury shares with third par-ties, or the value of services received for the shares allo-cated to associates as part of share-based compensa-tion arrangements, are recorded in “Retained earnings” in the consolidated statement of changes in equity.
Revenue recognition
RevenueRevenue is recognized on the sale of Novartis Group products and services and recorded as “Net sales” in the consolidated income statement when there is per-suasive evidence that a sales arrangement exists; title, risks and rewards for the products are transferred to the customer; the price is determinable; and collectability is reasonably assured. When contracts contain customer acceptance provisions, sales are recognized upon the satisfaction of acceptance criteria. If products are stock-piled at the request of the customer, revenue is only rec-ognized once the products have been inspected and accepted by the customer, and there is no right of return or replenishment on product expiry.
Surgical equipment may be sold together with other products and services under a single contract. The total consideration is allocated to the separate elements based on their relative fair values. Revenue is recognized once the recognition criteria have been met for each ele-ment of the contract.
For surgical equipment, in addition to cash and install-ment sales, revenue is recognized under finance and operating lease arrangements. Arrangements in which Novartis transfers substantially all the risks and rewards incidental to ownership to the customer are treated as finance lease arrangements. Revenue from finance lease arrangements is recognized at amounts equal to the fair values of the equipment, which approximate the present values of the minimum lease payments under the arrange-
ments. As interest rates embedded in lease arrange-ments are approximately market rates, revenue under finance lease arrangements is comparable to revenue for outright sales. Finance income for arrangements in excess of twelve months is deferred and subsequently recognized based on a pattern that approximates the use of the effective interest method and recorded in “Other income”. Operating lease revenue for equipment rentals is recognized on a straight-line basis over the lease term.
Provisions for rebates and discounts granted to gov-ernment agencies, wholesalers, retail pharmacies, man-aged healthcare organizations and other customers are recorded as a deduction from revenue at the time the related revenues are recorded or when the incentives are offered. They are calculated on the basis of histori-cal experience and the specific terms in the individual agreements.
Provisions for refunds granted to healthcare provid-ers under innovative pay-for-performance agreements are recorded as a revenue deduction at the time the related sales are recorded. They are calculated on the basis of historical experience and clinical data available for the product, as well as the specific terms in the indi-vidual agreements. In cases where historical experience and clinical data are not sufficient for a reliable estima-tion of the outcome, revenue recognition is deferred until such history is available.
Cash discounts are offered to customers to encour-age prompt payment and are recorded as revenue deductions.
Following a decrease in the price of a product, we generally grant customers a “shelf stock adjustment” for their existing inventory for the involved product. Provi-sions for shelf stock adjustments, which are primarily relevant within the Sandoz Division, are determined at the time of the price decline or at the point of sale, if the impact of a price decline on the products sold can be reasonably estimated based on the customer’s inventory levels of the relevant product.
When there is historical experience of Novartis agree-ing to customer returns and Novartis can reasonably esti-mate expected future returns, a provision is recorded for estimated sales returns. In doing so, the estimated rate of return is applied, determined based on historical expe-rience of customer returns and considering any other relevant factors. This is applied to the amounts invoiced, also considering the amount of returned products to be destroyed versus products that can be placed back in inventory for resale. Where shipments are made on a re-sale or return basis, without sufficient historical expe-rience for estimating sales returns, revenue is only recorded when there is evidence of consumption or when the right of return has expired.
Provisions for revenue deductions are adjusted to actual amounts as rebates, discounts and returns are processed. The provision represents estimates of the related obligations, requiring the use of judgment when estimating the effect of these sales deductions.
196 | Novartis Annual Report 2017
Other revenue“Other revenue” includes royalty and profit sharing income and revenue from activities such as manufactur-ing services or other services rendered, to the extent such revenue is not recorded under net sales.
Research & Development
Internal Research & Development (R&D) costs are fully charged to “Research & Development” in the consoli-dated income statement in the period in which they are incurred. The Group considers that regulatory and other uncertainties inherent in the development of new prod-ucts preclude the capitalization of internal development expenses as an intangible asset until marketing approval from a regulatory authority is obtained in a major market such as the United States, the European Union, Switzer-land or Japan.
Payments made to third parties, such as contract research and development organizations in compensa-tion for subcontracted R&D, that is deemed to not trans-fer intellectual property to Novartis are expensed as internal R&D expenses in the period in which they are incurred. Such payments are only capitalized if they meet the criteria for recognition of an internally generated intangible asset, usually when marketing approval has been achieved from a regulatory authority in a major mar-ket.
Payments made to third parties to in-license or acquire intellectual property rights, compounds and products, including initial upfront and subsequent mile-stone payments, are capitalized, as are payments for other assets, such as technologies to be used in R&D activities. If additional payments are made to the origi-nator company to continue to perform R&D activities, an evaluation is made as to the nature of the payments. Such additional payments will be expensed if they are deemed to be compensation for subcontracted R&D services not resulting in an additional transfer of intellectual property rights to Novartis. Such additional payments will be cap-italized if they are deemed to be compensation for the transfer to Novartis of additional intellectual property developed at the risk of the originator company. Subse-quent internal R&D costs in relation to IPR&D and other assets are expensed, since the technical feasibility of the internal R&D activity can only be demonstrated by the receipt of marketing approval for a related product from a regulatory authority in a major market.
Costs for post-approval studies performed to sup-port the continued registration of a marketed product are recognized as marketing expenses. Costs for activ-ities that are required by regulatory authorities as a con-dition for obtaining marketing approval are capitalized and recognized as currently marketed products.
Inventory produced ahead of regulatory approval is fully provisioned and the charge is included in “Other expense” in the consolidated income statement, as its ultimate use cannot be assured. If this inventory can be subsequently sold, the provision is released to “Other income” in the consolidated income statement either on approval by the appropriate regulatory authority or, exceptionally in Europe, on recommendation by the Committee for Medicinal Products for Human Use (CHMP), if approval is virtually certain.
Share-based compensation
Vested Novartis shares and American Depositary Receipts (ADRs) that are granted as compensation are valued at their market value on the grant date and are immediately expensed in the consolidated income state-ment.
The fair values of unvested restricted shares, restricted share units (RSUs) and performance share units (PSUs) in Novartis shares and ADRs granted to associates as compensation are recognized as an expense over the related vesting period. The expense recorded in the consolidated income statement is included in the personnel expenses of the various func-tions where the associates are employed.
Unvested restricted shares, restricted ADRs and RSUs are only conditional on the provision of services by the plan participant during the vesting period. They are valued using their fair value on the grant date. As RSUs do not entitle the holder to dividends the fair value is based on the Novartis share price at the grant date adjusted for the net present value of the dividends expected to be paid during the holding period. The fair value of these grants, after making adjustments for assumptions related to their forfeiture during the vest-ing period, is expensed on a straight-line basis over the respective vesting period.
PSUs are subject to certain performance criteria being achieved during the vesting period and require plan participants to provide services during the vesting period. PSUs granted under plans defined as “Long-Term Per-formance Plans” are subject to performance criteria based on Novartis internal performance metrics. The expense is determined taking into account assumptions concerning performance during the period against tar-gets and expected forfeitures due to plan participants not meeting their service conditions. These assumptions are periodically adjusted. Any change in estimates for past services is recorded immediately as an expense or income in the consolidated income statement and amounts for future periods are expensed over the remaining vesting period. As a result, at the end of the vesting period, the total charge during the whole vesting period represents the amount that will finally vest. The number of equity instruments that finally vest is deter-mined at the vesting date.
PSUs granted under the Long-Term Relative Perfor-mance Plan (LTRPP) are conditional on the provision of services by the plan participant during the vesting period as well as on the Total Shareholder Return (TSR) per-formance of Novartis relative to a specific peer group of companies over the vesting period. These performance conditions are based on variables that can be observed in the market. IFRS requires that these observations are taken into account in determining the fair value of these PSUs at the date of grant. Novartis has determined the fair value of these PSUs at the date of grant using a “Monte Carlo” simulation model. The total fair value of this grant is expensed on a straight-line basis over the vesting period. Adjustments to the number of equity instruments granted are only made if a plan participant does not fulfill the service conditions.
If a plan participant leaves Novartis for reasons other than retirement, disability or death, then unvested restricted shares, restricted ADRs, RSUs and PSUs are
Novartis Annual Report 2017 | 197FINaNcIal RepORTNotes to the Novartis Group consolidated financial statements
forfeited, unless determined otherwise by the provision of the plan rules or by the Compensation Committee of the Novartis Board of Directors, for example, in connec-tion with a reorganization or divestment.
Measuring the fair values of PSUs granted under the LTRPP, requires estimates. The Monte Carlo simulation used for determining the fair value of the PSUs related to the LTRPP requires as input parameters the probabil-ity of factors related to uncertain future events; the term of the award; the grant price of underlying shares or ADRs; expected volatilities; the expected correlation matrix of the underlying equity instruments with those of the peer group of companies and the risk-free inter-est rate.
Government grants
Grants from governments or similar organizations are recognized at their fair value when there is a reasonable assurance that the grant will be received and the Group will comply with all attached conditions.
Government grants related to income are deferred and recognized in the consolidated income statement over the period necessary to match them with the related costs that they are intended to compensate.
The accounting policy for property, plant and equip-ment describes the treatment of any related grants.
Restructuring charges
Restructuring provisions are recognized for the direct expenditures arising from the restructuring, where the plans are sufficiently detailed and where appropriate communication to those affected has been made.
Charges to increase restructuring provisions are included in “Other expense” in the consolidated income statements. Corresponding releases are recorded in “Other income” in the consolidated income statement.
Taxes
Taxes on income are provided in the same periods as the revenues and expenses to which they relate and include any interest and penalties incurred during the period. Deferred taxes are determined using the com-prehensive liability method and are calculated on the temporary differences that arise between the tax base of an asset or liability and its carrying value in the bal-ance sheet prepared for consolidation purposes, except for those temporary differences related to investments in subsidiaries and associated companies, where the tim-ing of their reversal can be controlled and it is probable that the difference will not reverse in the foreseeable future. Since the retained earnings are reinvested, with-holding or other taxes on eventual distribution of a sub-sidiary’s retained earnings are only taken into account when a dividend has been planned.
The estimated amounts for current and deferred tax assets or liabilities, including any amounts related to any uncertain tax positions, are based on currently known facts and circumstances. Tax returns are based on an
interpretation of tax laws and regulations, and reflect estimates based on these judgments and interpretations. The tax returns are subject to examination by the com-petent taxing authorities, which may result in an assess-ment being made requiring payments of additional tax, interest or penalties. Inherent uncertainties exist in the estimates of the tax positions.
Non-current assets held for sale
Non-current assets are classified as assets held for sale when their carrying amount is to be recovered principally through a sale transaction and a sale is considered highly probable. They are stated at the lower of carrying amount and fair value less costs of disposal. Assets held for sale, included within a disposal group or discontinued opera-tions are not depreciated or amortized.
Status of adoption of significant new or amended IFRS standards or interpretationsThe adoption of new or amended standards and inter-pretations that are effective for the financial year begin-ning on January 1, 2017, did not have a material impact on the Group’s consolidated financial statements.
The following new IFRS standards will, based on a Novartis analysis, be of significance to the Group, but have not yet been early adopted:
IFRS 9 FINaNcIal INSTRUMeNTSIFRS 9 Financial Instruments will substantially change the classification and measurement of financial instruments. The new standard requires impairments to be based on a forward-looking model, changes the approach to hedging financial exposures and related documentation, changes the recognition of certain fair value changes and amends disclosures requirements.
The impairment of financial assets, including trade and lease receivables, will be assessed using an expected credit loss model rather than the current incurred loss model. Given the nature of Novartis’ financial assets, the Group does not expect a significant impact to our pro-visions for doubtful accounts or impairments from this change.
The new hedge accounting model introduced by the standard requires hedge accounting relationships to be based upon the Group’s own risk management strategy and objectives, and to be discontinued only when the relationships no longer qualify for hedge accounting. Based on the impact of adoption assessment performed, Novartis expects that the existing hedge relationship will continue to be designated as such under the new hedge accounting requirements.
The Group will implement the new standard on Jan-uary 1, 2018 and will apply the modified retrospective method, which requires the recognition of the cumula-tive effect of initially applying IFRS 9, as at January 1, 2018, to retained earnings and not restate prior years.
The most significant impact to the Group, upon adop-tion of IFRS 9, will be the treatment of the unrealized gains and losses from changes in fair value on certain of
198 | Novartis Annual Report 2017
the Group’s financial instruments, which are classified as available-for-sale marketable securities and financial investments. The unrealized gains and losses (to the extent of previous recognized unrealized gains), which the Group currently recognizes in the consolidated state-ment of other comprehensive income, will in the future be recognized in the consolidated income statement. This approach will be applied to equity securities where the fair value through other comprehensive income irre-vocable option will not be applied. If this accounting had been applied prior to January 1, 2018, the adoption date, the cumulative effect to be recorded as an increase to retained earnings, as at January 1, 2018, is estimated at USD 0.2 billion.
IFRS 15 ReVeNUe FROM cONTRacTS WITH cUSTOMeRSIFRS 15 Revenue from contracts with customers amends revenue recognition requirements and establishes prin-ciples for reporting information about the nature, amount, timing and uncertainty of revenue and cash flows aris-ing from contracts with customers. The standard replaces IAS 18 Revenue and IAS 11 Construction con-tracts and related interpretations.Results of our impact assessment: • The Group’s “Net sales” are derived from the sale of
drug substances, vision care products, surgical equip-ment, other products and services, where control transfers to our customers and our performance obli-gations are satisfied at the time of shipment to or receipt of the products by the customer or when the services are performed. We do not expect IFRS 15 to significantly change the timing or amount of revenue recognized under these arrangements.
• The Group’s “Other revenue” consists of royalty income from the out-licensing of intellectual property (IP), which is recognized as earned and from manufactur-ing services and other services, where revenue is rec-ognized when control transfers to the third party and our performance obligations are satisfied. We do not expect IFRS 15 to significantly change the timing or amount of revenue recognized from these manufactur-ing and other services arrangements, nor from these royalty arrangements, as the standard’s royalty excep-tion will apply for IP licenses.
“Other revenue” also includes revenue from profit sharing arrangements with our collaboration partners. Furthermore, the Group receives milestone payments related to sale or out-licensing of IP. Novartis does not expect IFRS 15 to significantly change the timing or amount of revenue recognized under these arrange-ments.
The Group will implement the new standard on January 1, 2018 and will apply the modified retrospective method, which requires the recognition of the cumulative effect of initially applying IFRS 15, as at January 1, 2018, to retained earnings and not restate prior years. However, since the results of the Group’s impact assessment indi-cates that IFRS 15 is not expected to significantly change the amount or timing of revenue recognition in 2017 or prior periods, an insignificant cumulative adjustment to increase retained earnings will be made.
IFRS 16 leaSeSIFRS 16 Leases substantially changes the financial state-ments as the majority of leases for which the company is the lessee will become on-balance sheet liabilities with corresponding right of use assets on the balance sheet. The standard replaces IAS 17 Leases and is effective on January 1, 2019. The current undiscounted operating lease commitments of USD 3.2 billion as of December 31, 2017, and disclosed in Note 27 provide, subject to the provision of the standard, an indicator of the impact of the implementation of IFRS 16 on the Group’s consoli-dated balance sheet.
Upon adoption of the new standard, a portion of the annual operating lease costs, which is currently fully rec-ognized as a functional expense, will be recorded as interest expense. In addition, the portion of the annual lease payments recognized in the cash flow statement as a reduction of the lease liability will be recognized as an outflow from financing activities, which currently are fully recognized as an outflow from operating activities. Given the leases involved and assuming the current low interest rate environment continues, the Group does not currently expect these effects to be significant.
There are no other IFRS standards or interpretations not yet effective that would be expected to have a material impact on the Group.
2. Significant transactionsSignificant transactions in 2017
INNOVaTIVe MeDIcINeS – acQUISITION OF ZIaRcO GROUp lIMITeD
On January 20, 2017, Novartis acquired Ziarco Group Limited (Ziarco), a privately held company in the United Kingdom, focused on the development of novel treat-ments in dermatology. This acquisition adds a once-daily oral H4 receptor antagonist in development for atopic
dermatitis, commonly known as eczema, to complement the Novartis dermatology portfolio and pipeline. The fair value of the total purchase consideration was USD 420 million. The amount consisted of an initial cash payment of USD 325 million and the net present value of the con-tingent consideration of USD 95 million, due to Ziarco shareholders, which they are eligible to receive upon the achievement of specified development milestones. The purchase price allocation resulted in net identifiable

Novartis Annual Report 2017 | 199FINaNcIal RepORTNotes to the Novartis Group consolidated financial statements
assets of USD 395 million and goodwill of USD 25 mil-lion. Results of operations since the date of acquisition were not material.
INNOVaTIVe MeDIcINeS – acQUISITION OF eNcORe VISION, INc.On January 20, 2017, Novartis acquired Encore Vision, Inc. (Encore), a privately-held company in Fort Worth, Texas, in the United States, focused on the development of a novel treatment in presbyopia. The fair value of the total purchase consideration was USD 456 million. The amount consisted of an initial cash payment of USD 366 million and the net present value of the contingent con-sideration of USD 90 million, due to Encore sharehold-ers, which they are eligible to receive upon the achieve-ment of specified development and commercialization milestones. The purchase price allocation resulted in net identifiable assets of USD 389 million and goodwill of USD 67 million. Results of operations since the date of acquisition were not material.
Significant transaction entered into in 2017 and closed in January 2018INNOVaTIVe MeDIcINeS – acQUISITION OF aDVaNceD acceleRaTOR applIcaTIONS, S.a.
On October 30, 2017, Novartis entered into a binding memorandum of understanding with Advanced Acceler-ator Applications S.A., (AAA), a NASDAQ-listed company headquartered in Saint-Genis-Pouilly, France, under which Novartis agreed to commence a tender offer for 100% of the share capital of AAA subject to certain con-ditions. Novartis commenced the tender offer on Decem-ber 7, 2017, to purchase all of the outstanding ordinary shares for a price of USD 41 per share and USD 82 per American Depositary Share (ADS), each representing two ordinary shares of AAA, which expired on January 19, 2018. The offer values AAAs equity at USD 3.9 bil-lion, on a fully diluted basis. The transaction to acquire AAA is being funded mainly through external short- and long-term debt.
As of the expiration of the tender offer, approximately 97% of the then outstanding fully diluted ordinary shares, including ordinary shares represented by ADSs, were validly tendered. On January 22, 2018, Novartis accepted and paid USD 3.9 billion for the ordinary shares, includ-ing ordinary shares represented by ADSs, tendered in the offer.
On January 22, 2018 Novartis also commenced a subsequent offering period that will expire on January 31, 2018, unless extended.
AAA is a radiopharmaceutical company that devel-ops, produces and commercializes molecular nuclear medicines, including Lutathera® (lutetium (177Lu) oxodo-treotide), a first-in-class RLT product for neuroendocrine tumors (NETs) and a portfolio of diagnostic products. Radiopharmaceuticals, such as Lutathera®, are unique medicinal formulations containing radioisotopes, which are used clinically for both diagnosis and therapy.
Significant transactions in 2016
alcON – acQUISITION OF TRaNSceND MeDIcal, INc.On February 17, 2016, Alcon entered into an agreement to acquire Transcend Medical, Inc. (Transcend), a pri-vately-held, US-based company focused on developing
minimally-invasive surgical devices to treat glaucoma. The transaction closed on March 23, 2016, and the fair value of the total purchase consideration was USD 332 million. The amount consisted of an initial cash payment of USD 240 million and the net present value of contin-gent consideration of USD 92 million due to the Tran-scend shareholders, which they are eligible to receive upon the achievement of specified development and commercialization milestones. The purchase price allo-cation resulted in net identifiable assets of USD 294 mil-lion and goodwill of USD 38 million. The 2016 results of operations since the date of acquisition were not mate-rial.
INNOVaTIVe MeDIcINeS – acQUISITION OF RepRIXYS pHaRMaceUTIcalS cORpORaTION
On November 18, 2016, Novartis acquired Reprixys Phar-maceuticals Corporation (Reprixys), a privately held, US-based company specializing in the development of therapeutics in certain hematologic and inflammatory disorders, following receipt of results of the SUSTAIN study. The previously held interest of 19% is adjusted to its fair value of USD 64 million through the consolidated income statement at acquisition date. This re-measure-ment resulted in a gain of USD 53 million.
The fair value of the total purchase consideration for acquiring the 81% stake Novartis did not already own amounted to USD 268 million. The amount consisted of an initial cash payment of USD 194 million and the net present value of the contingent consideration of USD 74 million due to Reprixys shareholders, which they are eli-gible to receive upon the achievement of specified devel-opment and commercialization milestones. The pur-chase price allocation resulted in net identifiable assets of USD 332 million. No goodwill was recognized. The 2016 results of operations since the date of acquisition were not material.
Significant transactions in 2015
Portfolio transformation transactionsTRaNSacTION WITH elI lIllY aND cOMpaNYOn January 1, 2015, Novartis closed its transaction with Eli Lilly and Company, USA (Lilly) announced in April 2014 to divest its Animal Health business for USD 5.4 billion in cash. This resulted in a pre-tax gain of USD 4.6 billion, which is recorded in operating income from discontin-ued operations.
TRaNSacTIONS WITH GlaXOSMITHKlINe plcOn March 2, 2015, Novartis closed its transactions with GlaxoSmithKline plc, Great Britain (GSK) announced in April 2014, with the following consequences:
INNOVATIVE MEDICINES – ACQUISITION OF GSK ONCOLOGY PRODUCTS
Novartis acquired GSK’s oncology products and certain related assets for an aggregate cash consideration of USD 16.0 billion. Up to USD 1.5 billion of this cash consideration at the acquisition date is contingent on certain development milestones. The fair value of this potentially refundable consideration as at the acquisition date is USD 0.1 billion. In addition, under the terms of the agreement, Novartis is granted a right of first negotiation

200 | Novartis Annual Report 2017
over the co-development or commercialization of GSK’s current and future oncology R&D pipeline, excluding oncology vaccines. The right of first negotiation is for a period of 12.5 years from the acquisition closing date. The purchase price allocation of the fair value of the con-sideration of USD 15.9 billion resulted in net identified assets of USD 13.5 billion and goodwill of USD 2.4 bil-lion. In 2015, from the date of the acquisition the busi-ness generated net sales of USD 1.8 billion. Management estimates net sales for the entire year 2015 would have amounted to USD 2.1 billion had the oncology products been acquired at the beginning of the 2015 reporting period. The 2015 net results from operations on a reported basis since the acquisition date were not material.
VACCINES – DIVESTMENT
Novartis divested its Vaccines business (excluding its Vaccines influenza business) to GSK for up to USD 7.1 billion plus royalties. The USD 7.1 billion consists of USD 5.25 billion paid at closing and up to USD 1.8 billion in future milestone payments. The fair value of the con-tingent future milestones and royalties as at the acqui-sition date is USD 1.0 billion, resulting in a fair value of consideration received of USD 6.25 billion. Included in this amount is a USD 450 million milestone payment received in late March 2015. The sale of this business resulted in a pre-tax gain of USD 2.8 billion, which is recorded in operating income from discontinued opera-tions.
Novartis’s Vaccines influenza business was excluded from the GSK Vaccines business acquisition. However, GSK entered into a future option arrangement with Novartis in relation to the Vaccines influenza business, pursuant to which Novartis could have unilaterally required GSK to acquire the entire or certain parts of its Vaccines influenza business for consideration of up to USD 250 million (the Influenza Put Option) if the divest-ment to CSL Limited, Australia (CSL), discussed below, had not been completed. The option period was 18 months from the closing date of the GSK transaction, but terminated with the sale of the Vaccines influenza business to CSL on July 31, 2015. Novartis paid GSK a fee of USD 5 million in consideration for the grant of the Influenza Put Option.
CONSUMER HEALTH – COMBINATION OF NOVARTIS OTC WITH GSK CONSUMER HEALTHCARE
Novartis and GSK agreed to create a combined con-sumer healthcare business through the combination between Novartis OTC and GSK Consumer Healthcare businesses. On March 2, 2015, a new entity, GlaxoSmith-Kline Consumer Healthcare Holdings Ltd. (GSK Con-sumer Healthcare) was formed via contribution of busi-nesses from both Novartis and GSK. Novartis has a 36.5% interest in the newly created entity. Novartis has valued the contribution of 63.5% of its OTC Division in exchange for 36.5% of the GSK Consumer Healthcare business at fair value. Based on the estimates of fair val-ues exchanged, an investment in an associated company of USD 7.6 billion was recorded. The resulting pre-tax
gain, net of transaction related costs, of USD 5.9 billion is recorded in operating income from discontinued oper-ations.
Novartis has four of eleven seats on the GSK Con-sumer Healthcare Board of Directors. Furthermore, Novartis has customary minority rights and also exit rights at a pre-defined, market based pricing mechanism.
The investment is accounted for using the equity method of accounting using estimated results for the last quarter of the year. Any differences between this esti-mate and actual results, when available, will be adjusted in the Group’s consolidated financial statements in the following year.
ADDITIONAL GSK RELATED COSTS
The GSK transaction resulted in USD 0.6 billion of addi-tional transaction-related costs that were expensed, thereof USD 0.3 billion paid in 2015.
TRaNSacTION WITH cSlOn October 26, 2014, Novartis entered into an agree-ment with CSL to sell its Vaccines influenza business to CSL for USD 275 million. Entering into the separate divestment agreement with CSL resulted in the Vaccines influenza business being classified as a separate dis-posal group consisting of a group of cash generating units within the Vaccines Division, requiring the perfor-mance of a separate valuation of the Vaccines influenza business net assets. This triggered the recognition of an exceptional impairment charge in 2014 of USD 1.1 billion as the estimated net book value of the Vaccines influ-enza business net assets was above the USD 275 mil-lion consideration. The transaction with CSL was com-pleted on July 31, 2015, resulting in a partial reversal of the impairment recorded in 2014 in the amount of USD 0.1 billion, which is included in operating income from dis-continued operations.
Other significant transactions in 2015INNOVaTIVe MeDIcINeS – acQUISITION OF SpINIFeX pHaRMaceUTIcalS, INc.
On June 29, 2015, Novartis entered into an agreement to acquire Spinifex Pharmaceuticals, Inc. (Spinifex), a United States and Australia based, privately held devel-opment stage company, focused on developing a periph-eral approach to treat neuropathic pain. The transaction closed on July 24, 2015, and the fair value of the total purchase consideration was USD 312 million. The amount consisted of an initial cash payment of USD 196 million and the net present value of the contingent consider-ation of USD 116 million due to previous Spinifex share-holders, which they are eligible to receive upon achieve-ment of specified development and commercialization milestones. The purchase price allocation resulted in net identifiable assets of USD 263 million and goodwill of USD 49 million. The 2015 results of operations since the date of acquisition were not material.
INNOVaTIVe MeDIcINeS – acQUISITION OF aDMUNe THeRapeUTIcS llc
On October 16, 2015, Novartis entered into an agreement to acquire Admune Therapeutics LLC (Admune), a US-based, privately held company, broadening Novartis’

Novartis Annual Report 2017 | 201FINaNcIal RepORTNotes to the Novartis Group consolidated financial statements
pipeline of cancer immunotherapies. The fair value of the total purchase consideration amounted to USD 258 mil-lion. This amount consists of an initial cash payment of USD 140 million and the net present value of the contin-gent consideration of USD 118 million due to Admune’s previous owners, which they are eligible to receive upon
the achievement of specified development and commer-cialization milestones. The purchase price allocation resulted in net identifiable assets of USD 258 million. No goodwill was recognized. The 2015 results of operations since the date of acquisition were not material.
3. Segmentation of key figures 2017, 2016 and 2015The businesses of Novartis are divided operationally on a worldwide basis into three identified reporting seg-ments, Innovative Medicines, Sandoz and Alcon. In addi-tion, we separately report Corporate activities.
Reporting segments are presented in a manner con-sistent with the internal reporting to the chief operating decision maker, which is the Executive Committee of Novartis. The reporting segments are managed sepa-rately because they each research, develop, manufac-ture, distribute, and sell distinct products that require dif-fering marketing strategies.
The Executive Committee of Novartis is responsible for allocating resources and assessing the performance of the reporting segments.
Innovative Medicines researches, develops, manu-factures, distributes and sells patented prescription medicines. The Innovative Medicines Division is orga-nized into two global business units: Novartis Oncology business unit, which consists of the global business fran-chises Oncology and Novartis Pharmaceuticals business unit, which consists of the global business franchises Ophthalmology, Neuroscience, Immunology and Derma-tology, Respiratory, Cardio-Metabolic and Established Medicines.
Sandoz develops, manufactures and markets finished dosage form medicines as well as intermediary products including active pharmaceutical ingredients. Sandoz is organized globally in three franchises: Retail Generics, Anti Infectives, and Biopharmaceuticals. In Retail Gener-ics, Sandoz develops, manufactures and markets active ingredients and finished dosage forms of pharmaceuti-cals to third parties. Retail Generics includes the areas of cardiovascular, central nervous system, dermatology, gastrointestinal and hormonal therapies, metabolism, oncology, ophthalmics, pain, and respiratory, as well as finished dosage form anti infectives sold to third parties. In Anti Infectives, Sandoz manufactures and supplies active pharmaceutical ingredients and intermediates,
mainly antibiotics, for internal use by Retail Generics and for sale to third party customers. In Biopharmaceuticals, Sandoz develops, manufactures and markets protein or other biotechnology based products, including biosimi-lars, and provides biotechnology manufacturing services to other companies.
Alcon researches, discovers, develops, manufac-tures, distributes and sells eye care products. The Alcon Division is the global leader in eye care, with product offerings in eye care devices and vision care. The Alcon Division is organized globally in two global business franchises as follows: In Surgical, Alcon develops, man-ufactures, distributes and sells ophthalmic surgical equipment, instruments, disposable products and intra-ocular lenses. In Vision Care, Alcon develops, manufac-tures, distributes and sells contact lenses and lens care products.
Income and expenses relating to Corporate include the costs of the Group headquarters and those of cor-porate coordination functions in major countries. In addi-tion, Corporate includes other items of income and expense that are not attributable to specific segments, such as certain revenues from intellectual property rights, certain expenses related to post-employment benefits, environmental remediation liabilities, charitable activities, donations and sponsorships. Usually, no allo-cation of Corporate items is made to the segments. As a result, Corporate assets and liabilities principally con-sist of net liquidity (cash and cash equivalents, market-able securities less financial debts), investments in asso-ciated companies and current and deferred taxes and non-segment specific environmental remediation and post-employment benefit liabilities. Corporate also includes the Alcon brand name intangible asset as it is used to market products of the Alcon Division and prod-ucts within the Ophthalmology business franchise of the Innovative Medicines Division.

202 | Novartis Annual Report 2017
Our divisions are supported by the Novartis Institutes for BioMedical Research, Global Drug Development, Novartis Technical Operations and Novartis Business Services organizations.• The Novartis Institutes for BioMedical Research (NIBR)
conducts research activities of the Innovative Medicines Division and also collaborates with Sandoz.
• Global Drug Development organization was estab-lished in July 2016 and oversees all drug development activities for our Innovative Medicines Division and the biosimilars portfolio of our Sandoz Division.
• Novartis Technical Operations organization was estab-lished in July 2016, to centralize management of our manufacturing operations across our Innovative Medicines and Sandoz Divisions.
• Novartis Business Services (NBS) was established in January 2015 as a shared services organization and delivers business support services across the Group, such as information technology, real estate and facil-ity services, procurement, product lifecycle services, human resources and financial reporting and account-ing operations.
Following the portfolio transformation transactions in 2015, described in Note 2, Novartis has separated the Group’s reported financial data into “continuing” operations and “discontinued” operations:
Continuing operations comprise:• Innovative Medicines: innovative patent-protected
prescription medicines• Sandoz: generic and biosimilar pharmaceuticals • Alcon: eye care devices and vision care • Corporate activities
Discontinued operations comprise:• Vaccines: preventive human vaccines. Excluded are
certain intellectual property rights and related other revenues of the Vaccines Division, which are now reported under Corporate activities.
• Consumer Health: OTC (over-the-counter medicines) and Animal Health. These two divisions were managed separately. However, neither was material enough to the Group to be disclosed separately as a reporting segment.
• Corporate: certain transactional and other expenses related to the portfolio transformation.
The accounting policies mentioned in Note 1 are used in the reporting of segment results. Inter-segmental sales are made at amounts that are considered to approximate arm’s length transactions. The Executive Committee of Novartis evaluates segmental performance and allo-cates resources among the segments based on a num-ber of measures including net sales, operating income and net operating assets. Segment net operating assets consist primarily of property, plant and equipment, intan-gible assets, goodwill, inventories and trade and other operating receivables less operating liabilities.

Novartis Annual Report 2017 | 203FINaNcIal RepORTNotes to the Novartis Group consolidated financial statements
Segmentation – Consolidated income statements
Innovative Medicines Sandoz Alcon Corporate Group (including eliminations)
(USD millions) 2017 2016 2017 2016 2017 2016 2017 2016 2017 2016
Net sales to third parties 33 025 32 562 10 060 10 144 6 024 5 812 49 109 48 518
Sales to other segments 668 624 118 104 3 – 789 – 728
Net sales 33 693 33 186 10 178 10 248 6 027 5 812 – 789 – 728 49 109 48 518
Other revenues 898 815 37 37 3 4 88 62 1 026 918
Cost of goods sold – 9 007 – 9 331 – 5 800 – 5 971 – 3 231 – 3 092 863 874 – 17 175 – 17 520
Gross profit 25 584 24 670 4 415 4 314 2 799 2 724 162 208 32 960 31 916
Marketing & Sales – 9 089 – 8 435 – 1 811 – 1 681 – 1 961 – 1 882 – 12 861 – 11 998
Research & Development – 7 630 – 7 709 – 774 – 814 – 568 – 516 – 8 972 – 9 039
General & Administration – 986 – 978 – 315 – 300 – 383 – 410 – 452 – 506 – 2 136 – 2 194
Other income 1 027 1 091 204 185 47 48 691 603 1 969 1 927
Other expense – 1 124 – 1 213 – 351 – 259 – 124 – 96 – 732 – 776 – 2 331 – 2 344
Operating income 7 782 7 426 1 368 1 445 – 190 – 132 – 331 – 471 8 629 8 268
Income from associated companies – 1 23 6 1 086 697 1 108 703
Interest expense – 777 – 707
Other financial income and expense 39 – 447
Income before taxes 8 999 7 817
Taxes – 1 296 – 1 119
Net income 7 703 6 698
Attributable to:
Shareholders of Novartis AG 7 703 6 712
Non-controlling interests 0 – 14
Included in net income are:
Interest income 110 43
Depreciation of property,
plant & equipment – 916 – 883 – 270 – 260 – 217 – 229 – 117 – 117 – 1 520 – 1 489
Amortization of intangible assets – 2 291 – 2 470 – 447 – 450 – 942 – 929 – 10 – 12 – 3 690 – 3 861
Impairment charges on property,
plant & equipment, net – 84 – 93 – 73 – 2 – 5 – 2 – 157 – 102
Impairment charges on intangible
assets, net – 591 – 522 – 61 – 65 – 57 – 4 – 709 – 591
Impairment charges and fair value
gains on financial assets, net – 42 – 55 – 29 – 185 – 77 – 256 – 132
Additions to restructuring provisions – 122 – 236 – 61 – 46 – 8 – 36 – 3 – 25 – 194 – 343
Equity-based compensation of
Novartis equity plans – 593 – 582 – 52 – 47 – 71 – 53 – 208 – 164 – 924 – 846

204 | Novartis Annual Report 2017
Innovative Medicines Sandoz Alcon Corporate Group (including eliminations)
(USD millions) 2016 2015 2016 2015 2016 2015 2016 2015 2016 2015
Net sales to third parties from
continuing operations 32 562 33 345 10 144 10 070 5 812 5 999 48 518 49 414
Sales to other segments 624 518 104 128 – 728 – 620 26
Net sales from continuing operations 33 186 33 863 10 248 10 198 5 812 5 999 – 728 – 620 48 518 49 440
Other revenues 815 792 37 25 4 23 62 107 918 947
Cost of goods sold – 9 331 – 9 204 – 5 971 – 5 844 – 3 092 – 3 145 874 789 – 17 520 – 17 404
Gross profit from continuing operations 24 670 25 451 4 314 4 379 2 724 2 877 208 276 31 916 32 983
Marketing & Sales – 8 435 – 8 430 – 1 681 – 1 679 – 1 882 – 1 663 – 11 998 – 11 772
Research & Development – 7 709 – 7 685 – 814 – 782 – 516 – 468 – 9 039 – 8 935
General & Administration – 978 – 1 031 – 300 – 346 – 410 – 450 – 506 – 648 – 2 194 – 2 475
Other income 1 091 1 149 185 109 48 54 603 737 1 927 2 049
Other expense – 1 213 – 1 639 – 259 – 381 – 96 – 69 – 776 – 784 – 2 344 – 2 873
Operating income from
continuing operations 7 426 7 815 1 445 1 300 – 132 281 – 471 – 419 8 268 8 977
Income from associated companies 6 2 697 264 703 266
Interest expense – 707 – 655
Other financial income and expense – 447 – 454
Income before taxes from
continuing operations 7 817 8 134
Taxes – 1 119 – 1 106
Net income from continuing operations 6 698 7 028
Net income from discontinued operations 10 766
Net income 6 698 17 794
Attributable to:
Shareholders of Novartis AG 6 712 17 783
Non-controlling interests – 14 11
Included in net income from
continuing operations are:
Interest income 43 33
Depreciation of property,
plant & equipment – 883 – 839 – 260 – 277 – 229 – 237 – 117 – 117 – 1 489 – 1 470
Amortization of intangible assets – 2 470 – 2 384 – 450 – 450 – 929 – 912 – 12 – 9 – 3 861 – 3 755
Impairment charges on property,
plant & equipment, net – 93 39 – 2 – 97 – 5 – 1 – 2 – 21 – 102 – 80
Impairment charges on intangible
assets, net – 522 – 138 – 65 – 27 – 4 – 1 – 591 – 166
Impairment charges and fair value
gains on financial assets, net – 55 – 32 – 77 – 72 – 132 – 104
Additions to restructuring provisions – 236 – 232 – 46 – 93 – 36 – 25 – 25 – 49 – 343 – 399
Equity-based compensation of
Novartis equity plans – 582 – 620 – 47 – 53 – 53 – 66 – 164 – 164 – 846 – 903

Novartis Annual Report 2017 | 205FINaNcIal RepORTNotes to the Novartis Group consolidated financial statements
Segmentation – Consolidated balance sheets
Innovative Medicines Sandoz Alcon Corporate Group (including eliminations)
(USD millions) 2017 2016 2017 2016 2017 2016 2017 2016 2017 2016
Total assets 54 075 51 911 18 231 17 611 22 014 22 970 38 759 37 632 133 079 130 124
Total liabilities – 11 457 – 10 007 – 3 459 – 3 168 – 1 893 – 2 520 – 42 043 – 39 538 – 58 852 – 55 233
Total equity 74 227 74 891
Net debt 19 047 16 025
Net operating assets 42 618 41 904 14 772 14 443 20 121 20 450 93 274 90 916
Included in assets and liabilities are:
Total property, plant & equipment 10 857 10 410 2 525 2 374 2 403 2 163 679 694 16 464 15 641
Additions to property,
plant & equipment 1 877 996 326 316 431 396 94 127 1 728 1 835
Total goodwill and intangible assets 31 571 31 630 10 993 10 774 16 176 16 914 3 007 3 002 61 747 62 320
Additions to goodwill and
intangible assets 1 984 865 64 45 82 63 16 5 1 146 978
Total investment in associated
companies 41 16 7 18 15 322 14 270 15 370 14 304
Additions to investment in associated
companies 6 4 40 37 46 41
Cash and cash equivalents,
marketable securities, commodities,
time deposits and derivative
financial instruments 9 485 7 777 9 485 7 777
Financial debts and derivative
financial instruments 28 532 23 802 28 532 23 802
Current income tax and deferred
tax liabilities 6 891 8 260 6 891 8 260
1 Excluding impact of business combinations
The following table shows countries that accounted for more than 5% of at least one of the respective Group totals, as well as regional information for net sales for the years ended December 31, 2017, 2016 and 2015, and for selected non-current assets for the years ended December 31, 2017 and 2016:
Net sales1 Total of selected non-current assets2
(USD millions) 2017 % 2016 % 2015 % 2017 % 2016 %
country
Switzerland 836 2 830 2 774 2 43 920 47 44 413 48
United States 16 935 34 17 117 35 18 079 37 28 476 30 28 484 31
United Kingdom 1 160 2 1 182 2 1 277 3 7 957 9 6 892 7
Germany 3 690 8 3 634 7 3 262 7 3 128 3 2 733 3
France 2 490 5 2 390 5 2 269 5 284 199
Japan 3 177 6 3 267 7 3 163 6 148 145
Other 20 821 43 20 098 42 20 590 40 9 668 11 9 399 11
Group 49 109 100 48 518 100 49 414 100 93 581 100 92 265 100
Region
Europe 17 492 36 17 079 35 16 472 33 61 699 66 59 879 65
Americas 20 899 42 20 998 43 22 414 45 29 113 31 29 831 32
Asia/Africa/Australasia 10 718 22 10 441 22 10 528 22 2 769 3 2 555 3
Group 49 109 100 48 518 100 49 414 100 93 581 100 92 265 100
1 Net sales from operations by location of third-party customer2 Total of property, plant and equipment; goodwill; intangible assets; and investment in associated companies
The Group’s largest, second-largest and third-largest customers account for approximately 17%, 12% and 7% of net sales, respectively (2016: 16%, 12% and 6% respec-tively; 2015: 14%, 11% and 5% respectively). All segments had sales to these customers in 2017, 2016 and 2015. No other customer accounted for 5% or more of net sales in any year.
The highest amounts of trade receivables outstand-ing were for these same three customers and amounted to 14%, 9% and 5%, respectively, of the trade receivables at December 31, 2017 (2016: 14%, 9% and 6% respec-tively).

206 | Novartis Annual Report 2017
Innovative Medicines net sales by business franchise
Change Change
2017 2016 (2016 2015 (2015
USD USD to 2017) USD to 2016)
millions millions USD % millions USD %
Oncology
Gleevec/Glivec 1 943 3 323 – 42 4 658 – 29
Tasigna 1 841 1 739 6 1 632 7
Sandostatin 1 612 1 646 – 2 1 630 1
Afinitor/Votubia 1 525 1 516 1 1 607 – 6
Exjade/Jadenu 1 059 956 11 917 4
Tafinlar + Mekinist 873 672 30 453 nm
Promacta/Revolade 867 635 37 402 nm
Votrient 808 729 11 565 nm
Jakavi 777 581 34 410 42
Kisqali 76 0 nm 0 nm
Other 893 993 – 10 1 030 – 4
Total Oncology
business unit 12 274 12 790 – 4 13 304 – 4
Ophthalmology
Lucentis 1 888 1 835 3 2 060 – 11
Travoprost Group 589 619 – 5 631 – 2
Systane Group 400 377 6 380 – 1
Topical Olopatadine Group 284 335 – 15 457 – 27
Other 2 207 2 297 – 4 2 395 – 4
Total Ophthalmology 5 368 5 463 – 2 5 923 – 8
Immunology and Dermatology
Cosentyx 2 071 1 128 84 261 nm
Neoral/Sandimmun(e) 488 515 – 5 570 – 10
Zortress/Certican 414 398 4 335 19
Ilaris 402 283 42 236 20
Myfortic 378 383 – 1 441 – 13
Other 288 308 – 6 294 5
Total Immunology
and Dermatology 4 041 3 015 34 2 137 41
Neuroscience
Gilenya 3 185 3 109 2 2 776 12
Other 102 124 – 18 141 – 12
Total Neuroscience 3 287 3 233 2 2 917 11
Change Change
2017 2016 (2016 2015 (2015
USD USD to 2017) USD to 2016)
millions millions USD % millions USD %
Respiratory
Ultibro Breezhaler 411 363 13 260 40
Seebri Breezhaler 151 149 1 150 – 1
Onbrez Breezhaler 112 143 – 22 166 – 14
Subtotal cOpD1 portfolio 674 655 3 576 14
Xolair 2 920 835 10 755 11
Other 23 31 – 26 37 – 16
Total Respiratory 1 617 1 521 6 1 368 11
cardio-Metabolic
Entresto 507 170 198 21 nm
Other 17 14 21 0 nm
Total cardio-Metabolic 524 184 185 21 nm
established Medicines
Galvus 1 233 1 193 3 1 140 5
Exforge 960 926 4 1 047 – 12
Diovan/Co-Diovan 957 1 073 – 11 1 284 – 16
Voltaren/Cataflam 465 525 – 11 558 – 6
Exelon/Exelon Patch 381 444 – 14 728 – 39
Ritalin/Focalin 236 282 – 16 365 – 23
Other 1 682 1 913 – 12 2 553 – 25
Total established
Medicines 5 914 6 356 – 7 7 675 – 17
Total pharmaceutical
business unit 20 751 19 772 5 20 041 – 1
Total division
net sales 33 025 32 562 1 33 345 – 2
1 Chronic obstructive pulmonary disease2 Net sales reflect Xolair sales for all indications (e.g., including Xolair SAA and Xolair
CSU, which is managed by the Immunology and Dermatology franchise)
nm = not meaningful
The product portfolio of other segments is widely spread in 2017, 2016 and 2015.

Novartis Annual Report 2017 | 207FINaNcIal RepORTNotes to the Novartis Group consolidated financial statements
4. associated companies Net income statement effect Other comprehensive income effect Total comprehensive income effect
(USD millions) 2017 2016 2015 2017 2016 2015 2017 2016 2015
Roche Holding AG, Switzerland 456 464 343 108 – 39 – 149 564 425 194
GlaxoSmithKline Consumer
Healthcare Holdings Ltd., UK 629 234 – 79 – 145 710 – 4 484 944 – 83
Others 23 5 2 23 5 2
associated companies
related to continuing operations 1 108 703 266 – 37 671 – 153 1 071 1 374 113
Novartis has significant investments in Roche Holding AG, Basel (Roche) and in GlaxoSmithKline Consumer Health-care Holdings Ltd, Brentford, Middlesex, UK as well as certain other smaller investments that are accounted for as associated companies.
Balance sheet value
December 31, December 31,
(USD millions) 2017 2016
Roche Holding AG, Switzerland 8 121 7 644
GlaxoSmithKline Consumer
Healthcare Holdings Ltd., UK 7 020 6 448
Others 229 212
Total 15 370 14 304
Roche Holding AG
The Group’s holding in Roche voting shares was 33.3% at December 31, 2017, 2016 and 2015. This investment represents approximately 6.3% of Roche’s total out-standing voting and non-voting equity instruments at December 31, 2017, 2016 and 2015.
Since full-year 2017 financial data for Roche is not available when Novartis produces its consolidated finan-cial results, a survey of analyst estimates is used to esti-mate the Group’s share of Roche’s net income. Any dif-ferences between these estimates and actual results will be adjusted in the Group’s 2018 consolidated financial statements when available.
The following tables show summarized financial infor-mation for Roche, including current values of fair value adjustments made at the time of the acquisition of the shares, for the year ended December 31, 2016 and for the six months ended June 30, 2017 (since full-year 2017 data is not yet available):
Non-current Current Non-current
(CHF billions) Current assets assets liabilities liabilities
December 31, 2016 28.7 61.4 22.6 27.8
June 30, 2017 26.7 56.9 20.6 26.0
Other Total
comprehen- comprehen-
(CHF billions) Revenue Net income sive income sive income
December 31, 2016 50.6 7.5 0.7 8.2
June 30, 2017 26.3 4.4 0.2 4.6
A purchase price allocation was performed on the basis of publicly available information at the time of acquisition of the investment. The December 31, 2017 balance sheet value allocation is as follows:
December 31,
(USD millions) 2017
Novartis share of Roche’s estimated net assets 2 412
Novartis share of re-appraised intangible assets 673
Implicit Novartis goodwill 2 915
current value of share in net identifiable assets
and goodwill 6 000
Accumulated equity accounting
adjustments and translation
effects less dividends received 2 121
Balance sheet value 8 121
The identified intangible assets principally relate to the value of currently marketed products and are amortized on a straight-line basis over their estimated average use-ful life of 20 years.
In 2017, dividends received from Roche in relation to the distribution of its 2016 net income amounted to USD 438 million (2016: USD 433 million in relation to the distribution of its 2015 net income).
The consolidated income statement effects from applying Novartis accounting principles for this invest-ment in 2017, 2016 and 2015 are as follows:
(USD millions) 2017 2016 2015
Novartis share of Roche’s
estimated current-year
consolidated net income 669 678 650
Prior-year adjustment – 67 – 68 – 157
Amortization of fair value
adjustments relating to
intangible assets, net of taxes
of USD 42 million (2016: USD 42
million; 2015: USD 41 million) – 146 – 146 – 150
Net income effect 456 464 343
The publicly quoted market value of the Novartis inter-est in Roche (SIX symbol: RO) at December 31, 2017, was USD 13.4 billion (2016: USD 12.4 billion).

208 | Novartis Annual Report 2017
GlaxoSmithKline Consumer Healthcare Holdings Ltd.On March 2, 2015, Novartis closed its transactions with GlaxoSmithKline plc, Great Britain (GSK) announced in April 2014. As part of these transactions, Novartis and GSK agreed to create a combined consumer healthcare business through a combination between Novartis OTC and GSK Consumer Healthcare. On March 2, 2015, a new entity GlaxoSmithKline Consumer Healthcare Hold-ings Ltd (GSK Consumer Healthcare) was formed via the contribution of businesses from both Novartis and GSK.
At December 31, 2017, 2016 and 2015, Novartis has a 36.5% interest in GSK Consumer Healthcare and four of eleven seats on the GSK Consumer Healthcare board of directors. Furthermore, Novartis has customary minority rights and also exit rights at a pre-defined, mar-ket-based pricing mechanism.
The December 31, 2017 balance sheet value alloca-tion is as follows:
December 31,
(USD millions) 2017
Novartis share of GSK Consumer Healthcare’s
estimated net assets 1 505
Novartis share of re-appraised intangible assets 3 852
Implicit Novartis goodwill 1 763
current value of share in net identifiable assets
and goodwill 7 120
Accumulated equity accounting
adjustments and translation
effects less dividends received – 100
Balance sheet value 7 020
The identified intangible assets principally relate to the value of the indefinite life GSK Consumer Healthcare intangible assets. The identified intangible assets with a definite life are amortized on a straight-line basis over their estimated average useful life of 20 years.
At acquisition date, Novartis has valued the contribu-tion of 63.5% of its OTC Division in exchange for 36.5% of the GSK Consumer Healthcare business at fair value. The retained interest in the OTC Division business con-tributed was accounted for at net book value at the time of contribution.
The following tables show summarized financial infor-mation for GSK Consumer Healthcare, including current values of fair value adjustments made at the time of acquisition, for the year ended December 31, 2016, and for the nine months ended September 30, 2017 (interim unaudited), since full-year 2017 data is not yet available:
Non-current Current Non-current
(GBP billions) Current assets assets liabilities liabilities
December 31, 2016 4.0 21.1 3.1 2.1
September 30, 2017 3.3 20.6 2.6 2.0
Other Total
comprehen- comprehen-
(GBP billions) Revenue Net income sive income sive income
December 31, 2016 6.5 0.6 1.6 2.2
September 30, 2017 5.3 0.6 – 0.4 0.2
Since full-year 2017 financial data for GSK Consumer Healthcare is not available when Novartis produces its consolidated financial results, a projection of the latest internal management reporting is used to estimate the Group’s share of GSK Consumer Healthcare’s net result for the year. Any differences between this estimate and actual results will be adjusted in the Group’s 2018 con-solidated financial statements when available.
In 2017, dividends received from GSK Consumer Healthcare amounted to USD 544 million (2016: USD 463 million).
The consolidated income statement effects from applying Novartis accounting principles for this invest-ment in 2017, 2016 and 2015 are as follows:
(USD millions) 2017 2016 2015
Novartis share of
GSK Consumer Healthcare’s
estimated current-year
consolidated net income 589 268 – 17
Prior-year adjustment 47 – 22
Amortization of fair value
adjustments relating to
intangible assets and inventory,
net of taxes of USD 1 million
(2016: USD 2 million;
2015: USD 18 million) – 7 – 12 – 62
Net income effect 629 234 – 79

Novartis Annual Report 2017 | 209FINaNcIal RepORTNotes to the Novartis Group consolidated financial statements
5. Interest expense and other financial income and expenseInterest expense
(USD millions) 2017 2016 2015
Interest expense – 758 – 709 – 669
(Expense)/ income arising from
discounting long-term liabilities – 19 2 14
Total interest expense – 777 – 707 – 655
Other financial income and expense
(USD millions) 2017 2016 2015
Interest income 110 43 33
Dividend income 1 1 1
Net capital losses on
available-for-sale securities – 1 – 1 – 8
Income on forward contracts
and options 1
Impairment of commodities
and available-for-sale securities, net 12 7 – 132
Other financial expense – 25 – 20 – 23
Monetary loss from hyperinflation
accounting – 72
Currency result, net – 58 – 477 – 254
Total other financial income
and expense 39 – 447 – 454
6. Taxes
Income before taxes
(USD millions) 2017 2016 2015
Switzerland 5 289 3 110 5 765
Foreign 3 710 4 707 2 369
Income before taxes
from continuing operations 8 999 7 817 8 134
Income before taxes
from discontinued operations 12 479
Total income before taxes 8 999 7 817 20 613
Current and deferred income tax expense
(USD millions) 2017 2016 2015
Switzerland – 462 – 709 – 317
Foreign – 1 594 – 1 418 – 1 333
current income tax expense
from continuing operations – 2 056 – 2 127 – 1 650
Switzerland – 298 765 – 68
Foreign 1 058 243 612
Deferred tax income
from continuing operations 760 1 008 544
Income tax expense
from continuing operations – 1 296 – 1 119 – 1 106
Income tax expense
from discontinued operations – 1 713
Total income tax expense – 1 296 – 1 119 – 2 819
Analysis of tax rateThe main elements contributing to the difference between the Group’s overall applicable tax rate (which can change each year since it is calculated as the weighted average tax rate based on pre-tax income of each subsidiary) and the effective tax rate are:
(As a percentage) 2017 2016 2015
Applicable tax rate 14.5 13.2 12.4
Effect of disallowed expenditures 3.4 3.5 3.5
Effect of utilization of tax losses
brought forward from prior periods – 0.1 – 0.2 – 0.2
Effect of income taxed at reduced rates – 0.2 – 0.2 – 0.3
Effect of tax credits and allowances – 2.2 – 2.8 – 2.7
Effect of release of
contingent consideration liability – 1.2 0.0 0.0
Effect of tax rate change
on current and deferred
tax assets and liabilities 1 0.7 0.2 – 0.5
Effect of write-off of deferred tax assets 0.0 0.5 0.0
Effect of write down and reversal of
write-down of investments in subsidiaries – 1.1 – 1.0 – 0.9
Effect of tax benefits expiring in 2017 – 0.8 – 0.5 – 0.4
Effect of non-deductible losses in Venezuela 0.0 1.3 1.2
Effect of prior year items 1.2 0.2 1.0
Effect of other items 2 0.2 0.1 0.5
effective tax rate for continuing operations 14.4 14.3 13.6
Effective tax rate for discontinued operations 13.7
effective tax rate 14.4 14.3 13.7
1 Included in 2017 is a 0.7% impact related to the revaluation of the deferred tax assets and liabities and a portion of current tax payables. This revaluation resulted from the US tax reform legislation enacted on December 22, 2017, refer to Note 11 for additional disclosures.
2 Other items in 2016 (+0.1%) include one-time impacts for the deferred tax effects on the net assets of certain subsidiaries resulting from the change in their tax status (-6.2%), the changes in uncertain tax positions (+5.1%) and other items (+1.2%).
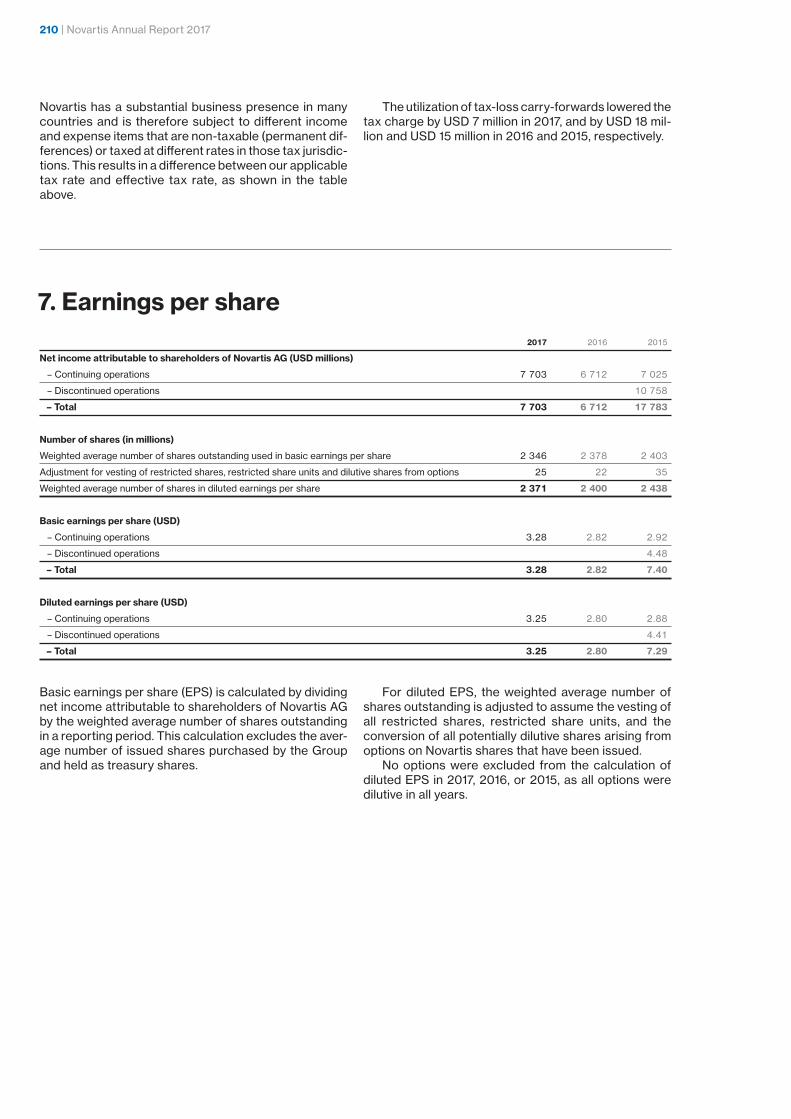
210 | Novartis Annual Report 2017
Novartis has a substantial business presence in many countries and is therefore subject to different income and expense items that are non-taxable (permanent dif-ferences) or taxed at different rates in those tax jurisdic-tions. This results in a difference between our applicable tax rate and effective tax rate, as shown in the table above.
The utilization of tax-loss carry-forwards lowered the tax charge by USD 7 million in 2017, and by USD 18 mil-lion and USD 15 million in 2016 and 2015, respectively.
7. earnings per share 2017 2016 2015
Net income attributable to shareholders of Novartis aG (USD millions)
– Continuing operations 7 703 6 712 7 025
– Discontinued operations 10 758
– Total 7 703 6 712 17 783
Number of shares (in millions)
Weighted average number of shares outstanding used in basic earnings per share 2 346 2 378 2 403
Adjustment for vesting of restricted shares, restricted share units and dilutive shares from options 25 22 35
Weighted average number of shares in diluted earnings per share 2 371 2 400 2 438
Basic earnings per share (USD)
– Continuing operations 3.28 2.82 2.92
– Discontinued operations 4.48
– Total 3.28 2.82 7.40
Diluted earnings per share (USD)
– Continuing operations 3.25 2.80 2.88
– Discontinued operations 4.41
– Total 3.25 2.80 7.29
Basic earnings per share (EPS) is calculated by dividing net income attributable to shareholders of Novartis AG by the weighted average number of shares outstanding in a reporting period. This calculation excludes the aver-age number of issued shares purchased by the Group and held as treasury shares.
For diluted EPS, the weighted average number of shares outstanding is adjusted to assume the vesting of all restricted shares, restricted share units, and the conversion of all potentially dilutive shares arising from options on Novartis shares that have been issued.
No options were excluded from the calculation of diluted EPS in 2017, 2016, or 2015, as all options were dilutive in all years.

Novartis Annual Report 2017 | 211FINaNcIal RepORTNotes to the Novartis Group consolidated financial statements
8. changes in consolidated statements of comprehensive incomeThe consolidated statements of comprehensive income include the Group’s net income for the year as well as all other valuation adjustments recorded in the Group’s con-solidated balance sheet but which under IFRS are not recorded in the consolidated income statement. These
include fair value adjustments to financial instruments, actuarial gains or losses on defined benefit pension and other post-employment plans and currency translation effects, net of tax.
The following table summarizes these value adjustments and currency translation effects attributable to Novartis shareholders:
Fair value Fair value Actuarial Cumulative
adjustments adjustments on gains/(losses) Net currency
on marketable deferred cash from defined investment translation Total value
(USD millions) securities flow hedges benefit plans hedge effects adjustments
Value adjustments at January 1, 2015 433 – 38 – 5 366 2 406 – 2 565
Fair value adjustments on financial instruments 28 20 48
Net actuarial losses from defined benefit plans 1 – 147 – 147
Currency translation effects 2 – 1 659 – 1 659
Total value adjustments in 2015 28 20 – 147 – 1 659 – 1 758
Fair value adjustments related to divestments 100 100
Value adjustments at December 31, 2015 461 – 18 – 5 413 747 – 4 223
Fair value adjustments on financial instruments – 113 15 – 98
Net actuarial losses from defined benefit plans – 514 – 514
Currency translation effects – 2 389 – 2 389
Total value adjustments in 2016 – 113 15 – 514 – 2 389 – 3 001
Fair value adjustments related to divestments 12 12
Value adjustments at December 31, 2016 348 – 3 – 5 915 – 1 642 – 7 212
Fair value adjustments on financial instruments 38 12 50
Net investment hedge – 237 – 237
Net actuarial gains from defined benefit plans 851 851
Currency translation effects 2 208 2 208
Total value adjustments in 2017 38 12 851 – 237 2 208 2 872
Value adjustments at December 31, 2017 386 9 – 5 064 – 237 566 – 4 340
1 Net actuarial gains of USD 10 million in 2015 were attributable to discontinued operations up to the respective divestment dates2 Currency translation losses of USD 29 million in 2015 were attributable to discontinued operations up to the respective divestment dates
8.1) The 2017, 2016 and 2015 changes in the fair value of financial instruments were as follows:
Fair value Fair value
adjustments adjustments on
on marketable deferred cash
(USD millions) securities flow hedges Total
Fair value adjustments at January 1, 2017 348 – 3 345
Changes in fair value:
– Available-for-sale marketable securities 11 11
– Available-for-sale financial investments 47 47
Realized net gains transferred to the consolidated income statement:
– Other financial assets sold – 109 – 109
Amortized net losses on cash flow hedges transferred to the consolidated income statement 13 13
Impaired financial assets transferred to the consolidated income statement 102 102
Deferred tax on above items 1 – 13 – 1 – 14
Fair value adjustments during the year 38 12 50
Fair value adjustments at December 31, 2017 386 9 395
1 Included in 2017 is a USD 18 million impact related to the revaluation of deferred tax liabilities on available-for-sale financial investments held in the US that were previously recognized through other comprehensive income. This revaluation resulted from the US tax reform legislation enacted on December 22, 2017, refer to Note 11 for additional disclosures.

212 | Novartis Annual Report 2017
Fair value Fair value
adjustments adjustments on
on marketable deferred cash
(USD millions) securities flow hedges Total
Fair value adjustments at January 1, 2016 461 – 18 443
Changes in fair value:
– Available-for-sale marketable securities 1 1
– Available-for-sale financial investments – 87 – 87
Realized net gains transferred to the consolidated income statement:
– Marketable securities sold – 1 – 1
– Other financial assets sold – 154 – 154
Amortized net losses on cash flow hedges transferred to the consolidated income statement 16 16
Impaired financial assets transferred to the consolidated income statement 131 131
Deferred tax on above items – 3 – 1 – 4
Fair value adjustments during the year – 113 15 – 98
Fair value adjustments at December 31, 2016 348 – 3 345
Fair value Fair value
adjustments adjustments on
on marketable deferred cash
(USD millions) securities flow hedges Total
Fair value adjustments at January 1, 2015 433 – 38 395
Changes in fair value:
– Available-for-sale marketable securities – 130 – 130
– Available-for-sale financial investments 80 80
– Associated companies’ movements in comprehensive income – 8 – 8
Realized net gains transferred to the consolidated income statement:
– Marketable securities sold – 1 – 1
– Other financial assets sold – 103 – 103
Amortized net losses on cash flow hedges transferred to the consolidated income statement 21 21
Impaired financial assets transferred to the consolidated income statement 194 194
Deferred tax on above items – 4 – 1 – 5
Fair value adjustments during the year 28 20 48
Fair value adjustments at December 31, 2015 461 – 18 443
8.2) In 2015, cumulative currency translation losses of USD 10 million were recycled through the income state-ment as a result of the divestments of subsidiaries. No currency translation losses or gains were recycled through the income statement in 2017 and 2016.
8.3) Remeasurements from defined benefit plans arise as follows:
(USD millions) 2017 2016 2015
Defined benefit pension plans before tax 1 367 – 667 – 252
Other post-employment benefit plans before tax 76 12 168
Taxation on above items 1 – 592 140 – 63
Total after tax 851 – 515 – 147
Attributable to:
Shareholders of Novartis AG 851 – 514 – 147
Non-controlling interests – 1
1 Included in 2017 is a USD -272 million impact related to the revaluation of deferred tax assets on US post-employment benefits that were previously recognized through other comprehensive income. This revaluation resulted from the US tax reform legislation enacted on December 22, 2017, refer to Note 11 for additional disclosures.

Novartis Annual Report 2017 | 213FINaNcIal RepORTNotes to the Novartis Group consolidated financial statements
9. property, plant & equipment
The following table summarizes the movements of property, plant and equipment during 2017:
Machinery
Construction & other
(USD millions) Land Buildings in progress equipment Total
Cost
January 1, 2017 687 13 113 2 680 14 816 31 296
Reclassifications 1 5 508 – 1 617 1 104
Additions 13 104 1 186 425 1 728
Disposals and derecognitions 2 – 23 – 324 – 71 – 593 – 1 011
Currency translation effects 38 663 190 1 106 1 997
December 31, 2017 720 14 064 2 368 16 858 34 010
Accumulated depreciation
January 1, 2017 – 40 – 5 436 – 15 – 10 164 – 15 655
Depreciation charge – 3 – 510 – 1 007 – 1 520
Accumulated depreciation on disposals and derecognitions 2 6 275 34 534 849
Impairment charge – 25 – 58 – 106 – 189
Reversal of impairment charge 2 30 32
Currency translation effects – 3 – 287 – 1 – 772 – 1 063
December 31, 2017 – 40 – 5 983 – 38 – 11 485 – 17 546
Net book value at December 31, 2017 680 8 081 2 330 5 373 16 464
Net book value of property, plant & equipment under finance lease contracts 78
commitments for purchases of property, plant & equipment 318
capitalized borrowing costs 9
1 Reclassifications between various asset categories due to completion of plant and other equipment under construction.2 Derecognition of assets that are no longer used and are not considered to have a significant disposal value or other alternative use.
The following table summarizes the movements of property, plant and equipment during 2016:
Machinery
Construction & other
(USD millions) Land Buildings in progress equipment Total
Cost
January 1, 2016 688 12 857 2 810 15 093 31 448
Reclassifications 1 4 630 – 1 226 592
Additions 24 176 1 226 409 1 835
Disposals and derecognitions 2 – 8 – 178 – 19 – 656 – 861
Currency translation effects – 21 – 372 – 111 – 622 – 1 126
December 31, 2016 687 13 113 2 680 14 816 31 296
Accumulated depreciation
January 1, 2016 – 40 – 5 188 – 7 – 10 231 – 15 466
Depreciation charge – 3 – 530 – 956 – 1 489
Accumulated depreciation on disposals and derecognitions 2 5 157 1 630 793
Impairment charge – 3 – 47 – 11 – 61 – 122
Reversal of impairment charge 6 1 13 20
Currency translation effects 1 166 1 441 609
December 31, 2016 – 40 – 5 436 – 15 – 10 164 – 15 655
Net book value at December 31, 2016 647 7 677 2 665 4 652 15 641
Net book value of property, plant & equipment under finance lease contracts 81
commitments for purchases of property, plant & equipment 223
capitalized borrowing costs 9
1 Reclassifications between various asset categories due to completion of plant and other equipment under construction.2 Derecognition of assets that are no longer used and are not considered to have a significant disposal value or other alternative use.

214 | Novartis Annual Report 2017
10. Goodwill and intangible assets
The following table summarizes the movements of goodwill and intangible assets in 2017:
Goodwill Intangible Assets other than Goodwill
Acquired Currently Other
research & Alcon marketed Marketing intangible
(USD millions) Total development brand name Technologies products know-how assets Total
Cost
January 1, 2017 31 381 5 150 2 980 6 548 33 007 5 960 1 492 55 137
Impact of business combinations 94 1 223 1 223
Reclassifications 1 – 389 175 214
Additions 697 5 282 162 1 146
Disposals and derecognitions 2 – 353 – 1 – 328 – 64 – 746
Currency translation effects 704 134 86 969 48 1 237
December 31, 2017 32 179 6 462 2 980 6 638 34 105 5 960 1 852 57 997
Accumulated amortization
January 1, 2017 – 401 – 886 – 3 637 – 16 863 – 1 430 – 981 – 23 797
Reclassifications 1 6 – 6
Amortization charge – 577 – 2 571 – 238 – 304 – 3 690
Accumulated impairments on disposals
and derecognitions2 352 317 61 730
Impairment charge – 615 – 92 – 2 – 709
Currency translation effects – 28 – 27 – 54 – 416 – 37 – 534
December 31, 2017 – 429 – 1 170 – 4 268 – 19 631 – 1 668 – 1 263 – 28 000
Net book value at December 31, 2017 31 750 5 292 2 980 2 370 14 474 4 292 589 29 997
1 Reclassifications between various asset categories as a result of product launches of acquired In-Process Research & Development and completion of software development.2 Derecognitions of assets that are no longer used or being developed and are not considered to have a significant disposal value or other alternative use.
The following table summarizes the movements of goodwill and intangible assets in 2016:
Goodwill Intangible Assets other than Goodwill
Acquired Currently Other
research & Alcon marketed Marketing intangible
(USD millions) Total development brand name Technologies products know-how assets Total
Cost
January 1, 2016 31 585 4 119 2 980 6 563 33 385 5 960 1 341 54 348
Impact of business combinations 56 690 451 1 141
Reclassifications 1 – 158 6 152
Additions 599 223 156 978
Disposals and derecognitions 2 – 23 – 464 – 130 – 617
Currency translation effects – 260 – 77 – 15 – 594 – 27 – 713
December 31, 2016 31 381 5 150 2 980 6 548 33 007 5 960 1 492 55 137
Accumulated amortization
January 1, 2016 – 411 – 650 – 3 070 – 14 221 – 1 192 – 998 – 20 131
Reclassifications 1 225 – 225
Amortization charge – 576 – 2 926 – 238 – 121 – 3 861
Accumulated impairments on disposals
and derecognitions2 22 390 123 535
Impairment charge – 490 – 96 – 5 – 591
Currency translation effects 10 7 9 215 20 251
December 31, 2016 – 401 – 886 – 3 637 – 16 863 – 1 430 – 981 – 23 797
Net book value at December 31, 2016 30 980 4 264 2 980 2 911 16 144 4 530 511 31 340
1 Reclassifications between various asset categories as a result of product launches of acquired In-Process Research & Development and completion of software development.2 Derecognitions of assets that are no longer used or being developed and are not considered to have a significant disposal value or other alternative use.

Novartis Annual Report 2017 | 215FINaNcIal RepORTNotes to the Novartis Group consolidated financial statements
The following table summarizes the allocation of the net book values of goodwill and intangible assets by report-ing segment at December 31, 2017:
Goodwill Intangible Assets other than Goodwill
Acquired Currently Other
research & Alcon marketed Marketing intangible
(USD millions) Total development brand name Technologies products know-how assets Total
Innovative Medicines 15 237 4 368 9 11 604 353 16 334
Sandoz 8 210 625 539 1 589 30 2 783
Alcon 8 295 291 1 822 1 281 4 292 195 7 881
Corporate 8 8 2 980 11 2 999
Net book value at December 31, 2017 31 750 5 292 2 980 2 370 14 474 4 292 589 29 997
The following table summarizes the allocation of the net book values of goodwill and intangible assets by report-ing segment at December 31, 2016:
Goodwill Intangible Assets other than Goodwill
Acquired Currently Other
research & Alcon marketed Marketing intangible
(USD millions) Total development brand name Technologies products know-how assets Total
Innovative Medicines 15 010 3 512 11 12 821 276 16 620
Sandoz 7 669 613 563 1 904 25 3 105
Alcon 8 293 139 2 337 1 419 4 530 196 8 621
Corporate 8 2 980 14 2 994
Net book value at December 31, 2016 30 980 4 264 2 980 2 911 16 144 4 530 511 31 340
The Innovative Medicines, Sandoz and Alcon Divisions’ cash generating units, to which goodwill are allocated, each comprise a group of smaller cash generating units. The valuation method of the recoverable amount of the cash generating units, to which goodwill is allocated, is based on the fair value less costs of disposal.
The Alcon brand name is a Corporate asset with an indefinite life. The intangible asset is allocated to Corpo-rate as it is used to market the Alcon-branded products of both the Alcon Division and the Ophthalmology busi-ness franchise of the Innovative Medicines Division. Net sales of these products together are the grouping of cash generating units, which is used to determine the recoverable amount. The valuation method is based on the fair value less costs of disposal.
The following assumptions are used in the calcula-tions:
Innovative
(As a percentage) Medicines Sandoz Alcon Corporate
Terminal growth rate 1.5 2.0 3.0 2.6
Discount rate (post-tax) 7.0 7.0 7.0 7.0
The Alcon terminal growth rate assumption of 3% is higher than the expected inflation rate of the medical device industry, and more specifically the ophthalmic sub-segment of the industry. The growth rates are expected to exceed this long-term inflation rate, due to
the impact of the demographic trend of the aging popu-lation to which Alcon’s products are prescribed is grow-ing faster than the general population.
The discount rates for all divisions consider the Group’s weighted average cost of capital, adjusted to approximate the weighted average cost of capital of a comparable market participant.
The fair value less costs of disposal, for all groupings of cash generating units containing goodwill or indefinite life intangible assets, is reviewed for the impact of rea-sonably possible changes in key assumptions. In partic-ular, we considered an increase in the discount rate, a decrease in the terminal growth rate and certain nega-tive impacts on the forecasted cash flows. These rea-sonably possible changes in key assumptions did not indicate an impairment.
Note 1, Significant accounting policies – Impairment of goodwill and intangible assets, provides additional dis-closures on how the Group performs goodwill and intan-gible asset impairment testing.
The following table shows the intangible asset impairment charges for 2017 and 2016:
(USD millions) 2017 2016
Innovative Medicines – 591 – 522
Sandoz – 61 – 65
Alcon – 57 – 4
Total – 709 – 591

216 | Novartis Annual Report 2017
11. Deferred tax assets and liabilities
Pensions and
Property, other benefit Tax loss Other assets,
plant & Intangible obligations carry- provisions
(USD millions) equipment assets of associates Inventories forwards and accruals Total
Gross deferred tax assets at January 1, 2017 224 1 331 1 839 4 160 146 2 597 10 297
Gross deferred tax liabilities at January 1, 2017 – 629 – 4 019 – 358 – 511 – 1 403 – 6 920
Net deferred tax balance at January 1, 2017 – 405 – 2 688 1 481 3 649 146 1 194 3 377
at January 1, 2017 – 405 – 2 688 1 481 3 649 146 1 194 3 377
Credited/(charged) to income – 30 1 279 – 90 – 304 – 49 – 46 760
Charged to equity – 101 – 101
Charged to other comprehensive income – 592 – 69 – 661
Impact of business combinations – 322 5 – 317
Other movements – 41 33 37 – 14 – 14 2 3
Net deferred tax balance at December 31, 2017 – 476 – 1 698 836 3 331 88 980 3 061
Gross deferred tax assets at December 31, 2017 137 1 287 1 090 3 786 97 1 983 8 380
Gross deferred tax liabilities at December 31, 2017 – 613 – 2 985 – 254 – 455 – 9 – 1 003 – 5 319
Net deferred tax balance at December 31, 2017 – 476 – 1 698 836 3 331 88 980 3 061
After offsetting the following amount of deferred tax assets and liabilities within the same tax jurisdiction the balance amounts to: 151
Deferred tax assets at December 31, 2017 8 229
Deferred tax liabilities at December 31, 2017 – 5 168
Net deferred tax balance at December 31, 2017 3 061
Gross deferred tax assets at January 1, 2016 216 611 1 730 3 821 62 2 866 9 306
Gross deferred tax liabilities at January 1, 2016 – 639 – 3 962 – 401 – 565 – 5 – 1 132 – 6 704
Net deferred tax balance at January 1, 2016 – 423 – 3 351 1 329 3 256 57 1 734 2 602
At January 1, 2016 – 423 – 3 351 1 329 3 256 57 1 734 2 602
Credited/(charged) to income – 13 1 057 53 373 55 – 517 1 008
Charged to equity – 44 – 44
Credited/(charged) to other comprehensive income 140 – 2 138
Impact of business combinations 4 – 400 23 37 – 336
Other movements 27 6 – 41 20 11 – 14 9
Net deferred tax balance at December 31, 2016 – 405 – 2 688 1 481 3 649 146 1 194 3 377
Gross deferred tax assets at December 31, 2016 224 1 331 1 839 4 160 146 2 597 10 297
Gross deferred tax liabilities at December 31, 2016 – 629 – 4 019 – 358 – 511 – 1 403 – 6 920
Net deferred tax balance at December 31, 2016 – 405 – 2 688 1 481 3 649 146 1 194 3 377
After offsetting the following amount of deferred tax assets and liabilities within the same tax jurisdiction the balance amounts to: 263
Deferred tax assets at December 31, 2016 10 034
Deferred tax liabilities at December 31, 2016 – 6 657
Net deferred tax balance at December 31, 2016 3 377
The following table presents deferred tax assets and deferred tax liabilities, which are expected to have an impact on current taxes payable after more than twelve months:
(USD billions) 2017 2016
Expected to have an impact on current tax
payable after more than 12 months
– Deferred tax assets 3.5 4.8
– Deferred tax liabilities 4.4 5.9
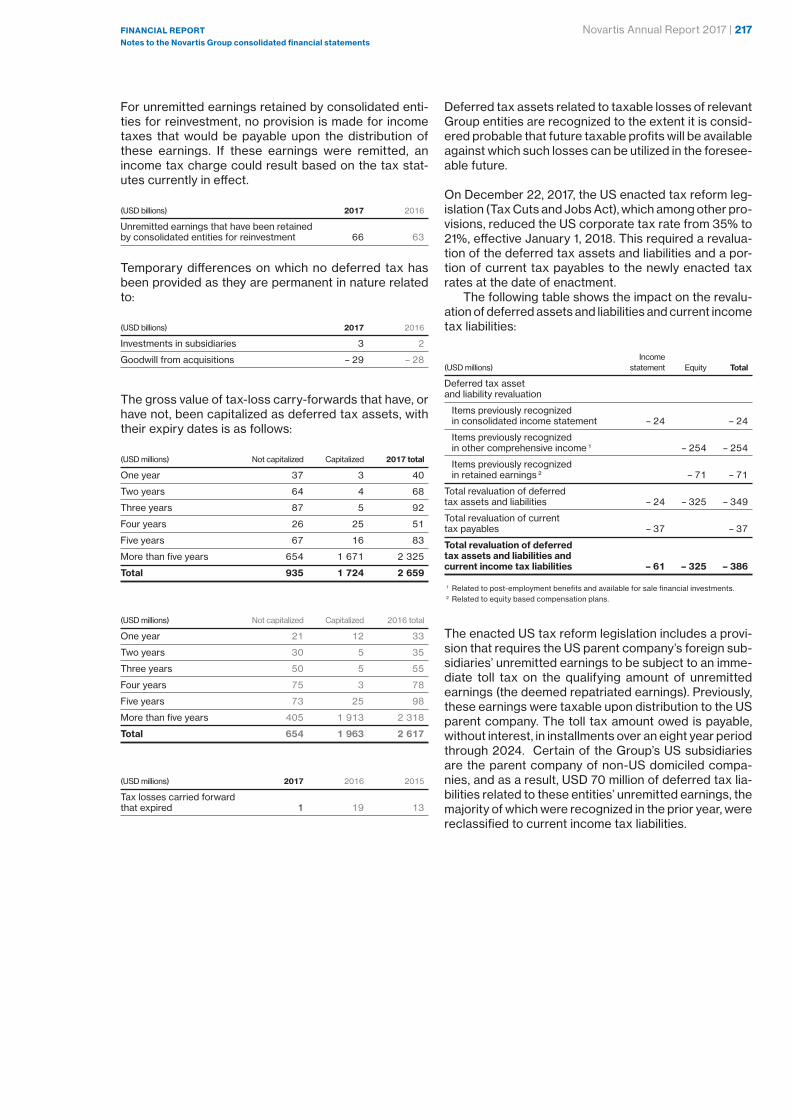
Novartis Annual Report 2017 | 217FINaNcIal RepORTNotes to the Novartis Group consolidated financial statements
For unremitted earnings retained by consolidated enti-ties for reinvestment, no provision is made for income taxes that would be payable upon the distribution of these earnings. If these earnings were remitted, an income tax charge could result based on the tax stat-utes currently in effect.
(USD billions) 2017 2016
Unremitted earnings that have been retained
by consolidated entities for reinvestment 66 63
Temporary differences on which no deferred tax has been provided as they are permanent in nature related to:
(USD billions) 2017 2016
Investments in subsidiaries 3 2
Goodwill from acquisitions – 29 – 28
The gross value of tax-loss carry-forwards that have, or have not, been capitalized as deferred tax assets, with their expiry dates is as follows:
(USD millions) Not capitalized Capitalized 2017 total
One year 37 3 40
Two years 64 4 68
Three years 87 5 92
Four years 26 25 51
Five years 67 16 83
More than five years 654 1 671 2 325
Total 935 1 724 2 659
(USD millions) Not capitalized Capitalized 2016 total
One year 21 12 33
Two years 30 5 35
Three years 50 5 55
Four years 75 3 78
Five years 73 25 98
More than five years 405 1 913 2 318
Total 654 1 963 2 617
(USD millions) 2017 2016 2015
Tax losses carried forward
that expired 1 19 13
Deferred tax assets related to taxable losses of relevant Group entities are recognized to the extent it is consid-ered probable that future taxable profits will be available against which such losses can be utilized in the foresee-able future.
On December 22, 2017, the US enacted tax reform leg-islation (Tax Cuts and Jobs Act), which among other pro-visions, reduced the US corporate tax rate from 35% to 21%, effective January 1, 2018. This required a revalua-tion of the deferred tax assets and liabilities and a por-tion of current tax payables to the newly enacted tax rates at the date of enactment.
The following table shows the impact on the revalu-ation of deferred assets and liabilities and current income tax liabilities:
Income
(USD millions) statement Equity Total
Deferred tax asset
and liability revaluation
Items previously recognized
in consolidated income statement – 24 – 24
Items previously recognized
in other comprehensive income 1 – 254 – 254
Items previously recognized
in retained earnings 2 – 71 – 71
Total revaluation of deferred
tax assets and liabilities – 24 – 325 – 349
Total revaluation of current
tax payables – 37 – 37
Total revaluation of deferred
tax assets and liabilities and
current income tax liabilities – 61 – 325 – 386
1 Related to post-employment benefits and available for sale financial investments.2 Related to equity based compensation plans.
The enacted US tax reform legislation includes a provi-sion that requires the US parent company’s foreign sub-sidiaries’ unremitted earnings to be subject to an imme-diate toll tax on the qualifying amount of unremitted earnings (the deemed repatriated earnings). Previously, these earnings were taxable upon distribution to the US parent company. The toll tax amount owed is payable, without interest, in installments over an eight year period through 2024. Certain of the Group’s US subsidiaries are the parent company of non-US domiciled compa-nies, and as a result, USD 70 million of deferred tax lia-bilities related to these entities’ unremitted earnings, the majority of which were recognized in the prior year, were reclassified to current income tax liabilities.

218 | Novartis Annual Report 2017
12. Financial and other non-current assets
Financial assets
(USD millions) 2017 2016
Available-for-sale long-term
financial investments 1 275 1 096
Long-term receivables from customers 197 231
Minimum lease payments
from finance lease agreements 122 147
Contingent consideration receivables 1 394 586
Long-term loans, advances and security deposits 255 136
Total financial assets 2 243 2 196
1 Note 28 provides additional disclosures related to contingent considerations.
Other non-current assets
(USD millions) 2017 2016
Deferred compensation plans 484 451
Prepaid post-employment benefit plans 133 47
Other non-current assets 201 200
Total other non-current assets 818 698
Minimum finance lease paymentsThe following table shows the receivables of the gross investments in finance leases and the net present value of the minimum lease payments, as well as unearned finance income, related to surgical equipment lease arrange-ments. The finance income is recorded in “Other income”.
2017 2016
Total Unearned Net Total Unearned Net
future finance Present book future finance Present book
(USD millions) payments income value Provision value payments income value Provision value
Not later than one year 1 83 – 7 76 – 3 73 91 – 5 86 – 2 84
Between one and five years 180 – 14 166 – 59 107 182 – 16 166 – 37 129
Later than five years 31 – 2 29 – 14 15 63 – 4 59 – 41 18
Total 294 – 23 271 – 76 195 336 – 25 311 – 80 231
1 The current portion of the minimum lease payments is recorded in trade receivables or other current assets (to the extent not yet invoiced).
13. Inventories(USD millions) 2017 2016
Raw material, consumables 841 705
Work in progress 2 957 2 700
Finished products 3 069 2 850
Total inventories 6 867 6 255
The following table shows the amount of inventory rec-ognized as an expense in “Cost of goods sold” in the consolidated income statements:
(USD billions) 2017 2016 2015
Cost of goods sold – 10.3 – 10.3 – 10.5
The following table shows the recognized amount of inventory provisions and reversals of inventory provisions:
(USD millions) 2017 2016 2015
Inventory provisions – 470 – 283 – 356
Reversals of inventory provisions 189 67 148
The reversals mainly result from the release of products initially requiring additional quality control inspections and from the reassessment of inventory values manu-factured prior to regulatory approval but for which approval was subsequently received.

Novartis Annual Report 2017 | 219FINaNcIal RepORTNotes to the Novartis Group consolidated financial statements
14. Trade receivables
(USD millions) 2017 2016
Total gross trade receivables 8 790 8 364
Provisions for doubtful trade receivables – 190 – 162
Total trade receivables, net 8 600 8 202
The following table summarizes the movement in the provision for doubtful trade receivables:
(USD millions) 2017 2016 2015
January 1 – 162 – 142 – 156
Impact of divestments 12
Provisions for doubtful trade receivables charged to the consolidated income statement – 119 – 76 – 68
Utilization provisions for doubtful trade receivables 12 17 39
Reversal of provisions for doubtful trade receivables 76 37 32
Currency translation effects – 9 2 11
December 31 – 190 – 162 – 142
The following sets forth the trade receivables that are not overdue as specified in the payment terms and con-ditions established with Novartis customers as well as an analysis of overdue amounts and related provisions for doubtful trade receivables:
(USD millions) 2017 2016
Not overdue 7 758 7 386
Past due for not more than one month 279 262
Past due for more than one month
but less than three months 230 223
Past due for more than three months
but less than six months 137 185
Past due for more than six months
but less than one year 137 145
Past due for more than one year 249 163
Provisions for doubtful trade receivables – 190 – 162
Total trade receivables, net 8 600 8 202
Trade receivable balances include sales to drug whole-salers, retailers, private health systems, government agencies, managed care providers, pharmacy benefit managers and government-supported healthcare sys-tems. Novartis continues to monitor sovereign debt issues and economic conditions, particularly in Greece, Italy, Portugal, Spain, Brazil, Russia, Saudi Arabia and Turkey, and evaluates trade receivables in these coun-tries for potential collection risks. The majority of the outstanding trade receivables from these closely moni-tored countries are due directly from local governments or from government-funded entities except for Russia, Brazil and Turkey, which are due from private entities. Deteriorating credit and economic conditions as well as other factors in these closely monitored countries have resulted in, and may continue to result in an increase in the average length of time that it takes to collect these
trade receivables and may require Novartis to re-evalu-ate the collectability of these trade receivables in future periods.
The following table shows the gross trade receiv-ables balance from these closely monitored countries at December 31, 2017 and 2016, the amounts that are past due for more than one year and the related provisions that have been recorded:
(USD millions) 2017 2016
Total balance of gross trade
receivables from closely
monitored countries 1 733 1 717
Past due for more than one year 124 82
Provisions 95 63
At December 31, 2017 amounts past due for more than one year are not significant in any of these countries on a standalone basis.
Total trade receivables include amounts denomi-nated in the following major currencies:
(USD millions) 2017 2016
US dollar (USD) 3 451 3 432
Euro (EUR) 1 533 1 366
Japanese yen (JPY) 600 567
Chinese yuan (CNY) 312 264
Russian ruble (RUB) 268 347
Brazilian real (BRL) 237 222
British pound (GBP) 208 160
Australian dollar (AUD) 165 147
Swiss franc (CHF) 127 135
Canadian dollar (CAD) 73 97
Other currencies 1 626 1 465
Total trade receivables, net 8 600 8 202

220 | Novartis Annual Report 2017
15. Marketable securities, commodities, time deposits, derivative financial instruments and cash and cash equivalentsMarketable securities, commodities, time deposits and derivative financial instruments
(USD millions) 2017 2016
Debt securities 328 306
Fund investments 34 31
Total available-for-sale marketable securities 362 337
Commodities 106 94
Time deposits with original maturity more than 90 days 125 108
Derivative financial instruments 31 230
Accrued interest on debt securities and time deposits 1 1
Total marketable securities, commodities, time deposits and derivative financial instruments 625 770
The following table provides a breakdown of debt securities by currency:
(USD millions) 2017 2016
US dollar (USD) 303 284
Euro (EUR) 14 12
Japanese yen (JPY) 11 10
Total debt securities 328 306
Cash and cash equivalents
(USD millions) 2017 2016
Current accounts 2 970 1 912
Time deposits and short-term investments with original maturity less than 90 days 5 890 5 095
Total cash and cash equivalents 8 860 7 007
16. Other current assets(USD millions) 2017 2016
VAT receivable 717 521
Withholding tax recoverable 93 282
Prepaid expenses
– Third parties 753 692
– Associated companies 3 5
Receivables from associated companies 8 7
Contingent consideration receivable 1 450
Other receivables and current assets 1 030 1 034
Total other current assets 3 054 2 541
1 Note 28 provides additional disclosures related to contingent consideration.

Novartis Annual Report 2017 | 221FINaNcIal RepORTNotes to the Novartis Group consolidated financial statements
17. equity
The following table shows the movement in the share capital:
Movement Movement Movement
(USD millions) Jan 1, 2015 in year Dec 31, 2015 in year Dec 31, 2016 in year Dec 31, 2017
Share capital 1 001 – 10 991 – 19 972 – 3 969
Treasury shares – 103 2 – 101 25 – 76 – 24 – 100
Outstanding share capital 898 – 8 890 6 896 – 27 869
The following table shows the movement in the shares:
2017 2016 2015
Total Total Total Total Total Total Total Total Total
Number of outstanding shares Novartis treasury outstanding Novartis treasury outstanding Novartis treasury outstanding
(in millions) Note shares shares shares shares shares shares shares shares shares
Balance at beginning of year 2 627.1 – 253.0 2 374.1 2 677.0 – 303.1 2 373.9 2 706.2 – 307.6 2 398.6
Shares canceled for capital
reduction 1 – 10.3 10.3 – 49.9 49.9 – 29.2 29.2
Shares acquired to be held in
Group Treasury 2 – 9.6 – 9.6
Shares acquired to be
canceled 3 – 66.2 – 66.2 – 10.3 – 10.3 – 49.9 – 49.9
Other share purchases 4 – 3.8 – 3.8 – 2.6 – 2.6 – 4.1 – 4.1
Exercise of options
and employee transactions 5 17.6 4.6 4.6 4.1 4.1 27.0 27.0
Equity-based compensation 5 8.8 8.8 9.0 9.0 11.9 11.9
Total movements – 10.3 – 46.3 – 56.6 – 49.9 50.1 0.2 – 29.2 4.5 – 24.7
Balance at end of year 2 616.8 – 299.3 2 317.5 2 627.1 – 253.0 2 374.1 2 677.0 – 303.1 2 373.9
1 Novartis reduced its share capital by cancelling shares which were repurchased on the SIX Swiss Exchange second trading line during previous years.2 Shares repurchased on the SIX Swiss Exchange first trading line3 For 2017 and 2016, shares repurchased on the SIX Swiss Exchange second trading line under the CHF 10 billion share buyback authority approved at the 2016 Annual General
Meeting (AGM). For 2015, shares repurchased on the SIX Swiss Exchange second trading line under the CHF 10 billion share buyback authority approved at the 2008 Annual General Meeting (AGM).
4 Shares acquired from employees, which were previously granted to them under the respective programs5 Shares delivered as a result of options being exercised and physical share deliveries related to equity-based participation plans
17.1) The amount available for distribution as a dividend to shareholders is based on the available distributable retained earnings of Novartis AG determined in accor-dance with the legal provisions of the Swiss Code of Obligations.
2017 2016 2015
Dividend per share (in CHF) 2.75 2.70 2.60
Total dividend payment
(in USD billion) 6.5 6.5 6.6

222 | Novartis Annual Report 2017
17.2) The following table summarizes the treasury shares movements:
2017 2016 2015
Number of Number of Number of
outstanding outstanding outstanding
shares Equity impact shares Equity impact shares Equity impact
Note (in millions) USDm (in millions) USDm (in millions) USDm
Shares acquired to be held in Group Treasury 1 – 9.6 – 897
Shares acquired to be canceled 2 – 66.2 – 5 270 – 10.3 – 784 – 49.9 – 4 805
Other share purchases 3 – 3.8 – 304 – 2.6 – 208 – 4.1 – 417
Purchase of treasury shares – 70.0 – 5 574 – 12.9 – 992 – 63.6 – 6 119
Exercise of options and employee transactions 4 17.6 4.6 255 4.1 214 27.0 1 592
Equity-based compensation 5, 6 8.8 612 9.0 664 11.9 815
Total – 56.6 – 4 707 0.2 – 114 – 24.7 – 3 712
1 Shares repurchased on the SIX Swiss Exchange first trading line2 For 2017 and 2016, shares repurchased on the SIX Swiss Exchange second trading line under the CHF 10 billion share buyback authority approved at the 2016 Annual General
Meeting (AGM). For 2015, shares repurchased on the SIX Swiss Exchange second trading line under the CHF 10 billion share buyback authority approved at the 2008 Annual General Meeting (AGM).
3 Shares acquired from employees, which were previously granted to them under the respective programs4 Shares delivered as a result of options being exercised related to equity-based participation plans and the delivery of treasury shares. The average share price of the shares
delivered was significantly below market price reflecting the strike price of the options exercised.5 Equity-settled share-based compensation is expensed in the consolidated income statement in accordance with the vesting period of the share-based compensation plans. The
value for the shares and options granted is credited to consolidated equity over the respective vesting period. In addition, tax benefits arising from tax deductible amounts exceeding the expense recognized in the income statement are credited to equity.
6 Included in 2017 is a USD 71 million impact related to the revaluation of deferred tax assets on equity based compensation that were previously recognized through retained earnings. This revaluation resulted from the US tax reform legislation enacted on December 22, 2017, refer to Note 11 for additional disclosures.
17.3) Changes in non-controlling interests represent the impact on the non-controlling interest of transactions with minority shareholders such as change in ownership percentage, dividend payments, and other equity trans-actions.
17.4) In 2017, Novartis entered into an irrevocable, non-dis-cretionary arrangement with a bank to repurchase Novartis shares on the second trading line under its up-to USD 5 billion share buyback, as well as to mitigate dilu-tion from equity-based participation plans. The commit-ment under this arrangement is the expected purchases by the bank under such trading plan over a rolling 90-day period. As of December 31, 2017, this trading plan com-mitment was fully executed and expired, and as a con-sequence, there is no contingent liability related to this plan recognized.
In 2014, Novartis entered into a similar irrevocable, non-discretionary arrangement with a bank to repur-chase Novartis shares. The commitment under this
arrangement reflected the expected purchases by the bank under such trading plan over a rolling 90-day period. In 2015, this trading plan was fully executed and expired, resulting in a decrease of USD 658 million in the repurchase obligation. As a consequence, there is no contingent liability related to this plan as of December 31, 2015 and December 31, 2016.
17.5) The impact of change in ownership of consolidated entities represents the excess of the amount paid to non-controlling interest over their carrying value and equity allocation to non-controlling interest due to change in ownership percentage.
17.6) At December 31, 2017, the market maker held 12 mil-lion written call options, originally issued as part of the share-based compensation for associates that have not yet been exercised. The weighted average exercise price of these options is USD 62.17 and they have contractual lives of 10 years, with remaining lives up to six years.

Novartis Annual Report 2017 | 223FINaNcIal RepORTNotes to the Novartis Group consolidated financial statements
18. Non-current financial debt
(USD millions) 2017 2016
Straight bonds 22 957 17 285
Liabilities to banks and other financial institutions 1 539 708
Finance lease obligations 87 82
Total, including current portion of non-current financial debt 23 583 18 075
Less current portion of non-current financial debt – 359 – 178
Total non-current financial debts 23 224 17 897
1 Average interest rate 0.3% (2016: 0.4%)
Financial debts, including current financial debts, con-tain only general default covenants. The Group is in com-pliance with these covenants.
The percentage of fixed-rate financial debt to total financial debt was 82% at December 31, 2017, and 76% at December 31, 2016.
The average interest rate on total financial debt in 2017 was 2.6% (2016: 2.8%).
The following table provides a breakdown of straight bonds:
2017 2016
Nominal Issuance Maturity (USD (USD
Coupon Currency amount year year Issuer Issue price millions) millions)
5.125% USD 3 000 2009 2019 Novartis Securities Investment Ltd., Hamilton, Bermuda 99.822% 2 997 2 995
4.400% USD 1 000 2010 2020 Novartis Capital Corporation, New York, United States 99.237% 997 996
2.400% USD 1 500 2012 2022 Novartis Capital Corporation, New York, United States 99.225% 1 491 1 490
3.700% USD 500 2012 2042 Novartis Capital Corporation, New York, United States 98.325% 489 489
3.400% USD 2 150 2014 2024 Novartis Capital Corporation, New York, United States 99.287% 2 134 2 132
4.400% USD 1 850 2014 2044 Novartis Capital Corporation, New York, United States 99.196% 1 824 1 823
0.750% EUR 600 2014 2021 Novartis Finance S.A., Luxembourg, Luxembourg 99.134% 713 625
1.625% EUR 600 2014 2026 Novartis Finance S.A., Luxembourg, Luxembourg 99.697% 714 627
0.250% CHF 500 2015 2025 Novartis AG, Basel, Switzerland 100.640% 513 491
0.625% CHF 550 2015 2029 Novartis AG, Basel, Switzerland 100.502% 564 539
1.050% CHF 325 2015 2035 Novartis AG, Basel, Switzerland 100.479% 333 318
3.000% USD 1 750 2015 2025 Novartis Capital Corporation, New York, United States 99.010% 1 730 1 728
4.000% USD 1 250 2015 2045 Novartis Capital Corporation, New York, United States 98.029% 1 218 1 217
0.125% EUR 1 250 2016 2023 Novartis Finance S.A., Luxembourg, Luxembourg 99.127% 1 480 1 299
0.625% EUR 500 2016 2028 Novartis Finance S.A., Luxembourg, Luxembourg 98.480% 588 516
1.800% USD 1 000 2017 2020 Novartis Capital Corporation, New York, United States 99.609% 996
2.400% USD 1 000 2017 2022 Novartis Capital Corporation, New York, United States 99.449% 993
3.100% USD 1 000 2017 2027 Novartis Capital Corporation, New York, United States 99.109% 988
0.000% EUR 1 250 2017 2021 Novartis Finance S.A., Luxembourg, Luxembourg 99.133% 1 480
1.125% EUR 600 2017 2027 Novartis Finance S.A., Luxembourg, Luxembourg 99.874% 715
Total straight bonds 22 957 17 285
The following tables provide a breakdown of total non-current financial debt, including current portion by maturity and currency:
Breakdown by maturity:
(USD millions) 2017 2016
2017 178
2018 359 345
2019 3 173 3 168
2020 1 997 1 000
2021 2 194 628
2022 2 485 2 442
After 2022 13 375 10 314
Total 23 583 18 075
Breakdown by currency:
(USD millions) 2017 2016
US dollar (USD) 15 945 12 952
Euro (EUR) 5 695 3 092
Japanese yen (JPY) 533 683
Swiss franc (CHF) 1 410 1 348
Total 23 583 18 075

224 | Novartis Annual Report 2017
The following table shows the comparison of balance sheet and fair value of total non-current financial debt, including current portion:
2017 2017 2016 2016
(USD millions) Balance sheet Fair values Balance sheet Fair values
Straight bonds 22 957 23 835 17 285 17 943
Others 626 626 790 790
Total 23 583 24 461 18 075 18 733
The fair values of straight bonds are determined by quoted market prices. Other financial debts are recorded at notional amounts which are a reasonable approxima-tion of the fair values.
The following table shows the pledged assets:
(USD millions) 2017 2016
Total net book value of property,
plant & equipment pledged as
collateral for non-current financial debts 84 94
19. provisions and other non-current liabilities(USD millions) 2017 2016
Accrued liability for employee benefits:
Defined benefit pension plans 1 3 157 4 490
Other long-term employee benefits and deferred compensation 625 545
Other post-employment benefits 1 953 1 005
Environmental remediation provisions 706 708
Provisions for product liabilities, governmental investigations and other legal matters 230 264
Contingent consideration 2 809 840
Other non-current liabilities 577 618
Total provisions and other non-current liabilities 7 057 8 470
1 Note 24 provides additional disclosures related to post-employment benefits.2 Note 28 provides additional disclosures related to contingent consideration.
Novartis believes that its total provisions are adequate based upon currently available information. However, given the inherent difficulties in estimating liabilities in this area, Novartis may incur additional costs beyond the amounts provided. Management believes that such addi-tional amounts, if any, would not be material to the Group’s financial condition but could be material to the results of operations or cash flows in a given period.
Environmental remediation provisionsThe following table shows the movements in the envi-ronmental liability provisions:
(USD millions) 2017 2016 2015
January 1 773 871 923
Cash payments – 46 – 75 – 52
Releases – 153 – 5
Additions 154 1 6
Currency translation effects 33 – 24 – 1
December 31 761 773 871
Less current provision – 55 – 65 – 80
Non-current environmental
remediation provisions
at December 31 706 708 791

Novartis Annual Report 2017 | 225FINaNcIal RepORTNotes to the Novartis Group consolidated financial statements
The material components of the environmental remedi-ation provisions consist of costs to sufficiently clean and refurbish contaminated sites to the extent necessary, and to treat, and where necessary, continue surveillance at sites where the environmental remediation exposure is less significant.
A substantial portion of the environmental remedia-tion provisions relate to the remediation of Basel regional landfills in the adjacent border areas in Switzerland, Ger-many and France. The provisions are re-assessed on a yearly basis and are adjusted as necessary.
In the United States, Novartis has been named under federal legislation (the Comprehensive Environmental Response, Compensation and Liability Act of 1980, as amended) as a potentially responsible party (PRP) in respect of certain sites. Novartis actively participates in, or monitors, the clean-up activities at the sites in which it is a PRP. The provision takes into consideration the number of other PRPs at each site as well as the iden-tity and financial position of such parties in light of the joint and several nature of the liability.
The expected timing of the related cash outflows as of December 31, 2017, is currently projected as follows:
Expected
(USD millions) cash outflows
Due within two years 164
Due later than two years, but within five years 241
Due later than five years, but within ten years 315
Due after ten years 41
Total environmental remediation liability provisions 761
Provisions for product liabilities, governmental investigations and other legal mattersNovartis has established provisions for certain product liabilities, governmental investigations and other legal matters where a potential cash outflow is probable and Novartis can make a reliable estimate of the amount of the outflow. These provisions represent the Group’s cur-rent best estimate of the total financial effect for the mat-ters described below and for other less significant mat-ters. Potential cash outflows reflected in a provision might be fully or partially off-set by insurance in certain circumstances.
Novartis has not established provisions for potential damage awards for certain additional legal claims against its subsidiaries if Novartis currently believes that a pay-ment is either not probable or cannot be reliably esti-mated. In total, these not-provisioned-for matters include more than 1 000 individual product liability cases and certain other legal matters. Plaintiffs’ alleged claims in these matters, which Novartis does not believe to be entirely remote but which do not fulfill the conditions for the establishment of provisions, currently aggregate to, according to Novartis’ current best belief, approximately USD 1.5 billion. In addition, in some of these matters there are claims for punitive or multiple (treble) damages, civil
penalties and disgorgement of profits that in Novartis’ view are either wholly or partially unspecified or wholly or partially unquantifiable at present; the Group believes that information about these amounts claimed by plain-tiffs generally is not meaningful for purposes of deter-mining a reliable estimate of a loss that is probable or more than remote.
A number of other legal matters are in such early stages or the issues presented are such that the Group has not made any provisions since it cannot currently estimate either a potential outcome or the amount of any potential losses. For these reasons, among others, the Group generally is unable to make a reliable estimate of possible loss with respect to such cases. It is therefore not practicable to provide information about the poten-tial financial impact of those cases.
There might also be cases for which the Group was able to make a reliable estimate of the possible loss or the range of possible loss, but the Group believes that publication of such information on a case-by-case basis would seriously prejudice the Group’s position in ongo-ing legal proceedings or in any related settlement dis-cussions. Accordingly, in such cases, information has been disclosed with respect to the nature of the contin-gency, but no disclosure is provided as to an estimate of the possible loss or range of possible loss.
Note 27 contains additional information on contin-gencies.
Summary of significant legal proceedingsThe following is a summary of significant legal proceed-ings to which Novartis or its subsidiaries are a party or were a party and that concluded in 2017.
Investigations and related litigationsSOUTHeRN DISTRIcT OF NeW YORK (S.D.N.Y.) MaRKeTING pRacTIceS INVeSTIGaTION aND lITIGaTION
In 2013, the US government filed a civil complaint in inter-vention to an individual qui tam action against Novartis Pharmaceuticals Corporation (NPC) in the United States District Court (USDC) for the S.D.N.Y. The complaint, as subsequently amended, asserts federal False Claims Act (FCA) and common law claims with respect to speaker programs and other promotional activities for certain NPC cardiovascular medications (Lotrel, Starlix and Valturna) allegedly serving as mechanisms to provide kickbacks to healthcare professionals (HCPs). It seeks damages, which according to the complaint are “sub-stantial”, including treble damages and maximum civil penalties per claim, as well as disgorgement of Novartis profits from the alleged unlawful conduct. Also in 2013, New York State filed a civil complaint in intervention asserting similar claims. Neither government complaint in intervention adopted the individual relator’s claims with respect to off-label promotion of Valturna, which were subsequently dismissed with prejudice by the court. The individual relator continues to litigate the kickback claims on behalf of other states and municipalities. NPC vigor-

226 | Novartis Annual Report 2017
ously contests the S.D.N.Y., New York State and individ-ual claims, both as to alleged liability and amount of dam-ages and penalties.
S.D.N.Y. / WeSTeRN DISTRIcT OF NeW YORK HealTHcaRe FRaUD INVeSTIGaTION
In 2011, Alcon Laboratories, Inc. (ALI) received a sub-poena from the United States Department of Health & Human Services relating to an investigation into allega-tions of healthcare fraud. The subpoena requests the production of documents relating to marketing practices, including the remuneration of healthcare providers, in connection with certain ALI products (Vigamox, Nevanac, Omnipred, Econopred; surgical equipment). ALI is coop-erating with this investigation.
S.D.N.Y. GILENYA MaRKeTING pRacTIceS INVeSTIGaTIONIn 2013, NPC received a civil investigative demand from the United States Attorney’s Office (USAO) for the S.D.N.Y. requesting the production of documents and information relating to marketing practices for Gilenya, including the remuneration of healthcare providers in connection therewith. In 2017, S.D.N.Y. and New York State declined to intervene in claims raised by an indi-vidual relator, which continue to be vigorously contested.
GOVeRNMeNT GeNeRIc pRIcING aNTITRUST INVeSTIGaTIONS, aNTITRUST claSS acTIONS
In 2016 and 2017, Sandoz Inc. received subpoenas and interrogatories from the Antitrust Division of the US Department of Justice (DoJ) and from the Attorney Gen-eral of the State of Connecticut requesting documents related to the marketing and pricing of generic pharma-ceutical products sold by Sandoz Inc. and its subsidiar-ies, including Fougera Pharmaceuticals, Inc. (Fougera), and related communications with competitors. Sandoz Inc. is cooperating with these investigations, which it believes to be part of a broader inquiry into industry prac-tice.
Since the third quarter of 2016, Sandoz Inc. and Foug-era have been sued alongside other generic pharmaceu-tical companies in more than 20 consolidated complaints by proposed classes of direct and indirect purchasers, and Attorneys General for 45 states, the District of Columbia and Puerto Rico have sought leave to file a complaint, alleging that defendants, including Sandoz, engaged in anti-competitive conduct with regard to the sales of various generic drugs and asserting violations of federal and state antitrust laws as well as consumer protection laws. Lek Pharmaceuticals d.d., Novartis AG and Novartis International AG were dismissed from the proceedings. The cases have been consolidated for pre-trial purposes in the USDC for the Eastern District of Pennsylvania (E.D. Pa.) and the claims are being vigor-ously contested.
DISTRIcT OF MaSSacHUSeTTS (D. MaSS.) cHaRITaBle FOUNDaTION INVeSTIGaTION
In 2016 and 2017, NPC received subpoenas from the USAO for the D. Mass. requesting documents related to NPC’s support of 501(c)(3) organizations that provide co-payment assistance to Medicare patients who are prescribed Novartis medicines, including the respective accounting and tax treatment, as well as related to pric-
ing strategies for Gleevec, Tasigna, Zometa, and Gilenya. The requests are focused on potential violations of fed-eral health care offenses, including the Anti-Kickback Statute, and FCA. NPC is cooperating with this investi-gation, which it believes to be part of a broader inquiry into industry practices.
aSIa/RUSSIa INVeSTIGaTIONIn 2017, Novartis Group companies, as well as present and former senior executives of Alcon, received docu-ment requests and subpoenas from the DoJ and the US Securities and Exchange Commission (SEC) requesting information concerning Alcon’s business practices in Asia and Russia and related accounting treatment, both before and after Alcon became part of the Novartis Group. Novartis is cooperating with this investigation.
LUCENTIS/aVaSTIN® MaTTeRSIn connection with an investigation into whether Novartis Farma S.p.A., Novartis AG, F. Hoffmann-La Roche AG, Genentech Inc. and Roche S.p.A. colluded to artificially preserve the market positions of Avastin® and Lucentis, in 2014 the Italian Competition Authority imposed a fine equivalent to USD 125 million on Novartis AG and Novartis Farma S.p.A. Novartis paid the fine, subject to the right to later claim recoupment, and is appealing before the Consiglio di Stato. In 2014 and 2015, the Italian Ministry of Health and the Lombardia region sent letters with pay-ment requests for a total equivalent of approximately USD 1.5 billion in damages from Novartis and Roche enti-ties based on the above allegations. In 2014, the French Competition Authority opened an investigation against Novartis Groupe France with respect to the French mar-ket for anti-vascular endothelial growth factor (VEGF) products indicated for the treatment of wet age-related macular degeneration (AMD). Novartis continues to vig-orously contest all claims in Italy and France. Also, Novartis is challenging policies and regulations allowing off-label/unlicensed use and reimbursement for eco-nomic reasons in various countries, including in Italy and the UK.
JapaN INVeSTIGaTIONIn 2015, a trial started against a former Novartis Pharma K.K. (NPKK) employee, and also NPKK under the dual liability concept in Japanese law, over allegations brought by the Tokyo District Public Prosecutor Office in two counts for alleged manipulation of data in sub-analysis publications of the Kyoto Heart Study regarding valsar-tan. The charges against NPKK are subject to a maxi-mum total fine of JPY 4 million. In 2017, the Tokyo Dis-trict Court issued a not-guilty ruling for both the former NPKK employee and NPKK. An appeal by the Tokyo Dis-trict Public Prosecutor Office remains pending.
SOUTH KORea INVeSTIGaTIONIn 2016, the Seoul Western District Prosecutor initiated a criminal investigation into, among other things, allega-tions that Novartis Korea utilized medical journals to pro-vide inappropriate economic benefits to HCPs. A crimi-nal trial is ongoing concerning allegations that Novartis Korea utilized medical journals to provide inappropriate economic benefits to HCPs. In addition, other authorities in South Korea, including the Korea Fair Trade Commis-

Novartis Annual Report 2017 | 227FINaNcIal RepORTNotes to the Novartis Group consolidated financial statements
sion, the Ministry of Food and Drug Safety and the Min-istry of Health and Welfare conducted investigations into Novartis Korea. Those investigations have led to total fines of approximately USD 53 million as well as sales and reimbursement suspensions on Novartis Korea products in 2017.
GReece INVeSTIGaTIONNovartis is investigating allegations of potentially inap-propriate economic benefits in Greece to HCPs and oth-ers. Novartis Group companies in Greece are providing information to the Greek authorities related to these alle-gations. Novartis is also responding to a subpoena and document requests from the SEC and DoJ that it received in 2016 and 2017 in connection with such allegations and is cooperating with their investigation.
Antitrust class actionscONTacT leNSeSSince the first quarter of 2015, more than 50 putative class action complaints have been filed in several courts across the US naming contact-lens manufacturers, including ALI, and alleging violations of federal antitrust law as well as state antitrust, consumer protection and unfair competition laws of various states in connection with the sale of contact lenses. The cases have been consolidated in the Middle District of Florida by the Judi-cial Panel on Multidistrict Litigation and the claims are being vigorously contested.
GLEEVEC
In 2015 and 2016, Novartis Group companies were sued in putative antitrust class actions in D. Mass. alleging delayed generic entry of Gleevec and seeking damages on behalf of direct and indirect purchasers of Gleevec. The motion to dismiss those actions was granted and plaintiffs have appealed. A similar class action was filed in 2018 in E.D. Pa. on behalf of direct purchasers of Gleevec. The claims are being vigorously contested.
eNOXapaRINIn 2015, Sandoz and Momenta Pharmaceuticals were sued in a putative antitrust class action in federal court in Tennessee alleging that Momenta and Sandoz engaged in anticompetitive and unfair business conduct with regard to sales of enoxaparin, and the same allega-tions were made by Amphastar in a lawsuit filed in fed-eral court in California and subsequently moved to fed-eral court in Mass. (Sandoz, Momenta Pharmaceuticals and Amphastar are currently engaged in patent litigation concerning enoxaparin). The claims are being vigorously contested.
Other mattersaVeRaGe WHOleSale pRIce (aWp) lITIGaTIONLawsuits have been brought, the latest in February 2016, by various US state governmental entities and private parties against various pharmaceutical companies, including certain Sandoz entities and NPC, alleging that they fraudulently overstated the AWP that is or has been used by payors, including state Medicaid agencies, to
calculate reimbursements to healthcare providers. NPC remains a defendant in an action brought by the state of Illinois and in a putative class action brought by private payors in New Jersey, and Sandoz remains a defendant in an individual action in Pennsylvania. The putative class action in Pennsylvania was dismissed in 2017. The claims are being vigorously contested.
RECLAST/ACLASTA pRODUcT lIaBIlITY lITIGaTIONNPC is a defendant in more than 20 US product liability actions involving Reclast and alleging atypical femur fracture injuries, most of which are in New Jersey state or federal court and in California state court coordinated with claims against other bisphosphonate manufactur-ers. The Canadian putative class action brought against numerous bisphosphonate manufacturers, including NPC, Novartis Pharmaceuticals Canada Inc. and Novartis International AG, in Quebec was discontinued in 2017. The claims are being vigorously contested.
TaXOTeRe® (DOceTaXel) pRODUcT lIaBIlITY lITIGaTIONSandoz is a defendant in more than 1 000 US product liability actions involving Taxotere® (docetaxel), an oncol-ogy product, many of which have been transferred to Multidistrict Litigation in the Eastern District of Louisi-ana. The complaints allege that Sanofi, as innovator, and several 505(b)(2) NDA holders (including Sandoz) failed to warn of the risk of permanent alopecia/hair loss. The claims are being vigorously contested.
aMIODaRONe pRODUcT lIaBIlITY lITIGaTIONSandoz entities are named in more than 10 individual and multi-plaintiff US product liability cases involving amiodarone, a cardiac drug indicated to treat life-threat-ening arrhythmias that have not responded to other treat-ment. The complaints allege failure to warn, off-label pro-motion and failure to include medication guides to pharmacies. All claims are being vigorously contested.
ORIel lITIGaTIONIn 2013, Shareholder Representative Services LLC filed a complaint in New York State Court against Sandoz Inc., two affiliates and two former officers of Sandoz AG asserting various common law and statutory contract, fraud and negligent misrepresentation claims arising out of Sandoz Inc.’s purchase of Oriel Therapeutics, Inc. In March 2015, the court dismissed all parties and claims but for a breach of contract claim against Sandoz Inc. Sandoz Inc. continues to vigorously contest the claim.
eYe DROp pRODUcTS cONSUMeR claSS acTIONSTwo putative consumer fraud class actions remain ongo-ing against Alcon and Sandoz in New Jersey and at the US Court of Appeals for the First Circuit after having been initially dismissed at the trial court level. They claim that Alcon’s and Sandoz’s eye drop products for glau-coma were unfairly designed so that the drop dosage is more than necessary and exceeds the capacity of the eye, leading to wastage and higher costs to patient con-sumers. The claims are being vigorously contested.

228 | Novartis Annual Report 2017
IP MattersMIVS@ plaTFORM paTeNT INFRINGeMeNT lITIGaTIONJohns Hopkins University filed a patent infringement law-suit against Alcon alleging that the use of certain Alcon surgical products, principally by third parties, infringes a patent directed to certain methods of ocular surgery, and a trial is scheduled for February 2018. The claims are being vigorously contested.
Concluded legal mattersNeW YORK STaTe pRIcING pOlIcY INVeSTIGaTIONIn 2014, ALI received a civil subpoena from the New York State attorney general relating to an investigation into a unilateral pricing policy program. Novartis considers this matter concluded.
LUCENTIS/aVaSTIN® MaTTeR IN FRaNceNovartis’ appeals against a temporary recommendation of use and reimbursement of off-label Avastin® for neo-vascular AMD by hospital ophthalmologists, in force since September 2015, as well as against the decree on which the recommendation is based, were rejected by the Supreme Court in 2016 and 2017.
SOlODYN® aNTITRUST claSS acTIONSSince the third quarter of 2013, seventeen putative class action complaints and three other complaints had been filed against manufacturers of the brand drug Solodyn® and its generic equivalent, including Sandoz Inc. The cases had been consolidated and transferred for pretrial purposes to the federal district court in Mass. The plain-tiffs purported to represent direct and indirect purchas-ers of Solodyn® branded products and asserted viola-
tions of federal and state antitrust laws, including allegations in connection with separate settlements by Medicis with each of the other defendants, including San-doz Inc., of patent litigation relating to Solodyn®. In 2017, all cases were resolved through settlement, the payment of which was not material to Novartis.
Summary of product liability, governmental investigations and other legal matters provision movements
(USD millions) 2017 2016 2015
January 1 395 1 194 849
Cash payments – 69 – 811 – 256
Releases of provisions – 70 – 239 – 223
Additions to provisions 93 243 832
Currency translation effects 2 8 – 8
December 31 351 395 1 194
Less current portion – 121 – 131 – 743
Non-current product
liabilities, governmental
investigations and other
legal matters provisions
at December 31 230 264 451
Novartis believes that its total provisions for investiga-tions, product liability, arbitration and other legal matters are adequate based upon currently available information. However, given the inherent difficulties in estimating lia-bilities, there can be no assurance that additional liabil-ities and costs will not be incurred beyond the amounts provided.
20. current financial debt and derivative financial instruments(USD millions) 2017 2016
Interest-bearing accounts of associates
payable on demand 1 1 822 1 601
Bank and other financial debt 2 692 836
Commercial paper 2 328 3 174
Current portion of non-current financial debt 359 178
Fair value of derivative financial instruments 107 116
Total current financial debt and derivative
financial instruments 5 308 5 905
1 Weighted average interest rate 0.5% (2016: 0.5%)2 Weighted average interest rate 7.0% (2016: 6.7%)
The consolidated balance sheet amounts of current financial debt, other than the current portion of non- current financial debt, approximate the estimated fair value due to the short-term nature of these instruments.
Details on commercial papers are provided in Note 28 – Liquidity risk.

Novartis Annual Report 2017 | 229FINaNcIal RepORTNotes to the Novartis Group consolidated financial statements
21. provisions and other current liabilities
(USD millions) 2017 2016
Taxes other than income taxes 660 547
Restructuring provisions 153 222
Accrued expenses for goods and services received but not invoiced 977 880
Accruals for royalties 586 550
Provisions for deductions from revenue 4 672 4 183
Accruals for compensation and benefits including social security 2 327 1 993
Environmental remediation liabilities 55 65
Deferred income 305 287
Provisions for product liabilities, governmental investigations and other legal matters 1 121 131
Accrued share-based payments 261 199
Contingent considerations 2 44 49
Other payables 1 042 722
Total provisions and other current liabilities 11 203 9 828
1 Note 19 provides additional disclosures related to legal provisions.2 Note 28 provides additional disclosures related to contingent considerations.
Provisions are based upon management’s best estimate and adjusted for actual experience. Such adjustments to the historic estimates have not been material.
Provisions for deductions from revenueThe following table shows the movement of the provi-sions for deductions from revenue:
(USD millions) 2017 2016 2015
January 1 4 183 3 790 3 533
Impact of business combinations 3
Additions 17 997 16 622 15 603
Payments/utilizations – 17 452 – 16 189 – 15 218
Changes in offset against
gross trade receivables – 252 10 50
Currency translation effects 196 – 50 – 181
December 31 4 672 4 183 3 790
Restructuring provisions movements
(USD millions) 2017 2016 2015
January 1 222 260 333
Additions 194 343 399
Cash payments – 200 – 260 – 435
Releases – 64 – 66 – 36
Transfers – 7 – 76
Currency translation effects 8 21 – 1
December 31 153 222 260
In 2017, additions to provisions of USD 194 million were mainly related to the following reorganizations:• The Innovative Medicines Division’s Pharmaceuticals
business unit adjusted a regional promotional model which led to a restructuring of the sales force. It also
streamlined the above country operating model to facil-itate an even higher external competition oriented focus. Furthermore, the development organization streamlined its activities to create efficiencies.
• The Alcon Division continued initiatives to realign its operations to focus on the Surgical and Vision Care business after the Ophthalmic Pharmaceutical busi-ness transfer to the Innovative Medicines Division.
• The Sandoz Division launched initiatives to focus resources to gain efficiencies.
• Group-wide initiatives to streamline Novartis Technical Operations in the Innovative Medicines and Sandoz Divisions were launched.
In 2016, additions to provisions of USD 343 million were mainly related to the following reorganizations:• The Innovative Medicines Division’s Pharmaceuticals
business unit realigned its operations to improve its operating agility, to focus resources on key growth driv-ers. Furthermore, research realigned and focused its operations resulting in redundancies from the consol-idation of certain research teams and the outsourcing of certain activities to qualified third party vendors.
• The Alcon Division launched several initiatives to improve its efficiencies resulting in redundancies, as it realigned its operations to focus on its Surgical and Vision Care business franchises after the transfer of its Ophthalmic Pharmaceuticals business to Innovative Medicines division.
• The Sandoz Division launched an initiative to reallocate resources to priority, high growth and higher profitabil-ity countries.
• Various group-wide initiatives to simplify organizational structure, including the consolidation of manufacturing sites and support services.
In 2015, additions to provisions of USD 399 million were mainly related to the following reorganizations:

230 | Novartis Annual Report 2017
• The Innovative Medicines Division implemented a restructuring program targeted at efficiency gains in the business franchises, other than in Oncology. It also initiated initiatives related to the integration of the oncology business acquired from GSK.
• The Alcon Division extended its initiative started in the prior year to realize productivity opportunities.
• Various group-wide initiatives to simplify the organiza-tional structure, mainly related to the manufacturing footprint and support services.
22. Details to the consolidated cash flow statements22.1) Adjustments for non-cash items from continuing operations
(USD millions) 2017 2016 2015
Taxes 1 296 1 119 1 106
Depreciation, amortization and impairments on:
Property, plant & equipment 1 677 1 591 1 550
Intangible assets 4 399 4 452 3 921
Financial assets 1 256 132 104
Income from associated companies – 1 108 – 703 – 266
Gains on disposal and other adjustments on property, plant & equipment, intangible, financial and other
non-current assets, net – 1 043 – 935 – 869
Equity-settled compensation expense 683 671 773
Change in provisions and other non-current liabilities 160 956 1 642
Net financial expense 738 1 154 1 109
Total 7 058 8 437 9 070
1 Including unrealized fair value gains
In 2015, the Group acquired property, plant and equip-ment of USD 85 million through finance lease contracts.
22.2) Cash flows from changes in working capital and other operating items included in operating cash flow from continuing operations
(USD millions) 2017 2016 2015
(Increase) in inventories – 247 – 235 – 482
(Increase) in trade receivables – 204 – 229 – 513
Increase/(Decrease) in trade payables 58 – 587 378
Change in other net current assets and other operating cash flow items 637 974 – 246
Total 244 – 77 – 863
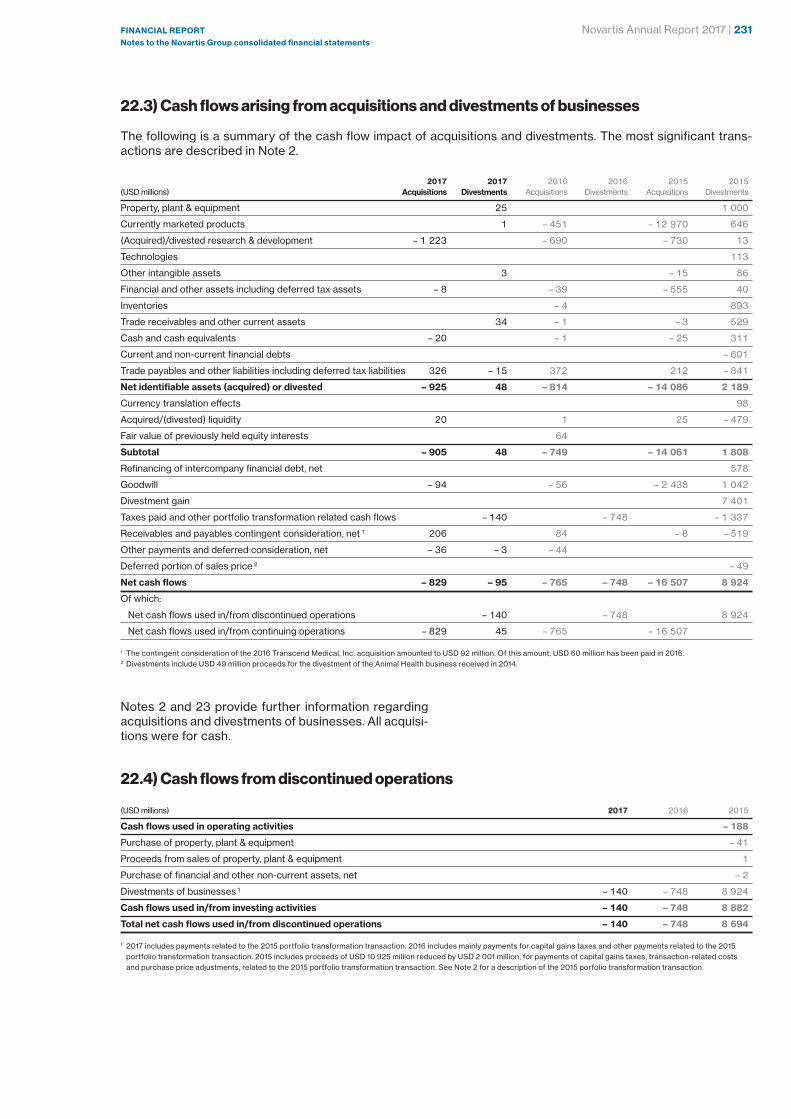
Novartis Annual Report 2017 | 231FINaNcIal RepORTNotes to the Novartis Group consolidated financial statements
22.3) Cash flows arising from acquisitions and divestments of businesses
The following is a summary of the cash flow impact of acquisitions and divestments. The most significant trans-actions are described in Note 2.
2017 2017 2016 2016 2015 2015
(USD millions) acquisitions Divestments Acquisitions Divestments Acquisitions Divestments
Property, plant & equipment 25 1 000
Currently marketed products 1 – 451 – 12 970 646
(Acquired)/divested research & development – 1 223 – 690 – 730 13
Technologies 113
Other intangible assets 3 – 15 86
Financial and other assets including deferred tax assets – 8 – 39 – 555 40
Inventories – 4 893
Trade receivables and other current assets 34 – 1 – 3 529
Cash and cash equivalents – 20 – 1 – 25 311
Current and non-current financial debts – 601
Trade payables and other liabilities including deferred tax liabilities 326 – 15 372 212 – 841
Net identifiable assets (acquired) or divested – 925 48 – 814 – 14 086 2 189
Currency translation effects 98
Acquired/(divested) liquidity 20 1 25 – 479
Fair value of previously held equity interests 64
Subtotal – 905 48 – 749 – 14 061 1 808
Refinancing of intercompany financial debt, net 578
Goodwill – 94 – 56 – 2 438 1 042
Divestment gain 7 401
Taxes paid and other portfolio transformation related cash flows – 140 – 748 – 1 337
Receivables and payables contingent consideration, net 1 206 84 – 8 – 519
Other payments and deferred consideration, net – 36 – 3 – 44
Deferred portion of sales price 2 – 49
Net cash flows – 829 – 95 – 765 – 748 – 16 507 8 924
Of which:
Net cash flows used in/from discontinued operations – 140 – 748 8 924
Net cash flows used in/from continuing operations – 829 45 – 765 – 16 507
1 The contingent consideration of the 2016 Transcend Medical, Inc. acquisition amounted to USD 92 million. Of this amount, USD 60 million has been paid in 2016.2 Divestments include USD 49 million proceeds for the divestment of the Animal Health business received in 2014.
Notes 2 and 23 provide further information regarding acquisitions and divestments of businesses. All acquisi-tions were for cash.
22.4) Cash flows from discontinued operations
(USD millions) 2017 2016 2015
cash flows used in operating activities – 188
Purchase of property, plant & equipment – 41
Proceeds from sales of property, plant & equipment 1
Purchase of financial and other non-current assets, net – 2
Divestments of businesses 1 – 140 – 748 8 924
cash flows used in/from investing activities – 140 – 748 8 882
Total net cash flows used in/from discontinued operations – 140 – 748 8 694
1 2017 includes payments related to the 2015 portfolio transformation transaction. 2016 includes mainly payments for capital gains taxes and other payments related to the 2015 portfolio transformation transaction. 2015 includes proceeds of USD 10 925 million reduced by USD 2 001 million, for payments of capital gains taxes, transaction-related costs and purchase price adjustments, related to the 2015 portfolio transformation transaction. See Note 2 for a description of the 2015 porfolio transformation transaction.

232 | Novartis Annual Report 2017
22.5) Reconciliation of liabilities arising from financing activities
Current
financial
debts and
Non-current derivative
financial financial
(USD millions) debts instruments Total
January 1, 2017 17 897 5 905 23 802
Increase in non-current financial debts 4 933 4 933
Repayment of non-current financial debts – 1 – 187 – 188
Change in current financial debts – 755 – 755
Changes in fair values and other changes – 6 – 140 – 146
Amortization of bonds discount 16 16
Currency translation effects 744 126 870
Current portion of non-current financial debt – 359 359
December 31, 2017 23 224 5 308 28 532
23. acquisitions of businessesFair value of assets and liabilities arising from acquisitions
(USD millions) 2017 2016 2015
Currently marketed products 451 12 970
Acquired research & development 1 223 690 730
Other intangible assets 15
Deferred tax assets 8 39 555
Inventories 4
Trade receivables and other current assets 1 3
Cash and cash equivalents 20 1 25
Payables and other liabilities including deferred tax liabilities – 326 – 372 – 212
Net identifiable assets acquired 925 814 14 086
Acquired liquidity – 20 – 1 – 25
Goodwill 94 56 2 438
Net assets recognized as a result of business combinations 999 869 16 499
Note 2 details significant acquisition of businesses, which were Ziarco and Encore in 2017, were Transcend and Reprixys in 2016, and were the GSK Oncology prod-ucts, Spinifex and Admune in 2015. The goodwill arising out of these acquisitions is attributable to buyer-specific
synergies, the assembled workforce and the accounting for deferred tax liabilities on the acquired assets. No goodwill from 2017 is tax-deductible. Goodwill of USD 18 million from 2016 and of USD 2.4 billion from 2015 is tax deductible.

Novartis Annual Report 2017 | 233FINaNcIal RepORTNotes to the Novartis Group consolidated financial statements
24. post-employment benefits for associates
Defined benefit plans
In addition to the legally required social security schemes, the Group has numerous independent pension and other post-employment benefit plans. In most cases, these plans are externally funded in entities that are legally separate from the Group. For certain Group companies, however, no independent plan assets exist for the pen-sion and other post-employment benefit obligations of associates. In these cases the related unfunded liability is included in the balance sheet. The defined benefit obli-gations (DBOs) of all major pension and other post-em-ployment benefit plans are reappraised annually by inde-pendent actuaries. Plan assets are recognized at fair value. The major plans are based in Switzerland, the United States, the United Kingdom, Germany and Japan, which represent 94% of the Group’s total DBO for pen-sion plans. Details of the plans in the two most signifi-cant countries of Switzerland and the United States are provided below.
Swiss-based pension plans represent the most sig-nificant portion of the Group’s total DBO and plan assets. For the active insured members born on or after Janu-ary 1, 1956, or having joined the plans after December 31, 2010, the benefits are partially linked to the contribu-tions paid into the plan. Certain features of Swiss pen-sion plans required by law preclude the plans being cat-egorized as defined contribution plans. These factors include a minimum interest guarantee on retirement sav-ings accounts, a pre-determined factor for converting the accumulated savings account balance into a pension and embedded death and disability benefits.
All benefits granted under Swiss-based pension plans are vested, and Swiss legislation prescribes that the employer has to contribute a fixed percentage of an associate’s pay to an external pension fund. Additional employer contributions may be required whenever the plan’s statutory funding ratio falls below a certain level. The associate also contributes to the plan. The pension plans are run by separate legal entities, each governed by a Board of Trustees, that, for the principal plans, con-sists of representatives nominated by Novartis and the active insured associates. The Boards of Trustees are responsible for the plan design and asset investment strategy.
In September 2017, the pension regulations in Swit-zerland were amended, which resulted in a change in accounting from defined benefit to defined contribution for a component of the Swiss pension plans. This change resulted in a reduction to the defined benefit pension plans liability and in a corresponding net pre-tax gain of USD 225 million (CHF 216 million).
The United States pension plans represent the sec-ond largest component of the Group’s total DBO and plan assets. The principal plans (Qualified Plans) are funded, whereas plans providing additional benefits for executives (Restoration Plans) are unfunded. Employer contributions are required for Qualified Plans whenever the statutory funding ratio falls below a certain level. Fur-thermore, associates in the United States are covered under other post-employment benefit plans and post-re-tirement medical plans.
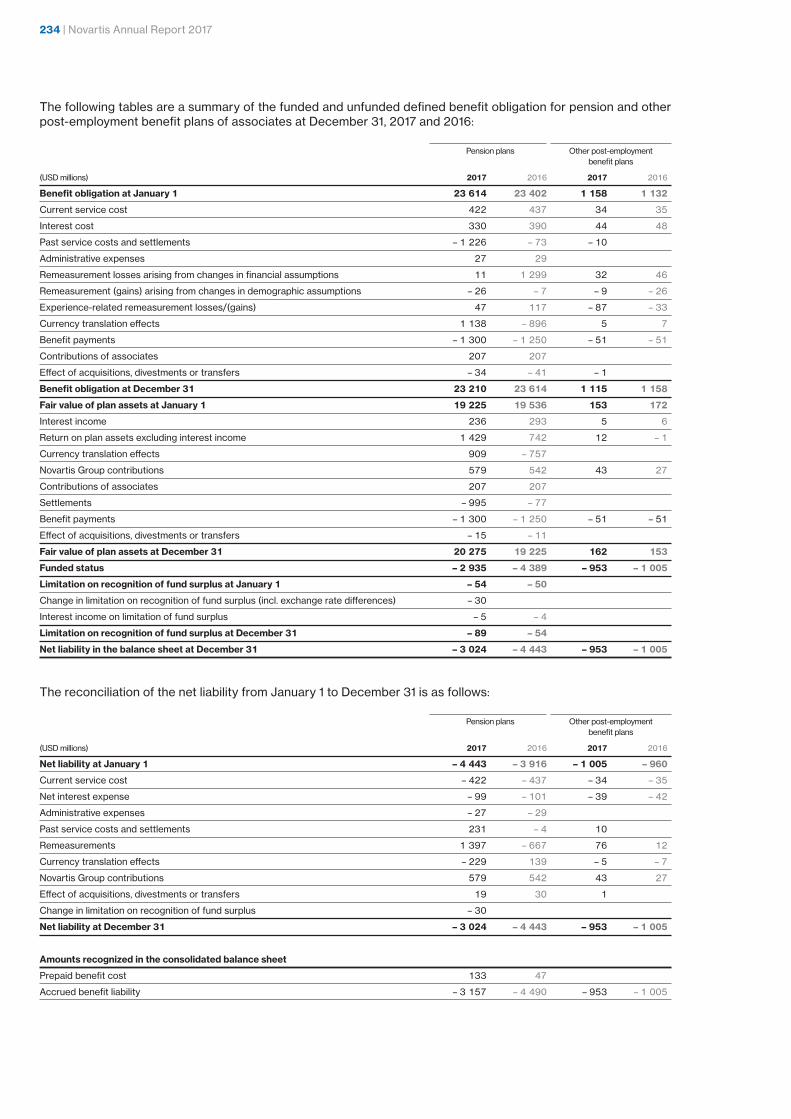
234 | Novartis Annual Report 2017
The following tables are a summary of the funded and unfunded defined benefit obligation for pension and other post- employment benefit plans of associates at December 31, 2017 and 2016:
Pension plans Other post-employment benefit plans
(USD millions) 2017 2016 2017 2016
Benefit obligation at January 1 23 614 23 402 1 158 1 132
Current service cost 422 437 34 35
Interest cost 330 390 44 48
Past service costs and settlements – 1 226 – 73 – 10
Administrative expenses 27 29
Remeasurement losses arising from changes in financial assumptions 11 1 299 32 46
Remeasurement (gains) arising from changes in demographic assumptions – 26 – 7 – 9 – 26
Experience-related remeasurement losses/(gains) 47 117 – 87 – 33
Currency translation effects 1 138 – 896 5 7
Benefit payments – 1 300 – 1 250 – 51 – 51
Contributions of associates 207 207
Effect of acquisitions, divestments or transfers – 34 – 41 – 1
Benefit obligation at December 31 23 210 23 614 1 115 1 158
Fair value of plan assets at January 1 19 225 19 536 153 172
Interest income 236 293 5 6
Return on plan assets excluding interest income 1 429 742 12 – 1
Currency translation effects 909 – 757
Novartis Group contributions 579 542 43 27
Contributions of associates 207 207
Settlements – 995 – 77
Benefit payments – 1 300 – 1 250 – 51 – 51
Effect of acquisitions, divestments or transfers – 15 – 11
Fair value of plan assets at December 31 20 275 19 225 162 153
Funded status – 2 935 – 4 389 – 953 – 1 005
limitation on recognition of fund surplus at January 1 – 54 – 50
Change in limitation on recognition of fund surplus (incl. exchange rate differences) – 30
Interest income on limitation of fund surplus – 5 – 4
limitation on recognition of fund surplus at December 31 – 89 – 54
Net liability in the balance sheet at December 31 – 3 024 – 4 443 – 953 – 1 005
The reconciliation of the net liability from January 1 to December 31 is as follows:
Pension plans Other post-employment benefit plans
(USD millions) 2017 2016 2017 2016
Net liability at January 1 – 4 443 – 3 916 – 1 005 – 960
Current service cost – 422 – 437 – 34 – 35
Net interest expense – 99 – 101 – 39 – 42
Administrative expenses – 27 – 29
Past service costs and settlements 231 – 4 10
Remeasurements 1 397 – 667 76 12
Currency translation effects – 229 139 – 5 – 7
Novartis Group contributions 579 542 43 27
Effect of acquisitions, divestments or transfers 19 30 1
Change in limitation on recognition of fund surplus – 30
Net liability at December 31 – 3 024 – 4 443 – 953 – 1 005
amounts recognized in the consolidated balance sheet
Prepaid benefit cost 133 47
Accrued benefit liability – 3 157 – 4 490 – 953 – 1 005

Novartis Annual Report 2017 | 235FINaNcIal RepORTNotes to the Novartis Group consolidated financial statements
The following table shows a breakdown of the DBO for pension plans by geography and type of member, and the breakdown of plan assets into the geographical locations in which they are held:
2017 2016
Rest of Rest of
(USD millions) Switzerland United States the world Total Switzerland United States the world Total
Benefit obligation at December 31 14 606 3 788 4 816 23 210 15 436 3 783 4 395 23 614
Thereof unfunded 728 499 1 227 739 497 1 236
By type of member
Active 5 627 796 1 646 8 069 6 426 891 1 460 8 777
Deferred pensioners 1 258 1 646 2 904 831 1 515 2 346
Pensioners 8 979 1 734 1 524 12 237 9 010 2 061 1 420 12 491
Fair value of plan assets at December 31 14 445 2 400 3 430 20 275 13 958 2 282 2 985 19 225
Funded status – 161 – 1 388 – 1 386 – 2 935 – 1 478 – 1 501 – 1 410 – 4 389
The following table shows the principal weighted average actuarial assumptions used for calculating defined ben-efit plans and other post- employment benefits of associates:
Pension plans Other post-employment benefit plans
2017 2016 2015 2017 2016 2015
Weighted average assumptions used to determine
benefit obligations at December 31
Discount rate 1.5% 1.4% 1.8% 3.7% 4.2% 4.4%
Expected rate of pension increase 0.5% 0.4% 0.4%
Expected rate of salary increase 2.8% 2.2% 2.9%
Interest on savings account 0.6% 0.5% 0.8%
Current average life expectancy
for a 65-year-old male in years 22 22 21 21 21 21
Current average life expectancy
for a 65-year-old female in years 24 24 24 23 23 23
Changes in the aforementioned actuarial assumptions can result in significant volatility in the accounting for the Group’s pension plans in the consolidated financial state-ments. This can result in substantial changes in the Group’s other comprehensive income, long-term liabili-ties and prepaid pension assets.
The DBO is significantly impacted by assumptions regarding the rate that is used to discount the actuari-ally determined post-employment benefit liability. This rate is based on yields of high-quality corporate bonds in the country of the plan. Decreasing corporate bond yields decrease the discount rate, so that the DBO increases and the funded status decreases.
In Switzerland, an increase in the DBO due to lower discount rates is slightly offset by lower future benefits expected to be paid on the associate’s savings account where the assumption on interest accrued changes in line with the discount rate.
The impact of decreasing interest rates on a plan’s assets is more difficult to predict. A significant part of the plan assets is invested in bonds. Bond values usually rise when interest rates decrease and may therefore par-tially compensate for the decrease in the funded status. Furthermore, pension assets also include significant
holdings of equity instruments. Share prices tend to rise when interest rates decrease and therefore often coun-teract the negative impact of the rising defined benefit obligation on the funded status (although the correlation of interest rates with equities is not as strong as with bonds, especially in the short term).
The expected rate for pension increases significantly affects the DBO of most plans in Switzerland, Germany and the United Kingdom. Such pension increases also decrease the funded status, although there is no strong correlation between the value of the plan assets and pension/inflation increases.
Assumptions regarding life expectancy significantly impact the DBO. An increase in longevity increases the DBO. There is no offsetting impact from the plan assets, as no longevity bonds or swaps are held by the pension funds. Generational mortality tables are used where this data is available.
The following table shows the sensitivity of the defined benefit pension obligation to the principal actu-arial assumptions for the major plans in Switzerland, the United States, the United Kingdom, Germany and Japan on an aggregated basis:

236 | Novartis Annual Report 2017
Change in 2017 year-end
(USD millions) defined benefit pension obligation
25 basis point increase in discount rate – 753
25 basis point decrease in discount rate 803
1 year increase in life expectancy 840
25 basis point increase in rate of pension increase 533
25 basis point decrease in rate of pension increase – 138
25 basis point increase of interest on savings account 56
25 basis point decrease of interest on savings account – 54
25 basis point increase in rate of salary increase 49
25 basis point decrease in rate of salary increase – 50
The healthcare cost trend rate assumptions used for other post- employment benefits are as follows:
2017 2016 2015
Healthcare cost trend rate
assumed for next year 6.5% 7.0% 7.5%
Rate to which the cost trend
rate is assumed to decline 4.5% 5.0% 5.0%
Year that the rate reaches
the ultimate trend rate 2025 2022 2022
The following table shows the weighted average plan asset allocation of funded defined benefit pension plans at December 31, 2017 and 2016:
Pension plans
Long-term Long-term
target target
(as a percentage) minimum maximum 2017 2016
Equity securities 15 40 31 31
Debt securities 20 60 35 35
Real estate 5 20 15 15
Alternative investments 0 20 15 15
Cash and other investments 0 15 4 4
Total 100 100
Cash and most of the equity and debt securities have a quoted market price in an active market. Real estate and alternative investments, which include hedge fund and private equity investments, usually do not have a quoted market price.
The strategic allocation of assets of the different pen-sion plans is determined with the objective of achieving an investment return that, together with the contributions paid by the Group and its associates, is sufficient to main-tain reasonable control over the various funding risks of the plans. Based upon the market and economic envi-
ronments, actual asset allocations may temporarily be permitted to deviate from policy targets. The asset allo-cation currently includes investments in shares of Novartis AG as per the below table:
December 31, December 31,
2017 2016
Investment in shares of Novartis AG
Number of shares (in millions) 11.0 11.0
Market Value (in USD billions) 0.9 0.8
The weighted average duration of the defined benefit obligation is 14.6 years (2016: 14.5 years).
The Group’s ordinary contribution to the various pen-sion plans is based on the rules of each plan. Additional contributions are made whenever this is required by stat-ute or law (i.e., usually when statutory funding levels fall below pre-determined thresholds). The only significant plans that are foreseen to require additional funding are those in the United Kingdom.
The expected future cash flows in respect of pension and other post-employment benefit plans at December 31, 2017, were as follows:
Other post-
employment
(USD millions) Pension plans benefit plans
Novartis Group contributions
2018 (estimated) 395 62
expected future benefit payments
2018 1 226 63
2019 1 166 65
2020 1 163 67
2021 1 147 68
2022 1 133 69
2023–2027 5 534 344
Defined contribution plans
In many subsidiaries, associates are covered by defined contribution plans. Contributions charged to the 2017 consolidated income statement for the defined contri-bution plans were:
(USD millions) 2017 2016 2015
Contributions for defined contribution plans continuing operations 406 338 359
Contributions for defined contribution plans discontinued operations 1

Novartis Annual Report 2017 | 237FINaNcIal RepORTNotes to the Novartis Group consolidated financial statements
25. equity-based participation plans for associates
The expense related to all equity-based participation plans and the liabilities arising from equity-based pay-ment transactions were as follows:
(USD millions) 2017 2016 2015
Expense related to equity-based
participation plans 924 846 968
of which continuing operations 924 846 903
of which discontinued operations 65
Liabilities arising from equity-based
payment transactions 261 199 209
Equity-based participation plans can be separated into the following plans:
Annual Incentive
The Annual Incentive of the Novartis Group CEO and the other Executive Committee members is paid 50% in cash in February or March of the year following the perfor-mance period, and 50% in Novartis Restricted Shares (RSs) or Restricted Share Units (RSUs) that are granted in January of the year following the performance period, deferred and restricted for three years. In 2016, this was extended to Novartis Top Leaders (NTLs). The Annual Incentive payout for the NTLs is 70% in cash and 30% in Novartis RSs or RSUs. Each RS is entitled to voting rights and payment of dividends during the vesting period. Each RSU is equivalent to one Novartis share and is converted into one share at the vesting date. RSUs do not carry any dividend, dividend equivalent or voting rights. The executives in certain countries may elect to also receive their cash incentive partially or fully in shares or share units that will not be subject to vesting condi-tions.
Share savings plans
A number of associates in certain countries as well as certain key executives worldwide are encouraged to invest their Annual Incentive, and in the United Kingdom also their salary, in a share savings plan. Under the share savings plan, participants may elect to receive their Annual Incentive fully or partially in Novartis shares in lieu of cash. As a reward for their participation in the share savings plan, at no additional cost to the partici-pant, Novartis matches their investments in shares after a holding period of three or five years.
Novartis operates three share savings plans, and asso-ciates may only participate in one of the share savings plans in any given year:• In Switzerland, Employee Share Ownership Plan
(ESOP) participants may choose to receive their Annual Incentive (i) 100% in shares, (ii) 50% in shares and 50% in cash or (iii) 100% in cash. After expiration of a three-
year holding period for Novartis shares invested under the ESOP, participants will receive one matching share for every two invested shares. Associates eligible for the equity plan “Select” are not eligible to receive ESOP matching shares starting with the 2017 performance period onwards.
• In the United Kingdom, associates can invest up to 10% of their monthly salary in shares (up to a maximum of GBP 150) and may also be invited to invest their net Annual Incentive in shares. Two invested shares are matched with one share with a holding period of three years. Starting with the 2017 performance period onwards, United Kingdom associates can only invest a maximum of 50% of their Annual Incentive in shares and this option is no longer offered to associates who are eligible for the equity plan “Select”.
• The Leveraged Share Savings Plan (LSSP) was avail-able to key executives for performance periods prior to 2016. At the participant’s election, the Annual Incen-tive was awarded partly or entirely in shares. The elected number of shares is subject to a holding period of five years. At the end of the holding period, Novartis will match the invested shares at a ratio of 1-to-1 (i.e. one share awarded for each invested share). In the United States both the LSSP award and the corre-sponding match are cash settled.
Following the introduction of the new compensation pro-grams in 2014, the Novartis Group CEO and the other Executive Committee members are no longer eligible to participate in the share savings plans. From the 2016 performance period onwards, the NTLs are also no lon-ger eligible to participate in the share savings plans.
Novartis equity plan “Select”
The equity plan “Select” is a global equity incentive plan under which eligible associates may annually be awarded a grant subject to a three year vesting period. No awards are granted for performance ratings below a certain threshold. Executive Committee members are not eligi-ble for participation in the equity plan “Select” effective from the performance period 2014, and the NTLs are not eligible to participate effective from the performance period 2016.
The equity plan “Select” currently allows participants in Switzerland to choose the form of their equity com-pensation in RSs or RSUs. In all other jurisdictions, RSUs are typically granted. Until 2013, participants could also choose to receive part or the entire grant in the form of tradable share options.
Tradable share options expire on their tenth anniver-sary from the grant date. Each tradable share option enti-tles the holder to purchase after vesting (and before the tenth anniversary from the grant date) one Novartis share at a stated exercise price that equals the closing market price of the underlying share at the grant date.

238 | Novartis Annual Report 2017
Options under Novartis equity plan “Select” outside North AmericaThe following table shows the activity associated with the share options during the period. The weighted aver-age prices in the table below are translated from Swiss francs into USD at historical rates.
2017 2016
Weighted Weighted
average average
Options exercise Options exercise
(millions) price (USD) (millions) price (USD)
Options outstanding
at January 1 9.5 59.4 11.7 59.9
Sold or exercised – 2.1 59.2 – 2.2 61.8
Forfeited or expired
Outstanding at December 31 7.4 59.5 9.5 59.4
exercisable at December 31 7.4 59.5 9.5 59.4
All share options were granted at an exercise price that was equal to the closing market price of the Group’s shares at the grant date. The weighted average share price at the dates of sale or exercise was USD 80.1.
The following table summarizes information about share options outstanding at December 31, 2017:
Options outstanding
Average Weighted
Number remaining average
outstanding contractual exercise
Range of exercise prices (USD) (millions) life (years) price (USD)
45–49 0.7 1.0 46.7
50–54 1.1 2.0 54.6
55–59 2.7 3.3 57.6
65–70 2.9 5.0 66.1
Total 7.4 3.6 59.5
Options under Novartis equity plan “Select” for North AmericaThe following table shows the activity associated with the American Depositary Receipts (ADR) options during the period:
2017 2016
Weighted Weighted
ADR average ADR average
options exercise options exercise
(millions) price (USD) (millions) price (USD)
Options outstanding
at January 1 25.9 59.9 31.9 60.2
Sold or exercised – 5.6 59.9 – 6.0 61.7
Forfeited or expired
Outstanding at December 31 20.3 59.9 25.9 59.9
exercisable at December 31 20.3 59.9 25.9 59.9
All ADR options were granted at an exercise price that was equal to the closing market price of the ADRs at the grant date. The weighted average ADR price at the dates of sale or exercise was USD 79.9.
The following table summarizes information about ADR options outstanding at December 31, 2017:
ADR options outstanding
Average Weighted
Number remaining average
outstanding contractual exercise
Range of exercise prices (USD) (millions) life (years) price (USD)
45–49 1.8 1.0 46.4
50–54 2.1 2.0 53.7
55–59 8.0 3.5 58.0
65–69 8.4 5.0 66.1
Total 20.3 3.7 59.9
Long-Term Performance Plan
The Long-Term Performance Plan (LTPP) is an equity plan for the Novartis Group CEO, the other Executive Commit-tee members and the NTLs. For the 2017 grant, the target incentive is 200% of base compensation for the Novartis Group CEO and ranges from 150% to 170% for other Exec-utive Committee members. For the NTLs, the target incen-tive range is from 20% to 160% of base compensation.
The awards of the LTPP are based on three-year per-formance objectives focused on financial and innovation measures. The financial measure is Novartis Cash Value Added (NCVA). The weighting of this measure is 75%. The NCVA target is approved by the Board of Directors.
The innovation measure is based on a holistic approach under which divisional innovation targets are set at the beginning of the cycle, comprised of up to ten target milestones that represent the most important research and development project milestones for each division. The weighting of this measure is 25%. At the end of the performance period, the Research & Devel-opment Committee assists the Board of Directors and the Compensation Committee in evaluating performance against the innovation targets at the end of the cycle.
Under the LTPP, participants are granted a target number of Performance Share Units (PSUs) at the begin-ning of every performance period, which are converted into unrestricted Novartis shares after the performance period. Payout is between 0% and 200% of target. PSUs granted under the LTPP do not carry voting rights, but do carry dividend equivalents that are paid in shares at the end of the performance period.
Long-Term Relative Performance Plan
The Long-Term Relative Performance Plan (LTRPP) is an equity plan for the Novartis Group CEO, other ECN mem-bers and NTLs. For the 2017 grant, the target incentive is 125% of base compensation for the Novartis Group CEO and ranges from 60% to 80% for other Executive Com-mittee members. For the NTLs, the target incentive range is from 10% to 40% of base compensation. The LTRPP is based on the ranking of Novartis’ Total Shareholder Return (TSR) relative to a global healthcare peer group of 12 com-panies until 2016, and 15 companies from 2017, over roll-ing three-year performance periods. TSR in USD is calcu-lated as price change of the Novartis share plus the dividend plus the re-investment return of the dividend amount, all translated to USD at the respective exchange rate, over the three-year performance period. The calcu-
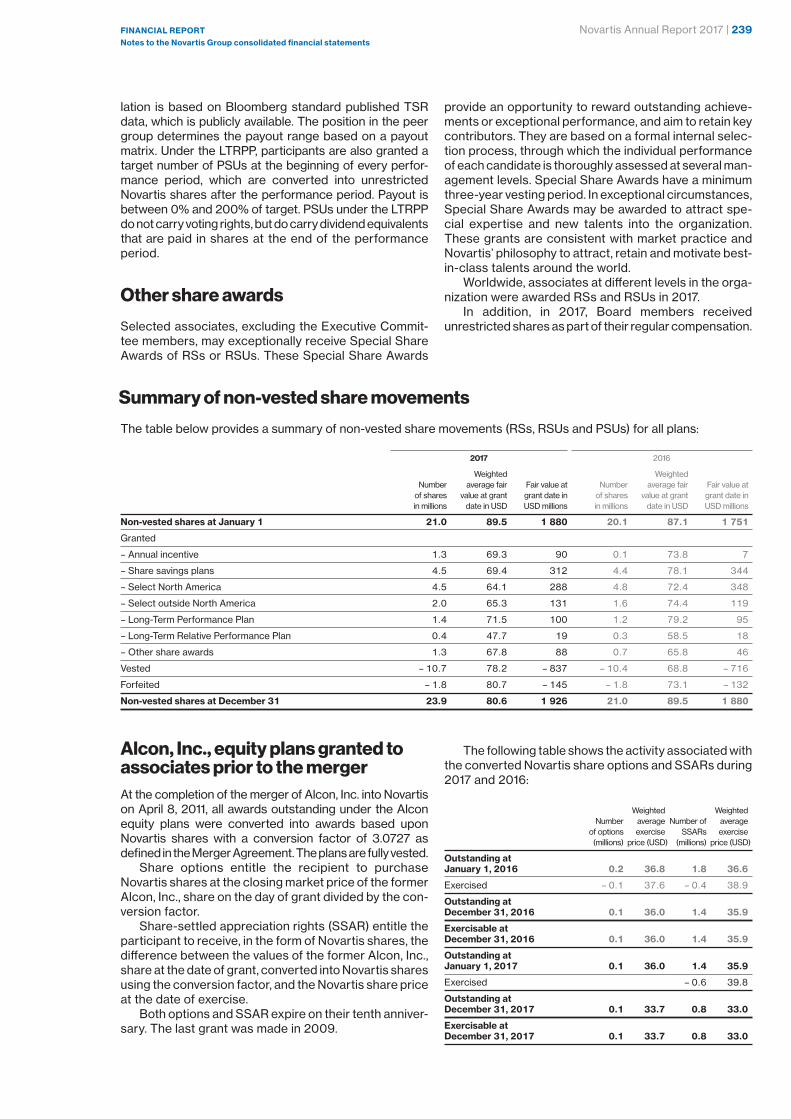
Novartis Annual Report 2017 | 239FINaNcIal RepORTNotes to the Novartis Group consolidated financial statements
lation is based on Bloomberg standard published TSR data, which is publicly available. The position in the peer group determines the payout range based on a payout matrix. Under the LTRPP, participants are also granted a target number of PSUs at the beginning of every perfor-mance period, which are converted into unrestricted Novartis shares after the performance period. Payout is between 0% and 200% of target. PSUs under the LTRPP do not carry voting rights, but do carry dividend equivalents that are paid in shares at the end of the performance period.
Other share awards
Selected associates, excluding the Executive Commit-tee members, may exceptionally receive Special Share Awards of RSs or RSUs. These Special Share Awards
provide an opportunity to reward outstanding achieve-ments or exceptional performance, and aim to retain key contributors. They are based on a formal internal selec-tion process, through which the individual performance of each candidate is thoroughly assessed at several man-agement levels. Special Share Awards have a minimum three-year vesting period. In exceptional circumstances, Special Share Awards may be awarded to attract spe-cial expertise and new talents into the organization. These grants are consistent with market practice and Novartis’ philosophy to attract, retain and motivate best-in-class talents around the world.
Worldwide, associates at different levels in the orga-nization were awarded RSs and RSUs in 2017.
In addition, in 2017, Board members received unrestricted shares as part of their regular compensation.
Summary of non-vested share movements
The table below provides a summary of non-vested share movements (RSs, RSUs and PSUs) for all plans:
2017 2016
Weighted Weighted
Number average fair Fair value at Number average fair Fair value at
of shares value at grant grant date in of shares value at grant grant date in
in millions date in USD USD millions in millions date in USD USD millions
Non-vested shares at January 1 21.0 89.5 1 880 20.1 87.1 1 751
Granted
– Annual incentive 1.3 69.3 90 0.1 73.8 7
– Share savings plans 4.5 69.4 312 4.4 78.1 344
– Select North America 4.5 64.1 288 4.8 72.4 348
– Select outside North America 2.0 65.3 131 1.6 74.4 119
– Long-Term Performance Plan 1.4 71.5 100 1.2 79.2 95
– Long-Term Relative Performance Plan 0.4 47.7 19 0.3 58.5 18
– Other share awards 1.3 67.8 88 0.7 65.8 46
Vested – 10.7 78.2 – 837 – 10.4 68.8 – 716
Forfeited – 1.8 80.7 – 145 – 1.8 73.1 – 132
Non-vested shares at December 31 23.9 80.6 1 926 21.0 89.5 1 880
Alcon, Inc., equity plans granted to associates prior to the mergerAt the completion of the merger of Alcon, Inc. into Novartis on April 8, 2011, all awards outstanding under the Alcon equity plans were converted into awards based upon Novartis shares with a conversion factor of 3.0727 as defined in the Merger Agreement. The plans are fully vested.
Share options entitle the recipient to purchase Novartis shares at the closing market price of the former Alcon, Inc., share on the day of grant divided by the con-version factor.
Share-settled appreciation rights (SSAR) entitle the participant to receive, in the form of Novartis shares, the difference between the values of the former Alcon, Inc., share at the date of grant, converted into Novartis shares using the conversion factor, and the Novartis share price at the date of exercise.
Both options and SSAR expire on their tenth anniver-sary. The last grant was made in 2009.
The following table shows the activity associated with the converted Novartis share options and SSARs during 2017 and 2016:
Weighted Weighted
Number average Number of average
of options exercise SSARs exercise
(millions) price (USD) (millions) price (USD)
Outstanding at
January 1, 2016 0.2 36.8 1.8 36.6
Exercised – 0.1 37.6 – 0.4 38.9
Outstanding at
December 31, 2016 0.1 36.0 1.4 35.9
exercisable at
December 31, 2016 0.1 36.0 1.4 35.9
Outstanding at
January 1, 2017 0.1 36.0 1.4 35.9
Exercised – 0.6 39.8
Outstanding at
December 31, 2017 0.1 33.7 0.8 33.0
exercisable at
December 31, 2017 0.1 33.7 0.8 33.0

240 | Novartis Annual Report 2017
26. Transactions with related parties
Genentech/Roche
Novartis has two agreements with Genentech, Inc., United States, a subsidiary of Roche Holding AG which is indirectly included in the consolidated financial state-ments using equity accounting since Novartis holds 33.3% of the outstanding voting shares of Roche.
LUCENTISNovartis has licensed the exclusive rights to develop and market Lucentis outside the United States for indications related to diseases of the eye. As part of this agreement, Novartis paid Genentech/Roche an initial milestone and shared the cost for the subsequent development by mak-ing additional milestone payments upon the achievement of certain clinical development points and product approval. Novartis also pays royalties on the net sales of Lucentis products outside the United States. In 2017, Lucentis sales of USD 1.9 billion (2016: USD 1.8 billion, 2015: USD 2.1 billion) were recognized by Novartis.
XOLAIRIn February 2004, Novartis Pharma AG, Genentech, Inc., and Tanox, Inc., finalized a three-party collaboration to govern the development and commercialization of cer-
tain anti-IgE antibodies including Xolair and TNX-901. Under this agreement, all three parties co-developed Xolair. On August 2, 2007, Genentech, Inc. completed the acquisition of Tanox, Inc. and has taken over its rights and obligations. Novartis and Genentech/Roche are co-promoting Xolair in the United States where Genen-tech/Roche records all sales. Novartis records sales outside of the United States.
Novartis markets Xolair and records all sales and related costs outside the United States as well as co-pro-motion costs in the US. Genentech/Roche and Novartis share the resulting profits from sales in the United States, Europe and other countries, according to agreed prof-it-sharing percentages. In 2017, Novartis recognized total sales of Xolair of USD 920 million (2016: USD 835 mil-lion, 2015: USD 755 million) including sales to them for the United States market.
The net expense for royalties, cost sharing and profit sharing arising out of the Lucentis and Xolair agreements with Genentech/Roche totaled USD 33 million in 2017 (2016: USD 217 million, 2015: USD 309 million).
Furthermore, Novartis has several patent license, supply and distribution agreements with Roche.
Executive Officers and Non-Executive Directors Compensation
During 2017, there were 11 Executive Committee members (“Executive Officers”), including those who stepped down during the year (14 members in 2016 and 11 members in 2015 also including those who stepped down).
The total compensation for members of the Execu-tive Committee and the 13 Non-Executive Directors (13 in 2016, 12 in 2015 including those who stepped down during the year) using the Group’s accounting policies for equity-based compensation and pension benefits was as follows:
Executive Officers Non-Executive Directors Total
(USD millions) 2017 2016 2015 2017 2016 2015 2017 2016 2015
Cash and other compensation 18.4 20.8 17.1 4.0 4.0 4.7 22.4 24.8 21.8
Post-employment benefits 2.0 2.2 1.9 2.0 2.2 1.9
Equity-based compensation 49.9 46.2 52.9 4.8 4.6 4.4 54.7 50.8 57.3
Total 70.3 69.2 71.9 8.8 8.6 9.1 79.1 77.8 81.0
During 2017, there was an increase in the IFRS compen-sation expense for Executive Officers, mainly due to the pro-rata accelerated vesting of equity-based compen-sation, required by IFRS, for an ECN member who stepped down on December 31, 2017. This was partially offset by the reduction in the number of Executive Offi-cers compared to 2016. The increase in the IFRS com-pensation expense for Non-Executive Directors was due to one additional Non-Executive Director appointed at the 2017 Annual General Meeting.
During 2016, there was a decrease in the IFRS com-pensation expense for Executive Officers compared to 2015. This was mainly due to lower equity-based com-
pensation expense attributable to lower performance factors, which was partially offset by higher benefits other than equity-based compensation resulting from the increase in the number of Executive Officers.
The Annual Incentive award, which is fully included in equity- based compensation even when paid out in cash, is granted in January in the year following the reporting period.
The disclosures on Board and Executive compensa-tion required by the Swiss Code of Obligations and in accordance with the Swiss Ordinance against Excessive Compensation in Stock Exchange Listed Companies are shown in the Compensation Report.

Novartis Annual Report 2017 | 241FINaNcIal RepORTNotes to the Novartis Group consolidated financial statements
Transactions with former members of the Board of DirectorsDuring 2017, 2016 and 2015, the following payments (or waivers of claims) were made to former Board members or to “persons closely” linked to them:
Currency 2017 2016 2015
Prof. Dr. Brody CHF 0 25 000 100 000
Prof. Dr. Zinkernagel CHF 0 50 000 200 000
Dr. Krauer CHF 60 000 60 000 60 000
Dr. Vasella CHF 26 279 0 0
USD 0 250 000 250 000
Prof. Dr. William R. Brody and Prof. Dr. Rolf M. Zinkernagel, who stepped down from the Board of Directors at the 2014 AGM, received in 2016 and 2015, delegated Board membership fees for their work on the Boards of the Novartis Institute for Tropical Diseases (Prof. Dr. Zinkernagel) and the Genomics Institute of the Novartis Research Foundation (Prof. Dr. Brody and Prof. Dr. Zinkernagel). No payments were made in 2017, as their respective mandates ended in 2016.
Dr. Alex Krauer, Honorary Chairman, is entitled to an amount of CHF 60 000 for annual periods from one AGM to the next. This amount was fixed in 1998 upon his departure from the Board in 1999, and has not been revised since that date.
In 2017, Dr. Daniel Vasella, Honorary Chairman, was paid CHF 26 279 for reimbursable costs under his agree-ment with the company. In 2016, Dr. Daniel Vasella
received the contractual minimum compensation under an agreement which became effective on November 1, 2013 and ended in 2016. Under this agreement, Dr. Vasella was compensated at a rate of USD 25 000 per day, with an annual guaranteed minimum fee of USD 250 000. This amount was in line with compensa-tion practices at other large companies when retired Chairmen or CEOs were retained in consulting agree-ments after leaving the board of directors.
In 2014, Dr. Vasella exercised an option to acquire, at a future date, real estate in Risch, Zug, Switzerland. The real estate transaction closed in 2015 and Dr. Vasella acquired the Group assets from a consolidated entity for an arm’s length transaction price determined on the basis of two independent external assessments.
Transactions with an Executive Officer prior to the start of employmentAs announced on September 24, 2015, Dr. James E. Bradner succeeded Dr. Mark Fishman as President of the Novartis Institutes for BioMedical Research (NIBR) and member of the Executive Committee of Novartis with effect from March 1, 2016. In 2015, a Novartis subsidiary acquired Dr. Bradner’s 10 million shares (7% interest) in a non-material entity for USD 10 million. The arm’s length transaction price was determined based on the most recent round of financing of this entity.
The above disclosures related to Dr. Vasella and Dr. Bradner are made on a voluntary basis.
27. commitments and contingenciesLeasing commitments
The Group has entered into various fixed-term opera-tional leases, mainly for cars and real estate. As of December 31, 2017, the Group’s commitments with respect to these leases, including estimated payment dates, were as follows:
(USD millions) 2017
2018 309
2019 224
2020 161
2021 131
2022 123
Thereafter 2 221
Total 3 169
expense of current year 337
Research & Development and other intangible asset purchase commitmentsThe Group has entered into long-term research and development agreements with various institutions which provide for potential milestone payments by Novartis that may be capitalized. As of December 31, 2017 the Group’s commitments to make payments under those agree-ments and other agreements to purchase intangible assets, and their estimated timing, were as follows:
Other
Research & intangible asset
Development purchase
(USD millions) commitments commitments Total
2018 780 130 910
2019 671 671
2020 864 864
2021 801 801
2022 353 353
Thereafter 837 837
Total 4 306 130 4 436

242 | Novartis Annual Report 2017
Other commitments
The Group has entered into various purchase commit-ments for services and materials as well as for equip-ment in the ordinary course of business. These commit-ments are generally entered into at current market prices and reflect normal business operations.
Contingencies
Group companies have to observe the laws, government orders and regulations of the country in which they operate.
A number of Novartis companies are, and will likely continue to be, subject to various legal proceedings and investigations that arise from time to time, including pro-ceedings regarding product liability, sales and market-ing practices, commercial disputes, employment, and wrongful discharge, antitrust, securities, health and safety, environmental, tax, international trade, privacy, and intellectual property matters. As a result, the Group may become subject to substantial liabilities that may not be covered by insurance and that could affect our business, financial position and reputation. While Novartis does not believe that any of these legal proceedings will have a material adverse effect on its financial position, litigation is inherently unpredictable and large judgments sometimes occur. As a consequence, Novartis may in the future incur judgments or enter into settlements of claims that could have a material adverse effect on its results of operations or cash flow.
Governments and regulatory authorities around the world have been stepping up their compliance and law enforcement activities in recent years in key areas, including marketing practices, pricing, corruption, trade restrictions, embargo legislation, insider trading, anti-trust, cyber security and data privacy. Further, when one government or regulatory authority undertakes an inves-tigation, it is not uncommon for other governments or regulators to undertake investigations regarding the same or similar matters. Responding to such investiga-tions is costly and requires an increasing amount of man-agement’s time and attention. In addition, such investi-gations may affect our reputation, create a risk of potential exclusion from government reimbursement programs in the United States and other countries, and may lead to (or arise from) litigation. These factors have contributed to decisions by Novartis and other co mpanies
in the healthcare industry, when deemed in their interest, to enter into settlement agreements with governmental authorities around the world prior to any formal decision by the authorities or a court. Those government settle-ments have involved and may continue to involve, in cur-rent government investigations and proceedings, large cash payments, sometimes in the hundreds of millions of dollars or more, including the potential repayment of amounts allegedly obtained improperly and other pen-alties, including treble damages. In addition, settlements of government healthcare fraud cases often require companies to enter into corporate integrity agreements, which are intended to regulate company behavior for a period of years. Our affiliate Novartis Pharmaceuticals Corporation is a party to such an agreement, which will expire in 2020. Also, matters underlying governmental investigations and settlements may be the subject of separate private litigation.
While provisions have been made for probable losses, which management deems to be reasonable or appro-priate, there are uncertainties connected with these estimates.
Note 19 contains additional information on these mat-ters.
A number of Group companies are involved in legal proceedings concerning intellectual property rights. The inherent unpredictability of such proceedings means that there can be no assurances as to their ultimate out-come. A negative result in any such proceeding could potentially adversely affect the ability of certain Novartis companies to sell their products, or require the payment of substantial damages or royalties.
In the opinion of management, however, the outcome of these actions will not materially affect the Group’s financial position but could be material to the results of operations or cash flow in a given period.
The Group’s potential environmental remediation lia-bility is assessed based on a risk assessment and inves-tigation of the various sites identified by the Group as at risk for environmental remediation exposure. The Group’s future remediation expenses are affected by a number of uncertainties. These uncertainties include, but are not limited to, the method and extent of remediation, the per-centage of material attributable to the Group at the reme-diation sites relative to that attributable to other parties, and the financial capabilities of the other potentially responsible parties.
Note 19 contains additional information on environ-mental liabilities.

Novartis Annual Report 2017 | 243FINaNcIal RepORTNotes to the Novartis Group consolidated financial statements
28. Financial instruments – additional disclosures
(USD millions) Note 2017 1 2016 1
cash and cash equivalents 15 8 860 7 007
Financial assets – measured at fair value through other comprehensive income
Available-for-sale marketable securities
Debt securities 15 328 306
Fund investments 15 34 31
Total available-for-sale marketable securities 362 337
Available-for-sale long-term financial investments
Equity securities 12 1 109 989
Fund investments 12 166 107
Total available-for-sale long-term financial investments 1 275 1 096
Total financial assets – measured at fair value through other comprehensive income 1 637 1 433
Financial assets – measured at amortized costs
Trade receivables, income tax receivables, and other current assets
(excluding contingent consideration receivables and pre-payments) 14/16 10 650 10 202
Accrued interest on debt securities and time deposits 15 1 1
Time deposits with original maturity more than 90 days 15 125 108
Long-term loans and receivables from customers and finance lease, advances, security deposits 12 574 514
Total financial assets – measured at amortized costs 11 350 10 825
Financial assets – measured at fair value through the consolidated income statement
Associated companies at fair value through profit and loss 216 188
Derivative financial instruments 15 31 230
Contingent consideration receivables 12/16 844 586
Total financial assets – measured at fair value through the consolidated income statement 1 091 1 004
Total financial assets 22 938 20 269
Financial liabilities – measured at amortized costs
Current financial debt
Interest-bearing accounts of associates payable on demand 20 1 822 1 601
Bank and other financial debt 20 692 836
Commercial paper 20 2 328 3 174
Current portion of non-current debt 20 359 178
Total current financial debt 5 201 5 789
Non-current financial debt
Straight bonds 18 22 957 17 285
Liabilities to banks and other financial institutions 18 539 708
Finance lease obligations 18 87 82
Current portion of non-current debt 18 – 359 – 178
Total non-current financial debt 23 224 17 897
Trade payables 5 169 4 873
Total financial liabilities – measured at amortized costs 33 594 28 559
Financial liabilities – measured at fair value through the consolidated income statement
Contingent consideration (see Note 19/21) and other financial liabilities 924 1 018
Derivative financial instruments 20 107 116
Total financial liabilities – measured at fair value through the consolidated income statement 1 031 1 134
Total financial liabilities 34 625 29 693
1 Except for straight bonds (see Note 18), the carrying amount is a reasonable approximation of fair value.

244 | Novartis Annual Report 2017
Derivative financial instruments
The following tables show the contract or underlying principal amounts and fair values of derivative financial instruments analyzed by type of contract at Decem-ber 31, 2017 and 2016. Contract or underlying principal
amounts indicate the gross volume of business outstand-ing at the consolidated balance sheet date and do not represent amounts at risk. The fair values are determined by reference to market prices or standard pricing mod-els that use observable market inputs at December 31, 2017 and 2016.
Contract or underlying Positive fair values Negative fair values principal amount
(USD millions) 2017 2016 2017 2016 2017 2016
currency-related instruments
Forward foreign exchange rate contracts 8 410 8 220 31 230 – 107 – 116
Total derivative financial instruments included in
marketable securities and in current financial debts 8 410 8 220 31 230 – 107 – 116
The following table shows by currency contract or underlying principal amount the derivative financial instruments at December 31, 2017 and 2016:
2017
(USD millions) EUR USD Other Total
currency-related instruments
Forward foreign exchange rate contracts 2 768 4 361 1 281 8 410
Total derivative financial instruments 2 768 4 361 1 281 8 410
2016
(USD millions) EUR USD JPY Other Total
currency-related instruments
Forward foreign exchange rate contracts 3 623 3 427 43 1 127 8 220
Total derivative financial instruments 3 623 3 427 43 1 127 8 220
Derivative financial instruments effective for hedge accounting purposesAt the end of 2017 and 2016, there were no open hedg-ing instruments for anticipated transactions.
Fair value by hierarchy
As required by IFRS, financial assets and liabilities recorded at fair value in the consolidated financial state-ments are categorized based upon the level of judgment associated with the inputs used to measure their fair value. There are three hierarchical levels, based on an increasing amount of subjectivity associated with the inputs to derive fair valuation for these assets and liabil-ities, which are as follows:
The assets carried at Level 1 fair value are equity and debt securities listed in active markets.
The assets generally included in Level 2 fair value hierarchy are foreign exchange and interest rate deriva-tives and certain debt securities. Foreign exchange and interest rate derivatives are valued using corroborated market data. The liabilities generally included in this fair value hierarchy consist of foreign exchange and interest rate derivatives.
Level 3 inputs are unobservable for the asset or lia-bility. The assets generally included in Level 3 fair value hierarchy are various investments in hedge funds and unquoted equity security investments. Contingent con-sideration carried at fair value is included in this cate-gory.

Novartis Annual Report 2017 | 245FINaNcIal RepORTNotes to the Novartis Group consolidated financial statements
2017
Valued at
(USD millions) Level 1 Level 2 Level 3 amortized cost Total
Financial assets
Debt securities 303 25 328
Fund investments 34 34
Total available-for-sale marketable securities 337 25 362
Time deposits with original maturity more than 90 days 125 125
Derivative financial instruments 31 31
Accrued interest on debt securities 1 1
Total marketable securities, time deposits and derivative financial instruments 337 56 126 519
Available-for-sale financial investments 672 437 1 109
Fund investments 166 166
Contingent consideration receivables 394 394
Long-term loans and receivables from customers
and finance lease, advances, security deposits 574 574
Financial investments and long-term loans 672 997 574 2 243
associated companies at fair value through profit and loss 28 188 216
contingent consideration receivables short-term 450 450
Financial liabilities
Contingent consideration payables – 852 – 852
Other financial liabilities – 72 – 72
Derivative financial instruments – 107 – 107
Total financial liabilities at fair value – 107 – 924 – 1 031
2016
Valued at
(USD millions) Level 1 Level 2 Level 3 amortized cost Total
Financial assets
Debt securities 284 22 306
Fund investments 31 31
Total available-for-sale marketable securities 315 22 337
Time deposits with original maturity more than 90 days 108 108
Derivative financial instruments 230 230
Accrued interest on debt securities 1 1
Total marketable securities, time deposits and derivative financial instruments 315 252 109 676
Available-for-sale financial investments 513 476 989
Fund investments 107 107
Contingent consideration receivables 586 586
Long-term loans and receivables from customers
and finance lease, advances, security deposits 514 514
Financial investments and long-term loans 513 1 169 514 2 196
associated companies at fair value through profit and loss 188 188
Financial liabilities
Contingent consideration payables – 889 – 889
Other financial liabilities – 129 – 129
Derivative financial instruments – 116 – 116
Total financial liabilities at fair value – 116 – 1 018 – 1 134
The analysis above includes all financial instruments including those measured at amortized cost or at cost.

246 | Novartis Annual Report 2017
The change in carrying values associated with Level 3 financial instruments using significant unobservable inputs during the year ended December 31 are set forth below:
2017
Associated Available-
companies at for-sale Contingent Contingent Other
fair value through Fund financial consideration consideration financial
(USD millions) profit and loss investments investments receivables payables liabilities
January 1 188 107 476 586 – 889 – 129
Fair value gains and other adjustments,
including from divestments recognized
in the consolidated income statement 45 32 278 362
Fair value losses (including impairments and
amortizations) and other adjustments recognized
in the consolidated income statement – 34 – 45 – 193 – 37
Fair value adjustments recognized in the consolidated statement
of comprehensive income 45 – 40
Purchases 37 28 113 – 238
Cash receipts and payments – 20 106 94
Disposals – 19 – 18 – 52
Reclassification – 29 4 – 47
December 31 188 166 437 844 – 852 – 72
Total of fair value gains and losses recognized
in the consolidated income statement for assets
and liabilities held at December 31, 2017 11 0 – 13 278 169 – 37
2016
Associated Available-
companies at for-sale Contingent Contingent Other
fair value through Fund financial consideration consideration financial
(USD millions) profit and loss investments investments receivables payables liabilities
January 1 181 94 473 550 – 790 – 315
Fair value gains and other adjustments,
including from divestments recognized
in the consolidated income statement 26 1 51 3
Fair value losses (including impairments and
amortizations) and other adjustments recognized
in the consolidated income statement – 28 – 1 – 24 – 156
Fair value adjustments recognized in the consolidated statement
of comprehensive income 14 – 8
Purchases 41 5 122 – 172
Cash receipts and payments – 15 229 183
Disposals – 3 – 5 – 18
Reclassification – 29 – 70
December 31 188 107 476 586 – 889 – 129
Total of fair value gains and losses recognized
in the consolidated income statement for assets
and liabilities held at December 31, 2016 – 2 – 1 – 23 51 – 156 3
During 2017, there were several individually non-signifi-cant transfers of available-for-sale financial investments from Level 3 to Level 1 for USD 73 million (2016: USD 75 million) mainly due to Initial Public Offerings of the invested companies.
Realized gains and losses associated with Level 3 available-for-sale marketable securities are recorded in the consolidated income statement under “Other finan-cial income and expense” and realized gains and losses associated with Level 3 available-for-sale financial
investments are recorded in the consolidated income statement under “Other income” or “Other expense”, respectively.
If the pricing parameters for the Level 3 input were to change for associated companies at fair value through profit and loss, equity securities, fund investments and available-for-sale financial investments by 10% positively or negatively, this would change the amounts recorded in the 2017 consolidated statement of comprehensive income by USD 79 million.

Novartis Annual Report 2017 | 247FINaNcIal RepORTNotes to the Novartis Group consolidated financial statements
For the determination of the fair value of a contingent consideration various unobservable inputs are used. A change in these inputs might result in a significantly higher or lower fair value measurement. The inputs used are, among others, the probability of success, sales fore-cast and assumptions regarding the discount rate, tim-ing and different scenarios of triggering events. The inputs are interrelated. The significance and usage of these inputs to each contingent consideration may vary due to differences in the timing and triggering events for payments or in the nature of the asset related to the con-tingent consideration.
If the most significant parameters for the Level 3 input were to change by 10% positively or negatively, or where the probability of success (POS) is the most significant input parameter 10% were added or deducted from the applied probability of success, for contingent consider-ation payables, other financial liabilities and contingent consideration receivables, this would change the amounts recorded in the 2017 consolidated income statement by USD 333 million and USD 322 million, respectively.
Nature and extent of risks arising from financial instrumentsMarket riskNovartis is exposed to market risk, primarily related to foreign currency exchange rates, interest rates and the market value of the investments of liquid funds. The Group actively monitors and seeks to reduce, where it deems it appropriate to do so, fluctuations in these expo-sures. It is the Group’s policy and practice to enter into a variety of derivative financial instruments to manage the volatility of these exposures and to enhance the yield on the investment of liquid funds. It does not enter into any financial transactions containing a risk that cannot be quantified at the time the transaction is concluded. In addition, it does not sell short assets it does not have, or does not know it will have, in the future. The Group only sells existing assets or enters into transactions and future transactions (in the case of anticipatory hedges) that it confidently expects it will have in the future, based on past experience. In the case of liquid funds, the Group writes call options on assets it has, or writes put options on positions it wants to acquire and has the liquidity to acquire. The Group expects that any loss in value for these instruments generally would be offset by increases in the value of the underlying transactions.
Foreign currency exchange rate riskThe Group uses the US dollar as its reporting currency. As a result, the Group is exposed to foreign currency exchange movements, primarily in European, Japanese and emerging market currencies. Fluctuations in the exchange rates between the US dollar and other curren-cies can have a significant effect on both the Group’s results of operations, including reported sales and earn-
ings, as well as on the reported value of our assets, lia-bilities and cash flows. This, in turn, may significantly affect the comparability of period-to-period results of operations.
Because our expenditures in Swiss francs are sig-nificantly higher than our revenues in Swiss francs, vol-atility in the value of the Swiss franc can have a signifi-cant impact on the reported value of our earnings, assets and liabilities, and the timing and extent of such volatility can be difficult to predict. In addition, there is a risk that certain countries could take other steps that could sig-nificantly impact the value of their currencies.
The Group is exposed to a potential adverse devalu-ation risk on its intercompany funding and total invest-ment in certain subsidiaries operating in countries with exchange controls. The most significant foreign exchange losses (USD 0.3 billion) occurred in Venezuela in 2016. The net outstanding intercompany payable balance of Venezuela subsidiaries was not significant at December 31, 2017 and at December 31, 2016, due to reserves against the intercompany balances.
The Group manages its global currency exposure by engaging in hedging transactions where management deems appropriate. Novartis may enter into various con-tracts that reflect the changes in the value of foreign cur-rency exchange rates to preserve the value of assets, commitments and anticipated transactions. Novartis also uses forward contracts and foreign currency option con-tracts to hedge.
Net investments in subsidiaries in foreign countries are long-term investments. Their fair value changes through movements of foreign currency exchange rates. The Group has designated a certain portion of its long-term euro-denominated straight bonds as hedges of the translation risk arising on certain of these net invest-ments in foreign operations with euro functional cur-rency. As of December 31, 2017, long-term financial debt with a carrying amount of EUR 1.8 billion (USD 2.2 billion) has been designated as a hedge instrument. During 2017, USD 237 million of unrealized loss was recognized in other comprehensive income and accumulated in cur-rency translation effects in relation with this net invest-ment hedge. The hedge remained effective since incep-tion, and no amount was recognized in the consolidated income statement in 2017. During 2016 and 2015, the Group did not apply net investment hedge accounting.
Commodity price riskThe Group has only a very limited exposure to price risk related to anticipated purchases of certain commodities used as raw materials by the Group’s businesses. A change in those prices may alter the gross margin of a specific business, but generally by not more than 10% of the margin and thus below the Group’s risk management tolerance levels. Accordingly, the Group does not enter into significant commodity futures, forward and option contracts to manage fluctuations in prices of anticipated purchases.

248 | Novartis Annual Report 2017
Interest rate riskThe Group addresses its net exposure to interest rate risk mainly through the ratio of its fixed-rate financial debt to variable rate financial debt contained in its total financial debt portfolio. To manage this mix, Novartis may enter into interest rate swap agreements, in which it exchanges periodic payments based on a notional amount and agreed-upon fixed and variable interest rates.
Equity riskThe Group may purchase equities as investments of its liquid funds. As a policy, it limits its holdings in an unre-lated company to less than 5% of its liquid funds. Poten-tial investments are thoroughly analyzed. Call options are written on equities that the Group owns, and put options are written on equities that the Group wants to buy and for which cash is available.
Credit riskCredit risks arise from the possibility that customers may not be able to settle their obligations as agreed. To man-age this risk, the Group periodically assesses country and customer credit risk, assigns individual credit limits, and takes actions to mitigate credit risk where appropri-ate.
The Group’s largest customer accounted for approx-imately 17% of net sales, and the second-largest and third-largest customers accounted for 12% and 7% of net sales, respectively (2016: 16%, 12% and 6%, respec-tively; 2015: 14%, 11% and 5%, respectively). No other customer accounted for 5% or more of net sales in either year.
The highest amounts of trade receivables outstand-ing were for these same three customers and amounted to 14%, 9% and 5%, respectively, of the Group’s trade receivables at December 31, 2017 (2016: 14%, 9% and 6%, respectively). There is no other significant concen-tration of customer credit risk.
Counterparty riskCounterparty risk encompasses issuer risk on market-able securities and money market instruments, credit risk on cash, time deposits and derivatives, as well as settlement risk for different instruments. Issuer risk is reduced by only buying securities that are at least A- rated. Counterparty credit risk and settlement risk are reduced by a policy of entering into transactions with
counterparties (banks or financial institutions) that fea-ture a strong credit rating. Exposure to these risks is closely monitored and kept within predetermined param-eters. The limits are regularly assessed and determined based upon credit analysis, including financial statement and capital adequacy ratio reviews. In addition, reverse repurchasing agreements are contracted and Novartis has entered into credit support agreements with various banks for derivative transactions.
The Group’s cash and cash equivalents are held with major regulated financial institutions, the three largest ones hold approximately 20.2%, 15.0% and 12.7%, respectively (2016: 16.5%, 6.9% and 6.7%, respectively).
The Group does not expect any losses from non-per-formance by these counterparties and does not have any significant grouping of exposures to financial sector or country risk.
Liquidity riskLiquidity risk is defined as the risk that the Group could not be able to settle or meet its obligations on time or at a reasonable price. Group Treasury is responsible for liquidity, funding and settlement management. In addi-tion, liquidity and funding risks, and related processes and policies, are overseen by management. Novartis manages its liquidity risk on a consolidated basis accord-ing to business needs, tax, capital or regulatory consid-erations, if applicable, through numerous sources of financing in order to maintain flexibility. Management monitors the Group’s net debt or liquidity position through rolling forecasts on the basis of expected cash flows.
Novartis has two United States commercial paper programs under which it can issue up to USD 9.0 billion in the aggregate of unsecured commercial paper notes. Novartis also has a Japanese commercial paper program under which it can issue up to JPY 150 billion (approxi-mately USD 1.3 billion) of unsecured commercial paper notes. Commercial paper notes totaling USD 2.3 billion under these three programs were outstanding as per December 31, 2017 (2016: USD 3.2 billion). Novartis fur-ther has a committed credit facility of USD 6.0 billion, entered into on September 23, 2015. This credit facility is provided by a syndicate of banks and is intended to be used as a backstop for the United States commercial paper programs. It matures in September 2020 and was undrawn as per December 31, 2017 and December 31, 2016.

Novartis Annual Report 2017 | 249FINaNcIal RepORTNotes to the Novartis Group consolidated financial statements
The following table sets forth how management monitors net debt or liquidity based on details of the remaining contractual maturities of current financial assets and liabilities excluding trade receivables and payables as well as contingent considerations at December 31, 2017 and December 31, 2016:
2017
Due later than Due later than Due later than
one month three months one year
Due within but less than but less than but less than Due after
(USD millions) one month three months one year five years five years Total
current assets
Marketable securities and time deposits 71 72 105 181 58 487
Commodities 106 106
Derivative financial instruments and accrued interest 7 19 6 32
Cash and cash equivalents 4 260 4 600 8 860
Total current financial assets 4 338 4 691 111 181 164 9 485
Non-current liabilities
Financial debt – 9 849 – 13 375 – 23 224
Financial debt – undiscounted – 9 893 – 13 519 – 23 412
Total non-current financial debt – 9 849 – 13 375 – 23 224
current liabilities
Financial debt – 4 576 – 169 – 456 – 5 201
Financial debt – undiscounted – 4 576 – 169 – 456 – 5 201
Derivative financial instruments – 31 – 48 – 28 – 107
Total current financial debt – 4 607 – 217 – 484 – 5 308
Net debt – 269 4 474 – 373 – 9 668 – 13 211 – 19 047
2016
Due later than Due later than Due later than
one month three months one year
Due within but less than but less than but less than Due after
(USD millions) one month three months one year five years five years Total
current assets
Marketable securities and time deposits 32 126 110 124 53 445
Commodities 94 94
Derivative financial instruments and accrued interest 38 102 91 231
Cash and cash equivalents 5 907 1 100 7 007
Total current financial assets 5 977 1 328 201 124 147 7 777
Non-current liabilities
Financial debt – 5 141 – 12 756 – 17 897
Financial debt – undiscounted – 5 155 – 12 901 – 18 056
Total non-current financial debt – 5 141 – 12 756 – 17 897
current liabilities
Financial debt – 5 099 – 250 – 440 – 5 789
Financial debt – undiscounted – 5 099 – 250 – 440 – 5 789
Derivative financial instruments – 15 – 72 – 29 – 116
Total current financial debt – 5 114 – 322 – 469 – 5 905
Net debt 863 1 006 – 268 – 5 017 – 12 609 – 16 025
The consolidated balance sheet amounts of financial lia-bilities included in the above analysis are not materially different to the contractual amounts due on maturity. The
positive and negative fair values on derivative financial instruments represent the net contractual amounts to be exchanged at maturity.

250 | Novartis Annual Report 2017
The Group’s contractual undiscounted potential cash flows from derivative financial instruments to be settled on a gross basis are as follows:
2017
Due later than Due later than
one month three months
Due within but less than but less than
(USD millions) one month three months one year Total
Derivative financial instruments and accrued interest on derivative
financial instruments
Potential outflows in various currencies – from financial derivative liabilities – 953 – 972 – 2 824 – 4 749
Potential inflows in various currencies – from financial derivative assets 928 948 2 778 4 654
2016
Due later than Due later than
one month three months
Due within but less than but less than
(USD millions) one month three months one year Total
Derivative financial instruments and accrued interest on derivative
financial instruments
Potential outflows in various currencies – from financial derivative liabilities – 1 087 – 1 246 – 2 027 – 4 360
Potential inflows in various currencies – from financial derivative assets 1 109 1 287 2 051 4 447
Other contractual liabilities that are not part of management’s monitoring of the net debt or liquidity consist of the following items:
2017
Due later than Due later than Due later than
one month three months one year
but less than but less than but less than Due after
(USD millions) three months one year five years five years Total
Contractual interest on non-current liabilities – 113 – 507 – 1 765 – 3 859 – 6 244
Trade payables – 5 169 – 5 169
2016
Due later than Due later than Due later than
one month three months one year
but less than but less than but less than Due after
(USD millions) three months one year five years five years Total
Contractual interest on non-current liabilities – 104 – 433 – 1 694 – 4 015 – 6 246
Trade payables – 4 873 – 4 873
Capital risk management
Novartis strives to maintain a strong credit rating. In man-aging its capital, Novartis focuses on maintaining a strong balance sheet. Moody’s rated the Group as Aa3 for long-term maturities and as P-1 for short-term matur-ities and Standard & Poor’s had a rating of AA- for long-term maturities and A-1+ for short-term maturities. Fitch had a long-term rating of AA and a short-term rating of F1+.
The debt/equity ratio increased to 0.38:1 at December 31, 2017, compared to 0.32:1 at the beginning of the year.
Value at risk
The Group uses a value at risk (VAR) computation to esti-mate the potential ten-day loss in the fair value of its financial instruments.
A ten-day period is used because of an assumption that not all positions could be undone in one day given the size of the positions. The VAR computation includes all financial assets and financial liabilities as set forth in the table on page 243, except trade receivables, income tax receivables and other current assets, contingent considerations, finance lease obligations, long-term loans and receivables from customers and finance lease, advances and security deposits and trade payables.

Novartis Annual Report 2017 | 251FINaNcIal RepORTNotes to the Novartis Group consolidated financial statements
The VAR estimates are made assuming normal mar-ket conditions, using a 95% confidence interval. The Group uses a “Delta Normal” model to determine the observed interrelationships between movements in inter-est rates, stock markets and various currencies. These inter-relationships are determined by observing interest rate, stock market movements and forward foreign cur-rency rate movements over a sixty-day period for the calculation of VAR amounts.
The estimated potential ten-day loss in the fair value of the Group’s foreign currency positions (including for-eign exchange translation risk), the estimated potential ten-day loss of its equity holdings, and the estimated potential ten-day loss in fair value of its interest rate sen-sitive instruments (primarily financial debt and invest-ments of liquid funds under normal market conditions) as calculated in the VAR model are the following:
(USD millions) 2017 2016
All financial instruments 498 541
Analyzed by components:
Instruments sensitive to foreign
currency exchange rates 184 222
Instruments sensitive to equity
market movements 27 26
Instruments sensitive to interest rates 242 328
The average, high, and low VAR amounts are as follows:
2017
(USD millions) Average High Low
All financial instruments 521 560 466
Analyzed by components:
Instruments sensitive to foreign
currency exchange rates 277 352 184
Instruments sensitive to equity
market movements 28 35 21
Instruments sensitive to
interest rates 282 338 219
2016
(USD millions) Average High Low
All financial instruments 402 541 316
Analyzed by components:
Instruments sensitive to foreign
currency exchange rates 203 245 147
Instruments sensitive to equity
market movements 50 99 26
Instruments sensitive to
interest rates 308 407 234
The VAR computation is a risk analysis tool designed to statistically estimate the potential ten-day loss from adverse movements in foreign currency exchange rates, equity prices and interest rates under normal market conditions. The computation does not purport to repre-sent actual losses in fair value on earnings to be incurred by the Group, nor does it consider the effect of favorable changes in market rates. The Group cannot predict actual future movements in such market rates and it does not claim that these VAR results are indicative of future movements in such market rates or are representative of any actual impact that future changes in market rates may have on the Group’s future results of operations or financial position.
In addition to these VAR analyses, the Group uses stress testing techniques that aim to reflect a worst case scenario on the marketable securities that are monitored by Group Treasury. For these calculations, the Group uses the six-month period with the worst performance observed over the past twenty years in each category. For 2017 and 2016, the worst case loss scenario was calculated as follows:
(USD millions) 2017 2016
All financial instruments 7 6
Analyzed by components:
Instruments sensitive to foreign
currency exchange rates
Instruments sensitive to equity
market movements
Instruments sensitive to
interest rates 7 6
In the Group’s risk analysis, Novartis considered this worst case scenario acceptable as it could reduce income, but would not endanger the solvency or invest-ment grade credit rating of the Group.

252 | Novartis Annual Report 2017
29. Discontinued operations
Discontinued operations consolidated income statement segmentation
2015
Corporate Total
Consumer (including discontinued
(USD millions) Vaccines Health1 eliminations) operations
Net sales to third parties of discontinued operations 145 456 601
Sales to continuing segments 18 1 19
Net sales of discontinued operations 163 457 620
Other revenues 18 5 23
Cost of goods sold – 192 – 184 – 376
Gross profit of discontinued operations – 11 278 267
Marketing & Sales – 57 – 187 – 244
Research & Development – 151 – 30 – 181
General & Administration – 26 – 32 – 58
Other income 2 870 10 558 – 8 13 420
Other expense – 57 – 14 – 656 – 727
Operating income of discontinued operations 2 568 10 573 – 664 12 477
Income from associated companies 2 2
Income before taxes of discontinued operations 12 479
Taxes – 1 713
Net income of discontinued operations 10 766
1 Consumer Health is the aggregation of the former OTC and Animal Health divisions.
The following are included in net income from discontinued operations:
(USD millions) 2015
Impairment charges on property, plant & equipment, net 83
Additions to restructuring provisions – 1
Equity-based compensation of Novartis equity plans – 65
30. events subsequent to the December 31, 2017 consolidated balance sheet dateSignificant transaction closed in January 2018 For significant transaction entered into in 2017 and closed in 2018, see Note 2.
Dividend proposal for 2017 and approval of the Group’s 2017 consolidated financial statementsOn January 23, 2018, the Novartis AG Board of Direc-tors proposed the acceptance of the 2017 consolidated financial statements of the Novartis Group for approval
by the Annual General Meeting on March 2, 2018. Fur-thermore, also on January 23, 2018, the Board proposed a dividend of CHF 2.80 per share to be approved at the Annual General Meeting on March 2, 2018. If approved, total dividend payments would amount to approximately USD 6.7 billion (2016: USD 6.5 billion) using the CHF/USD December 31, 2017 exchange rate.

Novartis Annual Report 2017 | 253FINaNcIal RepORTNotes to the Novartis Group consolidated financial statements
31. principal Group subsidiaries and associated companiesThe following table lists the principal subsidiaries controlled by Novartis and associated companies in which Novartis is deemed to have significant influence. It includes all subsidiaries and associated companies with Total assets or Net sales to third parties in excess of USD 25 million. The equity interest percentage shown in the table also rep-resents the share in voting rights in those entities, except where explicitly noted.
Share Equity
As at December 31, 2017 capital 1 interest
algeria
Société par actions SANDOZ, Algiers DZD 650.0 m 100%
argentina
Novartis Argentina S.A., Buenos Aires ARS 906.1 m 100%
Alcon Laboratorios S.A., Buenos Aires ARS 83.9 m 100%
australia
Novartis Australia Pty Ltd, North Ryde, NSW AUD 2 100%
Novartis Pharmaceuticals Australia Pty Ltd, North Ryde, NSW AUD 3.8 m 100%
Sandoz Pty Ltd, North Ryde, NSW AUD 11.6 m 100%
Alcon Laboratories (Australia) Pty Ltd, Frenchs Forest, NSW AUD 2.6 m 100%
austria
Novartis Austria GmbH, Vienna EUR 1.0 m 100%
Novartis Pharma GmbH, Vienna EUR 1.1 m 100%
Sandoz GmbH, Kundl EUR 32.7 m 100%
EBEWE Pharma Ges.m.b.H Nfg. KG, Unterach am Attersee EUR 1.0 m 100%
Bangladesh
Novartis (Bangladesh) Limited, Gazipur BDT 162.5 m 60%
Belgium
N.V. Novartis Pharma S.A., Vilvoorde EUR 7.1 m 100%
N.V. Sandoz S.A., Vilvoorde EUR 19.2 m 100%
S.A. Alcon-Couvreur N.V., Puurs EUR 110.6 m 100%
N.V. Alcon S.A., Vilvoorde EUR 141 856 100%
Bermuda
Novartis Investment Ltd., Hamilton USD 12 000 100%
Novartis Securities Investment Ltd., Hamilton CHF 30 000 100%
Novartis Finance Services Ltd., Hamilton CHF 20 000 100%
Novartis B2 Ltd., Hamilton USD 12 000 100%
Novartis B3 Ltd., Hamilton USD 106 400 100%
Triangle International Reinsurance Limited, Hamilton CHF 1.0 m 100%
Trinity River Insurance Co Ltd., Hamilton USD 370 000 100%
Brazil
Novartis Biociências S.A., São Paulo BRL 265.0 m 100%
Sandoz do Brasil Indústria Farmacêutica Ltda., Cambé, PR BRL 190.0 m 100%
canada
Novartis Pharmaceuticals Canada Inc., Dorval, Quebec CAD 13.0 m 100%
Sandoz Canada Inc., Boucherville, Quebec CAD 80.8 m 100%
Alcon Canada Inc., Mississauga, Ontario CAD 2 500 100%
CIBA Vision Canada Inc., Mississauga, Ontario CAD 82 886 100%
chile
Novartis Chile S.A., Santiago de Chile CLP 2.0 bn 100%
Alcon Laboratorios Chile Ltd., Santiago de Chile CLP 2.0 bn 100%
china
Beijing Novartis Pharma Co., Ltd., Beijing USD 30.0 m 100%
Novartis Pharmaceuticals (HK) Limited, Hong Kong HKD 200 100%
China Novartis Institutes for
BioMedical Research Co., Ltd., Shanghai USD 320.0 m 100%
Suzhou Novartis Pharma Technology Co., Ltd., Changshu USD 103.4 m 100%
Shanghai Novartis Trading Ltd., Shanghai USD 3.2 m 100%
Sandoz (China) Pharmaceutical Co., Ltd., Zhongshan USD 36.5 m 100%
Alcon Hong Kong Limited, Hong Kong HKD 77 000 100%
Alcon (China) Ophthalmic Product Co., Ltd., Beijing USD 60.0 m 100%
colombia
Novartis de Colombia S.A., Santafé de Bogotá COP 7.9 bn 100%
Laboratorios Alcon de Colombia S.A., Santafé de Bogotá COP 20.9 m 100%
croatia
Sandoz d.o.o. farmaceutska industrija, Zagreb HRK 25.6 m 100%
czech Republic
Novartis s.r.o., Prague CZK 51.5 m 100%
Sandoz s.r.o., Prague CZK 44.7 m 100%
Alcon Pharmaceuticals (Czech Republic) s.r.o., Prague CZK 31.0 m 100%
Denmark
Novartis Healthcare A/S, Copenhagen DKK 14.0 m 100%
Sandoz A/S, Copenhagen DKK 12.0 m 100%
Alcon Nordic A/S, Copenhagen DKK 0.5 m 100%
ecuador
Novartis Ecuador S.A., Quito USD 4.0 m 100%
egypt
Novartis Pharma S.A.E., Cairo EGP 193.8 m 99.77%
Sandoz Egypt Pharma S.A.E., New Cairo City EGP 250 000 100%
Finland
Novartis Finland Oy, Espoo EUR 459 000 100%
Share Equity
As at December 31, 2017 capital 1 interest
France
Novartis Groupe France S.A., Rueil-Malmaison EUR 103.0 m 100%
Novartis Pharma S.A.S., Rueil-Malmaison EUR 43.4 m 100%
Sandoz S.A.S., Levallois-Perret EUR 5.4 m 100%
Laboratoires Alcon S.A.S., Rueil-Malmaison EUR 12.9 m 100%
Germany
Novartis Deutschland GmbH, Wehr EUR 155.5 m 100%
Novartis Business Services GmbH, Wehr EUR 25 000 100%
Novartis Pharma GmbH, Nuremberg EUR 25.6 m 100%
Novartis Pharma Produktions GmbH, Wehr EUR 2.0 m 100%
Sandoz International GmbH, Holzkirchen EUR 100 000 100%
1 A Pharma GmbH, Oberhaching EUR 26 000 100%
HEXAL AG, Holzkirchen EUR 93.7 m 100%
Salutas Pharma GmbH, Barleben EUR 42.1 m 100%
Aeropharm GmbH, Rudolstadt EUR 26 000 100%
Alcon Pharma GmbH, Freiburg im Breisgau EUR 512 000 100%
CIBA Vision GmbH, Grosswallstadt EUR 15.4 m 100%
WaveLight GmbH, Erlangen EUR 6.6 m 100%
Gibraltar
Novista Insurance Limited, Gibraltar City CHF 130.0 m 100%
Greece
Novartis (Hellas) S.A.C.I., Metamorphosis/Athens EUR 23.4 m 100%
Alcon Laboratories Hellas-
Commercial and Industrial S.A., Maroussi, Athens EUR 5.7 m 100%
Hungary
Novartis Hungary Healthcare Limited Liability
Company, Budapest HUF 545.6 m 100%
Sandoz Hungary Limited Liability Company, Budapest HUF 883.0 m 100%
India
Novartis India Limited, Mumbai INR 140.7 m 73.4%
Novartis Healthcare Private Limited, Mumbai INR 60.0 m 100%
Sandoz Private Limited, Mumbai INR 32.0 m 100%
Alcon Laboratories (India) Private Limited, Bangalore INR 1.1 bn 100%
Indonesia
PT. Novartis Indonesia, Jakarta IDR 7.7 bn 100%
PT. CIBA Vision Batam, Batam IDR 11.9 bn 100%
Ireland
Novartis Ireland Limited, Dublin EUR 25 000 100%
Novartis Ringaskiddy Limited, Ringaskiddy, County Cork EUR 2.0 m 100%
Alcon Laboratories Ireland Limited, Cork City EUR 541 251 100%
Israel
Novartis Israel Ltd., Petach Tikva ILS 1 000 100%
Optonol Ltd., Neve-Ilan ILS 752 545 100%
Italy
Novartis Farma S.p.A., Origgio EUR 18.2 m 100%
Sandoz S.p.A., Origgio EUR 1.7 m 100%
Sandoz Industrial Products S.p.A., Rovereto EUR 2.6 m 100%
Alcon Italia S.p.A., Milan EUR 3.7 m 100%
Japan
Novartis Holding Japan K.K., Tokyo JPY 10.0 m 100%
Novartis Pharma K.K., Tokyo JPY 6.0 bn 100%
Ciba-Geigy Japan Limited, Tokyo JPY 8.5 m 100%
Sandoz K.K., Tokyo JPY 100.0 m 100%
Alcon Japan Ltd., Tokyo JPY 500.0 m 100%
luxembourg
Novartis Investments S.à r.l., Luxembourg-Ville USD 100.0 m 100%
Novartis Finance S.A., Luxembourg-Ville USD 100 000 100%
Malaysia
Novartis Corporation (Malaysia) Sdn. Bhd., Kuala Lumpur MYR 3.3 m 100%
Alcon Laboratories (Malaysia) Sdn. Bhd., Petaling Jaya MYR 1.0 m 100%
CIBA Vision Johor Sdn. Bhd., Kuala Lumpur MYR 10.0 m 100%
Mexico
Novartis Farmacéutica, S.A. de C.V., Mexico City MXN 205.0 m 100%
Sandoz, S.A. de C.V., Mexico City MXN 468.2 m 100%
Alcon Laboratorios, S.A. de C.V., Mexico City MXN 5.9 m 100%
Morocco
Novartis Pharma Maroc SA, Casablanca MAD 80.0 m 100%
Netherlands
Novartis Netherlands B.V., Arnhem EUR 1.4 m 100%
Novartis Pharma B.V., Arnhem EUR 4.5 m 100%
Sandoz B.V., Almere EUR 907 560 100%
Alcon Nederland B.V., Arnhem EUR 18 151 100%
New Zealand
Novartis New Zealand Ltd, Auckland NZD 820 000 100%

254 | Novartis Annual Report 2017
Share Equity
As at December 31, 2017 capital 1 interest
Norway
Novartis Norge AS, Oslo NOK 1.5 m 100%
pakistan
Novartis Pharma (Pakistan) Limited, Karachi PKR 3.9 bn 99.99%
panama
Novartis Pharma (Logistics), Inc., Panama City USD 10 000 100%
Alcon Centroamerica S.A., Panama City PAB 1 000 100%
philippines
Novartis Healthcare Philippines, Inc., Manila PHP 298.8 m 100%
Sandoz Philippines Corporation, Manila PHP 30.0 m 100%
poland
Novartis Poland Sp. z o.o., Warszawa PLN 44.2 m 100%
Sandoz Polska Sp. z o.o., Warszawa PLN 25.6 m 100%
Lek S.A., Strykow PLN 11.4 m 100%
Alcon Polska Sp. z o.o., Warszawa PLN 750 000 100%
portugal
Novartis Portugal SGPS Lda., Porto Salvo EUR 500 000 100%
Novartis Farma – Produtos Farmacêuticos S.A., Porto Salvo EUR 2.4 m 100%
Sandoz Farmacêutica Lda., Porto Salvo EUR 499 900 100%
Alcon Portugal-Produtos e
Equipamentos Oftalmológicos Lda., Porto Salvo EUR 4.5 m 100%
Romania
Novartis Pharma Services Romania S.R.L., Bucharest RON 3.0 m 100%
Sandoz S.R.L., Targu-Mures RON 105.2 m 100%
Alcon Romania S.R.L., Bucharest RON 10.8 m 100%
Russian Federation
Novartis Pharma LLC, Moscow RUB 20.0 m 100%
Novartis Neva LLC, St. Petersburg RUB 1.3 bn 100%
ZAO Sandoz, Moscow RUB 57.4 m 100%
Alcon Farmacevtika LLC, Moscow RUB 44.1 m 100%
Saudi arabia
Saudi Pharmaceutical Distribution Co. Ltd., Riyadh SAR 26.8 m 75%
Singapore
Novartis (Singapore) Pte Ltd., Singapore SGD 100 000 100%
Novartis Singapore Pharmaceutical
Manufacturing Pte Ltd, Singapore SGD 45.0 m 100%
Novartis Asia Pacific Pharmaceuticals Pte Ltd, Singapore SGD 39.0 m 100%
Novartis Institute for Tropical Diseases Pte Ltd, Singapore SGD 2 004 100%
Alcon Pte Ltd, Singapore SGD 164 000 100%
Alcon Singapore Manufacturing Pte Ltd, Singapore SGD 101 000 100%
CIBA Vision Asian Manufacturing and
Logistics Pte Ltd., Singapore SGD 1.0 m 100%
Slovakia
Novartis Slovakia s.r.o., Bratislava EUR 2.0 m 100%
Slovenia
Lek Pharmaceuticals d.d., Ljubjana EUR 48.4 m 100%
Sandoz Pharmaceuticals d.d., Ljubjana EUR 1.5 m 100%
South africa
Novartis South Africa (Pty) Ltd, Midrand ZAR 86.3 m 100%
Sandoz South Africa (Pty) Ltd, Kempton Park ZAR 3.0 m 100%
Alcon Laboratories (South Africa) (Pty) Ltd., Midrand ZAR 201 820 100%
South Korea
Novartis Korea Ltd., Seoul KRW 24.5 bn 98.55%
Sandoz Korea Ltd., Seoul KRW 17.8 bn 100%
Alcon Korea Ltd., Seoul KRW 33.8 bn 100%
Spain
Novartis Farmacéutica S.A., Barcelona EUR 63.0 m 100%
Sandoz Farmacéutica S.A., Madrid EUR 270 450 100%
Sandoz Industrial Products
S.A., Les Franqueses del Vallés / Barcelona EUR 9.3 m 100%
Alcon Cusi S.A., Barcelona EUR 11.6 m 100%
Abadia Retuerta S.A., Sardón de Duero/Valladolid EUR 6.0 m 100%
Sweden
Novartis Sverige AB, Täby / Stockholm SEK 5.0 m 100%
Switzerland
Novartis International AG, Basel CHF 10.0 m 100%
Novartis Holding AG, Basel CHF 100.2 m 100%
Novartis International Pharmaceutical Investment AG, Basel CHF 100 000 100%
Novartis Bioventures AG, Basel CHF 100 000 100%
Novartis Forschungsstiftung, Basel -- -- 100%
Novartis Stiftung für Kaderausbildung, Basel -- -- 100%
Novartis Mitarbeiterbeteiligungsstiftung, Basel -- -- 100%
Novartis Stiftung für Mensch und Umwelt, Basel -- -- 100%
Stiftung der Novartis AG für Erziehung,
Ausbildung und Bildung, Basel -- -- 100%
Novartis Pharma AG, Basel CHF 350.0 m 100%
Novartis International Pharmaceutical AG, Basel CHF 100 000 100%
Novartis Pharma Services AG, Basel CHF 20.0 m 100%
Novartis Pharma Schweizerhalle AG, Muttenz CHF 18.9 m 100%
Novartis Pharma Stein AG, Stein CHF 251 000 100%
Novartis Pharma Schweiz AG, Risch CHF 5.0 m 100%
Sandoz AG, Basel CHF 5.0 m 100%
Sandoz Pharmaceuticals AG, Risch CHF 100 000 100%
Alcon Switzerland SA, Risch CHF 100 000 100%
Alcon Pharmaceuticals Ltd., Fribourg CHF 200 000 100%
Roche Holding AG, Basel CHF 160.0 m 33/6 2
Share Equity
As at December 31, 2017 capital 1 interest
Taiwan
Novartis (Taiwan) Co., Ltd., Taipei TWD 170.0 m 100%
Thailand
Novartis (Thailand) Limited, Bangkok THB 302.0 m 100%
Alcon Laboratories (Thailand) Limited, Bangkok THB 228.1 m 100%
Turkey
Novartis Saglik, Gida ve Tarim Ürünleri Sanayi
ve Ticaret A.S., Istanbul TRY 98.0 m 100%
Farmanova Saglik Hizmetleri Ltd. Sti., Istanbul TRY 6.7 m 100%
Sandoz Ilaç Sanayi ve Ticaret A.S., Istanbul TRY 165.2 m 99.99%
Sandoz Syntek Ilaç Hammaddeleri
Sanayi ve Ticaret A.S., Istanbul TRY 46.0 m 100%
Sandoz Grup Saglik Ürünleri
Ilaçlari Sanayi ve Ticaret A.S., Gebze – Kocaeli TRY 50.0 m 100%
Alcon Laboratuvarlari Ticaret A.S., Istanbul TRY 25.2 m 100%
United arab emirates
Novartis Middle East FZE, Dubai AED 7.0 m 100%
United Kingdom
Novartis UK Limited, Frimley/Camberley GBP 25.5 m 100%
Novartis Pharmaceuticals UK Limited, Frimley/Camberley GBP 5.4 m 100%
Novartis Grimsby Limited, Frimley/Camberley GBP 250.0 m 100%
Ziarco Group Limited, Frimley/Camberley GBP 3 904 100%
Sandoz Limited, Frimley/Camberley GBP 2.0 m 100%
Alcon Eye Care UK Limited, Frimley/Camberley GBP 550 000 100%
Glaxosmithkline Consumer Healthcare
Holdings Limited, Brentford, Middlesex GBP 100 000 36.5%
United States of america
Novartis Corporation, East Hanover, NJ USD 72.2 m 100%
Novartis Finance Corporation, New York, NY USD 1 000 100%
Novartis Capital Corporation, New York, NY USD 1 100%
Novartis Services, Inc., East Hanover, NJ USD 1 100%
Novartis US Foundation, New York, NY -- -- 100%
Novartis Pharmaceuticals Corporation, East Hanover, NJ USD 5.2 m 100%
Novartis Institutes for BioMedical
Research, Inc., Cambridge, MA USD 1 100%
Corthera, Inc., San Mateo, CA USD 1 100%
CoStim Pharmaceuticals Inc., Cambridge, MA USD 1 100%
Encore Vision, Inc., New York, NY USD 1 100%
Navigate BioPharma Services, Inc., Wilmington, NC USD 100 100%
Reprixys Pharmaceuticals Corporation, Oklahoma City, OK USD 1 100%
Spinifex Pharmaceuticals, Inc., Wilmington, NC USD 1 100%
Novartis Institute for Functional Genomics, Inc., San Diego, CA USD 1 000 100%
Sandoz Inc., Princeton, NJ USD 25 000 100%
Fougera Pharmaceuticals Inc., Melville, NY USD 1 100%
Eon Labs, Inc., Princeton, NJ USD 1 100%
Alcon Laboratories, Inc., Fort Worth, TX USD 1 000 100%
Alcon Refractivehorizons, LLC, Fort Worth, TX USD 10 100%
Alcon Research, Ltd., Fort Worth, TX USD 12.5 100%
Alcon Lensx, Inc., Aliso Viejo, CA USD 1 100%
Alcon Laboratories Holding Corporation, Fort Worth, TX USD 10 100%
Novartis Vaccines and Diagnostics, Inc., Cambridge, MA USD 3 100%
ClarVista Medical, Inc., Aliso Viejo, CA USD 1 100%
Transcend Medical, Inc., Menlo Park, CA USD 1 100%
Venezuela
Novartis de Venezuela, S.A., Caracas VEF 1.4 m 100%
Alcon Pharmaceutical, C.A., Caracas VEF 5.5 m 100%
In addition, the Group is represented by subsidiaries and associated companies in the following countries: Bosnia/Herzegovina, Bulgaria, Dominican Republic, Guatemala, Kenya, Latvia, the Former Yugoslav Republic of Macedonia, Nigeria, Peru, Puerto Rico, Ukraine and Uruguay1 Share capital may not reflect the taxable share capital and does not include any
paid-in surplus2 Approximately 33% of voting shares; approximately 6% of total net income and equity
attributable to Novartism = million; bn = billion

Novartis Annual Report 2017 | 255FINaNcIal RepORTReport of Novartis management on internal control over financial reporting
Report of Novartis management on internal control over financial reporting
The Board of Directors and management of the Group are responsible for establishing and maintaining ade-quate internal control over financial reporting. The Novartis Group’s internal control system was designed to provide reasonable assurance to the Novartis Group’s management and Board of Directors regarding the reli-ability of financial reporting and the preparation and fair presentation of its published consolidated financial statements.
All internal control systems, no matter how well designed, have inherent limitations. Therefore, even those systems determined to be effective may not prevent or detect misstatements and can provide only reasonable assur-ance with respect to financial statement preparation and presentation. Also, projections of any evaluation of effec-tiveness to future periods are subject to the risk that con-trols may become inadequate because of changes in conditions or that the degree of compliance with the pol-icies or procedures may deteriorate.
Novartis Group management assessed the effectiveness of the Group’s internal control over financial reporting as of December 31, 2017. In making this assessment, it used the criteria established in Internal Control – Integrated Framework(2013) issued by the Committee of Sponsor-ing Organizations of the Treadway Commission (COSO). Based on its assessment, management has concluded that, as of December 31, 2017, the Novartis Group’s inter-nal control over financial reporting was effective based on those criteria.
PricewaterhouseCoopers AG, Switzerland, an indepen-dent registered public accounting firm, has issued an opinion on the existence and effec tiveness of the Group’s internal control over financial reporting which is included in this financial report on the pages 256 and 261 respec-tively.
Joseph Jimenez Harry KirschChief Executive Officer Chief Financial Officer
Basel, January 23, 2018

256 | Novartis Annual Report 2017
Report of the statutory auditor on the consolidated financial statements of Novartis AG
To the general meeting of Novartis AG, Basel
Opinion
We have audited the consolidated financial statements of Novartis AG and its subsidiaries (the “Group”), which comprise the consolidated income statements, consol-idated statements of comprehensive income, consoli-dated balance sheets, consolidated statements of changes in equity, and consolidated cash flow state-ments, and notes to the consolidated financial state-ments (pages 186 to 254), including a summary of sig-nificant accounting policies, for the year ended December 31, 2017.
In our opinion, the consolidated financial statements give a true and fair view of the consolidated financial position of the Group as at December 31, 2017 and its consolidated financial performance and its consolidated cash flows for the year then ended in accordance with International Financial Reporting Standards (IFRS), as issued by the International Accounting Standards Board, and comply with Swiss law.
Basis for opinion
We conducted our audit in accordance with Swiss law, International Standards on Auditing (ISAs) and Swiss Auditing Standards. Our responsibilities under those pro-visions and standards are further described in the “Audi-tor’s responsibilities for the audit of the consolidated financial statements” section of our report.
We are independent of the Group in accordance with the provisions of Swiss law and the requirements of the Swiss audit profession, as well as the IESBA Code of Ethics for Professional Accountants, and we have ful-filled our other ethical responsibilities in accordance with these requirements. We believe that the audit evidence we have obtained is sufficient and appropriate to provide a basis for our opinion.
Our audit approach
Overview• Overall Group materiality: USD 400 million which rep-
resents slightly less than 5% of income before taxes from continuing operations.
• We conducted full scope audit work at the Group’s three operating divisions and at 14 reporting entities, including reporting entities of the Corporate Division, in seven countries.
• In addition, full scope audit work on account balances was performed on 21 reporting entities in 14 countries.
• Our audit scope addressed 69% of the Group’s net sales and 86% of Group’s total assets.
As key audit matters, the following areas of focus have been identified:• Carrying value of Alcon goodwill• Carrying value of intangible assets other than goodwill• Governmental investigations and litigation• Rebates, discounts, and sales returns
Audit scopeWe designed our audit by determining materiality and assessing the risks of material misstatement in the con-solidated financial statements. In particular, we consid-ered areas where subjective judgments were made, such as significant accounting estimates that involved making assumptions and consideration of future events that are inherently uncertain. As in all of our audits, we also addressed the risk of management override of internal controls, including among other matters consideration of whether there was evidence of bias that represented a risk of material misstatement due to fraud.
How we tailored the audit scopeWe tailored the scope of our audit in order to perform sufficient work to enable us to provide an opinion on the financial statements as a whole, taking into account the structure of the Group, the accounting processes and controls, and the industry in which the Group operates.
The Group financial statements are a consolidation of over 300 reporting entities. We identified 14 reporting enti-ties that, in our view, required an audit of their complete financial information due to their size or risk characteris-tics. We worked very closely with and received full scope reporting from the divisional audit teams for Innovative Medicines, Alcon and Sandoz, each being a global busi-ness with headquarters based in Switzerland, the United States of America and Germany, respectively. We also received full scope reporting from reporting entity audit teams for the full scope audit work performed on account balances, carried out at 21 reporting entities, to obtain appropriate coverage of material balances. None of the reporting entities excluded from our Group audit scope individually contributed more than 5% to net sales or total assets. Audit procedures were also performed by the Group audit team over the Group’s Corporate segment, certain group functions (including accounting for associ-ated companies, taxation, treasury, certain employee ben-efits, government investigations and litigation) and Group consolidation.
In order to exercise the appropriate direction and supervision over the work of the divisional and reporting entity audit teams, the Group audit team made several site visits, reviewed audit working papers, participated in meetings between the divisional and reporting entity audit teams and attended selected meetings between divisional management and divisional audit teams. In addition, we hosted a planning workshop in May 2017 for audit partners and managers responsible for divisional and reporting entities.
Novartis Annual Report 2017 | 257FINaNcIal RepORTReport of the statutory auditor on the consolidated financial statements of Novartis aG
MaterialityThe scope of our audit was influenced by our applica-tion of materiality. Our audit opinion aims to provide rea-sonable assurance that the consolidated financial state-ments are free from material misstatement. Misstatements may arise due to fraud or error. They are considered material, if individually or in aggregate, they could rea-sonably be expected to influence the economic deci-sions of users taken on the basis of the consolidated financial statements.
Based on our professional judgment, we determined certain quantitative thresholds for materiality, including the overall group materiality for the consolidated finan-cial statements as a whole as set out below. These, together with qualitative considerations, helped us to determine the scope of our audit and the nature, timing and extent of our audit procedures and to evaluate the effect of misstatements, if any, both individually and in aggregate, on the consolidated financial statements as a whole.
Overall group materialityUSD 400 million.
How we determined itSlightly less than 5% of income before taxes from con-tinuing operations.
Rationale for the materiality benchmark appliedWe chose income before taxes as the measure because, in our view, it is the measure against which the perfor-mance of the Group is most commonly assessed and is a generally accepted benchmark.
We agreed with the Audit and Compliance Committee that we would report to them misstatements identified during our audit above USD 20 million as well as any mis-statements below that amount which, in our view, war-ranted reporting for qualitative reasons.
Key Audit Matters
Key audit matters are those matters that, in our professional judgment, were of most significance in our audit of the consolidated financial statements of the current period. These matters were addressed in the context of our audit of the consolidated financial statements as a whole, and in forming our opinion thereon, and we do not provide a separate opinion on these matters.
Key audit matter
carrying value of alcon goodwillThe Group has goodwill of USD 31.8 billion at December 31, 2017, of which USD 8.3 billion relates to Alcon.
The assessment of the carrying value of the goodwill balances is dependent on the estimation of future cash flows. In particular, those assessments and judgments made to support the carrying value of the goodwill allo-cated to the Alcon Division were critical, given the per-formance of the business in prior years, which lead the group to initiate a turnaround plan, followed by the on-go-ing strategic review.
Refer to Note 1 Significant accounting policies (pages 191 to 198) and Note 10 Goodwill and intangible assets (pages 214 to 215).
How our audit addressed the key audit matter
We assessed and tested the design and operating effec-tiveness of the Group’s controls over the assessment of the carrying value of Alcon goodwill and concluded that these operate effectively.
We tested, with the support of our valuation special-ists, the carrying value of the goodwill allocated to Alcon as at December 31, 2017 focusing on the reasonable-ness of the cash flows growth rate after the forecast period assumption of 3%, given that this rate is above both the growth rate achieved by Alcon recently and the rate of inflation in key markets at the end of 2017. We also challenged management to substantiate its key assump-tions in the cash flow projections during the forecast period and its intention and ability to execute their stra-tegic initiatives and evaluated the reasonableness of the discount rate applied to those future cash flows.
We assessed management’s sensitivity analysis around key estimates to quantify the downside changes in assumptions that could result in an impairment and the disclosures included in Note 10 Goodwill and intan-gible assets (pages 214 to 215) of the annual report.
As a result of our procedures, as discussed with the Audit and Compliance Committee, we determined that the conclusions reached by management with regard to the carrying value of Alcon goodwill were reasonable and supportable.

258 | Novartis Annual Report 2017
Key audit matter
carrying value of intangible assets other than goodwillThe Group has intangible assets other than goodwill totaling USD 30.0 billion at December 31, 2017, compris-ing research and development acquired, currently mar-keted products, marketing know-how, technologies, the Alcon brand name and other intangible assets. The Group recognized specific impairments of intangible assets other than goodwill of USD 709 million during the year.
The assessment of the carrying values of intangible assets is dependent on future cash flows and if these are below initial expectations there is a risk that the assets will be impaired. The reviews of carrying values performed by the Group contain a number of significant judgments and estimates such as scientific success, rev-enue growth, the success of new product launches, profit margins and discount rates.
The carrying value assessments of the following intangible asset includes the most significant risk and highest level of judgment:• The Alcon brand name is an indefinite life corporate
asset and not subject to amortization.• Certain currently marketed products which have per-
formed below management’s expectation or were, in our view, at a greater risk of impairment.
• Products in development, as the assessment of their carrying value is challenging due to management being required to make judgments both as to the prob-ability of scientific success and regulatory approval of the developments across indications, as well as the probability of commercial success of the subsequent product launches.
Refer to Note 1 Significant accounting policies (pages 191 to 198) and Note 10 Goodwill and intangible assets (pages 214 to 215).
How our audit addressed the key audit matter
We assessed and tested the design and operating effec-tiveness of the Group’s controls over the assessment of the carrying value of intangible asset other than good-will and concluded that these operate effectively, spe-cifically in respect to the identification of impairment trig-gering events.
We obtained certain carrying value calculations and assessed the key assumptions. For the Alcon brand name and the currently marketed products these assumptions specifically included pricing, market size and share and competition assumptions.
We assessed the indefinite life designation of the Alcon brand name asset considering the performance of the business in prior years, by challenging manage-ment on their ability to execute their strategic initiatives.
For selected currently marketed products and prod-ucts in development, with the support of our valuation specialists, we considered third party sources to chal-lenge expected future revenues due to actions by com-petitors or due to changes in relevant markets.
Furthermore, for products in development we also considered key scientific developments. We performed our own sensitivity analysis around these key estimates to ascertain the extent of change in those assumptions that either individually or collectively would be required for the intangible assets tested to be impaired.
As a result of our procedures we did not propose any adjustments to the amount of impairment recognized in 2017. For intangible assets other than goodwill where management determined that no impairment was required, we found that the assessments made by man-agement were based upon reasonable assumptions, consistently applied.
Key audit matter
Governmental investigations and litigationThe pharmaceutical industry is heavily regulated which increases inherent litigation risk.
The Group is subject to various government investi-gations, of which the most significant are disclosed in Note 19 Provisions and other non-current liabilities.
We specifically assessed the investigations and related litigation in the US given their significance and the inherent uncertainty of outcomes.
Refer to Note 1 Significant accounting policies (pages 191 to 198) and Note 19 Provisions and other non-current liabilities (pages 224 to 228).
How our audit addressed the key audit matter
We assessed and tested the design and operating effec-tiveness of the Group’s controls over the completeness, assessment for recognition, measurement and disclo-sures of provisions for governmental investigations and other legal matters and concluded that these operate effectively.
We evaluated management’s judgments in connec-tion with the investigations and related litigation in the US, read the respective court filings and minutes of Board of Directors and management meetings and inquired with management, internal and external legal counsel.
We concluded that the judgments made by manage-ment were in accordance with the accounting policies described in Note 1.

Novartis Annual Report 2017 | 259FINaNcIal RepORTReport of the statutory auditor on the consolidated financial statements of Novartis aG
Key audit matter
Rebates, discounts and sales returnsThe Group distributes its products in many cases through wholesale distributors, and in many cases the ultimate net selling prices are determined based on the contrac-tual arrangements that the Group has with the ultimate patient’s insurer or other payment program.
The initial revenue recognition, which is usually upon shipment to the distributor, requires an estimate of the net selling price taking into consideration rebates and discounts as well as sales returns. The estimate depends on contract terms and regulation, as well as forecasts of sales volumes by sales channel. Additionally, the dis-pensing of the product to the patient and the final deter-mination of the selling price may be several months later.
We focused our testing on the valuation and accu-racy of the accruals for both rebates and discounts together with sales returns recognized at the year end because, specifically for US Medicaid and Medicare or similar programs, the estimation processes involve large volumes of data, require significant judgment and can contain risks of management bias.
The provision reported as of December 31, 2017 for revenue deductions related to rebates, discounts, allow-ances and sales returns amounted to USD 4.7 billion.
Refer to Note 21 Provisions and other current liabili-ties (pages 229 and 230).
How our audit addressed the key audit matter
We performed procedures to assess the design and operating effectiveness of the controls related to the recording of rebates, discounts and sales returns and the estimation of related period end reserves.
We obtained management’s calculations for the respective estimates and performed one or more of the following procedures on each of them: developed an independent expectation of the reserve and/or tested management’s estimation process to assess the reason-ableness of the recorded reserve balances, performed retrospective reviews and assessed subsequent events. We also performed testing of credits issued and pay-ments made throughout the year, reviewed related con-tracts and independently confirmed sales terms with sig-nificant customers, and inventory levels with the largest wholesalers.
We did not identify any material differences between our expectations and the accruals and we found the judg-ments made by management to be reasonable.
Other information in the annual reportThe Board of Directors is responsible for the other infor-mation in the annual report. The other information com-prises all information included in the annual report, but does not include the consolidated financial statements, the stand-alone financial statements and our auditor’s reports thereon.
Our opinion on the consolidated financial statements does not cover the other information in the annual report and we do not express any form of assurance conclu-sion thereon.
In connection with our audit of the consolidated finan-cial statements, our responsibility is to read the other information in the annual report and, in doing so, con-sider whether the other information is materially incon-sistent with the consolidated financial statements or our knowledge obtained in the audit, or otherwise appears to be materially misstated. If, based on the work we have performed, we conclude that there is a material misstate-ment of this other information, we are required to report that fact. We have nothing to report in this regard.
Responsibilities of the Board of Directors for the consolidated financial statementsThe Board of Directors is responsible for the prepara-tion of the consolidated financial statements that give a true and fair view in accordance with IFRS and the pro-
visions of Swiss law, and for such internal control as the Board of Directors determines is necessary to enable the preparation of consolidated financial statements that are free from material misstatement, whether due to fraud or error.
In preparing the consolidated financial statements, the Board of Directors is responsible for assessing the Group’s ability to continue as a going concern, disclos-ing, as applicable, matters related to going concern and using the going concern basis of accounting unless the Board of Directors either intends to liquidate the Group or to cease operations, or has no realistic alternative but to do so.
Auditor’s responsibilities for the audit of the consolidated financial statementsOur objectives are to obtain reasonable assurance about whether the consolidated financial statements as a whole are free from material misstatement, whether due to fraud or error, and to issue an auditor’s report that includes our opinion. Reasonable assurance is a high level of assurance, but is not a guarantee that an audit conducted in accordance with Swiss law, ISAs and Swiss Auditing Standards will always detect a material mis-statement when it exists. Misstatements can arise from fraud or error and are considered material if, individually or in the aggregate, they could reasonably be expected to influence the economic decisions of users taken on the basis of these consolidated financial statements.

260 | Novartis Annual Report 2017
As part of an audit in accordance with Swiss law, ISAs and Swiss Auditing Standards, we exercise professional judgment and maintain professional scepticism through-out the audit. We also:• Identify and assess the risks of material misstatement
of the consolidated financial statements, whether due to fraud or error, design and perform audit procedures responsive to those risks, and obtain audit evidence that is sufficient and appropriate to provide a basis for our opinion. The risk of not detecting a material mis-statement resulting from fraud is higher than for one resulting from error, as fraud may involve collusion, forgery, intentional omissions, misrepresentations, or the override of internal control.
• Obtain an understanding of internal control relevant to the audit in order to design audit procedures that are appropriate in the circumstances.
• Evaluate the appropriateness of accounting policies used and the reasonableness of accounting estimates and related disclosures made.
• Conclude on the appropriateness of the Board of Directors’ use of the going concern basis of account-ing and, based on the audit evidence obtained, whether a material uncertainty exists related to events or con-ditions that may cast significant doubt on the Group’s ability to continue as a going concern. If we conclude that a material uncertainty exists, we are required to draw attention in our auditor’s report to the related dis-closures in the consolidated financial statements or, if such disclosures are inadequate, to modify our opin-ion. Our conclusions are based on the audit evidence obtained up to the date of our auditor’s report. How-ever, future events or conditions may cause the Group to cease to continue as a going concern.
• Evaluate the overall presentation, structure and con-tent of the consolidated financial statements, including the disclosures, and whether the consolidated finan-cial statements represent the underlying transactions and events in a manner that achieves fair presentation.
• Obtain sufficient appropriate audit evidence regarding the financial information of the entities or business activities within the Group to express an opinion on the consolidated financial statements. We are responsible for the direction, supervision and performance of the Group audit. We remain solely responsible for our audit opinion.
We communicate with the Board of Directors mostly through the Audit and Compliance Committee regard-ing, among other matters, the planned scope and timing of the audit and significant audit findings, including any significant deficiencies in internal control that we iden-tify during our audit.
We also provide the Board of Directors with a state-ment that we have complied with relevant ethical require-ments regarding independence, and to communicate with them all relationships and other matters that may reasonably be thought to bear on our independence, and where applicable, related safeguards.
From the matters communicated with the Board of Directors, we determine those matters that were of most significance in the audit of the consolidated financial statements of the current period and are therefore the key audit matters. We describe these matters in our audi-tor’s report unless law or regulation precludes public dis-closure about the matter or when, in extremely rare cir-cumstances, we determine that a matter should not be communicated in our report because the adverse con-sequences of doing so would reasonably be expected to outweigh the public interest benefits of such commu-nication.
Report on other legal and regulatory requirementsIn accordance with article 728a paragraph 1 item 3 CO and Swiss Auditing Standard 890, we confirm that an internal control system exists which has been designed for the preparation of consolidated financial statements according to the instructions of the Board of Directors.
We recommend that the consolidated financial state-ments submitted to you be approved.
PricewaterhouseCoopers AG
Martin Kennard Stephen JohnsonAudit expert Global relationshipAuditor in charge partner
Basel, January 23, 2018
The report set out on pages 256 to 260 is included in accordance with the requirements of Swiss Law and does not form part of the Novartis AG Annual Report pursuant to section 13 or 15(d) of the securities exchange act of 1934 as filed with the US Securities and Exchange Commission (SEC) on Form 20-F. The report of the Independent Registered Public Accounting Firm as included in the Form 20-F is reprinted for information purposes on page 261.

Novartis Annual Report 2017 | 261FINaNcIal RepORTReport of Independent Registered public accounting Firm
Report of Independent Registered Public Accounting Firm
To the Shareholders and Board of Directors of Novartis AG, BaselOpinions on the Financial Statements and Internal control over Financial ReportingWe have audited the accompanying consolidated bal-ance sheets of Novartis AG and its consolidated subsid-iaries (Group or Company) as of December 31, 2017 and December 31, 2016, and the related consolidated income statements, consolidated statements of comprehensive income, consolidated statements of changes in equity, and consolidated cash flow statements for each of the three years in the period ended December 31, 2017, including the related notes (collectively referred to as the “consolidated financial statements”). We also have audited the Company’s internal control over financial reporting as of December 31, 2017, based on criteria established in Internal Control – Integrated Framework (2013) issued by the Committee of Sponsoring Organi-zations of the Treadway Commission (COSO).
In our opinion, the consolidated financial statements referred to above present fairly, in all material respects, the financial position of the Company as of December 31, 2017 and December 31, 2016, and the results of its operations and its cash flows for each of the three years in the period ended December 31, 2017 in conformity with International Financial Reporting Standards (IFRS) as issued by the International Accounting Standards Board. Also in our opinion, the Company maintained, in all material respects, effective internal control over finan-cial reporting as of December 31, 2017, based on criteria established in Internal Control – Integrated Framework (2013) issued by the COSO.
Basis for OpinionsThe Novartis’ Board of Directors and management of the Group are responsible for these consolidated financial statements, for maintaining effective internal control over financial reporting, and for its assessment of the effec-tiveness of internal control over financial reporting, included in the “Report of Novartis Management on Inter-nal Control Over Financial Reporting” in item 15(b) of this Form 20-F. Our responsibility is to express opinions on the Company’s consolidated financial statements and on the Company’s internal control over financial report-ing based on our audits. We are a public accounting firm registered with the Public Company Accounting Over-sight Board (United States) (“PCAOB”) and are required to be independent with respect to the Company in accor-dance with the U.S. federal securities laws and the appli-cable rules and regulations of the Securities and Exchange Commission and the PCAOB.
We conducted our audits in accordance with the stan-dards of the PCAOB. Those standards require that we plan and perform the audits to obtain reasonable assur-ance about whether the consolidated financial state-ments are free of material misstatement, whether due to error or fraud, and whether effective internal control over financial reporting was maintained in all material respects.
Our audits of the consolidated financial statements included performing procedures to assess the risks of material misstatement of the consolidated financial statements, whether due to error or fraud, and perform-ing procedures that respond to those risks. Such pro-cedures included examining, on a test basis, evidence regarding the amounts and disclosures in the consoli-
dated financial statements. Our audits also included evaluating the accounting principles used and significant estimates made by management, as well as evaluating the overall presentation of the consolidated financial statements. Our audit of internal control over financial reporting included obtaining an understanding of inter-nal control over financial reporting, assessing the risk that a material weakness exists, and testing and evalu-ating the design and operating effectiveness of internal control based on the assessed risk. Our audits also included performing such other procedures as we con-sidered necessary in the circumstances. We believe that our audits provide a reasonable basis for our opinions.
Definition and limitations of Internal control over Financial ReportingA company’s internal control over financial reporting is a process designed to provide reasonable assurance regarding the reliability of financial reporting and the preparation of financial statements for external purposes in accordance with IFRS. A company’s internal control over financial reporting includes those policies and pro-cedures that (i) pertain to the maintenance of records that, in reasonable detail, accurately and fairly reflect the transactions and dispositions of the assets of the com-pany; (ii) provide reasonable assurance that transactions are recorded as necessary to permit preparation of financial statements in accordance with IFRS, and that receipts and expenditures of the company are being made only in accordance with authorizations of manage-ment and directors of the company; and (iii) provide rea-sonable assurance regarding prevention or timely detec-tion of unauthorized acquisition, use, or disposition of the company’s assets that could have a material effect on the financial statements.
Because of its inherent limitations, internal control over financial reporting may not prevent or detect mis-statements. Also, projections of any evaluation of effec-tiveness to future periods are subject to the risk that con-trols may become inadequate because of changes in conditions, or that the degree of compliance with the policies or procedures may deteriorate.
PricewaterhouseCoopers AG
Martin Kennard Stephen JohnsonAudit expert Global relationshipAuditor in charge partner
Basel, January 23, 2018
PwC has served as the Company’s auditor since 1996. PwC or its predecessors audited certain of the Compa-ny’s predecessor entities since at least 1940.
The report of the Independent Registered Public Accounting Firm set out above is reprinted for information purposes only and is a copy of the report included in the Novartis AG Annual Report pursuant to section 13 or 15(d) of the securities exchange act of 1934 as filed with the US Securities and Exchange Commission (SEC), on Form 20-F. The report does not form part of the reporting to the general meeting as required by Swiss Law.

262 | Novartis Annual Report 2017
Financial statements of Novartis AGIncome statements (For the years ended December 31, 2017 and 2016)(CHF millions) Note 2017 2016
Income from investment in Group subsidiaries 7 633 7 291
License income 1 588 1 445
Gain from disposal of intangibles assets 274 495
Other income 5 11
Total income 9 500 9 242
Amortization of goodwill and other intangible assets 3 – 1 141 – 1 140
Administrative expenses – 23 – 26
Other expenses – 2 – 4
Total expenses – 1 166 – 1 170
Operating income 8 334 8 072
Financial income 4 449 440
Financial expenses 4 – 180 – 194
Income before taxes 8 603 8 318
Direct taxes – 176 – 177
Net income of the year 8 427 8 141
The accompanying Notes form an integral part of these financial statements.

Novartis Annual Report 2017 | 263FINaNcIal RepORtFinancial statements of Novartis aG
Balance sheets (At December 31, 2017 and 2016) (CHF millions) Note 2017 2016
assets
current assets
Cash and cash equivalents 60 3
Receivables
Group subsidiaries 1 897 4 163
Third parties 6 24
total current assets 1 963 4 190
Non-current assets
Financial assets
Group subsidiaries 14 965 14 978
Investments 5
Group subsidiaries 12 398 12 630
Third parties 0 0
Goodwill and other intangible assets 3 14 366 15 507
total non-current assets 41 729 43 115
total assets 43 692 47 305
liabilities and equity
current liabilities
Other current liabilities
Group subsidiaries 36 48
Third parties 84 8
Accrued expenses 186 185
Deferred income 16 19
total current liabilities 322 260
Non-current liabilities
Interest-bearing non-current liabilities
Bonds 6 1 378 1 378
Non-current provisions 488 502
total non-current liabilities 1 866 1 880
equity
Share capital 7 1 308 1 314
legal capital reserves – capital contribution reserve 198 198
General reserve 320 320
Reserve for treasury shares held by subsidiaries 8 3 005 3 417
total legal retained earnings 3 325 3 737
Free reserves 9 30 178 30 527
Retained earnings 3 281 2 040
Net income of the year 8 427 8 141
Retained earnings available for distribution at the end of the year 11 708 10 181
total unappropriated earnings 41 886 40 708
treasury shares held by Novartis aG 8 – 5 213 – 792
total equity 41 504 45 165
total liabilities and equity 43 692 47 305
The accompanying Notes form an integral part of these financial statements.

264 | Novartis Annual Report 2017
Notes to the financial statements of Novartis AG1. IntroductionThe financial statements of Novartis AG, with its regis-tered office in Basel, comply with the requirements of the Swiss accounting legislation of the Swiss Code of Obligations (SCO).
Novartis AG is presenting consolidated financial statements according to IFRS. As a result, these financial statements and notes do not include additional disclo-sures, cash flow statements or a management report.
2. accounting policiesFinancial income and expenses
Current assets and current liabilities denominated in foreign currencies are converted at year-end exchange rates. Realized exchange gains and losses, and all unreali zed exchange losses arising from these as well as those from business transactions are recorded net as financial income or financial expenses.
Derivative financial instruments
Derivative financial instruments are used for hedging pur-poses. These instruments are valued at fair value. When different accounting policies apply for the hedged item and the derivative financial instrument, hedge accounting is applied through measuring the hedged item together with the derivative financial instrument.
Financial assets
Financial assets are valued at acquisition cost less adjustments for foreign currency losses and any other impairment of value.
Investments
Investments are initially recognized at cost. Investments in Novartis Group subsidiaries are assessed annually and in case of an impairment adjusted to their recoverable amount within their category.
Goodwill and other intangible assets
Goodwill and other intangible assets are capitalized and amortized over a period of between five and 20 years. Goodwill and other intangible assets are reviewed for impairment on a yearly basis. If necessary, an impairment loss is recognized.
Bonds
Bonds are valued at nominal value. Any bond premium is accrued over the duration of the bond so that at maturity the balance sheet amount will equal the amount that is due to be paid.
Provisions
Provisions are made to cover general business risks of the Group.

Novartis Annual Report 2017 | 265FINaNcIal RepORtNotes to the financial statements of Novartis aG
3. Goodwill and other intangible asset movements
(CHF millions) 2017 2016
Goodwill
Gross cost 1 22 350 22 350
Accumulated amortization
January 1 – 6 843 – 5 703
Amortization charges – 1 141 – 1 140
December 31 – 7 984 – 6 843
Net book value at December 31 14 366 15 507
Other intangible assets
Cost 1 11 11
Accumulated amortization 1 – 11 – 11
Net book value at December 31
Goodwill and other intangible assets
Net book value at December 31 14 366 15 507
1 There was no change during 2017 and 2016.
4. Financial income and expenses 2017 2016
(CHF millions) Income Expenses Income Expenses
Interest 449 – 111 440 – 134
Foreign exchange – 68 – 58
Others – 1 – 2
total 449 – 180 440 – 194
5. InvestmentsThe principal direct and indirect subsidiaries and other holdings of Novartis AG are shown in Note 31 to the Group’s consolidated financial statements.

266 | Novartis Annual Report 2017
6. Bonds
Straight bonds 2017 2016
Nominal Issuance Maturity (cHF (CHF
Coupon Currency amount year year Issuer Issue price millions) millions)
0.250% CHF 500 2015 2025 Novartis AG, Basel, Switzerland 100.640% 501 502
0.625% CHF 550 2015 2029 Novartis AG, Basel, Switzerland 100.502% 551 551
1.050% CHF 325 2015 2035 Novartis AG, Basel, Switzerland 100.479% 326 325
total straight bonds 1 378 1 378
Breakdowns by maturity(CHF millions) 2017 2016
After 2022 1 378 1 378
total 1 378 1 378
comparison of balance sheet and fair value 2017 2017 2016 2016
(CHF millions) Balance sheet Fair values Balance sheet Fair values
Straight bonds 1 378 1 408 1 378 1 407
total 1 378 1 408 1 378 1 407
7. Share capital
2017 2016
Number Share capital Number Share capital
of shares CHF millions of shares CHF millions
January 1 2 627 114 820 1 313.6 2 676 993 000 1 338.5
Number of shares canceled/capital reduced during the period – 10 270 000 – 5.2 – 49 878 180 – 24.9
December 31 2 616 844 820 1 308.4 2 627 114 820 1 313.6
The Novartis AG share capital consists of registered shares with a nominal value of CHF 0.50 each.
The total share capital decreased from CHF 1 313.6 million at December 31, 2016, to CHF 1 308.4 million at December 31, 2017, due to a share capital reduction as a result of the cancellation of 10.3 million repurchased shares with a nominal value of CHF 5.2 million. The cancellation was approved at the Annual General Meeting of February 28, 2017, and became effective on May 9,
2017. During 2016, the total share capital decreased from CHF 1 338.5 million at December 31, 2015, to CHF 1 313.6 million at December 31, 2016, due to a share capital reduction as a result of the cancellation of 49.9 million repurchased shares with a nominal value of CHF 24.9 million. The cancellation was approved at the Annual General Meeting of February 23, 2016, and became effective on April 28, 2016.

Novartis Annual Report 2017 | 267FINaNcIal RepORtNotes to the financial statements of Novartis aG
8. Reserve for treasury shares
2017 2016
Reserve for Reserve for
treasury shares treasury shares
Number held by subsidiaries Number held by subsidiaries
of shares CHF millions of shares CHF millions
treasury shares held by subsidiaries 1
January 1 56 847 803 3 417 65 176 383 4 009
Number of shares purchased/sold; reserves transferred – 6 341 428 – 412 – 8 328 580 – 592
December 31 50 506 375 3 005 56 847 803 3 417
1 Excluding foundations
2017 2016
Reserve for Reserve for
treasury shares treasury shares
Number held by Novartis AG Number held by Novartis AG
of shares CHF millions of shares CHF millions
treasury shares held by Novartis aG
January 1 61 577 458 792 101 185 638 4 676
Number of shares purchased/canceled; reserves transferred 55 950 000 4 421 – 39 608 180 – 3 884
December 31 117 527 458 5 213 61 577 458 792
2017 2016
Total reserve for Total reserve for
Number of treasury shares Number treasury shares
shares CHF millions of shares CHF millions
total treasury shares 1
January 1 118 425 261 4 209 166 362 021 8 685
Total number of shares purchased/sold or canceled;
reserves transferred 49 608 572 4 009 – 47 936 760 – 4 476
December 31 168 033 833 8 218 118 425 261 4 209
1 Excluding foundations
Novartis AG has met the legal requirements for legal reserves under Articles 659 et. seq. and 663b.10 SCO for the treasury shares.
Treasury share purchases during 2017 totaled 70.6 million (2016: 12.9 million), with an average purchase price of CHF 78 (2016: CHF 75). Treasury share sales totaled 1.8 million (2016: 4.1 million), with an average sale price of CHF 61 (2016: CHF 56), and share-based compensation transactions totaled 9.0 million shares (2016: 8.8 million shares).
The number of treasury shares held by the company and its subsidiaries meet the definitions and require-ments of Article 659b SCO. At December 31, 2017, treasury shares held by Novartis AG and its subsidiaries totaled 168 033 833. As per the dividend payment date, Novartis AG and its subsidiaries are expected to hold 156 515 091 shares. These shares are non- dividend- bearing shares. It should be noted that within the Novartis Group’s IFRS consolidated financial statements, some Novartis entities are included in the consolidation scope – mainly foundations, which do not qualify as subsi diaries in the sense of Article 659b SCO.

268 | Novartis Annual Report 2017
9. Free reserves
(CHF millions) 2017 2016
January 1 30 527 34 560
Reduction due to cancellation of treasury shares (CHF 767 million / CHF 4 651 million of repurchased shares
less their nominal value of CHF 5 million / CHF 25 million) – 761 – 4 626
Transfer from reserve for treasury shares 412 593
December 31 30 178 30 527
10. contingent liabilities(CHF millions) Dec 31, 2017 Dec 31, 2016
Guarantees in favor of subsidiaries to cover capital and interest of bonds, credit facilities and commercial paper programs –
total maximum amount CHF 43 195 million (2016: CHF 39 369 million) 23 512 19 708
Other guarantees in favor of subsidiaries, associated companies and others –
total maximum amount CHF 4 010 million (2016: CHF 4 155 million) 1 592 2 253
total contingent liabilities 25 104 21 961
Novartis AG is part of the Swiss Novartis value added tax (VAT) group and is therefore jointly liable for existing and future VAT claims from the Swiss Federal Tax Administration.
11. Registration, voting restrictions and major shareholdersThe company’s Articles of Incorporation state that no person or entity shall be registered with the right to vote for more than 2% of the share capital as set forth in the Commercial Register. In particular cases, the Board of Directors may allow exemptions from the limitation for registration in the share register.
According to the share register, shareholders own-ing 2% or more of the Company’s capital at December 31 and being entitled to voting rights on all of their shares, excluding treasury shares held by Novartis AG and its subsidiaries are as follows:
% Holding of % Holding of
share capital share capital
Dec 31, 2017 Dec 31, 2016
Novartis Foundation for Employee
Participation, Basel 2.5 2.6
Emasan AG, Basel 3.4 3.4
UBS Fund Management
(Switzerland) AG, Basel 2.0 2.1
Furthermore, there are the following other significant share holders:
2017 2016
Shareholders registered as nominees:
Chase Nominees Ltd., London 7.8% 8.5%
Nortrust Nominees Ltd., London 3.8% 3.9%
Bank of New York Mellon, New York 4.3% 4.4%
through Bank of New York Mellon, Everett 2.0% 1.8%
through Bank of New York Mellon,
SA/NV, Brussels 2.3% 2.6%
Shareholder acting as american Depositary Share (aDS) depositary:
JPMorgan Chase Bank, N.A., New York 12.3% 12.0%
The following shareholder is disclosed through a notifi-cation filed with Novartis AG, but not registered as of December 31, 2017 in the Novartis Share Register:• Norges Bank (Central Bank of Norway), Oslo, holds
2.1% (2016: 2.0%).The following shareholder is disclosed through a notifi-cation filed with Novartis AG and the SIX Swiss Exchange, but registered with less than 2% of the share capital as of December 31, 2017 in the Novartis Share Register:• BlackRock, Inc., New York, holds between 3% and 5%.

Novartis Annual Report 2017 | 269FINaNcIal RepORtNotes to the financial statements of Novartis aG
12. equity instrument disclosures for the Board of Directors and executive committee membersShare ownership requirements for Board membersThe Chairman is required to own a minimum of 30 000 Novartis shares, and other members of the Board of Directors are required to own at least 4 000 Novartis shares within three years after joining the Board of Direc-tors, to ensure their interests are aligned with those of shareholders. Board members are prohibited from hedg-ing or pledging their ownership positions in Novartis shares that are part of their guideline share ownership requirement, and are required to hold these shares for 12 months after retiring from the Board of Directors. As at December 31, 2017, all current and former members of the Board of Directors who were required to meet the minimum share ownership requirements did so.
Shares, ADRs and share options owned by Board membersAs at December 31, 2017, no member of the Board of Directors, either individually or together with “persons closely linked”1 to them, owned 1% or more of the out-standing shares (or ADRs) of Novartis. As at the same date, no member of the Board of Directors held any share options to purchase Novartis shares.
The total number of vested Novartis shares and ADRs owned by members of the Board of Directors and “ persons closely linked”1 to them as at December 31, 2017 is shown in the table below.
Shares and ADRs owned by Board members1
Number of shares 1,2
at At
December 31, December 31,
2017 2016
Joerg Reinhardt 518 310 497 762
Enrico Vanni 20 101 17 853
Nancy Andrews 4 042 2 308
Dimitri Azar 13 094 11 217
Ton Buechner (from February 24, 2016) 4 428 1 398
Srikant Datar 37 239 34 998
Elizabeth Doherty (from February 24, 2016) 2 761 839
Ann Fudge 15 457 17 530
Pierre Landolt 3 61 029 58 061
Frans van Houten (from February 28, 2017) 978 NA
Andreas von Planta 130 634 127 740
Charles L. Sawyers 7 763 6 029
William T. Winters 12 397 9 257
total 828 233 784 992
NA – Not applicable.1 Includes holdings of “persons closely linked” to Board members (see definition in this
Note 12)2 Each share provides entitlement to one vote.3 According to Pierre Landolt, the Sandoz Family Foundation is the economic
beneficiary of the shares
Share ownership requirements for Executive Committee membersExecutive Committee members are required to own at least a minimum multiple of their annual base salary in Novartis shares or Restricted Share Units (RSUs) within five years of hire or promotion, as set out in the table below.
In the event of a substantial rise or drop in the share price, the Board of Directors may, at its discretion, amend that time period accordingly.
Function Ownership level
CEO 5 x base compensation
Other Executive Committee members 3 x base compensation
The determination of equity amounts against the share ownership requirements is defined to include vested and unvested Novartis shares or ADRs, as well as RSUs acquired under the company’s compensation plans. However, unvested matching shares granted under the Leveraged Share Savings Plan (LSSP), the Employee Share Owner ship Plan (ESOP), and any unvested Per-formance Share Units (PSUs) are excluded. The deter-mination also includes other shares as well as vested options of Novartis shares or ADRs that are owned directly or indirectly by “persons closely linked”1 to an Executive Committee member. The Compensation Com-mittee reviews compliance with the share ownership guideline on an annual basis.
As at December 31, 2017, all members who have served at least five years on the Executive Committee have met or exceeded their personal Novartis share own-ership requirements.
Shares, aDRs, equity rights and share options owned by executive committee membersAs at December 31, 2017, no member of the Executive Committee, either individually or together with “persons closely linked”1 to them, owned 1% or more of the out-standing shares (or ADRs) of Novartis. As at the same date, no member of the Executive Committee held any share options to purchase Novartis shares, with the exception of André Wyss who held 373 000.
The following table shows the total number of shares, ADRs, and other equity rights owned by Executive Committee members and “persons closely linked”1 to them as at December 31, 2017.
1 “Persons closely linked” are (i) their spouse, (ii) their children below age 18, (iii) any legal entities that they own or otherwise control, and (iv) any legal or natural person who is acting as their fiduciary.

270 | Novartis Annual Report 2017
Shares, aDRs and other equity rights owned by executive committee members1
Unvested Unvested
Vested shares total at Vested shares Total at
shares and other December 31, shares and other December 31,
and ADRs equity rights 2 2017 and ADRs equity rights 2 2016
Joseph Jimenez (CEO) 287 699 288 378 576 077 347 278 273 930 621 208
Steven Baert 10 955 55 125 66 080 11 111 50 827 61 938
F. Michael Ball 0 109 222 109 222 0 49 081 49 081
James Bradner 0 47 364 47 364 0 14 479 14 479
Felix R. Ehrat 189 940 123 255 313 195 137 290 122 196 259 486
Richard Francis 35 117 57 758 92 875 22 424 49 550 71 974
Paul Hudson 6 616 36 193 42 809 0 24 027 24 027
Harry Kirsch 64 769 95 378 160 147 47 437 108 686 156 123
Vasant Narasimhan 16 279 85 726 102 005 7 271 79 703 86 974
Bruno Strigini 27 871 78 774 106 645 4 310 92 383 96 693
André Wyss 51 183 63 240 114 423 61 475 92 875 154 350
total 690 429 1 040 413 1 730 842 638 596 957 737 1 596 333
NA – Not applicable.1 Includes holdings of “persons closely linked” to Executive Committee members (see definition in this Note 12)2 Includes restricted shares, RSUs and target number of PSUs. Matching shares under the ESOP and LSSP, and target number of PSUs are disclosed pro-rata to December 31,
unless the award qualified for full vesting under the relevant plan rules. Awards under all other incentive plans are disclosed in full.

Novartis Annual Report 2017 | 271FINaNcIal RepORtappropriation of available earnings of Novartis aG as per balance sheet and declaration of dividend
Appropriation of available earnings of Novartis AG as per balance sheet and declaration of dividend
(CHF) 2017 2016
available unappropriated earnings
Balance brought forward 3 281 006 904 2 039 915 695
Net income of the year 8 427 115 178 8 140 581 612
total available earnings at the disposal of the annual General Meeting 11 708 122 082 10 180 497 307
appropriation proposed by the Board of Directors
Payment of a gross dividend (before taxes and duties) of CHF 2.80 (2016: CHF 2.75) on 2 460 329 729
(2016: 2 518 535 601) dividend-bearing shares1 with a nominal value of CHF 0.50 each – 6 888 923 241 – 6 925 972 903
total available earnings after appopriation 4 819 198 841 3 254 524 404
Dividend waived for additional treasury shares held by the Company 26 482 500
Balance to be carried forward 4 819 198 841 3 281 006 904
1 No dividend will be declared on treasury shares held by Novartis AG, and certain other treasury shares held by other Group companies.
Assuming that this proposal by the Board of Directors is approved by the Annual General Meeting of share-holders, payment of the dividend will be made as from March 8, 2018. The last trading day with entitlement to receive the dividend is March 5, 2018. As from March 6, 2018 the shares will be traded ex-dividend.

272 | Novartis Annual Report 2017
Report of the statutory auditor on the financial statements of Novartis aG
To the General Meeting of Novartis AG, Basel
Opinion
As statutory auditor, we have audited the financial state-ments of Novartis AG, which comprise the balance sheet as at December 31, 2017, income statement and notes to the financial statements (pages 262 to 270) for the year then ended, including a summary of significant accounting policies.
In our opinion, the accompanying financial statements as at December 31, 2017 comply with Swiss law and the company’s articles of incorporation.
Basis for opinion
We conducted our audit in accordance with Swiss law and Swiss Auditing Standards. Our responsibilities under those provisions and standards are further described in the “Auditor’s responsibilities for the audit of the finan-cial statements” section of our report.
We are independent of the entity in accordance with the provisions of Swiss law and the requirements of the Swiss audit profession and we have fulfilled our other ethical responsibilities in accordance with these requirements.
We believe that the audit evidence we have obtained is sufficient and appropriate to provide a basis for our opinion.
Our audit approach
Audit scopeWe designed our audit by determining materiality and assessing the risks of material misstatement in the finan-cial statements. In particular, we considered areas where subjective judgments were made, such as significant accounting estimates that involved making assumptions and consideration of future events that are inherently uncertain. As in all of our audits, we also addressed the risk of management override of internal controls, includ-ing among other matters, consideration of whether there was evidence of bias that represented a risk of material misstatement due to fraud.
MaterialityThe scope of our audit was influenced by our applica-tion of materiality. Our audit opinion aims to provide rea-sonable assurance that the financial statements are free from material misstatement. Misstatements may arise due to fraud or error. They are considered material if,
individually or in aggregate, they could reasonably be expected to influence the economic decisions of users taken on the basis of the financial statements.
Based on our professional judgment, we determined certain quantitative thresholds for materiality, including the overall materiality for the financial statements as a whole as set out below. These, together with qualitative considerations, helped us to determine the scope of our audit and the nature, timing and extent of our audit procedures and to evaluate the effect of misstatements, both individually and in aggregate, on the financial state-ments as a whole.• Overall materiality: CHF 400 million.• How we determined it: Slightly less than 5% of income
before taxes.• Rationale for the materiality benchmark applied: We
chose income before taxes as the measure because, in our view, it is the measure against which the perfor-mance of the entity is most commonly assessed and is a generally accepted benchmark.
We agreed with the Audit and Compliance Committee that we would report to them misstatements identified during our audit above CHF 20 million as well as any mis-statements below that amount which, in our view, war-ranted reporting for qualitative reasons.
Key Audit Matters
Key audit matters are those matters that, in our profes-sional judgment, were of most significance in our audit of the financial statements of the current period. We have determined that there are no key audit matters to com-municate in our report.
Responsibilities of the Board of Directors for the financial statementsThe Board of Directors is responsible for the prepara-tion of the financial statements in accordance with the provisions of Swiss law and the company’s articles of incorporation, and for such internal control as the Board of Directors determines is necessary to enable the preparation of financial statements that are free from material misstatement, whether due to fraud or error.
In preparing the financial statements, the Board of Directors is responsible for assessing the entity’s ability to continue as a going concern, disclosing, as appli cable, matters related to going concern and using the going concern basis of accounting unless the Board of Directors either intends to liquidate the entity or to cease operations, or has no realistic alternative but to do so.

Novartis Annual Report 2017 | 273FINaNcIal RepORtReport of the statutory auditor on the financial statements of Novartis aG
Auditor’s responsibilities for the audit of the financial statementsOur objectives are to obtain reasonable assurance about whether the financial statements as a whole are free from material misstatement, whether due to fraud or error, and to issue an auditor’s report that includes our opinion. Reasonable assurance is a high level of assurance, but is not a guarantee that an audit conducted in accordance with Swiss law and Swiss Auditing Stan-dards will always detect a material misstatement when it exists. Misstatements can arise from fraud or error and are considered material if, individually or in the aggregate, they could reasonably be expected to influ-ence the economic decisions of users taken on the basis of these financial statements.
As part of an audit in accordance with Swiss law and Swiss Auditing Standards, we exercise professional judgment and maintain professional scepticism through-out the audit. We also:• Identify and assess the risks of material misstatement
of the financial statements, whether due to fraud or error, design and perform audit procedures responsive to those risks, and obtain audit evidence that is suffi-cient and appropriate to provide a basis for our opin-ion. The risk of not detecting a material misstatement resulting from fraud is higher than for one resulting from error, as fraud may involve collusion, forgery, intentional omissions, misrepresentations, or the over-ride of internal control.
• Obtain an understanding of internal control relevant to the audit in order to design audit procedures that are appropriate in the circumstances, but not for the pur-pose of expressing an opinion on the effectiveness of the entity’s internal control.
• Evaluate the appropriateness of accounting policies used and the reasonableness of accounting estimates and related disclosures made.
• Conclude on the appropriateness of the Board of Directors’ use of the going concern basis of account-ing and, based on the audit evidence obtained, whether a material uncertainty exists related to events or con-ditions that may cast significant doubt on the entity’s ability to continue as a going concern. If we conclude that a material uncertainty exists, we are required to draw attention in our auditor’s report to the related dis-closures in the financial statements or, if such disclo-sures are inadequate, to modify our opinion. Our con-clusions are based on the audit evidence obtained up to the date of our auditor’s report. However, future events or conditions may cause the entity to cease to continue as a going concern.
We communicate with the Board of Directors, mostly through the Audit and Compliance Committee regard-ing, among other matters, the planned scope and timing of the audit and significant audit findings, including any significant deficiencies in internal control that we identify during our audit.
We also provide the Board of Directors with a state-ment that we have complied with relevant ethical require-ments regarding independence, and to communicate with them all relationships and other matters that may reasonably be thought to bear on our independence, and where applicable, related safeguards.
From the matters communicated with the Board of Directors, we determine those matters that were of most significance in the audit of the financial statements of the current period and are therefore the key audit matters. We describe these matters in our auditor’s report unless law or regulation precludes public disclosure about the matter or when, in extremely rare circumstances, we determine that a matter should not be communicated in our report because the adverse consequences of doing so would reasonably be expected to outweigh the public interest benefits of such communication.
Report on other legal and regulatory requirementsIn accordance with article 728a paragraph 1 item 3 CO and Swiss Auditing Standard 890, we confirm that an internal control system exists which has been designed for the preparation of financial statements according to the instructions of the Board of Directors.
We further confirm that the proposed appropriation of available earnings complies with Swiss law and the company’s articles of incorporation. We recommend that the financial statements submitted to you be approved.
PricewaterhouseCoopers AG
Martin Kennard Stephen JohnsonAudit expert Global relationshipAuditor in charge partner
Basel, January 23, 2018