financial report - ivy tech community college of indiana · i am pleased to present the ivy tech...
TRANSCRIPT

FINANCIAL REPORT
2017-2018

2018 | IVY TECH COMMUNITY COLLEGE FINANCIAL REPORT1
IVY TECH COMMUNITY COLLEGE OF INDIANA2017-18 FINANCIAL REPORT
TABLE OF CONTENTS
President’s Letter . . . . . . . . . . . . . . . . . . . . . . . . . . . . . . . . . . . . . . . . . . . . . . . . . . . . . . . . . . . . . . . . . . . . . . . . . . . . . . . . . . . . . 2
State Board of Trustees . . . . . . . . . . . . . . . . . . . . . . . . . . . . . . . . . . . . . . . . . . . . . . . . . . . . . . . . . . . . . . . . . . . . . . . . . . . . . . . . 3
Management Letter . . . . . . . . . . . . . . . . . . . . . . . . . . . . . . . . . . . . . . . . . . . . . . . . . . . . . . . . . . . . . . . . . . . . . . . . . . . . . . . . . . . 4
Auditor's Opinion . . . . . . . . . . . . . . . . . . . . . . . . . . . . . . . . . . . . . . . . . . . . . . . . . . . . . . . . . . . . . . . . . . . . . . . . . . . . . . . . . . . 5–7
Management’s Discussion and Analysis . . . . . . . . . . . . . . . . . . . . . . . . . . . . . . . . . . . . . . . . . . . . . . . . . . . . . . . . . . . . . . . 8–19
Ivy Tech Community College of Indiana Statement of Net Position . . . . . . . . . . . . . . . . . . . . . . . . . . . . . . . . . . . . . . . . . . . 21
Ivy Tech Foundation Consolidated Statements of Financial Position . . . . . . . . . . . . . . . . . . . . . . . . . . . . . . . . . . . . . . . . . 22
Ivy Tech Community College of Indiana Statement of Revenues, Expenses and Changes in Net Position . . . . . . . . . . 23
Ivy Tech Foundation Consolidated Statements of Activities . . . . . . . . . . . . . . . . . . . . . . . . . . . . . . . . . . . . . . . . . . . . 24–25
Ivy Tech Community College of Indiana Statement of Cash Flows . . . . . . . . . . . . . . . . . . . . . . . . . . . . . . . . . . . . . . . 26–27
Ivy Tech Foundation Consolidated Statements of Cash Flows . . . . . . . . . . . . . . . . . . . . . . . . . . . . . . . . . . . . . . . . . . . 28–29
Ivy Tech Community College of Indiana Notes to Financial Statements . . . . . . . . . . . . . . . . . . . . . . . . . . . . . . . . . . . 30–50
Required Supplementary Information
Schedule of College’s Other Postemployment Benefits . . . . . . . . . . . . . . . . . . . . . . . . . . . . . . . . . . . . . . . . . . . . . . . . . . . . 51
Changes in Assumptions and Benefit Terms . . . . . . . . . . . . . . . . . . . . . . . . . . . . . . . . . . . . . . . . . . . . . . . . . . . . . . . . . . . . . . 51
Schedule of the College's Proportionate Share of the Net Pension Liability . . . . . . . . . . . . . . . . . . . . . . . . . . . . . . . . . . . 51
Schedule of the College’s Contributions . . . . . . . . . . . . . . . . . . . . . . . . . . . . . . . . . . . . . . . . . . . . . . . . . . . . . . . . . . . . . . . . . 51
Public Employees' Retirement Plan . . . . . . . . . . . . . . . . . . . . . . . . . . . . . . . . . . . . . . . . . . . . . . . . . . . . . . . . . . . . . . . . . . . . . . 51
Supplementary Schedules
Schedules of Annual Bond Requirements for Outstanding Debts . . . . . . . . . . . . . . . . . . . . . . . . . . . . . . . . . . . . . . . . .54-59
Schedule of Student Financial Aid Expenditures . . . . . . . . . . . . . . . . . . . . . . . . . . . . . . . . . . . . . . . . . . . . . . . . . . . . . . . . . . 60
Five Year Trend in Student Enrollment . . . . . . . . . . . . . . . . . . . . . . . . . . . . . . . . . . . . . . . . . . . . . . . . . . . . . . . . . . . . . . . . . . . 60

IVY TECH COMMUNITY COLLEGE FINANCIAL REPORT | 20182
DEAR FRIENDS OF IVY TECH,On behalf of the Trustees of Ivy Tech Community College of Indiana, I am pleased to present the College’s 2017-18 Financial Report .
The 2017-18 year was an exciting time for the College . In December 2017, the College launched its strategic plan, entitled “Our Communities . Your College . Pathways for Student Success and a Stronger Indiana .” The strategic plan is the College’s map to achieving the vision of students earning 50,000 high-quality certifications, certificates, and degrees per year aligned with the needs of Indiana’s workforce .
The goals and their corresponding strategies outlined in the plan focus on student success, recruitment and enrollment, completion, placing students in high-demand, high-wage jobs, becoming a great place to work, ensuring the College has sufficient financial resources to achieve its mission, and effectively engaging with and serving Indiana’s unique communities . Much work has already begun towards these seven goals . Related to Goal One, Student Success, a train-the-trainer model has been implemented statewide to expand coaching and is on track to develop 100 in-house coaches by the end of 2018 . Additionally, 8 week courses have been developed and will be launched in Fall 2018 . The second goal in the strategic plan focuses on recruitment and enrollment . As part of Goal Two, the College has worked to best equip our student- and recruit-facing teams with the tools to have meaningful, impactful conversations with prospective and current students . Using the Dimensions of Professional Communication model, our teams across the state now have a systematic method of engaging students, which will lead to higher outcomes . Goal Three focuses on student completion, and in only six months, a statewide MOU for reverse transfer has already been signed . In alignment with Goal Four, to place students in high-wage, high-demand jobs, the College has developed a partnership with Ascend Indiana and financial supporters to build robust career development strategy, including focus on placements, work and learn experiences . Progress on Goal Six, ensuring the College has sufficient financial resources to achieve its mission, has also been made . A new internal campus allocation methodology was presented to the Chancellors and is effective for FY19, and the College is gathering data in preparation to re-negotiate leases with the aim of reducing operating costs . Lastly, 6,000 community leaders statewide were surveyed to provide feedback critical to Goal Seven and in determining how the College can more effectively engage with and serve out communities .
These are only a few examples of the great progress and initiatives throughout the College . As evidenced by this financial report, Ivy Tech remains well positioned fiscally thanks to the work of College faculty and staff . It is increasingly important that the College continues to be fiscally strong in order to maintain affordability and achieve the goals set forth in the strategic plan .
We thank our donor, employer, community, and state partners for their continued support . Your support has been critical in the accomplishments of 2017-18 . More importantly, it is positioning our students for success and the state to achieve the Big Goal that 60% of the state’s workforce will have a high-value, post-secondary degree or credential by 2025 . This means a brighter, stronger Indiana for all of us .
Respectfully,
Sue Ellspermann, PhD
President, Ivy Tech Community College

2018 | IVY TECH COMMUNITY COLLEGE FINANCIAL REPORT3
PRESIDENTDr. Susan Ellspermann
STATE BOARD OF TRUSTEESMichael Dora, Chair
Rushville, Indiana
Paula Hughes-Schuh, Vice Chair Fort Wayne, Indiana
Darrel Zeck, Secretary Terre Haute, Indiana
Board listing as of June 30, 2018
Terry Anker Carmel, Indiana
Jesse Brand Columbus, Indiana
Brad Clark Kokomo, Indiana
Larry Garatoni Mishawaka, Indiana
Marianne Glick Indianapolis, Indiana
Gretchen Gutman Bloomington, Indiana
Harold Hunt Madison, Indiana
Stewart McMillan Valparaiso, Indiana
Steve Schreckengast Lafayette, Indiana
Kerry Stemler Sellersburg, Indiana
Kaye Whitehead Muncie, Indiana
Andrew Wilson Evansville, Indiana

October 25, 2018
TO THE PRESIDENT AND STATE BOARD OF TRUSTEES OF IVY TECH COMMUNITY COLLEGE OF INDIANA:
I am pleased to present the Ivy Tech Community College of Indiana Annual Financial Report for the year ended June 30, 2018, including an opinion on pages 5-7 from the Indiana State Board of Accounts .
This financial report incorporates data from the College’s 19 campuses, 25 educational sites, and 78 courses only locations . The financial statements have been prepared in accordance with Governmental Accounting Standards Board (GASB) statements and the accompanying notes and Management Discussion and Analysis are integral components of the report .
An analysis is included herein which compares the College’s financial position for the fiscal years ended June 30, 2018, and 2017 with comparative information for fiscal year 2016 . This demonstrates the College’s continued fiscal strength despite challenging times for community colleges and in the higher education sector nationwide .
The College is committed to ensuring the institution has sufficient financial resources to achieve its mission of providing accessible and affordable world-class education and adaptive learning . This is evidenced by the College’s efforts to increase efficiencies and maximize support received from State appropriations, student fees, donor contributions, grants, and contracts .
This report is a complete and permanent record of Ivy Tech Community College of Indiana’s financial status for the period stated therein .
Respectfully submitted,
William M . Hawkins Senior Vice President, Chief Financial Officer, and Treasurer
2018 | IVY TECH COMMUNITY COLLEGE FINANCIAL REPORT5
STATE OF INDIANA
AN EQUAL OPPORTUNITY EMPLOYER STATE BOARD OF ACCOUNTS 302 WEST WASHINGTON STREET ROOM E418 INDIANAPOLIS, INDIANA 46204-2769
Telephone: (317) 232-2513
Fax: (317) 232-4711 Web Site: www.in.gov/sboa
INDEPENDENT AUDITOR'S REPORT
TO: THE OFFICIALS OF IVY TECH COMMUNITY COLLEGE OF INDIANA, INDIANAPOLIS, INDIANA Report on the Financial Statements We have audited the financial statements of the business-type activities and the discretely pre-sented component unit of Ivy Tech Community College of Indiana (College), a component unit of the State of Indiana, as of and for the years ended June 30, 2018 and 2017, and the related notes to the financial statements, which collectively comprise the College's basic financial statements, as listed in the Table of Contents. Management's Responsibility for the Financial Statements Management is responsible for the preparation and fair presentation of these financial statements in accordance with accounting principles generally accepted in the United States of America; this includes the design, implementation, and maintenance of internal control relevant to the preparation and fair presen-tation of financial statements that are free from material misstatement, whether due to fraud or error. Auditor's Responsibility Our responsibility is to express opinions on these financial statements based on our audit. We did not audit the financial statements of Ivy Tech Foundation, Inc. (Foundation), a component unit of the College as described in Note I, which represents 100 percent, 100 percent, and 100 percent, respectively, of the total assets, net position and revenues of the discretely presented component unit. Those statements were audited by other auditors whose report has been furnished to us, and our opinion, insofar as it relates to the amounts included for the Foundation, is based solely on the report of the other auditors. We conducted our audit in accordance with auditing standards generally accepted in the United States of America and the standards applicable to financial audits contained in Government Auditing Standards, issued by the Comptroller General of the United States. Those standards require that we plan and perform the audit to obtain reasonable assurance about whether the financial statements are free from material misstatement. The financial statements of the Foundation were audited in accordance with auditing standards generally accepted in the United States of America, but were not audited in accordance with Government Auditing Standards. An audit involves performing procedures to obtain audit evidence about the amounts and dis-closures in the financial statements. The procedures selected depend on the auditor's judgment, including the assessment of the risks of material misstatement of the financial statements, whether due to fraud or error. In making those risk assessments, the auditor considers internal control relevant to the College's preparation and fair presentation of the financial statements in order to design audit procedures that are appropriate in the circumstances, but not for the purpose of expressing an opinion on the effectiveness of the College's internal control. Accordingly, we express no such opinion. An audit also includes evaluating the appropriateness of accounting policies used and the reasonableness of significant accounting estimates made by management, as well as evaluating the overall presentation of the financial statements.

IVY TECH COMMUNITY COLLEGE FINANCIAL REPORT | 20186
INDEPENDENT AUDITOR'S REPORT (Continued)
We believe that the audit evidence we have obtained is sufficient and appropriate to provide a basis for our audit opinions. Opinions In our opinion, based on our audit and the report of the other auditors, the financial statements referred to above present fairly, in all material respects, the respective financial position of the business-type activities and the discretely presented component unit of the College, as of June 30, 2018 and 2017, and the respective changes in financial position and, where applicable, cash flows thereof and for the years then ended in accordance with accounting principles generally accepted in the United States of America. Emphasis of Matter As discussed in Note XIII to the financial statements, in fiscal year 2018, the College adopted new accounting guidance GASB Statement 75 Accounting and Financial Reporting for Postemployment Benefits other than Pensions. Our opinion is not modified with respect to these matters. Other Matters Required Supplementary Information Accounting principles generally accepted in the United States of America require that the Management's Discussion and Analysis, Schedule of College’s Other Postemployment Benefits, Changes in Assumptions and Benefit Terms, Schedule of the College's Proportionate Share of the Net Pension Liability, Schedule of the College's Contributions, and Public Employees' Retirement Plan be presented to supplement the basic financial statements. Such information, although not a part of the basic financial statements, is required by the Governmental Accounting Standards Board who considers it to be an essential part of financial reporting for placing the basic financial statements in an appropriate operational, economic, or historical context. We have applied certain limited procedures to the required supplementary information in accordance with auditing standards generally accepted in the United States of America, which consisted of inquiries of management about the methods of preparing the information and comparing the information for consistency with management's responses to our inquiries, the basic financial state-ments, and other knowledge we obtained during our audit of the basic financial statements. We do not express an opinion or provide any assurance on the information because the limited procedures do not provide us with sufficient evidence to express an opinion or provide any assurance.
Other Information Our audit was conducted for the purpose of forming opinions on the financial statements that collectively comprise the College's basic financial statements. The accompanying President's Letter, State Board of Trustees, Schedules of Annual Bond Requirements for Outstanding Debts, Schedule of Student Financial Aid Expenditures, and Five Year Trend in Student Enrollment are presented for purposes of additional analysis and are not a required part of the basic financial statements. The President's Letter, State Board of Trustees, Schedules of Annual Bond Requirements for Outstanding Debts, Schedule of Student Financial Aid Expenditures, and Five Year Trend in Student Enrollment have not been subjected to the auditing procedures applied in the audit of the basic financial statements and, accordingly, we do not express an opinion or provide any assurance on them.

2018 | IVY TECH COMMUNITY COLLEGE FINANCIAL REPORT7
INDEPENDENT AUDITOR'S REPORT (Continued)
Other Reporting Required by Government Auditing Standards In accordance with Government Auditing Standards, we have also issued our report dated October 25, 2018, on our consideration of the College's internal control over financial reporting and on our tests of its compliance with certain provisions of laws, regulations, contracts, and grant agreements and other matters. The purpose of that report is solely to describe the scope of our testing of internal control over financial reporting and compliance and the results of that testing, and not to provide an opinion on the effectiveness of the College's internal control over financial reporting or on compliance. That report is an integral part of an audit performed in accordance with Government Auditing Standards in considering the College's internal control over financial reporting and compliance.
Paul D. Joyce, CPA State Examiner October 25, 2018

IVY TECH COMMUNITY COLLEGE FINANCIAL REPORT | 20188
MANAGEMENT’S DISCUSSION AND ANALYSISIntroductionThis section of Ivy Tech Community College of Indiana’s (Ivy Tech) annual financial report presents a discussion and analysis of the financial performance of the College for the fiscal year ending June 30, 2018 and 2017 along with comparative data for the year ending June 30, 2016 . The management’s discussion and analysis provides summary level financial information; therefore, it should be read in conjunction with the accompanying financial statements and note disclosures . The management’s discussion and analysis is designed to focus on current activities, significant changes, and currently known facts . The financial statements, notes, and this discussion are the responsibility of management .
Using this Annual ReportThis annual report consists of a series of financial statements, prepared in accordance with the Governmental Accounting Standards Board (GASB) Statement No . 35, Basic Financial Statements—and Management’s Discussion and Analysis—for Public Colleges and Universities, an Amendment of GASB Statement No . 34 Basic Financial Statements and Management’s Discussion and Analysis—for State and Local Governments . The financial statements focus on the financial condition of the College, the results of operations, and cash flows of the College as a whole .
One of the most important questions asked about the College’s finances is whether the College is better or worse as a result of this year’s activity . The keys to understanding that question are the Statement of Net Position, Statement of Revenues, Expenses, and Changes in Net Position, and the Statement of Cash Flows . These statements present financial information in a form similar to that used by corporations . The College’s net position is one indicator of the College’s financial strength . Over time, increases or decreases in net position is one indicator of the improvement or erosion of the College’s financial health when considered with non-financial facts such as enrollment levels and the condition of facilities .
The Statement of Net Position includes all assets and liabilities . It is prepared under the accrual basis of accounting, whereby revenues and assets are recognized when the service is provided and expenses and liabilities are recognized when others provide the service to the College, regardless of when cash is exchanged .
The Statement of Revenues, Expenses, and Changes in Net Position presents the revenues earned and expenses incurred during the year . Activities are reported as either operating or nonoperating . The authoritative financial reporting model classifies State appropriations and gifts as nonoperating revenues; therefore, such a classification results in an operating deficit being shown in this statement . The utilization of long-lived assets, referred to as capital assets, is reflected in the financial statements as depreciation, which amortizes the cost of an asset over its expected useful life .
Another important factor to consider when evaluating financial viability is the College’s ability to meet financial obligations as they mature . The Statement of Cash Flows presents the information related to cash inflows and outflows summarized by operating, capital, and noncapital financing and investing activities .
2018 | IVY TECH COMMUNITY COLLEGE FINANCIAL REPORT9
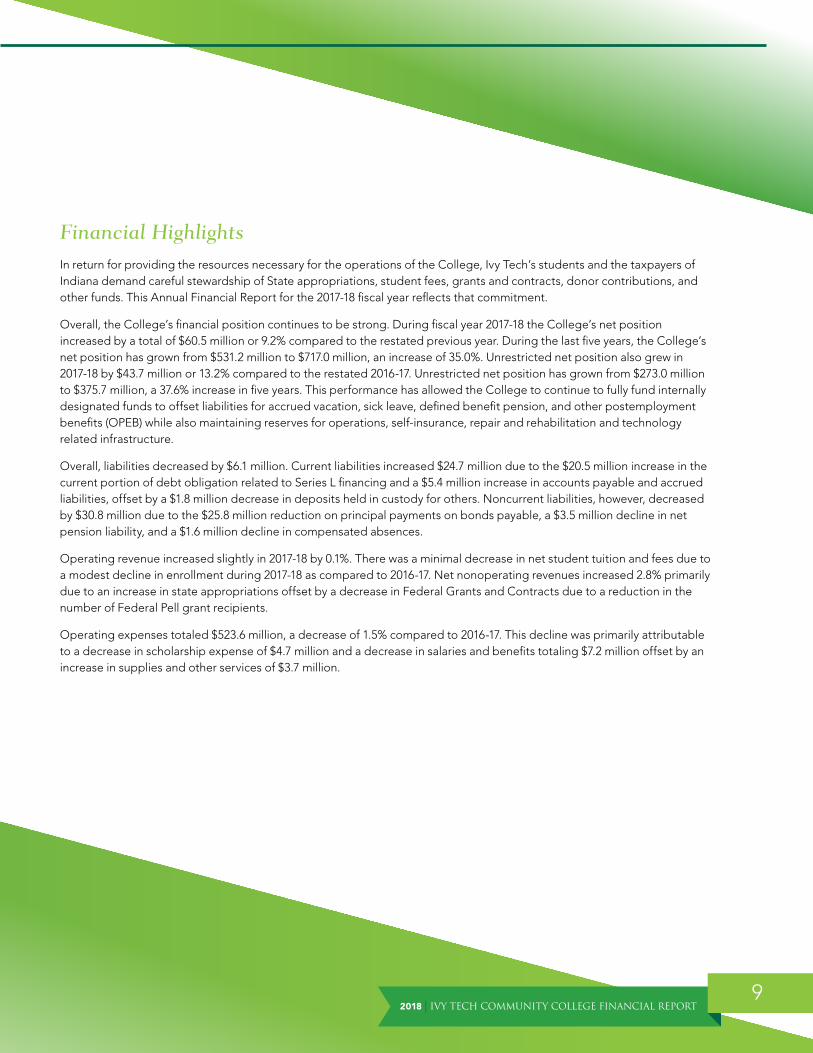
Financial HighlightsIn return for providing the resources necessary for the operations of the College, Ivy Tech’s students and the taxpayers of Indiana demand careful stewardship of State appropriations, student fees, grants and contracts, donor contributions, and other funds . This Annual Financial Report for the 2017-18 fiscal year reflects that commitment .
Overall, the College’s financial position continues to be strong . During fiscal year 2017-18 the College’s net position increased by a total of $60 .5 million or 9 .2% compared to the restated previous year . During the last five years, the College’s net position has grown from $531 .2 million to $717 .0 million, an increase of 35 .0% . Unrestricted net position also grew in 2017-18 by $43 .7 million or 13 .2% compared to the restated 2016-17 . Unrestricted net position has grown from $273 .0 million to $375 .7 million, a 37 .6% increase in five years . This performance has allowed the College to continue to fully fund internally designated funds to offset liabilities for accrued vacation, sick leave, defined benefit pension, and other postemployment benefits (OPEB) while also maintaining reserves for operations, self-insurance, repair and rehabilitation and technology related infrastructure .
Overall, liabilities decreased by $6 .1 million . Current liabilities increased $24 .7 million due to the $20 .5 million increase in the current portion of debt obligation related to Series L financing and a $5 .4 million increase in accounts payable and accrued liabilities, offset by a $1 .8 million decrease in deposits held in custody for others . Noncurrent liabilities, however, decreased by $30 .8 million due to the $25 .8 million reduction on principal payments on bonds payable, a $3 .5 million decline in net pension liability, and a $1 .6 million decline in compensated absences .
Operating revenue increased slightly in 2017-18 by 0 .1% . There was a minimal decrease in net student tuition and fees due to a modest decline in enrollment during 2017-18 as compared to 2016-17 . Net nonoperating revenues increased 2 .8% primarily due to an increase in state appropriations offset by a decrease in Federal Grants and Contracts due to a reduction in the number of Federal Pell grant recipients .
Operating expenses totaled $523 .6 million, a decrease of 1 .5% compared to 2016-17 . This decline was primarily attributable to a decrease in scholarship expense of $4 .7 million and a decrease in salaries and benefits totaling $7 .2 million offset by an increase in supplies and other services of $3 .7 million .
IVY TECH COMMUNITY COLLEGE FINANCIAL REPORT | 201810
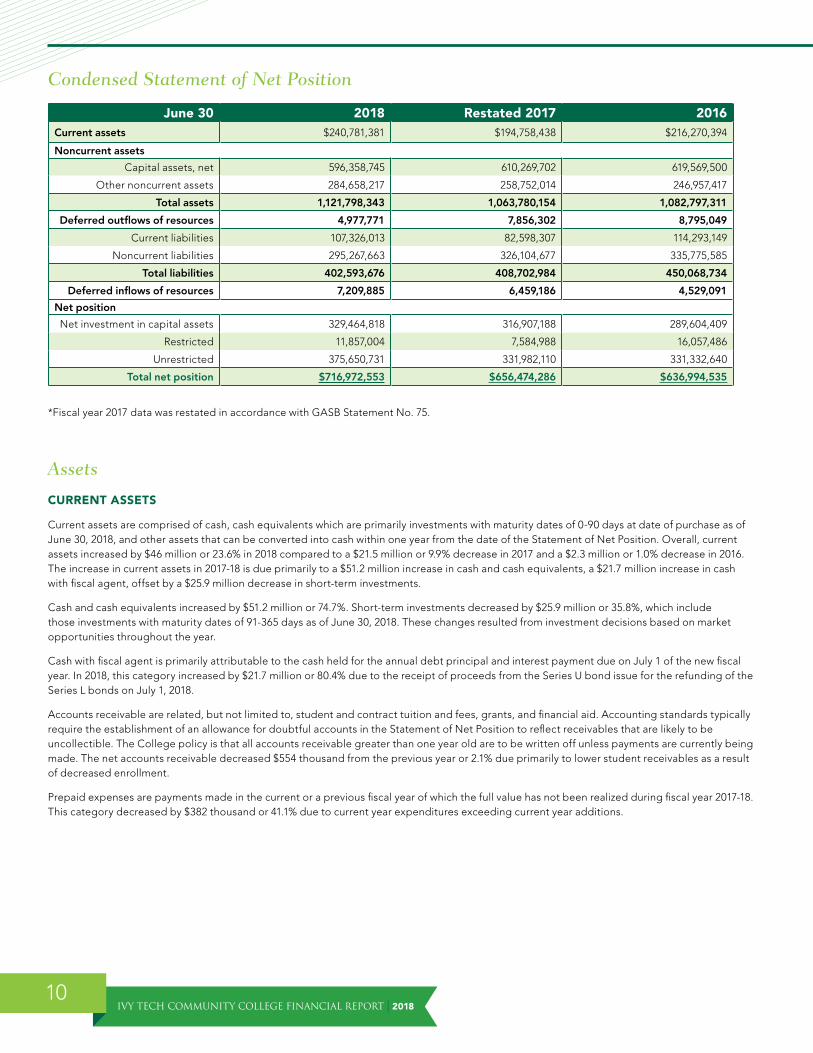
Condensed Statement of Net Position
June 30 2018 Restated 2017 2016Current assets $240,781,381 $194,758,438 $216,270,394
Noncurrent assets
Capital assets, net 596,358,745 610,269,702 619,569,500
Other noncurrent assets 284,658,217 258,752,014 246,957,417
Total assets 1,121,798,343 1,063,780,154 1,082,797,311
Deferred outflows of resources 4,977,771 7,856,302 8,795,049
Current liabilities 107,326,013 82,598,307 114,293,149
Noncurrent liabilities 295,267,663 326,104,677 335,775,585
Total liabilities 402,593,676 408,702,984 450,068,734
Deferred inflows of resources 7,209,885 6,459,186 4,529,091
Net position
Net investment in capital assets 329,464,818 316,907,188 289,604,409
Restricted 11,857,004 7,584,988 16,057,486
Unrestricted 375,650,731 331,982,110 331,332,640
Total net position $716,972,553 $656,474,286 $636,994,535
*Fiscal year 2017 data was restated in accordance with GASB Statement No . 75 .
Assets
CURRENT ASSETS
Current assets are comprised of cash, cash equivalents which are primarily investments with maturity dates of 0-90 days at date of purchase as of June 30, 2018, and other assets that can be converted into cash within one year from the date of the Statement of Net Position . Overall, current assets increased by $46 million or 23 .6% in 2018 compared to a $21 .5 million or 9 .9% decrease in 2017 and a $2 .3 million or 1 .0% decrease in 2016 . The increase in current assets in 2017-18 is due primarily to a $51 .2 million increase in cash and cash equivalents, a $21 .7 million increase in cash with fiscal agent, offset by a $25 .9 million decrease in short-term investments .
Cash and cash equivalents increased by $51 .2 million or 74 .7% . Short-term investments decreased by $25 .9 million or 35 .8%, which include those investments with maturity dates of 91-365 days as of June 30, 2018 . These changes resulted from investment decisions based on market opportunities throughout the year .
Cash with fiscal agent is primarily attributable to the cash held for the annual debt principal and interest payment due on July 1 of the new fiscal year . In 2018, this category increased by $21 .7 million or 80 .4% due to the receipt of proceeds from the Series U bond issue for the refunding of the Series L bonds on July 1, 2018 .
Accounts receivable are related, but not limited to, student and contract tuition and fees, grants, and financial aid . Accounting standards typically require the establishment of an allowance for doubtful accounts in the Statement of Net Position to reflect receivables that are likely to be uncollectible . The College policy is that all accounts receivable greater than one year old are to be written off unless payments are currently being made . The net accounts receivable decreased $554 thousand from the previous year or 2 .1% due primarily to lower student receivables as a result of decreased enrollment .
Prepaid expenses are payments made in the current or a previous fiscal year of which the full value has not been realized during fiscal year 2017-18 . This category decreased by $382 thousand or 41 .1% due to current year expenditures exceeding current year additions .

2018 | IVY TECH COMMUNITY COLLEGE FINANCIAL REPORT11
NONCURRENT ASSETS
Noncurrent assets are assets not expected to be converted into cash within one year from the date of the Statement of Net Position . Noncurrent assets increased by $12 .0 million or 1 .4% in 2018 compared to $2 .5 million or 0 .3% increase in 2017 and a $47 .8 million or 5 .8% increase in 2016 .
In 2018, long-term investments increased by $25 .9 million or 10 .0% from the previous year . This increase is a combination of a shift from short-term to long-term investments in response to market opportunities and investment income .
Net capital assets decreased $13 .9 million or 2 .3% primarily due to the increase in the disposal of assets related to the biennial inventory verification and fewer completed construction or repair and rehabilitation projects in 2017-18 as compared to the previous year .
Deferred Outflows of ResourcesDeferred outflows of resources represent consumption of resources applicable to a future reporting period . Deferred outflows decreased $2 .9 million or 36 .6% in 2018 compared to a $939 thousand or 10 .7% decrease in 2017 . This is due to several factors, including projected and actual investment contributions, changes in assumptions, and fewer participants in the pension plan . Additional information about this item can be found in Note IX, section B .
Liabilities
CURRENT LIABILITIES
Current liabilities are obligations that are due within one year from the date of the Statement of Net Position and will require the use of a current asset or will create another current liability . This category increased by $24 .7 million or 29 .9% compared to a decrease of $31 .7 million or 27 .7% in 2017 and a $29 .7 million or 35 .2% increase in 2016 . The net change in current liabilities is largely due to the reclassification of Series L from long term debt to current .
Accounts payable and accrued liabilities increased $5 .4 million or 20 .7% in 2018 compared to a decrease of $3 .0 million or 10 .3% in fiscal year 2017 . The primary reason for the increase was due to a change in pay frequency from semi-monthly to a bi-weekly lag for exempt administrative staff during the 2018 fiscal year . This change resulted in $7 .0 million in additional accruals for wages and benefits payable for time worked in June and not paid out until July . This increase was offset by a $2 .1 million reclassification of an old, unclaimed accounts payable to income .
Unearned revenue represents monies received in the current year for services, tuition and fees, or goods to be provided by the College in a future period and not applicable with GASB Statement No . 63 Financial Reporting of Deferred Outflows of Resources, Deferred Inflows of Resources, and Net Position . Unearned revenue increased $502 thousand or 4 .2% as compared to the prior year . This increase was due primarily to an $851 thousand increase in unearned summer revenue . This increase was offset by a $182 thousand reduction in unearned revenue in restricted grants and contracts and a $182 thousand reduction in unearned non-credit summer revenue as compared to the prior year .
The current portion of debt obligation is the portion of the College’s long-term debt which is payable within the next fiscal year . This category increased by $20 .5 million or 72 .8% primarily due to reclassification of Series L from long-term debt to current .
NONCURRENT LIABILITIES
Noncurrent liabilities will be paid one year or later from the date of the Statement of Net Position . The College’s noncurrent liabilities include compensated absences, long-term debt and other obligations, net pension liability, and other postemployment benefits . Implementation of GASB Statement No . 75, Accounting and Financial Reporting for Other Postemployment Benefits (OPEB) Other Than Pensions, required recognition of the entire OPEB liability and a more comprehensive measure of OPEB expense .
Overall, noncurrent liabilities decreased by $30 .8 million or 9 .5% . The 2018 change in noncurrent liabilities was due primarily to a $25 .8 million decrease in long-term debt from the principal payments on bonds payable, a $3 .5 million decrease in net pension liability, and $1 .6 million decrease in compensated absences .

IVY TECH COMMUNITY COLLEGE FINANCIAL REPORT | 201812
OUTSTANDING DEBT AT YEAR END
Leases, Notes, and Bonds Payable 6/30/2018 6/30/2017 6/30/2016Revenue Bonds Payable:
Series H student fee bonds $11,200,000 $11,200,000 $11,200,000
Series J student fee bonds 9,245,000 9,245,000 9,245,000
Series K student fee bonds - - 33,085,000
Series L student fee bonds 26,570,000 29,640,000 32,575,000
Series N student fee bonds 58,470,000 62,515,000 66,450,000
Series O student fee bonds 9,200,000 9,200,000 9,200,000
Series P student fee bonds 24,070,000 25,120,000 26,135,000
Series Q student fee bonds - 2,785,000 5,640,000
Series R student fee bonds 50,705,000 55,815,000 60,670,000
Series S student fee bonds - 2,290,000 4,570,000
Series T student fee bonds 24,680,000 27,410,000 27,730,000
Series U student fee bonds 20,550,000 - -
Total bonds payable 234,690,000 235,220,000 286,500,000
Premium on bonds—H, I, J, K, L , P, R, T, U 15,176,163 12,990,911 14,428,238
Lease obligations 27,212,784 31,709,434 35,371,320
Notes payable 2,004,685 4,457,349 5,714,517
Total leases, notes, and bonds payable $279,083,632 $284,377,694 $342,014,075
Deferred Inflows of ResourcesDeferred inflows of resources represent acquisition of resources applicable to a future reporting period as required by GASB Statement No . 68, GASB Statement No . 71, and GASB Statement No . 75 . Deferred inflows related to pensions totaled $3 .9 million, a decrease of $504 thousand or 11 .5% from 2017 . Deferred inflows related to other postemployment benefits totaled $3 .3 million, an increase of $1 .3 million or 60 .1% over the restated 2017 amount . Additional information about this item can be found in Notes VII, IX and XIII .
Net PositionNet position represents the difference between the College’s assets and liabilities . Net position increased $60 .5 million or 9 .2% in 2018 over restated 2017 compared to an increase of $19 .5 million or 3 .1% in 2017, and $39 .0 million or 6 .5% in 2016 .
The classification “net investment in capital assets,” which includes building and equipment less depreciation, land owned by the College, and construction work in progress, increased by $12 .6 million or 4 .0% compared to the prior year . This increase was mainly due to the capitalization of repair and rehabilitation projects as well as other building projects .
The restricted “capital projects” classification increased by $4 .3 million or 56 .8% from the prior year primarily due to a $3 .7 million increase in cash for the plant fund projects .
Unrestricted net position increased by $43 .7 million or 13 .2% in FY18 . The increase is mainly attributable to increases in state appropriations as well as reductions in total operating expenses, primarily within salaries and benefits .
The net position is comprised of 52 .4% unrestricted net position, 46 .0% net investment in capital assets, and 1 .6% capital projects and endowments .
375,650,731329,464,818
11,857,00446.0%52.4% 1.6%
Net Investment in Capital AssetsUnrestricted Capital Projects & Endowment
375, 650, 731329,464,818
2018 ANALYSIS OF NET POSITION
2018 | IVY TECH COMMUNITY COLLEGE FINANCIAL REPORT13
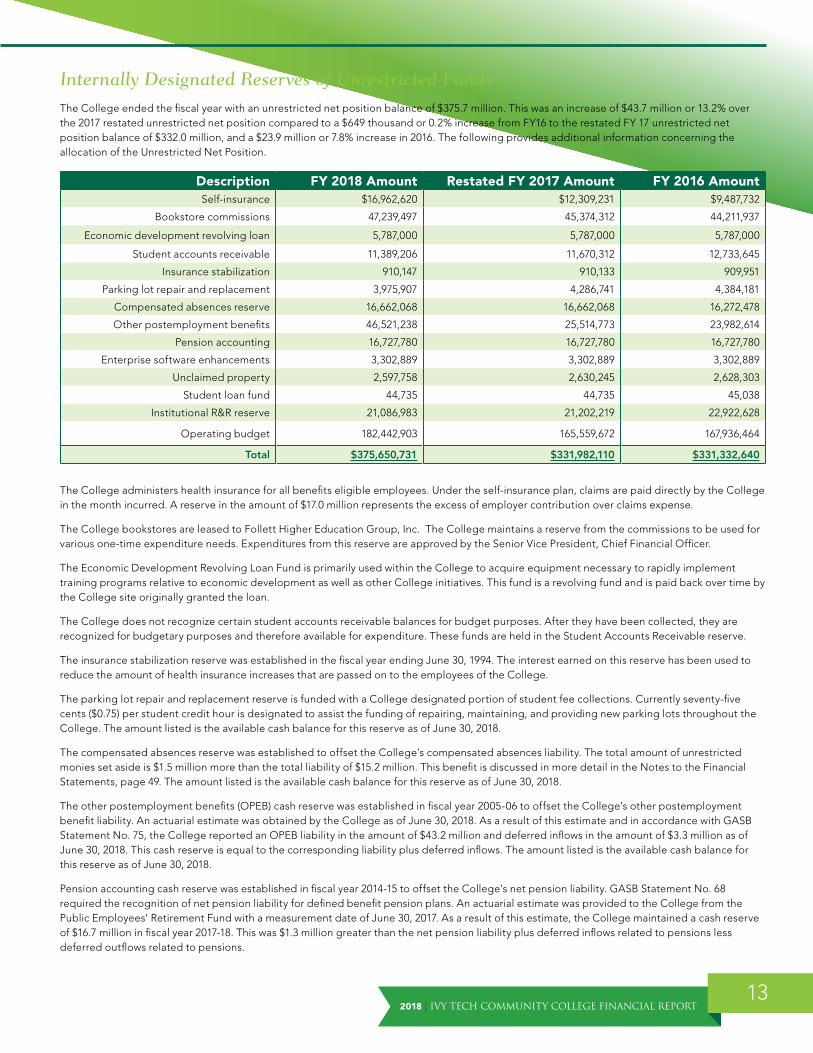
Internally Designated Reserves of Unrestricted FundsThe College ended the fiscal year with an unrestricted net position balance of $375 .7 million . This was an increase of $43 .7 million or 13 .2% over the 2017 restated unrestricted net position compared to a $649 thousand or 0 .2% increase from FY16 to the restated FY 17 unrestricted net position balance of $332 .0 million, and a $23 .9 million or 7 .8% increase in 2016 . The following provides additional information concerning the allocation of the Unrestricted Net Position .
Description FY 2018 Amount Restated FY 2017 Amount FY 2016 AmountSelf-insurance $16,962,620 $12,309,231 $9,487,732
Bookstore commissions 47,239,497 45,374,312 44,211,937
Economic development revolving loan 5,787,000 5,787,000 5,787,000
Student accounts receivable 11,389,206 11,670,312 12,733,645
Insurance stabilization 910,147 910,133 909,951
Parking lot repair and replacement 3,975,907 4,286,741 4,384,181
Compensated absences reserve 16,662,068 16,662,068 16,272,478
Other postemployment benefits 46,521,238 25,514,773 23,982,614
Pension accounting 16,727,780 16,727,780 16,727,780
Enterprise software enhancements 3,302,889 3,302,889 3,302,889
Unclaimed property 2,597,758 2,630,245 2,628,303
Student loan fund 44,735 44,735 45,038
Institutional R&R reserve 21,086,983 21,202,219 22,922,628
Operating budget 182,442,903 165,559,672 167,936,464
Total $375,650,731 $331,982,110 $331,332,640
The College administers health insurance for all benefits eligible employees . Under the self-insurance plan, claims are paid directly by the College in the month incurred . A reserve in the amount of $17 .0 million represents the excess of employer contribution over claims expense .
The College bookstores are leased to Follett Higher Education Group, Inc . The College maintains a reserve from the commissions to be used for various one-time expenditure needs . Expenditures from this reserve are approved by the Senior Vice President, Chief Financial Officer .
The Economic Development Revolving Loan Fund is primarily used within the College to acquire equipment necessary to rapidly implement training programs relative to economic development as well as other College initiatives . This fund is a revolving fund and is paid back over time by the College site originally granted the loan .
The College does not recognize certain student accounts receivable balances for budget purposes . After they have been collected, they are recognized for budgetary purposes and therefore available for expenditure . These funds are held in the Student Accounts Receivable reserve .
The insurance stabilization reserve was established in the fiscal year ending June 30, 1994 . The interest earned on this reserve has been used to reduce the amount of health insurance increases that are passed on to the employees of the College .
The parking lot repair and replacement reserve is funded with a College designated portion of student fee collections . Currently seventy-five cents ($0 .75) per student credit hour is designated to assist the funding of repairing, maintaining, and providing new parking lots throughout the College . The amount listed is the available cash balance for this reserve as of June 30, 2018 .
The compensated absences reserve was established to offset the College’s compensated absences liability . The total amount of unrestricted monies set aside is $1 .5 million more than the total liability of $15 .2 million . This benefit is discussed in more detail in the Notes to the Financial Statements, page 49 . The amount listed is the available cash balance for this reserve as of June 30, 2018 .
The other postemployment benefits (OPEB) cash reserve was established in fiscal year 2005-06 to offset the College’s other postemployment benefit liability . An actuarial estimate was obtained by the College as of June 30, 2018 . As a result of this estimate and in accordance with GASB Statement No . 75, the College reported an OPEB liability in the amount of $43 .2 million and deferred inflows in the amount of $3 .3 million as of June 30, 2018 . This cash reserve is equal to the corresponding liability plus deferred inflows . The amount listed is the available cash balance for this reserve as of June 30, 2018 .
Pension accounting cash reserve was established in fiscal year 2014-15 to offset the College’s net pension liability . GASB Statement No . 68 required the recognition of net pension liability for defined benefit pension plans . An actuarial estimate was provided to the College from the Public Employees’ Retirement Fund with a measurement date of June 30, 2017 . As a result of this estimate, the College maintained a cash reserve of $16 .7 million in fiscal year 2017-18 . This was $1 .3 million greater than the net pension liability plus deferred inflows related to pensions less deferred outflows related to pensions .

IVY TECH COMMUNITY COLLEGE FINANCIAL REPORT | 201814
The enterprise software enhancement reserve has been established to assist the College in maintaining and enhancing the enterprise-wide software programs .
Prior to the repeal of Indiana Code Title 4, Article 10, Chapter 10 in July 2014, the College maintained unclaimed property which consisted of checks that have not been cashed and are greater than two years old . The payees may claim these checks upon the filing of a claim and proof of identity . As of June 30, 2015, checks that have not been cashed are now reported and remitted to the State’s Unclaimed Property division in accordance with the dormancy periods outlined in the State’s unclaimed property laws .
The College maintains a loan fund for the purpose of making short-term loans to students . The funds are derived from a number of different sources .
The College has unrestricted reserves for potential R&R projects within the College .
The operating budget is the remaining amount of the unrestricted net position available for expenditure .
Capital Assets, Net, At Year-End
2018 2017 2016Construction work in progress $11,614,947 $11,008,641 $22,238,899
Land 33,419,704 33,566,492 31,607,504
Land improvements and infrastructure 11,950,049 11,916,071 11,923,158
Buildings 516,058,598 527,304,242 527,212,907
Furniture, fixtures, and equipment 22,890,719 26,016,963 26,090,636
Library materials 424,728 457,293 496,396
Totals $596,358,745 $610,269,702 $619,569,500
During fiscal year 2018, net capital assets decreased by $13 .9 million or 2 .3% compared to a $9 .3 million or 1 .5% decrease in 2017 and a $10 .1 million or 1 .7% increase in 2016 . The decrease in 2017-18 is mainly due to the increase in accumulated depreciation in buildings related to construction and repair and rehabilitation projects completed in 2016-17 . The $3 .1 million or 12 .0% decrease in Furniture, fixtures and equipment can be attributed to the mandatory statewide physical inventory conducted during fiscal year 2018 which resulted in campuses identifying and disposing of equipment no longer in use .
Condensed Statement of Revenues, Expenses and Changes in Net Position
Year Ended June 30 2018 Restated 2017 2016Operating revenues $166,090,169 $165,867,457 $174,988,088
Operating expenses (523,552,179) (531,598,649) (549,933,555)
Total operating losses (357,462,010) (365,731,192) (374,945,467)
Nonoperating revenues 417,024,007 405,602,748 421,242,808
Nonoperating expenses (11,138,470) (10,847,289) (15,817,794)
Income before other revenues, expenses, gains, or losses
48,423,527 29,024,267 30,479,547
Other revenues 12,074,740 10,165,211 8,517,854
Increase in net position 60,498,267 39,189,478 38,997,401
Net position, beginning of year 656,474,286 636,994,535 597,997,134
Net position, end of year before change in accounting standard
676,184,013
Prior period adjustment due to change in accounting standard – See Note XIII
(19,709,727)
Net position, end of year $716,972,553 $656,474,286 $636,994,535
*Fiscal year 2017 data was restated in accordance with GASB Statement No . 75 . Additionally, gains (losses) on sale and disposal of capital assets has been reclassified from other revenues, expenses, gains or losses to nonoperating revenues and expenses for financial statement presentation purposes in fiscal year 2016-2018 . For FY18, the amount was a loss of ($628,779), loss of ($46,681) for FY17, and loss of ($3,431,826) for FY16 .

2018 | IVY TECH COMMUNITY COLLEGE FINANCIAL REPORT15
Operating RevenuesTotal operating revenues for 2018 increased $223 thousand or 0 .1% compared to a decrease of $9 .1 million or 5 .2% in 2017 and a $8 .4 million or 5 .1% increase in 2016 . The following chart and analysis illustrate the 2017-18 operating revenues .
TUITION AND FEES
Student tuition and fees, which include all fees assessed for educational purposes, increased by $2 .3 million or 1 .1% mainly due to an increase in tuition rates and a modest decline in enrollment . Scholarship discounts and allowances represent the difference between the stated fee rates and the amount that is paid by third party payers . The vast majority of the scholarship discounts are paid to the College in the form of Federal and State student financial aid . The scholarship discounts increased by $2 .4 million or 3 .0% compared to fiscal year 2017 due to the change in student aid expense . The net student tuition and fees decreased by $151 thousand or 0 .1% .
GRANTS AND CONTRACTS
Grants and contracts include restricted revenues made available by federal, state, local, and nongovernmental grants and contracts . As outlined on the chart below, Federal sources increased by $424 thousand or 15 .4% due to an increase in federal grant spending . State and local sources decreased by $205 thousand or 1 .5% mainly due to a difference in Perkins funding . During FY17, there was an additional allocation of approximately $300,000 in Perkins funding; there was not an additional allocation in FY18 . Nongovernmental sources decreased $2 .4 million
2017 Operating Revenues 2016 Operating RevenuesOther
4%Other
4%
Grants & contracts13% Grants &
contracts14%
Student tuition & fees, net
79%
Student tuition & fees, net
76%
Auxiliary enterprises
4%Auxiliary
enterprises6%
2018 Operating RevenuesOther
6%
Grants & Contracts
12%
Auxiliary Enterprises
3%
Student tuition & fees, net
79%

IVY TECH COMMUNITY COLLEGE FINANCIAL REPORT | 201816
or 40 .1% due to a decline in spending as activities funded by nongovernmental grants, contracts, and agreements neared completion . In total, revenue from grants and contracts decreased by 9 .7% .
2018 2017 2016Federal grants and contracts $3,180,299 $2,756,738 $3,029,844
State and local grants and contracts 13,327,296 13,532,770 12,868,810
Nongovernmental grants and contracts 3,538,997 5,908,380 8,555,640
$20,046,592 $22,197,888 $24,454,294
Auxiliary EnterprisesAuxiliary enterprises are intended to be self-supporting and supplement the operations of the College . The total auxiliary enterprise revenue was $5 .1 million . The primary revenue source is the commission on bookstore sales . This category decreased by $720 thousand or 12 .4% in 2017-18 primarily due a $569 thousand reduction in bookstore sales commissions .
Operating ExpensesTotal operating expenses decreased by $8 .0 million or 1 .5% in 2018 compared to an $18 .3 million or 3 .3% decrease in 2017 and a $7 .6 million or 1 .4% decrease in 2016 . In 2018, a $7 .2 million decrease in salaries and benefits and a $4 .7 million decrease in scholarships and fellowships offset by a $3 .7 million increase in supply and other service expenses accounted for the majority of the change in total operating expenses . Changes to operating expenses during 2018 are noted below .
COMPENSATION
Salary and wages expense decreased by $2 .4 million or 1 .0% and benefits expense decreased $4 .8 million or 6 .2% . There were workforce reductions at certain campuses that resulted in the salary and wage expense decreasing . The two primary factors for the reduction in benefit expenses were exempt staff’s use of accrued vacation time during the pay transition to two weeks in arrears and surplus self-insurance contributions .
SCHOLARSHIPS AND FELLOWSHIPS
Scholarships and fellowships decreased $4 .7 million or 6 .5% in 2017-18 due to a reduction in enrollment and the number of degree seeking students receiving Federal financial aid .
UTILITIES
Utilities increased $281 thousand or 2 .5% compared to 2016-17 .
SUPPLIES AND OTHER SERVICES
Supplies and other services increased $3 .7 million or 3 .7% . The largest increases were attributable to IncludED expenses of $1 .6 million, $683 thousand in professional services and fees, $678 thousand in apprentice contract expenses, $588 thousand in building repair and rehabilitation costs and $415 thousand in media advertising .
DEPRECIATION
Depreciation expense increased by $33 thousand or 0 .1% in 2018 .
Nonoperating Revenues and ExpensesThis category consists of State and Federal appropriations, investment income, interest on capital asset-related debt, governmental grants and contracts, gains (losses) on sale and disposal of capital assets, gifts and student government support .
Gains (losses) on sale and disposal of capital assets has been reclassified from other revenues, expenses, gains or losses to nonoperating revenues and expenses for financial statement presentation purposes . For FY18, the amount was a loss of ($628,779), loss of ($46,681) for FY17, and loss of ($3,431,826) for FY16 .
Nonoperating revenues increased by $11 .4 million or 2 .8% in 2018 compared to a decrease of $15 .6 million or 3 .7% in 2017 and a $27 .3 million or 6 .1% decrease in 2016 . The major factor for the increase was a $13 .2 million increase in State appropriations and $1 .5 million increase in State grants, which is offset by a decrease in Federal grants and contracts .

2018 | IVY TECH COMMUNITY COLLEGE FINANCIAL REPORT17
In fiscal year 2017-18, Federal grants and contracts totaled $114 .0 million, a reduction of $4 .2 million or 3 .5% from the previous year . State aid awards increased by $1 .5 million or 5 .2% from the previous year . The reduction in Federal awards was due to the decline in enrollment and a reduction of degree-seeking students receiving financial aid . The increase in State aid awards was driven by the new workforce ready grant and higher O’Bannon grants tied to an eligibility change .
Investment income increased by $270 thousand or 9 .3% . This increase can be attributed to market conditions .
Gift revenues increased $775 thousand or 156 .6% due to the establishment of gift funds in fiscal year 2017-18 to better account for revenues and expenses that were previously accounted for in the operating fund or within non-governmental grants and contracts .
Nonoperating expenses increased $291 thousand or 2 .7% during fiscal year 2018 . This is primarily due to an increase in losses from sale and disposal of capital assets offset by a reduction of interest expense on capital asset related debt .
OTHER REVENUES, EXPENSES, GAINS, OR LOSSES
Total other revenues, expenses, gains, or losses consist of capital gifts, grants, and capital appropriations . In total, this category increased by $1 .9 million in 2018 .
In fiscal year 2018, capital appropriations increased by $3 .3 million due to the $3 .0 million cash appropriation for Fort Wayne’s Harshman Hall . Capital gifts and grants decreased by $1 .4 million or 22 .3% primarily due to a decrease in donated capital assets to the College compared to 2016-2017 .
Statement of Cash FlowsAnother way to assess the financial condition of an institution is to look at the Statement of Cash Flows . Its primary purpose is to provide relevant information about the cash receipts and cash payments of an entity during a period . The Statement of Cash Flows also helps users evaluate:
• an entity’s ability to generate future net cash flows
• its ability to meet its obligations as they come due
• its need for external financing
Condensed Statement of Cash Flows
Year Ended June 30 2018 2017 2016Cash provided (used) by:
Operating activities ($319,817,167) ($324,932,972) ($335,879,702)
Noncapital financing activities 409,944,726 401,040,507 418,254,709
Capital and related financing activities (42,548,906) (49,540,851) (56,780,645)
Investing activities 3,583,201 (29,476,956) (38,963,517)
Net increase (decrease) in cash 51,161,854 (2,910,272) (13,369,155)
Cash and cash equivalents, beginning of the year 68,448,794 71,359,066 84,728,221
Cash and cash equivalents, end of the year $119,610,648 $68,448,794 $71,359,066
For the College’s financial statement purposes, cash and cash equivalents are comprised of cash (in banks and on hand) and investments with maturity dates of 0-90 days at date of purchase as of June 30, 2018 . Cash and cash equivalents increased $51 .2 million or 74 .7% this fiscal year . The changes resulted from investment decisions based on market opportunities throughout the year .
Cash used for operating activities decreased by $5 .1 million or 1 .6% in 2018 compared to a decrease of $10 .9 million in 2017 and a $48 .8 million decrease from 2015 to 2016 . The decrease in payments to and on behalf of employees and payments to students accounted for the decrease in operating outflows in 2018 .
Cash provided from noncapital financing activities increased by $8 .9 million or 2 .2% in 2018 compared to a decrease of $17 .2 million in 2017 and a $22 .9 million decrease in 2016 . The largest increase in cash was from State appropriations .
Cash used for capital and related financing activities decreased by $7 .0 million or 14 .1% compared to a decrease of $7 .2 million in 2017 and a $17 .8 million increase from 2015 to 2016 . The largest decrease in the use of cash in 2018 was for the purchase of capital assets .
Cash used for investing activities decreased by $33 .1 million in 2018 compared to a decrease of $9 .5 million in 2017 and a $53 .3 million increase in cash used from 2015 to 2016 . The decrease was due to holding a higher cash balance in response to market opportunities .
According to the authoritative guidance from the GASB, State appropriations and Federal and State financial aid proceeds are to be shown as a non-capital financing activity and not as cash provided by operating activities . This resulted in showing more cash being used for operating activities than cash being provided .

IVY TECH COMMUNITY COLLEGE FINANCIAL REPORT | 201818
Factors Impacting Future PeriodsIvy Tech continues to maintain financial strength and is well positioned to continue to serve the educational and training needs of Hoosiers . Net position continues to grow and the College consistently operates with a positive operating margin . Key financial ratios are strong as evidenced by the Higher Learning Commission’s financial ratios . Both Standard and Poor’s and Fitch Ratings maintain an ‘AA’ with a stable outlook bond rating for the College’s long-term debt .
State of Indiana general fund revenues increased 1 .9% compared to the prior year . The state’s largest source of revenue – sales and use taxes – grew 2 .3% compared to fiscal year 2017, and individual income tax revenue increased 7 .2% . The State ended fiscal year 2018 with reserves totaling $1 .785 billion and a $100 .4 million operating surplus . The most recent economic and revenue forecast (December 2017) projects revenue growth of 3 .6% in fiscal year 2019 . The most recent projection from the Indiana State Budget Agency projects a $24 .6 million operating surplus for the State of Indiana in 2018-19 and combined balances of $1 .9 billion . Similar to 2017-18, during fiscal year 2018-19, the College has targeted a significant portion of increased tuition revenues and state operating funds toward improving student outcomes; recruitment and retention, enhancing workforce alignment and increasing the number of credentials and degrees awarded . The College continues to post strong results under Indiana’s performance funding formula which is used to allocate operating funds to the state’s public universities and colleges . Based on this formula, the College’s state operating appropriation is set to increase 1 .73% in 2018-19 .
Enrollment at Ivy Tech declined in 2017-18, reflecting a continuation of the modest declines for the College in prior years, and consistent with national trends for community colleges . Historical annual unduplicated headcount and FTE are reflected in the following charts .
100,000
90,000
80,000
70,000
60,000
50,000
40,000
30,000
20,000
10,000
0
200,000
180,000
160,000
140,000
120,000
100,000
80,000
60,000
40,000
20,000
0
2009-10 2010-11 2011-12 2012-13 2013-14 2014-15 2015-16 2016-17 2017-18
2009-10 2010-11 2011-12 2012-13 2013-14 2014-15 2015-16 2016-17 2017-18
ANNUALIZED FTE STUDENT ENROLLMENT TREND
ANNUALIZED STUDENT ENROLLMENT TREND

2018 | IVY TECH COMMUNITY COLLEGE FINANCIAL REPORT19
Authorized FacilitiesIn the 2017 General Assembly, the College received a capital bonding allocation of $78 .9 million and cash appropriations of $3 .0 million for capital renovations . Projects receiving bonding include Kokomo $40 .2 million and Muncie $38 .7 million . In addition, the College received a cash appropriation of $3 .0 million for Fort Wayne Harshman Hall . Prior to proceeding with any of these projects, the College received authorization from the Commission for Higher Education, the State Budget Committee, and the Governor . Construction on the Muncie and Kokomo projects began in late spring of 2018 . Tax exempt fee replacement bonds will be issued in July 2018 for the total $78 .9 million pursuant to authority granted in HEA 1001-2017 .
$280,000,000
$240,000,000
$200,000,000
$160,000,000
$120,000,000
$80,000,000
$40,000,000
$0
GROSS STUDENT FEE REVENUE
2009-10 2010-11 2011-12 2012-13 2013-14 2014-15 2015-16 2016-17 2017-18

20IVY TECH COMMUNITY COLLEGE FINANCIAL REPORT | 2018

2018 | IVY TECH COMMUNITY COLLEGE FINANCIAL REPORT21
Ivy Tech Community College of Indiana Statement of Net Position
June 30, 2018 With Comparative Figures at June 30, 20172018 Restated 2017
ASSETSCurrent assets
Cash and cash equivalents $119,610,648 $68,448,794
Cash with fiscal agent 48,803,255 27,060,200
Short-term investments 46,504,334 72,449,934
Accounts receivable 29,873,759 30,922,782
Allowance for doubtful accounts (4,572,889) (5,067,825)
Inventories 15,948 16,318
Prepaid expenses 546,326 928,235
Total current assets 240,781,381 194,758,438
Noncurrent assetsLong-term investments 284,658,217 258,752,014
Capital assets, net 596,358,745 610,269,702
Total noncurrent assets 881,016,962 869,021,716
TOTAL ASSETS 1,121,798,343 1,063,780,154
Deferred outflows of resourcesDeferred outflows related to pension 4,977,771 7,856,302
Total deferred outflows of resources 4,977,771 7,856,302
LIABILITIESCurrent liabilities
Accounts payable and accrued liabilities 31,673,218 26,248,504
Compensated absences 9,946,569 9,844,283
Deposits held in custody for others 4,562,575 6,405,729
Unearned revenue 12,377,122 11,875,223
Current portion of debt obligation 48,766,529 28,224,568
Total current liabilities 107,326,013 82,598,307
Noncurrent liabilitiesCompensated absences 5,246,693 6,817,785
Long-term debt and other obligations 230,317,103 256,153,126
Other postemployment benefits – Note XIII 43,178,310 43,136,472
Net pension liability 16,525,557 19,997,294
Total noncurrent liabilities 295,267,663 326,104,677
TOTAL LIABILITIES 402,593,676 408,702,984
Deferred inflows of resourcesDeferred inflows related to pension 3,866,957 4,371,158
Deferred inflows related to OPEB – Note XIII 3,342,928 2,088,028
Total deferred inflows of resources 7,209,885 6,459,186
NET POSITIONNet investment in capital assets 329,464,818 316,907,188
Restricted for: Capital projects 11,793,225 7,521,210
Restricted for: Endowment 63,779 63,778
Unrestricted – Note XIII 375,650,731 331,982,110
TOTAL NET POSITION $716,972,553 $656,474,286
The accompanying notes to the financial statements are an integral part of this statement

IVY TECH COMMUNITY COLLEGE FINANCIAL REPORT | 201822
Ivy Tech Foundation, Inc. Consolidated Statements of Financial Position
June 30, 2018 and 2017
2018 2017ASSETS
Cash and equivalents $5,272,783 $6,520,756
Investments 17,648,071 16,721,652
Pledges receivable 11,952,799 9,404,543
Prepaid expenses and other assets 401,500 970,614
Property and equipment, net 49,235,459 52,947,283
Receivable from related party 162,051 1,167,801
Net investment in direct financing lease with related party 5,461,870 5,881,644
Note receivable from bank 23,510,509 23,510,509
Beneficial interest in trusts 236,289 209,880
Assets restricted for permanent endowment 32,679,088 31,513,630
TOTAL ASSETS $146,560,419 $148,848,312
LIABILITIESAccounts payable and accrued expenses $1,079,152 $1,175,195
Accounts payable— related party 611,834 1,200,780
Line of credit borrowings 1,664,255 2,712,407
Interest rate swap liability 161,356 248,195
Notes payable and capital lease obligation, net 46,054,476 47,108,516
Other liabilities 363,378 369,794
TOTAL LIABILITIES 49,934,451 52,814,887
NET ASSETSUnrestricted 8,928,349 7,984,330
Restricted:Temporarily restricted 55,018,531 56,535,465
Permanently restricted 32,679,088 31,513,630
Total restricted 87,697,619 88,049,095
TOTAL NET ASSETS 96,625,968 96,033,425
TOTAL LIABILITIES AND NET ASSETS $146,560,419 $148,848,312
See accompanying notes

2018 | IVY TECH COMMUNITY COLLEGE FINANCIAL REPORT23
Ivy Tech Community College of Indiana Statement of Revenues, Expenses, and Changes in Net PositionFor the Year Ended June 30, 2018 With Comparative Figures at June 30, 2017
2018 Restated 2017REVENUESOperating Revenues
Student tuition and fees $213,137,495 $210,876,978
Scholarship allowances (82,730,668) (80,319,394)
Net student tuition and fees 130,406,827 130,557,584
Federal grants and contracts 3,180,299 2,756,738
State and local grants and contracts 13,327,296 13,532,770
Nongovernmental grants and contracts 3,538,997 5,908,380
Sales and services of educational departments 2,091,529 1,970,774
Auxiliary enterprises 5,105,247 5,824,883
Other operating revenues 8,439,974 5,316,328
TOTAL OPERATING REVENUES 166,090,169 165,867,457
EXPENSESOperating Expenses
Salaries and wages 236,285,222 238,665,227
Benefits 72,632,911 77,430,881
Scholarships and fellowships 66,709,610 71,364,259
Utilities 11,659,827 11,378,956
Supplies and other services 103,602,337 99,912,711
Depreciation and amortization 32,662,272 32,629,615
Amortization of deferred loss on refunding - 217,000
TOTAL OPERATING EXPENSES 523,552,179 531,598,649
Operating income (loss) (357,462,010) (365,731,192)
NONOPERATING REVENUES (EXPENSES)State appropriations 267,570,136 254,383,944
Federal appropriations 1,083,804 1,189,496
Investment income 3,179,694 2,909,708
Interest on capital asset-related debt (9,828,754) (10,146,503)
Governmental grants and contracts – federal 114,004,836 118,182,006
Governmental grants and contracts – state 29,914,888 28,442,329
Gain (loss) on sale and disposal of capital assets (680,937) (46,681)
Gifts 1,270,649 495,265
Student government support (628,779) (654,105)
NET NONOPERATING REVENUES 405,885,537 394,755,459
Income (loss) before other revenues, expenses, gains, or losses 48,423,527 29,024,267
Capital gifts and grants 4,756,088 6,118,013
Capital appropriations 7,318,652 4,047,198
Total other revenues and gains 12,074,740 10,165,211
INCREASE IN NET POSITION 60,498,267 39,189,478
Net position—beginning of year 656,474,286 636,994,535
Net Position— end of year before change in accounting standard - 676,184,013
Prior period adjustment to net position change in accounting standard – Note XIII - (19,709,727)
Adjusted net position—end of year $716,972,553 $656,474,286
The accompanying notes to the financial statements are an integral part of this statement

IVY TECH COMMUNITY COLLEGE FINANCIAL REPORT | 201824
Ivy Tech Foundation, Inc. Consolidated Statements of Activities
Years Ended June 30, 2018 and 2017
2018
Unrestricted Temporarily Restricted
Permanently Restricted Total
REVENUE, GAINS AND SUPPORTContributions:
Cash and pledges $806,240 $4,731,300 $839,379 $6,376,919
College assistance for property 500,000 923,332 - 1,423,332
Non-cash - 800,772 - 800,772
Grant revenue - 4,767,906 - 4,767,906
Total contributions 1,306,240 11,223,310 839,379 13,368,929
In-kind contributed operational services 3,485,087 - - 3,485,087
Investment income 1,335,411 2,081,956 32,554 3,449,921
Vending and royalty income 663,502 1,906 - 665,408
Special events income (loss), net of expenses of $444,785 in 2018 and $628,188 in 2017
(8,733) 368,593 110,250 470,110
Real estate rental income 2,193,180 - - 2,193,180
Gain (loss) on sale of property and equipment - 314,583 - 314,583
Uncollectible pledges (1,231) (45,975) - (47,206)
Miscellaneous revenue 29,192 20,462 - 49,654
9,002,648 13,964,835 982,183 23,949,666
Net assets released from restrictions 15,298,494 (15,298,494) - -
Reclassification of donor intent - (183,275) 183,275 -
Total Revenue, Gains and Support 24,301,142 (1,516,934) 1,165,458 23,949,666
EXPENSESFinancial aid to students 3,888,522 - - 3,888,522
Building improvements, supplies and equipment 5,509,535 - - 5,509,535
Faculty and staff development 137,753 - - 137,753
Special programs 1,682,169 - - 1,682,169
Community outreach/promotional expense 1,145,699 - - 1,145,699
Donations to Ivy Tech Community College 291,973 - - 291,973
Donated property to Ivy Tech Community College - - - -
In-kind expense 1,009,389 - - 1,009,389
Real estate rental expenses 4,964,830 - - 4,964,830
Other program expenses 51,687 - - 51,687
Total College Assistance Program expenses 18,681,557 - - 18,681,557
Administrative expenses 1,873,120 - - 1,873,120
Fundraising expenses 2,889,285 - - 2,889,285
Total Expenses 23,443,962 - - 23,443,962
INCREASE (DECREASE) IN NET ASSETS BEFORE GAIN ON INTEREST RATE SWAPS
857,180 (1,516,934) 1,165,458 505,704
Gain on interest rate swaps 86,839 - - 86,839
INCREASE (DECREASE) IN NET ASSETS 944,019 (1,516,934) 1,165,458 592,543
NET ASSETSBeginning of Year 7,984,330 56,535,465 31,513,630 96,033,425
End of Year $8,928,349 $55,018,531 $32,679,088 $96,625,968
See accompanying notes
2018 | IVY TECH COMMUNITY COLLEGE FINANCIAL REPORT25
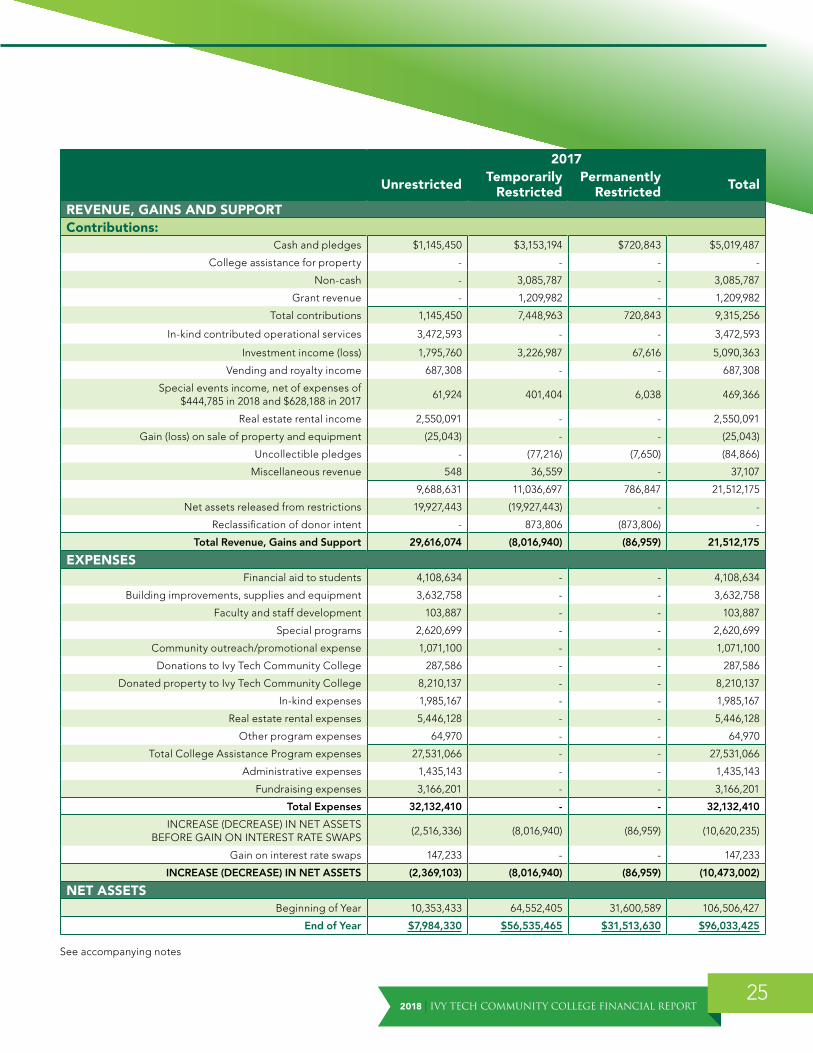
2017
Unrestricted Temporarily Restricted
Permanently Restricted Total
REVENUE, GAINS AND SUPPORTContributions:
Cash and pledges $1,145,450 $3,153,194 $720,843 $5,019,487
College assistance for property - - - -
Non-cash - 3,085,787 - 3,085,787
Grant revenue - 1,209,982 - 1,209,982
Total contributions 1,145,450 7,448,963 720,843 9,315,256
In-kind contributed operational services 3,472,593 - - 3,472,593
Investment income (loss) 1,795,760 3,226,987 67,616 5,090,363
Vending and royalty income 687,308 - - 687,308
Special events income, net of expenses of $444,785 in 2018 and $628,188 in 2017
61,924 401,404 6,038 469,366
Real estate rental income 2,550,091 - - 2,550,091
Gain (loss) on sale of property and equipment (25,043) - - (25,043)
Uncollectible pledges - (77,216) (7,650) (84,866)
Miscellaneous revenue 548 36,559 - 37,107
9,688,631 11,036,697 786,847 21,512,175
Net assets released from restrictions 19,927,443 (19,927,443) - -
Reclassification of donor intent - 873,806 (873,806) -
Total Revenue, Gains and Support 29,616,074 (8,016,940) (86,959) 21,512,175
EXPENSESFinancial aid to students 4,108,634 - - 4,108,634
Building improvements, supplies and equipment 3,632,758 - - 3,632,758
Faculty and staff development 103,887 - - 103,887
Special programs 2,620,699 - - 2,620,699
Community outreach/promotional expense 1,071,100 - - 1,071,100
Donations to Ivy Tech Community College 287,586 - - 287,586
Donated property to Ivy Tech Community College 8,210,137 - - 8,210,137
In-kind expenses 1,985,167 - - 1,985,167
Real estate rental expenses 5,446,128 - - 5,446,128
Other program expenses 64,970 - - 64,970
Total College Assistance Program expenses 27,531,066 - - 27,531,066
Administrative expenses 1,435,143 - - 1,435,143
Fundraising expenses 3,166,201 - - 3,166,201
Total Expenses 32,132,410 - - 32,132,410
INCREASE (DECREASE) IN NET ASSETS BEFORE GAIN ON INTEREST RATE SWAPS
(2,516,336) (8,016,940) (86,959) (10,620,235)
Gain on interest rate swaps 147,233 - - 147,233
INCREASE (DECREASE) IN NET ASSETS (2,369,103) (8,016,940) (86,959) (10,473,002)
NET ASSETSBeginning of Year 10,353,433 64,552,405 31,600,589 106,506,427
End of Year $7,984,330 $56,535,465 $31,513,630 $96,033,425
See accompanying notes

IVY TECH COMMUNITY COLLEGE FINANCIAL REPORT | 201826
Ivy Tech Community College of Indiana Statement of Cash Flows
For the Year Ended June 30, 2018 With Comparative Figures at June 30, 2017
2018 2017CASH FLOWS FROM OPERATING ACTIVITIES
Tuition and fees $132,187,567 $133,513,038
Gifts, grants and contracts 18,777,751 27,681,463
Auxiliary enterprises 4,999,328 5,687,096
Sales and services of educational departments 2,091,529 1,970,774
Payments to suppliers (116,185,456) (112,902,962)
Payments to or on behalf of employees (303,418,250) (314,834,450)
Payments to students (66,709,610) (71,364,259)
Other receipts (payments) 8,439,974 5,316,328
NET CASH PROVIDED (USED) BY OPERATING ACTIVITIES (319,817,167) (324,932,972)
CASH FLOWS FROM NONCAPITAL FINANCING ACTIVITIESFederal and state scholarships & grants 143,919,724 146,624,335
State appropriations 267,570,136 254,383,944
Receipts from direct federal loan proceeds 64,907,484 80,822,027
Payments from direct federal loan proceeds to students/financial institutions (66,928,832) (80,698,390)
Gifts 1,104,993 495,265
Other nonoperating receipts (payments) (628,779) (586,674)
NET CASH PROVIDED (USED) BY NONCAPITAL FINANCING ACTIVITIES 409,944,726 401,040,507
CASH FLOW FROM CAPITAL AND RELATED FINANCING ACTIVITIESCapital/federal appropriations 8,402,457 5,236,694
Capital grants/gifts 4,437,059 4,861,997
Deposit with trustee 417,816 228,297
Deferred outflows - loss on refunding - -
Proceeds from issuance of capital debt 24,534,837 -
Purchase of capital assets (19,595,886) (22,187,912)
Proceeds from sale of capital assets 482,662 -
Principal paid on capital-related debt (49,789,314) (25,999,053)
Interest paid on capital-related debt (11,438,537) (11,680,874)
NET CASH PROVIDED (USED) BY CAPITAL AND RELATED FINANCING ACTIVITIES (42,548,906) (49,540,851)
CASH FLOW FROM INVESTING ACTIVITIESPurchase of investments - (35,000,000)
Proceeds from sales and maturities of investments 39,397 2,606,445
Income on investments 3,543,804 2,916,599
NET CASH PROVIDED (USED) BY INVESTING ACTIVITIES 3,583,201 (29,476,956)
Net increase (decrease) in cash 51,161,854 (2,910,272)
Cash and cash equivalents–beginning of year 68,448,794 71,359,066
Cash and cash equivalents–end of year $119,610,648 $68,448,794

2018 | IVY TECH COMMUNITY COLLEGE FINANCIAL REPORT27
RECONCILIATION OF NET OPERATING REVENUES (EXPENSES) TO NET CASH PROVIDED (USED) BY OPERATING ACTIVITIES 2018 2017
Net Operating Income (Loss) (357,462,010) (365,731,192)
Adjustments to reconcile net operating expenses to cash used by operating activities:Depreciation 32,662,272 32,629,615
Amortization - -
Deferred ouflow – amortization of the loss on refunding - 217,000
Deferred outflow – pension 2,878,531 721,746
Deferred inflow – pension 750,699 (157,934)
Allowance for doubtful accounts 494,936 2,471,507
CHANGES IN ASSETS AND LIABILITIES:Accounts receivable (542,948) 5,396,231
Cash with fiscal agent (92,418) (124,891)
Prepaid expense 381,909 (20,742)
Inventories 370 15,333
Accounts payable and accrued liabilities 5,550,136 (415,110)
Net pension liability (3,471,737) (672,684)
Compensated absences (1,468,806) 389,591
Unearned revenue 501,899 348,558
NET CASH PROVIDED (USED) BY OPERATING ACTIVITIES ($319,817,167) ($324,932,972)
SIGNIFICANT NONCASH TRANSACTIONS Donated assets 75,864 1,256,017
Unrealized gain/(loss) on investments (2,956,561) (1,404,763)
The accompanying notes to the financial statements are an integral part of this statement .

IVY TECH COMMUNITY COLLEGE FINANCIAL REPORT | 201828
Ivy Tech Foundation, Inc. Consolidated Statements of Cash Flows
Years Ended June 30, 2018 and 2017
2018 2017OPERATING ACTIVITIES
Increase (decrease) in net assets $592,543 $(10,473,002)
Adjustments to reconcile increase (decrease) in net assets to net cash used by operating activities:Depreciation of property and equipment 3,084,229 3,350,303
Amortization of debt issuance costs 19,624 63,999
Gain (loss) on sales of property and equipment (314,583) 25,043
Net realized and unrealized gains on investments (1,822,722) (3,577,829)
In-kind contribution of property - (1,060,000)
Contribution of property to Ivy Tech Community College - 8,210,137
Gain on interest rate swap (86,839) (147,233)
Increase in value of beneficial interest in trusts (58,963) (92,174)
(Increase) decrease in certain operating assets:Pledges receivable (2,548,256) 2,121,199
Prepaid expenses and other assets 569,114 (165,331)
Receivable from related party 1,005,750 3,222,353
Increase (decrease) in certain operating liabilities:Accounts payable and accrued expenses (96,043) 150,772
Accounts payable—related party (588,946) (1,985,605)
Contributions restricted for long-term purposes (982,183) (786,847)
Net cash used by operating activities (1,227,275) (1,144,215)
INVESTING ACTIVITIESProceeds from note receivable from related party - 33,000
Proceeds from sales of property and equipment 942,178 5,022,750
Proceeds from direct financing lease with related party 419,774 152,513
Purchases of investments (7,103,282) (6,412,445)
Sales and maturities of investments 7,054,067 8,723,342
Net cash provided by investing activities 1,312,737 7,519,160
FINANCING ACTIVITIESNet borrowings (repayments) on lines of credit (1,048,152) 257,439
Payments on notes payable (778,991) (9,325,062)
Payments on capital lease obligations (294,673) (281,266)
Net change in other liabilities (6,416) (12,772)
Proceeds from contributions restricted for long-term purposes:Investment in permanently restricted endowment 794,797 778,458
Net cash used by financing activities (1,333,435) (8,583,203)
NET DECREASE IN CASH AND EQUIVALENTS (1,247,973) (2,208,258)
CASH AND EQUIVALENTSBeginning of Year 6,520,756 8,729,014
End of Year $5,272,783 $6,520,756
See accompanying notes

2018 | IVY TECH COMMUNITY COLLEGE FINANCIAL REPORT29
IVY TECH FOUNDATION, INC. CONSOLIDATED STATEMENTS OF CASH FLOWS (CONTINUED) YEARS ENDED JUNE 30, 2018 AND 2017
SUPPLEMENTAL DISCLOSURES 2018 2017Interest paid $1,064,260 $ 1,104,032
Noncash investing and financing activities:In-kind contribution of property - 1,060,000
Contribution of property to Ivy Tech Community College - 8,210,137
Receivable from related party related to property sale - 972,750
See accompanying notes

IVY TECH COMMUNITY COLLEGE FINANCIAL REPORT | 201830
IVY TECH COMMUNITY COLLEGE OF INDIANA NOTES TO FINANCIAL STATEMENTS JUNE 30, 2018I. Summary of Significant Accounting Policies
A. GENERAL INFORMATIONIvy Tech Community College of Indiana (Ivy Tech) serves the people of Indiana through accessible and affordable world-class education and adaptive learning . The College empowers students to achieve their career and transfer aspirations . Ivy Tech embraces the vision of economic transformation inspired by the education and earnings attainment of Indiana’s citizens, the vitality of the workforce, and the prosperity of Indiana’s unique and diverse communities . The Indiana General Assembly through IC 20-12-61-2 established Ivy Tech in 1963 . In 2005 the General Assembly adopted Senate Bill 296 which broadened the institution’s mission to include serving as the state’s community college system . Ivy Tech’s official name changed to “Ivy Tech Community College of Indiana .” Ivy Tech is governed by a board of trustees, composed of 15 members, appointed by the governor . According to Indiana law, each Trustee must have knowledge or experience in one or more of the following areas: manufacturing, commerce, labor, agriculture, state and regional economic development needs, and/or Indiana’s educational delivery system . Appointments are made for three year terms on a staggered basis . Ivy Tech has 19 campuses and 25 educational sites located across the State of Indiana . The President’s office and other statewide administrative offices are located in Indianapolis, Indiana .
Ivy Tech Foundation (the Foundation) was incorporated on June 9, 1969, under The Indiana Foundations and Holding Companies Act of 1921 as a corporation organized exclusively for charitable, educational and scientific purposes . The Foundation, whose principal activity is to promote educational, scientific and charitable purposes in connection with or at the request of Ivy Tech Community College (the College), commenced its financial activities with the receipt of various unrestricted contributions in October 1970 and recorded $18 .7 million of expenditures assisting the College during fiscal year 2017-18 . The Foundation currently operates under the Indiana Nonprofit Corporations Law of 1971 as amended, which is codified as IC 23-17 . As required by the GASB Statement No . 39 Determining Whether Certain Organizations Are Component Units and GASB Statement No . 61 The Financial Reporting Entity: Omnibus an amendment of GASB Statements No. 14 and No. 34, the audited financial statements of the Foundation are discretely presented with the College’s financial statements . The Foundation’s fiscal year reporting period is from July 1 through June 30 . Further information regarding the Foundation may be obtained at Ivy Tech Foundation; 50 West Fall Creek Parkway Drive North, Indianapolis, IN 46208-5752 or http://ivytech .edu/giving .
With the implementation of GASB Statement No . 35 Basic Financial Statements and Management’s Discussion and Analysis for Public Colleges and Universities, Ivy Tech is considered a special purpose government . The College has elected to report as a business type activity using proprietary fund accounting and financial reporting model . The College is considered to be a component unit of the State of Indiana .
As such, there is a close relationship between the College and the State of Indiana . The College receives appropriations, program approvals and grants from the State .
The financial statements have been prepared to incorporate all fund groups utilized internally by Ivy Tech . These statements have been prepared in accordance with accounting principles generally accepted in the United States of America as prescribed by GASB Statements No . 34 and 35 . These Statements require the College to report revenues net of discounts and allowances . The following components of the College’s financial statements are also required by GASB Statements No . 34 and 35:
• Management’s Discussion and Analysis
• Basic financial statements including a Statement of Net Position, Statement of Revenues, Expenses and Changes in Net Position, and Statement of Cash Flows for the College as a whole
• Notes to the financial statements
There were new GASB statements that were effective for the fiscal year 2017-18 . The new standards were reviewed and required changes were incorporated . Specifically GASB Statement No . 75 Accounting and Financial Reporting for Postemployment Benefits Other Than Pensions was implemented . The implementation of GASB Statement No . 75 required recognition of the entire OPEB liability, a more comprehensive measure of OPEB expense, and deferred outflows or inflows .
B. BASIS OF ACCOUNTING, MEASUREMENT FOCUS, AND FINANCIAL STATEMENT PRESENTATIONThe College’s financial statements have been prepared in accordance with generally accepted accounting principles accepted in the United States of America, as prescribed by the GASB . The College follows all applicable GASB pronouncements . The College’s financial statements are reported using the economic resources measurement focus and the accrual basis of accounting . Revenues are recorded when earned and expenses are recorded when a liability is incurred, regardless of the timing of related cash flows . Grants and similar items are recognized as revenue as soon as all eligibility requirements imposed by the provider have been met . Eliminations have been made to prevent the double counting of internal activities .
The preparation of financial statements in conformity with accounting principles generally accepted in the United States of America requires management to make estimates and assumptions that affect the reported amounts of assets and liabilities at the date of the financial statements and the reported amounts of revenue and expenses during the reporting period . Actual results could differ from those estimates .
2018 | IVY TECH COMMUNITY COLLEGE FINANCIAL REPORT31
The College utilizes the accounting standard of the establishment of an allowance for doubtful accounts in the Statement of Net Position to reflect receivables that are likely to be uncollectible .
C. OPERATING AND NONOPERATING REVENUES AND EXPENSES
Operating revenues are generated by the primary activities of the College and consist of tuition and fees, non-financial aid grants and contracts, sales and services of educational activities and bookstore commission revenues . Transactions related to financial aid grants, capital and related financing activities, non-capital financing activities, investing activities, State appropriations and gifts are components of nonoperating income . Operating expenses are incurred in carrying out the College’s day-to-day activities, and consist of salaries and wages, fringe benefits, scholarships and fellowships, utilities, supplies and other services, depreciation, and the amortization of deferred loss on refunding . Nonoperating expenses consist of interest on capital asset related debt and student government support .
D. CASH AND CASH EQUIVALENTS
Cash and cash equivalents are comprised of cash (in banks and on hand) and investments with maturity dates of 0-90 days at date of purchase as of June 30, 2018 .
E. INVESTMENTS
Investments are valued at fair value using the 3 levels of measuring fair value in accordance with the GASB Statement No . 72 .
F. PREPAID EXPENSES
Prepaid expenses are payments made in the current or a previous fiscal year, which the College has not realized the full value of through fiscal year 2017-18 .
G. INVENTORIES
Inventories are valued at cost .
H. DEFERRED OUTFLOWS OF RESOURCES
A deferred outflow of resources is a consumption of net position by the College that is applicable to a future reporting period and is reported in a separate section in the Statement of Net Position . Recognition of deferred outflows of resources is limited to those instances identified by the GASB in authoritative pronouncements . The deferred outflow of resources consists of resources related to the College’s defined benefit pension plan and if applicable, the College’s other postemployment benefits plan .
I. COMPENSATED ABSENCES
Liabilities for compensated absences are recorded for eligible employees’ vacation time and for employees meeting eligibility criteria, sick leave as of June 30, 2018 . Accrued time for vacation and sick leave vests to a maximum and is equal to the amount accrued during the preceding 18 months . Unused vacation time is paid out upon termination regardless of age or years of service . The sick leave maximum is equal to 1,056 hours . Unused sick leave is paid out upon retirement only if the employee’s age is a least fifty-five years and their age plus years of service equal seventy-five or more . Employees eligible for this benefit are paid at a rate of one-half the accumulated time up to an accumulated maximum of 100 days .
J. NET PENSION LIABILITY AND RELATED ITEMS
The College participates in the State of Indiana’s Public Employee Retirement Fund (PERF) for full-time support employees hired prior to July 1, 2014 . Net pension liability, deferred outflows of resources, deferred inflows of resources related to pensions, and pension expense are reported based on the College’s allocation provided by PERF and reported in conformance with GASB Statement No . 68 .
K. OTHER POSTEMPLOYMENT LIABILITY AND RELATED ITEMS
The College has a regular other postemployment benefits plan and a 75 plan available to eligible retirees . Other postemployment benefits liability, deferred inflows of resources related to OPEB, and OPEB expense are reported based on an actuarial report for the College’s plan and reported in conformance with GASB Statement No . 75 .
L. DEFERRED INFLOW OF RESOURCES
A deferred inflow of resources is the acquisition of net position by the College that is applicable to a future reporting period and is reported in a separate section in the Statement of Net Position . Recognition of deferred inflows of resources is limited to those instances identified by the GASB in authoritative pronouncements . The deferred inflow of resources consists of resources related to the College’s defined benefit pension and other postemployment benefits plans .
M. CAPITAL ASSETS ACCOUNTING POLICY DISCLOSURE
The College’s capitalization threshold is defined as any non-expendable item, or group of items making up one unit, with a useful life of more than one year, and a unit acquisition cost of $3,000 or more . Library books costing $35 or more are generally capitalized as a group, with the detail maintained and updated periodically as new acquisitions are made or other items are removed .
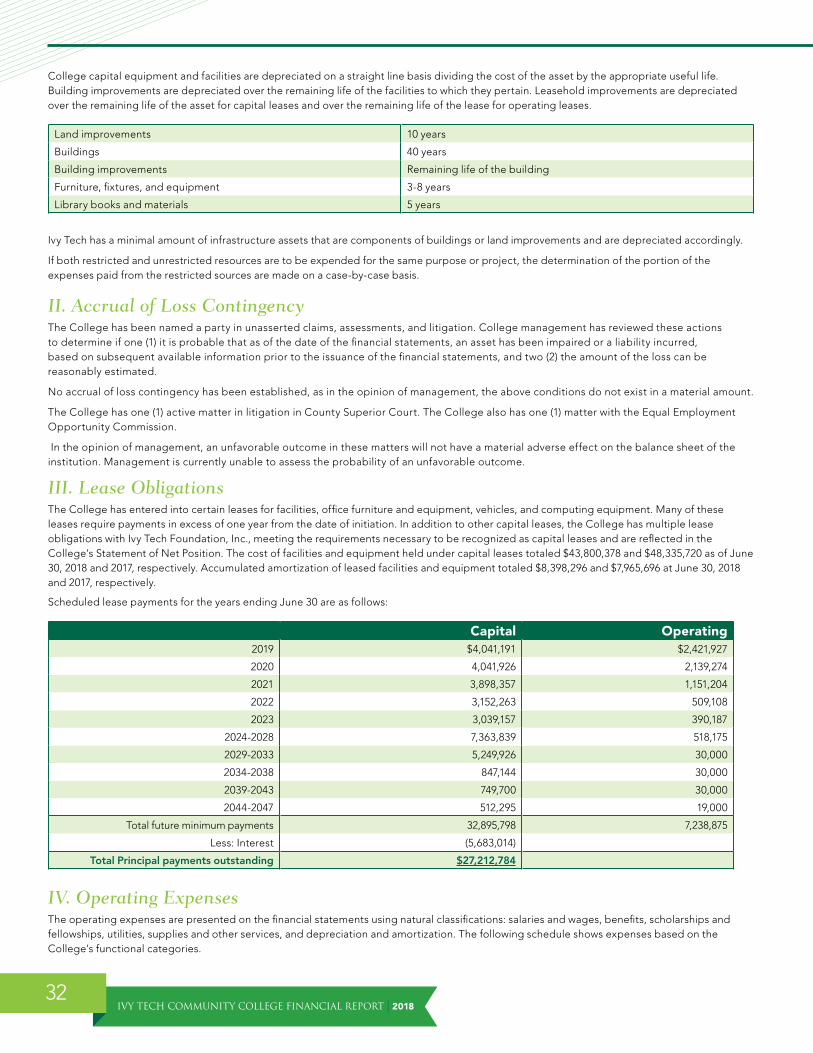
IVY TECH COMMUNITY COLLEGE FINANCIAL REPORT | 201832
College capital equipment and facilities are depreciated on a straight line basis dividing the cost of the asset by the appropriate useful life . Building improvements are depreciated over the remaining life of the facilities to which they pertain . Leasehold improvements are depreciated over the remaining life of the asset for capital leases and over the remaining life of the lease for operating leases .
Land improvements 10 years
Buildings 40 years
Building improvements Remaining life of the building
Furniture, fixtures, and equipment 3-8 years
Library books and materials 5 years
Ivy Tech has a minimal amount of infrastructure assets that are components of buildings or land improvements and are depreciated accordingly .
If both restricted and unrestricted resources are to be expended for the same purpose or project, the determination of the portion of the expenses paid from the restricted sources are made on a case-by-case basis .
II. Accrual of Loss ContingencyThe College has been named a party in unasserted claims, assessments, and litigation . College management has reviewed these actions to determine if one (1) it is probable that as of the date of the financial statements, an asset has been impaired or a liability incurred, based on subsequent available information prior to the issuance of the financial statements, and two (2) the amount of the loss can be reasonably estimated .
No accrual of loss contingency has been established, as in the opinion of management, the above conditions do not exist in a material amount .
The College has one (1) active matter in litigation in County Superior Court . The College also has one (1) matter with the Equal Employment Opportunity Commission .
In the opinion of management, an unfavorable outcome in these matters will not have a material adverse effect on the balance sheet of the institution . Management is currently unable to assess the probability of an unfavorable outcome .
III. Lease ObligationsThe College has entered into certain leases for facilities, office furniture and equipment, vehicles, and computing equipment . Many of these leases require payments in excess of one year from the date of initiation . In addition to other capital leases, the College has multiple lease obligations with Ivy Tech Foundation, Inc ., meeting the requirements necessary to be recognized as capital leases and are reflected in the College’s Statement of Net Position . The cost of facilities and equipment held under capital leases totaled $43,800,378 and $48,335,720 as of June 30, 2018 and 2017, respectively . Accumulated amortization of leased facilities and equipment totaled $8,398,296 and $7,965,696 at June 30, 2018 and 2017, respectively .
Scheduled lease payments for the years ending June 30 are as follows:
Capital Operating2019 $4,041,191 $2,421,927
2020 4,041,926 2,139,274
2021 3,898,357 1,151,204
2022 3,152,263 509,108
2023 3,039,157 390,187
2024-2028 7,363,839 518,175
2029-2033 5,249,926 30,000
2034-2038 847,144 30,000
2039-2043 749,700 30,000
2044-2047 512,295 19,000
Total future minimum payments 32,895,798 7,238,875
Less: Interest (5,683,014)
Total Principal payments outstanding $27,212,784
IV. Operating ExpensesThe operating expenses are presented on the financial statements using natural classifications: salaries and wages, benefits, scholarships and fellowships, utilities, supplies and other services, and depreciation and amortization . The following schedule shows expenses based on the College’s functional categories .
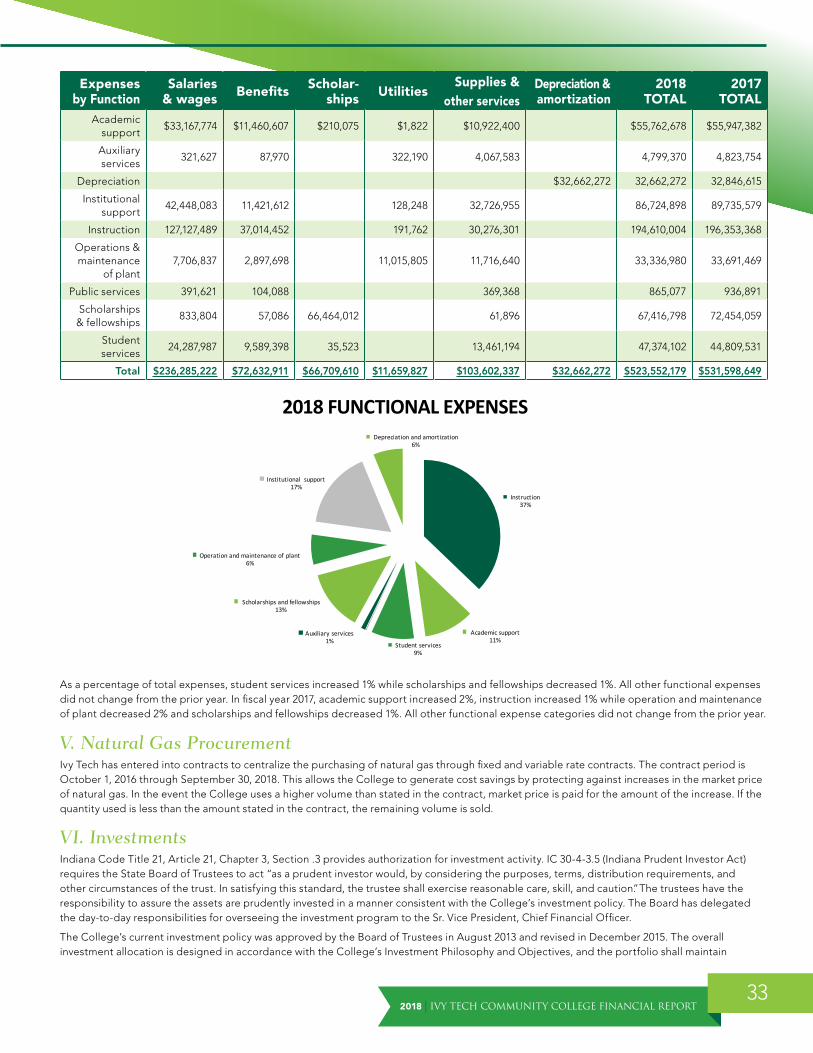
2018 | IVY TECH COMMUNITY COLLEGE FINANCIAL REPORT33
Expenses by Function
Salaries & wages Benefits Scholar-
ships UtilitiesSupplies &
other servicesDepreciation & amortization
2018 TOTAL
2017 TOTAL
Academic support
$33,167,774 $11,460,607 $210,075 $1,822 $10,922,400 $55,762,678 $55,947,382
Auxiliary services
321,627 87,970 322,190 4,067,583 4,799,370 4,823,754
Depreciation $32,662,272 32,662,272 32,846,615
Institutional support
42,448,083 11,421,612 128,248 32,726,955 86,724,898 89,735,579
Instruction 127,127,489 37,014,452 191,762 30,276,301 194,610,004 196,353,368
Operations & maintenance
of plant7,706,837 2,897,698 11,015,805 11,716,640 33,336,980 33,691,469
Public services 391,621 104,088 369,368 865,077 936,891
Scholarships & fellowships
833,804 57,086 66,464,012 61,896 67,416,798 72,454,059
Student services
24,287,987 9,589,398 35,523 13,461,194 47,374,102 44,809,531
Total $236,285,222 $72,632,911 $66,709,610 $11,659,827 $103,602,337 $32,662,272 $523,552,179 $531,598,649
As a percentage of total expenses, student services increased 1% while scholarships and fellowships decreased 1% . All other functional expenses did not change from the prior year . In fiscal year 2017, academic support increased 2%, instruction increased 1% while operation and maintenance of plant decreased 2% and scholarships and fellowships decreased 1% . All other functional expense categories did not change from the prior year .
V. Natural Gas ProcurementIvy Tech has entered into contracts to centralize the purchasing of natural gas through fixed and variable rate contracts . The contract period is October 1, 2016 through September 30, 2018 . This allows the College to generate cost savings by protecting against increases in the market price of natural gas . In the event the College uses a higher volume than stated in the contract, market price is paid for the amount of the increase . If the quantity used is less than the amount stated in the contract, the remaining volume is sold .
VI. InvestmentsIndiana Code Title 21, Article 21, Chapter 3, Section .3 provides authorization for investment activity . IC 30-4-3 .5 (Indiana Prudent Investor Act) requires the State Board of Trustees to act “as a prudent investor would, by considering the purposes, terms, distribution requirements, and other circumstances of the trust . In satisfying this standard, the trustee shall exercise reasonable care, skill, and caution .” The trustees have the responsibility to assure the assets are prudently invested in a manner consistent with the College’s investment policy . The Board has delegated the day-to-day responsibilities for overseeing the investment program to the Sr . Vice President, Chief Financial Officer .
The College’s current investment policy was approved by the Board of Trustees in August 2013 and revised in December 2015 . The overall investment allocation is designed in accordance with the College’s Investment Philosophy and Objectives, and the portfolio shall maintain
2018 FUNCTIONAL EXPENSES
Instruction37%
Academic support11%
Student services9%Public service
0%
Auxiliary services1%
Scholarships and fellowships13%
Operation and maintenance of plant6%
Institutional support17%
Depreciation and amortization6%
2018 FUNCTIONAL EXPENSES

IVY TECH COMMUNITY COLLEGE FINANCIAL REPORT | 201834
a prudently diversified investment portfolio . The investment structure is divided into liquidity tiers to provide for income maximization while meeting the daily liquidity requirements of the College .
Authorized investments include certificates of deposit, interest-bearing deposit accounts, U .S . Government Treasury securities, U .S . Government agency securities, repurchase agreements, commercial paper, money market accounts, investment grade corporate bonds and notes, municipal bonds, and asset and mortgage backed securities .
A. FAIR VALUE MEASUREMENT
As mentioned previously, the mission of Ivy Tech is to serve the people of Indiana through accessible and affordable world-class education and adaptive learning . The College empowers students to achieve their career and transfer aspirations . Ivy Tech embraces the vision of economic transformation inspired by the education and earning attainment of Indiana citizens, the vitality of the workforce, and the prosperity of Indiana's unique and diverse communities . Ivy Tech’s investment portfolio is a source of funds for current and future operations of the College . GASB Statement No . 72, Fair Value Measurement & Application, states that investments must be measured at fair value .
There are 3 levels of measuring fair value . Level 1 consists of quoted prices for identical assets or liabilities in an active market at the measurement date . Level 2 are prices other than those included within Level 1 that are observable, directly or indirectly, and consist of quoted prices for similar assets or liabilities in active or non-active markets . Level 3 are significant, unobservable inputs .
The market approach valuation technique was used . Publicly traded assets are valued in accordance with market quotation and valuation services provided by the College’s investment custodian . Assets that are not publicly traded are valued based on other external sources or valuations provided by the College’s investment custodian . The following chart provides the methodology and hierarchy level for each type of the College’s assets .
Asset Type Source(s) Methodology Hierarchy LevelMoney Market Mutual Funds Not applicable $1 per share 2
Commercial Paper-Discounted U .S . Bank Pricing Unit Matrix pricing 2
U .S . Treasury ObligationsFT Interactive Data, Standard
& Poor’s, or BloombergInstitutional bond quotes 1
U .S . Government Agency Obligations
FT Interactive Data, Standard & Poor’s, or Bloomberg
Institutional bond quotes 2
U .S . Government Agency Mortgage-Backed Pools
FT Interactive Data, Standard & Poor’s, or Bloomberg
Mortgage-backed securities pricing 2
Government Agency REMICSFT Interactive Data, Standard
& Poor’s, or BloombergCollateralized mortgage
obligation source2
Corporate BondsFT Interactive Data, Standard
& Poor’s, or BloombergInstitutional bond quotes 2
Corporate Paydown SecuritiesFT Interactive Data, Standard
& Poor’s, or BloombergCollateralized mortgage
obligation source2
Municipal BondsStandard & Poor’s, FT Interactive
Data, or BloombergEvaluations based on various market and industry inputs
2
Foreign BondsFT Interactive Data—Extel Financial
Ltd, Standard & Poor’s, or BloombergEvaluations based on various market factors
2
As of June 30, 2018, the difference between book value and fair value of the College’s investment portfolio resulted in a decrease of $2,956,561 . Based on the criteria outlined by GASB Statement No . 72, the breakdown by level of the College’s investment portfolio is as follows:
Fair Value Level 1 Level 2 Level 3 Cash & AccrualDemand deposits $108,837,259 $ - $ - $ - $108,837,259
Certificates of Deposit - - - - -
Investment manager cash & cash equivalents
5,629,976 1,979,347 3,624,588 - 26,041
U .S . Treasury & agencies 66,222,752 57,659,625 8,299,720 - 263,407
Agency backed mortgages 19,022,117 896,030 18,085,534 - 40,553
Corporate bonds & notes 133,145,708 - 132,213,412 - 932,296
Structured securities 72,966,130 - 72,836,218 - 129,912
Foreign bonds (in U .S . Dollars) 30,298,582 - 30,116,834 - 181,748
Municipal bonds 9,507,261 - 9,432,948 - 74,313
Total $445,629,785 $60,535,002 $274,609,254 $ - $110,485,529

2018 | IVY TECH COMMUNITY COLLEGE FINANCIAL REPORT35
As of June 30, 2017, the College’s investment portfolio by level is as follows:
Fair Value Level 1 Level 2 Level 3 Cash & AccrualDemand deposits $59,629,831 $ - $ - $ - $59,629,831
Certificates of Deposit 5,000,000 - - - 5,000,000
Investment manager cash & cash equivalents
8,489,597 1,199,652 7,285,469 - 4,476
U .S . Treasury & agencies 59,910,903 50,835,524 8,959,340 - 116,039
Agency backed mortgages 28,539,057 386,901 28,090,752 - 61,404
Corporate bonds & notes 132,599,054 - 131,736,022 - 863,032
Structured securities 69,191,998 - 69,096,165 - 95,833
Foreign bonds (in U .S . Dollars) 23,537,853 - 23,417,532 - 120,321
Municipal bonds 12,423,082 - 12,335,419 - 87,663
Total $ 399,321,375 $52,422,077 $280,920,698 $ - $65,978,600
Separately issued financial statements are not available for the College’s investment portfolio . The College’s investments are included in the cash and equivalents and investments lines of the Asset section in the Statement of Net Position .
B. INTEREST RATE RISK
Interest rate risk refers to the fact that changes in market interest rates may adversely affect the fair value of an investment . Generally the longer the maturity of the investment, the greater the sensitivity of its fair value to changes in market interest rate . One of the ways that the College and its investment managers manage its exposure to interest rate risk is by limiting maturities and ensuring the total portfolio is properly diversified among shorter term and longer term investments .
Information about the sensitivity of the fair values of the College’s investments to market interest rate fluctuations is provided by the following table showing the distribution of Ivy Tech’s investments by maturity as of June 30, 2018:
Fair Value <1 year 1-5 years 6-10 years More than 10 yearsDemand deposits $108,837,259 $108,837,259 $ - $ - $ -
Certificates of Deposit - - - - -
Investment manager cash & cash equivalents
5,629,976 5,629,976 - - -
U .S . Treasury & agencies 66,222,751 14,317,844 51,904,907 - -
Agency backed mortgages 19,022,117 832,012 12,381,231 3,587,257 2,221,617
Corporate bonds & notes 133,145,707 22,573,763 110,571,944 - -
Structured securities 72,966,131 1,713,419 42,612,075 6,849,743 21,790,894
Foreign bonds (in U .S . Dollars) 30,298,582 3,970,327 26,235,107 93,148 -
Municipal bonds 9,507,262 3,096,969 5,907,684 111,632 390,977
Total $445,629,785 $160,971,569 $249,612,948 $10,641,780 $24,403,488
As of June 30, 2017, the College’s investments by maturity were as follows:
Fair Value <1 year 1-5 years 6-10 years More than 10 yearsDemand deposits $59,629,831 $59,629,831 $ - $ - $ -
Certificates of Deposit 5,000,000 5,000,000 - - -
Investment manager cash & cash equivalents
8,489,597 8,489,597 - - -
U .S . Treasury & agencies 59,910,903 18,803,738 41,107,165 - -
Agency backed mortgages 28,539,057 3,935,281 12,616,713 6,836,318 5,150,745
Corporate bonds & notes 132,599,054 33,438,498 99,160,556 - -
Structured securities 69,191,998 476,846 42,770,867 4,666,106 21,278,179
Foreign bonds (in U .S . Dollars) 23,537,853 5,987,605 17,550,248 - -
Municipal bonds 12,423,082 4,807,966 7,578,019 37,097 -
Total $399,321,375 $140,569,362 $220,783,568 $11,539,521 $26,428,924
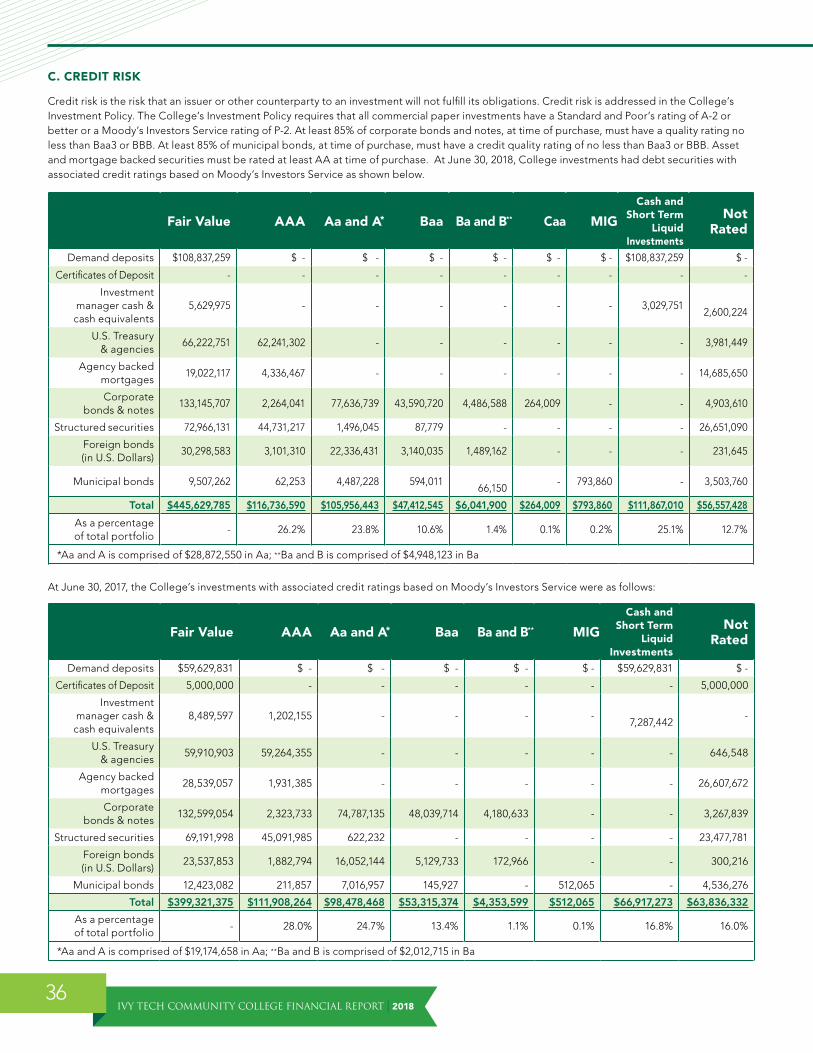
IVY TECH COMMUNITY COLLEGE FINANCIAL REPORT | 201836
C. CREDIT RISK
Credit risk is the risk that an issuer or other counterparty to an investment will not fulfill its obligations . Credit risk is addressed in the College’s Investment Policy . The College’s Investment Policy requires that all commercial paper investments have a Standard and Poor’s rating of A-2 or better or a Moody’s Investors Service rating of P-2 . At least 85% of corporate bonds and notes, at time of purchase, must have a quality rating no less than Baa3 or BBB . At least 85% of municipal bonds, at time of purchase, must have a credit quality rating of no less than Baa3 or BBB . Asset and mortgage backed securities must be rated at least AA at time of purchase . At June 30, 2018, College investments had debt securities with associated credit ratings based on Moody’s Investors Service as shown below .
Fair Value AAA Aa and A* Baa Ba and B** Caa MIG
Cash and Short Term
Liquid Investments
Not Rated
Demand deposits $108,837,259 $ - $ - $ - $ - $ - $ - $108,837,259 $ -
Certificates of Deposit - - - - - - - - -
Investment manager cash & cash equivalents
5,629,975 - - - - - - 3,029,751
2,600,224
U .S . Treasury & agencies
66,222,751 62,241,302 - - - - - - 3,981,449
Agency backed mortgages
19,022,117 4,336,467 - - - - - - 14,685,650
Corporate bonds & notes
133,145,707 2,264,041 77,636,739 43,590,720 4,486,588 264,009 - - 4,903,610
Structured securities 72,966,131 44,731,217 1,496,045 87,779 - - - - 26,651,090
Foreign bonds (in U .S . Dollars)
30,298,583 3,101,310 22,336,431 3,140,035 1,489,162 - - - 231,645
Municipal bonds 9,507,262 62,253 4,487,228 594,011
66,150 - 793,860 - 3,503,760
Total $445,629,785 $116,736,590 $105,956,443 $47,412,545 $6,041,900 $264,009 $793,860 $111,867,010 $56,557,428
As a percentage of total portfolio
- 26 .2% 23 .8% 10 .6% 1 .4% 0 .1% 0 .2% 25 .1% 12 .7%
*Aa and A is comprised of $28,872,550 in Aa; **Ba and B is comprised of $4,948,123 in Ba
At June 30, 2017, the College’s investments with associated credit ratings based on Moody’s Investors Service were as follows:
Fair Value AAA Aa and A* Baa Ba and B** MIG
Cash and Short Term
Liquid Investments
Not Rated
Demand deposits $59,629,831 $ - $ - $ - $ - $ - $59,629,831 $ -
Certificates of Deposit 5,000,000 - - - - - - 5,000,000
Investment manager cash & cash equivalents
8,489,597 1,202,155 - - - -
7,287,442 -
U .S . Treasury & agencies
59,910,903 59,264,355 - - - - - 646,548
Agency backed mortgages
28,539,057 1,931,385 - - - - - 26,607,672
Corporate bonds & notes
132,599,054 2,323,733 74,787,135 48,039,714 4,180,633 - - 3,267,839
Structured securities 69,191,998 45,091,985 622,232 - - - - 23,477,781
Foreign bonds (in U .S . Dollars)
23,537,853 1,882,794 16,052,144 5,129,733 172,966 - - 300,216
Municipal bonds 12,423,082 211,857 7,016,957 145,927 - 512,065 - 4,536,276
Total $399,321,375 $111,908,264 $98,478,468 $53,315,374 $4,353,599 $512,065 $66,917,273 $63,836,332
As a percentage of total portfolio
- 28 .0% 24 .7% 13 .4% 1 .1% 0 .1% 16 .8% 16 .0%
*Aa and A is comprised of $19,174,658 in Aa; **Ba and B is comprised of $2,012,715 in Ba

2018 | IVY TECH COMMUNITY COLLEGE FINANCIAL REPORT37
D. CONCENTRATION OF CREDIT RISK
In the allocation of assets, diversification of investments among asset classes that are not similarly affected by economic, political, or social developments is a highly desirable objective of credit risk . Thus to avoid undue risk concentrations in any single asset class or investment category, the College’s policy requires that certificates of deposit at any one bank do not exceed twenty percent (20%) of the College’s total investment portfolio at the time of investment . Commercial paper may not exceed sixty-five percent (65%) of total investments, and no more than one million ($1,000,000) or ten percent (10%) of the College’s total investment, whichever is less, may be invested in any one company at one time . No more than twenty-five percent (25%) of the total commercial paper portfolio may be invested in a single industry . Corporate bonds and commercial paper shall not exceed sixty-five percent (65%) of the College’s total investment portfolio, and no security of an individual corporate bond or note issuer shall exceed five percent (5%) of the College’s total investment portfolio . Municipal bonds shall not exceed twenty-five percent (25%) of the College’s investment portfolio, and no security of a municipal bond issuer shall exceed five percent (5%) of the College’s total investment portfolio . Combined exposure to non-Government sectors, including commercial paper, corporates, municipal bonds, mortgage-backed, commercial mortgage-backed and asset-backed securities, shall not exceed eighty-five percent (85%) of the College’s total investment portfolio .
The financial institutions that hold five percent (5%) or more of the College’s investments at June 30, 2018:
Name of Institution Amount PercentageLake City Bank $88,612,058 19 .9%
As of June 30, 2017, the financial institutions holding five percent (5%) or more of the College’s investments were as follows:
Name of Institution Amount PercentageLake City Bank $59,629,831 14 .9%
E. CUSTODIAL CREDIT RISKThe custodial credit risk for investments is the risk that, in the event of the failure of the counterparty to a transaction, a government will not be able to recover the value of investment or collateral securities that are in the possession of an outside party . The College manages custodial credit risk through the types of investments that are allowed by the Investment Policy . As of June 30, 2018, Ivy Tech deposits with financial institutions held in uncollateralized accounts are insured up to $250,000 by the FDIC and in excess of $250,000 by the Indiana Public Deposits Insurance Fund . At June 30, 2017, the College held Certificates of Deposits, totaling $5,000,000, which were covered under the Indiana Public Deposits Insurance Fund as they were invested in financial institutions on the approved list of depositories for the Public Deposits Insurance Fund . As of June 30, 2018, the College no longer holds any Certificates of Deposits .
F. FOREIGN CURRENCY RISKAs of June 30, 2018 and June 30, 2017, all of the College’s accounts are in U .S . dollars and not exposed to foreign currency risk .
G. ENDOWMENT AND FOUNDATION INVESTMENTSThe College’s policy regarding the Endowment investments are the same as the College’s investment policy, unless restricted by the Endowment Trustee . The College has two quasi-endowments, valued at $11,739 and $52,040 as of June 30, 2018 and $11,739 and $52,038 as of June 30, 2017, which are reported as restricted for endowment in the Statement of Net Position . Decisions regarding spending are made by the Board of Trustees and authority may be delegated to the Senior Vice President, Chief Financial Officer . Investment income was not spent during FY18 .
Types of investments held by the College’s Foundation, a component unit, are authorized by the Foundation’s Board of Trustees . They include a broader selection of investments including domestic equities, international equities, corporate bonds, mutual funds, certain types of alternative investments (hedge funds, REITS, commodities), certificates of deposit, money market accounts, interest bearing demand deposits insured by FDIC, commercial paper, donated real and personal property, and U .S . Government notes, bills, bonds, and agencies .
VII. Postemployment Benefits Other Than Pensions (OPEB)
PLAN DESCRIPTION
Ivy Tech Community College Post-Retirement Medical/Dental Benefits Plan is a self-administered, single employer defined benefit OPEB plan . No assets are accumulated in a trust that meets the criteria in paragraph 4 of GASB Statement 75, Accounting and Financial Reporting for Postemployment Benefits Other Than Pensions . Ivy Tech Community College Board of Trustees has the authority to establish and amend benefit provisions .
The Plan provides medical and dental benefits to eligible retirees and their spouses and/or dependents . Eligible retirees and their spouse and/or dependents are eligible for benefits under the Plan’s following two tiers . Please note, retirees, spouses, and dependents may stay on the Plan once they are eligible for Medicare; however, Plan coverage is secondary to Medicare .

IVY TECH COMMUNITY COLLEGE FINANCIAL REPORT | 201838
Regular Plan − All employees who retire between the age of fifty-five (55) and up to but not including sixty-five (65) with ten (10) years of benefits-eligible service with the College, or at the age of sixty-five (65) or later with five (5) years of benefits-eligible service with the College may continue participation in College group medical and/or dental benefits . Retirees pay 100% of the premium cost of an active employee .
75 Plan − All employees who retire between the age of fifty-five (55) and sixty-five (65), whose combined age and years of continuous benefit-eligible service equal at least seventy-five (75), were hired on or before December 31, 2008 and were benefits-eligible and continuously employed in a benefits-eligible position on or prior to December 31, 2008, may elect to remain in the College group medical and/or dental programs . Employees who meet the above requirements and remain in the 75 Plan pay the same premium as an active employee, which is subsidized by the College until they become eligible for Medicare at which time they may continue in the regular Plan . All participants in the 75 Plan must have been hired by December 31, 2008; the College is no longer accepting new participants into this Plan .
The expenditure is accrued and recognized under the terms of GASB Statement No . 75, Accounting and Financial Reporting for Postemployment Benefits Other Than Pensions .
As of July 1, 2017 the Plan had 2,629 total participants, 2,476 which are active participants and 153 are inactive participants receiving benefits . As of July 2, 2016, the Plan had 2,801 total participants, 2,608 which were active participants and 193 were inactive participants receiving benefits . There are no inactive participants entitled to but not yet receiving benefits in the College’s plan . The College contributed $3,181,966 to the Plan in fiscal year 2018 and $3,480,003 in fiscal year 2017 .
SIGNIFICANT ACTUARIAL ASSUMPTIONS AND OTHER INPUTS
The total OPEB liability in the June 30, 2018 measurement date was determined using the following actuarial assumptions and other inputs, applied to all periods included in the measurement, unless otherwise specified:
Valuation Date July 1, 2017 census data . Liabilities rolled forward to June 30, 2018 measurement date .
Experience study date 2013
Long-term rate of return on assets Not applicable
Inflation 3 .0%
Salary increases 3 .0%
Discount rate 3 .97% based on the Bond Buyer 20 General Obligation Index as of April 30, 2018
Ad hoc postemployment benefit changes None
Healthcare cost trend rates
Years Pre-65 Medical Dental
2017 7 .00% 5 .00%
2018 6 .00% 5 .00%
2019 5 .00% 5 .00%
The leveraging effect of co-pays, deductibles, and out of pocket limits on medical cost trend is assumed to be immaterial .
Projections of sharing benefit-related costsRetiree contributions are based on the active premium rates without regard to the aging assumption . Per capita contribution rates are $1,470 for medical and $98 for dental for 75 Plan retirees ($10,068 for medical and $490 for dental for Regular retirees)
Mortality RP-2014 White Collar Mortality Table with projection scale MP-2016
Since the prior measurement date, there have been no changes in plan terms . The discount rate, per capita claim cost, per capita contribution, and healthcare cost trend rates are reviewed annually and adjustments made as appropriate; these have been updated since the prior measurement date . The mortality assumption is updated annually to reflect the currently available mortality tables . The remaining assumptions are based on the 2013 experience study .
Total OPEB liability is sensitive to changes in both the discount rate and the health care cost trend rate . The following tables illustrate the potential impact of a one percentage point rate decrease or a one percentage point increase as of June 30, 2018 .
Discount Rate1 % Decrease Current 1 % Increase
$46,691,852 $43,178,310 $39,971,783
Health Care Cost Trend Rate1 % Decrease Current 1 % Increase
$39,226,474 $43,178,310 $47,691,963
As of June 30, 2017, the potential impact of a one percentage point rate decrease or increase was as follows:
Discount Rate1 % Decrease Current 1 % Increase
$46,694,667 $43,136,472 $39,894,814
Health Care Cost Trend Rate1 % Decrease Current 1 % Increase
$39,121,764 $43,136,472 $47,738,251
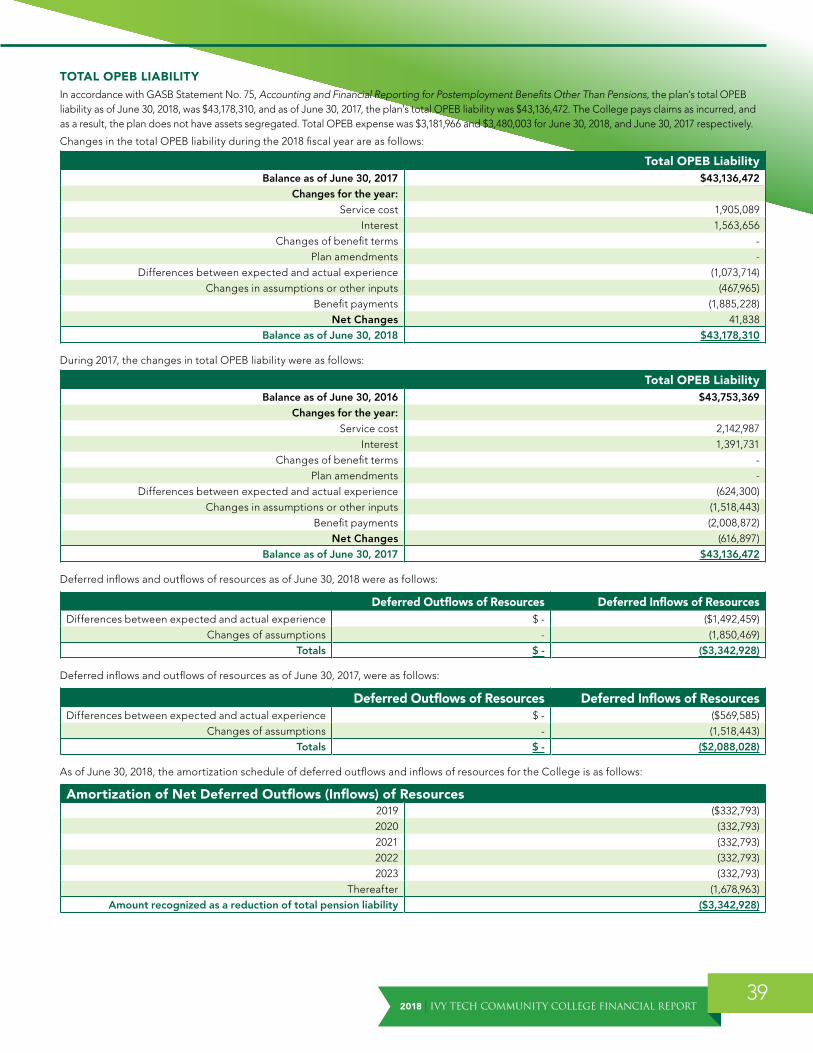
2018 | IVY TECH COMMUNITY COLLEGE FINANCIAL REPORT39
TOTAL OPEB LIABILITYIn accordance with GASB Statement No . 75, Accounting and Financial Reporting for Postemployment Benefits Other Than Pensions, the plan’s total OPEB liability as of June 30, 2018, was $43,178,310, and as of June 30, 2017, the plan’s total OPEB liability was $43,136,472 . The College pays claims as incurred, and as a result, the plan does not have assets segregated . Total OPEB expense was $3,181,966 and $3,480,003 for June 30, 2018, and June 30, 2017 respectively .
Changes in the total OPEB liability during the 2018 fiscal year are as follows:
Total OPEB LiabilityBalance as of June 30, 2017 $43,136,472
Changes for the year: Service cost 1,905,089
Interest 1,563,656 Changes of benefit terms -
Plan amendments - Differences between expected and actual experience (1,073,714)
Changes in assumptions or other inputs (467,965) Benefit payments (1,885,228)
Net Changes 41,838Balance as of June 30, 2018 $43,178,310
During 2017, the changes in total OPEB liability were as follows:
Total OPEB LiabilityBalance as of June 30, 2016 $43,753,369
Changes for the year: Service cost 2,142,987
Interest 1,391,731 Changes of benefit terms -
Plan amendments - Differences between expected and actual experience (624,300)
Changes in assumptions or other inputs (1,518,443) Benefit payments (2,008,872)
Net Changes (616,897)Balance as of June 30, 2017 $43,136,472
Deferred inflows and outflows of resources as of June 30, 2018 were as follows:
Deferred Outflows of Resources Deferred Inflows of ResourcesDifferences between expected and actual experience $ - ($1,492,459)
Changes of assumptions - (1,850,469)Totals $ - ($3,342,928)
Deferred inflows and outflows of resources as of June 30, 2017, were as follows:
Deferred Outflows of Resources Deferred Inflows of ResourcesDifferences between expected and actual experience $ - ($569,585)
Changes of assumptions - (1,518,443)Totals $ - ($2,088,028)
As of June 30, 2018, the amortization schedule of deferred outflows and inflows of resources for the College is as follows:
Amortization of Net Deferred Outflows (Inflows) of Resources2019 ($332,793)2020 (332,793)2021 (332,793)2022 (332,793)2023 (332,793)
Thereafter (1,678,963)Amount recognized as a reduction of total pension liability ($3,342,928)
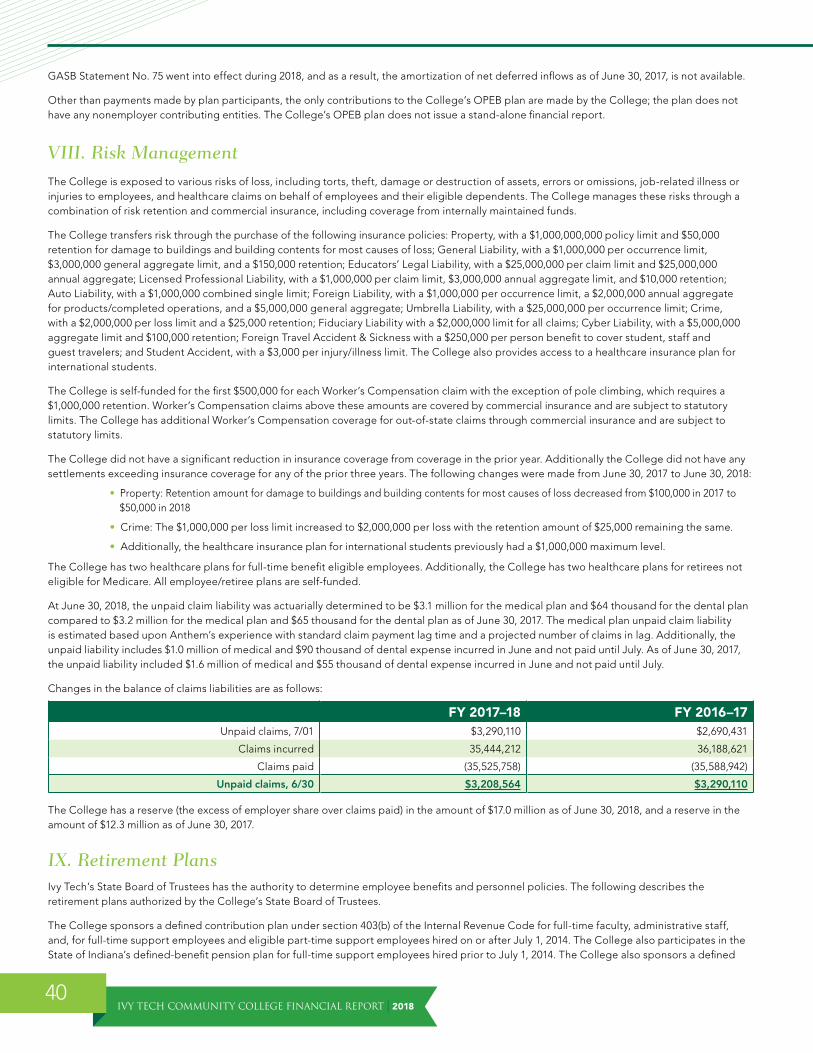
IVY TECH COMMUNITY COLLEGE FINANCIAL REPORT | 201840
GASB Statement No . 75 went into effect during 2018, and as a result, the amortization of net deferred inflows as of June 30, 2017, is not available .
Other than payments made by plan participants, the only contributions to the College’s OPEB plan are made by the College; the plan does not have any nonemployer contributing entities . The College’s OPEB plan does not issue a stand-alone financial report .
VIII. Risk ManagementThe College is exposed to various risks of loss, including torts, theft, damage or destruction of assets, errors or omissions, job-related illness or injuries to employees, and healthcare claims on behalf of employees and their eligible dependents . The College manages these risks through a combination of risk retention and commercial insurance, including coverage from internally maintained funds .
The College transfers risk through the purchase of the following insurance policies: Property, with a $1,000,000,000 policy limit and $50,000 retention for damage to buildings and building contents for most causes of loss; General Liability, with a $1,000,000 per occurrence limit, $3,000,000 general aggregate limit, and a $150,000 retention; Educators’ Legal Liability, with a $25,000,000 per claim limit and $25,000,000 annual aggregate; Licensed Professional Liability, with a $1,000,000 per claim limit, $3,000,000 annual aggregate limit, and $10,000 retention; Auto Liability, with a $1,000,000 combined single limit; Foreign Liability, with a $1,000,000 per occurrence limit, a $2,000,000 annual aggregate for products/completed operations, and a $5,000,000 general aggregate; Umbrella Liability, with a $25,000,000 per occurrence limit; Crime, with a $2,000,000 per loss limit and a $25,000 retention; Fiduciary Liability with a $2,000,000 limit for all claims; Cyber Liability, with a $5,000,000 aggregate limit and $100,000 retention; Foreign Travel Accident & Sickness with a $250,000 per person benefit to cover student, staff and guest travelers; and Student Accident, with a $3,000 per injury/illness limit . The College also provides access to a healthcare insurance plan for international students .
The College is self-funded for the first $500,000 for each Worker’s Compensation claim with the exception of pole climbing, which requires a $1,000,000 retention . Worker’s Compensation claims above these amounts are covered by commercial insurance and are subject to statutory limits . The College has additional Worker’s Compensation coverage for out-of-state claims through commercial insurance and are subject to statutory limits .
The College did not have a significant reduction in insurance coverage from coverage in the prior year . Additionally the College did not have any settlements exceeding insurance coverage for any of the prior three years . The following changes were made from June 30, 2017 to June 30, 2018:
• Property: Retention amount for damage to buildings and building contents for most causes of loss decreased from $100,000 in 2017 to $50,000 in 2018
• Crime: The $1,000,000 per loss limit increased to $2,000,000 per loss with the retention amount of $25,000 remaining the same .
• Additionally, the healthcare insurance plan for international students previously had a $1,000,000 maximum level .
The College has two healthcare plans for full-time benefit eligible employees . Additionally, the College has two healthcare plans for retirees not eligible for Medicare . All employee/retiree plans are self-funded .
At June 30, 2018, the unpaid claim liability was actuarially determined to be $3 .1 million for the medical plan and $64 thousand for the dental plan compared to $3 .2 million for the medical plan and $65 thousand for the dental plan as of June 30, 2017 . The medical plan unpaid claim liability is estimated based upon Anthem’s experience with standard claim payment lag time and a projected number of claims in lag . Additionally, the unpaid liability includes $1 .0 million of medical and $90 thousand of dental expense incurred in June and not paid until July . As of June 30, 2017, the unpaid liability included $1 .6 million of medical and $55 thousand of dental expense incurred in June and not paid until July .
Changes in the balance of claims liabilities are as follows:
FY 2017–18 FY 2016–17Unpaid claims, 7/01 $3,290,110 $2,690,431
Claims incurred 35,444,212 36,188,621
Claims paid (35,525,758) (35,588,942)
Unpaid claims, 6/30 $3,208,564 $3,290,110
The College has a reserve (the excess of employer share over claims paid) in the amount of $17 .0 million as of June 30, 2018, and a reserve in the amount of $12 .3 million as of June 30, 2017 .
IX. Retirement PlansIvy Tech’s State Board of Trustees has the authority to determine employee benefits and personnel policies . The following describes the retirement plans authorized by the College’s State Board of Trustees .
The College sponsors a defined contribution plan under section 403(b) of the Internal Revenue Code for full-time faculty, administrative staff, and, for full-time support employees and eligible part-time support employees hired on or after July 1, 2014 . The College also participates in the State of Indiana’s defined-benefit pension plan for full-time support employees hired prior to July 1, 2014 . The College also sponsors a defined
2018 | IVY TECH COMMUNITY COLLEGE FINANCIAL REPORT41
contribution plan under section 457(b) of the Internal Revenue Code in which all employees are eligible to participate . Additionally, the College sponsors a defined contribution plan under section 401(a) for certain eligible employees of the College . This plan is a governmental plan as defined under section 414(d) and section 3(32) of the Employee Retirement Income Security Act of 1974 . As part of this plan, the College adopted the Qualified Excess Benefit Arrangement (QEBA) under section 415(m) (3) . The sole purpose of the Arrangement is to provide for contributions that would have been made to the 401(a) plan absent the limitations of section 415(c) .
The College provided retirement plan coverage to 3,053 and 3,079 active employees as of June 30, 2018, and June 30, 2017, respectively .
A. IVY TECH COMMUNITY COLLEGE OF INDIANA DEFINED CONTRIBUTION RETIREMENT PLAN
Full-time faculty, administrative staff, full-time support employees hired after July 1, 2014 and eligible part-time support employees are eligible to receive a nonelective contribution to the defined contribution retirement plan sponsored by the College . The College contributes a fixed percentage of compensation on behalf of each eligible employee to the plan . The participation date for eligible employees is determined by their personnel position classification . The employee immediately vests, upon eligibility and participation in the plan .
During the fiscal year ending June 30, 2018, the College remitted $21 .0 million to Transamerica, representing $148 .3 million in total salaries compared to the $20 .8 million remitted to Transamerica representing $145 .3 million in salaries as of June 30, 2017 . During both fiscal year 2017 and 2018, there were no forfeitures recognized by the College during the reporting period, and there are no assets held in a trust as defined in GASB Statement No . 73 . On June 30, 2018, there were 2,620 employees participating in the defined contribution retirement plan compared to 2,561 employees participating on June 30, 2017 .
All employees of the College are also eligible to voluntarily defer a portion of their salary to this retirement plan .
B. PUBLIC EMPLOYEES’ RETIREMENT FUND
Plan DescriptionThe Indiana Public Retirement System (INPRS) administers nine pension trust funds including eight defined benefit retirement plans and one defined contribution retirement plan, two other postemployment benefit funds and one agency fund . The College participates in the Public Employees’ Retirement Fund (PERF) for full-time, non-exempt employees hired prior to July 1, 2014, which is one of the eight defined benefit retirement plans .
The PERF is a cost sharing multiple-employer defined benefit plan based on 35 IAC 21-1-1, 35 IAC 21-1-2 and amended IC 5-10 .2-2-11(b) . PERF was established to provide retirement, disability, and survivor benefits to full-time employees of the State of Indiana not covered by another plan, those political subdivisions that elect to participate in the retirement plan, and certain INPRS employees . There are two tiers to the PERF Plan . The first is the Public Employees’ Defined Benefit Plan (PERF Hybrid Plan) and the second is the My Choice: Retirement Savings Plan for Public Employees (My Choice), formerly known as Public Employees’ Annuity Savings Account Only Plan (PERF ASA Only Plan) . The College participates in the PERF Hybrid Plan .
The PERF Hybrid Plan was established by the Indiana Legislature in 1945 and is governed by the INPRS Board of Trustees in accordance with Indiana Code (IC) 5-10 .2, IC 5-10 .3, and IC 5-10 .5 . There are two aspects to the PERF Hybrid Plan defined benefit structure . The first portion is the monthly defined benefit pension that is funded by the employer . The second portion of the PERF Hybrid Plan benefit structure is the annuity savings account (ASA) that supplements the defined benefit at retirement .
Complete financial statements for INPRS are available online at www .in .gov/inprs/annualreports .htm
MembershipPERF members are officers and employees of units of State and local governments in Indiana (referred to as political subdivisions), including counties, cities, towns, townships, libraries, and school corporations . The political subdivisions become participants by ordinance or resolution of the governing body, which specifies the classifications of employees who will become members of the plan . The ordinance or resolution is filed with and approved by INPRS . In order to be a member, employees hired after June 30, 1982, except employees of a participating school corporation, must occupy positions normally requiring performance of service of more than 1,000 hours during a year .
ContributionsThe College is obligated by statute to make contributions to PERF, which are determined by the INPRS Board of Trustees based on actuarial investigation and valuation in accordance with IC 5-10 .2-2-11 . The funding policy provides for periodic employer contributions at actuarially determined rates that, expressed as percentages of annual covered payroll, are sufficient to fund the pension benefits when they become due . As PERF is a cost-sharing plan, all risks and costs, including benefit costs, are shared proportionately by the participating employers . During fiscal year 2018, the College was required to contribute 11 .2% of covered payroll, which totaled $1,766,008 . In fiscal year 2017, the College contributed $2,058,160 . The PERF Hybrid Plan members contribute 3% of covered payroll to their annuity savings account, which is not used to fund the defined benefit pension for the PERF Hybrid Plan . The employer may elect to make the contributions to the annuity savings account on behalf of the member, which is the case with the College .

IVY TECH COMMUNITY COLLEGE FINANCIAL REPORT | 201842
Retirement Benefits – Defined Benefit Pension The PERF Hybrid Plan retirement benefit consists of the sum of a defined pension benefit provided by employer contributions plus the amount credited to the member’s annuity savings account . Pension benefits (non ASA) vest after 10 years of creditable service . Members are immediately vested in their annuity savings account .
A member who has reached age 65 and has at least 10 years of creditable service is eligible for normal retirement and, as such, is entitled to 100% of the pension benefit component . This annual pension benefit is equal to 1 .1% times the average annual compensation times the number of years of creditable service . The average annual compensation in this calculation uses the highest 20 calendar quarters of salary in a covered position . All 20 calendar quarters do not need to be continuous, but they must be in groups of four consecutive calendar quarters . Members may be eligible for reduced pension benefit based on age and years of service .
The monthly pension benefits for members in pay status may be increased periodically as cost of living adjustments (COLA) . Such increases are not guaranteed by statute and have historically been provided on an “ad hoc” basis and can only be granted by the Indiana General Assembly . There was no COLA for the year ended June 30, 2017 or June 30, 2016 . Eligible members received a one-time check in September 2016 and September 2015 with the amount of the one-time checks ranged from $150 to $450, depending upon a member’s years of service, and was for a member who retired or was disabled on or before December 1, 2015 or 2014, and who was entitled to receive a monthly benefit on July 1, 2016 or 2015 .
Disability and Survivor Benefits The PERF Hybrid Plan also provides disability and survivor benefits . A member who has at least five years of creditable service and becomes disabled while in active service, on FMLA leave, receiving workers’ compensation benefits, or receiving employer-provided disability insurance benefits may retire for the duration of the disability, if the member has qualified for social security disability benefits and has furnished proof of the qualification . The disability benefit is calculated the same as that for a normal retirement without reduction for early retirement .
Upon the death in service of a member with 15 or more years of creditable service as of January 1, 2007, a survivor benefit may be paid to the surviving spouse to whom the member had been married for two or more years, or surviving dependent children under the age of 18 .
Retirement Benefits – Annuity Savings Account Members are required to participate in an Annuity Savings Account (ASA) . The ASA consists of the member’s contributions, set by statute at 3% of compensation as defined by IC 5-10 .2-3-2 for PERF, plus the interest/earnings or losses credited to the member’s account . A member’s contributions and interest credits belong to the member and do not belong to the State or the College .
Investments in the members’ annuity savings accounts are individually directed and controlled by plan participants who direct the investment of their account balances among eight investment options, with varying degrees of risk and return potential .
SIGNIFICANT ACTUARIAL ASSUMPTIONS
Key methods and assumptions used in calculating the total pension liability in the latest actuarial valuations for the College’s participation in PERF at June 30, 2018 and June 30, 2017 are below .
Valuation Date:Assets June 30, 2017
LiabilitiesJune 30, 2016 – Member census data as of June 30, 2016 was used in the valuation and adjusted, where appropriate, to reflect changes between June 30, 2016 and June 30, 2017 . Standard actuarial roll forward techniques were then used to project the total pension liability computed as of June 30, 2016 to June 30, 2017 .
Actuarial Assumptions:Experience study date Period of 4 years ended June 30, 2014
Investment rate of return 6 .75%, net of investment expense, including inflation
Cost of living increase 1 .0%
Future salary increases 2 .50%-4 .25%
Inflation 2 .25%
Mortality – HealthyRP-2014 Total Data Set Mortality Table, with Social Security Administration
generational improvement scale from 2006
Mortality – DisabledRP-2014 Disabled Mortality Table, with Social Security Administration
generational improvement scale from 2006
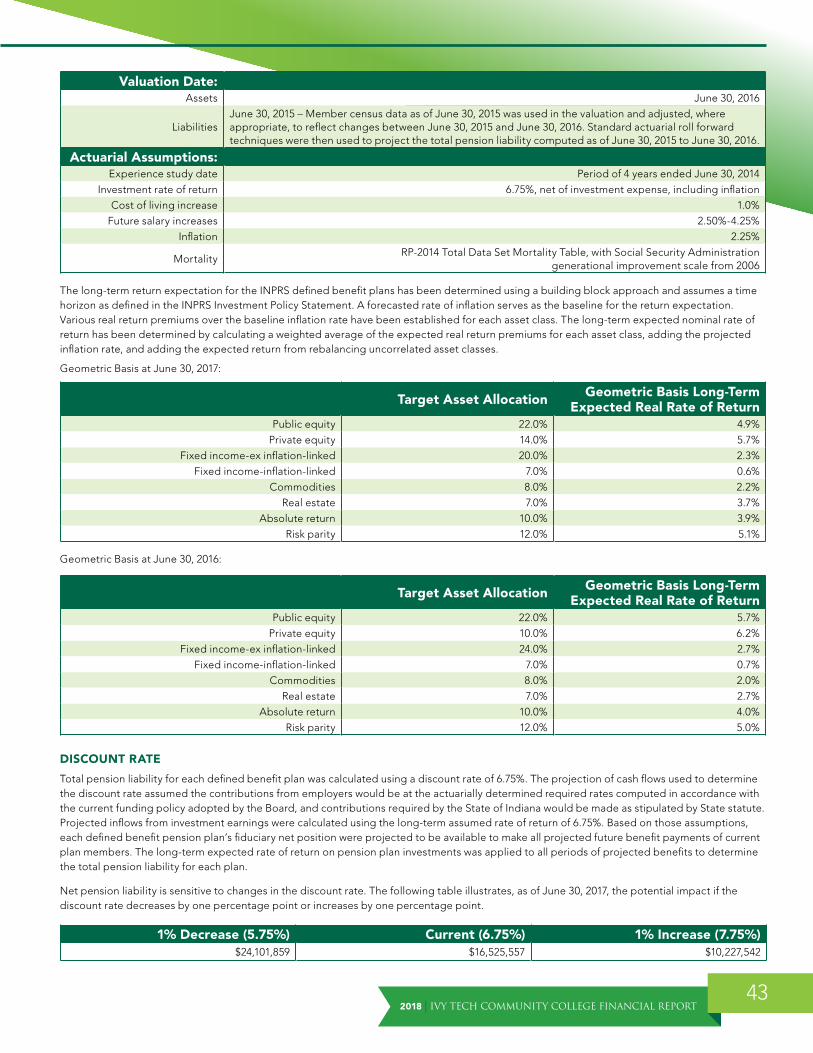
2018 | IVY TECH COMMUNITY COLLEGE FINANCIAL REPORT43
Valuation Date:Assets June 30, 2016
LiabilitiesJune 30, 2015 – Member census data as of June 30, 2015 was used in the valuation and adjusted, where appropriate, to reflect changes between June 30, 2015 and June 30, 2016 . Standard actuarial roll forward techniques were then used to project the total pension liability computed as of June 30, 2015 to June 30, 2016 .
Actuarial Assumptions:Experience study date Period of 4 years ended June 30, 2014
Investment rate of return 6 .75%, net of investment expense, including inflationCost of living increase 1 .0%
Future salary increases 2 .50%-4 .25%Inflation 2 .25%
MortalityRP-2014 Total Data Set Mortality Table, with Social Security Administration
generational improvement scale from 2006
The long-term return expectation for the INPRS defined benefit plans has been determined using a building block approach and assumes a time horizon as defined in the INPRS Investment Policy Statement . A forecasted rate of inflation serves as the baseline for the return expectation . Various real return premiums over the baseline inflation rate have been established for each asset class . The long-term expected nominal rate of return has been determined by calculating a weighted average of the expected real return premiums for each asset class, adding the projected inflation rate, and adding the expected return from rebalancing uncorrelated asset classes .
Geometric Basis at June 30, 2017:
Target Asset Allocation Geometric Basis Long-Term Expected Real Rate of Return
Public equity 22 .0% 4 .9%Private equity 14 .0% 5 .7%
Fixed income-ex inflation-linked 20 .0% 2 .3%Fixed income-inflation-linked 7 .0% 0 .6%
Commodities 8 .0% 2 .2%Real estate 7 .0% 3 .7%
Absolute return 10 .0% 3 .9%Risk parity 12 .0% 5 .1%
Geometric Basis at June 30, 2016:
Target Asset Allocation Geometric Basis Long-Term Expected Real Rate of Return
Public equity 22 .0% 5 .7%Private equity 10 .0% 6 .2%
Fixed income-ex inflation-linked 24 .0% 2 .7%Fixed income-inflation-linked 7 .0% 0 .7%
Commodities 8 .0% 2 .0%Real estate 7 .0% 2 .7%
Absolute return 10 .0% 4 .0%Risk parity 12 .0% 5 .0%
DISCOUNT RATE
Total pension liability for each defined benefit plan was calculated using a discount rate of 6 .75% . The projection of cash flows used to determine the discount rate assumed the contributions from employers would be at the actuarially determined required rates computed in accordance with the current funding policy adopted by the Board, and contributions required by the State of Indiana would be made as stipulated by State statute . Projected inflows from investment earnings were calculated using the long-term assumed rate of return of 6 .75% . Based on those assumptions, each defined benefit pension plan’s fiduciary net position were projected to be available to make all projected future benefit payments of current plan members . The long-term expected rate of return on pension plan investments was applied to all periods of projected benefits to determine the total pension liability for each plan .
Net pension liability is sensitive to changes in the discount rate . The following table illustrates, as of June 30, 2017, the potential impact if the discount rate decreases by one percentage point or increases by one percentage point .
1% Decrease (5.75%) Current (6.75%) 1% Increase (7.75%)$24,101,859 $16,525,557 $10,227,542

IVY TECH COMMUNITY COLLEGE FINANCIAL REPORT | 201844
The following table illustrates, as of June 30, 2016, the potential impact if the discount rate decreases by one percentage point or increases by one percentage point .
1% Decrease (5.75%) Current (6.75%) 1% Increase (7.75%)$28,720,849 $19,997,294 $12,746,701
PENSION PLAN’S FIDUCIARY NET POSITION
INPRS is a pension trust fund of the State of Indiana for financial statement reporting purposes . The financial statements of INPRS are prepared using the accrual basis of accounting in conformity with generally accepted accounting principles as applied to governments . Under the accrual basis, revenues are recognized when earned, and expenses are recognized when liabilities are incurred, regardless of the timing of related cash flows . INPRS applies all applicable GASB pronouncements in accounting and reporting for its operations .
Pension, disability, special death benefits, and distributions of contributions and interest are recognized when due and payable to members or beneficiaries . Benefits are paid once the retirement or survivor applications have been processed and approved . Distributions of contributions and interest are distributions from inactive, non-vested members’ annuity savings accounts . These distributions may be requested by members or auto-distributed by the fund when certain criteria are met .
The pooled and non-pooled investments are reported at fair value . Fair value is the amount at which an investment could be exchange in a current transaction between willing parties, other than in a forced or liquidation sale .
Additional information regarding the plan’s fiduciary net position may be found online at http://www .in .gov/inprs/annualreports .htm .
OTHER INFORMATION
Ivy Tech Community College’s proportionate share of the collective net pension liability is $16,525,557, which is 0 .3704% of PERF’s total net pension liability . The College’s proportion of the net pension liability was based on wages reported by employers relative to the collective wages of the plan . The measurement date of the collective net pension liability is June 30, 2017 . The actuarial valuation date upon which the total pension liability is based, is June 30, 2016 . Standard actuarial roll forward techniques were used to project the total pension liability computed as of June 30, 2016 to June 30, 2017 .
The contribution rates were calculated as of June 30, and the newly calculated contribution rates will become effective either July 1, 2017 or January 1, 2018 .
There are no changes between the measurement date and the employer’s reporting date that are expected to have a significant impact on the employer’s proportionate share of the collective net pension liability . Full-time, non-exempt employees hired after July 1, 2014, are no longer added to PERF; over time, this may impact the College’s proportionate share of the collective net pension liability .
In accordance with GASB Statement No . 68, Accounting and Financial Reporting for Pensions—An Amendment of GASB Statement No. 27, and GASB Statement No . 71, Pension Transition for Contributions Made Subsequent to the Measurement Date, the College’s net pension liability reported as of June 30, 2018, is $16,525,557 and $19,997,294 as of June 30, 2017 . The College’s total pension expense was $654,945 and $1,962,947 as of June 30, 2018 and 2017, respectively . Deferred inflows and outflows of resources were as follows . As of June 30, 2018:
Deferred Outflows of Resources
Deferred Inflows of Resources
Differences between expected and actual experience $313,838 $12,825
Net difference between projected and actual earnings on pension plan investments 2,614,053 828,534
Changes of assumptions 265,331 -
Changes in proportion and differences between employer contributions and proportionate share of contributions
18,541 3,025,598
Employer contributions subsequent to measurement date 1,766,008 -
Totals $4,977,771 $3,866,957
As of June 30, 2017:
Deferred Outflows of Resources
Deferred Inflows of Resources
Differences between expected and actual experience $448,014 $36,914
Net difference between projected and actual earnings on pension plan investments 4,398,323 1,125,171
Changes of assumptions 882,296 -
Changes in proportion and differences between employer contributions and proportionate share of contributions
55,852 3,209,072
Employer contributions subsequent to measurement date 2,071,818 -
Totals $7,856,303 $4,371,157
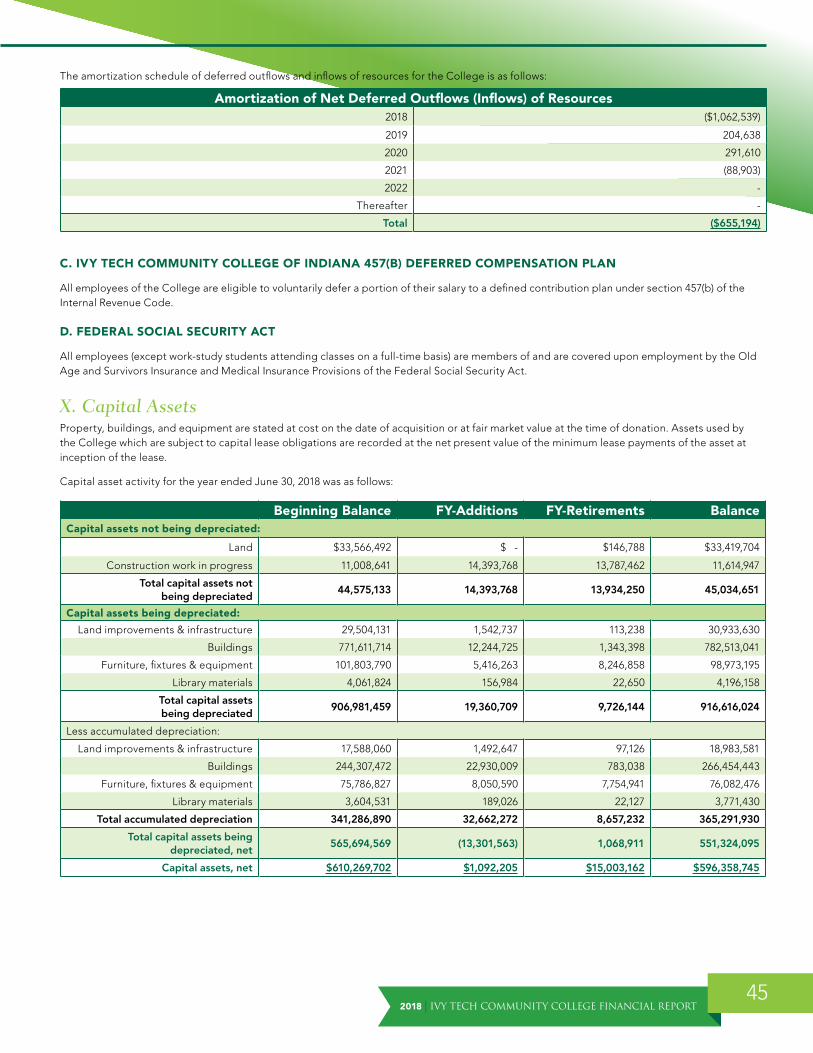
2018 | IVY TECH COMMUNITY COLLEGE FINANCIAL REPORT45
The amortization schedule of deferred outflows and inflows of resources for the College is as follows:
Amortization of Net Deferred Outflows (Inflows) of Resources2018 ($1,062,539)
2019 204,638
2020 291,610
2021 (88,903)
2022 -
Thereafter -
Total ($655,194)
C. IVY TECH COMMUNITY COLLEGE OF INDIANA 457(B) DEFERRED COMPENSATION PLAN
All employees of the College are eligible to voluntarily defer a portion of their salary to a defined contribution plan under section 457(b) of the Internal Revenue Code .
D. FEDERAL SOCIAL SECURITY ACT
All employees (except work-study students attending classes on a full-time basis) are members of and are covered upon employment by the Old Age and Survivors Insurance and Medical Insurance Provisions of the Federal Social Security Act .
X. Capital AssetsProperty, buildings, and equipment are stated at cost on the date of acquisition or at fair market value at the time of donation . Assets used by the College which are subject to capital lease obligations are recorded at the net present value of the minimum lease payments of the asset at inception of the lease .
Capital asset activity for the year ended June 30, 2018 was as follows:
Beginning Balance FY-Additions FY-Retirements BalanceCapital assets not being depreciated:
Land $33,566,492 $ - $146,788 $33,419,704
Construction work in progress 11,008,641 14,393,768 13,787,462 11,614,947
Total capital assets not being depreciated
44,575,133 14,393,768 13,934,250 45,034,651
Capital assets being depreciated:
Land improvements & infrastructure 29,504,131 1,542,737 113,238 30,933,630
Buildings 771,611,714 12,244,725 1,343,398 782,513,041
Furniture, fixtures & equipment 101,803,790 5,416,263 8,246,858 98,973,195
Library materials 4,061,824 156,984 22,650 4,196,158
Total capital assets being depreciated
906,981,459 19,360,709 9,726,144 916,616,024
Less accumulated depreciation:
Land improvements & infrastructure 17,588,060 1,492,647 97,126 18,983,581
Buildings 244,307,472 22,930,009 783,038 266,454,443
Furniture, fixtures & equipment 75,786,827 8,050,590 7,754,941 76,082,476
Library materials 3,604,531 189,026 22,127 3,771,430
Total accumulated depreciation 341,286,890 32,662,272 8,657,232 365,291,930
Total capital assets being depreciated, net
565,694,569 (13,301,563) 1,068,911 551,324,095
Capital assets, net $610,269,702 $1,092,205 $15,003,162 $596,358,745
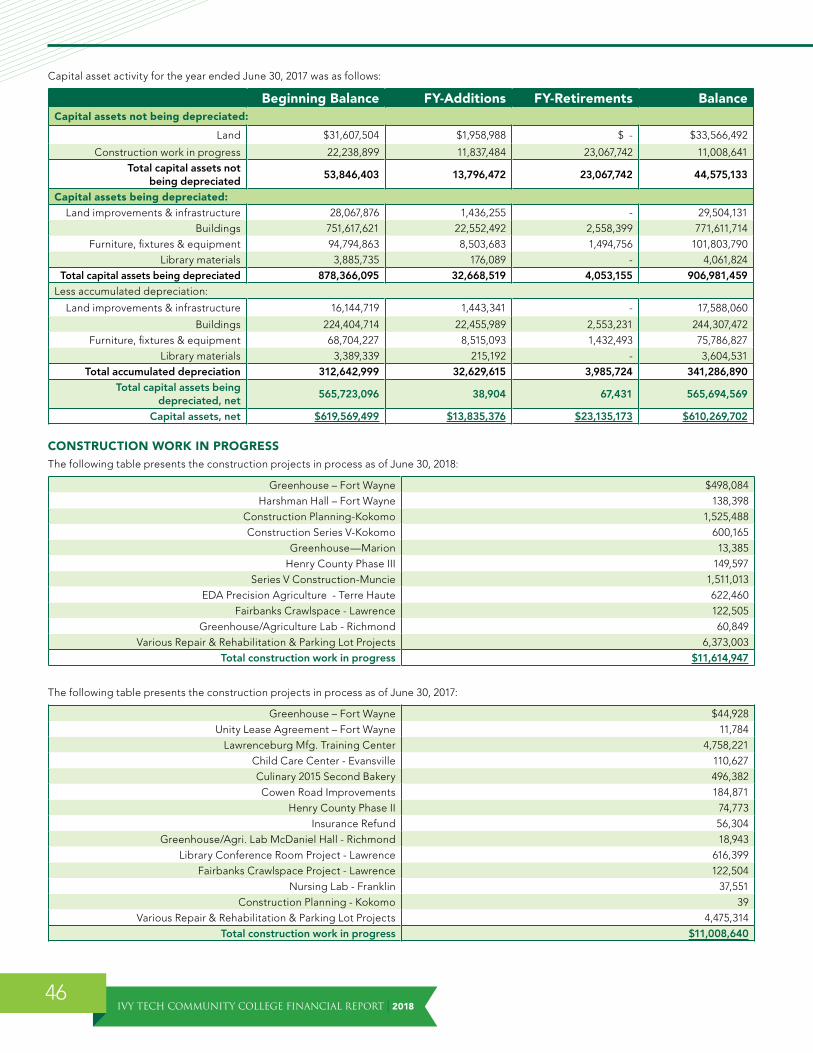
IVY TECH COMMUNITY COLLEGE FINANCIAL REPORT | 201846
Capital asset activity for the year ended June 30, 2017 was as follows:
Beginning Balance FY-Additions FY-Retirements BalanceCapital assets not being depreciated:
Land $31,607,504 $1,958,988 $ - $33,566,492
Construction work in progress 22,238,899 11,837,484 23,067,742 11,008,641 Total capital assets not
being depreciated 53,846,403 13,796,472 23,067,742 44,575,133
Capital assets being depreciated:Land improvements & infrastructure 28,067,876 1,436,255 - 29,504,131
Buildings 751,617,621 22,552,492 2,558,399 771,611,714 Furniture, fixtures & equipment 94,794,863 8,503,683 1,494,756 101,803,790
Library materials 3,885,735 176,089 - 4,061,824 Total capital assets being depreciated 878,366,095 32,668,519 4,053,155 906,981,459
Less accumulated depreciation:
Land improvements & infrastructure 16,144,719 1,443,341 - 17,588,060
Buildings 224,404,714 22,455,989 2,553,231 244,307,472 Furniture, fixtures & equipment 68,704,227 8,515,093 1,432,493 75,786,827
Library materials 3,389,339 215,192 - 3,604,531 Total accumulated depreciation 312,642,999 32,629,615 3,985,724 341,286,890
Total capital assets being depreciated, net
565,723,096 38,904 67,431 565,694,569
Capital assets, net $619,569,499 $13,835,376 $23,135,173 $610,269,702
CONSTRUCTION WORK IN PROGRESSThe following table presents the construction projects in process as of June 30, 2018:
Greenhouse – Fort Wayne $498,084Harshman Hall – Fort Wayne 138,398
Construction Planning-Kokomo 1,525,488Construction Series V-Kokomo 600,165
Greenhouse—Marion 13,385 Henry County Phase III 149,597
Series V Construction-Muncie 1,511,013EDA Precision Agriculture - Terre Haute 622,460
Fairbanks Crawlspace - Lawrence 122,505Greenhouse/Agriculture Lab - Richmond 60,849
Various Repair & Rehabilitation & Parking Lot Projects 6,373,003Total construction work in progress $11,614,947
The following table presents the construction projects in process as of June 30, 2017:
Greenhouse – Fort Wayne $44,928Unity Lease Agreement – Fort Wayne 11,784
Lawrenceburg Mfg . Training Center 4,758,221 Child Care Center - Evansville 110,627 Culinary 2015 Second Bakery 496,382Cowen Road Improvements 184,871
Henry County Phase II 74,773Insurance Refund 56,304
Greenhouse/Agri . Lab McDaniel Hall - Richmond 18,943Library Conference Room Project - Lawrence 616,399
Fairbanks Crawlspace Project - Lawrence 122,504Nursing Lab - Franklin 37,551
Construction Planning - Kokomo 39Various Repair & Rehabilitation & Parking Lot Projects 4,475,314
Total construction work in progress $11,008,640
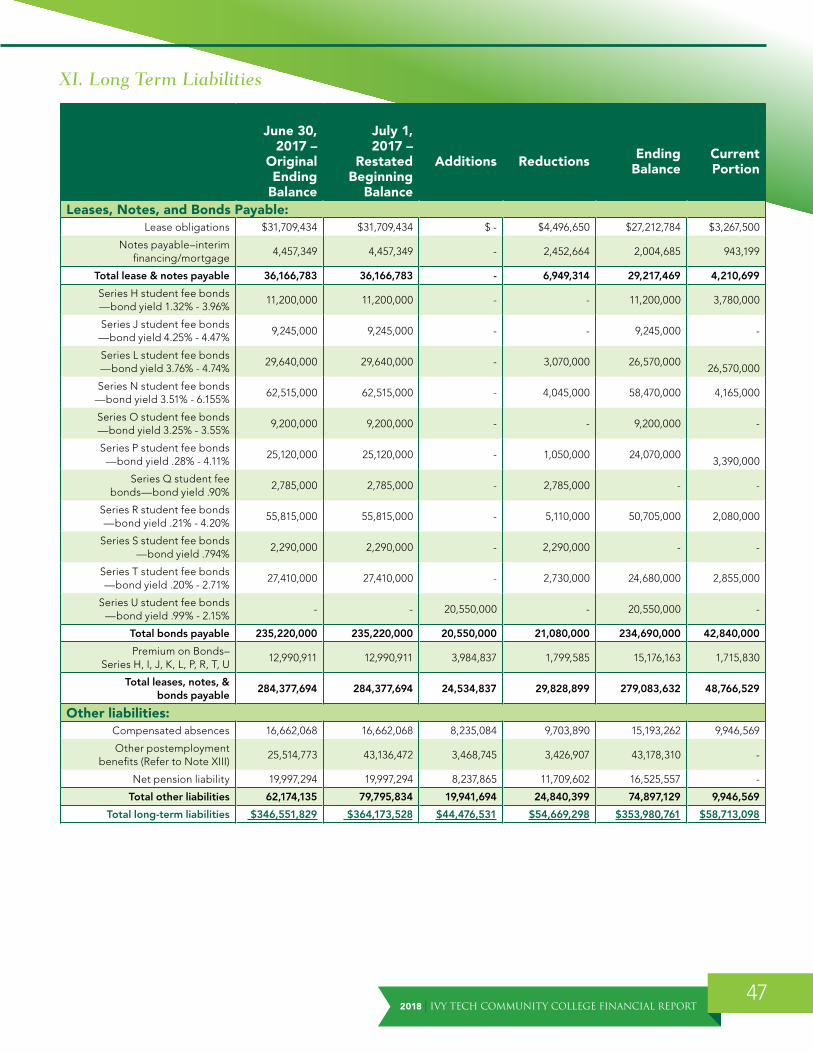
2018 | IVY TECH COMMUNITY COLLEGE FINANCIAL REPORT47
XI. Long Term Liabilities
June 30, 2017 –
Original Ending
Balance
July 1, 2017 –
Restated Beginning
Balance
Additions Reductions Ending Balance
Current Portion
Leases, Notes, and Bonds Payable:Lease obligations $31,709,434 $31,709,434 $ - $4,496,650 $27,212,784 $3,267,500
Notes payable–interim financing/mortgage
4,457,349 4,457,349 - 2,452,664 2,004,685 943,199
Total lease & notes payable 36,166,783 36,166,783 - 6,949,314 29,217,469 4,210,699
Series H student fee bonds—bond yield 1 .32% - 3 .96%
11,200,000 11,200,000 - - 11,200,000 3,780,000
Series J student fee bonds —bond yield 4 .25% - 4 .47%
9,245,000 9,245,000 - - 9,245,000 -
Series L student fee bonds —bond yield 3 .76% - 4 .74%
29,640,000 29,640,000 - 3,070,000 26,570,000
26,570,000
Series N student fee bonds —bond yield 3 .51% - 6 .155%
62,515,000 62,515,000 - 4,045,000 58,470,000 4,165,000
Series O student fee bonds —bond yield 3 .25% - 3 .55%
9,200,000 9,200,000 - - 9,200,000 -
Series P student fee bonds —bond yield .28% - 4 .11%
25,120,000 25,120,000 - 1,050,000 24,070,000
3,390,000
Series Q student fee bonds—bond yield .90%
2,785,000 2,785,000 - 2,785,000 - -
Series R student fee bonds —bond yield .21% - 4 .20%
55,815,000 55,815,000 - 5,110,000 50,705,000 2,080,000
Series S student fee bonds —bond yield .794%
2,290,000 2,290,000 - 2,290,000 - -
Series T student fee bonds —bond yield .20% - 2 .71%
27,410,000 27,410,000 - 2,730,000 24,680,000 2,855,000
Series U student fee bonds —bond yield .99% - 2 .15%
- - 20,550,000 - 20,550,000 -
Total bonds payable 235,220,000 235,220,000 20,550,000 21,080,000 234,690,000 42,840,000
Premium on Bonds– Series H, I, J, K, L, P, R, T, U
12,990,911 12,990,911 3,984,837 1,799,585 15,176,163 1,715,830
Total leases, notes, & bonds payable
284,377,694 284,377,694 24,534,837 29,828,899 279,083,632 48,766,529
Other liabilities:Compensated absences 16,662,068 16,662,068 8,235,084 9,703,890 15,193,262 9,946,569
Other postemployment benefits (Refer to Note XIII)
25,514,773 43,136,472 3,468,745 3,426,907 43,178,310 -
Net pension liability 19,997,294 19,997,294 8,237,865 11,709,602 16,525,557 -
Total other liabilities 62,174,135 79,795,834 19,941,694 24,840,399 74,897,129 9,946,569
Total long-term liabilities $346,551,829 $364,173,528 $44,476,531 $54,669,298 $353,980,761 $58,713,098

IVY TECH COMMUNITY COLLEGE FINANCIAL REPORT | 201848
A. NOTES PAYABLE
In previous years, the College entered into a tax exempt financing agreement with Key Government Finance in the amount of $4,776,072, signed a promissory note with the Foundation relating to the purchase of 43 acres in Elkhart, and initiated a qualified energy savings project as defined by the Indiana Code, which was financed with a Qualified Energy Conservation Promissory Note totaling $3,260,000 . As of June 30, 2017, the principal balances were $2,731,129, $195,051, and $1,531,170, respectively . The principal balances as of June 30, 2018 were $1,842,634 for Key Government Finance and $162,051 for the Elkhart land . The Qualified Energy Conservation note was paid off during 2018 .
As of June 30, 2018:
Beginning Balance Additions Reductions Ending Balance Current
PortionKey government finance
CISCO/CDW$2,731,129 $ - $888,494 $1,842,634 $910,199
Note payable w/foundation 43 acres Elkhart land
195,051 - 33,000 162,051 33,000
Qualified energy savings–Indianapolis
1,531,170 - 1,531,170 - -
Totals $4,457,350 $ - $2,452,664 $2,004,685 $943,199
As of June 30, 2017:
Beginning Balance Additions Reductions Ending Balance Current
PortionKey government finance
CISCO/CDW$3,620,213 $ - $889,084 $2,731,129 $888,494
Note payable w/foundation 43 acres Elkhart land
228,051 - 33,000 195,051 33,000
Qualified energy savings–Indianapolis
1,866,253 - 335,083 1,531,170 1,531,170
Totals $5,714,517 $ - $1,257,167 $4,457,350 $2,452,664
Key Government Finance CDW/CISCO Tax Exempt Lease Purchase Agreement. In July 2015, the College entered into a tax exempt financing agreement with Key Government Finance in the amount of $4,776,072 . Under the terms of the agreement, the College pays an effective interest rate of 2 .42% . The College financed the purchase of state-wide network equipment . Under the terms of the agreement, the College will enter into a five-year financing agreement to replace end of life networking gear with annual payments of $955,214 due on July 1, with the last payment due July 1, 2019 .
KEY GOVERNMENT FINANCE CDW/CISCO TAX EXEMPT LEASE PURCHASE AGREEMENT $4,776,072 FINANCING AMOUNT
Year Ending June 30 Principal Interest Total Balance2018 $ - $ - $ - $1,842,634
2019 910,199 45,015 955,214 932,435 2020 932,435 22,779 955,214 -
Totals $1,842,634 $67,794 $1,910,428 $ -
Foundation Elkhart Land Notes Payable. In fiscal year 2012-13, the South Bend campus entered into a financing agreement to purchase 43 acres of land in Elkhart . The campus makes annual principal and interest payments to the Foundation, with the final payment occurring in fiscal year 2022-23 . Interest is calculated on an annual basis . The property was deeded from the Foundation to the College in 2013 .
SOUTH BEND PROMISSORY NOTE WITH FOUNDATION $327,051 FINANCING AMOUNT
Year Ending June 30 Principal Outstanding Principal Balance2018 $ - $162,051
2019 33,000 129,051 2020 33,000 96,051 2021 33,000 63,051 2022 33,000 30,051
2023 30,051 -
Totals $ 162,051 $-

2018 | IVY TECH COMMUNITY COLLEGE FINANCIAL REPORT49
Qualified Energy Savings Project.In August 2010, the College entered into a Qualified Energy Conservation Note in the amount of $3,260,000 with a maturity of January 10, 2021 . Under terms of the loan agreement, the College pays a fixed interest rate of 4 .80% per annum for the entire term of the loan . Under this financing mechanism, the College is eligible to receive an interest subsidy equal to 3 .35% from the Federal government less an assumed Federal sequestration at 6 .9% of the credit . The College makes principal and interest payments semi-annually . On July 1, 2017, the College called the bond and paid off the outstanding principal and interest due on July 10, 2017 .
QUALIFIED ENERGY CONSERVATION NOTE $3,260,000 ORIGINAL LOAN AMOUNT
Year Ending June 30 Principal Interest Total Federal Interest
Credit Net Total Outstanding Principal Balance
2018 $1,531,170 $36,952 $1,568,121 ($23,981) $1,544,140 $ -
Totals $1,531,170 $36,952 $1,568,121 ($23,981) $1,544,140 $ -
B. BONDS
Authorization by the Indiana General Assembly enables the College to issue bonds for the purpose of financing facility construction and improvements or refinancing and refunding . Series H bonds were issued for construction and improvement projects on the Richmond, Evansville, Valparaiso, and Terre Haute campuses . Series J bonds were issued for projects on the Richmond and Marion campuses . The Valparaiso, Marion and Madison projects were completed through funding provided by the Series K bonds . The Fort Wayne, Logansport and Greencastle projects were completed using Series L bonds . The Series L bonds also supported the Fairbanks refinancing and Series E refunding . The Series N bonds support projects on the Elkhart, Sellersburg, Warsaw, and Indianapolis campuses . The Series O bonds supported the refunding of Series I . Projects on the Indianapolis and Muncie campuses, the Lafayette refinancing, and Series I & K refunds were supported by the Series P bonds . The Series Q bonds supported the Series G refinancing, and the Series R bonds supported projects at the Anderson, Bloomington, and Indianapolis campuses as well as the Series H & L partial refinancing . The Series S bonds supported the Series I refunding and Series T supported the Series K refunding . Series U issued during FY18 supported the Series L refunding .
The June 30, 2017, Premium on Bonds of $13 .0 million includes the remaining balance from the sale of Series H, I, J, K, L, P, R, and T Student Fee Bonds . The ending balance at June 30, 2018, of $15 .2 million includes the remaining balance from the sale of Series H, I, J, K, L, P, R, T and U Student Fee Bonds . It is amortized over the remaining life of the related bonds .
C. COMPENSATED ABSENCES
As of June 30, 2018, the accrued vacation benefit is $9 .9 million and the eligible sick leave benefit is $5 .3 million compared to $11 .8 million of accrued vacation benefit and $4 .9 million of eligible sick leave benefit as of June 30, 2017 . The College has internally designated a portion of its unrestricted funds to offset the entire liability for compensated absences as identified on page 13 of the Management Discussion & Analysis section .
D. BOND SCHEDULES
IVY TECH COMMUNITY COLLEGE OF INDIANA SCHEDULE OF ANNUAL REQUIREMENTS FOR PRINCIPAL AND INTEREST
Series H of 2003, Series J of 2005, Series L of 2009, Series N of 2010, Series O, Series P, Series Q of 2012, Series R of 2014, Series S of 2015, Series T of 2016 and Series U of 2017
Year Ending June 30 Principal Interest Total
Series N 35% Federal Interest
Credit*Net Total
Outstanding Principal Balance
2019 $42,840,000 $10,514,724 $53,354,724 ($1,055,868) $52,298,856 $191,850,000
2020 19,890,000 8,981,755 28,871,755 (987,892) 27,883,863 171,960,000
2021 19,295,000 7,592,266 26,887,266 (915,834) 25,971,432 152,665,000
2022 16,490,000 7,187,736 23,677,736 (839,041) 22,838,695 136,175,000
2023 16,790,000 6,342,104 23,132,104 (755,035) 22,377,070 119,385,000
2024-2028 88,115,000 18,513,271 106,628,271 (2,322,691) 104,305,580 31,270,000
2029-2033 31,270,000 2,817,771 34,087,771 (166,707) 33,921,065 -
Totals $234,690,000 $61,949,627 $296,639,627 ($7,043,066) $289,596,561 $ -
* Taxable bonds under the Build America Bond (“BAB”) program, which receive a 35% interest reimbursement from the Federal government . Includes 6 .2% sequestration reduction .

IVY TECH COMMUNITY COLLEGE FINANCIAL REPORT | 201850
XII. Property Subject to Capital LeasesThe College has multiple lease obligations with Ivy Tech Foundation, Inc . which were determined to meet the requirements necessary to be recognized as capital leases; thus requiring the recognition of long-term debt and capital assets on the College’s Statement of Net Position . Ivy Tech Foundation, Inc . believes these leases are operating leases and that they own the property and therefore reports the assets in their financial statements . Therefore, the Foundation also shows these assets in their Statements of Assets, Liabilities, and Fund Balance, which are incorporated herein . Consequently, the College and the Foundation have reported the same capital assets on their respective financial statements .
XIII. Restatement of Prior Year BalancesStatement No . 75 of the Governmental Accounting Standards Board, Accounting and Financial Reporting for Postemployment Benefits Other Than Pensions revised and established new financial reporting requirements for postemployment benefits other than pensions effective for fiscal years beginning after June 15, 2017 . The Statement required the recognition of a beginning balance adjustment for the Other Post Employment Benefits (OPEB) liability and any related Deferred Inflows or Deferred Outflows for fiscal year 2016-17 .
The chart below illustrates the cumulative effect of the changes on the Statement of Net Position .
ADJUSTMENTS OF THE STATEMENT OF NET POSITION
Category Fiscal Year 2017 Beginning Balance Adjustment Adjusted Beginning
BalanceOther postemployment benefits $25,514,773 $17,621,699 $43,136,472
Total noncurrent liabilities 308,482,978 17,621,699 326,104,677Total Liabilities 391,081,285 17,621,699 408,702,984
Deferred inflows related to OPEB - 2,088,028 2,088,028Total deferred inflows of resources 4,371,158 2,088,028 6,459,186
Net position-unrestricted 351,691,837 (19,709,727) 331,982,110Total net position $676,184,013 ($19,709,727) $656,474,286
XIV. Subsequent EventsStudent Fee Bonds Series V, in the amount of $69,205,000 were issued on July 18, 2018 . The bonds will support the Kokomo and Muncie construction projects . Additionally, Ivy Tech’s current agreement to centralize the purchasing of natural gas through fixed and variable rate contracts ends September 30, 2018 . The College has signed a new agreement that will go into effect October 1, 2018, and continue through September 30, 2021 .

2018 | IVY TECH COMMUNITY COLLEGE FINANCIAL REPORT51
REQUIRED SUPPLEMENTARY INFORMATIONSCHEDULE OF COLLEGE’S OTHER POSTEMPLOYMENT BENEFITS
June 30, 2018 June 30, 2017Total OPEB liability—beginning $43,136,472 $43,753,369
Service cost 1,905,089 2,142,987Interest 1,563,656 1,391,731
Changes of benefit terms - -Difference between expected and actual experience (1,073,714) (624,300)
Changes of assumptions or other inputs (467,965) (1,518,443)Benefit payments (1,885,228) (2,008,872)
Total OPEB liability-end $43,178,310 $43,136,472Covered employee payroll $189,194,063 $189,812,818
Total OPEB liability as percentage of covered employee payroll 23% 23%
The schedule is presented to illustrate the requirements to show information for 10 years . However until a full 10 year trend is compiled, the information is presented for those years for which information is available .
Claims are paid as incurred, and as a result, there are no assets accumulated in the plan .
CHANGES IN ASSUMPTIONS AND BENEFIT TERMSThe discount rate, per capita claim costs, per capita retiree contributions, and the mortality table have been updated since the prior measurement date . No additional changes are anticipated between the measurement date and the College’s reporting date of June 30, 2018 .
As of January 1, 2009, the College is no longer accepting new participants into the 75 Plan . This is the portion of the College’s other postemployment benefits plan where employees retiring between the age of fifty-five (55) and sixty-five (65), whose combined age and years of continuous benefit-eligible service equal at least seventy-five (75), were hired on or before December 31, 2008 and were benefits-eligible and continuously employed in a benefits-eligible position on or prior to December 31, 2008, may elect to remain in the College group medical and/or dental programs . The employees who met these requirements and remain in the 75 Plan pay the same premium as an active employee, which is subsidized by the College until they become eligible for Medicare at which time they may continue in the regular Plan . This is the only change in benefit terms, and as of June 30, 2018, no other changes to benefit terms are anticipated
SCHEDULE OF THE COLLEGE'S PROPORTIONATE SHARE OF THE NET PENSION LIABILITYMeasurement Date as of June 30, 2017
Measurement Date as of June 30, 2016
Measurement Date as of June 30, 2015
Measurement Date as of June 30, 2014
College's proportion of the net pension liability 0 .370% 0 .441% 0 .508% 0 .597%College's proportionate share of the net pension liability (asset) $16,525,557 $19,997,294 $20,669,978 $15,685,882
College's covered payroll $18,376,394 $21,117,060 $24,308,288 $29,142,157College's proportionate share of the net pension
liability (asset) as a percentage of its covered payroll89 .93% 94 .70% 85 .03% 53 .83%
Plan fiduciary net position as a percentage of the total pension liability
76 .60% 75 .30% 77 .30% 84 .30%
This schedule is presented to illustrate the requirement to show information for 10 years . Until a full 10-year trend is compiled, information is presented for those years for which information is available .
SCHEDULE OF THE COLLEGE'S CONTRIBUTIONS2017 2016 2015 2014
Contractually required contribution $2,058,160 $2,365,111 $2,729,685 $3,258,170 Contributions in relation to the contractually required contributions (2,058,160) (2,365,111) (2,729,685) (3,258,170)
Contribution deficiency (excess) $ - $ - $ - $- College's covered-payroll $18,376,394 $21,117,060 $24,308,288 $29,142,157
Contributions as a percentage of covered-payroll 11 .20% 11 .20% 11 .23% 11 .18%
This schedule is presented to illustrate the requirement to show information for 10 years . Until a full 10-year trend is compiled, information is presented for those years for which information is available .
PUBLIC EMPLOYEES’ RETIREMENT PLAN According to the Indiana Public Retirement System’s 2017 Comprehensive Annual Financial Report, an actuarial audit was completed which included updating the following assumptions:
• Adding a load on final average salary of $400 to reflect unused sick leave accumulated at termination of employment for active and inactive vested members .
• Additionally, for disabled members, the RP-2014 (with MP-2014 improvement removed) Disability Mortality tables are assumed instead of RP-2014 (with MP-2014 improvement removed) Total Data Set Mortality tables .
There were no changes to the actuarial methods during the fiscal year, but it is important to note that ASA annuaitizations will be handled through a third party annuity provider beginning January 1, 2018, compared to the previous date of April 1, 2017 .
Information regarding the annual money-weighted rate of returns on pension plan investments may be found on-line at https://www .in .gov/inprs/files/2017CAFRFinancialSection_Web .pdf .

52IVY TECH COMMUNITY COLLEGE FINANCIAL REPORT | 2018

532018 | IVY TECH COMMUNITY COLLEGE FINANCIAL REPORT
The following information is presented as additional data
and is not subject to the audit opinion expressed by the Indiana
State Board of Accounts. These reports were prepared by the management of Ivy Tech Community College of Indiana.
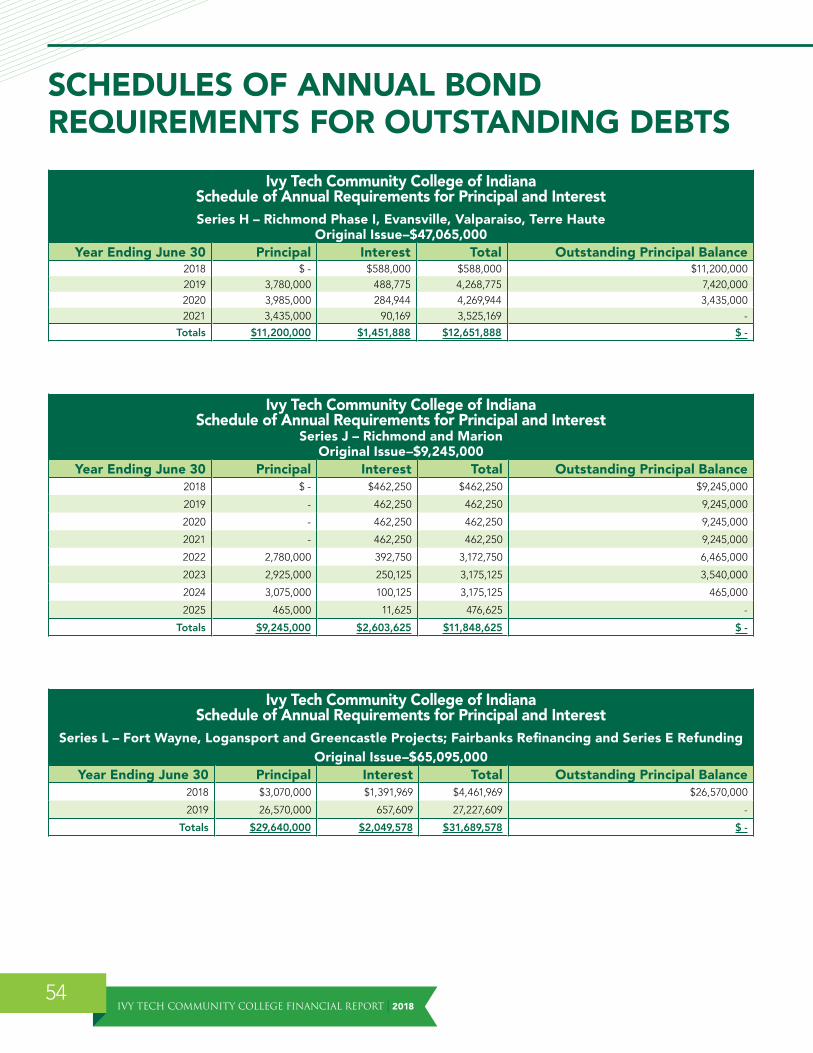
IVY TECH COMMUNITY COLLEGE FINANCIAL REPORT | 201854
SCHEDULES OF ANNUAL BOND REQUIREMENTS FOR OUTSTANDING DEBTS
Ivy Tech Community College of Indiana Schedule of Annual Requirements for Principal and InterestSeries H – Richmond Phase I, Evansville, Valparaiso, Terre Haute
Original Issue–$47,065,000Year Ending June 30 Principal Interest Total Outstanding Principal Balance
2018 $ - $588,000 $588,000 $11,200,0002019 3,780,000 488,775 4,268,775 7,420,0002020 3,985,000 284,944 4,269,944 3,435,0002021 3,435,000 90,169 3,525,169 -
Totals $11,200,000 $1,451,888 $12,651,888 $ -
Ivy Tech Community College of Indiana
Schedule of Annual Requirements for Principal and Interest Series J – Richmond and Marion
Original Issue–$9,245,000Year Ending June 30 Principal Interest Total Outstanding Principal Balance
2018 $ - $462,250 $462,250 $9,245,000
2019 - 462,250 462,250 9,245,000
2020 - 462,250 462,250 9,245,000
2021 - 462,250 462,250 9,245,000
2022 2,780,000 392,750 3,172,750 6,465,000
2023 2,925,000 250,125 3,175,125 3,540,000
2024 3,075,000 100,125 3,175,125 465,000
2025 465,000 11,625 476,625 -
Totals $9,245,000 $2,603,625 $11,848,625 $ -
Ivy Tech Community College of Indiana
Schedule of Annual Requirements for Principal and InterestSeries L – Fort Wayne, Logansport and Greencastle Projects; Fairbanks Refinancing and Series E Refunding
Original Issue–$65,095,000Year Ending June 30 Principal Interest Total Outstanding Principal Balance
2018 $3,070,000 $1,391,969 $4,461,969 $26,570,000
2019 26,570,000 657,609 27,227,609 -
Totals $29,640,000 $2,049,578 $31,689,578 $ -

2018 | IVY TECH COMMUNITY COLLEGE FINANCIAL REPORT55
Ivy Tech Community College of Indiana Schedule of Annual Requirements for Principal and Interest
Series N (Taxable Build America–Direct Pay Option) – Elkhart, Sellersburg, Warsaw and Indianapolis ProjectsOriginal Issue–$70,290,000
Year Ending June 30 Principal Interest Total 35% Federal
Interest Credit* Net Total Outstanding Principal Balance
2018 $4,045,000 $3,406,714 $7,451,714 ($1,118,424) $6,333,290 $58,470,000
2019 4,165,000 3,216,167 7,381,167 (1,055,868) 6,325,299 54,305,000
2020 4,300,000 3,009,113 7,309,113 (987,892) 6,321,221 50,005,000
2021 4,440,000 2,789,625 7,229,625 (915,834) 6,313,791 45,565,000
2022 4,600,000 2,555,714 7,155,714 (839,041) 6,316,673 40,965,000
2023 4,760,000 2,299,832 7,059,832 (755,035) 6,304,797 36,205,000
2024 4,940,000 2,027,504 6,967,504 (665,630) 6,301,875 31,265,000
2025 5,135,000 1,739,514 6,874,514 (571,082) 6,303,431 26,130,000
2026 5,320,000 1,435,535 6,755,535 (471,286) 6,284,249 20,810,000
2027 5,545,000 1,110,208 6,655,208 (364,481) 6,290,727 15,265,000
2028 5,765,000 762,143 6,527,143 (250,212) 6,276,931 9,500,000
2029 6,000,000 400,075 6,400,075 (131,345) 6,268,730 3,500,000
2030 3,500,000 107,712 3,607,712 (35,362) 3,572,350 -
Totals $62,515,000 $24,859,855 $87,374,855 ($8,161,491) $79,213,365 $ -
* Taxable bonds issued under the Build America Bond ("BAB") program, which receive a 35% interest reimbursement from the Federal government . Includes 6 .2% sequestration reduction .
Ivy Tech Community College of Indiana
Schedule of Annual Requirements for Principal and InterestSeries O (Tax-Exempt) – Series I Refunding
Original Issue–$9,200,000Year Ending June 30 Principal Interest Total Outstanding Principal Balance
2018 $ - $314,728 $314,728 $9,200,000
2019 - 314,728 314,728 9,200,000
2020 - 314,728 314,728 9,200,000
2021 - 314,728 314,728 9,200,000
2022 - 314,728 314,728 9,200,000
2023 - 314,728 314,728 9,200,000
2024 - 314,728 314,728 9,200,000
2025 2,250,000 278,161 2,528,161 6,950,000
2026 3,415,000 183,548 3,598,548 3,535,000
2027 3,535,000 62,746 3,597,746 -
Totals $9,200,000 $2,727,551 $11,927,551 $ -

IVY TECH COMMUNITY COLLEGE FINANCIAL REPORT | 201856
Ivy Tech Community College of Indiana Schedule of Annual Requirements for Principal and Interest
Series P (Tax-Exempt) – Indianapolis & Muncie Projects, Lafayette Refinancing and Series I & K RefundingsOriginal Issue–$32,415,000
Year Ending June 30 Principal Interest Total Outstanding Principal Balance2018 $1,050,000 $978,550 $2,028,550 $24,070,000
2019 3,390,000 877,525 4,267,525 20,680,000
2020 3,530,000 738,300 4,268,300 17,150,000
2021 5,235,000 581,825 5,816,825 11,915,000
2022 540,000 477,500 1,017,500 11,375,000
2023 555,000 458,375 1,013,375 10,820,000
2024 570,000 441,500 1,011,500 10,250,000
2025 965,000 417,269 1,382,269 9,285,000
2026 615,000 389,288 1,004,288 8,670,000
2027 5,035,000 263,700 5,298,700 3,635,000
2028 665,000 135,450 800,450 2,970,000
2029 700,000 104,737 804,737 2,270,000
2030 725,000 75,394 800,394 1,545,000
2031 760,000 46,600 806,600 785,000
2032 785,000 15,700 800,700 -
Totals $25,120,000 $6,001,713 $31,121,713 $ -
Ivy Tech Community College of Indiana Schedule of Annual Requirements for Principal and Interest
Series Q (Tax-Exempt) – Series G RefundingOriginal Issue–$15,190,000
Year Ending June 30 Principal Interest Total Outstanding Principal Balance2018 $2,785,000 $12,532 $2,797,532 $ -
Totals $2,785,000 $12,532 $2,797,532 $-

2018 | IVY TECH COMMUNITY COLLEGE FINANCIAL REPORT57
Ivy Tech Community College of Indiana Schedule of Annual Requirements for Principal and Interest
Series R (Tax-Exempt) – Anderson, Bloomington & Indianapolis Projects, Note Refinancing (Series H & L Partial Refundings)
Original Issue–$76,705,000Year Ending June 30 Principal Interest Total Outstanding Principal Balance
2018 $5,110,000 $2,557,295 $7,667,295 $50,705,000 2019 2,080,000 2,377,545 4,457,545 48,625,000 2020 5,075,000 2,198,670 7,273,670 43,550,000 2021 2,290,000 2,014,545 4,304,545 41,260,000 2022 2,415,000 1,896,920 4,311,920 38,845,000 2023 2,540,000 1,773,045 4,313,045 36,305,000 2024 2,665,000 1,642,920 4,307,920 33,640,000 2025 5,545,000 1,437,670 6,982,670 28,095,000 2026 2,950,000 1,225,295 4,175,295 25,145,000 2027 3,095,000 1,074,170 4,169,170 22,050,000 2028 3,250,000 915,545 4,165,545 18,800,000 2029 3,425,000 748,670 4,173,670 15,375,000 2030 3,595,000 573,170 4,168,170 11,780,000 2031 3,770,000 407,895 4,177,895 8,010,000 2032 3,925,000 252,033 4,177,033 4,085,000 2033 4,085,000 85,785 4,170,785 -
Totals $55,815,000 $21,181,173 $76,996,173 $ -
Ivy Tech Community College of Indiana Schedule of Annual Requirements for Principal and Interest
Series S (Tax-Exempt) – Series I RefundingOriginal Issue–$6,840,000
Year Ending June 30 Principal Interest Total Outstanding Principal Balance2018 $2,290,000 $9,091 $2,299,091 $ -
Totals $2,290,000 $9,091 $2,299,091 $ -
Ivy Tech Community College of Indiana Schedule of Annual Requirements for Principal and Interest
Series T (Tax-Exempt) – Refunding Series K Original Issue–$28,090,000
Year Ending June 30 Principal Interest Total Outstanding Principal Balance2018 $2,730,000 $1,218,600 $3,948,600 $24,680,000 2019 2,855,000 1,092,625 3,947,625 21,825,000 2020 3,000,000 946,250 3,946,250 18,825,000 2021 710,000 853,500 1,563,500 18,115,000 2022 3,305,000 753,125 4,058,125 14,810,000 2023 3,475,000 583,625 4,058,625 11,335,000 2024 3,615,000 441,375 4,056,375 7,720,000 2025 3,760,000 292,000 4,052,000 3,960,000 2026 3,960,000 99,000 4,059,000 -
Totals $27,410,000 $6,280,100 $33,690,100 $ -

IVY TECH COMMUNITY COLLEGE FINANCIAL REPORT | 201858
Ivy Tech Community College of Indiana Schedule of Annual Requirements for Principal and Interest
Series U (Tax-Exempt) – Refunding Series L Original Issue–$20,550,000
Year Ending June 30 Principal Interest Total Outstanding Principal Balance2018 $ - $ - $ - $20,550,000 2019 - 1,027,500 1,027,500 20,550,000 2020 - 1,027,500 1,027,500 20,550,000 2021 3,185,000 947,875 4,132,875 17,365,000 2022 2,850,000 797,000 3,647,000 14,515,000 2023 2,535,000 662,375 3,197,375 11,980,000 2024 2,665,000 532,375 3,197,375 9,315,000 2025 - 465,750 465,750 9,315,0002026 2,950,000 392,000 3,342,000 6,365,0002027 3,105,000 240,625 3,345,625 3,260,000 2028 3,260,000 81,500 3,341,500 -
Totals $20,550,000 $6,174,500 $26,724,500 $ -

2018 | IVY TECH COMMUNITY COLLEGE FINANCIAL REPORT59
Ivy Tech Community College of Indiana Schedule of Annual Requirements for Principal and Interest
Series H of 2003, Series J of 2005, Series L of 2009, Series N of 2010, Series O, Series P, Series Q of 2012, Series R of 2014, Series S of 2015, Series T of 2016 and Series U of 2017
Year Ending June 30 Principal Interest Total Series N 35% Federal
Interest Credit* Net Total Outstanding Principal Balance
2018 $21,080,000 $10,939,729 $32,019,729 ($1,118,424) $30,901,305 $234,690,000
2019 42,840,000 10,514,724 53,354,724 (1,055,868) 52,298,856 191,850,000
2020 19,890,000 8,981,755 28,871,755 (987,892) 27,883,863 171,960,000
2021 19,295,000 7,592,266 26,887,266 (915,834) 25,971,432 152,665,000
2022 16,490,000 7,187,736 23,677,736 (839,041) 22,838,695 136,175,000
2023 16,790,000 6,342,104 23,132,104 (755,035) 22,377,070 119,385,000
2024 17,530,000 5,500,527 23,030,527 (665,630) 22,364,897 101,855,000
2025 18,120,000 4,641,992 22,761,992 (571,082) 22,190,910 83,735,000
2026 19,210,000 3,724,665 22,934,665 (471,286) 22,463,379 64,525,000
2027 20,315,000 2,751,449 23,066,449 (364,481) 22,701,968 44,210,000
2028 12,940,000 1,894,638 14,834,638 (250,212) 14,584,426 31,270,000
2029 10,125,000 1,253,483 11,378,483 (131,345) 11,247,138 21,145,000
2030 7,820,000 756,276 8,576,276 (35,362) 8,540,914 13,325,000
2031 4,530,000 454,495 4,984,495 - 4,984,495 8,795,000
2032 4,710,000 267,733 4,977,733 - 4,977,733 4,085,000
2033 4,085,000 85,785 4,170,785 - 4,170,785 -
Totals $255,770,000 $72,889,356 $328,659,356 ($8,161,491) $320,497,866 $ -
Series H Bonds Principal Debt of $11,200,000Series J Bonds Principal Debt of $9,245,000Series L Bonds Principal Debt of $29,640,000Series N Bonds Principal Debt of $62,515,000Series O Bonds Principal Debt of $9,200,000Series P Bonds Principal Debt of $25,120,000Series Q Bonds Principal Debt of $2,785,000Series R Bonds Principal Debt of $55,815,000Series S Bonds Principal Debt of $2,290,000Series T Bonds Principal Debt of $27,410,000
Series U Bonds Principal Debt of $20,550,000
* Taxable bonds issued under the Build America Bond ("BAB") program, which receive a 35% interest reimbursement from the Federal government . Includes 6 .2% sequestration reduction .

SCHEDULE OF STUDENT FINANCIAL AID EXPENDITURES FOR YEAR ENDED JUNE 30, 2018 WITH COMPARATIVE FIGURES AT JUNE 30, 2017
CURRENT UNRESTRICTED
CURRENT RESTRICTED 06/30/18 TOTAL 06/30/17 TOTAL
Workstudy $- $833,803 $833,803 $1,209,404
Scholarship/fellowship (1) - 117,021,209 117,021,209 120,591,572
Grants - 25,672,352 25,672,352 24,410,887
Fee remissions 5,952,425 - 5,952,425 5,861,646
Administrative allowance (2)
392,360 - 392,360 412,470
TOTAL FINANCIAL AID EXPENSES
$6,344,785 $143,527,364 $149,872,149 $152,485,979
(1) The amount of $117,021,209 includes $109,682,490 for Pell grants as compared to $113,105,162 for the prior year . The College has no choice in determining the recipients for the Pell grant program .
(2) Administrative allowance is made up of $179,135 for Pell, and $213,225 for SEOG and Work Study .
IVY TECH COMMUNITY COLLEGE OF INDIANA FIVE YEAR TREND IN STUDENT ENROLLMENT
ActualCredit Student 2013-14 2014-15 2015-16 2016-17 2017-18
Full Time 37,119 30,130 27,403 25,996 24,701
Part Time 142,072 141,361 137,361 138,747 137,948
Total 179,191 171,491 164,764 164,743 162,649
FTE 67,265 61,011 57,371 56,309 55,269
Non-Credit Students 14,281 12,792 12,647 11,553 10,417
CREDIT STUDENTSThe above information reports students on an “unduplicated” basis for Full Time, Part Time, and the Total categories . FTE reports these students on a "full-time equivalent" basis . For purposes of student count, the above full time data includes individuals who enrolled in 12 or more credit hours for a single term; or 24 or more credit hours for two or more terms .
NON-CREDIT STUDENTSThe above information for non-credit students represents total unduplicated non-credit registrations during the fiscal year . This includes custom training courses as well as open enrollment in both professional development and personal enrichment courses . The numbers reported previously for the periods of 2013-14 through 2015-16 were duplicated headcount instead of unduplicated . The numbers have been corrected with the unduplicated amounts .
IVY TECH COMMUNITY COLLEGE FINANCIAL REPORT | 201860


IvyTech.edu