financial report 30 june 2007 - downloads.ifmsystems.com
TRANSCRIPT

Appendix 4E Preliminary final report
30/6/2007 Appendix 4E
Infomedia Ltd
ABN 63 003 326 243
Appendix 4E
Year Ended 30 June 2007
CONTENTS
• Result For Announcement To The Market
• Commentary On Results For the Period
• Annual Financial Report
• Independent Audit Report

Appendix 4E Preliminary final report
30/6/2007 Appendix 4E
Appendix 4E
Preliminary final report Name of entity
Infomedia Ltd ABN or equivalent company reference
Half yearly (tick)
Preliminary final (tick)
Financial year ended (‘current period’)
A.B.N 63 003 326 243 12 months ended 30 June 2007
Results for announcement to the market $A'000
Revenues
Down 2% to 55,357
Profit after income tax attributable to members Down 16% to 15,294 Profit (loss) from extraordinary items after tax attributable to members
Nil
Net profit for the period attributable to members Down 16% to 15,294
Dividends (distributions) Amount per security Franked amount per security
Current Year: Final dividend – declared and not paid 2.1¢ 2.1¢ Special dividend – paid 3.5¢ 3.5¢ Interim dividend – paid 1.9¢ 1.9¢ Previous Corresponding Period: Final dividend 2.1¢ 2.1¢ Special dividend 3.5¢ 3.5¢ Interim dividend 1.9¢ 1.9¢
Record date for determining entitlements to the dividend
6 September 2007
Date the dividends are payable
27 September 2007
Brief explanation of any of the figures reported above necessary to enable the figures to be understood:

Appendix 4E Preliminary final report
30/6/2007 Appendix 4E
Infomedia Ltd Year Ended 30 June 2007 Commentary on the results for the period: The earnings per security and nature of any dilution aspects: Earnings per share were 4.70 cents. Refer to income statement and note 5 to the accounts for more information. Return to shareholders including distributions and buy backs:
Final dividend distributions:
A fully franked final dividend of two point one cents (2.1¢) will be paid to shareholders of record at 6 September 2007. This combined with the earlier interim dividend declared in February brings the total franked dividend for the year to four cents (4.0¢) and represents a payout ratio of 85% based upon profit after tax.
Significant features of operating performance: Electronic Parts Catalogue subscription numbers grew by 11% to 53,165 and Superservice Menus subscription numbers grew by 56% to 2,614 over the previous corresponding period. Electronic Parts Catalogue subscription growth was driven primarily through the successful worldwide launch into Kia markets coupled with organic growth within the existing portfolio. Superservice Menu subscription growth was driven primarily across European markets with particular emphasis on Daihatsu and Hyundai. Catalogue & Publishing sales revenue increased by 3% to $52,990,000 over the equivalent prior period. This growth was impaired as a result of the rising strength of the Australian dollar throughout the year. Consolidated sales revenue of $54,566,000 only included five months of the Business Systems division compared to the full twelve months of the comparative period following the sale of the division. The division was sold on 1 December 2006 for gross proceeds of $1,500,000. The absence of the Business Systems division in the second half had little impact on reported profits as this business was operating on a near breakeven basis. Cash flows from operations remain strong with $14,044,000 in cash generation. Total dividend payments to shareholders over the 2007 financial year amounted to $24,421,000. Notwithstanding these returns, the balance sheet remains in a strong position with $15,690,000 cash on hand at 30 June 2007. The result of segments that are significant to an understanding of the business as a whole: Details of segmental results are located in the Financial Report (Note 29). A discussion of trends in performance: In the year ahead the Company will incorporate higher data licence costs and experience the previously communicated reduction in General Motors subscriptions in North America. Despite anticipated net growth in software subscription volumes, the projected strength of the Australian dollar during the course of the 2008 year is likely to have a dampening affect on reported profit. The recent successful contract renewals in Europe, North America and Asia Pacific, along with the positive reception of our new products provide a solid platform for growth in subscription volumes. Further advances in EPC technology for both the franchised automotive dealer and the Independent Motor Trade will create increased sales momentum and diversification of the Company’s customers and product portfolio over the medium term. The outlook for Superservice Menus remains strong with continuing growth expected into 2008 and beyond. The Company continues to expand both domestically and internationally with new automakers and organic growth from current releases. Any other factors which have affected the results in the period or which are likely to affect results in the future, including those where the effect could not be quantified Factors that may influence or affect future results either favourably or unfavourably include:
• Movements in foreign currency exchange rates • Renewal of data licence contracts with automakers and other key suppliers • Continuous research & development of leading edge technology products • Rate of rollout & growth of new and existing products

Infomedia Ltd
ABN 63 003 326 243
Annual Financial Reportfor the year ended 30 June 2007

I n f o m e d i a L t d A n n u a l R e p o r t
1
ABN 63 003 326 243 Directors Richard Graham – Chairman Gary Martin – Chief Executive Officer Frances Hernon Myer Herszberg Andrew Moffat Company Secretary Nick Georges Chief Financial Officer Peter Adams Registered Office 357 Warringah Road Frenchs Forest NSW Australia 2086 Auditors Ernst & Young Share Register Computershare Registry Services Pty Ltd Solicitors Thomson Playford Lawyers Internet Address www.infomedia.com.au

I n f o m e d i a L t d A n n u a l R e p o r t
CONTENTS
2
Directors’ Report..........................................................................................................................................................3 Auditor’s Independence Declaration ........................................................................................................................ 13 Income Statement ....................................................................................................................................................... 14 Balance Sheet .............................................................................................................................................................. 15 Cash Flow Statement.................................................................................................................................................. 16 Statement of Changes in Equity ................................................................................................................................ 17 Notes to the Financial Statements ............................................................................................................................. 18
Note 1 - Corporate information ...................................................................................................................... 18 Note 2 - Summary of significant accounting policies..................................................................................... 18 Note 3 - Revenues and expenses .................................................................................................................... 26 Note 4 - Income tax ........................................................................................................................................ 27
Note 5 - Earnings per share ........................................................................................................................... 29 Note 6 - Dividends proposed or paid ............................................................................................................. 30 Note 7 - Trade and other receivables.............................................................................................................. 30 Note 8 - Inventories........................................................................................................................................ 31 Note 9 - Intercompany.................................................................................................................................... 31 Note 10 - Other financial assets........................................................................................................................ 31 Note 11 - Interests in controlled entities........................................................................................................... 31 Note 12 - Property, plant and equipment.......................................................................................................... 32 Note 13 - Intangible assets and goodwill.......................................................................................................... 34 Note 14 - Impairment testing of goodwill and intangibles with indefinite lives............................................... 36
Note 15 - Trade and other payables.................................................................................................................. 37 Note 16 - Interest-bearing loans and borrowings.............................................................................................. 37 Note 17 - Provisions (current) .......................................................................................................................... 37 Note 18 - Deferred revenue .............................................................................................................................. 37 Note 19 - Provisions (non-current) ................................................................................................................... 38 Note 20 - Contributed equity and reserves ....................................................................................................... 39 Note 21 - Statement of cash flows.................................................................................................................... 40 Note 22 - Sale of business ................................................................................................................................ 41 Note 23 - Commitments and contingencies...................................................................................................... 41 Note 24 - Share-based payment plans .............................................................................................................. 42 Note 25 - Pensions and other post-employment benefit plans.......................................................................... 43 Note 26 - Key Management Personnel disclosures .......................................................................................... 44 Note 27 - Auditors’ remuneration .................................................................................................................... 46 Note 28 - Related party disclosures.................................................................................................................. 46 Note 29 - Segment information ........................................................................................................................ 47 Note 30 - Financial risk management objectives and policies.......................................................................... 50 Note 31 - Financial instruments........................................................................................................................ 51 Note 32 - Subsequent events ............................................................................................................................ 52
Directors’ Declaration................................................................................................................................................ 53 Independent Audit Report ......................................................................................................................................... 54

I n f o m e d i a L t d A n n u a l R e p o r t
DIRECTORS’ REPORT
3
Your Directors submit their report for the year ended 30 June 2007.
DIRECTORS Directors were in office from the beginning of the financial year until the date of this report, unless otherwise stated. Geoffrey Henderson was a non-executive Director and Chairman of the Corporate Governance Committee until his resignation on 28 February 2007. In June 2007 the Board resolved to appoint Ms Hernon to the Audit & Risk Committee and to subsequently merge that Committee and the Corporate Governance Committee into the Audit, Risk & Governance Committee. It also resolved that the Board itself would re-absorb the Remuneration & Nomination Committee functions, These changes took effect from 1 July 2007, with the exception of Ms Hernon’s appointment to the Audit & Risk Committee (as it then was), which took effect on 25 June 2007. Refer to the Corporate Governance Statement for further details. The names and details of the Directors of the Company in office during the financial year and until the date of this report are:
Names, qualifications, experience and special responsibilities Richard Graham Chairman
Mr Richard Graham has held senior management positions in the American and Australian computer industry since 1977. Mr Graham co-founded the Company in 1988 and was its Chairman and Managing Director/CEO from its establishment until he retired as CEO in December 2004. Since then Mr Graham has continued as Chairman.
Mr Graham was last re-elected to the Board in October 2005 Gary Martin Chief Executive Officer
Gary Martin was promoted to the position of Chief Executive Officer on 1 January 2005. Mr Martin has extensive experience in the automotive industry. He has been with Infomedia since 1998, when he joined the Company as International Sales Manager. Mr Martin was appointed as General Manager, Electronic Catalogues Division in August 2001. Prior to joining Infomedia, he had 12 years of experience at automotive dealerships; including as General Manager, Parts & Accessories of a large multi-franchised dealership group. In his time with Ford dealers, Mr Martin was awarded the Ford Management Excellence Award in four consecutive years and participated on various Automaker committees. Mr Martin was elected to the Board in October 2004.
Frances Hernon Non-executive Director
Frances Hernon was appointed to the Infomedia Board of Directors on 19 June 2000. Ms Hernon has extensive experience in media, publishing, marketing and technology. She has held senior editorial positions at News Ltd and Murdoch Magazines and was General Manager, Harrison Communications, Director of Publicity at Channel Ten, Managing Editor of the NRMA's member magazine The Open Road, Manager, Business Communications for NRMA, and Senior Account Manager, Group IT&T for the Insurance Australia Group (IAG). Ms Hernon is currently Corporate Affairs Manager for Nestlé Australia Ltd. Ms Hernon currently serves on the Audit, Risk & Governance Committee and also serves the Board as Lead Non-executive Director for all matters that formerly fell within the ambit of the Remuneration & Nomination Committee. Ms Hernon was last re-elected to the Board in October 2006.
Myer Herszberg Non-executive Director
Myer Herszberg has been a Director of Infomedia since 1992. Mr Herszberg has extensive consumer electronics experience and was active in bringing home computers to Australia in the early 1980s as well as many other leading edge electronic products. He also has extensive experience in the commercial property market, and is active in a number of community service organisations. Mr Herszberg currently serves on the Company’s Audit, Risk & Governance Committee. Mr Herszberg was last re-elected to the Board in October 2005.

I n f o m e d i a L t d A n n u a l R e p o r t
DIRECTORS’ REPORT
4
Directors (Continued)
Andrew Moffat Non-executive Director (Chairman of Audit, Risk & Corporate Governance Committee)
Andrew Moffat was appointed to the Infomedia Board of Directors on 31 March 2005. Mr Moffat has more than 20 years of corporate and investment banking experience and is the sole principal of Cowoso Capital Pty Ltd, a company providing strategic corporate advisory services. Andrew was a Director of Equity Capital Markets & Advisory for BNP Paribas Equities (Australia) Limited with principal responsibility for mergers and acquisition advisory services and a range of equity capital raising mandates including placements, initial public offerings, rights issues and dividend reinvestment plan underwritings. His corporate banking experience was gained whilst working in the United Kingdom and Australia with Standard Chartered Bank Group, National Westminster Banking Group and BNP Paribas. Mr Moffat was elected to the Board in October 2005.
COMPANY SECRETARY Nick Georges General Counsel & Company Secretary
Nick Georges is a qualified lawyer, admitted to the Supreme Courts of Victoria in 1991 and New South Wales in 1999. Prior to joining Infomedia and becoming its General Counsel & Company Secretary in 1999, Mr Georges worked in general practice as a solicitor in Victoria before moving to Sydney to take up an executive role with Altium Limited where he obtained extensive experience in the information technology industry.
Interests in the shares and options of the Company and related bodies corporate As at the date of this report, the interests of the Directors in the shares and options of the Company were:
Infomedia Ltd Ordinary Shares
fully paid Options over Ordinary
Shares Wiser Equity Pty Limited 100,277,501 - Yarragene Pty Limited 23,421,599 - Wiser Centre Pty Limited 1,000,000 - Richard Graham 926,559 - Gary Martin 407,590 666,667 Frances Hernon 5,000 - Andrew Moffat - -
Richard Graham is the sole Director and beneficial shareholder of Wiser Equity Pty Limited. Richard Graham is a Director of Wiser Centre Pty Limited, trustee for the Wiser Centre Pty Ltd Superannuation Fund. Myer Herszberg is a Director and major shareholder of Yarragene Pty Limited. Directorships of other publicly listed entities During the past four years, Andrew Moffat has been the non-executive chairman of Pacific Star Network Limited. He is also a non-executive Director of Cash Converters International Ltd and an executive Director of Ausron Limited.

I n f o m e d i a L t d A n n u a l R e p o r t
DIRECTORS’ REPORT
5
PRINCIPAL ACTIVITIES Infomedia Ltd is a company limited by shares that is incorporated and domiciled in Australia. The principal activities during the year of entities within the consolidated entity were: • developer and supplier of electronic parts catalogues and service quoting systems for the automotive industry
globally; • information management, analysis and creation for the domestic automotive and oil industries; and • the provision of dealer management systems for the automotive industry. There have been no significant changes in the nature of those activities during the year with the exception of the sale of the Company’s Business Systems division on 1 December 2006 which was the division responsible for the provision of dealer management systems for the automotive industry. EMPLOYEES The company employed 204 (2006: 230) full time employees as at 30 June 2007. DIVIDENDS Cents $’000 Final dividends recommended: On ordinary shares – final – fully franked 2.10 6,845 Dividends paid in the year: On ordinary shares – 2007 interim – fully franked 1.90 6,194 On ordinary shares – special – fully franked 3.50 11,391 Final for the 2006 year: On ordinary shares – as recommended in the 2006 report 2.10 6,836 NET TANGIBLE ASSETS PER SECURITY Cents The Company’s net tangible assets per security are as follows:
• Net tangible assets per share at 30 June 2007 4.8 • Net tangible assets per share at 30 June 2006 7.5 REVIEW AND RESULTS OF OPERATIONS The following table presents sales revenue and profit after tax after excluding non-recurring significant items: CONSOLIDATED
2007 2006
$’000 $’000
Sales revenue – Catalogue & Publishing 52,990 51,635
Sales revenue – Business systems (sold 1 December 2006) 1,576 3,942
Consolidated sales revenue 54,566 55,577
Reported Profit After Tax 15,294 18,146
Adjustments:
Sale and leaseback transaction after tax - (1,616)
Profit after tax excluding sale and leaseback transaction and significant items 15,294 16,530

I n f o m e d i a L t d A n n u a l R e p o r t
DIRECTORS’ REPORT
6
REVIEW AND RESULTS OF OPERATIONS (CONTINUED) The Company is pleased to report net profit after tax of $15,294,000 for the 2007 financial year which is within the guidance previously provided to the market in December 2006. Electronic Parts Catalogue subscription numbers grew by 11% to 53,165 and Superservice Menus subscription numbers grew by 56% to 2,614 over the previous corresponding period. Electronic Parts Catalogue subscription growth was driven primarily through the successful worldwide launch into Kia markets coupled with organic growth within the existing portfolio. Superservice Menu subscription growth was driven primarily across European markets with particular emphasis on Daihatsu and Hyundai. Catalogue & Publishing sales revenue increased by 3% to $52,990,000 over the equivalent prior period. This growth was impaired as a result of the rising strength of the Australian dollar throughout the year. Consolidated sales revenue of $54,566,000 only included five months of the Business Systems division compared to the full twelve months of the comparative period following the sale of the division. The division was sold on 1 December 2006 for gross proceeds of $1,500,000. The absence of the Business Systems division in the second half had little impact on reported profits as this business was operating on a near breakeven basis. Cash flows from operations remain strong with $14,044,000 in cash generation. Total dividend payments to shareholders over the 2007 financial year amounted to $24,421,000. Notwithstanding these returns, the balance sheet remains in a strong position with $15,690,000 cash on hand at 30 June 2007. SIGNIFICANT CHANGES IN THE STATE OF AFFAIRS There has been no significant change in the state of affairs of the Company since the last Directors’ Report with the exception of the sale of the Company’s Business Systems division on 1 December 2006 which was the division responsible for the provision of dealer management systems for the automotive industry.
SIGNIFICANT EVENTS AFTER THE BALANCE DATE There has been no matter or circumstance that has arisen since the end of the financial year that has significantly affected the operations of the Company, the results of those operations, or the state of affairs of the Company.
LIKELY DEVELOPMENTS AND EXPECTED RESULTS In the year ahead the Company will incorporate higher data licence costs and experience the previously communicated reduction in General Motors subscriptions in North America. Despite anticipated net growth in software subscription volumes, the projected strength of the Australian dollar during the course of the 2008 year is likely to have a dampening affect on reported profit. The recent successful contract renewals in Europe, North America and Asia Pacific, along with the positive reception of our new products provide a solid platform for growth in subscription volumes. Further advances in EPC technology for both the franchised automotive dealer and the Independent Motor Trade will create increased sales momentum and diversification of the Company’s customers and product portfolio over the medium term. The outlook for Superservice Menus remains strong with continuing growth expected into 2008 and beyond. The Company continues to expand both domestically and internationally with new automakers and organic growth from current releases. ENVIRONMENTAL REGULATION AND PERFORMANCE The Company is not subject to any particular or significant environmental regulation under a law of the Commonwealth of Australia or of a State or Territory.
SHARE OPTIONS Unissued shares At the date of this report, there were 1,300,001 unissued ordinary shares under options. Refer to Note 24 of the financial statements for further details of the options outstanding.
Shares issued as a result of the exercise of options During the financial year, executives have exercised options to acquire 499,999 (2006: nil) fully paid ordinary shares in Infomedia Ltd at a weighted average price of $0.50. Since the end of the financial year there have been no further options exercised.
I n f o m e d i a L t d A n n u a l R e p o r t
DIRECTORS’ REPORT
7
INDEMNIFICATION AND INSURANCE OF DIRECTORS AND OFFICERS During the year the Company paid a premium in relation to insuring Directors and other officers against liability incurred in their capacity as a Director or officer of the Company. The insurance contract specifically prohibits the disclosure of the nature of the policy and amount of premium paid.
REMUNERATION REPORT This report outlines the remuneration arrangements in place for Directors and executives of the Company. Infomedia Ltd has adopted the option available under the Corporation Regulations 2M.6.04 (as amended by the Corporation Amendments Regulation 2006 (No. 4)) which permits listed companies to transfer the remuneration disclosures required AASB124 para Aus 25.4 – Aus 25.7.2 out of the Financial Report and into the Remuneration Report. The transferred AASB124 disclosures are subject to audit.
Compensation Philosophy (audited) The performance of the Company depends upon the quality of its Directors and executives. To prosper, the Company must attract, motivate and retain highly skilled Directors and executives. To this end, the Company embodies the following principles in its compensation framework: • Provide competitive rewards to attract high calibre executives • Link executive rewards to shareholder value • Establish appropriate performance hurdles in relation to variable executive compensation Remuneration Committee The Remuneration & Nomination Committee (Remuneration Committee) of the Board of Directors is responsible for recommending to the Board the Company’s remuneration and compensation policy arrangements for all Key Management Personnel. The Remuneration Committee assesses the appropriateness of the nature and amount of these emoluments on a periodic basis by reference to relevant employment market conditions with the overall objective of ensuring maximum stakeholder benefit from the retention of a high quality board and executive team.
Compensation Structure In accordance with best practice corporate governance recommendations, the structure of non-executive Director and senior executive compensation is separate and distinct.
Non-executive Director Compensation (audited) Objective The Board seeks to set aggregate compensation at a level which provides the Company with the ability to attract and retain Directors of appropriate calibre, whilst incurring a cost which is acceptable to shareholders. Structure The Constitution and the ASX Listing Rules specify that the aggregate compensation of non-executive Directors shall be determined from time to time by a general meeting. An amount not exceeding the amount determined is then available between the Directors as appropriate (for the year ending 30 June 2007 non-executive Directors’ compensation totalled $350,136 (2006: $311,489)). The latest determination was at the Annual General Meeting held on 30 October 2002 when shareholders approved a maximum aggregate compensation of $450,000 per year. The Board has historically considered the advice from external consultants as well as the fees paid to non-executive Directors of comparable companies when undertaking a review process.
Senior Executive and Executive Director Compensation (audited) Objective The Company aims to reward executives with a level and mix of compensation commensurate with their position and responsibilities within the Company and so as to: • reward executives for Company and individual performance against targets set by reference to appropriate benchmarks; • align the interests of executives with those of shareholders; • link reward with the strategic goals and performance of the Company; and • ensure total compensation is competitive by market standards.
Structure In determining the level and make-up of executive compensation, the Remuneration Committee engages an external consultant from time to time to provide independent advice in the form of a written report detailing market levels of compensation for comparable executive roles.
Compensation consists of the following key elements: - Fixed Compensation - Variable Compensation - Short Term Incentive (‘STI’); and - Variable Compensation - Long Term Incentive (‘LTI’).
I n f o m e d i a L t d A n n u a l R e p o r t
DIRECTORS’ REPORT
8
REMUNERATION REPORT (CONTINUED) The actual proportion of fixed compensation and variable compensation (potential short term and long term incentives) is established for Key Management Personnel (excluding the CEO and non-executive Directors) by the CEO in conjunction with the Remuneration Committee, and in the case of the CEO, by the Chairman of the Board in conjunction with the Remuneration Committee. Other executive salaries are determined by the CEO with reference to market conditions. Fixed Compensation Objective The level of fixed compensation is set so as to provide a base level of compensation which is both appropriate to the position and is competitive in the market. Fixed compensation is reviewed periodically by the CEO in conjunction with the Remuneration Committee for the Key Management Personnel (excluding the CEO and non-executive Directors), and in the case of the CEO, by the Chairman of the Board in conjunction with the Remuneration Committee. All other executive positions are reviewed periodically by the CEO. As noted above, the Committee has access to external advice independent of management. Structure Executives are given the opportunity to receive their fixed (primary) compensation in a variety of forms including cash or other designated employee expenditure such as motor vehicles. It is intended that the manner of payment chosen will be optimal for the recipient without creating undue cost for the Company. Variable Compensation – Short Term Incentive (STI) (audited) Objective The objective of short term compensation is to link the achievement of both individual performance and Company performance with the compensation received by the executive.
Structure The structure of short term compensation is a cash bonus dependent upon a combination of individual performance objectives and Company objectives being met. This reflects the Company wide practice of ‘Performance Planning & Review’ (PPR) procedures. Individual performance objectives centre on key focus areas. Company objectives include achieving budgetary targets that are set at the commencement of the financial year (adjusted where necessary for currency fluctuations). These performance conditions were chosen, in the case of individual performance objectives, to promote and maintain the individual’s focus on their own contribution to the Company’s strategic objectives through individual achievement in key result areas (KRAs) which include, for example, ‘leadership’, ‘decision making’, ‘results’ and ‘risk management’. In the case of Company objectives, budgetary performance conditions were chosen to promote and maintain a collaborative, Company wide focus on the achievement of those targets. In assessing whether an individual performance condition has been satisfied, pre-agreed key performance indicators (KPIs) are used. In assessing whether Company objectives have been satisfied, Board level pre-determined budgetary targets are used. These methods have been chosen to create clear and measurable performance targets.
Variable Compensation – Long Term Incentive (LTI) (audited) Objective The objective of the LTI plan is to reward executives in a manner which aligns this element of compensation with the creation of shareholder wealth. As such LTI grants are made to executives who are able to influence the generation of shareholder wealth and thus have a direct impact on the Company's performance against the relevant long term performance hurdle.
Structure The structure of long term compensation is in the form of share options pursuant to the employee option and employee share plans. Performance hurdles have been introduced for all share options issued after 31 December 2004 and are determined upon grant of those share options. These hurdles typically relate to the Company’s share price reaching or exceeding a particular level. These methods were chosen to create clear and measurable performance expectations.

I n f o m e d i a L t d A n n u a l R e p o r t
DIRECTORS’ REPORT
9
REMUNERATION REPORT (CONTINUED) Specified Directors and five highest remunerated specified executives for the year ended 30 June 2007 and 30 June 2006 (audited)
Short-Term Post Employment Share Based Payments Long-Term Total
Percentage Performance
Related
2007 Financial Year: Salary &
Fees Bonus
Non Monetary
Benefits Superannuation Options Employee
Share Plan Other $ %
Directors:
Richard Graham 115,000 - - 10,350 - - - 125,350 -
Gary Martin 280,000 83,200 - 25,200 48,846 - 3,267 440,513 30%
Myer Herszberg 56,300 - - 5,067 - - - 61,367 -
Frances Hernon 56,250 - - 5,062 - - - 61,312 -
Andrew Moffat 56,250 - - 5,062 - - - 61,312 -
Geoffrey Henderson 37,427 - - 3,368 - - - 40,795 -
Executives:
Andrew Pattinson 314,276 24,746 15,258 28,285 - - 5,238 387,803 6%
Peter Adams 190,742 38,000 - 17,220 17,961 - 2,225 266,148 21%
Mark Kujacznski 182,692 25,641 12,434 - - - - 220,767 12%
Michael Roach 167,215 25,000 - 14,850 7,332 - 2,787 217,184 15%
Nick Georges 165,000 23,000 - 14,850 5,700 - 1,925 210,475 14%
1,621,152 219,587 27,692 129,314 79,839 - 15,442 2,093,026
2006 Financial Year:
Directors:
Richard Graham 118,019 - - 10,350 - - - 128,369 -
Gary Martin 280,000 63,000 - 24,445 51,232 - 3,267 421,944 27%
Myer Herszberg 42,000 - - 3,780 - - - 45,780 -
Geoffrey Henderson 42,000 - - 3,780 - - - 45,780 -
Frances Hernon 42,000 - - 3,780 - - - 45,780 -
Andrew Moffat 42,000 - - 3,780 - - - 45,780 -
Executives:
Andrew Pattinson 305,523 - 14,537 27,497 - 1,000 5,092 353,649 -
Peter Adams 190,742 38,000 - 17,167 17,742 1,000 2,225 266,876 21%
Nick Georges 170,290 12,500 - 15,326 13,050 1,000 1,987 214,153 12%
Michael Roach 153,558 14,000 - 13,820 6,286 1,000 2,559 191,223 11%
Mark Kujacznski 170,186 - 9,589 - - - - 179,775 -
1,556,318 127,500 24,126 123,725 88,310 4,000 15,130 1,939,109
Directors and Executives also represent Key Management Personnel as defined by AASB124.
I n f o m e d i a L t d A n n u a l R e p o r t
DIRECTORS’ REPORT
10
REMUNERATION REPORT (CONTINUED)
Contract for Services (audited)
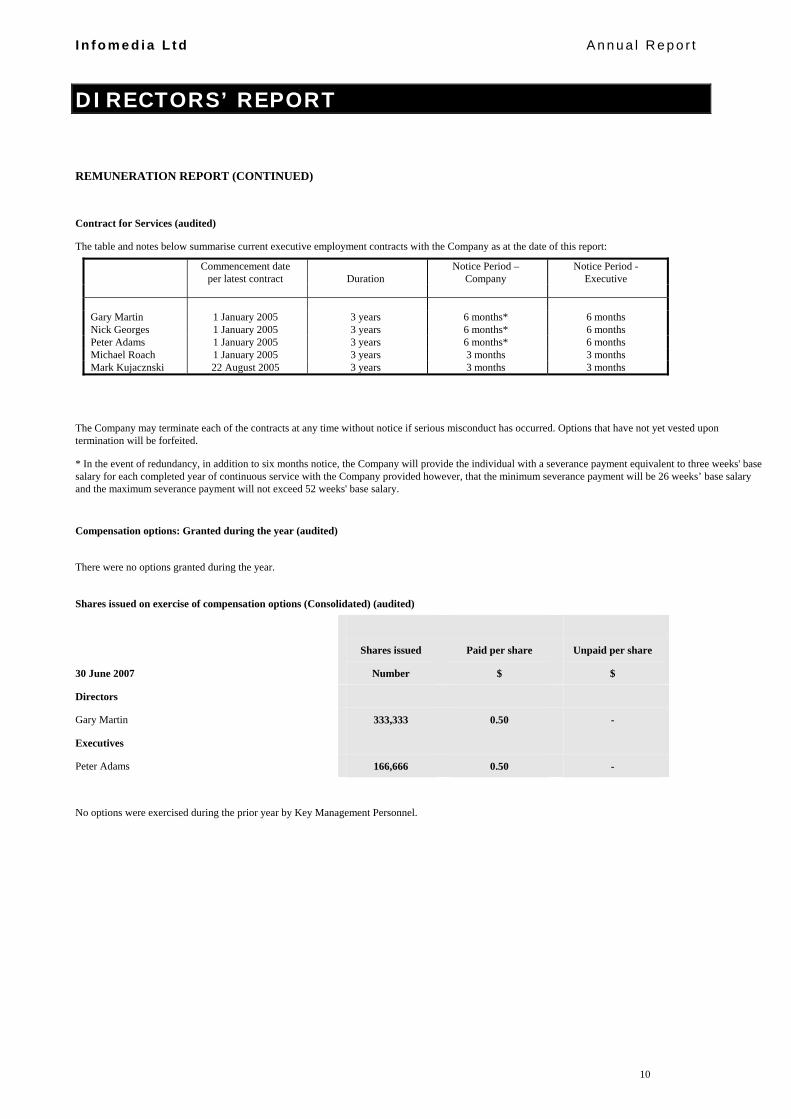
The table and notes below summarise current executive employment contracts with the Company as at the date of this report:
Commencement date per latest contract Duration
Notice Period – Company
Notice Period - Executive
Gary Martin 1 January 2005 3 years 6 months* 6 months Nick Georges 1 January 2005 3 years 6 months* 6 months Peter Adams 1 January 2005 3 years 6 months* 6 months Michael Roach 1 January 2005 3 years 3 months 3 months Mark Kujacznski 22 August 2005 3 years 3 months 3 months
The Company may terminate each of the contracts at any time without notice if serious misconduct has occurred. Options that have not yet vested upon termination will be forfeited.
* In the event of redundancy, in addition to six months notice, the Company will provide the individual with a severance payment equivalent to three weeks' base salary for each completed year of continuous service with the Company provided however, that the minimum severance payment will be 26 weeks’ base salary and the maximum severance payment will not exceed 52 weeks' base salary.
Compensation options: Granted during the year (audited)
There were no options granted during the year.
Shares issued on exercise of compensation options (Consolidated) (audited)
30 June 2007
Shares issued
Number
Paid per share
$
Unpaid per share
$
Directors
Gary Martin 333,333 0.50 -
Executives
Peter Adams 166,666 0.50 -
No options were exercised during the prior year by Key Management Personnel.

I n f o m e d i a L t d A n n u a l R e p o r t
DIRECTORS’ REPORT
11
REMUNERATION REPORT (CONTINUED)
Option holdings of Key Management Personnel (Consolidated) (audited)
30 June 2007
Balance at beginning of
period Granted as
compensation Options
exercised Net change
other Balance at
end of period Vested at 30 June 2007
1 July 2006 30 June 2007 Total
Not exercisable Exercisable
Directors
Gary Martin 1,000,000 - (333,333) - 666,667 666,667 333,334 333,333
Executives
Peter Adams 250,000 - (166,666) - 83,334 83,334 83,334 -
Nick Georges 250,000 - - - 250,000 250,000 166,667 83,333
Michael Roach 200,000 - - - 200,000 200,000 133,334 66,666
1,700,000 - (499,999) - 1,200,001 1,200,001 716,669 483,332
30 June 2006
Balance at beginning of
period Granted as
compensation Options
exercised Net change
other Balance at
end of period Vested at 30 June 2006
1 July 2005 30 June 2006 Total
Not exercisable Exercisable
Directors
Gary Martin - 1,000,000 - - 1,000,000 1,000,000 666,667 333,333
Executives
Peter Adams - 250,000 - - 250,000 250,000 166,667 83,333
Nick Georges - 250,000 - - 250,000 250,000 166,667 83,333
Michael Roach - 200,000 - - 200,000 200,000 200,000 -
- 1,700,000 - - 1,700,000 1,700,000 1,200,001 499,999

Liability limited by a scheme approved under Professional Standards Legislation.
Auditor’s Independence Declaration to the Directors of Infomedia Ltd
In relation to our audit of the financial report of Infomedia Ltd for the financial year ended 30 June 2007, to the best of my knowledge and belief, there have been no contraventions of the auditor independence requirements of the Corporations Act 2001 or any applicable code of professional conduct.
Ernst & Young
Garry Wayling Partner Sydney 22 August 2007

I n f o m e d i a L t d A n n u a l R e p o r t
INCOME STATEMENT
14
YEAR ENDED 30 June 2007 Notes CONSOLIDATED INFOMEDIA LTD
2007 2006 2007 2006
$’000 $’000 $’000 $’000
Sales revenue 54,566 55,577 42,967 46,112
Rental revenue - 646 - -
Finance revenue 791 268 778 1,164
Revenue 55,357 56,491 43,745 47,276
Cost of sales 3(i) (17,448) (17,472) (11,106) (13,436)
Gross Profit 37,909 39,019 32,639 33,840
Other income 3(ii) - 2,892 - 677
Net profit/(loss) on sale of business 22 15 - (76) -
Employee benefits expense 3(iii) (8,374) (8,009) (7,017) (6,851)
Depreciation and amortisation 3(iv) (3,492) (3,355) (3,016) (2,689)
Finance costs (134) (197) (134) (197)
Operating lease rental (1,072) (534) (533) (912)
Other expenses (4,119) (5,002) (1,868) (5,302)
Profit before income tax 20,733 24,814 19,995 18,566
Income tax expense 4 (5,439) (6,668) (5,498) (4,866)
Profit after income tax 15,294 18,146 14,497 13,700
Basic earnings per share (cents per share) 5 4.70 5.58
Diluted earnings per share (cents per share) 5 4.68 5.57
Dividends per share - ordinary (cents per share) 6 4.00 4.00
Dividends per share - special (cents per share) 6 - 7.00

I n f o m e d i a L t d A n n u a l R e p o r t
BALANCE SHEET
15
AT 30 June 2007 Notes CONSOLIDATED INFOMEDIA LTD
2007 2006 2007 2006
CURRENT ASSETS $’000 $’000 $’000 $’000
Cash and cash equivalents 21(b) 15,690 26,021 13,544 25,089 Trade and other receivables 7 6,944 6,751 3,818 4,409 Inventories 8 52 84 52 71 Prepayments 432 544 297 448 Derivatives 31 - 229 - 229
TOTAL CURRENT ASSETS 23,118 33,629 17,711 30,246
NON-CURRENT ASSETS
Intercompany 9 - - 1,623 451 Other financial assets 10 335 804 583 1,052 Property, plant and equipment 12 2,817 4,066 2,222 3,402 Intangible assets and goodwill 13 17,139 17,375 13,465 12,754 Deferred tax assets 4 1,443 1,790 1,250 1,592
TOTAL NON-CURRENT ASSETS 21,734 24,035 19,143 19,251
TOTAL ASSETS 44,852 57,664 36,854 49,497
CURRENT LIABILITIES
Trade and other payables 15 2,482 3,974 1,752 2,988 Interest-bearing loans and borrowings 16 - 500 - 500 Provisions 17 2,284 2,711 1,612 2,001 Income tax payable 2,272 3,451 2,228 3,126 Deferred revenue 18 506 816 254 405
TOTAL CURRENT LIABILITIES 7,544 11,452 5,846 9,020
NON-CURRENT LIABILITIES
Provisions 19 1,706 2,339 1,568 2,187 Deferred tax liabilities 4 2,700 2,062 2,353 1,576
TOTAL NON-CURRENT LIABILITIES 4,406 4,401 3,921 3,763
TOTAL LIABILITIES 11,950 15,853 9,767 12,783
NET ASSETS 32,902 41,811 27,087 36,714
EQUITY
Contributed equity 20 17,738 17,488 17,738 17,488 Reserves 20 978 1,010 1,023 976 Retained profits 14,186 23,313 8,326 18,250
TOTAL EQUITY 32,902 41,811 27,087 36,714

I n f o m e d i a L t d A n n u a l R e p o r t
CASH FLOW STATEMENT
16
YEAR ENDED 30 June 2007 Notes CONSOLIDATED INFOMEDIA LTD
2007 2006 2007 2006 $’000 $’000 $’000 $’000 CASH FLOWS FROM OPERATING ACTIVITIES
Receipts from customers 54,284 54,522 43,535 46,229 Payments to suppliers and employees (35,448) (31,036) (25,438) (23,556) Interest received 791 268 778 1,164 Borrowing costs (3) (197) (3) (197) Income tax paid (5,580) (4,528) (5,239) (4,528) NET CASH FLOWS FROM OPERATING
ACTIVITIES 21 (a) 14,044 19,029 13,633 19,112
CASH FLOWS FROM INVESTING ACTIVITIES Acquisition of property, plant and equipment (873) (1,625) (692) (1,121) Proceeds from sale of business 22 1,169 - 185 - Proceeds from sale of property, plant and equipment
including property held for resale 3(vi) - 23,000 - 1,750 Non refundable payment for capital works 3(vi) - (500) - - Purchase of intellectual property - (2,096) - (2,096) Purchase of shares in controlled entity - - - (1) NET CASH FLOWS FROM/(USED IN) INVESTING
ACTIVITIES 296 18,779 (507) (1,468)
CASH FLOWS FROM FINANCING ACTIVITIES Proceeds from exercise of share options 250 - 250 - Proceeds from borrowings - 8,000 - 8,000 Repayment of borrowings (500) (7,500) (500) (7,500) Repayment of loan from controlled entity - - - 21,250 Dividends paid on ordinary shares 6 (24,421) (23,108) (24,421) (23,108) NET CASH FLOWS FROM/(USED IN) FINANCING
ACTIVITIES (24,671) (22,608) (24,671) (1,358) NET INCREASE/(DECREASE) IN CASH HELD (10,331)
15,200 (11,545)
16,286
Add opening cash brought forward 26,021
10,821 25,089
8,803
CLOSING CASH CARRIED FORWARD
21 (b) 15,690
26,021 13,544
25,089

I n f o m e d i a L t d A n n u a l R e p o r t
STATEMENT OF CHANGES IN EQUITY
17
YEAR ENDED 30 June 2007 CONSOLIDATED
Contributed
equity Retained profits Reserves Total
$’000 $’000 $’000 $’000 At 1 July 2006
17,488 23,313 1,010 41,811
Currency translation differences - - (79) (79) Profit for the year - 15,294 - 15,294 Cost of share based payments - - 47 47
Exercise of options 250 - - 250 Equity dividends - (24,421) - (24,421) At 30 June 2007 17,738 14,186 978 32,902
YEAR ENDED 30 June 2006 CONSOLIDATED
Contributed
equity Retained profits Reserves Total
$’000 $’000 $’000 $’000 At 1 July 2005
17,488 28,275 706 46,469
Currency translation differences - - 53 53 Profit for the year - 18,146 - 18,146 Cost of share based payments - - 251 251 Equity dividends - (23,108) - (23,108) At 30 June 2006 17,488 23,313 1,010 41,811
YEAR ENDED 30 June 2007 INFOMEDIA LTD
Contributed
equity Retained profits Reserves Total
$’000 $’000 $’000 $’000 At 1 July 2006
17,488 18,250 976 36,714
Profit for the year - 14,497 - 14,497
Exercise of options 250 - - 250 Cost of share based payments - - 47 47 Equity dividends - (24,421) - (24,421) At 30 June 2007 17,738 8,326 1,023 27,087
YEAR ENDED 30 June 2006 INFOMEDIA LTD
Contributed
equity Retained profits Reserves Total
$’000 $’000 $’000 $’000 At 1 July 2005
17,488 27,658 725 45,871
Profit for the year - 13,700 - 13,700 Cost of share based payments - - 251 251 Equity dividends - (23,108) - (23,108) At 30 June 2006 17,488 18,250 976 36,714

I n f o m e d i a L t d A n n u a l R e p o r t
NOTES TO THE FINANCIAL STATEMENTS
18
30 June 2007 1. CORPORATE INFORMATION The financial report of Infomedia Ltd for the year ended 30 June 2007 was authorised for issue in accordance with a resolution of the Directors on 22 August 2007. Infomedia Ltd is a company limited by shares incorporated in Australia whose shares are publicly traded on the Australian stock exchange. The nature of the operations and principal activities of the Company are described in the Directors’ Report. 2. SUMMARY OF SIGNIFICANT ACCOUNTING POLICIES (a) Basis of preparation The financial report is a general-purpose financial report, which has been prepared in accordance with the requirements of the Corporations Act 2001 and Australian Accounting Standards. The financial report has also been prepared on a historical cost basis, except for derivative financial instruments that have been measured at fair value. (b) Statement of compliance The financial report complies with Australian Accounting Standards, which include Australian equivalents to International Financial Reporting Standards ('AIFRS'). Compliance with AIFRS ensures that the financial report, comprising the financial statements and notes thereto, complies with International Financial Reporting Standards ('IFRS'). Certain Australian Accounting Standards and UIG interpretations have recently been issued or amended but are not yet effective. These Standards have not been adopted by the Company for the year ended 30 June 2007. The Directors have yet to finalise their assessment of the impact of the new or amended standards (to the extent relevant to the Company). (c) Basis of consolidation The consolidated financial statements comprise the financial statements of Infomedia Ltd and its subsidiaries (‘the Company’). The financial statements of subsidiaries are prepared for the same reporting period as the parent company, using consistent accounting policies. Adjustments are made to bring into line any dissimilar accounting policies that may exist. All intercompany balances and transactions, including unrealised profits arising from intra-group transactions, have been eliminated in full. Unrealised losses are eliminated unless costs cannot be recovered. Subsidiaries are consolidated from the date on which control is transferred to the Company and cease to be consolidated from the date on which control is transferred out of the Company. Where there is loss of control of a subsidiary, the consolidated financial statements include the results for the part of the reporting period during which Infomedia Ltd has control. (d) Significant accounting judgements, estimates and assumptions Significant accounting estimates and assumptions The carrying amounts of certain assets and liabilities are often determined based on estimates and assumptions of future events. The key estimates and assumptions that have a significant risk of causing a material adjustment to the carrying amounts of certain assets and liabilities within the next annual reporting period are:
• Impairment of goodwill The Company determines whether goodwill is impaired at least on an annual basis. This requires an estimation of the recoverable amount of the cash generating units to which the goodwill and intangibles with indefinite useful lives are allocated. The assumptions used in this estimation of recoverable amount and the carrying amount of goodwill and intangibles with indefinite useful lives are discussed in Note 14.
• Share-based payment transactions The Company measures the cost of equity-settled transactions with employees by reference to the fair value of the equity instruments at the date at which they are granted. The fair value is determined by an external valuer using a binomial model, using the assumptions detailed in Note 24.
I n f o m e d i a L t d A n n u a l R e p o r t
NOTES TO THE FINANCIAL STATEMENTS
19
30 June 2007 2. SUMMARY OF SIGNIFICANT ACCOUNTING POLICIES (CONTINUED) (e) Foreign currencies Translation of foreign currency transactions Transactions in foreign currencies of the Company are converted to local currency at the rate of exchange ruling at the date of the transaction. Amounts payable to and by the Company that are outstanding at the balance date and are denominated in foreign currencies have been converted to local currency using rates of exchange ruling at the end of the reporting period. All currency exchange differences in the consolidated financial report are taken to the income statement. Derivative Financial Instruments The Company uses derivative financial instruments such as foreign currency contracts to hedge its risks associated with foreign currency fluctuations. Such derivative financial instruments are stated at fair value. The fair value of forward exchange contracts is calculated by reference to current forward exchange rates for contracts with similar maturity profiles. For derivatives that do not qualify for hedge accounting, any gains or losses arising from changes in fair value are taken directly to net profit or loss for the reporting period. Translation of financial reports of overseas operations Both the functional and presentation currency of Infomedia Ltd and its Australian subsidiaries is Australian dollars (A$). Non-monetary items that are measured in terms of historical cost in a foreign currency are translated using the exchange rate as at the date of the initial transaction. The functional currency of the overseas subsidiaries is as follows: IFM Europe Ltd Euros IFM Germany GmbH Euros IFM North America Inc United States Dollars (USD) As at the reporting date the assets and liabilities of these overseas subsidiaries are translated into the presentation currency of Infomedia Ltd at the rate of exchange ruling at the balance sheet date and the income statements are translated at the weighted average exchange rates for the period. The exchange differences arising on the retranslation are taken directly to a separate component of equity. (f) Cash and cash equivalents Cash on hand and in banks and short-term deposits are stated at nominal values. For the purposes of the Cash Flow Statement, cash includes cash on hand and in banks, and money market investments readily convertible to cash within three months, net of outstanding bank overdrafts. (g) Trade and other receivables Trade receivables, which generally have 30-60 day terms, are recognised and carried at original invoice amount less an allowance for any uncollectible amounts. An allowance for doubtful debts is made when there is objective evidence that the Company will not be able to collect the debts. Bad debts are written off when identified.

I n f o m e d i a L t d A n n u a l R e p o r t
NOTES TO THE FINANCIAL STATEMENTS
20
30 June 2007 2. SUMMARY OF SIGNIFICANT ACCOUNTING POLICIES (CONTINUED) (h) Investments and other financial assets Financial assets in the scope of AASB 139 Financial Instruments: Recognition and Measurement are classified as either financial assets at fair value through profit or loss, loans and receivables, held-to-maturity investments, or available-for-sale investments, as appropriate. For the Company the relevant category is listed below: Loans and receivables Loans and receivables are non-derivative financial assets with fixed or determinable payments that are not quoted in an active market. Such assets are carried at amortised cost using the effective interest method. Gains and losses are recognised in profit or loss when the loans and receivables are derecognised or impaired, as well as through the amortisation process. Investments in Subsidiaries Investments in subsidiaries are recorded at cost. (i) Inventories Inventories are valued at the lower of cost and net realisable value. Costs incurred in bringing each product to its present location and condition are accounted for as follows:
• Raw materials – purchase cost on a first-in-first-out basis (j) Goodwill Goodwill acquired in a business combination is initially measured at cost being the excess of the cost of the business combination over the Company’s interest in the net fair value of the acquiree's identifiable assets, liabilities and contingent liabilities. Following initial recognition, goodwill is measured at cost less any accumulated impairment losses. Goodwill is reviewed for impairment annually or more frequently if events or changes in circumstances indicate that the carrying value may be impaired. For the purpose of impairment testing, goodwill acquired in a business combination is, from the acquisition date, allocated to each of the Company’s cash-generating units, or groups of cash generating units, that are expected to benefit from the synergies of the combination, irrespective of whether other assets or liabilities of the Company are assigned to those units or groups of units. Each unit or group of units to which the goodwill is so allocated: • represents the lowest level within the Company at which the goodwill is monitored for internal management purposes; and • is not larger than a segment based on either the Company’s primary or the Company’s secondary reporting format determined in accordance with AASB 114 Segment Reporting. Impairment is determined by assessing the recoverable amount of the cash-generating unit (group of cash-generating units), to which the goodwill relates. When the recoverable amount of the cash-generating unit (group of cash-generating units) is less than the carrying amount, an impairment loss is recognised. When goodwill forms part of a cash-generating unit (group of cash-generating units) and an operation within that unit is disposed of, the goodwill associated with the operation disposed of is included in the carrying amount of the operation when determining the gain or loss on disposal of the operation. Goodwill disposed of in this manner is measured based on the relative values of the operation disposed of and the portion of the cash generating unit retained. Impairment losses recognised for goodwill are not subsequently reversed. (k) Intangible assets Intangible assets acquired separately or in a business combination are initially measured at cost. The cost of an intangible asset acquired in a business combination is its fair value as at the date of acquisition. Following initial recognition, intangible assets are carried at cost less any accumulated amortisation and any accumulated impairment losses. Internally generated intangible assets, excluding capitalised development costs, are not capitalised and expenditure is charged against profits in the year in which the expenditure is incurred. The useful lives of intangible assets are assessed to be either finite or indefinite. Intangible assets with finite lives are amortised over the useful life and assessed for impairment whenever there is an indication that the intangible asset may be impaired. The amortisation period and the amortisation method for an intangible asset with a finite useful life is reviewed at least at each financial year-end. Changes in the expected useful life or the expected pattern of consumption of future economic benefits embodied in the asset are accounted for by changing the amortisation period or method, as appropriate, which is a change in accounting estimate. The amortisation expense on intangible assets with finite lives is recognised in profit or loss in the expense category consistent with the function of the intangible asset. Intangible assets with indefinite useful lives are tested for impairment annually either individually or at the cash-generating unit level. Such intangibles are not amortised. The useful life of an intangible asset with an indefinite life is reviewed each reporting period to determine whether indefinite life assessment continues to be supportable. If not, the change in the useful life assessment from indefinite to finite is accounted for as a change in an accounting estimate and is thus accounted for on a prospective basis.

I n f o m e d i a L t d A n n u a l R e p o r t
NOTES TO THE FINANCIAL STATEMENTS
21
30 June 2007 2. SUMMARY OF SIGNIFICANT ACCOUNTING POLICIES (CONTINUED) (k) Intangible assets (continued) Research and development costs Research costs are expensed as incurred. An intangible asset arising from development expenditure on an internal project is recognised only when the Company can demonstrate the technical feasibility of completing the intangible asset so that it will be available for use or sale, its intention to complete and its ability to use or sell the asset, how the asset will generate future economic benefits, the availability of resources to complete the development and the ability to measure reliably the expenditure attributable to the intangible asset during its development. Following the initial recognition of the development expenditure, the cost model is applied requiring the asset to be carried at cost less any accumulated amortisation and accumulated impairment losses. Any expenditure so capitalised is amortised over the period of expected benefits from the related project commencing from the commercial release of the project. The carrying value of an intangible asset arising from development expenditure is tested for impairment annually when the asset is not yet available for use, or more frequently when an indication of impairment arises during the reporting period. Gains or losses arising from derecognition of an intangible asset are measured as the difference between the net disposal proceeds and the carrying amount of the asset and are recognised in profit or loss when the asset is derecognised. (l) Impairment of assets The Company assesses at each reporting date whether there is an indication that an asset may be impaired. If any such indication exists, or when annual impairment testing for an asset is required, the Company makes an estimate of the asset’s recoverable amount. An asset’s recoverable amount is the higher of its fair value less costs to sell and its value in use and is determined for an individual asset, unless the asset does not generate cash inflows that are largely independent of those from other assets or groups of assets and the asset's value in use cannot be estimated to be close to its fair value. In such cases the asset is tested for impairment as part of the cash generating unit to which it belongs. When the carrying amount of an asset or cash-generating unit exceeds its recoverable amount, the asset or cash-generating unit is considered impaired and is written down to its recoverable amount. In assessing value in use, the estimated future cash flows are discounted to their present value using a pre-tax discount rate that reflects current market assessments of the time value of money and the risks specific to the asset. Impairment losses relating to continuing operations are recognised in those expense categories consistent with the function of the impaired asset unless the asset is carried at revalued amount (in which case the impairment loss is treated as a revaluation decrease). An assessment is also made at each reporting date as to whether there is any indication that previously recognised impairment losses may no longer exist or may have decreased. If such indication exists, the recoverable amount is estimated. A previously recognised impairment loss is reversed (with the exception of goodwill) only if there has been a change in the estimates used to determine the asset’s recoverable amount since the last impairment loss was recognised. If that is the case the carrying amount of the asset is increased to its recoverable amount. That increased amount cannot exceed the carrying amount that would have been determined, net of depreciation, had no impairment loss been recognised for the asset in prior years. Such reversal is recognised in profit or loss unless the asset is carried at revalued amount, in which case the reversal is treated as a revaluation increase. After such a reversal the depreciation charge is adjusted in future periods to allocate the asset’s revised carrying amount, less any residual value, on a systematic basis over its remaining useful life.

I n f o m e d i a L t d A n n u a l R e p o r t
NOTES TO THE FINANCIAL STATEMENTS
22
30 June 2007 2. SUMMARY OF SIGNIFICANT ACCOUNTING POLICIES (CONTINUED) (m) Property, plant and equipment Property, plant and equipment is stated at cost less accumulated depreciation and any accumulated impairment losses. Such cost includes the cost of replacing parts that are eligible for capitalisation when the cost of replacing the parts is incurred. Similarly, when each major inspection is performed, its cost is recognised in the carrying amount of the plant and equipment as a replacement only if it is eligible for capitalisation. Land and buildings are measured at cost less accumulated depreciation on buildings and less any impairment losses recognised. Depreciation is calculated on a straight-line basis over the estimated useful life of the assets as follows: Major depreciation periods are: 2007 2006 Freehold buildings: 40 years 40 years Leasehold improvements: 5 to 20 years 5 to 20 years Other plant and equipment: 3 to 15 years 3 to 15 years The assets' residual values, useful lives and amortisation methods are reviewed, and adjusted if appropriate, at each financial year end. (i) Impairment The carrying values of property, plant and equipment are reviewed for impairment at each reporting date, with the recoverable amount being estimated when events or changes in circumstances indicate that the carrying value may be impaired. The recoverable amount of property, plant and equipment is the higher of fair value less costs to sell and value in use. In assessing value in use, the estimated future cash flows are discounted to their present value using a pre-tax discount rate that reflects current market assessments of the time value of money and the risks specific to the asset. For an asset that does not generate largely independent cash inflows, recoverable amount is determined for the cash-generating unit to which the asset belongs, unless the asset's value in use can be estimated to be close to its fair value. An impairment exists when the carrying value of an asset or cash-generating units exceeds its estimated recoverable amount. The asset or cash-generating unit is then written down to its recoverable amount. (ii) Derecognition and disposal An item of property, plant and equipment is derecognised upon disposal or when no further future economic benefits are expected from its use or disposal. Any gain or loss arising on derecognition of the asset (calculated as the difference between the net disposal proceeds and the carrying amount of the asset) is included in profit or loss in the year the asset is derecognised. (n) Leases The determination of whether an arrangement is or contains a lease is based on the substance of the arrangement and requires an assessment of whether the fulfilment of the arrangement is dependent on the use of a specific asset or assets and the arrangement conveys a right to use the asset. (i) Company as a lessee Operating lease payments are recognised as an expense in the income statement on a straight-line basis over the lease term. Lease incentives are recognised in the income statement as an integral part of the total lease expense. (ii) Company as a lessor Leases in which the Company retains substantially all the risks and benefits of ownership of the leased asset are classified as operating leases. Initial direct costs incurred in negotiating an operating lease are added to the carrying amount of the leased asset and recognised as an expense over the lease term on the same basis as rental income (i.e. on a straight-line basis). (o) Trade and other payables Trade payables and other payables are carried at amortised costs and represent liabilities for goods and services provided to the Company prior to the end of the financial year that are unpaid and arise when the Company becomes obliged to make future payments in respect of the purchase of these goods and services.

I n f o m e d i a L t d A n n u a l R e p o r t
NOTES TO THE FINANCIAL STATEMENTS
23
30 June 2007 2. SUMMARY OF SIGNIFICANT ACCOUNTING POLICIES (CONTINUED) (p) Provisions Provisions are recognised when the Company has a present obligation (legal or constructive) as a result of a past event, it is probable that an outflow of resources embodying economic benefits will be required to settle the obligation and a reliable estimate can be made of the amount of the obligation. Where the Company expects some or all of a provision to be reimbursed, for example under an insurance contract, the reimbursement is recognised as a separate asset but only when the reimbursement is virtually certain. The expense relating to any provision is presented in the income statement net of any reimbursement. If the effect of the time value of money is material, provisions are determined by discounting the expected future cash flows at a pre-tax rate that reflects current market assessments of the time value of money and, where appropriate, the risks specific to the liability. Where discounting is used, the increase in the provision due to the passage of time is recognised as a borrowing cost. (q) Deferred revenue Certain contracts allow annual subscriptions to be invoiced in advance. The components of revenue relating to the subscription period beyond balance date are recorded as a liability.
(r) Interest bearing loans and borrowings All loans and borrowings are initially recognised at the fair value of the consideration received less directly attributable transaction costs. After initial recognition, interest-bearing loans and borrowings are subsequently measured at amortised cost using the effective interest method. Borrowing costs are recognised as an expense when incurred. (s) Contributed equity Ordinary shares are classified as equity. Incremental costs directly attributable to the issue of new shares or options are shown in equity as a deduction, net of tax, from the proceeds. (t) Revenue recognition Revenue is recognised to the extent that it is probable that the economic benefits will flow to the entity and the revenue can be reliably measured. The following specific recognition criteria must also be met before revenue is recognised: Subscriptions Subscription revenue is recognised when the copyright article has passed to the buyer with related support revenue being recognised over the service period. Where the copyright article and related support revenue are inseparable then the revenue is recognised over the service period. Interest Control of a right to receive consideration for the provision of, or investment in, assets has been attained.
(u) Cost of sales Cost of sales includes the direct cost of raw materials, direct salary and wages, and agency costs associated with the manufacture and distribution of the product.

I n f o m e d i a L t d A n n u a l R e p o r t
NOTES TO THE FINANCIAL STATEMENTS
24
30 June 2007 2. SUMMARY OF SIGNIFICANT ACCOUNTING POLICIES (CONTINUED) (v) Income tax Current tax assets and liabilities for the current and prior periods are measured at the amount expected to be recovered from or paid to the taxation authorities. The tax rates and tax laws used to compute the amount are those that are enacted or substantively enacted by the balance sheet date. Deferred income tax is provided on all temporary differences at the balance sheet date between the tax bases of assets and liabilities and their carrying amounts for financial reporting purposes. Deferred income tax liabilities are recognised for all taxable temporary differences except: • when the deferred income tax liability arises from the initial recognition of goodwill or of an asset or liability in a transaction that is not a business combination and that, at the time of the transaction, affects neither the accounting profit nor taxable profit or loss; or • when the taxable temporary difference is associated with investments in subsidiaries, associates or interests in joint ventures, and the timing of the reversal of the temporary difference can be controlled and it is probable that the temporary difference will not reverse in the foreseeable future. Deferred income tax assets are recognised for all deductible temporary differences, carry-forward of unused tax assets and unused tax losses, to the extent that it is probable that taxable profit will be available against which the deductible temporary differences and the carry-forward of unused tax credits and unused tax losses can be utilised, except: • when the deferred income tax asset relating to the deductible temporary difference arises from the initial recognition of an asset or liability in a transaction that is not a business combination and, at the time of the transaction, affects neither the accounting profit nor taxable profit or loss; or • when the deductible temporary difference is associated with investments in subsidiaries, associates or interests in joint ventures, in which case a deferred tax asset is only recognised to the extent that it is probable that the temporary difference will reverse in the foreseeable future and taxable profit will be available against which the temporary difference can be utilised. The carrying amount of deferred income tax assets is reviewed at each balance sheet date and reduced to the extent that it is no longer probable that sufficient taxable profit will be available to allow all or part of the deferred income tax asset to be utilised. Unrecognised deferred income tax assets are reassessed at each balance sheet date and are recognised to the extent that it has become probable that future taxable profit will allow the deferred tax asset to be recovered. Deferred income tax assets and liabilities are measured at the tax rates that are expected to apply to the year when the asset is realised or the liability is settled, based on tax rates (and tax laws) that have been enacted or substantively enacted at the balance sheet date. Income taxes relating to items recognised directly in equity are recognised in equity and not in profit or loss. Deferred tax assets and deferred tax liabilities are offset only if a legally enforceable right exists to set off current tax assets against current tax liabilities and the deferred tax assets and liabilities relate to the same taxable entity and the same taxation authority. The tax consolidated current tax liability and other deferred tax assets are required to be allocated to the members of the tax consolidated group in accordance with UIG 1052. The group uses a group allocation method for this purpose where the allocated current tax payable, deferred tax assets and other tax credits for each member of the tax consolidated group is determined as if the company is a stand-alone taxpayer but modified as necessary to recognise membership of a tax consolidated group. Recognition of amounts allocated to members of the tax consolidated group has regard to the tax consolidated groups future tax profits. (w) Other taxes Revenues, expenses and assets are recognised net of the amount of Goods and Services Tax (“GST”) except: • when the GST incurred on a purchase of goods and services is not recoverable from the taxation authority, in which case the GST is recognised as part of the cost of acquisition of the asset or as part of the expense item as applicable; and • receivables and payables, which are stated with the amount of GST included. The net amount of GST recoverable from, or payable to, the taxation authority is included as part of receivables or payables in the balance sheet. Cash flows are included in the Cash Flow Statement on a gross basis and the GST component of cash flows arising from investing and financing activities, which is recoverable from, or payable to, the taxation authority are classified as operating cash flows. Commitments and contingencies are disclosed net of the amount of GST recoverable from, or payable to, the taxation authority.

I n f o m e d i a L t d A n n u a l R e p o r t
NOTES TO THE FINANCIAL STATEMENTS
25
30 June 2007 2. SUMMARY OF SIGNIFICANT ACCOUNTING POLICIES (CONTINUED) (x) Employee leave benefits (i) Wages, salaries and annual leave Liabilities for wages and salaries, including non-monetary benefits, and annual leave expected to be settled within 12 months of the reporting date are recognised in other payables in respect of employees’ services up to the reporting date. They are measured at the amounts expected to be paid when the liabilities are settled. Liabilities for non-accumulating sick leave are recognised when the leave is taken and are measured at the rates paid or payable. (ii) Long service leave The liability for long service leave is recognised in the provision for employee benefits and measured as the present value of expected future payments to be made in respect of services provided by employees up to the reporting date using the projected unit credit method. Consideration is given to expected future wage and salary levels, experience of employee departures, and period of service. Expected future payments are discounted using market yields at the reporting date on national government bonds with terms to maturity and currencies that match, as closely as possible, the estimated future cashflows. (y) Share-based payment transactions The Company provides benefits to employees in the form of share-based payment transactions, whereby employees render services in exchange for shares or options over shares (‘equity-settled transactions’). There are currently two plans in place to provide these benefits: (i) the Employee Share Plan (ESP), and (ii) the Employee Option Plan (EOP). The cost of these equity-settled transactions with employees is measured by reference to the fair value at the date at which they are granted. The fair value is determined by an external valuer using a binomial model. In valuing equity-settled transactions, no account is taken of any performance conditions, other than conditions linked to the price of the shares of Infomedia Ltd (‘market conditions’). The cost of equity-settled transactions is recognised, together with a corresponding increase in equity, over the period in which the performance conditions are fulfilled, ending on the date on which the relevant employees become fully entitled to the option (‘vesting date’). The cumulative expense recognised for equity-settled transactions at each reporting date until vesting date reflects (i) the extent to which the vesting period has expired and (ii) the number of options that, in the opinion of the Directors of the Company, will ultimately vest. This opinion is formed based on the best available information at balance date. No adjustment is made for the likelihood of market performance conditions being met as the effect of these conditions is included in the determination of fair value at grant date. Where the terms of an equity-settled option are modified, as a minimum an expense is recognised as if the terms had not been modified. In addition, an expense is recognised for any increase in the value of the transaction as a result of the modification, as measured at the date of modification. Where an equity-settled option is cancelled, it is treated as if it had vested on the date of cancellation, and any expense not yet recognised for the option is recognised immediately. However, if a new option is substituted for the cancelled option, and designated as a replacement option on the date that it is granted, the cancelled and new option are treated as if they were a modification of the original option, as described in the previous paragraph. The dilutive effect, if any, of outstanding options is reflected as additional share dilution in the computation of earnings per share. (z) Earnings per share Basic earnings per share is determined by dividing the profit attributed to members of the parent after related income tax expense by the weighted average number of ordinary shares outstanding during the financial year. Diluted earnings per share is calculated as net profit attributable to members, adjusted for: - cost of servicing equity (other than dividends); - the after tax effect of dividends and interest associated with dilutive potential ordinary shares that have been recognised as
expenses; and - other non-discretionary changes in revenue or expenses during the period that would result from the dilution of potential
ordinary shares; divided by the weighted average number of ordinary shares and dilutive potential ordinary shares, adjusted for any bonus element.
I n f o m e d i a L t d A n n u a l R e p o r t
NOTES TO THE FINANCIAL STATEMENTS
26
30 June 2007 Notes CONSOLIDATED INFOMEDIA LTD
2007 2006 2007 2006
$’000 $’000 $’000 $’000
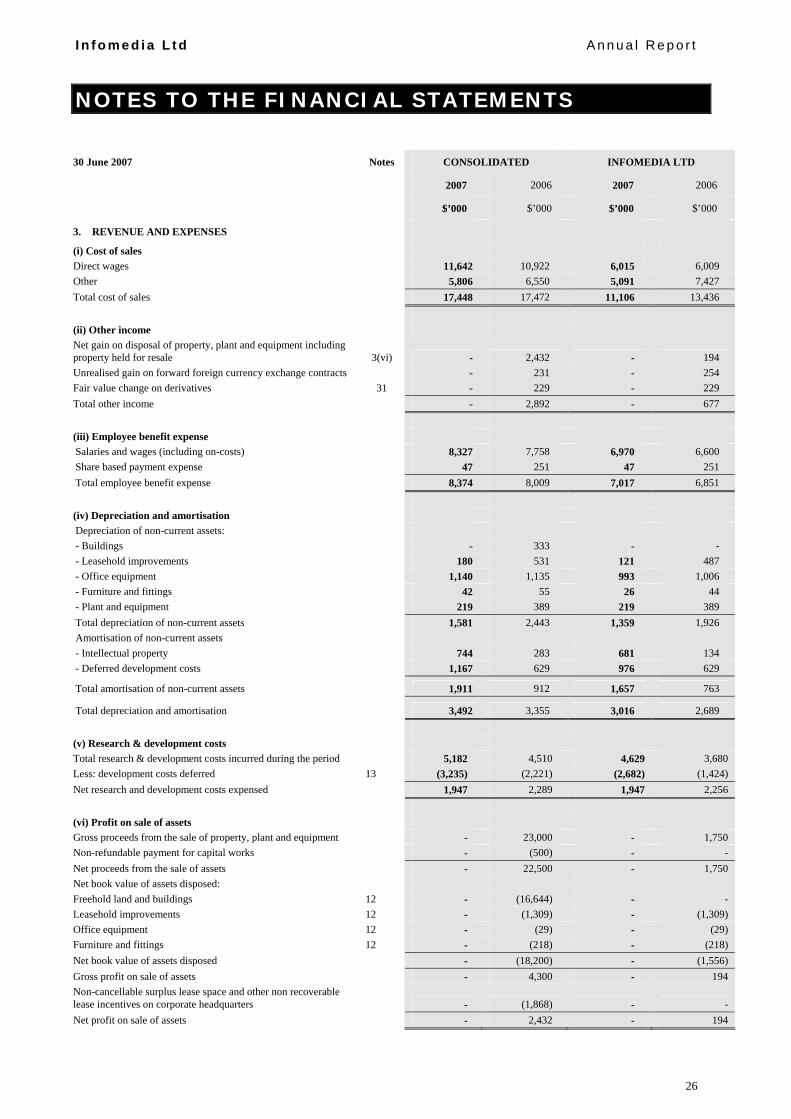
3. REVENUE AND EXPENSES
(i) Cost of sales Direct wages 11,642 10,922 6,015 6,009 Other 5,806 6,550 5,091 7,427 Total cost of sales 17,448 17,472 11,106 13,436 (ii) Other income Net gain on disposal of property, plant and equipment including property held for resale 3(vi) - 2,432 - 194 Unrealised gain on forward foreign currency exchange contracts - 231 - 254 Fair value change on derivatives 31 - 229 - 229 Total other income - 2,892 - 677 (iii) Employee benefit expense Salaries and wages (including on-costs) 8,327 7,758 6,970 6,600 Share based payment expense 47 251 47 251 Total employee benefit expense 8,374 8,009 7,017 6,851
(iv) Depreciation and amortisation Depreciation of non-current assets: - Buildings - 333 - - - Leasehold improvements 180 531 121 487 - Office equipment 1,140 1,135 993 1,006 - Furniture and fittings 42 55 26 44 - Plant and equipment 219 389 219 389 Total depreciation of non-current assets 1,581 2,443 1,359 1,926 Amortisation of non-current assets - Intellectual property 744 283 681 134 - Deferred development costs 1,167 629 976 629
Total amortisation of non-current assets 1,911 912 1,657 763
Total depreciation and amortisation 3,492 3,355 3,016 2,689 (v) Research & development costs Total research & development costs incurred during the period 5,182 4,510 4,629 3,680 Less: development costs deferred 13 (3,235) (2,221) (2,682) (1,424) Net research and development costs expensed 1,947 2,289 1,947 2,256 (vi) Profit on sale of assets Gross proceeds from the sale of property, plant and equipment - 23,000 - 1,750 Non-refundable payment for capital works - (500) - - Net proceeds from the sale of assets - 22,500 - 1,750 Net book value of assets disposed: Freehold land and buildings 12 - (16,644) - - Leasehold improvements 12 - (1,309) - (1,309) Office equipment 12 - (29) - (29) Furniture and fittings 12 - (218) - (218) Net book value of assets disposed - (18,200) - (1,556) Gross profit on sale of assets - 4,300 - 194 Non-cancellable surplus lease space and other non recoverable lease incentives on corporate headquarters
- (1,868) - -
Net profit on sale of assets - 2,432 - 194

I n f o m e d i a L t d A n n u a l R e p o r t
NOTES TO THE FINANCIAL STATEMENTS
27
30 June 2007 Notes CONSOLIDATED INFOMEDIA LTD
2007 2006 2007 2006
$’000 $’000 $’000 $’000
4. INCOME TAX
The major components of income tax expense are: Income statement Current income tax Current income tax charge 4,853 5,469 4,497 3,799 Adjustments in respect of current income tax of previous years.
(84) (327) (118) (225)
Adjustments in respect of capital gains tax of previous years.
(315) - - -
Deferred income tax Relating to origination and reversal of temporary differences
985 1,526 1,119 1,292
Income tax expense reported in the income statement 5,439 6,668 5,498 4,866
A reconciliation between tax expense and the product of accounting profit before income tax multiplied by the Company's applicable income tax rate is as follows:
Accounting profit before income tax 20,733 24,814 19,995 18,566 At the Company's statutory income tax rate of 30% (2006: 30%)
6,220 7,444 5,999 5,570
Adjustments in respect of current income tax of previous years
(84) (327) (118) (225)
Adjustments in respect of capital gains tax of previous years.
(315) - - -
Additional research and development deduction (388) (660) (347) (601) Expenditure not allowable for income tax purposes 145 211 138 122 Other (139) - (174) - Income tax expense reported in the income statement 5,439 6,668 5,498 4,866
Tax consolidation Effective 1 July 2002, for the purposes of income taxation, Infomedia Ltd and its 100% owned Australian subsidiaries have formed a tax consolidated group. Members of the group have entered into a tax sharing arrangement in order to allocate income tax expense to the wholly-owned subsidiaries. In addition the agreement provides for the allocation of income tax liabilities between the entities should the head entity default on its tax payment obligations. At the balance date, the possibility of default is remote.
Members of the tax consolidated group have also entered into a tax funding agreement. The tax funding agreement provides for the funding of allocated tax liabilities, tax losses and foreign tax credits for the current period based on recognition applying the recognition criteria set out in the accounting policy for income taxes. Allocations under the tax funding agreement are made after the finalisation of the group’s income tax return. The allocation of taxes under the tax funding agreement is recognised as an increase/decrease in the subsidiaries' intercompany accounts with the tax consolidated group head company, Infomedia Ltd.

I n f o m e d i a L t d A n n u a l R e p o r t
NOTES TO THE FINANCIAL STATEMENTS
28
30 June 2007 Notes BALANCE SHEET INCOME STATEMENT
2007 2006 2007 2006
4. INCOME TAX (CONTINUED) $’000 $’000 $’000 $’000
Deferred income tax Deferred income tax at 30 June relates to the following: CONSOLIDATED Deferred tax liabilities Prepayments (1) (8) (7) 8 Derivatives - (69) (69) 69 Property plant and equipment (120) (150) (30) 150 Deferred development costs (2,195) (1,574) 621 477 Intellectual property (384) (243) 141 2 Currency exchange - (18) (18) 18 (2,700) (2,062)
CONSOLIDATED Deferred tax assets Allowance for doubtful debts 77 75 (2) (94) Copyright intellectual property - 176 176 176 Other payables 116 97 (19) 15 Employee entitlement provisions 551 710 159 47 Other provisions 565 732 167 681 Currency exchange 134 - (134) (23) Gross deferred income tax assets 1,443 1,790 Deferred tax income/ (expense) 985 1,526
PARENT Deferred tax liabilities Prepayments (2) (5) (3) 5 Derivatives - (69) (69) 69 Property plant and equipment (120) (150) (30) 150 Deferred development costs (1,847) (1,335) 512 238 Intellectual property (384) - 384 - Currency exchange - (17) (17) 17 (2,353) (1,576)
PARENT Deferred tax assets Allowance for doubtful debts 75 69 (6) (100) Copyright intellectual property - 176 176 176 Other payables 107 91 (16) 28 Employee entitlement provisions 389 524 135 51 Other provisions 565 732 167 681 Currency exchange 114 - (114) (23) 1,250 1,592 Deferred tax income/ (expense) 1,119 1,292
30 June 2007

I n f o m e d i a L t d A n n u a l R e p o r t
NOTES TO THE FINANCIAL STATEMENTS
29
5. EARNINGS PER SHARE
Basic earnings per share amounts are calculated by dividing net profit for the year attributable to ordinary equity holders of the parent by the weighted average number of ordinary shares outstanding during the year.
Diluted earnings per share amounts are calculated by dividing the net profit attributable to ordinary shareholders by the weighted average number of ordinary shares outstanding during the year (adjusted for the effects of dilutive options).
The following reflects the income and share data used in the total operations basic and diluted earnings per share computations:
Notes CONSOLIDATED
2007 2006
$’000 $’000
Net profit attributable to equity holders from continuing operations 15,294 18,146
Number of
shares Number of
shares Weighted average number of ordinary shares for basic earnings per share 325,693,490 325,456,844 Effect of dilution: Employee share plans - 14,729 Share options 899,919 132,313 Adjusted weighted average number of ordinary shares for diluted earnings per share 326,593,409 325,603,886 There have been no other transactions involving ordinary shares or potential ordinary shares since the reporting date and before the completion of these financial statements.

I n f o m e d i a L t d A n n u a l R e p o r t
NOTES TO THE FINANCIAL STATEMENTS
30
30 June 2007 Notes
CONSOLIDATED
INFOMEDIA LTD
2007 2006 2006 2006
$’000 $’000 $’000 $’000
6. DIVIDENDS PROPOSED OR PAID
(a) Dividends paid during the year:
Franked interim dividend - 1.9 cents (2006: 1.9 cents) per share
6,194 6,184 6,194 6,184
Prior year final franked dividend – 2.1 cents (2006: 1.7 cents) per share
6,836 5,533 6,836 5,533
Special dividend – 3.5 cents (2006: 3.5 cents) per share
11,391 11,391 11,391 11,391
Total dividends paid during the year 24,421 23,108 24,421 23,108
(b) Dividends proposed and not recognised as a liability:
Final franked dividend – 2.1 cents (2006: 2.1 cents) per share
6,845 6,836 6,845 6,836
Special franked dividend – nil (2006: 3.5 cents) per share
- 11,391 - 11,391
6,845 18,227 6,845 18,227
(c) Franking credit balance:
The amount of franking credits available for the subsequent financial year are:
– franking account balance as at the end of the financial year
1,135 6,362
– franking credits that will arise from the payment of income tax payable as at the end of the financial year
2,228 3,126
3,363 9,488
The tax rate at which paid dividends have been franked is 30% (2006: 30%). Dividends proposed will be franked at the rate of 30% (2006: 30%).
7. TRADE AND OTHER RECEIVABLES (CURRENT)
Trade debtors 6,850 6,707 3,553 4,180
Allowance for doubtful debts (487) (480) (250) (228)
6,363 6,227 3,303 3,952
Other debtors 581 524 515 457
6,944 6,751 3,818 4,409
(a) Trade debtors are non-interest bearing and are generally on 30-60 day terms. An allowance for doubtful debts is made when there is objective evidence that a trade debtor is impaired. The amount of the allowance/impairment loss is recognised as the difference between the carrying amount of the debtor and the estimated future cash flows expected to be received from the relevant debtors.

I n f o m e d i a L t d A n n u a l R e p o r t
NOTES TO THE FINANCIAL STATEMENTS
31
30 June 2007 Notes CONSOLIDATED INFOMEDIA LTD
2007 2006 2007 2006
$’000 $’000 $’000 $’000
8. INVENTORIES
Raw materials
At cost 52 84 52 71
Total inventories at the lower of cost and net realisable value
52 84 52 71
9. INTERCOMPANY (NON-CURRENT)
Wholly-owned controlled entities - - 1,623 451
- - 1,623 451
10. OTHER FINANCIAL ASSETS (NON-CURRENT)
Investments in controlled entities 11 - - 248 248
Other receivables 335 804 335 804
335 804 583 1,052
11. INTERESTS IN CONTROLLED ENTITIES
Name Country of incorporation
Percentage of equity interest held by the Company (directly
or indirectly)
2007 2006
% %
IFM Europe Ltd
- ordinary shares United Kingdom 100 100
247 247
Infomedia Investments Pty Ltd
- ordinary shares - $2 only Australia 100 100
- -
Datateck Publishing Pty Ltd
- ordinary shares - $4 only Australia 100 100
- -
AutoConsulting Pty Ltd
- ordinary shares - $1 only Australia 100 100
- - IFM North America Inc - ordinary shares
United States of America 100 100
1 1
IFM Germany GmbH* Germany 100 -
- -
248 248
* Investment is held by IFM Europe Ltd.

I n f o m e d i a L t d A n n u a l R e p o r t
NOTES TO THE FINANCIAL STATEMENTS
32
30 June 2007 Notes CONSOLIDATED INFOMEDIA LTD
2007 2006 2007 2006
$’000 $’000 $’000 $’000
12. PROPERTY, PLANT & EQUIPMENT
Leasehold improvements
At cost 944 1,286 515 915
Accumulated amortisation (380) (369) (101) (148)
564 917 414 767
Office equipment
At cost 5,675 6,925 4,583 5,834
Accumulated depreciation (4,075) (4,616) (3,321) (3,943)
1,600 2,309 1,262 1,891
Furniture and fittings
At cost 266 334 123 212
Accumulated depreciation (93) (119) (57) (93)
173 215 66 119
Plant and equipment
At cost 2,800 2,597 2,800 2,597
Accumulated depreciation (2,320) (1,972) (2,320) (1,972)
480 625 480 625
Total property, plant and equipment
At cost 9,685 11,142 8,021 9,558
Accumulated depreciation and amortisation (6,868) (7,076) (5,799) (6,156)
Total written down amount 2,817 4,066 2,222 3,402

I n f o m e d i a L t d A n n u a l R e p o r t
NOTES TO THE FINANCIAL STATEMENTS
33
30 June 2007 CONSOLIDATED INFOMEDIA LTD
2007 2006 2007 2006
$’000 $’000 $’000 $’000
12. PROPERTY, PLANT & EQUIPMENT (CONTINUED)
(b) Reconciliation of property, plant and equipment carrying values
Freehold land and buildings
Carrying amount – opening balance - 16,976 - -
Disposals - (16,644) - -
Depreciation - (332) - -
Carrying amount – closing balance - - - -
Leasehold Improvements
Carrying amount – opening balance 917 2,138 767 2,039
Additions 81 619 15 524
Disposals (254) (1,309) (247) (1,309)
Depreciation (180) (531) (121) (487)
Carrying amount – closing balance 564 917 414 767
Office equipment
Carrying amount – opening balance 2,309 2,192 1,891 1,957
Additions 686 1,281 602 969
Disposals (255) (29) (238) (29)
Depreciation (1,140) (1,135) (993) (1,006)
Carrying amount – closing balance 1,600 2,309 1,262 1,891
Furniture and fittings
Carrying amount – opening balance 215 387 119 378
Additions 31 101 - 3
Disposals (31) (218) (27) (218)
Depreciation (42) (55) (26) (44)
Carrying amount – closing balance 173 215 66 119
Plant and equipment
Carrying amount – opening balance 625 889 625 889
Additions 74 125 74 125
Depreciation (219) (389) (219) (389)
Carrying amount – closing balance 480 625 480 625

I n f o m e d i a L t d A n n u a l R e p o r t
NOTES TO THE FINANCIAL STATEMENTS
34
30 June 2007 CONSOLIDATED INFOMEDIA LTD
Development costs1
$000
Intellectual Property2
$’000
Goodwill 2
$’000
Total
$’000
Development costs1
$000
Intellectual Property2
$’000
Goodwill 2
$’000
Total
$’000
13. INTANGIBLE ASSETS AND GOODWILL
At 1 July 2006
Cost (gross carrying amount) 6,229 3,910 8,837 18,976 5,432 2,410 6,026 13,868
Accumulated amortisation (980) (621) - (1,601) (980) (134) - (1,114)
Net carrying amount 5,249 3,289 8,837 17,375 4,452 2,276 6,026 12,754
Year ended 30 June 2007
At 1 July 2006, net of accumulated amortisation and impairment 5,249 3,289 8,837 17,375 4,452 2,276 6,026 12,754
Additions – internal development 3, 235 - - 3,235 2,682 - - 2,682
Disposals – Business systems assets - (950) (296) (1,246) - - - -
Other movements - (314) - (314) - (314) - (314)
Amortisation (1,167) (744) - (1,911) (976) (681) - (1,657)
At 30 June 2007, net of accumulated amortisation and impairment 7,317 1,281 8,541 17,139 6,158 1,281 6,026 13,465
At 30 June 2007
Cost (gross carrying amount) 9,464 2,096 8,541 20,101 8,114 2,096 6,026 16,236
Accumulated amortisation (2,147) (815) - (2,962) (1,956) (815) - (2,771)
Net carrying amount 7,317 1,281 8,541 17,139 6,158 1,281 6,026 13,465
1. Internally generated 2. Purchased as part of business/territory acquisition Development costs have been capitalised at cost. This intangible asset has been assessed as having a finite life and is amortised using the straight-line method over a period not exceeding four years commencing from the commercial release of the project. If an impairment indication arises, the recoverable amount is estimated and an impairment loss is recognised to the extent that the recoverable amount is lower than the carrying amount. Intellectual property includes intangible assets acquired through business or territory acquisition and relates primarily to copyright and software code over key products. Intellectual property is amortised over its useful life being 10 years.

I n f o m e d i a L t d A n n u a l R e p o r t
NOTES TO THE FINANCIAL STATEMENTS
35
CONSOLIDATED INFOMEDIA LTD
Development costs
$000
Intellectual Property
$’000
Goodwill
$’000
Total
$’000
Development costs
$000
Intellectual Property
$’000
Goodwill
$’000
Total
$’000
13. INTANGIBLE ASSETS AND GOODWILL (CONTINUED)
At 1 July 2005
Cost (gross carrying amount) 4,008 1,500 8,837 14,345 4,008 - 6,026 10,034
Accumulated amortisation (351) (338) - (689) (351) - - (351)
Net carrying amount 3,657 1,162 8,837 13,656 3,657 - 6,026 9,683
Year ended 30 June 2006
At 1 July 2005, net of accumulated amortisation and impairment 3,657 1,162 8,837 13,656 3,657 - 6,026 9,683
Additions – internal development 2,221 - - 2,221 1,424 - - 1,424
Purchased intellectual property - 2,410 - 2,410 - 2,410 - 2,410
Amortisation (629) (283) - (912) (629) (134) - (763)
At 30 June 2006, net of accumulated amortisation and impairment 5,249 3,289 8,837 17,375 4,452 2,276 6,026 12,754
At 30 June 2006
Cost (gross carrying amount) 6,229 3,910 8,837 18,976 5,432 2,410 6,026 13,868
Accumulated amortisation (980) (621) - (1,601) (980) (134) - (1,114)
Net carrying amount 5,249 3,289 8,837 17,375 4,452 2,276 6,026 12,754
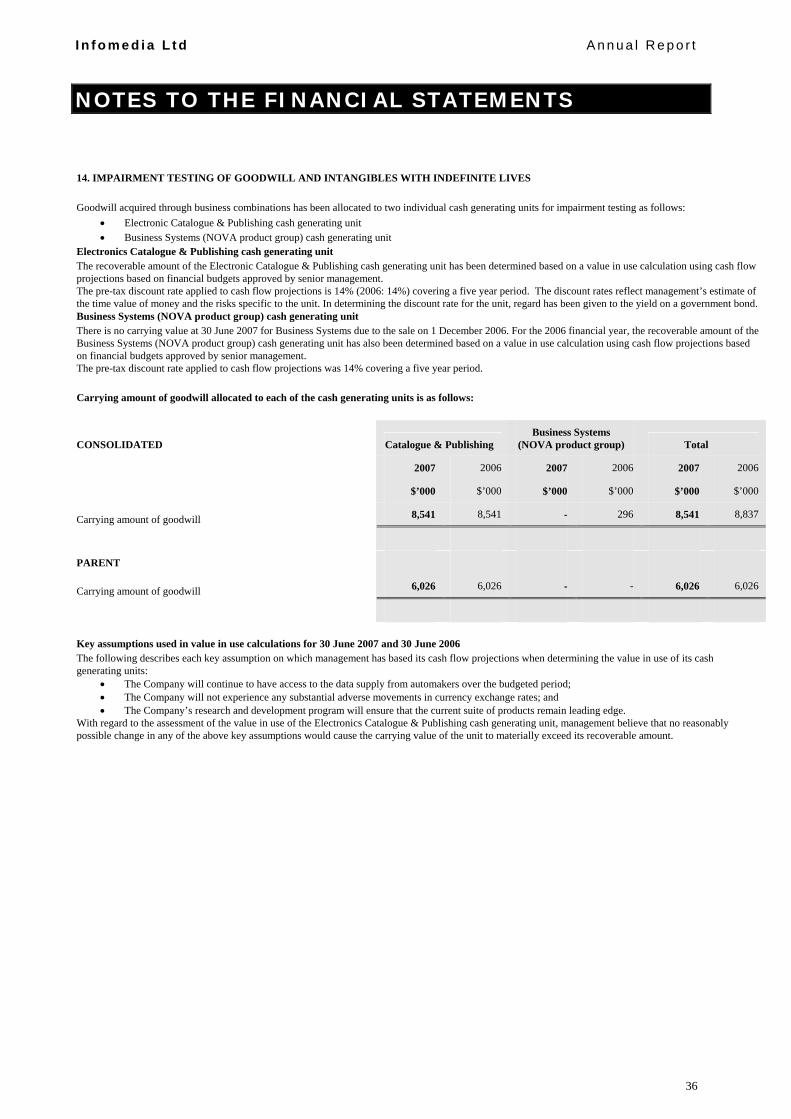
I n f o m e d i a L t d A n n u a l R e p o r t
NOTES TO THE FINANCIAL STATEMENTS
36
14. IMPAIRMENT TESTING OF GOODWILL AND INTANGIBLES WITH INDEFINITE LIVES Goodwill acquired through business combinations has been allocated to two individual cash generating units for impairment testing as follows:
• Electronic Catalogue & Publishing cash generating unit • Business Systems (NOVA product group) cash generating unit
Electronics Catalogue & Publishing cash generating unit The recoverable amount of the Electronic Catalogue & Publishing cash generating unit has been determined based on a value in use calculation using cash flow projections based on financial budgets approved by senior management. The pre-tax discount rate applied to cash flow projections is 14% (2006: 14%) covering a five year period. The discount rates reflect management’s estimate of the time value of money and the risks specific to the unit. In determining the discount rate for the unit, regard has been given to the yield on a government bond. Business Systems (NOVA product group) cash generating unit There is no carrying value at 30 June 2007 for Business Systems due to the sale on 1 December 2006. For the 2006 financial year, the recoverable amount of the Business Systems (NOVA product group) cash generating unit has also been determined based on a value in use calculation using cash flow projections based on financial budgets approved by senior management. The pre-tax discount rate applied to cash flow projections was 14% covering a five year period. Carrying amount of goodwill allocated to each of the cash generating units is as follows:
CONSOLIDATED Catalogue & Publishing Business Systems
(NOVA product group) Total
2007 2006 2007 2006 2007 2006
$’000 $’000 $’000 $’000 $’000 $’000
Carrying amount of goodwill 8,541 8,541 - 296 8,541 8,837
PARENT
Carrying amount of goodwill 6,026 6,026 - - 6,026 6,026
Key assumptions used in value in use calculations for 30 June 2007 and 30 June 2006 The following describes each key assumption on which management has based its cash flow projections when determining the value in use of its cash generating units:
• The Company will continue to have access to the data supply from automakers over the budgeted period; • The Company will not experience any substantial adverse movements in currency exchange rates; and • The Company’s research and development program will ensure that the current suite of products remain leading edge.
With regard to the assessment of the value in use of the Electronics Catalogue & Publishing cash generating unit, management believe that no reasonably possible change in any of the above key assumptions would cause the carrying value of the unit to materially exceed its recoverable amount.

I n f o m e d i a L t d A n n u a l R e p o r t
NOTES TO THE FINANCIAL STATEMENTS
37
30 June 2007 Notes CONSOLIDATED INFOMEDIA LTD
2007 2006 2007 2006
$’000 $’000 $’000 $’000
15. TRADE AND OTHER PAYABLES (CURRENT)
Trade creditors 15(a) 443 1,131 139 565
Other creditors 2,039 2,843 1,613 2,423
2,482 3,974 1,752 2,988
(a) Trade creditors are non-interest bearing and are normally settled on 30 day terms.
16. INTEREST BEARING LOANS AND BORROWINGS (CURRENT)
Bank loans 16(a) - 500 - 500
- 500 - 500
(a) The bank loan drawings have been made under a multi-currency cash advance facility. The drawings at balance date are denominated in Australian dollars. The USD13 million facility terminates in August 2008 (refer also Notes 21(c), 23(c) and 31).
17. PROVISIONS (CURRENT)
Employee benefits 1,790 2,063 1,118 1,353
Provision for non-cancellable surplus lease space and other lease incentives 19(a) 494 648 494 648
2,284 2,711 1,612 2,001
18. DEFERRED REVENUE (CURRENT)
Revenue in advance 506 816 254 405
506 816 254 405

I n f o m e d i a L t d A n n u a l R e p o r t
NOTES TO THE FINANCIAL STATEMENTS
38
30 June 2007 Notes CONSOLIDATED INFOMEDIA LTD
2007 2006 2007 2006
$’000 $’000 $’000 $’000
19. PROVISIONS (NON-CURRENT)
Employee benefits 315 545 177 393
Provision for non-cancellable surplus lease space and other lease incentives 19(a) 891 1,294 891 1,294
Make good provision 19(b) 500 500 500 500
1,706 2,339 1,568 2,187
(a) Movement in non-cancellable surplus lease space and other lease incentives provision:
Carrying amount at the beginning of the year 1,942 178 1,942 178
Arising during the year - 1,868 - 1,868
Utilised (688) (104) (688) (104)
Discount rate adjustment 131 - 131 -
Carrying amount at the end of the year 1,385 1,942 1,385 1,942
Current 17 494 648 494 648
Non-current 891 1,294 891 1,294
1,385 1,942 1,385 1,942
The provision for non-cancellable lease space and other lease incentives has been made pursuant to the lease obligations under contract to the extent that no future benefits are anticipated.
(b) Movement in make good provision:
Carrying amount at the beginning of the year 500 - 500 -
Arising during the year - 500 - 500
Carrying amount at the end of the year 500 500 500 500
The provision for make good has been estimated pursuant to the Company’s obligation to restore leased premises to original condition at the end of the lease term.

I n f o m e d i a L t d A n n u a l R e p o r t
NOTES TO THE FINANCIAL STATEMENTS
39
30 June 2007 Notes CONSOLIDATED INFOMEDIA LTD
2007 2006 2007 2006
20. CONTRIBUTED EQUITY AND RESERVES $’000 $’000 $’000 $’000
Ordinary shares 17,738 17,488 17,738 17,488
17,738 17,488 17,738 17,488
Effective 1 July 1998, the Corporations legislation in place abolished the concepts of authorised capital and par value shares. Accordingly, the Parent does not have authorised capital nor par value in respect of its issued shares.
Fully paid ordinary shares carry one vote per share and carry the right to dividends. Notes Number $’000
Movement in ordinary shares on issue:
At 1 July 2005 325,156,205 17,488
Employee Share Plan issuance 24 315,368 -
At 30 June 2006 325,471,573 17,488
Employee Options Exercised 24 499,999 250
At 30 June 2007 325,971,572 17,738
Employee Option Plan There were no options issued during the current year. A total of 1,700,000 options were issued to eligible employees during the prior year at an average exercise price of $0.50. Refer to Note 24.
30 June 2007 Notes CONSOLIDATED INFOMEDIA LTD
Employee equity
benefits reserve
Foreign currency
translation reserve Total
Employee equity benefits reserve
$’000 $’000 $’000 $’000
Movement in reserves:
At 1 July 2005 725 (19) 706 725
Currency translation differences - 53 53 -
Share based payments 251 - 251 251
At 30 June 2006 976 34 1,010 976
Currency translation differences - (79) (79) -
Share based payments 47 - 47 47
At 30 June 2007 1,023 (45) 978 1,023
Nature and purpose of reserves
Employee equity benefits reserve This reserve is used to record the value of equity benefits provided to employees and Directors as part of their compensation. Refer to Note 24 for further details. Foreign currency translation reserve The foreign currency translation reserve is used to record exchange differences arising from the translation of the financial statements of foreign subsidiaries. It is also used to record the effect of hedging net investments in foreign operations.

I n f o m e d i a L t d A n n u a l R e p o r t
NOTES TO THE FINANCIAL STATEMENTS
40
30 June 2007 Notes CONSOLIDATED INFOMEDIA LTD
2007 2006 2007 2006
21. STATEMENT OF CASH FLOWS $’000 $’000 $’000 $’000
(a) Reconciliation of profit after tax to the net cash flows from operations
Profit from ordinary activities after income tax expense
15,294 18,146 14,497 13,700
Depreciation of non-current assets 1,581 2,443 1,359 1,926 Amortisation of non-current assets 1,911 912 1,657 763 Amortisation of employee options 47 251 47 251 Net (profit)/loss on sale of business (15) - 76 - Gross profit on sale of property, plant and equipment
including property held for resale
- (4,300) - (194) Changes in assets and liabilities (Increase)/decrease in trade and other debtors 415 (31) (1,279) 2,475 (Increase)/decrease in inventories 32 4 20 (29) (Increase)/decrease in prepayments 97 (4) 144 (14) (Increase)/decrease in future income tax benefit 348 (803) 341 (813) (Increase)/decrease in deferred development costs (3,235) (2,221) (2,682) (1,424) Decrease/(increase) in trade and other creditors (1,168) 21 (917) (320) Decrease/(increase) in allowance for doubtful debts 8 (399) 23 (332) Decrease/(increase) in provision for employee
entitlements
(505) 178 (485) 66 Decrease/(increase) in other provisions (270) 1,868 (270) 1,868 Decrease/(increase) in income tax payable (1,180) 2,236 476 673 Decrease/(increase) in deferred income tax liability 639 721 777 478 Decrease/(increase) in revenue in advance 45 7 (151) 38
Net cash flow from operating activities 14,044 19,029 13,633 19,112
(b) Reconciliation of cash
Cash balance comprises: – cash at bank 4,404 25,853 3,116 25,079 – cash on deposit 11,286 168 10,428 10
15,690 26,021 13,544 25,089
(c) Financing facilities available
At reporting date, the following financing facilities had been negotiated and were available:
Total facilities:
USD13 million multi-currency cash advance facility 15,350 17,580 15,350 17,580
Facilities used at reporting date:
Bank loans - 500 - 500
Facilities unused at reporting date:
Bank loans 15,350 17,080 15,350 17,080

I n f o m e d i a L t d A n n u a l R e p o r t
NOTES TO THE FINANCIAL STATEMENTS
41
30 June 2007 Notes CONSOLIDATED INFOMEDIA LTD
2007 2006 2007 2006
22. SALE OF BUSINESS $’000 $’000 $’000 $’000
On 1 December 2006, Infomedia sold its Business Systems division to an unrelated third party. The components of the disposal were:
Gross consideration 1,500 - 150 - Net working capital adjustments (331) - 35 -
Cash proceeds 1,169 - 185 -
Net book value of assets and liabilities disposed: Plant and equipment 540 - 512 - Intangible assets 1,245 - - - Other net liabilities (631) - (251) -
Total net assets disposed 1,154 - 261 -
Net profit on sale of business 15 - (76) -
23. COMMITMENTS & CONTINGENCIES
(a) Lease expenditure commitments
Operating leases (non-cancellable):
Minimum lease payments
– not later than one year 1,540 1,657 1,098 1,199
– later than one year and not later than five years 4,093 4,483 3,463 3,453
– aggregate operating lease expenditure contracted for at balance date 5,633 6,140 4,561 4,652
Operating lease commitments are for office accommodation both in Australia and abroad.
(b) Performance Bank Guarantee
Infomedia Ltd has a performance bank guarantee to a maximum value of $700,000 relating to the lease commitments of its corporate headquarters.
(c) Interlocking Guarantees
The bank loan drawings have been made pursuant to a multi-currency cash advance facility. The facility has been provided on the condition of interlocking guarantees between the Parent entity and its controlled entities (the guarantors).

I n f o m e d i a L t d A n n u a l R e p o r t
NOTES TO THE FINANCIAL STATEMENTS
42
24. SHARE BASED PAYMENT PLANS
Employee Option Plan
The Employee Option Plan entitles the Company to offer ‘eligible employees’ options to subscribe for shares in the Company. Options will be granted at a nil issue price unless otherwise determined by the Directors of the Company and each Option enables the holder to subscribe for one Share. The exercise price for the Options granted will be as specified on the option certificate or, if not specified, the volume weighted average price for Shares of the Company for the five days trading immediately before the day on which the options were granted. The Options may be exercised in accordance with the date determined by the Board, which must be within four years of the option being granted.
Information with respect to the number of options granted under the employee share incentive scheme is as follows:
Notes 2007 2006
Number of
options
Weighted average
exercise price Number of
options
Weighted average exercise
price
Balance at beginning of year 24(a) 1,950,000 $0.52 727,000 $0.73
- granted 24(b) - - 1,700,000 $0.50
- forfeited (150,000) $0.75 (477,000) $0.73
- exercised 24(c) (499,999) $0.50 - -
Balance at end of year 24(d) 1,300,001 $0.51 1,950,000 $0.52
(a) Options held at the beginning of the year:
The following table summarises information about options held by employees at 1 July 2006
Number of options Grant date Earliest vesting
date Expiry date
Weighted average
exercise price
150,000 24/5/2004 24/5/2005 31/5/2007 $0.75
100,000 20/9/2004 20/9/2005 20/9/2007 $0.67
250,000 8/7/2005 5/1/2006 5/2/2008 $0.50
1,000,000 27/10/2005 5/1/2006 5/2/2008 $0.50
250,000 6/10/2005 5/1/2006 5/2/2008 $0.48
200,000 16/12/2005 16/12/2006 16/1/2009 $0.49
(b) Options granted during the year:
There were no options granted during the year ended 30 June 2007.
(c) Options exercised during the year:
The following table summarises information about options exercised by employees during the year
Number of options exercised
Weighted average
exercise price
Weighted average share price at date of
exercise
499,999 $0.50 $0.79
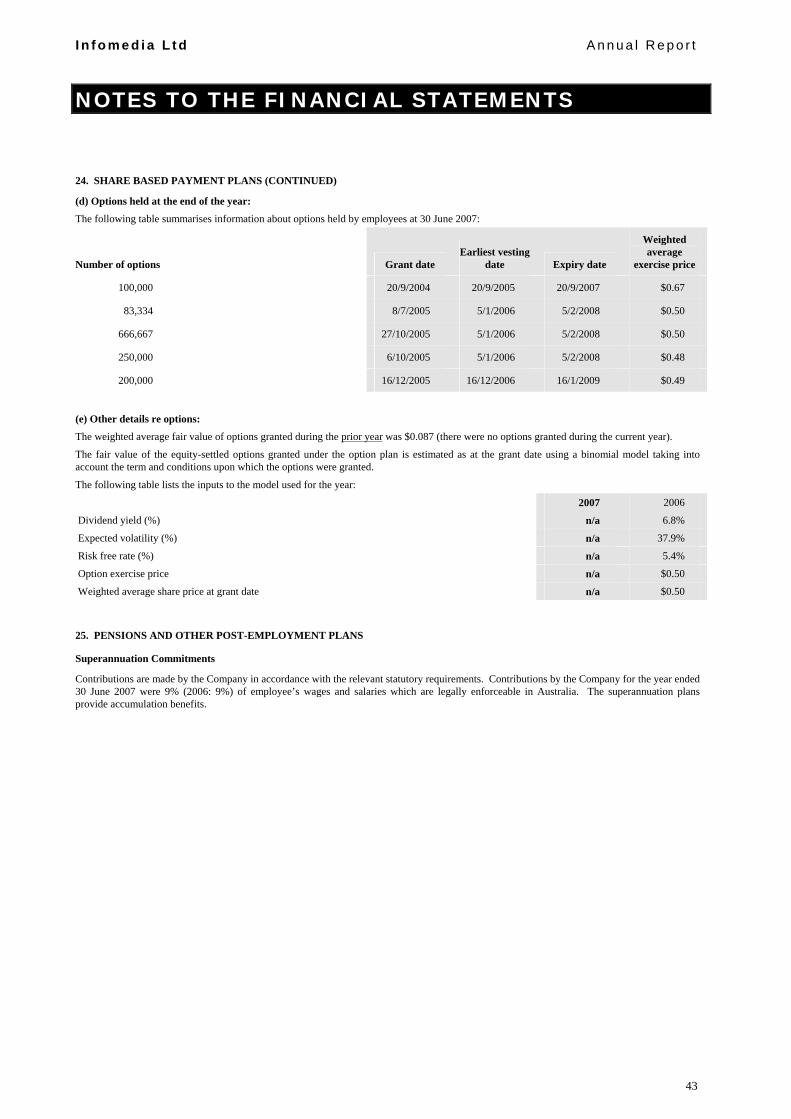
I n f o m e d i a L t d A n n u a l R e p o r t
NOTES TO THE FINANCIAL STATEMENTS
43
24. SHARE BASED PAYMENT PLANS (CONTINUED)
(d) Options held at the end of the year:
The following table summarises information about options held by employees at 30 June 2007:
Number of options Grant date Earliest vesting
date Expiry date
Weighted average
exercise price
100,000 20/9/2004 20/9/2005 20/9/2007 $0.67
83,334 8/7/2005 5/1/2006 5/2/2008 $0.50
666,667 27/10/2005 5/1/2006 5/2/2008 $0.50
250,000 6/10/2005 5/1/2006 5/2/2008 $0.48
200,000 16/12/2005 16/12/2006 16/1/2009 $0.49
(e) Other details re options:
The weighted average fair value of options granted during the prior year was $0.087 (there were no options granted during the current year).
The fair value of the equity-settled options granted under the option plan is estimated as at the grant date using a binomial model taking into account the term and conditions upon which the options were granted.
The following table lists the inputs to the model used for the year:
2007 2006
Dividend yield (%) n/a 6.8%
Expected volatility (%) n/a 37.9%
Risk free rate (%) n/a 5.4%
Option exercise price n/a $0.50
Weighted average share price at grant date n/a $0.50
25. PENSIONS AND OTHER POST-EMPLOYMENT PLANS
Superannuation Commitments
Contributions are made by the Company in accordance with the relevant statutory requirements. Contributions by the Company for the year ended 30 June 2007 were 9% (2006: 9%) of employee’s wages and salaries which are legally enforceable in Australia. The superannuation plans provide accumulation benefits.

I n f o m e d i a L t d A n n u a l R e p o r t
NOTES TO THE FINANCIAL STATEMENTS
44
26. KEY MANAGEMENT PERSONNEL DISCLOSURES Infomedia Ltd has adopted the option available under the Corporation Regulations 2M.6.04 (as amended by the Corporation Amendments Regulation 2006 (No. 4)) which permits listed companies to transfer the remuneration disclosures required AASB124 para Aus 25.4 – Aus 25.7.2 out of the Financial Report and into the Remuneration Report. The transferred AASB124 disclosures are subject to audit.
(a) Details of Key Management Personnel
(i) Directors
Richard Graham Chairman
Gary Martin Chief Executive Officer
Myer Herszberg Non-executive Director
Geoffrey Henderson (resigned 28 February 2007) Non-executive Director
Frances Hernon Non-executive Director
Andrew Moffat Non-executive Director
(ii) Executives
Andrew Pattinson Managing Director – IFM Europe Ltd
Peter Adams Chief Financial Officer
Mark Kujacznski Vice President - IFM North America Inc
Michael Roach General Manager – Electronic Catalogue and Data Management
Nick Georges Company Secretary and Legal Counsel (b) Compensation of Key Management Personnel
(i) Compensation by Category: Key Management Personnel
CONSOLIDATED INFOMEDIA LTD
2007 2006 2007 2006
$ $ $ $
Short-Term 1,868,431 1,707,944 1,101,169 1,040,551
Post Employment 129,314 123,725 86,179 82,408
Other Long-Term 15,442 15,130 7,417 7,479
Termination Benefits - - - -
Share-based Payments 79,839 92,310 72,507 84,024
2,093,206 1,939,109 1,267,272 1,214,462

I n f o m e d i a L t d A n n u a l R e p o r t
NOTES TO THE FINANCIAL STATEMENTS
45
26. KEY MANAGEMENT PERSONNEL DISCLOSURES (CONTINUED)
(c) Shareholdings of Key Management Personnel
30 June 2007
Number of shares held in Infomedia Ltd Balance 30 June
2006 Granted as
compensation On exercise of options
Net change other
Balance 30 June 2007
Directors
Richard Graham 102,204,060 - - - 102,204,060
Myer Herszberg 39,421,599 - - (16,000,000) 23,421,599
Gary Martin 74,257 - 333,333 - 407,590
Frances Hernon 5,000 - - - 5,000
Executives
Andrew Pattinson 2,447,567 - - - 2,447,567
Peter Adams 11,421 - 166,666 (78,087) 100,000
Nick Georges 24,421 - - - 24,421
Michael Roach 18,721 - - - 18,721
Total 144,207,046 - 499,999 (16,078,087) 128,628,958
30 June 2006
Number of shares held in Infomedia Ltd Balance 1 July
2005 Granted as
compensation On exercise of options
Net change other
Balance 30 June 2006
Directors
Richard Graham 102,204,060 - - - 102,204,060
Myer Herszberg 39,421,599 - - - 39,421,599
Gary Martin 74,257 - - - 74,257
Frances Hernon 5,000 - - - 5,000
Executives
Andrew Pattinson 2,545,571 1,996 - (100,000) 2,447,567
Nick Georges 22,425 1,996 - - 24,421
Michael Roach 16,725 1,996 - - 18,721
Peter Adams 9,425 1,996 - - 11,421
Total 144,299,062 7,984 - (100,000) 144,207,046
All equity transactions with key management personnel other than those arising from the exercise of compensation options and compensation shares have been entered into under terms and conditions no more favourable than those the entity would have adopted if dealing at arm’s length.

I n f o m e d i a L t d A n n u a l R e p o r t
NOTES TO THE FINANCIAL STATEMENTS
46
26. KEY MANAGEMENT PERSONNEL DISCLOSURES (CONTINUED)
(d) Loans to Key Management Personnel
There were no loans at the beginning or the end of the reporting period to key management personnel. No loans were made available during the reporting period to key management personnel.
(e) Other transactions and balances with Key Management Personnel (including related entities)
(i) Infomedia Ltd previously rented office space from Wiser Equity Pty Limited (formerly Wiser Laboratory Pty Limited), a company in which Richard Graham is a Director. A lease termination payment of $170,000 was made on 9 August 2005 to Wiser Equity Pty Limited to relinquish the Company from its future lease commitments as the space was no longer used.
(ii) Infomedia Ltd rented office space from Richard Graham. The total rent payments for the year ended 30 June 2007 of $79,209 (2006: $176,898) were on commercial terms.
(iii) Infomedia Ltd received financial consulting services from Cowoso Capital Pty Limited, a company in which Andrew Moffat is a Director. The total consulting services paid for the year ended 30 June 2007 of $57,500 (2006: $12,500) were on commercial terms.
30 June 2007 Notes CONSOLIDATED INFOMEDIA LTD
2007 2006 2007 2006
$ $ $ $
27. AUDITORS’ REMUNERATION
Amounts received or due and receivable by the auditors of Infomedia Ltd for:
– an audit or review of the financial report of the entity and any other entity in the consolidated entity
191,900 183,350 165,850 158,350
– other services in relation to the entity and any other entity in the consolidated entity
- - - -
191,900 183,350 165,850 158,350
28. RELATED PARTY DISCLOSURES
Ultimate Parent
Infomedia Ltd is the ultimate Australian parent company
Wholly-owned group transactions
(a) An unsecured, interest free loan of $5,002 (2006: $Nil) remains owing from IFM Germany GmbH to Infomedia Ltd.
(b) An unsecured, interest free loan of $3,131,065 (2006: $2,793,213) remains owing to Infomedia Investments Pty Limited from Infomedia Ltd.
(c) An unsecured, interest free loan of $2,767,113 (2006: $2,126,248) remains owing from Datateck Publishing Pty Limited to Infomedia Ltd. The loan is repayable in seven days upon demand.
(d) An unsecured, interest free loan of $386,219 (2006: $987,913) remains owing from AutoConsulting Pty Limited to Infomedia Ltd. The loan is repayable in seven days upon demand.
(e) An unsecured, interest free loan of $59,810 (2006: $1,013,333) remains owing from IFM Europe Ltd to Infomedia Ltd.
(f) An unsecured, interest free loan of $1,535,477 (2006: $1,143,345) remains owing from IFM North America Inc. to Infomedia Ltd.
(g) During the year a management fee of $480,000 (2006: $480,000) was paid to Datateck Publishing Pty Limited by Infomedia Ltd.
(h) During the year Infomedia Ltd received $13,117,364 (2006: $7,004,846) from IFM Europe Ltd for intra-group sales.
(i) During the year Datateck Publishing Pty Limited received $746,110 (2006: $279,441) from IFM Europe Ltd for intra-group sales.
(j) During the year IFM Europe Ltd received $565,934 (2006: $1,571,822) from Infomedia Ltd for intra-group distribution services.
(k) During the year Infomedia Ltd received $10,363,329 (2006: $8,827,526) from IFM North America Inc. for intra-group sales.
(l) During the year IFM North America Inc. received $554,699 (2006: $813,558) from Infomedia Ltd for intra-group distribution services.
(m) During the year IFM Europe paid $398,384 (2006: $nil) to IFM Germany GmbH for intra-group distribution services.
Entity with deemed significant influence over the Company
Wiser Equity Pty Limited, a company in which Richard Graham is a Director, owns 30.8% of the ordinary shares in Infomedia Ltd (2006: 30.8%).

I n f o m e d i a L t d A n n u a l R e p o r t
NOTES TO THE FINANCIAL STATEMENTS
47
29. SEGMENT INFORMATION
PRIMARY SEGMENT
30 June 2007
Business Segments Catalogue &
Publishing Business Systems*** Total Notes $’000 $’000 $’000 REVENUE Sales revenue 52,990 1,576 54,566 Rental income - - - Total segment revenue 52,990 1,576 54,566 Unallocated revenue: Finance revenue 791 Total consolidated revenue 55,357 Segment result 20,019 57 20,076 Unallocated items: Finance revenue 791 Finance costs (134)
Consolidated profit before income tax 20,733 Income tax expense 4 (5,439)
Consolidated profit after income tax 15,294 ASSETS Segment assets 29,162 - 29,162 Unallocated assets: Cash
15,690
Total Assets 44,852 LIABILITIES Segment liabilities 11,950 - 11,950 Other segment information:
Capital expenditure 873 - 873 Depreciation 3(iv) 1,479 102 1,581 Amortisation 3(iv) 1,848 63 1,911
*** - The Business Systems division was sold on 1 December 2006 for $1,500,000 (refer note 22). As a result the segment result shown above represents five months of trading only.

I n f o m e d i a L t d A n n u a l R e p o r t
NOTES TO THE FINANCIAL STATEMENTS
48
29. SEGMENT INFORMATION (CONTINUED) 30 June 2006
Business Segments Catalogue & Publishing Business Systems Total Notes $’000 $’000 $’000 REVENUE Sales revenue 51,635 3,942 55,577 Rental income 646 - 646 Total segment revenue 52,281 3,942 56,223 Unallocated revenue: Finance revenue 268 Total consolidated revenue 56,491 Segment result 24,634 109 24,743 Unallocated items: Finance revenue 268 Finance costs (197) Consolidated profit before income tax 24,814
Income tax expense 4 (6,668) Consolidated profit after income tax 18,146
ASSETS Segment assets 28,889 2,754 31,643 Unallocated assets: Cash
26,021
Total Assets 57,664 LIABILITIES Segment liabilities 14,754 1,099 15,853 Other segment information: Capital expenditure 1,522 103 1,625
Depreciation 3(iv) 2,149 294 2,443 Amortisation 3(iv) 762 150 912

I n f o m e d i a L t d A n n u a l R e p o r t
NOTES TO THE FINANCIAL STATEMENTS
49
29. SEGMENT INFORMATION (CONTINUED)
SECONDARY SEGMENT 30 June 2007
Geographical Segments
Europe North
America Asia Pacific
Latin & South
America Total Notes $’000 $’000 $’000 $’000 $’000 REVENUE Segment revenue 20,511 16,343 13,870 3,842 54,566 Unallocated revenue: Finance revenue 791 Total consolidated revenue 55,357 ASSETS Segment assets 1,345 1,480 26,337 - 29,162 Unallocated assets: Cash 15,690 Total Assets 44,852
Capital expenditure
8 4 861 - 873
30 June 2006
Geographical Segments
Europe North
America Asia Pacific Latin & South
America Total Notes $’000 $’000 $’000 $’000 $’000 Segment revenue 18,437 17,876 15,779 3,485 55,577 Unallocated revenue: Finance revenue 268 Rental income 646 Total consolidated revenue 56,491 ASSETS Segment assets 556 1,514 29,573 - 31,643 Unallocated assets: Cash 26,021 Total Assets 57,664
Capital expenditure
19 211 1395 - 1,625 Segment products and locations The Company’s operating divisions are organised and managed separately according to the nature of the products and the services they provide, with each segment offering different products. Infomedia’s core business involves the production of the Microcat and Partfinder electronic parts catalogues and the Superservice Menus service quoting system. These systems are specialised business tools designed to make the selection and sale of replacement parts fast, easy and accurate. All products are sourced from Australia. Segment accounting policies The Company generally accounts for intersegment sales and transfers as if the sales or transfers were to third parties at current market prices. Segment accounting polices are the same as the Company’s accounting policies described in Note 2. The geographical segment revenue is classified according to customer destination as opposed to the billing source. This classification represents a change in presentation from the prior year with the 2006 comparative figures restated accordingly. The change in classification has been driven by enhancements to internal management reporting. Geographical assets have been classified according to location of the asset. The Asia Pacific disclosures include corporate assets.

I n f o m e d i a L t d A n n u a l R e p o r t
NOTES TO THE FINANCIAL STATEMENTS
50
30. FINANCIAL RISK MANAGEMENT OBJECTIVES AND POLICIES
The Company’s principal financial instruments, other than derivatives, comprise bank loans, cash and short-term deposits. The main purpose of these financial instruments is to raise finance for the Company’s operations. The Company has various other financial assets and liabilities such as trade receivables and trade payables, which arise directly from its operations. The Company also enters into derivative transactions through forward currency contracts. The purpose is to manage the currency risks arising from the Company’s operations. It is, and has been throughout the period under review, the Company’s policy that no trading in financial instruments shall be undertaken. The main risks arising from the Company’s financial instruments are cash flow interest rate risk, liquidity risk, foreign currency risk and credit risk. Details of the significant accounting policies and methods adopted, including the criteria for recognition, the basis of measurement and the basis on which income and expenses are recognised, in respect of each class of financial asset, financial liability and equity instrument are disclosed in Note 2 to the financial statements.
Cash flow interest rate risk The Company’s exposure to the risk of changes in market interest rates relates primarily to the Company’s cash holdings with a floating interest rate. The Company’s policy is to accept the floating interest rate risk with both its cash holdings and bank loans. Cash is held primarily with leading Australian banks for periods not exceeding 30 days. Bank loans are drawn with varying bill maturities ranging from 30 to 180 days accepting the floating rate of interest.
Foreign currency risk The Company has transactional currency exposures. These exposures mainly arise from the transactional sale of products and to a lesser extent the associated cost of sales component relating to these products. As the Company’s product offerings are typically made on a recurring monthly subscription basis, there is a relatively high degree of reliability in estimating a proportion of future cashflow exposures. Approximately half of the Company’s sales are denominated in United States Dollars and around one-third of the Company’s sales are denominated in Euro. The Company seeks to mitigate exposure to movements in these currencies by entering into forward exchange derivative contracts periodically. As a result of the Company’s recent investment in both its European and United States subsidiaries, the Company’s balance sheet can be affected by movements in both the Euro and United States dollar against the Australian dollar. As the net earnings from these operations are repatriated back to Australia on a regular basis, the Company does not seek to hedge this exposure.
Credit risk The Company’s credit risk with regard to accounts receivables is spread broadly across three automotive groups - manufacturers, distributors and dealerships. Receivable balances are monitored on an ongoing basis with the result that the Company’s exposure to bad debts is not significant. As the products typically have a monthly life cycle and are priced on a relatively low subscription price, the concentration of credit risk is typically low with automotive manufacturers being the exception. With respect to credit risk arising from the other financial assets of the Company, which comprise cash and cash equivalents, available-for-sale financial assets and certain derivative instruments, the Company’s exposure to credit risk arises from default of the counter party, with a maximum exposure equal to the carrying amount of these instruments. Since the Company trades only with recognised third parties, there is no requirement for collateral.
Liquidity risk The Company’s exposure to liquidity risk is minimal given the relative strength of the balance sheet and strong cash flows from operations.

I n f o m e d i a L t d A n n u a l R e p o r t
NOTES TO THE FINANCIAL STATEMENTS
51
31. FINANCIAL INSTRUMENTS
Fair values Set out below is a comparison by category of carrying amounts and fair values of all of the Company’s financial instruments recognised in the financial statements. The fair values of derivatives have been calculated by discounting the expected future cash flows at prevailing interest rates.
Carrying Amount Fair Value
CONSOLIDATED 2007 2006 2007 2006
Financial assets $’000 $’000 $’000 $’000
Cash and cash equivalents 15,690 26,021 15,690 26,021 Trade receivables 6,363 6,227 6,363 6,227 Forward currency contracts - 229 - 229 Other financial assets (non-current) 335 804 335 804
Financial liabilities
Trade payables 2,482 3,974 2,482 3,974 Interest-bearing loans and borrowings - 500 - 500
Off balance sheet
Contingencies - - 700 700
Carrying Amount Fair Value
PARENT 2007 2006 2007 2006
Financial assets $’000 $’000 $’000 $’000
Cash and cash equivalents 13,544 25,089 13,544 25,089 Trade receivables 3,303 3,952 3,303 3,952 Forward currency contracts - 229 - 229 Intercompany 1,623 451 1,623 451 Other financial assets (non-current)1 583 1,052 6,150 5,901
Financial liabilities
Trade payables 1,752 2,988 1,752 2,988 Interest-bearing loans and borrowings - 500 - 500
Off balance sheet
Contingencies - - 700 700 1. Other financial assets for the parent entity include investment in wholly-owned subsidiaries. The fair value of the underlying net assets of the subsidiaries is higher than the carrying amount in the parent entity accounts. Contingencies The Company and certain controlled entities have potential financial liabilities that may arise from certain contingencies disclosed in Note 22. As explained in that note, no material losses are anticipated in respect of any of those contingencies and the fair value disclosed above is the Directors' estimate of amounts that would be payable by the Company as consideration of the assumption of those contingencies by another party.

I n f o m e d i a L t d A n n u a l R e p o r t
NOTES TO THE FINANCIAL STATEMENTS
52
31. FINANCIAL INSTRUMENTS (CONTINUED) Interest rate risk The following table sets out the carrying amount, by maturity, of the financial instruments exposed to interest rate risk:
CONSOLIDATED PARENT
YEAR ENDED 30 JUNE 2007
Less than one year
$’000
Two to five years
$’000
Greater than five
years $’000
Weighted average effective interest rate %
Less than one year
$’000
Two to five years
$’000
Greater than five
years $’000
Weighted average effective interest rate %
Floating rate
Cash and cash equivalents 15,690 - - 5.7% 13,544 - _ 5.7%
Interest-bearing liabilities - - - - - - - -
YEAR ENDED 30 JUNE 2006 CONSOLIDATED PARENT
Less than one
year
$’000
Two to five years
$’000
Greater than five
years $’000
Weighted average effective interest rate %
Less than one year
$’000
Two to five years
$’000
Greater than five
years $’000
Weighted average effective interest rate %
Floating rate
Cash and cash equivalents 26,021 - - 5.7% 25,089 - - 5.7%
Interest-bearing liabilities (500) - - 6.3% (500) - - 6.3%
Interest on financial instruments classified as floating rate is repriced at intervals of less than one year. Interest on financial instruments classified as fixed rate is fixed until maturity of the instrument. The other financial instruments of the Group and Parent that are not included in the above tables are non-interest bearing and are therefore not subject to interest rate risk. Derivative contracts There were no derivative contracts on hand at 30 June 2007. The following table summarises the forward exchange contracts on hand at 30 June 2006:
CONSOLIDATED PARENT
Maturity Company
buys Company
sells Exchange
rate Company
buys Company
sells Exchange
rate
Company sells United States Dollars (USD) $A’000 USD’000 $A’000 USD’000
Quarter 1 2007 financial year 1,392 1,000 0.7186 1,392 1,000 0.7186
Quarter 2 2007 financial year 2,087 1,500 0.7186 2,087 1,500 0.7186
Quarter 3 2007 financial year - - - - - -
Quarter 4 2007 financial year - - - - - -
Company sells Euros (E) $A’000 E ’000 $A’000 E ’000
Quarter 1 2007 financial year 3,077 1,775 0.5768 3,077 1,775 0.5768
Quarter 2 2007 financial year 3,248 1,875 0.5773 3,248 1,875 0.5773
Quarter 3 2007 financial year 3,248 1,875 0.5773 3,248 1,875 0.5773
Quarter 4 2007 financial year 3,248 1,875 0.5773 3,248 1,875 0.5773
The mark to market valuation of these contracts at 30 June 2006 was $229,000. 32. SUBSEQUENT EVENTS There has been no matter or circumstance that has arisen since the end of the financial year that has significantly affected the operations of the Company, the results of those operations, or the state of affairs of the Company.


Liability limited by a scheme approved under Professional Standards Legislation.
Independent auditor’s report to the members of Infomedia Ltd We have audited the accompanying financial report of Infomedia Ltd (the company) and the consolidated entity, which comprises the balance sheet as at 30 June 2007, and the income statement, statement of changes in equity and cash flow statement for the year ended on that date, a summary of significant accounting policies, other explanatory notes and the Directors’ declaration. The company has disclosed information as required by paragraphs Aus 25.4 to Aus 25.7.2 of Accounting Standard 124 Related Party Disclosures (“remuneration disclosures”), under the heading “Remuneration Report” on pages 7 to 11 of the Directors’ Report, as permitted by Corporations Regulation 2M.6.04. Directors’ Responsibility for the Financial Report The Directors of the company are responsible for the preparation and fair presentation of the financial report in accordance with the Australian Accounting Standards (including the Australian Accounting Interpretations) and the Corporations Act 2001. This responsibility includes establishing and maintaining internal controls relevant to the preparation and fair presentation of the financial report that is free from material misstatement, whether due to fraud or error; selecting and applying appropriate accounting policies; and making accounting estimates that are reasonable in the circumstances. In Note 2, the Directors also state that the financial report, comprising the financial statements and notes complies, with International Financial Reporting Standards. The Directors are also responsible for the remuneration disclosures contained in the Directors’ Report. Auditor’s Responsibility Our responsibility is to express an opinion on the financial report based on our audit. We conducted our audit in accordance with Australian Auditing Standards. These Auditing Standards require that we comply with relevant ethical requirements relating to audit engagements and plan and perform the audit to obtain reasonable assurance whether the financial report is free from material misstatement and that the remuneration disclosures comply with Accounting Standard AASB 124 Related Party Disclosures. An audit involves performing procedures to obtain audit evidence about the amounts and disclosures in the financial report. The procedures selected depend on our judgment, including the assessment of the risks of material misstatement of the financial report, whether due to fraud or error. In making those risk assessments, we consider internal controls relevant to the preparation and fair presentation of the financial report in order to design audit procedures that are appropriate in the circumstances, but not for the purpose of expressing an opinion on the effectiveness of the internal controls. An audit also includes evaluating the appropriateness of accounting policies used and the reasonableness of accounting estimates made by the Directors, as well as evaluating the overall presentation of the financial report. We believe that the audit evidence we have obtained is sufficient and appropriate to provide a basis for our audit opinion. Independence In conducting our audit we have met the independence requirements of the Corporations Act 2001. We have given to the Directors of the company a written Auditor’s Independence Declaration, a copy of which is included after the Directors’ Report. Auditor’s Opinion In our opinion: 1. the financial report of Infomedia Ltd is in accordance with: (a) the Corporations Act 2001, including:
(i) giving a true and fair view of the financial position of Infomedia Ltd and the consolidated entity at 30 June 2007 and of their performance for the year ended on that date; and
(ii) complying with Australian Accounting Standards (including the Australian Accounting Interpretations); and (b) other mandatory financial reporting requirements in Australia. 2. the financial report also complies with International Financial Reporting Standards as disclosed in Note 2.
3. the remuneration disclosures that are contained on pages 7 to 11 of the Directors’ Report comply with Accounting Standard
AASB 124 Related Party Disclosures.
Ernst & Young
Garry Wayling Partner Sydney, 22 August 2007