financial report 2016 - english - european bank for...
TRANSCRIPT

Income statement
EBRD Financial Report 2016 13
These financial statements have been approved for issue by the Board of Directors on 8 March 2017.
Pages 18 to 76 are an integral part of these financial statements.
For the year ended 31 December 2016 Note
Year to 31 December
2016 € million
Year to 31 December
2015 € million
Interest and similar income From Banking loans 1,007 1,127 From fixed-income debt securities and other interest 126 81 Interest expense and similar charges (237) (139) Net interest expense on derivatives (81) (170) Net interest income 3 815 899 Net fee and commission income 4 29 28 Dividend income 97 82 Net gains from share investments at fair value through profit or loss 5 326 197
Net gains/(losses) from loans at fair value through profit or loss 6 9 (44) Net gains from loans at amortised cost 15 3 Net gains from Treasury assets held at amortised cost 7 6 4 Net gains from Treasury activities at fair value through profit or loss and foreign exchange 8 84 114
Fair value movement on non-qualifying and ineffective hedges 9 131 (171) Impairment provisions on Banking loan investments 10 (57) 120 Impairment provisions on guarantees (3) 1 General administrative expenses 11 (445) (401) Depreciation and amortisation 19,20 (22) (30) Net profit for the year from continuing operations 985 802 Transfers of net income approved by the Board of Governors 25 (181) (360) Net profit after transfers of net income approved by the Board of Governors 804 442
Attributable to: Equity holders 804 442

Statement of comprehensive income
14 EBRD Financial Report 2016
Pages 18 to 76 are an integral part of these financial statements.
For the year ended 31 December 2016
Year to 31 December
2016 € million
Year to
31 December 2015
€ million Net profit after transfers of net income approved by the Board of Governors 804 442 Other comprehensive income/(expense) 1. Items that will not be reclassified subsequently to profit or loss
Share investments designated as fair value through other comprehensive expense 12 (7) Actuarial gains/(losses) on defined benefit scheme 20 (6)
2. Items that may be reclassified subsequently to profit or loss Cash flow hedges (2) -
Total comprehensive income 834 429 Attributable to: Equity holders 834 429

Balance sheet
EBRD Financial Report 2016 15
At 31 December 2016 Note € million 31 December 2016
€ million € million 31 December 2015
€ million Assets Placements with and advances to credit institutions 12 14,110 11,724 Debt securities 13
At fair value through profit or loss 926 747 At amortised cost 8,981 11,329
9,907 12,076 Collateralised placements - 13 24,017 23,813
Other financial assets 14 Derivative financial instruments 4,319 4,596 Other financial assets 214 335 4,533 4,931
Loan investments Banking portfolio: Loans at amortised cost 15 22,885 21,817 Less: Provisions for impairment 10 (1,044) (1,083) Loans at fair value through profit or loss 16 313 339
22,154 21,073 Share investments
Banking portfolio: At fair value through profit or loss 17 5,265 5,033 Treasury portfolio: Share investments at fair value through other comprehensive income 18 75 63
5,340 5,096
Intangible assets 19 63 63 Property, technology and office equipment 20 43 50 Total assets 56,150 55,026
Liabilities Borrowings
Amounts owed to credit institutions and other third parties 21 2,478 2,590 Debts evidenced by certificates 22 35,531 34,280
38,009 36,870 Other financial liabilities 23
Derivative financial instruments 2,170 2,993 Other financial liabilities 540 577
2,710 3,570 Total liabilities 40,719 40,440
Members’ equity attributable to equity holders Paid-in capital 24 6,207 6,202 Reserves and retained earnings 25 9,224 8,384 Total members’ equity 15,431 14,586 Total liabilities and members’ equity 56,150 55,026
Memorandum items Undrawn commitments 26 12,075 12,959 Pages 18 to 76 are an integral part of these financial statements.

Statement of changes in equity
16 EBRD Financial Report 2016
For the year ended 31 December 2016
Subscribed capital € million
Callable capital € million
Fair value through other
comprehensive income reserve
€ million
Cash flow reserves € million
Actuarial remeas-urement € million
Retained earnings € million
Total equity
€ million At 31 December 2014 29,674 (23,472) 14 - (8) 7,941 14,149 Total comprehensive income for the year - - (7) - (6) 442 429 Internal tax for the year - - - - - 8 8 At 31 December 2015 29,674 (23,472) 7 - (14) 8,391 14,586 Total comprehensive income for the year - - 12 (2) 20 804 834 Internal tax for the year - - - - - 6 6 Capital subscriptions 29 (24) - - - - 5 At 31 December 2016 29,703 (23,496) 19 (2) 6 9,201 15,431
Refer to note 25 “Reserves and retained earnings” on page 69 for a further explanation of the Bank’s reserves.
Pages 18 to 76 are an integral part of these financial statements.

Statement of cash flows
EBRD Financial Report 2016 17
For the year ended 31 December 2016 € million
Year to 31 December
2016 € million € million
Year to 31 December
2015 € million
Cash flows from operating activities
Cash and cash equivalents are amounts with less than three months to maturity from the date of the transactions, which are available for use at short notice and are subject to insignificant risk of change in value. Within the 31 December 2016 balance is €9 million restricted for technical assistance to be provided to member countries in the SEMED region (2015: €12 million).
Pages 18 to 76 are an integral part of these financial statements.
20 See note 12 on page 60 for total amounts in ‘placements with and advances to credit institutions’.
Net profit for the year 804 442 Adjustments for: Unwinding of the discount relating to impaired identified assets (31) (30) Interest income (1,102) (1,178) Interest expenses and similar charges 318 309 Net deferral of fees and direct costs 113 98 Dividend income (97) (82) Internal tax 7 7 Realised gains on share investments and equity derivatives (21) (250) Unrealised (gains)/losses on share investments and equity derivatives at fair value through profit or loss (305) 53 Unrealised (gains)/losses from loans at fair value through profit or loss (9) 44 Realised gains on Banking loans (15) (3) Realised gains on Treasury investments (6) (4) Fair value movement on hedges (131) 165 Unrealised fair value movement 344 (262) Foreign exchange gains (10) (1) Depreciation and amortisation 21 30 Loss on disposal of property, technology and office equipment 5 2 Gross provisions charge for Banking loan losses and guarantees 60 (121) Movement in net income allocations payable 105 115 50 (666) Interest income received 1,055 1,056 Interest expenses and similar charges paid (444) (276) Dividend income received 99 80 (Increase)/decrease in operating assets: Prepaid expenses 33 25 Proceeds from repayments of Banking loans 9,124 6,818 Funds advanced for Banking loans (9,854) (7,743) Proceeds from sale of Banking share investments and equity derivatives 764 1,361 Funds advanced for Banking share investments (774) (1,082) Net placements to credit institutions (1,500) 86 Net proceeds from settlement of derivatives (32) 1,633 Increase in operating liabilities: Accrued expenses 84 94
Net cash from operating activities (1,395) 1,386 Cash flows used in investing activities
Proceeds from sale of debt securities at amortised cost 12,724 12,721 Purchases of debt securities at amortised cost (10,341) (12,622) Proceeds from sale of debt securities held at fair value through profit or loss 901 1,334 Purchases of debt securities held at fair value through profit or loss (1,065) (1,026) Purchases of intangible assets, property, technology and office equipment (43) (61)
Net cash from investing activities 2,176 346 Cash flows from financing activities
Capital received 5 - Issue of debts evidenced by certificates 15,526 15,454 Redemption of debts evidenced by certificates (15,328) (16,088)
Net cash used in financing activities 203 (634) Net increase in cash and cash equivalents 984 1,098 Cash and cash equivalents at beginning of the year 7,533 6,435 Cash and cash equivalents at 31 December20 8,517 7,533

Accounting Policies
18 EBRD Financial Report 2016
The principal accounting policies applied in the preparation of these financial statements are set out below. These policies have been consistently applied to all the years presented, unless otherwise stated.
A. Basis of preparation These financial statements have been prepared in accordance with International Financial Reporting Standards (IFRS) as issued by the International Accounting Standards Board (IASB). The financial statements have been prepared under the historical cost convention, as modified by the revaluation of financial assets at fair value through other comprehensive income, financial assets and financial liabilities held at fair value through profit or loss and all derivative contracts. In addition, financial assets and liabilities subject to amortised cost measurement which form part of a qualifying hedge relationship have been accounted for in accordance with hedge accounting rules – see “Derivative financial instruments and hedge accounting” on page 21. The financial statements have been prepared on a going concern basis. The going concern assessment was made by the Bank’s Board of Directors when approving the Bank’s ‘Strategy Implementation Plan 2017 – 2019’ in December 2016, which analysed the Bank’s liquidity position. The assessment was re-confirmed by the President and Senior Vice President, Chief Financial Officer and Chief Operating Officer on 8 March 2017, the date on which they signed the financial statements.
The preparation of financial statements in conformity with IFRS requires the use of certain critical accounting estimates. It also requires management to exercise its judgement in the process of applying the Bank’s policies. The areas involving a higher degree of judgement or complexity, or areas where judgements and estimates are significant to the financial statements, are disclosed in “Critical accounting estimates and judgements” on page 24.
New and amended IFRS mandatorily effective for the current reporting period There are a number of amendments to standards effective for the current reporting period which have no or negligible impact on the Bank’s financial statements, namely:
• IFRS 11: Joint Arrangements
• IAS 1: Presentation of Financial Statements
• IAS 16: Property, Plant and Equipment
• IAS 38: Intangible Assets
IFRS not yet mandatorily effective but adopted early IFRS 9: ‘Financial Instruments’ is the IASB’s replacement project for IAS 39. The Standard has developed in phases and was completed in July 2014 with a mandatory application date for annual reporting periods beginning on or after 1 January 2018. The Bank adopted the first phase ‘recognition and measurement of financial assets’ (November 2009) in its 2010 financial statements.
See the accounting policy for financial assets on page 20 for more details.

EBRD Financial Report 2016 19
IFRS not yet mandatorily effective and not adopted early The following standards are not yet effective and have not been adopted early.
Pronouncement Nature of change Potential impact Amendments to: IFRS 2: Share-based Payment
Accounting for a modification of a share-based payment transaction that changes its classification from cash-settled to equity-settled. Effective for annual reporting periods beginning on or after 1 January 2018.
The Bank considers that this standard is not applicable to its operations.
Amendments to: IFRS 4: Insurance Contracts
Provides guidance for insurers in applying IFRS 9: Financial Instruments with IFRS 4: Insurance Contracts. Effective for annual reporting periods beginning on or after 1 January 2018.
The Bank considers that this standard is not applicable to its operations.
IFRS 9: Financial Instruments Classification and measurement of financial liabilities (October 2010). Hedge accounting (November 2013). Impairment methodology and introduction of a ‘fair value through other comprehensive income’ measurement category for financial assets represented by simple debt instruments (July 2014). IFRS 9 to be adopted in its entirety for annual reporting periods beginning on or after 1 January 2018.
The Bank has commenced its implementation programme for the hedge accounting and impairment sections of IFRS 9. At this stage it does not foresee any material change to its classification and measurement of financial assets and liabilities.
Amendments to: IFRS 10: Consolidated Financial Statements and IAS 28: Investments in Associates and Joint Ventures
Provides guidance for accounting for the loss of control of a subsidiary as a result of a transaction involving an associate or a joint venture that is accounted for using the equity method. Effective for annual reporting periods beginning on or after a date to be determined by the IASB.
The Bank considers that these amendments have no applicability to its existing operations.
IFRS 15: Revenue from Contracts with Customers
Establishes principles for reporting useful information to users of financial statements about the nature, amount, timing and uncertainty of revenue and cash flows arising from an entity’s contracts with customers. Effective for annual reporting periods beginning on or after 1 January 2018.
The Bank has yet to assess the potential impact of adopting this standard.
IFRS 16: Leases Sets out the principles for the recognition, measurement, presentation and disclosure of leases for both parties to a contract, that is, the customer (‘lessee’) and the supplier (‘lessor’). Effective for annual reporting periods beginning on or after 1 January 2019.
The Bank has yet to assess the potential impact of adopting this standard.
Amendments to: IAS 7: Statement of Cash Flows
An entity shall provide disclosures that enable users of financial statements to evaluate changes in liabilities arising from financing activities, including both changes arising from cash flows and non-cash changes. Effective for annual reporting periods beginning on or after 1 January 2017.
This is a disclosure requirement only which the Bank will comply with in 2017.
Amendments to: IAS 12: Income Taxes
Clarifies the requirements on recognition of deferred tax assets for unrealised losses on debt instruments measured at fair value. Effective for annual reporting periods beginning on or after 1 January 2017.
The Bank is exempt from all forms of direct taxes and so this Standard is not applicable.

20 EBRD Financial Report 2016
B. Significant accounting policies
Financial assets – Classification and measurement The Bank early adopted the first instalment of IFRS 9: Financial Instruments, concerning the classification and measurement of financial assets, with effect from 1 January 2010 . Pursuant to that adoption, the Bank classifies its financial assets in the following categories: those measured at amortised cost and those measured at fair value. This classification depends on both the contractual characteristics of the assets and the business model adopted for their management.
Financial assets at amortised cost An investment is classified as ‘amortised cost’ only if both of the following criteria are met: the objective of the Bank’s business model is to hold the asset to collect the contractual cash flows; and the contractual terms give rise on specified dates to cash flows that are solely payments of principal and interest on the principal outstanding, interest being consideration for the time value of money and the credit risk associated with the principal amount outstanding. Investments meeting these criteria are measured initially at fair value plus transaction costs that are directly attributable to the acquisition of the financial assets. They are subsequently measured at amortised cost using the effective interest method less any impairment. Except for debt securities held at amortised cost, which are recognised on trade date, the Bank’s financial assets at amortised cost are recognised at settlement date.
Financial assets at fair value If either of the two criteria above is not met, the debt instrument is classified as ‘fair value through profit or loss’. The presence of an embedded derivative, which could potentially change the cash flows arising on a debt instrument so that they no longer represent solely payments of principal and interest, requires that instrument to be classified at fair value through profit or loss, an example being a convertible loan. Debt instruments classified at fair value through profit or loss are recognised on a settlement date basis if within the Banking loan portfolio and on a trade date basis if within the Treasury portfolio. The Bank’s share investments – equity investments held within its Banking portfolio – are measured at fair value through profit or loss, including associate investments. The Bank considers the latter to be venture capital investments for which IAS 28: Investments in Associates and Joint Ventures does not require the equity method of accounting. When an instrument that is required to be measured at fair value through profit or loss has characteristics of both a debt and equity instrument, the Bank determines its classification as a debt or an equity instrument on the basis of the legal rights and obligations attaching to the instrument in accordance with IFRS. The basis of fair value for listed share investments in an active market is the quoted bid market price on the balance sheet date. The basis of fair value for share investments that are either unlisted or listed in an inactive market is determined using valuation techniques appropriate to the market and industry of each investment. The primary valuation techniques used are net asset value and earnings-based valuations to which a multiple is applied based on information from comparable companies and discounted cash flows. Techniques used to support these valuations include industry valuation benchmarks and recent transaction prices.
The Bank’s share investments are recognised on a trade date basis. At initial recognition, the Bank measures these assets at their fair value. Transaction costs of financial assets carried at fair value through profit or loss are expensed in the income statement. Such assets are carried at fair value on the balance sheet with changes in fair value included in the income statement in the period in which they occur. The Bank also accounts for a small number of strategic equity investments21 at fair value through other comprehensive income with no recycling of such fair value gains or losses through the income statement.
Derecognition of financial assets The Bank derecognises a financial asset, or a portion of a financial asset, where the contractual rights to that asset have expired or where the rights to further cash flows from the asset have been transferred to a third party and, with them, either:
(i) substantially all the risks and rewards of the asset; or (ii) significant risks and rewards, along with the unconditional ability to sell or pledge the asset.
21 See note 18 to the financial statements on page 62.

EBRD Financial Report 2016 21
Where significant risks and rewards have been transferred, but the transferee does not have the unconditional ability to sell or pledge the asset, the Bank continues to account for the asset to the extent of its continuing involvement. Where neither derecognition nor continuing involvement accounting is appropriate, the Bank continues to recognise the asset in its entirety and recognises any consideration received as a financial liability.
Financial liabilities The Bank has not adopted early that part of IFRS 9 which relates to financial liabilities and therefore still applies IAS 39: Financial Instruments. With the exception of derivative instruments that must be measured at fair value, the Bank does not designate any financial liabilities at fair value through profit or loss. All are measured at amortised cost, unless they qualify for hedge accounting in which case the amortised cost is adjusted for the fair value attributable to the risks being hedged. Liabilities deriving from issued securities are recognised on a trade date basis with other liabilities on a settlement date basis. Interest expense is accrued using the effective interest rate method and is recognised within the ‘interest expense and similar charges’ line of the income statement, except for the allocated cost funding Treasury’s trading assets which is recognised within ‘net gains from Treasury activities at fair value through profit or loss’.
Contingent liabilities Contingent liabilities are possible obligations arising from past events, whose existence will be confirmed only by uncertain future events, or present obligations arising from past events that are not recognised because either an outflow of economic benefits is not probable or the amount of the obligation cannot be reliably measured. Contingent liabilities are not recognised but information about them is disclosed unless the possibility of any outflow of economic benefits in settlement is remote.
Derivative financial instruments and hedge accounting The Bank primarily makes use of derivatives for four purposes:
(i) the majority of the Bank’s issued securities, excluding commercial paper, are individually paired with a swap to convert the issuance proceeds into the currency and interest rate structure sought by the Bank;
(ii) to manage the net interest rate risks and foreign exchange risks arising from all of its financial assets and liabilities; (iii) to provide potential exit strategies for its unlisted equity investments through negotiated put options; (iv) through currency swaps, to manage funding requirements for the Bank’s loan portfolio.
All derivatives are measured at fair value through the income statement unless they form part of a qualifying cash flow hedge, in which case the fair value is taken to reserves and released into the income statement at the same time as the risks on the hedged instrument are recognised therein. Any hedge ineffectiveness will result in the relevant proportion of the fair value remaining in the income statement. Fair values are derived primarily from discounted cash flow models, option pricing models and from third party quotes. Derivatives are carried as assets when their fair values are positive and as liabilities when their fair values are negative. In 2016 the Bank introduced additional valuation measures for its over-the-counter (OTC)22 derivatives portfolio to reflect credit and funding cost adjustments which the Bank reasonably anticipates will be incorporated into the exit price for such instruments. These adjustments, calculated at a portfolio level for each individual counterparty, allow for the following factors:
• the credit valuation adjustment (“CVA”) reflects the impact on the price of a derivative trade of changes in the credit risk associated with the counterparty;
• the debit valuation adjustment (“DVA”) reflects the impact on the price of a derivative trade of changes in the credit risk associated with EBRD, and
• the funding valuation adjustment (“FVA”) reflects the costs and benefits arising when uncollateralised derivative exposures are hedged with collateralised trades.
The valuation adjustment deriving from these factors is detailed within the ‘Risk Management’ section of the report in the table detailing the fair value of the Bank’s derivative positions on page 38.
Hedge accounting The Bank has not adopted early that part of IFRS 9 which relates to hedge accounting and therefore still applies IAS 39: Financial Instruments. Hedge accounting is designed to bring accounting consistency to financial instruments that would not otherwise be permitted. A valid hedge relationship exists when a specific relationship can be identified between two or more financial instruments in which the change in value of one instrument (the hedging instrument) is highly negatively correlated to the change in value of the other (the hedged item). To qualify for hedge accounting this correlation must be within a range of 80 to 125 per cent, with any ineffectiveness within these boundaries recognised within “Fair value movement on non-qualifying and ineffective hedges” in the income statement. The Bank applies hedge accounting treatment to individually identified hedge relationships. Also included within this caption of the income statement are the gains and losses attributable to derivatives that the Bank uses for hedging interest-rate risk on a macro basis, but for which the Bank does not apply hedge accounting.
22 OTC derivatives are those not settled through a central clearing party.

22 EBRD Financial Report 2016
The Bank documents the relationship between hedging instruments and hedged items upon initial recognition of the transaction. The Bank also documents its assessment, on an ongoing basis, of whether the derivatives that are used in hedging transactions are highly effective in offsetting changes in fair values or cash flows of hedged items.
Fair value hedges The Bank’s hedging activities are primarily designed to mitigate interest rate risk by using swaps to convert the interest rate risk profile, on both assets and liabilities, into floating rate risk. Such hedges are known as “fair value” hedges. Changes in the fair value of the derivatives that are designated and qualify as fair value hedges, and that prove to be highly effective in relation to hedged risk, are included in the income statement, along with the corresponding change in fair value of the hedged asset or liability that is attributable to that specific hedged risk. In the case of a fair value hedge of a financial liability, where the hedge ceases to qualify for hedge accounting and the financial liability contains an embedded derivative which is of a different economic character to the host instrument, that embedded derivative is bifurcated and measured at fair value through the income statement. This is not required of hedged financial assets as IFRS 9 does not require bifurcation of embedded derivatives in the case of financial assets.
Cash flow hedges The Bank has engaged in cash flow hedges, principally to minimise the exchange rate risk associated with the fact that its administrative expenses are incurred in the pound sterling. The amount and timing of such hedges fluctuates in line with the Bank’s view on opportune moments to execute the hedges. In December 2016 the Bank purchased in the forward foreign exchange market approximately fifty per cent of the pound sterling figure for the 2017 budget. The movement in the fair value of these hedges will be recognised directly in reserves until such time as the relevant expenditure is incurred, when the hedge gains or losses will be reflected as part of the euro-equivalent expenses for the year. For further information on risk and related management policies see the Risk Management section of the report.
Financial guarantees Issued financial guarantees are initially recognised at their fair value, and subsequently measured at the higher of the unamortised balance of the related fees received and deferred, and the expenditure required to settle the commitment at the balance sheet date. The latter is recognised when it is both probable that the guarantee will need to be settled and that the settlement amount can be reliably estimated. Financial guarantees are recognised within other financial assets and other financial liabilities.
Impairment of financial assets Financial assets at amortised cost The Bank has not adopted early that part of IFRS 9 which relates to impairment and therefore still applies IAS 39: Financial Instruments. Where there is objective evidence that an identified loan asset is impaired, specific provisions for impairment are recognised in the income statement. Impairment is quantified as the difference between the carrying amount of the asset and the net present value of expected future cash flows discounted at the asset’s original effective interest rate where applicable. The carrying amount of the asset is reduced through the use of an allowance account and the amount of the loss is recognised in the income statement. The carrying amount of the asset is reduced directly only upon write-off. Resulting adjustments include the unwinding of the discount in the income statement over the life of the asset, and any adjustments required in respect of a reassessment of the initial impairment. The criteria that the Bank uses to determine that there is objective evidence of an impairment loss include:
• delinquency in contractual payments of principal or interest • cash flow difficulties experienced by the borrower • breach of loan covenants or conditions • initiation of bankruptcy proceedings • deterioration in the borrower’s competitive position • deterioration in the value of collateral.
Provisions for impairment of classes of similar assets that are not individually identified as impaired are calculated on a portfolio basis (the general provision). The methodology used for assessing such impairment is based on a risk-rated approach, with the methodology applied for all sovereign risk assets taking into account the Bank’s preferred creditor status afforded by its members. The Bank’s methodology calculates impairment on an incurred loss basis.23 Impairment is deducted from the asset categories on the balance sheet.
The Bank additionally makes transfers within its reserves to maintain a separate loan loss reserve to supplement the cumulative amount provisioned through the Bank’s income statement on an incurred loss basis. Impairment, less any amounts reversed during the year, is charged to the income statement. When a loan is deemed uncollectible the principal is written off against the related impairment provision. Such loans are written off only after all necessary procedures have been completed and the amount of the loss has been determined. Recoveries are credited to the income statement if previously written off.
23 See ‘Loss emergence period’ on page 26 under ‘Critical accounting estimates and judgements’.

EBRD Financial Report 2016 23
Loans and advances are generally renegotiated in response to an adverse change in the circumstances of the borrower. Depending upon the degree to which the original loan is amended, it may continue to be recognised or will be derecognised and replaced with a new loan. To the extent the original loan is retained, it will continue to be shown as overdue if appropriate and individually impaired where the renegotiated payments of interest and principal will not recover the original carrying amount of the asset.
Statement of cash flows The statement of cash flows is prepared using the indirect method. Cash and cash equivalents comprise balances with less than three months maturity from the date of the transaction, which are available for use at short notice and that are subject to insignificant risk of changes in value.
Foreign currencies The Bank’s reporting currency for the presentation of its financial statements is the euro. Foreign currency transactions are initially translated into euro using the exchange rates prevailing at the dates of the transactions. Foreign exchange gains and losses resulting from the settlement of such transactions, and from the translation at the year-end exchange rate of monetary assets and liabilities denominated in foreign currencies, are included in the income statement, except when deferred in reserves as qualifying cash flow hedges.
Capital subscriptions The Bank’s share capital is denominated in euro and is divided into paid-in and callable shares. Paid-in shares are recognised on the balance sheet as members’ equity. Callable shares will not be recorded on the balance sheet unless the Bank exercises its right to call the shares.
Intangible assets Costs associated with maintaining computer software programmes are recognised as an expense as incurred. Costs that are directly associated with identifiable and unique software products controlled by the Bank, and that will generate economic benefits exceeding costs beyond one year, are recognised as intangible assets. Direct costs include the staff costs of the software development team and an appropriate portion of relevant overheads. Expenditure that enhances or extends the performance of computer software programmes beyond their original specifications is recognised as a capital improvement and is added to the original cost of the software. Computer software development costs recognised as intangible assets are amortised using the straight-line method over an estimated life of three years.
Property, technology and office equipment Property, technology and office equipment is stated at cost less accumulated depreciation. Depreciation is calculated on the straight-line method to write off the cost of each asset to its residual value over the estimated life as follows: Freehold property 30 years Improvements on leases of less than 50 years unexpired Unexpired periods Technology and office equipment Between five and ten years
Update in accounting estimate During the year a review of the useful lives of the technology and office equipment assets was conducted. This review resulted in an increase in the estimated useful lives of a number of assets. The impact of this change in estimated useful lives has been a €7.2 million reduction to the 2016 depreciation expense. The effect on future periods is not disclosed due to the impracticality of estimating future asset balances.
Accounting for leases Leases of assets under which all the risks and benefits of ownership are effectively retained by the lessor are classified as operating leases. The Bank has entered into such leases for most of its office accommodation, both in its UK headquarters and its resident offices in other countries in which it has a presence. Payments made under operating leases are charged to the income statement on a straight-line basis over the period of the lease. When an operating lease is terminated before the lease period has expired, any payment required to be made to the lessor by way of penalty is recognised as an expense in the period in which the termination takes place.

24 EBRD Financial Report 2016
Interest, fees, commissions and dividends Interest income and expense is recognised on an accruals basis using the effective interest rate method. This method requires that, in addition to the contractual interest rate attaching to a financial instrument, those fees and direct costs associated with originating and maintaining the instrument are also recognised as interest income or expense over the life of the instrument. The amortisation of such fees and costs is recognised in the same line of interest income or expense as the instruments to which they relate. Further details are provided below.
• Banking loans: this represents interest income on banking loans. Interest is recognised on impaired loans through unwinding the discount used in deriving the present value of expected future cash flows.
• Fixed-income debt securities and other: this represents interest income on Treasury investments with the exception of those measured at fair value where the interest is recognised in ‘net gains from Treasury activities at fair value through profit or loss’. Where hedge accounting is applied to an underlying investment – typically using a swap to convert fixed-rate interest into floating – the net interest of the swap is included within this interest income line.
• Interest expense and similar charges: this represents interest expense on all borrowed funds. The majority of the Bank’s borrowings are undertaken through the issuance of bonds that are almost always paired with a one-to-one swap to convert the proceeds into the currency and floating rate profile sought by the Bank. Hedge accounting is applied to such relationships and the net interest of the associated swap is included within interest expense.
• Net interest income/(expense) on derivatives: in addition to swaps where the interest is associated with specific investments or borrowings, the Bank also employs a range of derivatives to manage the risk deriving from interest rate mismatches between the asset and liability side of the balance sheet. The net interest associated with these derivatives is presented separately as it is not identifiable to individual assets or liabilities presented elsewhere within ‘net interest income’. This lack of specific “matching” also means that hedge accounting is not applied in respect of the risks hedged by these derivatives.
Fees received in respect of services provided over a period of time are recognised as income as the services are provided. Other fees and commissions are classed as income when received. Issuance fees and redemption premiums or discounts are amortised over the period to maturity of the related borrowings on an effective yield basis. Dividends relating to share investments are recognised in accordance with IAS 18 when the Bank’s right to receive payments has been established, and when it is probable that the economic benefits will flow to the Bank and the amount can be reliably measured.
Staff retirement schemes The Bank has a defined contribution scheme and a defined benefit scheme to provide retirement benefits to its staff. The Bank keeps all contributions to the schemes, and all other assets and income held for the purposes of the schemes, separately from all of its other assets. Under the defined contribution scheme, the Bank and staff contribute to provide a lump sum benefit, such contributions being charged to the income statement and transferred to the scheme’s independent custodians.
The defined benefit scheme is funded entirely by the Bank and benefits are based on years of service and a percentage of final gross base salary as defined in the scheme. Independent actuaries calculate the defined benefit obligation at least every three years by using the projected unit credit method. The present value of the defined benefit obligation is determined by discounting the estimated future cash outflows (relating to service accrued to the balance sheet date) using the yields available on high-quality corporate bonds. For intermediate years, the defined benefit obligation is estimated using approximate actuarial roll-forward techniques that allow for additional benefit accrual, actual cash flows and changes in the underlying actuarial assumptions. The Bank’s contributions to the defined benefit scheme are determined by the Retirement Plan Committee, with advice from the Bank’s actuaries, and the contributions are transferred to the scheme’s independent custodians. The defined benefit cost charged to the income statement represents the service cost and the net interest income/(cost) on the plan’s net asset or liability. Remeasurements due to actuarial assumptions, including the difference between expected and actual net interest, are recognised in ‘other comprehensive income’. The net defined benefit or liability recognised on the balance sheet is equal to the actual surplus or deficit of the defined benefit plan.
Taxation In accordance with Article 53 of the Agreement, within the scope of its official activities, the Bank, its assets, property and income are exempt from all direct taxes. Taxes and duties levied on goods or services are likewise exempted or reimbursable except for those parts of taxes or duties that represent charges for public utility services.
C. Critical accounting estimates and judgements Preparing financial statements in conformity with IFRS requires the Bank to make estimates and judgements that affect the reported amounts of assets and liabilities at the date of the financial statements and the reported amounts included in the income statement during the reporting period. Estimates and judgements are continually evaluated and are based on historical experience and other factors, including expectations of future events that are believed to be reasonable under the circumstances. These estimates are highly dependent on a number of variables that reflect the economic environment and financial markets of the countries in which the Bank invests, but which are not directly correlated to market risks such as interest rate and foreign exchange risk. The Bank’s critical accounting estimates and judgements are outlined below.

EBRD Financial Report 2016 25
Fair value of derivative financial instruments The fair values of the Bank’s derivative financial instruments are determined by using discounted cash flow models. These cash flow models are based on underlying market prices for currencies, interest rates and option volatilities. Where market data is not available for all elements of a derivative’s valuation, extrapolation and interpolation of existing data has been used. Where unobservable inputs have been used, a sensitivity analysis has been included under “fair value hierarchy” within the Risk Management section of the report.
Fair value of Banking loans at fair value through profit or loss The fair values of the Bank’s loans at fair value through profit or loss are determined by using a combination of discounted cash flow models and options pricing models. These models incorporate market data pertaining to interest rates, a borrower’s credit spreads, underlying equity prices and dividend cash flows. Where relevant market data is not available extrapolation and interpolation of existing data has been used. Where unobservable inputs have been used, a sensitivity analysis has been included under “fair value hierarchy” within the Risk Management section of the report.
Fair value of share investments The Bank’s method for determining the fair value of share investments is described under “Financial assets” in the Accounting Policies section of the report and an analysis of the share investment portfolio is provided in note 17 on page 62. In relation to the Bank’s share investments where the valuations are not based on observable market inputs, additional sensitivity information has been included under “fair value hierarchy” in the Risk Management section of the report on page 54.
Provisions for the impairment of loan investments The Bank’s method for determining the level of impairment of loan investments is described within the Accounting Policies section of the report and further explained under credit risk within the Risk Management section of the report. Portfolio provisions for the unidentified impairment of non-sovereign loan investments at 31 December 2016 were €250 million (2015: €252 million). During 2016 the Bank carried out its regular annual review of the loss parameters underpinning estimates of unidentified impairment, with the aim of better reflecting the Bank’s loss experience. This review resulted in a modest reduction in the level of portfolio provisions. The key revision to these estimates was:
Probability of default24 • In determining the probabilities of default for each risk rating, the historical datasets used to calibrate the rates were
updated to include 2015. This was carried out for both the internal and external data used to determine the final probability of default rates.
If this change to loss parameter estimates had been applied at 31 December 2015, the portfolio provisions for the unidentified impairment of non-sovereign loan investments would have reduced by €16 million from €252 million to €236 million. The total reduction, as a result of this change, in portfolio provisions (including sovereign loan investments) at 31 December 2015 would have been €18 million. No estimate of the effect these changes may have on future periods has been undertaken on the grounds of impracticability. In addition, the sensitivity of portfolio provisions at 31 December 2016 to the key variables used in determining the level of impairment is provided below.
Risk ratings • If all non-sovereign loan investments were upgraded by three ‘notches’ or detailed ratings on the Bank’s probability of default
rating scale, this would result in a reduction of €206 million (2015: €208 million) in portfolio provisions on non-sovereign loans.
• Conversely, if all non-sovereign loan investments were downgraded by three ‘notches’ or detailed ratings on the Bank’s probability of default rating scale this would result in a charge to the income statement of €403 million (2015: €447 million) in relation to portfolio provisions for non-sovereign loans.
Probability of default rates • In determining the probabilities of default for each risk rating, the relative weighting applied to external data and the Bank’s
own experience is reviewed annually. The 2016 general provisioning methodology applies a 67 per cent weighting to the Bank’s own experience and a 33 per cent weighting to external data. A +/- 10 percentage points change in the weighting assigned to the Bank’s own experience would lead to a change in portfolio provisions of -/+ €25 million (2015: €24 million).
24 See table showing probability of default ratings used by the Bank in the credit risk section under ‘Risk Management’ on page 29.

26 EBRD Financial Report 2016
Loss emergence period • Provisions for unidentified impairment are made to reflect losses arising from events existing but not identified at the
balance sheet date and which will emerge within a 12-month period from that date. If the loss emergence period was reduced to three months it is broadly estimated that this would result in a decrease in portfolio provisions charged to the income statement of approximately €186 million (2015: €186 million).
Loss given default rates • A change in loss given default rates of 10 percentage points would lead to a change in portfolio provisions of +/- €56 million
(2015: €55 million).
Sovereign ratings • Portfolio provisions for the unidentified impairment of sovereign loan investments at 31 December 2016 amounted to
€29 million (2015: €32 million). If all sovereign loans were downgraded by three ‘notches’ or detailed ratings on the Bank’s probability of default rating scale this would result in a total charge to income statement of €58 million (2015: €63 million). Similarly, if the portfolio was upgraded by three ‘notches’ this would result in a release to the income statement of €24 million (2015: €27 million).
With respect to specific provisions, an increase or decrease of 10 percentage points on the current provision cover level would have an impact of +/- €121 million (2015: €125 million).

Risk management
EBRD Financial Report 2016 27
Financial risks
Risk governance The Bank’s overall framework for identifying and managing risks is underpinned by independent second line of defence25 control functions, including the Risk Management department, Office of the Chief Compliance Officer, Environmental and Social Department, Finance Department, Evaluations Department and other relevant units. An Internal Audit Department acts as third line of defence and independently assesses the effectiveness of the processes within the first and second lines of defence. The Vice President, Risk and Compliance, Chief Risk Officer (CRO) is responsible for ensuring the independent risk management of the Banking and Treasury exposures, including adequate processes and governance structure for independent identification, measurement, monitoring and mitigation of risks incurred by the Bank. The challenge of the control functions, review of their status and assessment of their ability to perform duties independently falls within the remit of the Audit Committee of the Board. Matters related to Bank-wide risk and associated policies and procedures are considered by the Risk Committee. The Risk Committee is accountable to the President. It oversees all aspects of the Banking and Treasury portfolios across all sectors and countries, and provides advice on Risk Management policies, measures and controls. It also approves proposals for new products submitted by Banking or Treasury. The membership comprises senior managers across the Bank including representatives from Risk Management, Finance, Banking and the Office of the General Counsel. The Risk Committee is chaired by the VP Risk and Compliance, CRO. The Managing Director, Risk Management reports to the VP Risk and Compliance, CRO and leads the overall management of the department. Risk Management provides an independent assessment of risks associated with individual investments undertaken by the Bank, and performs an ongoing review of the portfolio to monitor credit, market and liquidity risks and to identify appropriate risk management actions. It also assesses and proposes ways to manage risks arising from correlations and concentrations within the portfolio, and ensures that adequate systems and controls are put in place for identifying and managing operational risks across the Bank. It develops and maintains the Risk Management policies to facilitate Banking and Treasury operations and promotes risk awareness across the Bank. In exercising its responsibilities, Risk Management is guided by its mission to:
• Provide assurance to stakeholders that risk decision-making in the Bank is balanced and within agreed appetite, and that control processes are rigorously designed and applied; and
• Support the Bank’s business strategy including the maximisation of transition impact through provision of efficient and effective delivery of risk management advice, challenge and decision-making.
Risks in 2017 Below is a summary of current top and emerging risks identified by the Bank. These are risks that, if they were to crystallise, have the potential to negatively affect the Bank’s ability to carry out its mandate and/or which would cause a material deterioration in its portfolio. These risks therefore provide a background to understanding the changes in the Bank’s risk profile and exposures and are closely monitored by management.
• Political and economic environment in Turkey (the Bank’s largest country of operations). Weakening of the business environment, reduced investor confidence and vulnerability to US interest rates are likely to negatively impact the volatility of capital flows, foreign exchange rates, and debt availability.
• Elevated uncertainties about political and economic outlook for the eurozone following the UK referendum to exit the EU. • Global dynamics following the US presidential election, with the likely shifts in the US approach towards international trade and
the global environmental agreements, and its impact on the rest of the world trade and on multilateral cooperation. • Radicalisation and threat of terrorist activity in Middle East and beyond, undermining investment climate and intensifying the
refugee crisis across borders. • The continued weakness in the oil price and in other export commodity prices often leading to currency devaluations,
exacerbating budget problems and affecting creditworthiness of companies exposed to foreign currency risk in commodity producing countries.
In carrying out its mission, the Bank is exposed to financial risks through both its Banking and Treasury activities. These are principally credit, market, operational and liquidity risks.
25 With the Banking Vice-Presidency being the first line of defence in identifying and managing risks related to Banking debt and equity operations and Treasury
department being the first line of defence in identifying and managing risks related to Treasury exposure.
28 EBRD Financial Report 2016
A. Credit risk Credit risk is the potential loss to a portfolio that could result from either the default of a counterparty or the deterioration of its creditworthiness. The Bank also monitors concentration risk, which arises when too high a proportion of the Bank’s exposure is to a single obligor and/or has the potential to simultaneously deteriorate due to correlation to an event. Exposures to obligors in the same country or sector are examples but such concentrations could also include clusters or subsets of country or sector portfolios. The Bank is exposed to credit risk in both its Banking and Treasury activities, as Banking and Treasury counterparties could default on their contractual obligations, or the value of the Bank’s investments could become impaired. The Bank’s maximum exposure to credit risk from financial instruments is represented on the balance sheet, inclusive of the undrawn commitments related to loans and guarantees (see note 26 on page 71). Details of collateral and other forms of risk reduction are provided within the respective sections on Banking and Treasury below.
Credit risk in the Banking portfolio: Management Individual projects The Board of Directors approves a document that defines the principles underlying the credit process for the approval, management and review of Banking exposures. The Audit Committee periodically reviews these principles and its review is submitted to the Board for approval. The Operations Committee reviews all Banking projects prior to their submission for Board approval. The Committee is chaired by the First Vice President and Head of Client Services Group and its membership comprises senior managers of the Bank, including the VP Risk & Compliance, CRO and the Managing Director, Risk Management. A number of frameworks for smaller projects are considered by the Small Business Investment Committee or by senior management under a delegated authority framework supervised by the Operations Committee. The project approval process is designed to ensure compliance with the Bank’s criteria for sound banking, transition impact and additionality. It operates within the authority delegated by the Board, via the President, to approve projects within Board-approved framework operations. The Operations Committee is also responsible for approving significant changes to existing operations.
The Equity Committee acts as the governance committee for the equity portfolio and reports to the Operations Committee. Risk Management is represented at both the Equity Committee and the Small Business Investment Committee. Risk Management conducts reviews of all exposures within the Banking portfolio. At each review, Risk Management assesses whether there has been any change in the risk profile of the exposure, recommends actions to mitigate risk and reconfirms or adjusts the risk rating. It also reviews the fair value of equity investments.
Portfolio level review Risk Management reports on the development of the portfolio as a whole on a quarterly basis to senior management and the Audit Committee of the Board. The report includes a summary of key factors affecting the portfolio and provides analysis and commentary on trends within the portfolio and various sub-portfolios. It also includes reporting on compliance with all portfolio risk limits including an explanation of any limit breaches.
To identify emerging risk and enable appropriate risk mitigating actions Risk Management also conducts regular Bank-wide (top-down) and regional (bottom-up) stress testing exercises and comprehensive reviews of its investment portfolios. The Bank recognises that any resulting risk mitigation is constrained by the limited geographical space within which the Bank operates.
EBRD internal ratings Probability of default (PD) The Bank assigns its internal risk ratings to all counterparties, including borrowers, investee companies, guarantors, put counterparties and sovereigns in the Banking and Treasury portfolios. Risk ratings reflect the financial strength of the counterparty as well as consideration of any implicit support, for example from a major shareholder. The sovereign rating takes into consideration the ratings assigned by external rating agencies. For sovereign risk projects, the overall rating is the same as the sovereign rating. For non-sovereign operations, probability of default ratings are normally capped by the sovereign rating, except where the Bank has recourse to a guarantor from outside the country which may have a better rating than the local sovereign rating.

EBRD Financial Report 2016 29
The table below shows the Bank’s internal probability of default rating scale from 1.0 (lowest risk) to 8.0 (highest risk) and how this maps to the external ratings of Standard & Poor’s (S&P). References to risk rating through this text relate to probability of default ratings unless otherwise specified.
EBRD risk rating category EBRD risk rating External rating equivalent Category name Broader category
1 1.0 AAA Excellent
Investment grade
2 1.7 2.0
2.3/2.5
AA+ AA AA-
Very strong
3 2.7 3.0 3.3
A+ A A-
Strong
4 3.7 4.0 4.3
BBB+ BBB BBB-
Good
5 4.7 5.0 5.3
BB+ BB BB-
Fair
Risk class 5
6 5.7 6.0 6.3
B+ B B-
Weak
Risk class 6
7 6.7 7.0 7.3
CCC+ CCC
CCC-/CC/C Special attention
Classified 8 8.0 D Non-performing
Loss given default (LGD) The Bank assigns loss given default percentages on a scale of 0 to 100 determined by the seniority of the instrument in which the Bank invested.
Non-performing loans (NPL) NPL definition An asset is designated as non-performing when either the borrower is more than 90 days past due on payment to any material creditor, or when Risk Management considers that the counterparty is unlikely to pay its credit obligations in full without recourse by the Bank to actions such as realising security, if held.
Provisioning methodology A specific provision is raised on all NPL accounted for at amortised cost. The provision represents the amount of anticipated loss, being the difference between the outstanding amount from the client and the expected recovery amount. The expected recovery amount is equal to the present value of the estimated future cash flows discounted at the loan’s original effective interest rate.
General portfolio provisions In the performing portfolio, provisions are held against losses incurred but not identified at the balance sheet date. These amounts are based on the PD rates associated with the rating assigned to each counterparty, the LGD parameters reflecting product seniority and the Exposure at Default (EAD). EAD is calculated based on outstanding operating assets and the expected disbursement of committed but not yet drawn amounts.
Credit risk in the Banking portfolio: 2016 Total Banking loan exposure (operating assets including fair value adjustments but before provisions) increased during the year from €22.2 billion at 31 December 2015 to €23.2 billion at 31 December 2016. The total signed Banking loan portfolio and guarantees increased from €33.4 billion at 31 December 2015 to €33.8 billion at 31 December 2016.

30 EBRD Financial Report 2016
The average credit profile of the portfolio remained unchanged in 2016 as the weighted average probability of default (WAPD) rating improved slightly to 5.80 (2015: 5.81). Classified assets (those risk-rated 6.7 to 8.0) increased from 26.1 to 26.9 per cent and the absolute level now stands at €9.2 billion (2015: €8.8 billion). This performance largely reflected a deterioration in the economic and political environment since the end of 2014 in the countries where the Bank invests, most notably in Turkey, Ukraine and Russia.
Credit risk in the Banking portfolio 2016
NPL26 still remain low relative to the average portfolio risk rating, amounting to €1.3 billion or 5.5 per cent of operating assets at year-end 2016 (2015: €1.3 billion or 5.9 per cent). Distressed restructured loans27 were also relatively low, at €626 million or 2.7 per cent of operating assets at year-end 2016 (2015: €516 million or 2.3 per cent). Net write-offs amounted to €79 million in 2016 (2015: €60 million). Write-offs are typically relatively low as the Bank benefits from its strong liquidity and capitalisation to work out distressed loans.
Specific provisions remained broadly at the same level in 2016. This reflects the macro-financial environment in the countries in which the Bank invests, particularly in Turkey, Ukraine and Russia, which in turn affected the quality of the Bank’s portfolio.
26 NPL include impaired loans at amortised cost of €1.2 billion (2015: €1.2 billion) and loans at fair value through profit or loss with an original cost of €75 million
(2015: €69 million). 27 Defined as a loan in which any of the key terms and conditions have been amended due to the financial stress of the borrower, and without such amendment(s)
would likely have become an impaired loan. 28 Includes loans at fair value that have no associated specific provisions.
0%
10%
20%
30%
40%
50%
Dec-12 Dec 13 Dec-14 Dec-15 Dec-16
Perc
enta
ge o
f deb
t po
rtfo
lio
Investment Grade Risk Class 5 Risk Class 6 Classified
Movement in NPL28 2016
€ million 2015
€ million Opening balance 1,316 1,183 Repayments (228) (216) Write-offs (79) (60) New impaired assets 269 330 Other movements 14 79 Closing balance 1,292 1,316
EBRD Financial Report 2016 31
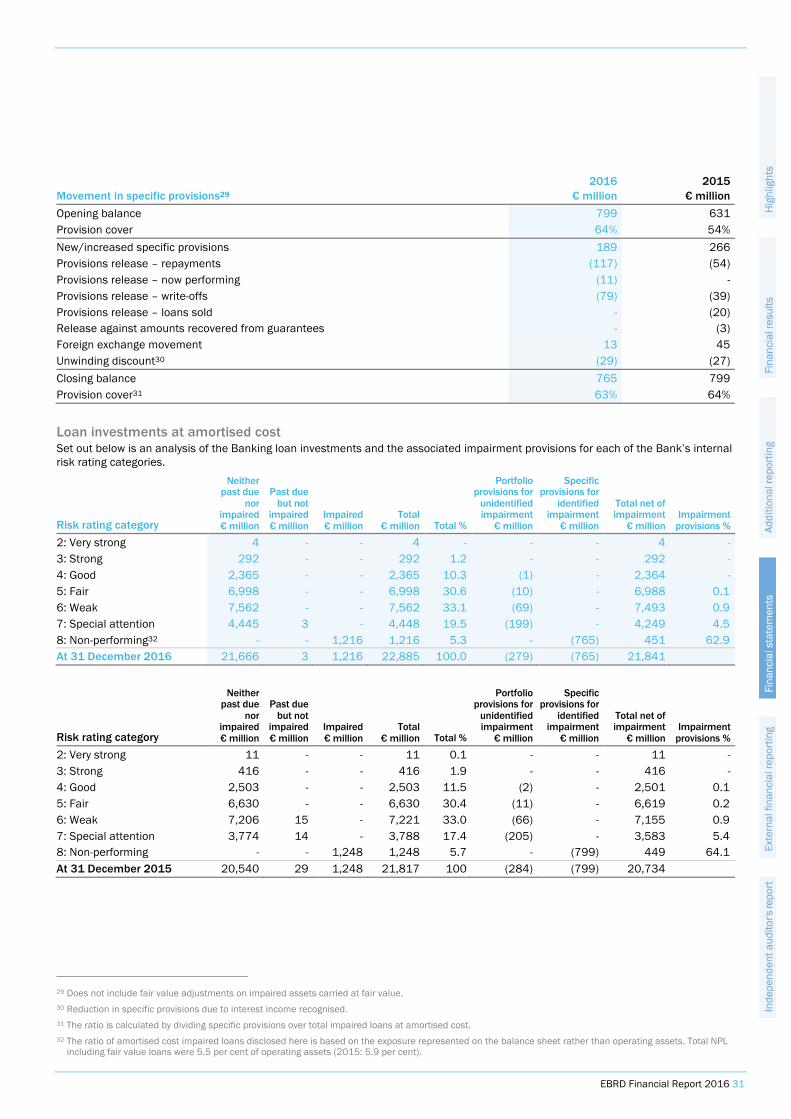
Loan investments at amortised cost Set out below is an analysis of the Banking loan investments and the associated impairment provisions for each of the Bank’s internal risk rating categories.
Risk rating category
Neither past due
nor impaired € million
Past due but not
impaired € million
Impaired € million
Total € million Total %
Portfolio provisions for
unidentified impairment € million
Specific provisions for
identified impairment € million
Total net of impairment € million
Impairment provisions %
2: Very strong 4 - - 4 - - - 4 - 3: Strong 292 - - 292 1.2 - - 292 - 4: Good 2,365 - - 2,365 10.3 (1) - 2,364 - 5: Fair 6,998 - - 6,998 30.6 (10) - 6,988 0.1 6: Weak 7,562 - - 7,562 33.1 (69) - 7,493 0.9 7: Special attention 4,445 3 - 4,448 19.5 (199) - 4,249 4.5 8: Non-performing32 - - 1,216 1,216 5.3 - (765) 451 62.9 At 31 December 2016 21,666 3 1,216 22,885 100.0 (279) (765) 21,841
Risk rating category
Neither past due
nor impaired € million
Past due but not
impaired € million
Impaired € million
Total € million Total %
Portfolio provisions for
unidentified impairment € million
Specific provisions for
identified impairment € million
Total net of impairment € million
Impairment provisions %
2: Very strong 11 - - 11 0.1 - - 11 - 3: Strong 416 - - 416 1.9 - - 416 - 4: Good 2,503 - - 2,503 11.5 (2) - 2,501 0.1 5: Fair 6,630 - - 6,630 30.4 (11) - 6,619 0.2 6: Weak 7,206 15 - 7,221 33.0 (66) - 7,155 0.9 7: Special attention 3,774 14 - 3,788 17.4 (205) - 3,583 5.4 8: Non-performing - - 1,248 1,248 5.7 - (799) 449 64.1 At 31 December 2015 20,540 29 1,248 21,817 100 (284) (799) 20,734
29 Does not include fair value adjustments on impaired assets carried at fair value. 30 Reduction in specific provisions due to interest income recognised. 31 The ratio is calculated by dividing specific provisions over total impaired loans at amortised cost. 32 The ratio of amortised cost impaired loans disclosed here is based on the exposure represented on the balance sheet rather than operating assets. Total NPL
including fair value loans were 5.5 per cent of operating assets (2015: 5.9 per cent).
Movement in specific provisions29 2016
€ million 2015
€ million Opening balance 799 631 Provision cover 64% 54% New/increased specific provisions 189 266 Provisions release – repayments (117) (54) Provisions release – now performing (11) - Provisions release – write-offs (79) (39) Provisions release – loans sold - (20) Release against amounts recovered from guarantees - (3) Foreign exchange movement 13 45 Unwinding discount30 (29) (27) Closing balance 765 799 Provision cover31 63% 64%

32 EBRD Financial Report 2016
At the end of 2016, €3 million of loans were past due but not impaired. Loans amounting to €3 million were outstanding for more than 30 days but less than 90 days (2015: €29 million past due, of which €20 million were outstanding for less than 30 days, and €9 million were outstanding for more than 30 days but less than 90 days).
At 31 December 2016 the Bank had security arrangements in place for €7.5 billion of its loan operating assets (2015: €6.9 billion). It also benefited from guarantees and risk-sharing facilities provided by Special Funds and Cooperation Funds (see note 29 on page 74: Related Parties) which provided credit enhancement of approximately €63 million at the year-end (2015: €66 million).
Loans at fair value through profit or loss Set out below is an analysis of the Bank’s loans held at fair value through profit or loss for each of the Bank’s relevant internal risk rating categories.
Undrawn loan commitments and guarantees Set out below is an analysis of the Bank’s undrawn loan commitments and guarantees for each of the Bank’s relevant internal risk rating categories.
Risk rating category
Undrawn loan commitments
2016 € million
Guarantees 2016
€ million
Undrawn loan commitments
2015 € million
Guarantees 2015
€ million 3. Strong 28 - 37 - 4: Good 1,275 - 1,044 - 5. Fair 2,123 20 2,001 21 6: Weak 3,642 195 4,312 237 7: Special attention 2,850 322 3,088 298 8: Non-performing 111 28 147 20 At 31 December 10,029 565 10,629 576 The Bank would typically have conditions precedent that would need to be satisfied before further disbursements on its debt transactions. In addition, for projects risk rated 8, it is unlikely that commitments would be drawn down without additional assurances that credit quality would improve.
Risk rating category
Fair value 2016
€ million
Fair value 2015
€ million 5: Fair 14 135 6: Weak 222 124 7: Special attention 71 64 8: Non-performing 6 16 At 31 December 313 339

EBRD Financial Report 2016 33
Credit risk in the Banking portfolio: Concentration Concentration by country The following table breaks down the main Banking credit risk exposures in their carrying amounts by country. In 2015 Turkey became the largest country exposure. The Bank is generally well diversified by country apart from its concentration in Turkey, Ukraine and Russia which account for 22.0, 10.3 and 7.5 per cent of loans drawn down respectively (as shown below) and 17.3, 11.7 and 5.6 per cent of the Bank’s total loans including undrawn respectively. However, by the nature of the regional focus of the Bank’s business model, some groups of countries in which the Bank operates are highly correlated.
Loans 2016
€ million
Undrawn loan commitments
and guarantees 2016
€ million
Total 2016
€ million
Loans 2015
€ million
Undrawn loan commitments
and guarantees 2015
€ million
Total 2015
€ million Albania 153 340 493 225 209 434 Armenia 154 74 228 189 72 261 Azerbaijan 548 378 926 567 470 1,037 Belarus 358 105 463 434 55 489 Bosnia and Herzegovina 584 403 987 583 301 884 Bulgaria 818 152 970 584 102 686 Croatia 882 145 1,027 751 217 968 Cyprus 10 64 74 - 13 13 Czech Republic 4 - 4 5 - 5 Egypt 714 1,069 1,783 627 839 1,466 Estonia 70 - 70 59 40 99 Former Yugoslav Republic of Macedonia 242 474 716 240 596 836 Georgia 553 127 680 397 184 581 Greece 356 148 504 49 - 49 Hungary 256 47 303 272 55 327 Jordan 307 389 696 228 207 435 Kazakhstan 1,651 823 2,474 1,370 657 2,027 Kosovo 38 114 152 16 90 106 Kyrgyz Republic 174 72 246 138 95 233 Latvia 107 2 109 90 23 113 Lithuania 31 - 31 22 - 22 Moldova 140 340 480 142 304 446 Mongolia 896 42 938 488 416 904 Montenegro 208 138 346 171 228 399 Morocco 289 425 714 228 418 646 Poland 1,541 752 2,293 1,584 561 2,145 Romania 1,009 201 1,210 1,326 243 1,569 Russia 1,731 174 1,905 2,753 381 3,134 Serbia 1,267 737 2,004 1,064 1,071 2,135 Slovak Republic 150 160 310 387 18 405 Slovenia 185 19 204 173 6 179 Tajikistan 108 265 373 98 237 335 Tunisia 151 94 245 178 38 216 Turkey 5,094 755 5,849 4,163 758 4,921 Turkmenistan 25 12 37 34 8 42 Ukraine 2,386 1,554 3,940 2,505 2,293 4,798 Uzbekistan 8 - 8 16 - 16 At 31 December 23,198 10,594 33,792 22,156 11,205 33,361

34 EBRD Financial Report 2016
Concentration by industry sector The following table breaks down the main Banking credit exposures in their carrying amounts by the industry sector of the project. The portfolio is generally well diversified with only depository credit (banks) constituting a material sector concentration.
Concentration by counterparty Maximum exposure (after risk transfers) to a non-sovereign economic group was €910 million at year-end 2016 (2015: €687 million). The Bank has a maximum nominal exposure limit as well as risk-based non-sovereign Banking counterparty exposure limits.
Credit risk in Treasury: Management Key risk parameters for funding, cash management, asset and liability management and liquidity risk appetite are approved by the Board of Directors and articulated in the Treasury Authority and Liquidity Policy (TALP). The TALP is the document by which the Board of Directors delegates authority to the Senior Vice President, Chief Financial Officer and Chief Operating Officer to manage and the Vice President Risk & Compliance, CRO to identify, measure, monitor and mitigate the Bank’s Treasury exposures. The TALP covers all aspects of Treasury activities where financial risks arise and also Risk Management’s identification, measurement, management and mitigation of those risks. In addition, Treasury and Risk Management Guidelines (TRMG) are approved by the Senior Vice President, Chief Financial Officer and Chief Operating Officer and the VP Risk & Compliance, CRO to regulate operational aspects of Treasury risk-taking and the related risk management processes and procedures.
Eligible Treasury counterparties and investments are normally rated between 1.0 and 3.3 (approximately equivalent to S&P AAA to A– ratings), with the exception of counterparties approved for local currency activities in the countries where the Bank invests. These activities support the Bank’s initiatives to provide local currency financing to Banking clients and to develop local capital markets. In cases where the creditworthiness of an issuer or counterparty deteriorates to levels below the standard of eligibility for new exposures, Risk Management and Treasury jointly recommend actions for the approval of the VP Risk & Compliance, CRO and the Senior Vice President, Chief Financial Officer and Chief Operating Officer. Any decision to retain ineligible exposures is reported to the Audit Committee. The TRMG state the minimum rating and maximum tenor by type of eligible counterparty and set the maximum credit limits per rating. The internal credit rating scale is the same as that used for Banking exposure. The actual credit limit and/or tenor approved for individual counterparties by Risk Management may be smaller or shorter than the ceilings defined in the TRMG, based on the likely direction of creditworthiness over the medium term, or on sector considerations. The limits apply across the range of eligible Treasury products for the relevant counterparty with exposures measured on a risk-adjusted basis. All individual counterparty and investment credit lines are monitored and reviewed by Risk Management at least annually.
Loans 2016
€ million
Undrawn loan commitments
and guarantees 2016
€ million
Total 2016
€ million
Loans 2015
€ million
Undrawn loan commitments
and guarantees 2015
€ million
Total 2015
€ million Agribusiness 2,014 518 2,532 2,268 504 2,772
Depository credit (banks) 5,020 881 5,901 5,023 933 5,956
Information and communication technologies
602 91 693 295 21 316
Insurance, pension, mutual funds 57 - 57 55 2 57
Leasing finance 470 39 509 374 126 500
Manufacturing and services 2,474 341 2,815 2,486 319 2,805
Municipal and environmental infrastructure
1,443 1,102 2,545 1,323 998 2,321
Natural resources 2,249 748 2,997 1,814 883 2,697
Non-depository credit (non-bank) 239 31 270 498 52 550
Power and energy 2,688 990 3,678 2,804 797 3,601
Property and tourism 314 112 426 292 230 522
Transport 1,630 626 2,256 1,889 734 2,623
Non-sovereign 19,200 5,479 24,679 19,121 5,599 24,720 Sovereign 3,998 5,115 9,113 3,035 5,606 8,641 At 31 December 23,198 10,594 33,792 22,156 11,205 33,361

EBRD Financial Report 2016 35
The Bank’s exposure measurement methodology for Treasury credit risk uses a “Monte Carlo” simulation technique that produces, to a high degree of confidence, maximum exposure amounts at future points in time for each counterparty (in practice, 95 per cent eVaR).33 This includes all transaction types and is measured out to the maturity of the longest dated transaction with that counterparty. These potential future exposures (PFE) are calculated and controlled against approved credit limits on a daily basis with exceptions escalated to the relevant authority level for approval.
Risk mitigation techniques (such as netting and collateral) and risk transfer instruments reduce calculated credit exposure. For example, Credit Support Annexes (CSA) for OTC derivatives activity reduce PFE in line with collateral posting expectations.
Credit risk in Treasury: Treasury liquid assets The carrying value of Treasury’s liquid assets stood at €24.0 billion at 31 December 2016 (2015: €23.8 billion).34 The internal ratings of Treasury’s counterparties and sovereign exposures are reviewed at least annually and adjusted as appropriate. Overall the WAPD rating, weighted by the carrying value of Treasury’s liquid assets, deteriorated to 2.34 at 31 December 2016 (2015: 2.23)
Credit quality of Treasury’s liquid assets 31 December 2016
Credit quality of Treasury’s liquid assets 31 December 2015
Placements with and advances to credit institutions Set out below is an analysis of the Bank’s placements with and advances to credit institutions for each of the Bank’s relevant internal risk rating categories.
At 31 December 2016 there were no placements with and advances to credit institutions that were past due or impaired (2015: €nil).
33 Value-at-risk (VaR) is a statistical estimate of the maximum probable loss that can be incurred, due to adverse movements in major risk drivers, over a one-day
trading horizon and estimated at a given confidence level. Expected shortfall (eVaR) is the average loss beyond the VaR level and is a more accurate measure of large potential losses.
34 Treasury liquid assets consist of placements with and advances to credit institutions, debt securities and, in 2015, collateralised placements.
1.0 (AAA)23.7%
1.7-2.5 (AA)30.1%
2.7-3.3 (A)41.5%
3.7-4.3 (BBB)2.4%
4.7-5.3 (BB)1.8%
5.7-6.3 (B)0.5%
1.0 (AAA)25.9%
1.7-2.5 (AA)34.0%
2.7-3.3 (A)37.8%
3.7-4.3 (BBB)1.9%
4.7-5.3 (BB)0.3% 5.7-6.3 (B)
0.1%
Risk rating category 2016
€ million 2015
€ million 1: Excellent 568 143 2: Very strong 2,238 2,619 3: Strong 10,384 8,498 4: Good 442 422 5: Fair 436 19 6: Weak 42 23 At 31 December 14,110 11,724

36 EBRD Financial Report 2016
Debt securities at fair value through profit or loss Set out below is an analysis of the Bank’s debt securities at fair value through profit or loss for each of the Bank’s relevant internal risk rating categories.
Risk rating category 2016
€ million 2015
€ million 1: Excellent 223 267 2: Very strong 502 401 3: Strong - - 4: Good 127 26 5: Fair 3 52 6: Weak 71 1 At 31 December 926 747
There were no debt securities at fair value past due in 2016 (2015: €nil).
Debt securities at amortised cost Set out below is an analysis of the Bank’s debt securities at amortised cost for each of the Bank’s relevant internal risk rating categories.
Risk rating category 2016
€ million 2015
€ million 1: Excellent 4,918 5,751 2: Very strong 2,790 3,709 3: Strong 1,273 1,869 At 31 December 8,981 11,329
There were no debt securities at amortised cost past due in 2016 (2015: €nil).
Treasury potential future exposure In addition to Treasury’s liquid assets there are other products such as OTC swaps and forward contracts that are included within Treasury’s overall PFE. PFE calculations show the future exposure throughout the life of a transaction or, in the case of collateralised portfolios, over the appropriate unwind periods. This is particularly important for Treasury’s repo/reverse repo activity and hedging products such as OTC swaps and forwards. Calculation of PFE reduces counterparty exposures through standard risk mitigations such as netting and collateral, which enables Risk Management to see a comprehensive exposure profile of all Treasury products (including liquid assets) against a specific counterparty limit on a daily basis.
Treasury PFE stood at €20.7 billion at 31 December 2016 (2015: €20.6 billion). Treasury maintained a high quality average credit risk profile during 2016 by investing liquidity in AAA sovereign and other highly rated assets. However the WAPD rating, weighted by PFE exposures, deteriorated slightly to 2.19 at 31 December 2016 (2015: 2.08).

EBRD Financial Report 2016 37
A very low proportion of Treasury exposures was below investment grade quality,35 amounting to 2.8 per cent at 31 December 2016 (2015: 0.7 per cent). This comprised a small pool of local currency liquidity assets held with counterparties from the countries in which the Bank invests together with several financial sector bonds.
Credit quality of Treasury PFE 31 December 2016
Credit quality of Treasury PFE 31 December 2015
There were no impaired assets in the Treasury portfolio at 31 December 2016 (2015: €nil). Derivatives The Bank makes use of derivatives for different purposes within both its Banking portfolio and its Treasury activities. Within the Banking portfolio option contracts are privately negotiated with third parties to provide potential exit routes for the Bank on many of its unlisted share investments. Banking also has a limited portfolio of swaps with clients to hedge their market risks or to facilitate hard currency funding. Furthermore, Banking has a small number of currency swaps that are fully hedged and have been entered into with clients to assist them in the management of their market risks. Within Treasury, use of exchange-traded and OTC derivatives is primarily focused on hedging interest rate and foreign exchange risks arising from Bank-wide activities. Market views expressed through derivatives are also undertaken as part of Treasury's activities (within the tight market risk limits described on page 44), while the transactions through which the Bank funds itself in capital markets are typically swapped into floating-rate debt with derivatives. The risks arising from derivative instruments are combined with those deriving from all other instruments dependent on the same underlying risk factors, and are subject to overall market and credit risk limits, as well as to stress tests. Additionally, special care is devoted to those risks that are specific to the use of derivatives through, for example, the monitoring of volatility risk for options.
35 BB+/Ba1/BB+ level or worse.
1.0 (AAA)28.7%
1.7-2.5 (AA)
37.0%
2.7-3.3 (A)30.4%
3.7-4.3 (BBB)1.1%
4.7-5.3 (BB)2.2%
5.7-6.3 (B)0.5%
6.7-7.3 (CCC)0.1%
1.0(AAA)
30.6%
1.7-2.5 (AA)41.2%
2.7-3.3(A)
26.4%
3.7-4.3 (BBB)1.1%
4.7-5.3(BB)0.4%
5.7-6.3(B)
0.2%6.7-7.3 (CCC)0.1%

38 EBRD Financial Report 2016
The table below shows the fair value of the Bank’s derivative financial assets and liabilities at 31 December 2016 and 31 December 2015.
Set out below is an analysis of the Bank’s derivative financial assets for each of the Bank’s internal risk rating categories.
Risk rating category 2016
€ million 2015
€ million 1: Excellent 64 - 2: Very strong 760 767 3: Strong 2,800 3,298 4: Good 317 223 5: Fair 198 187 6: Weak 48 63 7: Special attention 132 58 At 31 December 4,319 4,596
There were no derivative financial assets past due in 2016 (2015: €nil).
Included in the valuation of derivatives is an overall positive value to the Bank of €44 million attributable to the counterparty portfolio-level adjustments for CVA/DVA/FVA. The Bank implemented valuation adjustments for CVA/DVA/FVA in 2016 in line with the latest market practice for fair valuing derivatives. There was therefore no comparable valuation adjustment made in 2015. The valuation adjustment may be analysed thus:
• CVA: the credit valuation adjustment which reflects the impact on the price of a derivative trade from changes in the credit risk associated with the counterparty; €14 million
36 Where a financial liability held at amortised cost contains an embedded derivative which is of a different economic character to the host instrument, and the
liability does not qualify for hedge accounting, that embedded derivative is bifurcated and measured at fair value through the income statement. All such derivatives bifurcated by the Bank are embedded in Debts Evidenced by Certificates.
Assets 2016
€ million
Liabilities 2016
€ million
Total 2016
€ million
Assets 2015
€ million
Liabilities 2015
€ million
Total 2015
€ million
Portfolio derivatives not designated as hedges
OTC foreign currency products
Currency swaps 400 (82) 318 856 (52) 804 Spot and forward currency transactions 333 (151) 182 114 (139) (25) 733 (233) 500 970 (191) 779
OTC interest rate products Interest rate swaps 87 (170) (83) 65 (166) (101) Caps/floors 1 - 1 - - -
Banking derivatives Fair value of equity derivatives held in relation to the Banking portfolio 567 (50) 517 489 (77) 412 Total portfolio derivatives not designated as hedges and Banking derivatives 1,388 (453) 935 1,524 (434) 1,090
Derivatives held for hedging Derivatives designated as fair value hedges Interest rate swaps 1,195 (237) 958 1,510 (222) 1,288 Cross currency interest rate swaps 1,672 (1,357) 315 1,562 (2,203) (641) Embedded derivatives36 64 (121) (57) - (134) (134) 2,931 (1,715) 1,216 3,072 (2,559) 513
Derivatives designated as cash flow hedges
Forward currency transactions - (2) (2) - - -
Total derivatives held for hedging 2,931 (1,717) 1,214 3,072 (2,559) 513
Total derivatives at 31 December 4,319 (2,170) 2,149 4,596 (2,993) 1,603

EBRD Financial Report 2016 39
• DVA: the debit valuation adjustment which reflects the impact on the price of a derivative trade from changes in the credit risk associated with the EBRD; €(11) million
• FVA: the funding valuation adjustment which reflects the costs and benefits arising when uncollateralised derivative exposures are hedged with collateralised trades; €41 million
In order to manage credit risk in OTC derivative transactions,37 the Bank’s policy is to approve, ex ante, each counterparty individually and to review its creditworthiness and eligibility regularly. Derivatives limits are included in overall counterparty credit limits. OTC derivative transactions are normally carried out only with the most creditworthy counterparties, rated at the internal equivalent of A and above. Furthermore, the Bank pays great attention to mitigating the credit risk of OTC derivatives through the negotiation of appropriate legal documentation with counterparties. OTC derivative transactions are documented under a Master Agreement (MA) and a CSA. These provide for close-out netting and the posting of collateral by the counterparty once the Bank’s exposure exceeds a given threshold, which is usually a function of the counterparty’s risk rating. The Bank has also expanded the scope for applying risk mitigation techniques by documenting the widest possible range of instruments transacted with a given counterparty under a single MA and CSA, notably foreign exchange transactions. The Bank also uses credit-downgrade clauses and, for long-dated transactions, unilateral break clauses to manage its credit exposures. Similarly, the Bank emphasises risk mitigation for repurchase and reverse repurchase agreements and related transaction types through MA documentation.
Collateral The Bank mitigates counterparty credit risk by holding collateral against exposures to derivative counterparties. Counterparty exposure, for the purposes of collateralising credit risk, is only concerned with counterparties with whom the Bank has an overall net positive exposure. At 31 December 2016 this exposure stood at €2.0 billion (2015: €2.4 billion). Against this, the Bank held collateral of €2.0 billion (2015: €2.4 billion), reducing its net credit exposure to €nil (2015: €nil). Where the Bank borrows or purchases securities subject to a commitment to resell them (a reverse repurchase agreement) but does not acquire the risk and rewards of ownership, the transactions are treated as collateralised loans. The securities are not included in the balance sheet and are held as collateral. The table below illustrates the fair value of collateral held that is permitted to be sold or repledged in the absence of default. Sold or repledged collateral includes collateral on-lent through bond lending activities. In all cases the Bank has an obligation to return equivalent securities.
The table below shows the reported values of derivatives that are subject to MA netting arrangements.
37 This does not include negotiated options associated with share investments.
Collateral held as security
Held collateral
2016 € million
Sold or repledged
2016 € million
Held collateral
2015 € million
Sold or repledged
2015 € million
Derivative financial instruments High grade government securities 640 - 990 - Cash 1,336 1,336 1,384 1,384 1,976 1,336 2,374 1,384 Reverse sale and repurchase transactions 4,912 - 4,887 - At 31 December 6,888 1,336 7,261 1,384
Recognised derivative
assets 2016
€ million
Recognised derivative liabilities
2016 € million
Net position
2016 € million
Collateral held
2016 € million
Subject to a master netting agreement Net derivative assets by counterparty 2,764 (809) 1,955 1,952 Net derivative liabilities by counterparty 904 (1,187) (283) 24 3,668 (1,996) 1,672 1,976 No master netting agreement Other derivatives 20 (3) 17 - Embedded derivatives 64 (121) (57) - Equity derivatives 567 (50) 517 - 651 (174) 477 - At 31 December 4,319 (2,170) 2,149 1,976

40 EBRD Financial Report 2016
Credit risk in Treasury: Concentration Concentration by country At the end of 2016, Treasury credit risk exposure was spread across the following countries.
Concentration of Treasury peak exposure by country/region 31 December 2016
Concentration of Treasury peak exposure by country/region 31 December 2015
15.1%
3.1%
3.7%
3.7%
4.8%
6.3%
6.9%
8.9%
9.0%
11.4%
13.4%
13.7%
28 countries with exposure < 3%
Finland
Sweden
Denmark
Netherlands
Australia
Canada
France
United Kingdom
Japan
USA
Switzerland
12.2%
3.1%
3.1%
3.9%
4.0%
5.2%
6.8%
6.8%
8.6%
9.0%
11.6%
12.4%
13.3%
23 countries with exposure < 3%
Germany
Finland
Sweden
Norway
Australia
Netherlands
Canada
France
United Kingdom
Japan
USA
Switzerland
Recognised derivative
assets 2015
€ million
Recognised derivative liabilities
2015 € million
Net position
2015 € million
Collateral held
2015 € million
Subject to a master netting agreement Net derivative assets by counterparty 3,140 (728) 2,412 2,348 Net derivative liabilities by counterparty 844 (2,053) (1,209) 26 3,984 (2,781) 1,203 2,374 No master netting agreement Other derivatives 123 - 123 - Embedded derivatives - (135) (135) - Equity derivatives 489 (77) 412 - 612 (212) 400 - At 31 December 4,596 (2,993) 1,603 2,374
0 1,000 2,000 3,000 € million
0 1,000 2,000 3,000 € million

EBRD Financial Report 2016 41
Concentration by counterparty type The Bank continues to be largely exposed to banks in the Treasury portfolio which accounted for 59 per cent of the portfolio peak exposure (2015: 54 per cent). Direct sovereign exposure38 decreased to 15 per cent (2015: 22 per cent), while exposure to counterparties in the countries in which the Bank invests increased to 5 per cent (2015: 3 per cent) on a PFE basis.
Concentration of peak exposure by counterparty type 31 December 2016
Concentration of peak exposure by counterparty type 31 December 2015
CoO: Countries of operations ABS: Asset-backed securities
B. Market risk Market risk is the potential loss that could result from adverse market movements. The drivers of market risk are: (i) interest rate risk; (ii) foreign exchange risk; (iii) equity risk; and (iv) commodity price risk.
Market risk in the Banking portfolio The Banking loan portfolio is match-funded by Treasury in terms of currency, so for loan facilities extended in currencies other than euro the foreign exchange risk is hedged by Treasury. Likewise, interest rate risk to which the Banking loan portfolio would normally be exposed is managed through the Treasury portfolio. As such there is minimal residual foreign exchange or interest rate risk present in the Banking loan portfolio. The main exposure to market risk in the Banking portfolio arises from the exposure of share investments to foreign exchange and equity price risk, neither of which is captured in the VaR figures discussed under “Market risk in the Treasury portfolio”. Additional sensitivity information for the Bank’s share investments has been included under “fair value hierarchy” later in this section of the report. The EBRD takes a long-term view of its equity investments, and therefore accepts the short-term volatilities in value arising from exchange rate risk and price risk.
38 Indirect exposure is not included – that is, where the Bank holds government securities as collateral.
Banks59.0%
Sovereigns15.2%
Other state-controlled
entities5.8%
ABS6.6%
CoO Counter-parties5.3%
Others8.1%
Banks53.8%
Sovereigns21.8%
Other state-controlled
entities6.2%
ABS6.3%
CoO Counter-parties2.6%
Others9.3%

42 EBRD Financial Report 2016
Foreign exchange risk The Bank is subject to foreign exchange risks as it invests in equities that are denominated in currencies other than euro. Accordingly, the value of the equity investments may be affected favourably or unfavourably by fluctuations in currency rates. The table below indicates the currencies to which the Bank had significant exposure on its equity investments at 31 December 2016.39 The sensitivity analysis summarises the total effect of a reasonably possible movement of the currency rate40 against the euro on equity fair value and on profit or loss with all other variables held constant.
Share investments at fair value through profit or loss
5-year rolling average movement in exchange rate
% Fair value € million
Impact on net profit € million
Euro - 1,760 - Hungarian forint 3.2 141 5 Polish zloty 3.3 375 12 Romanian leu 1.0 293 3 Russian rouble 20.5 871 178 Turkish lira 12.3 296 37 Ukrainian hryvnia 25.0 111 28 United States dollar 6.3 959 60 Other non-euro 10.6 459 49 At 31 December 2016 5,265 372
5-year rolling average movement in exchange rate
% Fair value € million
Impact on net profit € million
Euro - 1,646 - Polish zloty 5.1 437 22 Romanian leu 1.2 312 4 Russian rouble 17.3 843 146 Turkish lira 12.5 332 41 Ukrainian hryvnia 23.6 89 21 United States dollar 6.4 899 58 Other non-euro 10.1 475 48 At 31 December 2015 5,033 340
The average movement in exchange rate for the “other non-euro” consists of the weighted average movement in the exchange rates listed in the same table.
39 The table reflects the currency in which shares are denominated. For most of the share investments denominated in euro (€1.76 billion) and in United States dollar (€959 million) the underlying risk exposures (and cash flows determining the equity values) are in the local currency of one of the countries of operations. As a result, the overall foreign exchange risk for these exposures also includes movements between the relevant local currency and either euro or United States dollar (but which is outside the scope of this disclosure). 40 Based on a five-year rolling average movement in the exchange rate.

EBRD Financial Report 2016 43
Equity price risk Equity price risk is the risk of unfavourable changes in the fair values of equities as the result of changes in the levels of equity indices and the value of individual shares. In terms of equity price risk, the Bank expects the effect on net profit will bear a linear relationship to the movement in equity indices, for both listed and unlisted equity investments. The table below summarises the potential impact on the Bank’s net profit from a reasonably possible change in equity indices.41
Share investments at fair value through profit or loss
5-year rolling average movement in benchmark index
% Fair value € million
Impact on net profit € million
Georgia BGAX Index 13.5 112 15 Greece GREK Index 27.4 170 47 Poland WIG Index 11.1 543 60 Romania BET Index 11.2 294 33 Russia MICEX Index 13.4 1,570 211 Serbia BELEX15 Index 9.2 191 18 Turkey XU100 Index 23.5 404 95 Ukraine PFTS Index 24.8 132 33 Regional and other Weighted average 15.0 1,849 277 At 31 December 2016 5,265 789
5-year rolling average movement in benchmark index
% Fair value € million
Impact on net profit € million
Cyprus CYSMMAPA Index 36.2 79 29 Greece GREK Index 26.9 265 71 Hungary CHTX Index 19.6 80 16 Kazakhstan KASE Index 12.9 76 10 Poland WIG Index 13.0 479 62 Romania BET Index 14.5 323 47 Russia MICEX Index 11.5 1,050 120 Serbia BELEX15 Index 11.6 100 12 Turkey XU100 Index 26.2 386 101 Ukraine PFTS Index 31.8 124 39 Regional and other Weighted average 17.1 2,071 354 At 31 December 2015 5,033 861
The average movement in benchmark index for “regional and other” is made up of the weighted average movement in benchmark indices of the countries listed in the same table.
Commodity risk in the Banking portfolio The Bank is exposed to commodity risk through some of its investments and due to the significant importance of commodities in a number of the countries in which it invests. The aggregate direct exposure to oil and gas extraction, metal ore mining and coal mining (and related support activities) amounts to 4.5 per cent (2015: 5.9 per cent) of the overall banking portfolio. Although the share of this portfolio is still a small percentage of the total, the potential overall risk can be more substantial, as several countries in which the Bank invests, most notably Russia, Kazakhstan, Azerbaijan and Mongolia, are heavily reliant on commodity exports to support their economic growth, domestic demand and budgetary revenues. A prolonged and material decline in oil prices would have an adverse effect on hydrocarbon producers and processors, as well as on the relevant sovereigns and corporate clients reliant on domestic demand. The Bank monitors this risk carefully and incorporates oil price movements into its stress testing exercises.
41 Based on a five-year rolling average movement in the relevant equity market indices.

44 EBRD Financial Report 2016
Market risk in the Treasury portfolio Interest rate and foreign exchange risk The Bank’s market risk exposure arises from the fact that the movement of interest rates and foreign exchange rates may have an impact on positions taken by the Bank. These risks are centralised and hedged by the Asset and Liability Management desk in Treasury. Interest rate risk is the risk that the value of a financial instrument will fluctuate due to changes in market interest rates. The length of time for which the interest is fixed on a financial instrument indicates the extent to which it is exposed to interest rate risk. Interest rate risks are managed by synthetically hedging the interest rate profiles of assets and liabilities through the use of exchange-traded and OTC derivatives. The Bank measures its exposure to market risk and monitors limit compliance daily. The main market risk limits in the Bank are based on eVaR computed at a 95 per cent confidence level over a one-day trading horizon; eVaR is defined as the average potential loss above a certain threshold (for example 95 per cent) that could be incurred due to adverse fluctuations in interest rates and/or foreign exchange rates. The Bank’s overall eVaR limit, laid down in the Board-approved TALP, at a 95 per cent confidence level over a one-day trading horizon is €60.0 million (less than 0.5 per cent of capital). For enhanced comparability across institutions, numbers disclosed in this financial report show eVaR-based measures scaled up to a 10-trading-day horizon. The market risk methodology considers the three-month swap curve as the main interest rate risk factor and the other factors as basis spread risk factors.42 The total eVaR (95 per cent confidence level over a 10-day trading horizon) of the Bank's Treasury portfolio, including basis spread risks, stood at €11.1 million at 31 December 2016 (2015: €30.6 million)43 with an average eVaR over the year of €17.2 million (2015: €33.4 million). Year on year, the total eVaR was lower (mainly due to lower basis risk) and driven primarily by the Government bond spread risk, to which Treasury is exposed through its sovereign bond holdings. Interest rate option exposure remained modest throughout the year with option eVaR at €0.6 million at year-end (2015: €0.8 million), having peaked at €3.7 million during the year (2015: €1.9 million). The specific contribution from foreign exchange risk to the overall eVaR stood at €1.5 million at year-end (2015: €1.5 million). As in previous years, this contribution was small throughout 2016 and never exceeded €3.2million (2015: € 3.2 million).
Equity price risk The Bank has direct exposure to equity risk of €75 million at 31 December 2016 through three Treasury share investments44 (2015: €63 million). Indirect exposure to equity risk occurs in the form of linked structures that are traded on a back-to-back basis and therefore result in no outright exposure.
42 Spread risk arises from cross-currency basis spreads, tenor spreads (for example between 6-month and 3-month Libor), overnight index swap (OIS) vs. 3-month
Libor spread and Government bond spreads. 43 Note that the numbers reported in Financial Statements 2015 pertained to 99%, 10-day VaR (not eVaR). For reference, the total VaR (99%, 10-day) of the Bank’s
Treasury portfolio stood at €12.6 million at 31 December 2016 (2015: €34.5 million). 44 See note 18 to the financial statements on page 62.

EBRD Financial Report 2016 45
C. Operational risk The Bank defines operational risk as all aspects of risk-related exposure other than those falling within the scope of credit, market and liquidity risk. This includes the risk of loss resulting from inadequate or failed internal processes, people and systems or from external events and reputational risk. Examples include:
• errors or failures in transaction support systems • inadequate disaster recovery planning • errors in the mathematical formulae of pricing or hedging models • errors in the computation of the fair value of transactions • damage to the Bank’s name and reputation, either directly by adverse comments or indirectly • errors or omissions in the processing and settlement of transactions, whether in the areas of execution, booking or settlement
or due to inadequate legal documentation • errors in the reporting of financial results or failures in controls, such as unidentified limit excesses or unauthorised
trading/trading outside policies • dependency on a limited number of key personnel, inadequate or insufficient staff training or skill levels • external events.
The Bank has a low tolerance for material losses arising from operational risk exposures. Where material operational risks are identified (that is, those that may lead to material loss if not mitigated), appropriate mitigation and control measures are put in place after a careful weighing of the risk/return trade-off. Maintaining the Bank’s reputation is of paramount importance and reputational risk has therefore been included in the Bank’s definition of operational risk. The Bank will always take all reasonable and practical steps to safeguard its reputation.
Within the Bank, there are policies and procedures in place covering all significant aspects of operational risk. These include consideration of the Bank’s high standards of business ethics, its established system of internal controls, checks and balances and segregation of duties. These are supplemented with:
• the Bank’s Codes of Conduct • disaster recovery/contingency planning • the Public Information Policy • the Environment and Social Policy • client and project integrity due diligence procedures, including anti-money-laundering measures • procedures for reporting and investigating suspected staff misconduct • the Bank’s Enforcement Policies and Procedures • the information security framework • the Procurement Policies and Rules.
Responsibility for developing the operational risk framework and for monitoring its implementation resides within the Risk Management department. Risk Management is responsible for the overall framework and structure to support line managers who control and manage operational risk as part of their day-to-day activities.
The Bank’s current operational risk framework includes an agreed definition; the categorisation of different loss type events to assess the Bank’s exposure to operational risk; a group of key risk indicators to measure such risks; the identification of specific operational risks through an annual self-assessment exercise; internal loss data collection; and the contribution to, and use of, external loss data. Departments within the Bank identify their operational risk exposures and evaluate the mitigating controls that help to reduce the inherent or pre-control risk. Each risk (both inherent and post-control) is assessed for its impact, according to a defined value scale and the likelihood of occurrence, based on a frequency-by-time range. Operational risk incident losses or near misses above €5,000 are required to be reported. The collection of such data is primarily to improve the control environment by taking into account the cost of control strengthening and perceived potential future losses. The Bank is a member of the Global Operational Risk Loss Database, the external loss database where members “pool” operational risk incident information over a monetary threshold. This provides the Bank with access to a depth of information wider than its own experience and supplements its own analysis on reported internal incidents.

46 EBRD Financial Report 2016
D. Liquidity risk
Liquidity risk management process The Bank’s liquidity policies are reviewed annually and any changes approved by the Board of Directors. The policies are designed to ensure that the Bank maintains a prudent level of liquidity, given the risk environment in which it operates, and to support its AAA credit rating.
The Bank’s medium term liquidity requirements are based on satisfying each of the following three minimum constraints:
• net Treasury liquid assets must be at least 75 per cent of the next two years’ projected net cash requirements, without recourse to accessing funding markets;
• the Bank’s liquidity must be considered a strong positive factor when rating agency methodologies are applied. These methodologies include applying haircuts to the Bank’s liquid assets, assessing the level of debt due within one year and considering undrawn commitments. This provides an external view of liquidity coverage under stressed circumstances;
• the Bank must be able to meet its obligations for at least 12 months under an extreme stress scenario. This internally generated scenario considers a combination of events that could detrimentally impact the Bank’s liquidity position.
For the purposes of the net cash requirements coverage ratio above, all assets managed within the Treasury portfolio are considered to be liquid assets while ‘net’ treasury liquid assets represent gross treasury assets net of short-term debt.45 The Bank typically holds liquidity above its minimum policy levels to allow flexibility in the execution of its borrowing programme. The Bank exceeded the minimum requirements under the new liquidity policy at 31 December 2016 and consistently exceeded the prevailing liquidity policy requirements throughout the year. The average weighted maturity of assets managed by Treasury at 31 December 2016 was 1.3 years (2015: 1.3 years).
The Bank’s short-term liquidity policy is based on the principles of the Liquidity Coverage Ratio within the Basel III reform package. The policy requires that the ratio of maturing liquid assets and scheduled cash inflows to cash outflows over both a 30-day and 90-day horizon must be a minimum of 100 per cent. The minimum ratios under the Bank’s policy have been exceeded at 31 December 2016 and consistently throughout the year. In addition to the above, Treasury actively manages the Bank’s liquidity position on a daily basis.
The Bank has a proven record of access to funding in the capital markets via its global medium-term note programme and commercial paper facilities. In 2016 the Bank raised €5.6 billion of medium- to long-term debt with an average tenor of 3.8 years (2015: €4.2 billion and 4.8 years). The Bank’s AAA credit rating with a stable outlook was affirmed by the three major rating agencies in 2016. The Bank’s liquidity policies are subject to independent review by Risk Management and by the Risk Committee prior to the submission for Board approval.
45 For this ratio, short-term debt is debt with a fixed or optional maturity of one year or less at the point of acquisition – that is, it is not debt where the remaining
maturity is one year or less.

EBRD Financial Report 2016 47
As the figures represent undiscounted cash flows, they do not agree to the balance sheet.
Financial liabilities at 31 December 2016
Up to and including 1 month € million
Over 1 month and up to and including 3 months € million
Over 3 months and up to and
including 1 year
€ million
Over 1 year and up to and including
3 years € million
Over 3 years € million
Total € million
Non-derivative cash flows Amounts owed to credit institutions (2,207) (309) - - - (2,516) Debts evidenced by certificates (1,927) (4,444) (5,736) (13,638) (12,089) (37,834) Other financial liabilities (12) (5) (333) (18) (2) (370) At 31 December 2016 (4,146) (4,758) (6,069) (13,656) (12,091) (40,720) Trading derivative cash flows Net settling interest rate derivatives (2) (3) (34) (53) (94) (186) Gross settling interest rate derivatives – outflow (13) (360) (381) (871) (284) (1,909) Gross settling interest rate derivatives – inflow 1 332 355 796 245 1,729 Foreign exchange derivatives – outflow (1,147) (1,845) (888) - - (3,880) Foreign exchange derivatives – inflow 1,108 1,739 840 - - 3,687 At 31 December 2016 (53) (137) (108) (128) (133) (559) Hedging derivative cash flows Net settling interest rate derivatives (200) 11 (602) (482) (53) (1,326) Gross settling interest rate derivatives – outflow (28) (308) (1,258) (2,695) (2,432) (6,721) Gross settling interest rate derivatives – inflow 37 268 1,055 2,264 2,044 5,668 At 31 December 2016 (191) (29) (805) (913) (441) (2,379) Total financial liabilities at 31 December 2016 (4,390) (4,924) (6,982) (14,697) (12,665) (43,658) Other financial instruments Undrawn commitments
Financial institutions (2,361) - - - - (2,361) Non-financial institutions (9,714) - - - - (9,714)
At 31 December 2016 (12,075) - - - - (12,075)

48 EBRD Financial Report 2016
Financial liabilities at 31 December 2015
Up to and including 1 month € million
Over 1 month and up to and
including 3 months € million
Over 3 months and up to and
including 1 year
€ million
Over 1 year and up to and
including 3 years € million
Over 3 years € million
Total € million
Non-derivative cash flows Amounts owed to credit institutions (2,441) (152) - - - (2,593) Debts evidenced by certificates (1,326) (4,659) (10,331) (14,011) (14,132) (44,459) Other financial liabilities (11) (6) (212) (44) (11) (284) At 31 December 2015 (3,778) (4,817) (10,543) (14,055) (14,143) (47,336) Trading derivative cash flows Net settling interest rate derivatives (3) (4) (31) (54) (77) (169) Gross settling interest rate derivatives – outflow (59) (29) (751) (644) (657) (2,140) Gross settling interest rate derivatives – inflow 52 14 745 630 655 2,096 Foreign exchange derivatives – outflow (2,344) (3,978) (850) - - (7,172) Foreign exchange derivatives – inflow 2,311 3,911 814 - - 7,036 At 31 December 2015 (43) (86) (73) (68) (79) (349) Hedging derivative cash flows Net settling interest rate derivatives (4) 5 (93) (63) (36) (191) Gross settling interest rate derivatives – outflow (392) (797) (1,528) (3,729) (2,730) (9,176) Gross settling interest rate derivatives – inflow 265 708 1,029 3,120 2,303 7,425 At 31 December 2015 (131) (84) (592) (672) (463) (1,942) Total financial liabilities at 31 December 2015 (3,952) (4,987) (11,208) (14,795) (14,685) (49,627) Other financial instruments Undrawn commitments
Financial institutions (2,641) - - - - (2,641) Non-financial institutions (10,318) - - - - (10,318)
At 31 December 2015 (12,959) - - - - (12,959)

EBRD Financial Report 2016 49
E. Capital management The Bank’s original authorised share capital was €10.0 billion. Under Resolution No. 59, adopted on 15 April 1996, the Board of Governors approved a doubling of the Bank’s authorised capital stock to €20.0 billion.
In accordance with the requirements of Article 5.3 of the Agreement, the Board of Governors reviews the capital stock of the Bank at intervals of not more than five years. At the Annual Meeting in May 2010 the Bank’s Board of Governors approved the Fourth Capital Resources Review (CRR4) which established the Bank’s strategy for the period 2011 to 2015. This included an analysis of the transition impact and operational activity of the Bank; an assessment of the economic outlook and transition challenges in the region; the formulation of medium-term portfolio development strategy and objectives; and a detailed analysis of the Bank’s projected future financial performance and capital adequacy. The review underlined the fact that the Bank relies on a strong capital base and stressed the need for prudent financial policies supporting conservative provisioning, strong liquidity and long-term profitability.
As a result of the assessment of capital requirements in CRR4, in May 2010 the Board of Governors approved a two-step increase in the authorised capital stock of the Bank: an immediate €1.0 billion increase in authorised paid-in shares (Resolution No. 126), and a €9.0 billion increase in authorised callable capital shares (Resolution No. 128). This amounts to an aggregate increase in the authorised capital stock of the Bank of €10.0 billion (collectively referred to as the second capital increase). The increase in callable capital became effective on 20 April 2011 when subscriptions were received for at least 50 per cent of the newly authorised callable capital. The callable shares were issued subject to redemption in accordance with the terms of Resolution No. 128. At 31 December 2016, €8.9 billion of the callable capital increase had been subscribed (2015: €8.9 billion).
At the May 2015 Annual Meeting the Board of Governors reviewed the capital stock of the Bank pursuant to Article 5.3 of the Agreement and resolved that the projected capital stock is appropriate for the 2016-2020 period, in the context of the approval of the Bank’s Strategic and Capital Framework 2016-2020. The Board of Governors further resolved that no callable capital shares would be redeemed and that the redemption and cancellation provisions in Resolution No. 128 be removed. Finally, the Board of Governors resolved that the adequacy of the Bank’s capital would next be reviewed at the 2020 Annual Meeting (Resolutions No. 181, 182 and 183).
The Bank does not have any other classes of capital.
The Bank’s capital usage is guided by statutory and financial policy parameters. Article 12 of the Agreement establishes a 1:1 gearing ratio which limits the total amount of outstanding loans, share investments and guarantees made by the Bank in the countries in which it invests to the total amount of the Bank’s unimpaired subscribed capital, reserves and surpluses. This capital base incorporates unimpaired subscribed capital (including callable capital), the unrestricted general reserves, loan loss reserve, special reserve and adjustments for general loan impairment provisions on Banking exposures and unrealised equity losses. Reflecting a change in interpretation in 2015, specific provisions are not included in the statutory capital base. The capital base for these purposes amounted to €39.7 billion46 at 31 December 2016 after 2016 net income allocation decisions (2015: €39.2 billion).
The Bank interprets the gearing ratio on a ‘disbursed Banking assets’ or ‘operating assets’ basis. To ensure consistency with the statutory capital base, specific provisions are deducted from total operating assets for the purposes of the ratio.47 At 31 December 2016, the Bank’s gearing ratio on an aggregated basis was 73 per cent (2015: 71 per cent). Article 12 also limits the total amount of disbursed share investments to the total amount of the Bank's unimpaired paid-in subscribed capital, surpluses and general reserve. No capital utilisation limits were breached during the year (2015: none).
The Bank’s statutory measure of capital adequacy under the gearing ratio is supplemented by a risk-based prudential capital adequacy limit under its Capital Adequacy Policy (previously named the Economic Capital Policy).
The Bank defines required capital as the potential capital losses it may incur based on probabilities consistent with the Bank’s AAA credit rating. The main risk categories assessed under the capital adequacy framework are credit risk, market risk and operational risk, and the total risk is managed within an available capital base that excludes callable capital, while maintaining a prudent capital buffer.
One of the main objectives of the Capital Adequacy Policy is to manage the Bank’s capital within a medium-term planning framework, providing a consistent measurement of capital headroom over time. The Bank’s objective is to prevent the need to call on subscribed callable capital and to use only available risk capital including paid-in capital and reserves. At 31 December 2016 the ratio of required capital to available capital was 77 per cent (2015: 80 per cent) compared with a policy threshold for this ratio of 90 per cent. The Bank’s risk-based capital requirement under this policy is managed alongside the Bank’s statutory capital constraint. The Bank’s prudent approach to capital management is reflected in the key financial ratios presented on page 7. At 31 December 2016, the ratio of members’ equity to total assets was 27 per cent (2015: 27 per cent) and the ratio of members’ equity to Banking assets was 56 per cent (2015: 56 per cent).
46 Deductions are made to exclude revaluation reserves related to Banking assets (as operating assets are considered at cost). 47 This reflects a change in the interpretation of the ratio in 2015. Previously specific provisions were included in the capital base and the operating assets
exposure was prior to the impact of specific provisions.

50 EBRD Financial Report 2016
F. Fair value of financial assets and liabilities
Classification and fair value of financial assets and liabilities
Financial assets at 31 December 2016
Carrying amount € million
Fair value € million
Financial assets measured at fair value through profit or loss or fair value through other comprehensive income: – Debt securities 926 926 – Derivative financial instruments 4,319 4,319 – Banking loans at fair value through profit or loss 313 313 – Banking portfolio: Share investments at fair value through profit or loss 5,265 5,265 – Treasury portfolio: Share investments at fair value through other comprehensive income 75 75 10,898 10,898 Financial assets measured at amortised cost:48 – Placements with and advances to credit institutions 14,110 14,110 – Debt securities 8,981 9,000 – Other financial assets 214 214 – Banking loan investments at amortised cost 21,841 22,610 45,146 45,934 Total 56,044 56,832
Financial assets at 31 December 2015
Carrying amount
€ million Fair value € million
Financial assets measured at fair value through profit or loss or fair value through other comprehensive income: – Debt securities 747 747 – Derivative financial instruments 4,596 4,596 – Banking loans at fair value through profit or loss 339 339 – Banking portfolio: Share investments at fair value through profit or loss 5,033 5,033 – Treasury portfolio: Share investments at fair value through other comprehensive income 63 63 10,778 10,778 Financial assets measured at amortised cost: – Placements with and advances to credit institutions 11,724 11,724 – Debt securities 11,329 11,301 – Collateralised placements 13 13 – Other financial assets 335 335 – Banking loan investments at amortised cost 20,734 21,363 44,135 44,736 Total 54,913 55,514
48 With the exception of debt securities and loan investments, the fair value for the other amortised cost assets approximates to their carrying value due to the
short-dated nature of these assets.
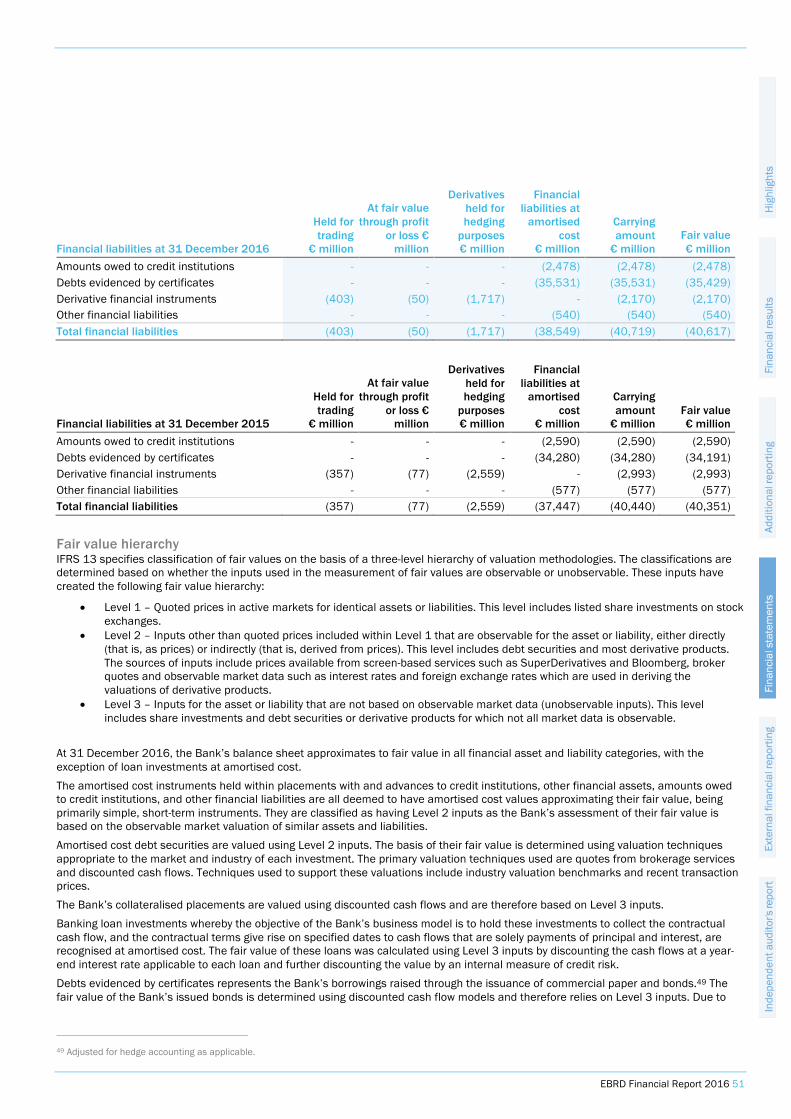
EBRD Financial Report 2016 51
Financial liabilities at 31 December 2016
Held for trading € million
At fair value through profit
or loss € million
Derivatives held for hedging
purposes € million
Financial liabilities at
amortised cost
€ million
Carrying amount € million
Fair value € million
Amounts owed to credit institutions - - - (2,478) (2,478) (2,478) Debts evidenced by certificates - - - (35,531) (35,531) (35,429) Derivative financial instruments (403) (50) (1,717) - (2,170) (2,170) Other financial liabilities - - - (540) (540) (540) Total financial liabilities (403) (50) (1,717) (38,549) (40,719) (40,617)
Fair value hierarchy IFRS 13 specifies classification of fair values on the basis of a three-level hierarchy of valuation methodologies. The classifications are determined based on whether the inputs used in the measurement of fair values are observable or unobservable. These inputs have created the following fair value hierarchy:
• Level 1 – Quoted prices in active markets for identical assets or liabilities. This level includes listed share investments on stock exchanges.
• Level 2 – Inputs other than quoted prices included within Level 1 that are observable for the asset or liability, either directly (that is, as prices) or indirectly (that is, derived from prices). This level includes debt securities and most derivative products. The sources of inputs include prices available from screen-based services such as SuperDerivatives and Bloomberg, broker quotes and observable market data such as interest rates and foreign exchange rates which are used in deriving the valuations of derivative products.
• Level 3 – Inputs for the asset or liability that are not based on observable market data (unobservable inputs). This level includes share investments and debt securities or derivative products for which not all market data is observable.
At 31 December 2016, the Bank’s balance sheet approximates to fair value in all financial asset and liability categories, with the exception of loan investments at amortised cost. The amortised cost instruments held within placements with and advances to credit institutions, other financial assets, amounts owed to credit institutions, and other financial liabilities are all deemed to have amortised cost values approximating their fair value, being primarily simple, short-term instruments. They are classified as having Level 2 inputs as the Bank’s assessment of their fair value is based on the observable market valuation of similar assets and liabilities. Amortised cost debt securities are valued using Level 2 inputs. The basis of their fair value is determined using valuation techniques appropriate to the market and industry of each investment. The primary valuation techniques used are quotes from brokerage services and discounted cash flows. Techniques used to support these valuations include industry valuation benchmarks and recent transaction prices. The Bank’s collateralised placements are valued using discounted cash flows and are therefore based on Level 3 inputs. Banking loan investments whereby the objective of the Bank’s business model is to hold these investments to collect the contractual cash flow, and the contractual terms give rise on specified dates to cash flows that are solely payments of principal and interest, are recognised at amortised cost. The fair value of these loans was calculated using Level 3 inputs by discounting the cash flows at a year-end interest rate applicable to each loan and further discounting the value by an internal measure of credit risk. Debts evidenced by certificates represents the Bank’s borrowings raised through the issuance of commercial paper and bonds.49 The fair value of the Bank’s issued bonds is determined using discounted cash flow models and therefore relies on Level 3 inputs. Due to
49 Adjusted for hedge accounting as applicable.
Financial liabilities at 31 December 2015
Held for trading € million
At fair value through profit
or loss € million
Derivatives held for hedging
purposes € million
Financial liabilities at
amortised cost
€ million
Carrying amount € million
Fair value € million
Amounts owed to credit institutions - - - (2,590) (2,590) (2,590) Debts evidenced by certificates - - - (34,280) (34,280) (34,191) Derivative financial instruments (357) (77) (2,559) - (2,993) (2,993) Other financial liabilities - - - (577) (577) (577) Total financial liabilities (357) (77) (2,559) (37,447) (40,440) (40,351)

52 EBRD Financial Report 2016
the short-tenor nature of commercial paper, amortised cost approximates fair value. The fair value of the Bank’s issued commercial paper is determined based on the observable market valuation of similar assets and liabilities and therefore relies on Level 2 inputs.
The table below provides information at 31 December 2016 about the Bank’s financial assets and financial liabilities measured at fair value. Financial assets and financial liabilities are classified in their entirety based on the lowest level input that is significant to the fair value measurement.
At 31 December 2016
Level 1 € million
Level 2 € million
Level 3 € million
Total € million
Debt securities - 926 - 926 Derivative financial instruments - 3,742 577 4,319 Banking loans - - 313 313 Share investments (Banking portfolio) 1,810 - 3,455 5,265 Share investments (Treasury portfolio) - 75 - 75 Total financial assets at fair value 1,810 4,743 4,345 10,898 Derivative financial instruments - (2,119) (51) (2,170) Total financial liabilities at fair value - (2,119) (51) (2,170)
At 31 December 2015
Level 1 € million
Level 2 € million
Level 3 € million
Total € million
Debt securities - 747 - 747 Derivative financial instruments - 4,098 498 4,596 Banking loans - - 339 339 Share investments (Banking portfolio) 1,819 - 3,214 5,033 Share investments (Treasury portfolio) - 63 - 63 Total financial assets at fair value 1,819 4,908 4,051 10,778 Derivative financial instruments - (2,915) (78) (2,993) Total financial liabilities at fair value - (2,915) (78) (2,993)
There have been no transfers between Level 1 and Level 2 during the year.

EBRD Financial Report 2016 53
The table below provides a reconciliation of the fair values of the Bank’s Level 3 financial assets and financial liabilities for the year ended 31 December 2016.
Derivative financial
instruments € million
Banking loans € million
Banking share investments € million
Total assets € million
Derivative financial
instruments € million
Total liabilities € million
Balance at 31 December 2015 498 339 3,214 4,051 (78) (78) Total gains/(losses) for the year ended 31 December 2016 in: Net profit/(loss) 180 48 (250) (22) 27 27 Deferred profit 25 - - 25 - - Purchases/issues - 108 746 854 - - Sales/settlements (126) (233) (303) (662) - - Write offs - - (25) (25) - - Reclassification - 51 (8) 43 - - Transfers out of Level 3 - - 81 81 - - Balance at 31 December 2016 577 313 3,455 4,345 (51) (51) Total gains/(losses) for the period included in net profit from assets and liabilities held at 31 December 2016 260 38 (147) 151 (48) (48)
Transfers into and out of Level 3 for Banking share investments relate to listed investments that switch from/(to) an actively traded market. Transfers into and out of Level 3 for derivative financial instruments relate to whether a model used to value a derivative is based on observable market inputs or otherwise.
Derivative financial
instruments € million
Banking loans € million
Banking share investments € million
Total assets € million
Derivative financial
instruments € million
Total liabilities € million
Balance at 31 December 2014 515 338 3,387 4,240 (82) (82) Total gains/(losses) for the year ended 31 December 2015 in: Net profit/(loss) 14 (44) (174) (204) 4 4 Purchases/issues 62 61 693 816 - - Sales/settlements (93) (44) (626) (763) - - Reclassification - 28 (28) - - - Transfers in to Level 3 - - (38) (38) - - Balance at 31 December 2015 498 339 3,214 4,051 (78) (78) Total gains/(losses) for the period included in net profit for assets and liabilities held at 31 December 2015 24 45 (46) 23 7 7

54 EBRD Financial Report 2016
Level 3 – sensitivity analysis The table below presents the Level 3 financial instruments carried at fair value at 31 December 2016, the main valuation models/techniques50 used in the valuation of these financial instruments and the estimated increases or decreases in fair value based on reasonably possible alternative assumptions:
Impact on net profit in 2016
Main valuation models/techniques
Carrying amount € million
Favourable change € million
Unfavourable change € million
Treasury derivative financial instruments
DCF models 9 - (1)
Banking loans DCF and option pricing models 313 11 (20) Banking share investments & associated derivatives51
NAV and EBITDA multiples, DCF models, compounded interest and option pricing models 3,972 520 (573)
At 31 December 4,294 531 (594)
Impact on net profit in 2015
Main valuation models/techniques
Carrying amount € million
Favourable change € million
Unfavourable change € million
Treasury derivative financial instruments
DCF models 8 - (1)
Banking loans DCF and option pricing models 339 10 (16) Banking share investments & associated derivatives
NAV and EBITDA multiples, DCF models, compounded interest and option pricing models 3,626 610 (528)
At 31 December 3,973 620 (545)
Treasury debt securities and derivative financial instruments The Bank’s derivative instruments held within the Treasury portfolio are valued through DCF models. Valuations are reconciled to counterparty statements on a daily basis. Therefore the reasonable possible alternative valuations have been determined based on the range of discrepancies between the Bank’s valuations and those of our counterparties.
The Bank’s debt securities are priced via a third party market data service, screen-based services such as Bloomberg or using broker quotes.
Banking loans Banking loans at fair value through profit or loss mainly comprise convertible loans or loans with an element of performance-based return. The valuation models/techniques used to fair value these instruments are DCF models and option pricing models. The inputs into the models include interest rates, the borrower’s credit spreads and underlying equity prices. Reasonable possible alternative valuations have been determined based on the borrower’s probability of default.
Banking share investments and derivatives The Bank’s unlisted equity portfolio comprises direct share investments, equity derivatives and equity funds. The main valuation models/techniques used to fair value these financial instruments are NAV multiples, EBITDA multiples and DCF models.
NAV multiples are most commonly applied to bank investments and equity funds. Reasonable possible alternative valuations have been determined based on the NAV multiple ranges in the valuations received for bank investments, and by considering the impact of adjusting the portfolio discount applied to equity funds. For investments valued using EBITDA multiples and DCF models, sensitivity analysis was performed by determining reasonable alternative valuations using sales, EBITDA, price-to-earnings multiples methods, as well as industry specific methods like multiples based on production capacities. Recent transactions within sectors were also considered where available. Further, within a given method valuation ranges were determined by using bottom and top quartile multiples. For DCF models sensitivity analysis was performed by changing certain underlying assumptions (for example, an increase or decrease in the discount rate).
50 NAV = net asset value; EBITDA = earnings before interest, tax, depreciation and amortisation; DCF = discounted cash flow. 51 Banking share investments typically have an attached put and/or call option derivative. As such, any change in the underlying value of the equity may be offset
by the change in the value of the derivative. For this reason, Banking share investments and the associated derivatives have been combined for the sensitivity analysis.
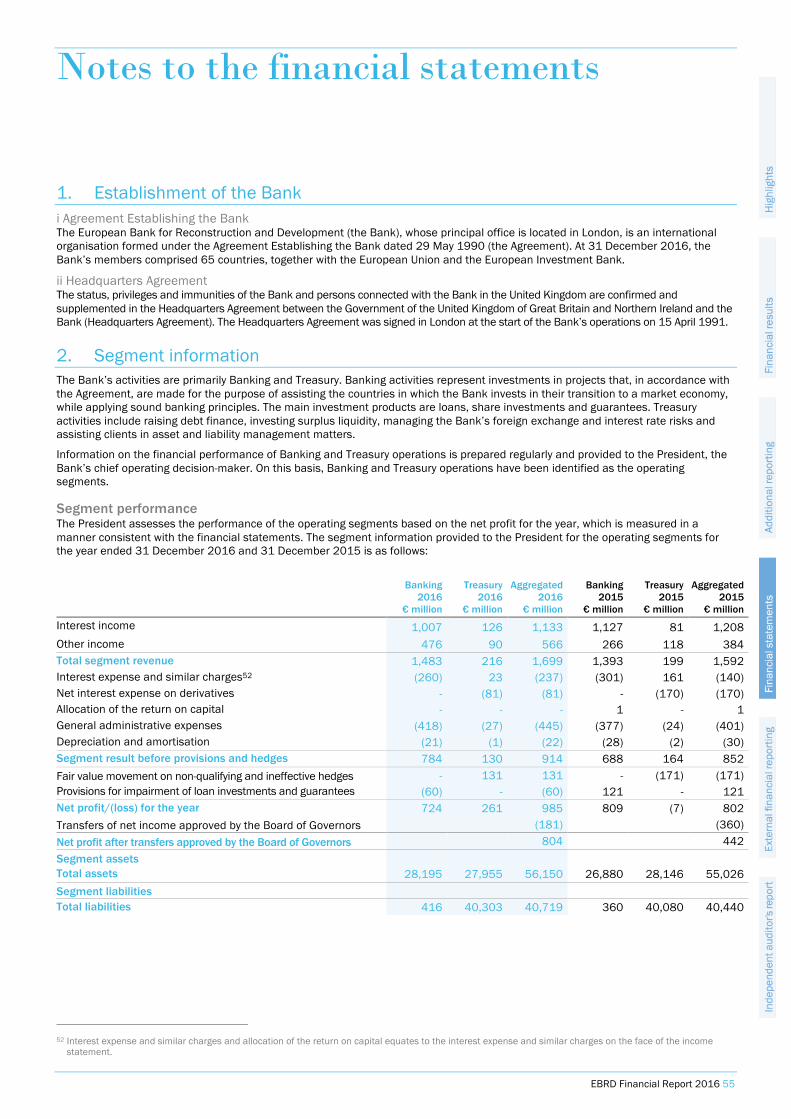
Notes to the financial statements
EBRD Financial Report 2016 55
1. Establishment of the Bank i Agreement Establishing the Bank The European Bank for Reconstruction and Development (the Bank), whose principal office is located in London, is an international organisation formed under the Agreement Establishing the Bank dated 29 May 1990 (the Agreement). At 31 December 2016, the Bank’s members comprised 65 countries, together with the European Union and the European Investment Bank.
ii Headquarters Agreement The status, privileges and immunities of the Bank and persons connected with the Bank in the United Kingdom are confirmed and supplemented in the Headquarters Agreement between the Government of the United Kingdom of Great Britain and Northern Ireland and the Bank (Headquarters Agreement). The Headquarters Agreement was signed in London at the start of the Bank’s operations on 15 April 1991.
2. Segment information The Bank’s activities are primarily Banking and Treasury. Banking activities represent investments in projects that, in accordance with the Agreement, are made for the purpose of assisting the countries in which the Bank invests in their transition to a market economy, while applying sound banking principles. The main investment products are loans, share investments and guarantees. Treasury activities include raising debt finance, investing surplus liquidity, managing the Bank’s foreign exchange and interest rate risks and assisting clients in asset and liability management matters.
Information on the financial performance of Banking and Treasury operations is prepared regularly and provided to the President, the Bank’s chief operating decision-maker. On this basis, Banking and Treasury operations have been identified as the operating segments.
Segment performance The President assesses the performance of the operating segments based on the net profit for the year, which is measured in a manner consistent with the financial statements. The segment information provided to the President for the operating segments for the year ended 31 December 2016 and 31 December 2015 is as follows:
52 Interest expense and similar charges and allocation of the return on capital equates to the interest expense and similar charges on the face of the income
statement.
Banking 2016
€ million
Treasury 2016
€ million
Aggregated2016
€ million
Banking 2015
€ million
Treasury
2015 € million
Aggregated2015
€ million
Interest income 1,007 126 1,133 1,127 81 1,208 Other income 476 90 566 266 118 384 Total segment revenue 1,483 216 1,699 1,393 199 1,592 Interest expense and similar charges52 (260) 23 (237) (301) 161 (140) Net interest expense on derivatives - (81) (81) - (170) (170) Allocation of the return on capital - - - 1 - 1 General administrative expenses (418) (27) (445) (377) (24) (401) Depreciation and amortisation (21) (1) (22) (28) (2) (30) Segment result before provisions and hedges 784 130 914 688 164 852 Fair value movement on non-qualifying and ineffective hedges - 131 131 - (171) (171) Provisions for impairment of loan investments and guarantees (60) - (60) 121 - 121 Net profit/(loss) for the year 724 261 985 809 (7) 802 Transfers of net income approved by the Board of Governors (181) (360) Net profit after transfers approved by the Board of Governors 804 442 Segment assets Total assets 28,195 27,955 56,150 26,880 28,146 55,026 Segment liabilities Total liabilities 416 40,303 40,719 360 40,080 40,440

56 EBRD Financial Report 2016
Segment revenues – Geographic The Bank’s activities are divided into six regions for internal management purposes.
Revenues are attributed to countries on the basis of the location in which a project operates.
3. Net interest income
2016
€ million 2015
€ million
Interest income accrued on impaired financial assets during 2016 was €31 million (2015: €30 million).56
53 Advanced countries are Croatia, Czech Republic, Estonia, Hungary, Latvia, Lithuania, Poland, Slovak Republic and Slovenia. 54 Early/Intermediate countries are Albania, Armenia, Azerbaijan, Belarus, Bosnia and Herzegovina, Bulgaria, Cyprus, Former Yugoslav Republic of Macedonia,
Georgia, Kazakhstan, Kosovo, Kyrgyz Republic, Moldova, Mongolia, Montenegro, Romania, Serbia, Tajikistan, Turkmenistan, Ukraine and Uzbekistan. 55 Other member countries of the Organisation for Economic Co-operation and Development which are not classed as Advanced or Early/Intermediate.
www.oecd.org/about/membersandpartners/ 56 This interest income equates to the unwinding of the discount on expected future cash flows from impaired financial assets.
Segment revenue
2016 € million
Segment revenue
2015 € million
Advanced countries53 163 207 Early/Intermediate countries54 604 527 Russia 497 503 SEMED 57 43 Turkey 162 113 OECD55 216 199 Total 1,699 1,592
Banking loans at amortised cost 1,007 1,127 Debt securities 75 54 Reverse repurchase agreements 3 1 Cash and short-term funds 46 26 Other 2 - Interest and similar income 1,133 1,208 Debts evidenced by certificates (194) (111) Amounts owed to credit institutions (42) (27) Other (1) (1) Interest expense and similar charges (237) (139) Net interest expense on derivatives (81) (170) Net interest income 815 899

EBRD Financial Report 2016 57
4. Net fee and commission income The main components of net fee and commission income are as follows:
2016
€ million 2015
€ million Trade finance fees 8 14 Syndication and agency fees 4 11 Administration fees 5 4 Prepayment fees 4 3 Front end and commitment charges 3 - Other 3 (1) Equity fees 2 (3) Net fee and commission income 29 28
Front-end, appraisal and commitment fees of €117 million (2015: €109 million) received in 2016, together with related direct costs of €4 million (2015: €6 million), have been deferred on the balance sheet. They will be recognised in interest income over the period from disbursement to repayment of the related loan, in accordance with IAS 18. In 2016, €90 million (2015: €160 million) of previously deferred fees and direct costs were recognised in interest income.
5. Net gains from share investments at fair value through profit or loss
On exit of an equity investment, the cumulative gain/loss is realised with a corresponding reversal of the cumulative unrealised gain/loss recorded prior to the exit.
6. Net gains/(losses) from loans at fair value through profit or loss
7. Net gains from Treasury assets held at amortised cost
During the year the Bank sold €1.3 billion of debt securities held at amortised cost (2015: €1.1 billion).
2016
€ million 2015
€ million Net realised gains from share investments and equity related derivatives 21 250 Net unrealised gains/(losses) from share investments and equity related derivatives 305 (53) Net gains from share investments at fair value through profit or loss 326 197
2016
€ million 2015
€ million Loan write-off - (1) Net unrealised gains/(losses) from changes in fair value 8 (43) Net unrealised foreign exchange gains 1 - Net gains/(losses) from loans at fair value through profit or loss 9 (44)
2016
€ million 2015
€ million Net realised gains from debt securities at amortised cost 6 4 Net gains from Treasury assets held at amortised cost 6 4
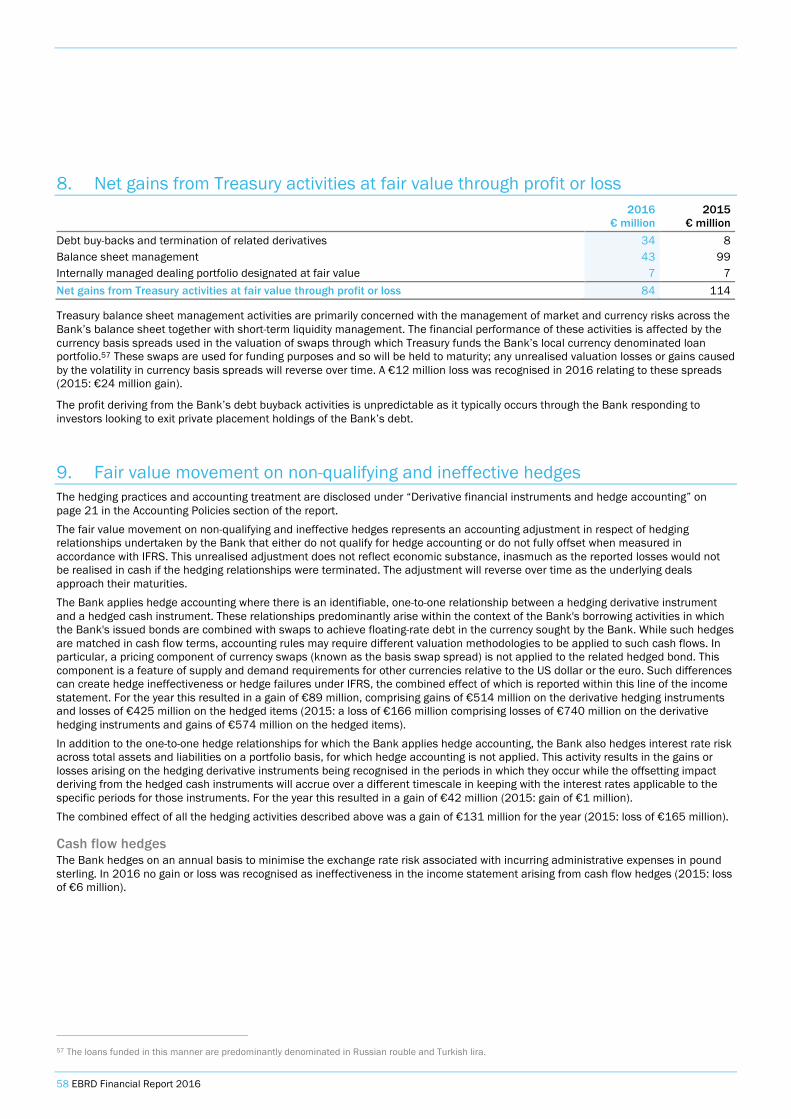
58 EBRD Financial Report 2016
8. Net gains from Treasury activities at fair value through profit or loss
Treasury balance sheet management activities are primarily concerned with the management of market and currency risks across the Bank’s balance sheet together with short-term liquidity management. The financial performance of these activities is affected by the currency basis spreads used in the valuation of swaps through which Treasury funds the Bank’s local currency denominated loan portfolio.57 These swaps are used for funding purposes and so will be held to maturity; any unrealised valuation losses or gains caused by the volatility in currency basis spreads will reverse over time. A €12 million loss was recognised in 2016 relating to these spreads (2015: €24 million gain).
The profit deriving from the Bank’s debt buyback activities is unpredictable as it typically occurs through the Bank responding to investors looking to exit private placement holdings of the Bank’s debt.
9. Fair value movement on non-qualifying and ineffective hedges The hedging practices and accounting treatment are disclosed under “Derivative financial instruments and hedge accounting” on page 21 in the Accounting Policies section of the report. The fair value movement on non-qualifying and ineffective hedges represents an accounting adjustment in respect of hedging relationships undertaken by the Bank that either do not qualify for hedge accounting or do not fully offset when measured in accordance with IFRS. This unrealised adjustment does not reflect economic substance, inasmuch as the reported losses would not be realised in cash if the hedging relationships were terminated. The adjustment will reverse over time as the underlying deals approach their maturities. The Bank applies hedge accounting where there is an identifiable, one-to-one relationship between a hedging derivative instrument and a hedged cash instrument. These relationships predominantly arise within the context of the Bank's borrowing activities in which the Bank's issued bonds are combined with swaps to achieve floating-rate debt in the currency sought by the Bank. While such hedges are matched in cash flow terms, accounting rules may require different valuation methodologies to be applied to such cash flows. In particular, a pricing component of currency swaps (known as the basis swap spread) is not applied to the related hedged bond. This component is a feature of supply and demand requirements for other currencies relative to the US dollar or the euro. Such differences can create hedge ineffectiveness or hedge failures under IFRS, the combined effect of which is reported within this line of the income statement. For the year this resulted in a gain of €89 million, comprising gains of €514 million on the derivative hedging instruments and losses of €425 million on the hedged items (2015: a loss of €166 million comprising losses of €740 million on the derivative hedging instruments and gains of €574 million on the hedged items). In addition to the one-to-one hedge relationships for which the Bank applies hedge accounting, the Bank also hedges interest rate risk across total assets and liabilities on a portfolio basis, for which hedge accounting is not applied. This activity results in the gains or losses arising on the hedging derivative instruments being recognised in the periods in which they occur while the offsetting impact deriving from the hedged cash instruments will accrue over a different timescale in keeping with the interest rates applicable to the specific periods for those instruments. For the year this resulted in a gain of €42 million (2015: gain of €1 million). The combined effect of all the hedging activities described above was a gain of €131 million for the year (2015: loss of €165 million).
Cash flow hedges The Bank hedges on an annual basis to minimise the exchange rate risk associated with incurring administrative expenses in pound sterling. In 2016 no gain or loss was recognised as ineffectiveness in the income statement arising from cash flow hedges (2015: loss of €6 million).
57 The loans funded in this manner are predominantly denominated in Russian rouble and Turkish lira.
2016
€ million 2015
€ million Debt buy-backs and termination of related derivatives 34 8 Balance sheet management 43 99 Internally managed dealing portfolio designated at fair value 7 7 Net gains from Treasury activities at fair value through profit or loss 84 114

EBRD Financial Report 2016 59
10. Provisions for impairment of Banking loan investments at amortised cost
11. General administrative expenses
The Bank’s expenses are predominantly incurred in pound sterling. The pound sterling equivalent of the Bank’s general administrative expenses, excluding depreciation and amortisation, totalled £326 million (2015: £308 million). Direct costs of €4 million (2015: €6 million) relating to loan origination in 2016 have been deferred on the balance sheet in accordance with IAS 18. These figures will be recognised in interest income over the period from disbursement to repayment of the related loans.
58 The net release of general provisions on sovereign and non-sovereign loan investments in 2015 of €337 million included a one-off release of €329 million due
to a change in estimation techniques. 59 Comprised of €192 million of new provisions against €128 million of released provisions (2015: €266 million against €57 million respectively). 60 Provisions raised in the non-euro currencies create foreign exchange exposures which Treasury hedges. To the extent these hedges are transacted at different
rates to the rates applied by the Bank’s accounting system to translate the provisions into the euro equivalent amounts, the difference is recognised as part of the overall provision charge in the income statement.
61 Excludes provisions for guarantees which are recorded in other assets.
(Charge)/release for the year 2016
€ million 2015
€ million Portfolio provisions for unidentified impairment of loan investments58
Non-sovereign loan investments 3 329 Sovereign loan investments 4 8
Specific provisions for identified impairment of loan investments59 (64) (209) Associated hedging costs60 - (8) Provisions for impairment of Banking loan investments at amortised cost (57) 120
Movement in provisions 2016
€ million 2015
€ million At 1 January (1,083) (1,209)
(Charge)/release for the year to the income statement61 (57) 128 Reversal of accrued interest income on newly impaired loans 3 - Loans sold - 20 Unwinding of the discount relating to identified impairment of assets 29 27 Foreign exchange adjustments (15) (89) Release against amounts written off 79 40 At 31 December (1,044) (1,083)
Analysed between Portfolio provisions for unidentified impairment of loan investments: Non-sovereign loan investments (250) (252) Sovereign loan investments (29) (32) Specific provisions for identified impairment of loan investments (765) (799) At 31 December (1,044) (1,083)
2016
€ million 2015
€ million Personnel costs (311) (292) Overhead expenses (138) (115) General administrative expenses (449) (407) Deferral of direct costs related to loan origination 4 6 Net general administrative expenses (445) (401)

60 EBRD Financial Report 2016
The following fees for work performed by the Bank’s external auditor were included in overhead expenses:
The fall in the fees for audit and assurance services paid to the Bank’s external auditor from 2015 to 2016 is attributable to movements in the value of pound sterling. The pound sterling equivalent of these fees increased to £402,000 (2015: £397,000).
12. Placements with and advances to credit institutions
Cash and cash equivalents are those placements and advances which have an original tenor equal to, or less than, three months. “Current” is defined as those assets maturing, or liabilities due, within the next 12 months. All other assets or liabilities are “non-current”.
13. Debt securities
2016
€ million 2015
€ million Debt securities at fair value through profit or loss 926 747 Debt securities at amortised cost 8,981 11,329 At 31 December 9,907 12,076 Analysed between Current 3,394 5,178 Non-current 6,513 6,898 At 31 December 9,907 12,076
There were no impairment losses relating to debt securities in 2016 (2015: €nil).
Audit and assurance services 2016 € 000
2015 € 000
Services as auditor of the Bank (308) (345) Internal controls framework assurance (147) (164) Retirement plan audit (25) (28) Tax recovery audit (12) (13) Audit and assurance services (492) (550)
Analysed between 2016
€ million 2015
€ million Cash and cash equivalents 8,517 7,533 Other current placements and advances 5,593 4,191 At 31 December 14,110 11,724

EBRD Financial Report 2016 61
14. Other financial assets
2016
€ million 2015
€ million Fair value of derivatives designated as fair value hedges 2,931 3,072 Fair value of portfolio derivatives not designated as hedges 821 1,035 Fair value of derivatives held in relation to the banking portfolio 567 489 Interest receivable 218 231 Paid-in capital receivable 12 12 Other (16) 92 At 31 December 4,533 4,931 Analysed between Current 954 1,334 Non-current 3,579 3,597 At 31 December 4,533 4,931
Included within “Other” above are deferred fair value amounts related to banking derivative instruments that have a determinable return. Specifically, these relate to banking derivatives that are valued using valuation techniques other than observable market data. On initial recognition, the difference between the transaction price and the value derived from the valuation technique is deferred. These amounts are recognised in profit when market data becomes observable, when the underlying equity is exited or when the derivative is either exercised or attributed with no value. At 31 December 2016, net gains of €112 million were deferred, the deferred gains being a negative adjustment to the balance sheet (2015: €88 million).
15. Banking loan investments at amortised cost
2016 Sovereign
loans € million
2016 Non-sovereign
loans € million
2016 Total loans
€ million
2015 Sovereign
loans € million
2015 Non-sovereign
loans € million
2015 Total loans
€ million At 1 January 3,033 18,784 21,817 2,920 17,438 20,358
Movement in fair value revaluation62 - 21 21 - (14) (14) Disbursements 2,185 7,561 9,746 519 7,163 7,682 Repayments and prepayments (1,230) (7,646) (8,876) (485) (6,289) (6,774) Foreign exchange movements 23 262 285 71 496 567 Movement in net deferral of front end fees and related direct costs (13) (9) (22) 8 49 57
Reclassification - (7) (7) - - - Written off - (79) (79) - (59) (59) At 31 December 3,998 18,887 22,885 3,033 18,784 21,817 Impairment at 31 December (29) (1,015) (1,044) (32) (1,051) (1,083) Total net of impairment at 31 December 3,969 17,872 21,841 3,001 17,733 20,734
Analysed between Current 2,981 2,899 Non-current 18,860 17,835 Total net of impairment at 31 December 3,969 17,872 21,841 3,001 17,733 20,734
At 31 December 2016 the Bank categorised 101 loan investments at amortised cost as impaired, with operating assets totalling €1.2 billion (2015: 85 loans totalling €1.2 billion).
62 This movement in fair value relates to a hedge adjustment to fixed rate loans that qualify for hedge accounting for interest rate risk.

62 EBRD Financial Report 2016
16. Banking loan investments at fair value through profit or loss
17. Share investments at fair value through profit or loss
2016 Fair value
Unlisted € million
2016 Fair value
Listed € million
2016 Fair value
Total € million
2015 Fair value
Unlisted € million
2015 Fair value
Listed € million
2015 Fair value
Total € million
Outstanding disbursements At 1 January 4,162 1,966 6,128 4,120 2,065 6,185 Transfer between unlisted and listed (179) 179 - (77) 77 - Disbursements 709 65 774 665 417 1,082 Disposals (421) (314) (735) (466) (593) (1,059) Reclassification (25) - (25) (28) - (28) Written off (8) - (8) (52) - (52) At 31 December 4,238 1,896 6,134 4,162 1,966 6,128 Fair value adjustment At 1 January (1,068) (27) (1,095) (1,165) 49 (1,116) Transfer between unlisted and listed 63 (63) - 39 (39) - Movement in fair value revaluation (75) 301 226 58 (37) 21 At 31 December (1,080) 211 (869) (1,068) (27) (1,095) Fair value at 31 December 3,158 2,107 5,265 3,094 1,939 5,033
Summarised financial information on share investments where the Bank owned greater than, or equal to, 20 per cent of the investee share capital at 31 December 2016 (venture capital associates), is detailed under note 29, “Related parties” on page 74.
18. Treasury share investments at fair value through other comprehensive income Treasury holds two strategic share investments for the purposes of accessing hedging and risk management products in the currencies of underdeveloped markets. These are in the Currency Exchange Fund N.V. and the Frontier Clearing Fund. The Bank also has a purely nominal shareholding in SWIFT as membership is required to participate in this international payments system.
2016
€ million 2015
€ million Share investment designated at fair value through other comprehensive income
The Currency Exchange Fund N.V. 67 55 The Frontier Clearing Fund 8 8 SWIFT - - At 31 December 75 63
No dividend income was received on these share investments during 2016 (2015: €nil).
Non-sovereign loans 2016
€ million 2015
€ million At 1 January 339 338 Movement in fair value revaluation 13 (44) Disbursements 108 61 Repayments and prepayments (233) (44) Foreign exchange movements 35 - Reclassification 51 28 At 31 December 313 339 Analysed between Current 31 36 Non-current 282 303 At 31 December 313 339

EBRD Financial Report 2016 63
19. Intangible assets
20. Property, technology and office equipment
Computer software development costs 2016
€ million Computer software development costs 2015
€ million Cost At 1 January 102 216 Additions 16 38 Disposals (3) (152) At 31 December 115 102 Amortisation At 1 January (39) (173) Charge (13) (18) Disposals - 152 At 31 December (52) (39) Net book value at 31 December 63 63
Property 2016
€ million
Property under
construction 2016
€ million
Technology and office equipment
2016 € million
Total 2016
€ million
Property 2015
€ million
Property under
construction 2015
€ million
Technology and office equipment
2015 € million
Total 2015
€ million Cost At 1 January 65 15 18 98 67 2 16 85 Additions 4 3 2 9 8 13 3 24 Transfers 13 (13) - - - - - - Disposals (5) (5) (2) (12) (10) - (1) (11) At 31 December 77 - 18 95 65 15 18 98 Depreciation At 1 January (35) - (13) (48) (33) - (12) (45) Charge (8) - (1) (9) (10) - (2) (12) Disposals 4 - 1 5 8 - 1 9 At 31 December (39) - (13) (52) (35) - (13) (48) Net book value at 31 December 38 - 5 43 30 15 5 50

64 EBRD Financial Report 2016
21. Borrowings
22. Debts evidenced by certificates The Bank’s outstanding debts evidenced by certificates and related fair value hedging swaps are summarised below, both in the currency of the bond and the currency obtained after currency swap hedges have been taken into account.
Bond denominations 2016
€ million
Currency after swap 2016
€ million
Bond denominations 2015
€ million
Currency after swap 2015
€ million Armenian dram - - (4) - Australian dollar (810) - (763) - Canadian dollar (34) - (32) - Euro (3,553) (5,968) (3,255) (4,477) Georgian lari (47) (47) (29) (29) Japanese yen (1,985) - (1,307) - Kazakh tenge (200) (200) - - Mexican peso (120) - (140) - New Turkish lira (768) - (1,236) - New Zealand dollar (15) - (14) - Norwegian krone (100) - (97) - Pound sterling (2,534) (1,609) (3,650) (2,727) Romanian leu (57) (26) (59) (22) Russian rouble (653) (202) (544) (233) Serbian dinar (20) (20) - - Slovak koruna (43) - (43) - South African rand (403) - (287) - Swiss franc - - (1) - United States dollar (24,189) (27,459) (22,819) (26,792) At 31 December (35,531) (35,531) (34,280) (34,280)
Where the swap counterparty exercises a right to terminate the hedging swap prior to legal maturity, the Bank is committed to exercise the same right with its issued bond.
Analysed between 2016
€ million 2015
€ million Current (11,692) (8,714) Non-current (23,839) (25,566) Debts evidenced by certificates at 31 December (35,531) (34,280)
During the year the Bank redeemed €1.6 billion of bonds and medium-term notes prior to maturity (2015: €0.5 billion), generating a net gain of €34 million (2015: €8 million).
63 See note 30 on page 75 for details of third parties.
2016
€ million 2015
€ million Amounts owed to credit institutions and other third parties Amounts owed to credit institutions (420) (264) Amounts held as collateral (1,343) (1,387) Amounts managed on behalf of third parties63 (715) (939) At 31 December (2,478) (2,590) Of which current: (2,478) (2,590)

EBRD Financial Report 2016 65
23. Other financial liabilities
2016
€ million 2015
€ million Fair value of derivatives designated as fair value hedges (1,715) (2,559) Fair value of derivatives designated as cash flow hedges (2) - Fair value of portfolio derivatives not designated as hedges (403) (357) Fair value of other derivatives held in relation to the banking portfolio (50) (77) Interest payable (157) (283) Net income allocations payable (220) (115) Other (163) (179) At 31 December (2,710) (3,570)
24. Subscribed capital
2016 Number of
shares
2016 Total
€ million
2015 Number of
shares
2015 Total
€ million Authorised shared capital 3,000,000 30,000 3,000,000 30,000 of which Subscriptions by members – initial capital 994,055 9,941 993,055 9,931 Subscriptions by members – first capital increase 989,055 9,891 988,055 9,881 Subscriptions by members – second capital increase 987,225 9,871 986,325 9,862 Subscribed capital 2,970,335 29,703 2,967,435 29,674 Unsubscribed capital 29,665 297 32,565 326 At 31 December 3,000,000 30,000 3,000,000 30,000
The Bank’s capital stock is divided into paid-in shares and callable shares. Each share has a par value of €10,000. At the Bank’s Annual Meeting in May 2010, the Board of Governors approved a two-step increase in the authorised capital stock of the Bank: a €1.0 billion increase in authorised paid-in shares and a €9.0 billion increase in authorised callable capital shares, amounting to a €10.0 billion aggregate increase in the authorised capital stock of the Bank (collectively referred to as the second capital increase). Resolution No. 126 authorised the increase in authorised capital stock by 100,000 paid-in shares, each share having a par value of €10,000, taking the authorised capital stock of the Bank to €21.0 billion. Resolution No. 128 authorised the increase in the authorised capital stock of the Bank by 900,000 callable shares, each share having a par value of €10,000. These shares were originally subject to redemption in accordance with the terms of Resolution No. 128, but such provisions were removed under the terms of Resolution No. 183 approved by the Board of Governors at the 2015 Annual Meeting. The increase in callable capital became effective in April 2011. Payment for the paid-in shares issued as part of the original authorised capital stock, and as part of the first capital increase and subscribed to by members, is made over a period of years determined in advance. Payment for the paid-in shares issued under the second capital increase was by way of a reallocation of net income previously allocated to surplus for other purposes, namely for the payment of such paid-in shares, pursuant to Article 36.1 of the Agreement and approved by Board of Governors Resolution No. 126, dated 14 May 2010. Article 6.4 of the Agreement states that payment of the amount subscribed to the callable capital is subject to call by the Bank, taking account of Articles 17 and 42 of the Agreement, only as and when required by the Bank to meet its liabilities. Article 42.1 states that in the event of the termination of the Bank’s operations, the liability of all members for all uncalled subscriptions to the capital stock will continue until all claims of creditors, including all contingent claims, have been discharged. The Agreement allows for a member to withdraw from the Bank, in which case the Bank is required to repurchase the former member’s shares. No member has ever withdrawn its membership. The stability in the membership reflects the fact that the members are 65 countries and two inter-governmental organisations, and that the purpose of the Bank is to foster the transition process in politically qualifying countries from central Europe to Central Asia and the SEMED region.
Analysed between 2016
€ million 2015
€ million Current (1,043) (1,625) Non-current (1,667) (1,945) At 31 December (2,710) (3,570)

66 EBRD Financial Report 2016
Moreover, there is a financial disincentive to withdrawing membership. The upper limit of the amount of the repurchase price of the former member’s shares is the amount of its paid-in capital, yet a former member remains liable for its direct obligations and its contingent liabilities to the Bank for as long as any part of the loans, share investments or guarantees contracted before it ceased to be a member are outstanding. Were a member to withdraw from the Bank, the Bank would be able to impose conditions and set dates in respect of payments for shares repurchased. If, for example, paying a former member would have adverse consequences for the Bank’s financial position, the Bank could defer payment until the risk had passed, and indefinitely if appropriate. If a payment was then made to a former member, the member would be required to repay, on demand, the amount by which the repurchase price would have been reduced if the losses for which the former member remained liable had been taken into account at the time of payment. Under the Agreement, payment for the paid-in shares of the initial capital stock subscribed to by members was made in five equal annual instalments. Of each instalment, up to 50 per cent was payable in non-negotiable, non-interest-bearing promissory notes or other obligations issued by the subscribing member and payable to the Bank at par value upon demand. Under Resolution No. 59, payment for the paid-in shares subscribed to by members under the first capital increase was made in eight equal annual instalments. Under Resolution No. 126, payment for the paid-in shares issued to members under the second capital increase was made in one instalment immediately following approval of Resolution No. 126.
On 15 January 2016, the People’s Republic of China was admitted to membership of the Bank, subscribing to 2,900 shares of the Bank’s capital stock. This stock consisted of 1,000 shares from initial capital (700 callable shares and 300 paid-in), 1,000 shares from the first capital increase (775 callable shares and 225 paid-in), and 900 shares from the second tranche of the second capital increase (all callable shares). A capital contribution of €5.25 million was made for the paid-in shares. A statement of capital subscriptions showing the amount of paid-in and callable shares subscribed to by each member, together with the amount of unallocated shares and votes, is set out in the following table. Under Article 29 of the Agreement, the voting rights of members that have failed to pay any part of the amounts due in respect of their capital subscription are proportionately reduced until payment is made.

EBRD Financial Report 2016 67
Statement of capital subscriptions
64 The voting power of members who have failed to pay any part of the amount due in respect of their obligations in relation to paid-in shares has been adjusted
down by a percentage corresponding to the percentage which the unpaid amount due bears to the total amount of paid-in shares subscribed to by that member. Consequently the overall number of exercisable votes is lower than the total amount of subscribed shares.
At 31 December 2016 Members
Total shares (number)
Resulting votes64
(number)
Total capital € million
Callable capital € million
Paid-in capital € million
Albania 3,001 2,511 30 24 6 Armenia 1,499 1,499 15 12 3 Australia 30,014 30,014 300 237 63 Austria 68,432 68,432 684 541 143 Azerbaijan 3,001 3,001 30 24 6 Belarus 6,002 6,002 60 47 13 Belgium 68,432 68,432 684 541 143 Bosnia and Herzegovina 5,071 5,071 51 40 11 Bulgaria 23,711 23,711 238 188 50 Canada 102,049 102,049 1,020 807 213 China 2,900 2,900 29 24 5 Croatia 10,942 10,942 109 86 23 Cyprus 3,001 3,001 30 24 6 Czech Republic 25,611 25,611 256 203 53 Denmark 36,017 36,017 360 285 75 Egypt 2,101 2,101 21 15 6 Estonia 3,001 3,001 30 24 6 European Investment Bank 90,044 90,044 900 712 188 European Union 90,044 90,044 900 712 188 Finland 37,518 37,518 375 297 78 Former Yugoslav Republic of Macedonia 1,762 1,762 17 13 4 France 255,651 255,651 2,557 2,024 533 Georgia 3,001 3,001 30 24 6 Germany 255,651 255,651 2,557 2,024 533 Greece 19,508 19,508 195 154 41 Hungary 23,711 23,711 237 188 49 Iceland 3,001 3,001 30 24 6 Ireland 9,004 9,004 90 71 19 Israel 19,508 19,508 195 154 41 Italy 255,651 255,651 2,557 2,024 533 Japan 255,651 255,651 2,557 2,024 533 Jordan 986 986 10 8 2 Kazakhstan 6,902 6,902 70 55 15 Korea, Republic of 30,014 30,014 300 237 63 Kosovo 580 580 6 5 1 Kyrgyz Republic 2,101 1,010 21 15 6 Latvia 3,001 3,001 30 24 6 Liechtenstein 599 599 6 5 1 Lithuania 3,001 3,001 30 24 6 Luxembourg 6,002 6,002 60 47 13 Malta 210 210 2 1 1 Mexico 4,501 4,501 46 35 11 Moldova 3,001 2,781 30 24 6 Mongolia 299 299 3 2 1

68 EBRD Financial Report 2016
Statement of capital subscriptions
At 31 December 2016 Total shares
(number)
Resulting votes
(number)
Total capital € million
Callable capital € million
Paid-in capital € million
Montenegro 599 599 6 5 1 Morocco 1,478 1,478 15 11 4 Netherlands 74,435 74,435 744 589 155 New Zealand 1,050 1,050 11 7 4 Norway 37,518 37,518 375 297 78 Poland 38,418 38,418 384 304 80 Portugal 12,605 12,605 126 100 26 Romania 14,407 14,407 144 114 30 Russia 120,058 120,058 1,201 951 250 Serbia 14,031 14,031 140 111 29 Slovak Republic 12,807 12,807 128 101 27 Slovenia 6,295 6,295 63 50 13 Spain 102,049 102,049 1,020 807 213 Sweden 68,432 68,432 684 541 143 Switzerland 68,432 68,432 684 541 143 Tajikistan 2,101 602 21 15 6 Tunisia 986 986 10 8 2 Turkey 34,515 34,515 345 273 72 Turkmenistan 210 164 2 1 1 Ukraine 24,011 24,011 240 190 50 United Kingdom 255,651 255,651 2,557 2,024 533 United States of America 300,148 300,148 3,001 2,376 625 Uzbekistan 4,412 4,134 44 31 13 Capital subscribed by members 2,970,335 2,966,711 29,703 23,496 6,207

EBRD Financial Report 2016 69
25. Reserves and retained earnings
2016
€ million 2015
€ million Special reserve
At 1 January 306 306 At 31 December 306 306
Loan loss reserve At 1 January 1,159 738 Transferred from retained earnings 12 421 At 31 December 1,171 1,159
Net income allocation
At 1 January 10 1,952 Transferred from/(to) retained earnings 180 (1,582) Distributions (181) (360) At 31 December 9 10
General reserve – other reserve Revaluation reserve At 1 January 7 14 Net gains/(losses) arising on revaluation of share investments at fair value through other comprehensive income 12 (7) At 31 December 19 7
Hedging reserve – cash flow hedges At 1 January - - Losses from changes in fair value of hedges recognised in equity (2) - At 31 December (2) -
Other At 1 January 219 211 Internal tax for the year 6 8 At 31 December 225 219 General reserve – other reserve at 31 December 242 226
General reserve – retained earnings At 1 January 6,683 4,726 Net profit before transfers of net income approved by the Board of Governors 985 802 Transferred to loan loss reserve (12) (421) Transferred (to)/from net income allocation (180) 1,582 Actuarial gains/(losses) on defined benefit scheme 20 (6) General reserve retained earnings at 31 December 7,496 6,683
Total reserves and retained earnings at 31 December 9,224 8,384

70 EBRD Financial Report 2016
The special reserve is maintained, in accordance with Article 16 of the Agreement, for meeting certain defined losses of the Bank. The special reserve has been established, in accordance with the Bank’s financial policies, by setting aside 100 per cent of qualifying fees and commissions received by the Bank associated with loans, guarantees and underwriting the sale of securities. In 2011 the Board of Directors decided that for the foreseeable future the size of the special reserve was adequate. In 2005, the Bank created a loan loss reserve (LLR) within members’ equity, to set aside an amount of retained earnings equal to the difference between the impairment losses expected over the life of the loan portfolio and the amount recognised through the Bank’s income statement on an incurred loss basis. In 2015 in a one-off adjustment additional reserves of €660 million were moved to the LLR. In 2016 the LLR increased marginally by €12 million. The general reserve represents all reserves except those amounts allocated to the special and loan loss reserves and it primarily comprises retained earnings. It also includes the retention of internal tax paid in accordance with Article 53 of the Agreement. This requires that all Directors, Alternate Directors, officers and employees of the Bank are subject to an internal tax imposed by the Bank on salaries and emoluments paid by the Bank and which is retained for its benefit. At the end of the year internal tax amounted to €116 million (2015: €109 million). The hedging reserve includes foreign exchange revaluation amounts on designated hedging instruments held by the Bank for the purposes of hedging its estimated future pound sterling operating expenditure. At 31 December 2016 there was a loss of €2 million on these hedges. Revaluation gains or losses on these hedges are held in reserves until the related hedged expenditure is incurred at which time such gains or losses are released to profit or loss.
Reserves and retained earnings 2016
€ million 2015
€ million Special reserve 306 306 Loan loss reserve 1,171 1,159 Net income allocation 9 10 Contingent liability - 81 Unrealised gains 1,182 955 Total restricted reserves 2,668 2,511 Unrestricted general reserves 6,556 5,873 At 31 December 9,224 8,384
The Bank’s reserves are used to determine, in accordance with the Agreement, what part of the Bank’s net income will be allocated to surplus or other purposes and what part, if any, will be distributed to its members. For this purpose, the Bank uses unrestricted general reserves. Article 36 of the Agreement relates to the allocation and distribution of the Bank’s net income and states: “No such allocation, and no distribution, shall be made until the general reserve amounts to at least ten per cent of the authorised capital stock”. This figure is currently €3.0 billion (2015: €3.0 billion). During 2016, the Board of Governors approved the transfer of €181 million of net income to be allocated to other purposes. This amount was reflected in the 2016 income statement, below net profit from continuing operations. Under Resolution No. 195 2015 Net Income Allocation €140 million was allocated to the EBRD Shareholder Special Fund (including an amount of €35 million required to support the Bank’s specific operational response for refugee-hosting countries), €40 million was allocated as a further grant to State Specialised Enterprise Chernobyl Nuclear Power Plant in relation to the Interim Spent Fuel Storage Facility project (as discussed below) and €1 million was allocated to the EBRD Community Special Fund. On 12 May 2016, the Board of Governors adopted Resolution No. 196 Use of Allocated Net Income for Chernobyl Projects. This varied elements of Resolution No. 175 related to a €100 million contingent liability originally recognised in 2014, of which €81 million remained in 2015. In 2016, €40 million was paid as a contribution from the Bank to the Interim Spent Fuel Storage Facility project. The remaining portion of the contingent liability of up to €60 million was subject to receipts from other donors exceeding the amount of €40 million. Under paragraph 1(a) of Resolution No. 196 the Bank’s remaining potential obligations were automatically cancelled on 31 December 2016, removing the Bank’s contingent liability.

EBRD Financial Report 2016 71
26. Undrawn commitments and guarantees
27. Operating lease commitments The Bank leases its Headquarters building in London and some of its Resident Office buildings in the countries in which it invests. These are standard operating leases and include renewal options, periodic escalation clauses and are mostly non-cancellable in the normal course of business without the Bank incurring substantial penalties. The most significant lease is that for the Bank’s Headquarters building. Rent payable under the terms of this lease is reviewed every five years and is based on market rates. The latest review is due to commence in 2017 with its terms applicable from December 2016.
Minimum future lease payments under long-term non-cancellable operating leases and payments made under such leases during the year are shown below:
Payable 2016
€ million 2015
€ million Not later than one year 27 35 Later than one year and not later than five years 96 119 Later than five years 16 45 At 31 December 139 199 Expenditure incurred in the current year 30 32
Analysis by instrument 2016
€ million 2015
€ million Undrawn commitments
Loans 10,029 10,629 Share investments 1,481 1,754 At 31 December 11,510 12,383
Guarantees Trade finance guarantees 455 451 Other guarantees 110 125 At 31 December 565 576
Undrawn commitments and guarantees at 31 December 12,075 12,959
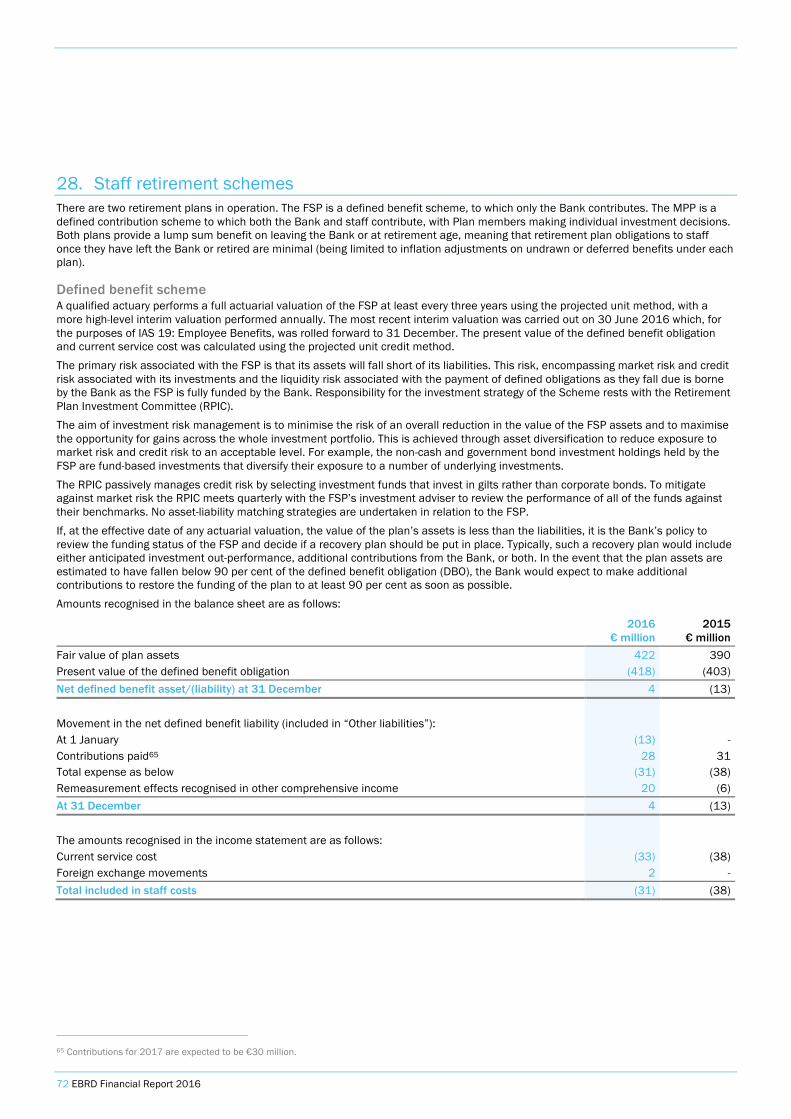
72 EBRD Financial Report 2016
28. Staff retirement schemes There are two retirement plans in operation. The FSP is a defined benefit scheme, to which only the Bank contributes. The MPP is a defined contribution scheme to which both the Bank and staff contribute, with Plan members making individual investment decisions. Both plans provide a lump sum benefit on leaving the Bank or at retirement age, meaning that retirement plan obligations to staff once they have left the Bank or retired are minimal (being limited to inflation adjustments on undrawn or deferred benefits under each plan).
Defined benefit scheme A qualified actuary performs a full actuarial valuation of the FSP at least every three years using the projected unit method, with a more high-level interim valuation performed annually. The most recent interim valuation was carried out on 30 June 2016 which, for the purposes of IAS 19: Employee Benefits, was rolled forward to 31 December. The present value of the defined benefit obligation and current service cost was calculated using the projected unit credit method. The primary risk associated with the FSP is that its assets will fall short of its liabilities. This risk, encompassing market risk and credit risk associated with its investments and the liquidity risk associated with the payment of defined obligations as they fall due is borne by the Bank as the FSP is fully funded by the Bank. Responsibility for the investment strategy of the Scheme rests with the Retirement Plan Investment Committee (RPIC). The aim of investment risk management is to minimise the risk of an overall reduction in the value of the FSP assets and to maximise the opportunity for gains across the whole investment portfolio. This is achieved through asset diversification to reduce exposure to market risk and credit risk to an acceptable level. For example, the non-cash and government bond investment holdings held by the FSP are fund-based investments that diversify their exposure to a number of underlying investments. The RPIC passively manages credit risk by selecting investment funds that invest in gilts rather than corporate bonds. To mitigate against market risk the RPIC meets quarterly with the FSP’s investment adviser to review the performance of all of the funds against their benchmarks. No asset-liability matching strategies are undertaken in relation to the FSP. If, at the effective date of any actuarial valuation, the value of the plan’s assets is less than the liabilities, it is the Bank’s policy to review the funding status of the FSP and decide if a recovery plan should be put in place. Typically, such a recovery plan would include either anticipated investment out-performance, additional contributions from the Bank, or both. In the event that the plan assets are estimated to have fallen below 90 per cent of the defined benefit obligation (DBO), the Bank would expect to make additional contributions to restore the funding of the plan to at least 90 per cent as soon as possible. Amounts recognised in the balance sheet are as follows:
2016
€ million 2015
€ million Fair value of plan assets 422 390 Present value of the defined benefit obligation (418) (403) Net defined benefit asset/(liability) at 31 December 4 (13) Movement in the net defined benefit liability (included in “Other liabilities”): At 1 January (13) - Contributions paid65 28 31 Total expense as below (31) (38) Remeasurement effects recognised in other comprehensive income 20 (6) At 31 December 4 (13) The amounts recognised in the income statement are as follows: Current service cost (33) (38) Foreign exchange movements 2 - Total included in staff costs (31) (38)
65 Contributions for 2017 are expected to be €30 million.

EBRD Financial Report 2016 73
Principal actuarial assumptions used:
2016 2015 Discount rate 2.50% 3.50% Expected return on plan assets 2.50% 3.50% Price inflation 3.25% 2.75% Future salary increases 3.25% 3.75% Weighted average duration of the defined benefit obligation 11 years 11 years Sensitivity analysis on the key actuarial assumptions:
Assumption Sensitivity
(Decrease)/ Increase
in DBO € million
Discount rate 2.50% +/- 0.5% pa (19)/21 Price inflation 3.25% +/- 0.25% pa 10/(10)
These sensitivity analyses have been determined based on reasonably possible changes of the respective assumptions occurring at the end of the reporting period, while holding all other assumptions constant. The sensitivity analysis presented above may not be representative of the actual change in the defined benefit obligation as it is unlikely that the change in assumptions would occur in isolation of one another as the assumptions may be correlated.
Plan asset allocation
2016 Listed
€ million
2016 Unlisted € million
2016 Total
€ million
2015 Listed
€ million
2015 Unlisted € million
2015 Total
€ million Equities 200 41 241 185 39 224 Index-linked bonds 144 - 144 130 - 130 Commodities - - - - 16 16 Other - 37 37 - 20 20 Fair value of plan assets 344 78 422 315 75 390
Changes in the present value of the defined benefit obligation are as follows: 2016
€ million 2015
€ million Present value of defined benefit obligation at 1 January (403) (359)
Service cost (33) (38) Interest cost (12) (12) Effect of exchange rate movement 57 (20) Actuarial (loss)/gain arising due to changes in assumptions66 (42) 13 Benefits paid 15 13 Present value of defined benefit obligation at 31 December (418) (403)
Changes in the fair value of plan assets are as follows: 2016
€ million 2015
€ million Present value of plan assets at 1 January 390 359
Interest income on plan assets 12 12 Return on assets greater/(less) than discount rate 62 (19) Effect of exchange rate movement (55) 20 Contributions paid 28 31 Benefits paid (15) (13) Present value of plan assets at 31 December 422 390
66 All actuarial losses relate to changes in financial assumptions.

74 EBRD Financial Report 2016
Defined contribution scheme The charge recognised under the MPP was €18 million (2015: €19 million) and is included in “General administrative expenses”.
Other long-term employee benefits The Bank maintains a medical retirement benefit plan to provide staff retiring from the Bank, aged 50 or over and with at least seven years’ service, with a lump sum benefit to help purchase medical insurance cover. The total charge for the year was €3 million (2015: €3 million).
29. Related parties The Bank has the following related parties:
Key management personnel Key management personnel comprise: members of the Bank’s Executive Committee, Managing Directors and the Director of the President’s Office.
Salaries and other benefits paid to key management personnel in 2016 amounted to €17 million (2015: €19 million). This comprises salary and employee benefits of €13 million (2015: €15 million) and post-employment benefits of €4 million (2015: €4 million). In pound sterling terms, the salaries and other benefits paid to key management personnel in 2016 amounted to £14 million (2015: £14 million), comprising salary and employee benefits of £11 million (2015: £11 million) and post-employment benefits of £3 million (2015: £3 million).
Venture capital associates The Bank has invested in a number of venture capital associates that it accounts for at fair value through profit or loss. At 31 December 2016, according to the 201567 audited financial statements (and where these are not available, the most recent unaudited management information) from the investee companies, these venture capital associates had total assets of €21.7 billion (2015: €33.1 billion) and total liabilities of €15.4 billion (2015: €24.5 billion). For the year ended 31 December 2016, these associates had income of €4.8 billion (2015: €5.1 billion) and made nil net gain or loss before tax (2015: net loss before tax of €1.0 billion). In addition, as at 31 December 2016, the Bank had outstanding €30 million (2015: €45 million) of financing to these companies on which it had received €1 million (2015: €1 million) of interest income during the year. There were no venture capital associates deemed material to the Bank at 31 December 2016.
67 The 2015 financial statements are the most recent available.
Experience gains and losses 2016
€ million 2015
€ million Defined benefit obligation (418) (403) Plan assets 422 390 Surplus/(deficit) 4 (13) Experience losses on plan assets:
Amount (15) - Percentage of the present value of the plan assets (3.6%) (0.1%)
Actual return less expected return on plan assets: Amount 62 (19) Percentage of the present value of the plan assets 14.7% (4.9%)

EBRD Financial Report 2016 75
Special Funds Special Funds are established in accordance with Article 18 of the Agreement Establishing the Bank and are administered under the terms of the rules and regulations for each such Special Fund. At 31 December 2016 the Bank administered 17 Special Funds (2015: 18 Funds) with aggregate pledged contributions amounting to €1.5 billion (2015: €1.6 billion).
The Bank acts as manager and administrator of the Special Funds for which it receives management and cost recovery fees. In 2016 these fees amounted to €2.3 million (2015: €3.6 million) of which €1.1 million was payable at 31 December 2016 (2015: €2.3 million). The Bank pays for guarantees from certain Special Funds in respect of specific exposures arising in its trade finance portfolios for which it paid €0.1 million in 2016 (2015: €0.1 million). In addition, the Bank also benefits from fee-free guarantee arrangements with certain Special Funds for losses which it could potentially incur in its investment activities. The provision of these guarantees qualifies such Special Funds as ‘unconsolidated structured entities’ within the meaning of IFRS 12. The Bank’s only exposure to these Special Funds would arise in the period between recognising a guarantee receivable on its balance sheet and the settlement of that receivable. At 31 December 2016 the Bank had €2.9 million of such exposure (2015: €2.0 million). Audit fees payable to the Bank's auditor for the 2016 audits of the Special Funds totalled €0.1 million (2015: €0.1 million).
The financial statements of each Special Fund are approved separately by the Board of Governors at the Bank’s Annual Meeting.
30. Other fund agreements
Cooperation Funds In addition to the Bank’s ordinary operations and the Special Funds programme, the Bank administers numerous bilateral and multilateral contribution agreements to provide technical assistance and investment support grants in the existing and potential countries in which it invests. These grants focus primarily on project preparation, project implementation (including goods and works), advisory services and training. The Bank also acts as a fund manager for donor-financed grants that can be accessed by other international financial institutions (IFIs). This fund manager function of the Bank exists under the following funds: Eastern Europe Energy Efficiency and Environment Partnership Funds (E5P), European Western Balkans Joint Fund (EWBJF – under Western Balkans Investment Framework) and Northern Dimension Environmental Partnership Fund (non-nuclear). The resources provided through cooperation contribution agreements are held separately from the ordinary capital resources of the Bank and are subject to external audit. In 2016 new agreements and replenishments of €517 million (2015: €264 million) were signed with donors. Contributions of €278 million (2015: €161 million) were received, and disbursements of €115 million (2015: €115 million) paid out during the year. At 31 December 2016, the total number of open Cooperation Funds was 192 (2015: 187). Further details will be available in the 2016 Grant Co-financing report.
Nuclear Funds Following a proposal by the G-7 countries for a multilateral programme of action to improve safety in nuclear power plants in the countries in which the Bank invests, the Nuclear Safety Account (NSA) was established by the Bank in March 1993. The NSA funds are in the form of grants and are used for funding safety improvement measures. At their Denver Summit in June 1997, the G-7 countries and the European Union endorsed the setting up of the Chernobyl Shelter Fund (CSF). The CSF was established on 7 November 1997, when the rules of the CSF were approved by the Board of Directors. It became operational on 8 December 1997, when the required eight contributors had entered into contribution agreements with the Bank. The objective of the CSF is to assist Ukraine in transforming the existing Chernobyl sarcophagus into a safe and environmentally stable system. In 1999, in pursuit of their policy to accede to the European Union, Lithuania, Bulgaria and the Slovak Republic gave firm commitments to close and decommission their nuclear power plant units with RBMK and VVER 440/230 reactors by certain dates. In response to this, the European Commission announced its intention to support the decommissioning of these reactors with substantial grants over a period of 8 to 10 years, and invited the Bank to administer three International Decommissioning Support Funds (IDSFs). On 12 June 2000, the Bank’s Board of Directors approved the rules of the Ignalina, Kozloduy and Bohunice IDSFs and the role of the Bank as their administrator. The funds finance selective projects to help with the decommissioning of designated reactors. They also finance measures to facilitate the necessary restructuring, upgrading and modernisation of the energy production, transmission and distribution sectors and improvements in energy efficiency.
In 2001, the Nordic Investment Bank hosted a meeting with participants from Belgium, Finland, Sweden, the European Commission and IFIs with activities in the Northern Dimension Area (NDA). At this meeting, participants agreed to establish the Northern Dimension Environmental Partnership (NDEP) to strengthen and coordinate financing of important environmental projects with cross-border effects in the NDA. On 11 December 2001, the Bank’s Board of Directors approved the rules of the NDEP Support Fund and the role of the Bank as fund manager. A programme to finance projects remediating the nuclear legacy of the Soviet Northern Fleet became operational in 2004.
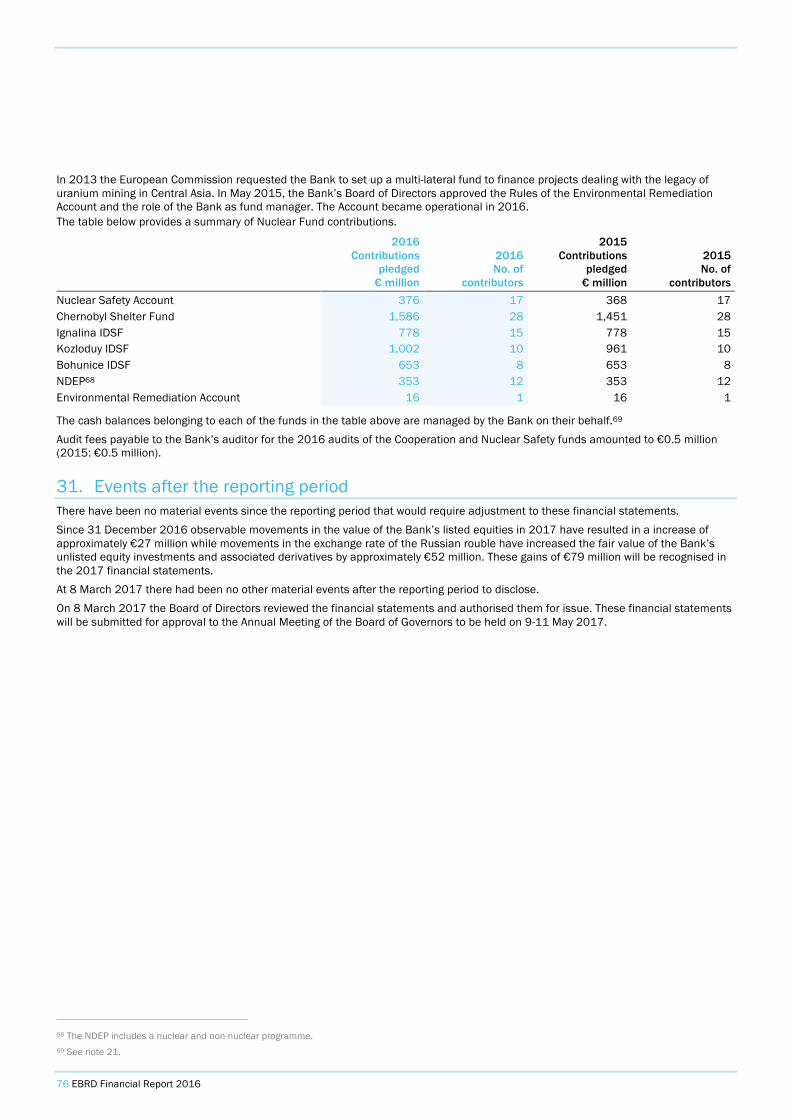
76 EBRD Financial Report 2016
In 2013 the European Commission requested the Bank to set up a multi-lateral fund to finance projects dealing with the legacy of uranium mining in Central Asia. In May 2015, the Bank’s Board of Directors approved the Rules of the Environmental Remediation Account and the role of the Bank as fund manager. The Account became operational in 2016. The table below provides a summary of Nuclear Fund contributions.
2016 Contributions
pledged € million
2016 No. of
contributors
2015 Contributions
pledged € million
2015 No. of
contributors Nuclear Safety Account 376 17 368 17 Chernobyl Shelter Fund 1,586 28 1,451 28 Ignalina IDSF 778 15 778 15 Kozloduy IDSF 1,002 10 961 10 Bohunice IDSF 653 8 653 8 NDEP68 353 12 353 12 Environmental Remediation Account 16 1 16 1
The cash balances belonging to each of the funds in the table above are managed by the Bank on their behalf.69 Audit fees payable to the Bank’s auditor for the 2016 audits of the Cooperation and Nuclear Safety funds amounted to €0.5 million (2015: €0.5 million).
31. Events after the reporting period There have been no material events since the reporting period that would require adjustment to these financial statements. Since 31 December 2016 observable movements in the value of the Bank’s listed equities in 2017 have resulted in a increase of approximately €27 million while movements in the exchange rate of the Russian rouble have increased the fair value of the Bank’s unlisted equity investments and associated derivatives by approximately €52 million. These gains of €79 million will be recognised in the 2017 financial statements. At 8 March 2017 there had been no other material events after the reporting period to disclose. On 8 March 2017 the Board of Directors reviewed the financial statements and authorised them for issue. These financial statements will be submitted for approval to the Annual Meeting of the Board of Governors to be held on 9-11 May 2017.
68 The NDEP includes a nuclear and non-nuclear programme. 69 See note 21.