financial performance analysis
TRANSCRIPT

FINANCIAL PERFORMANCE ANALYSIS OF TOWN
BENEFIT FUND (KUMBAKONAM) LTD
A FINAL PROJECT REPORT
Submitted by
A.MATHAVAN
Register Number: 1391022
In partial fulfilment for the award of the degree of
MASTER OF BUSINESS ADMINISTRATION
in
DEPARTMENT OF MANAGEMENT STUDIES
SRI RAMAKRISHNA ENGINEERING COLLEGE
Coimbatore-641 022
APRIL 2015

SRI RAMAKRISHNA ENGINEERING COLLEGE
COIMBATORE-641 022
Department of Management Studies
A FINAL PROJECT REPORT
APRIL 2015
This is to certify that the project report entitled
FINANCIAL PERFORMANCE ANALYSIS OF TOWN
BENEFIT FUND (KUMBAKONAM) LTD
is the bonafide record of project work done by
A.MATHAVAN
Register Number: 1391022
of Department of Management Studies during the year 2013-2015
__________________ __________________________
Project Guide Director
Management Studies
Submitted for the project Viva-Voce examination held on ______________
_______________ ________________
Internal Examiner External Examiner

DECLARATION
I affirm that the Project titled “FINANCIAL PERFORMANCE ANALYSIS OF TOWN
BENEFIT FUND (KUMBAKONAM) LTD” being submitted in partial fulfilment for the
award of MBA is the original work carried out by me. It has not formed the part of any other
project work submitted for award of any degree or diploma, either in this or any other
university.
_______________
A.MATHAVAN
1391022
I certify that the declaration made above by the candidate is true.
Ms.Sharmila Preethi
Assistant Professor
Department of Management Studies

ACKNOWLEDGEMENT
I am very thankful to the Management, Dr.A.Ebenezer Jeyakumar, Director
(Academics) and Dr.N.R.Alamelu, Principal of Sri Ramakrishna Engineering College for
providing facilities to complete the project work.
I express my immense gratitude to Dr.K.Chitra, Director, Department of Management
Studies, for her constant support to undergo study in an extensive manner and her continuous
encouragement and valuable guidance to complete this project successfully.
I express my immense gratitude to Ms.Sharmila Preethi, Assistant Professor,
Department of Management Studies, Sri Ramakrishna Engineering College for the continuous
encouragement, support and guidance that has helped me in completing this project work
I extend my sincere thanks to Mr. B.Mukuntha Ramanujam, President, Town Benefit
Fund (Kumbakonam) Limited for rendering their whole hearted support from the organization
side for the successful completion of this project.
My heartfelt thanks to My Parents and My Friends who supported and encouraged
me and made my endeavours possible.
I also thank all who have helped me directly and indirectly in completing this project
work.

EXECUTIVE SUMMARY
Financial institution play an important role in the economy role in the economy by
channelizing funds and thus act as prominent stakeholders. Non-banking financial companies
(NBFC) are providing the services of investment advisory (IAS), asset management (AMS),
leasing and investment finance (IF). Financial system may have classification from banking
view i.e. banking companies and Non-banking financial companies (NBFCs).
Financial statement analysis involves careful selection of data from financial statement
for the primary purpose of forecasting the financial health of the company. This is
accomplished by examining trends in key financial data across companies, and analysing key
financial ratio.
OBJECTIVES OF THE STUDY
To analyse the liquidity and solvency position of Town Benefit Fund (Kumbakonam)
Ltd. To analyse the profitability position of the firm. To analyse the efficiency of the company. To
make a comparative study and common size statement of the company.
METHODLOGY
The study is descriptive in nature since it descriptive about the current financial position
of the company. The source of the data from audited financial statement of the company. The
tools used for analysis are ratio analysis comparative analysis common size analysis and trend
analysis.
FINDINGS
Gross Profit Ratio is high (12.10) in the year 2012-13 and it is low (0.25) in the year
2011-12. Net Profit Ratio is high (12.44) in the year 2011-12 and it is low (2.59) in the year
2011-12. Operating Profit Ratio is high (90.57) in the year 2011-12 and it is low (89.14) in the
year 2009-10. Return on Equity Ratio is high (29.84) in the year 2011-12 and it is low (7.19)
in the year 2013-14. Debt Equity Ratio is high (4.48) in the year 2010-11 and it is low (0.62)
in the year 2009-10. Capital Gearing Ratio is high (0.93) in the year 2009-10 and it is low
(0.09) in the year 2010-11.
The comparative income statement for year 2013-14 the total revenue has increased
(19.59%) in the year 2014. Expenses have increased (30.83%) in the year 2014. Profit before
tax has been decreased (-62.18%) in the year 2014. Profit after tax amount decreased (-61.83%)
in the year 2014. The comparative balance sheet for the year 2013-14 the share capital funds
has increased (17.29%) in the year 2014. Short-term borrowings has increased (5.72%) in the
year 2014. Short-term loans and advances has decreased (-1.48%) in the year 2014. Total assets
and liability has increased (21.06%) during the year 2014.
The common size income statement for year 2013-14 the total revenue taken as100%
other components are expressed in term of total revenue. Total Expenses has increased
(96.16%) in the year 2014 compare with previous year it was (87.90). Profit before tax has
decreased (3.84%) in the year 20104 compare with previous year it was (12.15%). Profit after
tax amount decreased (2.59%) during 2014 compare with previous year it was (8.10%). The
common size balance sheet for year 2013-14 the total assets and liabilities are taken as100%
other components are expressed in term of total assets and liabilities. Share capital has
decreased (3.16%) in the year 2010 compare with previous year it was (3.26%).Short-term
borrowings has decreased (67.88%) in the year 2010 compare with previous year it was
(77.74%). Short-term loans and advances decreased (68.17%) in the year 2010 compare with
previous year it was (83.7%)
Trent percentage in Revenue shows in the year 2010 Revenue is 100% whereas in 2014
it is 440.92%. Hence it shows increasing trend and gradual improvement of the organization.
RECOMMENDATION
The company has to increase its gross profit and net profit by reducing their expenses
which in turn will increase the profitability ratio. The company should adopt a better debt equity
mix in the future to control the fluctuations in returns. The company should control fluctuations
in cash and bank balances as it impacts the current ratio of the company.

TABLE OF CONTENTS
Chapter
No. Title
Page
No.
1
INTRODUCTION
1.1 Introduction to the Concept of Study 1
1.2 Theoretical Background of the Study 2
1.3 Review of Literature 10
1.4 Statement of the problem 15
1.5 Objectives of the study 15
1.6 Scope of the study 15
1.7 Methodology 16
1.8 Limitations
16
1.9 Chapter Scheme (Report Structure)
17
2 ORGANIZATION PROFILE
2.1 History of the Organization 18
2.2 Management 21
2.3 Organization structure 22
2.4 Product profile and Market potential 23
2.5 Competitive strength of the company 23
2.6 Description of various functional areas. 25
3 MACRO-MICRO ECONOMIC ANALYSIS
3.1 Macro Analysis 28
3.2 Micro Analysis 30
4 ANALYSIS & INTERPRETATION
5 CONCLUSION
5.1 Findings 75
5.2 Recommendations 78
REFERENCES

LIST OF TABLES
Table
No. Title Page No.
2.1 Board Of Directors 21
3.1 Registered NCFC In India 31
3.2 Major Source Of Funding By NBFCs 31
4.1.1 Current Ratio 33
4.1.2 Quick Ratio 34
4.1.3 Absolute Liquid Ratio 35
4.1.4 Gross Profit Ratio 36
4.1.5 Net Profit Ratio 37
4.1.6 Operating Ratio 38
4.1.7 Operating Profit Ratio 39
4.1.8 Return On Equity Ratio 40
4.1.9 Debt Equity Ratio 41
4.1.10 Proprietary Ratio 42
4.1.11 Capital Gearing Ratio 43
4.2.1 Comparative Income Statement For The Year Ended 2010-11 44
4.2.2 Comparative Balance Sheet For The Year Ended 2010-11 46
4.2.3 Comparative Income Statement For The Year Ended 2011-12 48
4.2.4 Comparative Balance Sheet For The Year Ended 2011-12 49

4.2.5 Comparative Income Statement For The Year Ended 2012-13 51
4.2.6 Comparative Balance Sheet For The Year Ended 2012-13 52
4.2.7 Comparative Income Statement For The Year Ended 2013-14 54
4.2.8 Comparative Balance Sheet For The Year Ended 2013-14 55
4.3.1 Commonsize Income Statement For The Year Ended 2010-11 57
4.3.2 Commonsize Balance Sheet For The Year Ended 2010-11 59
4.3.3 Commonsize Income Statement For The Year Ended 2011-12 61
4.3.4 Commonsize Balance Sheet For The Year Ended 2011-12 62
4.3.5 Commonsize Income Statement For The Year Ended 2012-13 64
4.3.6 Commonsize Balance Sheet For The Year Ended 2012-13 65
4.3.7 Commonsize Income Statement For The Year Ended 2013-14 67
4.3.8 Commonsize Balance Sheet For The Year Ended 2013-14 68
4.4.1 Trend Percentages In Share Capital 70
4.4.2 Trend Percentages In Reserves & Surplus 71
4.4.3 Trend Percentages In Fixed Assets 72
4.4.4 Trend Percentages In Current Liabilities 73
4.4.5 Trend Percentages In Revenue 74
LIST OF CHARTS
Chart
No. Title Page No.
2.1 Organisation Structure 22
3.1 Activities Carried by NBFCs 28
4.1.1 Current Ratio 33
4.1.2 Quick Ratio 34
4.1.3 Absolute Liquid Ratio 35
4.1.4 Gross Profit Ratio 36
4.1.5 Net Profit Ratio 37
4.1.6 Operating Ratio 38
4.1.7 Operating Profit Ratio 39
4.1.8 Return On Equity Ratio 40
4.1.9 Debt Equity Ratio 41
4.1.10 Proprietary Ratio 42
4.1.11 Capital Gearing Ratio 43
4.4.1 Trend Percentages In Share Capital 70
4.4.2 Trend Percentages In Reserves & Surplus 71
4.4.3 Trend Percentages In Fixed Assets 72
4.4.4 Trend Percentages In Current Liabilities 73
4.4.5 Trend Percentages In Revenue 74


1
CHAPTER-1
INTRODUCTION
1.1 INTRODUCTION TO THE CONCEPT OF STUDY
The term ‘financial performance analysis also known as analysis and interpretation of
financial statements’ , refers to the process of determining financial strength and weaknesses of
the firm by establishing strategic relationship between the items of the balance sheet , profit and
loss account and other operative data.
The analysis of financial statements is an important aid to financial analysis. They provide
information on how the firm has performed in the past and what is its current financial position.
Financial analysis is the process of identifying the financial strengths and weakness of the firm
from the available accounting data and financial statements. The analysis is done by establishing
relationship between the different items of financial statements.
The focus of financial analysis is on key figures in the financial statements and the
significant relationship that exists between them. The analysis of financial statements is a process
of evaluating relationship between component parts of financial statements to obtain a better
understanding of the firm’s position and performance.
Investors and customers are keen on reviewing a company financial statement to gauge its
financial strength. Financial institutions are the pillar of the economy, which makes their financial
soundness a top-priority issue not only for the public regulators and investors. Equally important,
review the financial results helps analysts set economically sound firms apart from troubled
institutions.

2
The first task of financial analyst is to select the information relevant to the decision under
consideration from the total information contained in the financial statement. The second step
involved in financial analysis is to arrange the information in a way to highlight significant
relationships. The final step is interpretation and drawing of inferences and conclusions. In brief,
financial analysis is the process of selection, relation, and evaluation.
1.2 THEORETICAL BACKGROUND OF THE STUDY
Financial statement are those statements which exhibits true financial position of the business
for a particular period and also produce the profit earning capacity at the end of a particular period.
Financial statements are prepared for the purpose of presenting periodical review of report on the
progress by the management and deal with, Status of investment in the business
The result achieved during a period under view.
The statements disposing status of investment is known as Balance sheet and statement showing
the result is known as Profit and Loss Account. So the major financial statement are ‘Balance sheet
and Income statement’ (P/L A/c) therefore financial statement are affected by three things i.e.
Recorded facts, Accounting convention and personal Judgment. In short financial statement
position, profitability or weakness of the concern. Thus we can say that financial statement
provide a summary of the accounts of a business enterprise the balance sheet reflecting the assets
and liabilities and income statement showing the results of operation during a certain period.
1.2.1 RATIO ANALYSIS
Ratio analysis is used as a technique of analyzing the financial information, contained in the
balance sheet and profit and loss accounts, for a more meaningful understanding of the financial
position and performance of a firm.
The relationship between two accounting figures, expressed mathematically, is known as a
financial ratio. A ratio helps the analyst to make qualitative judgment about the firm’s financial
position and performance.

3
Several ratios can be calculated from the accounting data contained in the financial
statements. The parties which generally undertake financial analysis is short –term creditors, long-
term creditors, owner and management.
I. LIQUIDITY RATIO
Liquidity Ratios are also termed as Short-Term Solvency Ratios. The term liquidity means
the extent of quick convertibility of assets in to money for paying obligation of short-term nature.
To measure the liquidity of a firm, the following ratios are commonly used:
(a) Current Ratio.
(b) Quick Ratio (or) Acid Test or Liquid Ratio.
(c) Absolute Liquid Ratio (or) Cash Position Ratio.
(a) CURRENT RATIO
Current Ratio establishes the relationship between current Assets and current Liabilities. It
attempts to measure the ability of a firm to meet its current obligations. In order to compute this
ratio, the following formula is used:
Current Assets
Current Ratio =
Current Liabilities
Current ratio is a measure of the firm’s short term solvency. It indicates the availability of
current assets in rupees for every one rupee of current liability. A ratio of greater than one means
that the firm has more current assets than current claims against the, Current ratio of 2 to 1 or more
is considered satisfactory. Current ratio represents a margin of safety for creditors.
4
(b) QUICK RATIO
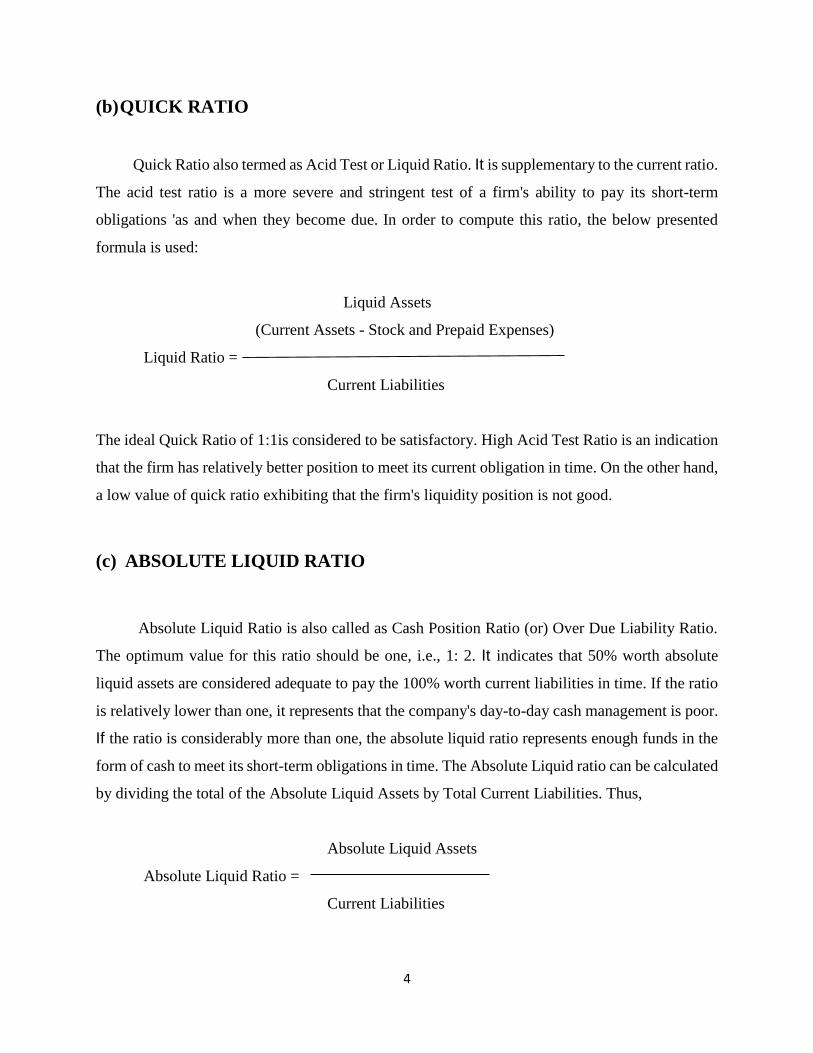
Quick Ratio also termed as Acid Test or Liquid Ratio. It is supplementary to the current ratio.
The acid test ratio is a more severe and stringent test of a firm's ability to pay its short-term
obligations 'as and when they become due. In order to compute this ratio, the below presented
formula is used:
Liquid Assets
(Current Assets - Stock and Prepaid Expenses)
Liquid Ratio =
Current Liabilities
The ideal Quick Ratio of 1:1is considered to be satisfactory. High Acid Test Ratio is an indication
that the firm has relatively better position to meet its current obligation in time. On the other hand,
a low value of quick ratio exhibiting that the firm's liquidity position is not good.
(c) ABSOLUTE LIQUID RATIO
Absolute Liquid Ratio is also called as Cash Position Ratio (or) Over Due Liability Ratio.
The optimum value for this ratio should be one, i.e., 1: 2. It indicates that 50% worth absolute
liquid assets are considered adequate to pay the 100% worth current liabilities in time. If the ratio
is relatively lower than one, it represents that the company's day-to-day cash management is poor.
If the ratio is considerably more than one, the absolute liquid ratio represents enough funds in the
form of cash to meet its short-term obligations in time. The Absolute Liquid ratio can be calculated
by dividing the total of the Absolute Liquid Assets by Total Current Liabilities. Thus,
Absolute Liquid Assets
Absolute Liquid Ratio =
Current Liabilities

5
II. PROFITABILITY RATIO
The term profitability means the profit earning capacity of any business activity. Thus, profit
earning may be judged on the volume of profit margin of any activity and is calculated by
subtracting costs from the total revenue accruing to a firm during a particular period. Profitability
Ratio is used to measure the overall efficiency or performance of a business. Generally, a large
number of ratios can also be used for determining the profitability as the same is related to sales
or investments.
The following important profitability ratios are below:
(a) Gross Profit Ratio
(b) Net Profit Ratio
(c) Operating Ratio
(d) Operating Profit Ratio
(e) Return on Equity Ratio
(a) GROSS PROFIT
Gross Profit Ratio established the relationship between gross profit and net sales. This ratio
is calculated by dividing the Gross Profit by Sales. It is usually indicated as percentage.
Gross Profit
Gross Profit Ratio = x 100
Net Sales
Gross Profit = Sales - Cost of Goods Sold
Net Sales = Gross Sales - Sales Return (or) Return Inwards
Higher Gross Profit Ratio is an indication that the firm has higher profitability. It also reflects
the effective standard of performance of firm's business.

6
(b) NET PROFIT RATIO
Net Profit Ratio is also termed as Sales Margin Ratio (or) Profit Margin Ratio (or) Net Profit
to Sales Ratio. This ratio reveals the firm's overall efficiency in operating the business. Net profit
Ratio is used to measure the relationship between net profit (either before or after taxes) and sales.
This ratio can be calculated by the following formula:
Net Profit after Tax
Net Profit Ratio = x 100
Net Sales
(c) OPERATING RATIO
Operating Ratio is calculated to measure the relationship between total operating expenses
and sales. The total operating expenses is the sum total of cost of goods sold, office and
administrative expenses and selling and distribution expenses. In other words, this ratio indicates
a firm's ability to cover total operating expenses. In order to compute this ratio, the following
formula is used:
Operating Cost
Operating Ratio = x 100
Net Sales
(d) OPERATING PROFIT RATIO
Operating Profit Ratio indicates the operational efficiency of the firm and is a measure of
the firm's ability to cover the total operating expenses. Operating Profit Ratio can be calculated as:
Operating Profit
Operating Profit Ratio = x 100
Net Sales
Operating Profit = Gross Profit - Operating Expenses

7
(e) RETURN ON EQUITY RATIO
This ratio is also called as ROL This ratio measures a return on the owner's or shareholders'
investment. This ratio establishes the relationship between net profit after interest and taxes and
the owner's investment. Usually this is calculated in percentage. This ratio, thus can be calculated
as:
Net Profit (after interest and tax)
Return on Equity Ratio = x 100
Shareholders' Fund (or) Investments
III. SOLVENCY RATIO
The term 'Solvency' generally refers to the capacity of the business to meet its short-term and
Long-term obligations. Solvency Ratio indicates the sound financial position of a concern to
carryon its business smoothly and meet its all obligations. Some of the important ratios which are
given below in order to determine the solvency of the concern:
(a) Debt - Equity Ratio
(b) Proprietary Ratio
(c) Capital Gearing Ratio
(a) DEBT-EQUITY RATIO
This ratio also termed as External - Internal Equity Ratio. This ratio is calculated to
ascertain the firm's obligations to creditors in relation to funds invested by the owners. The ideal
Debt Equity Ratio is 1: 1. This ratio also indicates all external liabilities to owner recorded
claims. It may be calculated as
Total Long Term Debt
Debt-Equity Ratio =
Share Holder’s Fund
8
(b) PROPRIETARY RATIO
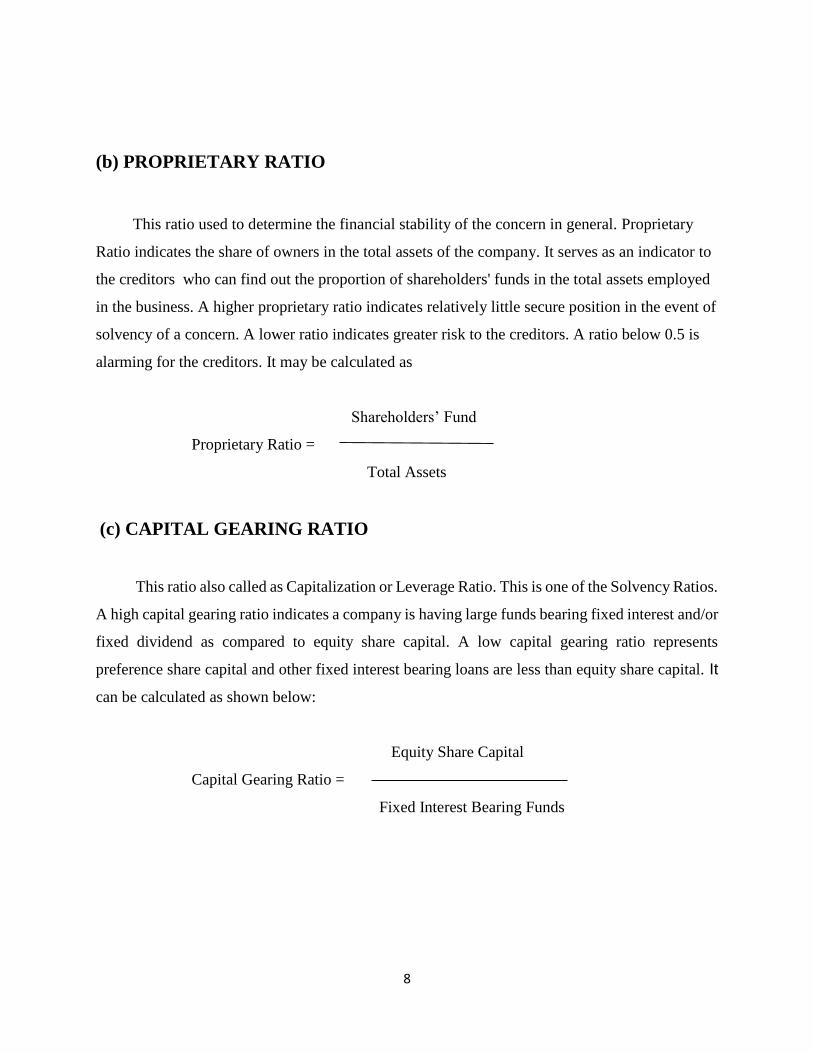
This ratio used to determine the financial stability of the concern in general. Proprietary
Ratio indicates the share of owners in the total assets of the company. It serves as an indicator to
the creditors who can find out the proportion of shareholders' funds in the total assets employed
in the business. A higher proprietary ratio indicates relatively little secure position in the event of
solvency of a concern. A lower ratio indicates greater risk to the creditors. A ratio below 0.5 is
alarming for the creditors. It may be calculated as
Shareholders’ Fund
Proprietary Ratio =
Total Assets
(c) CAPITAL GEARING RATIO
This ratio also called as Capitalization or Leverage Ratio. This is one of the Solvency Ratios.
A high capital gearing ratio indicates a company is having large funds bearing fixed interest and/or
fixed dividend as compared to equity share capital. A low capital gearing ratio represents
preference share capital and other fixed interest bearing loans are less than equity share capital. It
can be calculated as shown below:
Equity Share Capital
Capital Gearing Ratio =
Fixed Interest Bearing Funds

9
1.2.2 COMPARATIVE STATEMENT
Comparative balance sheet as on two or more different dates can be used for comparing assets
and liabilities and findings out any increase or decrease in the items.
Comparative Statement provides an idea of financial position at two or more periods.
Generally two financial statements (balance sheet and income statement) are prepared in
comparative form for financial analysis.
The Comparative Statement May Show:-
1. Absolute figures (rupee amounts)
2. Changes in absolute figures i.e. increase or decrease in absolute figures.
3. Absolute data in terms of percentages.
4. Increase or decrease in terms of percentages.
1.2.3 COMMON SIZE STATEMENT
The common-size statements, balance sheet and income statement are show in analytical
percentages. Common size statements indicate the relationship of various items with some
common items. In the income statements, the sales figure is taken as basis and all other figures are
expressed as percentage of sales. Similarly, in the balance sheet the total assets and liabilities is
taken as base and all other figures are expressed as percentage of this total.

10
1.2.4 TREND ANALYSIS
Trend analysis is Very important tool of horizontal financial analysis. This analysis enables
to known the change in the financial function and operating efficiency in between the time
period chosen.
By studding the trend analysis of each item we can know the direction of changes and based
upon the direction of changes, the options can be changed.
Trend =Absolute Value of item in the statement understudy *100
Absolute Value of same item in the base statement
1.3 REVIEW OF LITERATURE
B.Sathish kumar (2008)1, Conducted a study on Evaluation of the financial performance of Indian
private sector banks concluded that Private sector bank plays an important role in development of
Indian economy. After liberalization the banking industry underwent major changes. The
economic reforms totally have changed the banking sectors. RBI permitted new banks to be started
in private sector as per the recommendation of Narashima committee. The Indian banking industry
was dominated by the public banks. But now the situation have changed new generation banks
with the use of technology and professional management has gained a reasonable position in the
banking industry.
1 B. Sathish kumar(2008), article on “Evaluation of the financial performance of Indian private sector banks”, International
journal of motivation, Management and technology, vol.2,No.3,June2011

11
Beaver William H,Correia Maria and McNichols, Maureen. F et.al., (2010)2, Conducted a
study “Financial statement analysis and the prediction of Financial Distress” has analyzed that
Financial including trade suppliers, banks, credit rating agencies, investors and management,
among others. Financial distress refers to the inability of the company to pay its financial
obligations as they mature. Empirically, academic research in accounting and finance has focused
on either bond default or bankruptcy. The basic issue is whether the probability of distress varies
in a significant manner conditional upon the magnitude of the financial statement ratios. This
monograph discusses the evolution of three main streams within the financial distress prediction
literature: The set of dependent and explanatory variables used, the statistical methods of
estimations, and the modeling of financial distress.
SudeepKalakkar(2012)3, Conducted a study on “Key Factors in Determining the Financial
Performance of the Indian Banking Sector” To identified the expected result from the actual result
we have used econometric approach or model using internal financial values such as Return on
Asset, Return on Capital, Income rate growth and Profit per Employee and also used external
factors such as GDP growth rate of 83 scheduled Commercial Banks in three different sectors that
is public sector, private sector and foreign banks operation in India. Along with that we have also
used the financial values and ratios obtained by Reserve Bank of India. Finally we will highlight
the income growth rate will be affected by the market share, Investment to deposit ratio of foreign
banks are efficient compared to public sector banks and private sector banks. Thus foreign banks
have impact in the Indian banking sector with more profits per employee, business per employee,
capital adequacy, low NPA level, Asset Quality, Liquidity etc.
2 Beaver William H,Correia Maria and McNichols, Maureen F (2010), ‘Financial statement analysis and the
prediction of Financial’, Foundations & Trends in Accounting; 2010, Vol.5 Issue 2, p 99-102
3 SudeepKalakkar (2012), “Key Factors in Determining the Financial Performance of the Indian Banking Sector”, The IUP
Journal of Managerial Economics, Vol.4,No.2,pp.56-62, June 2012

12
McGowan Jr. ,Carl B Stambaughan and Andrew.R et.al., (2011)4, Conducted a study on
‘Financial Analysis of Bank Al Bilad’ presents a model for the financial analysis of a bank based
on the Dupont system of financial analysis. The Dupont system of financial analysis is derived
from an analysis of return on equity that consists of three parts: 1) Operating efficiency as
measured by profit margin, 2) Asset use efficiency as measured by total asset turnover, and 3)
Financial leverage as measured by the equity multiplier.
M. Cathy Claiborne and Kirkland A. Wilcox et.al., (2011)5, Conducted a study on “Home
Heaters: A Holistic View of Financial statement” has taken up two start-up companies in the same
industry that have identical economic transactions. Although both companies follow generally
accepted accounting principles (GAAT), each manager makes different choices and estimates
when applying GAAP. By preparing the financial statements, calculating ratios, and comparing
and contrasting the two companies.
Venus C. Ibrara (2009)6, Conducted a study on “Cash flow ratios; Tools for financial analysis”
has stated that according to Statement of financial accounting standards No.95, “ Statement of cash
flow,” the information in the statement, if used with information in other financial statements, can
help investors, creditors and others to assess an entity’s ability to generate positive future net cash
flow, and its ability to meet its obligations and to pay dividends, and determine its needs for
external financing during the period. This study will analyze ratios derived from the operating cash
flows. These ratios are then used to analyze four year of statements of cash flows of three
manufacturing corporations. The objective of the study is to test ratios derived from the statement
of cash flows, use them to evaluate the intra performances of companies t determine said
companies liquidity, efficiency, profitability and ability to protect long-term investors and
creditors. This study will test the usefulness of the ratios, applicability to manufacturing companies
and determine if there are limitations to their uses.
4 McGowan Jr. ,Carl B Stambaughan and Andrew R, (20011), ‘Financial Analysis of Bank Al Bilad’, International Business
& Economical Research Journal; Mar 2011, Vol.10 Issue 3, p 9-16
5M. Cathy Claiborne and Kirkland A. Wilcox (2011), ‘Home Heaters: A Holistic View of Financial statement’, Issues In
Accounting Education, Vol.26, No.4 2011 p 797-806 6 Venus C. Ibrara (2009), ‘Cash flow ratios; Tools for financial analysis’, Journal of International Business
Research, Volume 8, Special Issue1,2009

13
Ehsan.H. Feroz, Sungsoo kim, Raymond L. Raab et.al., (2003)7 Conducted a study on inancial
statement analysis : Data Envelopment approach. In this paper, they demonstrate that Data
Envelopment Analysis (DEA) can augment the traditional ratio analysis. Result reject the null
hypothesis that DEA can provide information to analysts that is additional to that provided by the
traditional ratio analysis.
Jaan Vainu (2002)8, Conducted a study ‘Bank performance analysis: Methodology and Empirical
Evidence’ has discussed that different version of financial ratio analysis are used for the bank
performance analysis using financial statement items as initial data sources. The usage of a
modified version of DuPont financial ratio analysis and a novel matrix approach is discussed n the
article. Empirical results of the Estonian commercial banking system performance analysis are
also presented in the article. Banks performance monitoring, analysis and control needs special
analysis in respect to their operation and performance result from the viewpoint of different
audiences, like investors/owners, regulators, customers/clients and management themselves.
7 Ehsan.H. Feroz, Sungsoo kim, Raymond L. Raab (2003) Conducted a study on “Financial statement analysis : Data
Envelopment approach”,Journal of the Operational Research Society, Vol.54,pp.48-58.
8 Jaan Vainu (2002), ‘Bank performance analysis: Methodology and Empirical Evidence’, Journal of Economic
Literature Classification number 22(2):2009 p 70-84

14
Professor M.R. Kumaraswamy (2009)9, Conducted a study ‘Financial Management cell for New
approach to Ethical-Based Financial statement analysis’ has discussed that today’s business
world has been characterized by moral bankruptcy violating all norms of good business ethics
which, in turn, has caused mounting economic (financial problem) due to frequent company and
bank failures and insolvencies, the result of their engaging in fraudulent (manipulative) deals in as
much as enterprises are started with profit-making motives, the need for a thorough link between
men and profit is something forgotten. Keeping these considerations in view the author 9has
formulated a new approach to financial statement analysis incorporating moral values in business
management.10
Mark T. Soliman (2004)10, In his study ‘Using Industry-Adjusted Dupont Analysis to predict
future Profitability’ has use Dupont analysis that decomposes return-on-net-operating assets
(RNOA) into two multiplicative components: Profit margin and asset turnover, both of which are
largely driven by industry membership. This paper investigates whether using industry-adjusted
Dupont analysis is a useful tool in predicting future changes in RONA. In contrast to prior research
that used economically- wide targets and finds that these components are not useful in forecasting.
9 Professor M.R. Kumara swamy (2009), ‘Financial Management cell for New approach to Ethical-Based
Financial statement analysis’, Journal of Financial Management and Analysis 22(2):2009 p 70-84
10 Mark T. Soliman (2004), ‘Using Industry-Adjusted Dupont Analysis to predict future Profitability’ Graduate
School of Business, Stanford University, Standford

15
1.4 STATEMENT OF THE PROBLEM
Financial performance analysis is very much needed for findings out the efficiency of rising
and utilization of funds in the organization by establishing strategic relationship between the
components of balance sheet and profit and loss statement and other operation data for better
decision making and to maximize the profitability of the organization.
1.5 OBJECTIVES OF THE STUDY
To analyse the liquidity and solvency position of the firm.
To analyse the profitability position of the firm.
To make a comparative study and to prepare a common size statement for the company.
1.6 SCOPE OF THE STUDY
The study is based on the accounting information of the Town Benefit Fund (Kumbakonam)
Limited, Kumbakonam. The study covers the period of 2010 to 2014 for analyzing the financial
statement such as income statements and balance sheet. The scope of the study involves the various
factors that affect the financial efficiency of the company. To increase the profit and sales growth
of the company. This study finds out the operational efficiency of the organization and allocation
of resources to improve the efficiency of the organization. The data of the past five years are taken
into account for the study. The performance is compared within those periods. This study finds out
the areas where Town Benefit Fund (Kumbakonam) Ltd. can improve to increase the efficiency of
its assets and funds employed.

16
1.7 METHODOLOGY
1.7.1 RESEARCH DESIGN
The study is descriptive in nature since it describe about the current financial position of the
company.
1.7.2 METHOD OF DATA COLLECTION
The study uses secondary data source
1.7.3 DATA USED FOR THE STUDY
Data of the Company’s Balance Sheet of the financial years 2009 -10 to 2013-14 were used
in the study.
1.7.4 TOOLS FOR ANALYSIS
The financial and statistical tools used in the study include
Ratio analysis
Comparative statement
Common size statement
Trend Analysis
1.8 LIMITATIONS
Analysis and interpretation are purely based on the figure represented on annual report
The study restricted to a period of 5 years
External factors which affect the financial performance of the concern are not given
importance

17
1.9 CHAPTER SCHEME
Chapter 1: Introduction
This chapter gives an introduction about the research conducted. It deals with the Background
of the study, Review of literature, Statement of the problem, Objectives of the study, Scope of the
study, Research methodology adopted and the Limitation of the study.
Chapter 2: Organizational profile
The chapter organizational profile deals with the history of the organization, the Management,
Departments, Organization structure, Competitive strength of the company, Future plan and the
description about various functional areas.
Chapter 3: Macro Micro Economic Analysis
The chapter macro-micro analysis gives an insight about the industry in global scenario as
well as the Indian scenario.
Chapter 4: Data Analysis and Interpretation
The chapter Analysis and interpretation deals with the analysis of the data collected for the
study.
Chapter 5: Conclusion
This chapter deals with the discussion of the findings and the suggested recommendations
based on the findings and a conclusion to the study.

18
CHAPTER 2
ORGANISATION PROFILE
2.1 HISTORY OF THE ORGANIZATION
Town Benefit Fund was established in 29th 1993 by CA.M.RAMAN in the Temple City of
Kumbakonam, with the blessings of the Makkal Sakthi Movement Founder Dr. M.S.
Udhayamurthi. As a deposit-accepting Non-banking financial company (NBFC).
The primary object of the institution is to cultivate the habit of savings among the members.
The first and foremost aim is to satisfy the member and create mutually among themselves. Apart
from serving the members for the past 20 years, the company conducted various social awareness
programs like (Eye camps, Motivation for the students).
On 31st March 2014 the company mobilized deposits to the tune of Rs.199.27 Crores from
the members and advanced to tune of Rs.144.40 Crores to our members. For the Financial Year
2014-2015 our Company Projected to achieve a total Business of Rs.550 Crores comprising Rs.300
Crores as Deposits and Rs.250 Crores as Advances.
The company though being a mid-sized company believes in adopting state of the art practices
in the areas of corporate governance. The company is an Unlisted Public Limited company
operating in the state of Tamilnadu. Presently 124 permanent employees and 86 temporary
employees were servicing the members through 35 branches.
They have declared dividends constantly for the past 10 years and declared 14% dividend for
the year ended 31 March 2014. Rewarding shareholders with rich cash dividends as well as
ploughing back of profits to support company’s future growth have been that twin objects of the
company over many years.

19
PILLARS OF TOWN BENEFIT FUND (KUMBAKONAM) LIMITED
Reliability
Trust
Openness/Transparency
Commitment
SOME OF THE HIGHLIGHTS ARE
The company has NIL BAD DEBTS for the past 5 years
The company has 100% RECOVERY for the past 5 years
The company’s financial statement do not carry any qualification (Adverse Remark) by the
Auditors
Since inception, the company has not advanced any loan to its Director and persons or firm
or companies referred in the section 295 of the Act.
Since inception, the company has complied with the directives issued by the Reserve Bank
of India and central government as regards to acceptance of deposits. No order has been
passed by the company law board or RBI or any other tribunal u/s 58 AA.
Since inception, no prosecution was initiated against or show causes notices received by
the company for alleged offences under the Act and nc fines and penalties or any other
punishment were imposed on the company.
POLICY
The company covers malpractices and events which have taken place/suspected to take place
involving
Abuse of authority
Breach of contract
Negligence causing substantial and specific danger to public health and safety

20
Financial irregularities, including fraud, or suspected fraud
Criminal offences
VISION
Many May Come And Many May Go But We [TBF (Kumbakonam) Limited] Serve You
For Ever
MISSION
We Imbibe Our Mission “MUTUALITY AMONG HUMANITY” Among Our Member Based
On The Four Pillars Of TBF (Kumbakonam) Limited
Our mutuality philosophy drives us to develop safe and high quality services. Our wide
spread of network helps us get closer to our member.
We focus on building and maintain sound relations with our members and employees and
all other stake holders.
We believe that the success of business comes from each individual’s creativity and team
work.
We at TBF Ltd., stimulate the mutual growth of our members through “Trust and
Responsibility and in this process TBF Ltd., strives to contribute to the development of
overall so city”.

21
2.2 MANAGEMENT
Table No-2.1
BOARD OF DIRECTORS
S.No.
Name
Category
1 B.Mukuntha Ramanujam WTD & Pesident
2 S.R.Sridharan WTD & VP (HR & Admin.)
3 R.Vijayakumar WTD & VP (Business
Development)
4 K.E.B. Rangarajan Director
5 Dr.R.Rajarajeswari Director
6 S.Rajavel Director
7 S.Abai kumar Director

22
2.3 ORGANIZATION STRUCTURE
Chart No 2.1 ORGANIZATION STRUCTURE
FOUNDER
PRESIDENT
VICE PRESIDENT VICE PRESITEND
DIRECTOR
DIRECTOR DIRECTOR
CREDIT
MANAGER
GENERAL MANAGER
OPERATION
MANAGER
HR
MANAGER
FINANCE
MANAGER

23
2.4 PRODUCT PROFILE AND MARKET POTENTIAL
Recurring Deposit Scheme
Children's Educational Saving Scheme
Regular General Lakshadhipathi Scheme
Fixed Deposit And Cumulative Deposit
JEWEL LOAN
MARKET POTENTIAL
Strong presence in the retail segment
Good network
Competitive pricing based on asset age
Customer segment.
2.5 COMPETITIVE STRENGTH OF THE COMPANY
2.5.1 STRENGTHS
High on service aspect
Strong last-mile approach
Focus on recovery
Easy and fast appraisal & disbursements
Able to generate higher yield on assets
Attained critical mass in terms of size
Own employees

24
2.5.2 WEAKNESS
Weak credit history
Weaker risk-management & technology systems
Higher regulatory restrictions
2.5.3 OPPORTUNITIES
Augmentation of capital and leveraging for growth
Large untapped market, both rural & urban and also geographically
Demographic changes and under-penetration
New opportunities in credit card, personal finance, home equity, etc.
Tie-up with global financial sector giants
Blurring gap with banks in terms of cost of funds
Securitisation, to liberate funds to fuel asset growth
2.5.4 THREATS
Weak financial health
High cost of funds
Asset quality deterioration may not only wipe out profits
but also net worth
Entry of foreign players in post-2009 scenario
Growing retail thrust within banks

25
2.6 DESCRIPTION OF FUNCTIONAL AREAS
The various department of the organization includes,
Deposit Section
Accounts Section
Loan Section
Audit Section
2.6.1 Deposits Section
This section concentrates on accepting the deposits from customers. There different types
of deposits available. The money collected from the customers have to be maintained in the
respective accounts and interest has to charged accordingly.
2.6.2 Accounts section
The accounts section focuses on maintaining a clear record on the day transaction that takes
place in the organization. Book keeping is one of the main activity of the account section. It is also
responsible for documenting all the cash inflows and outflows that takes place between the banks.it
should also monitor the reserves deposits and banks performance regularly.
2.6.3 Loan Section
The loan section is said to be the most vital section of the NBFC. It has to sanction loan to
the customers based on their repaying after verifying the necessary documents. However the
amount of loan that can be sanctioned will be decided by the general manager. The information
regarding the payment of interest against the loans has to be maintained and monitored regularly.

26
2.6.4 Audit Section
The audit section is said to be the backbone of the bank.it is responsible for verifying the
vouchers, receipts, invoice and bills etc. in regard to the income and expenses of the NBFC. The
internal audit is conducted once in a month to verify whether all the transactions are done ethically.
A clear explanation has to be given to the internal auditor on any queries in regard with the
transactions. These documents are used as references for the annual audit.

27
CHAPTER 3
MACRO AND MICRO ECONOMIC ANALYSIS
3.1 NON-BANKING FINANCIAL COMPANY (NBFC)
The RBI defines an NBFC as a company registered under the Companies Act, 1956 and
engaged in the business of loans and advances, acquisition of shares, stock, bonds, debentures, and
securities issued by the Global or local government authorities, or other securities of like
marketable nature, leasing, hire-purchase, insurance business, chit business. However, this
excludes institutions whose principal business is in the agricultural or industrial sector, or in the
sale, purchase and construction of immovable property. A non-banking entity that has as its
principal line of business the receipt of deposits, under any scheme or arrangement, or the
extension of loans, in any manner, is also considered an NBFC.
Gradually, NBFCs have become recognized as complementary to the banking sector due to
their customer-oriented services, simplified procedures, attractive rates of return on deposits,
flexibility and timeliness in meeting the credit needs of specified sectors, among other reasons.
NBFCs have traditionally extended credit across the country through their widespread
geographical presence, with NBFCs supplying credit in segments such as equipment leasing, hire
purchase, and consumer finance. These are areas which warrant infusion of financing due to the
existing demand-supply gap. NBFCs have provided a more flexible source of financing and have
been able to disburse funds to a gamut of clientele, from local individual customers to a variety of
corporate clientele. NBFCs can be divided into deposit taking NBFCs, i.e., those which accept
deposits from the public and non-deposit taking NBFCs, i.e., those which do not accept deposits
from the public.

28
The activities carried out by NBFCs can be grouped as follows
Chart No - 3.1
Activities Carried by NBFCs
3.2 GLOBAL SCENARIO OF NBFC
Size of NBFCs Sector and their Growth
In line with the global trend, NBFCs in India too emerged primarily to fill in the gaps in the
supply of financial services which were not generally provided by the banking sector, and also to
complement the banking sector in meeting the financing requirements of the evolving economy.
Over the years NBFCs have grown sizably both in terms of their numbers as well as he
volume of business transactions (RBI, 2014). The number of such financial companies grew more
than seven-fold from 7,063 in 1981 to 51,929 in 1996. Thus, the growth of NBFCs has been rapid,
especially in the 1990s owing to the high degree of their orientation towards customers and
simplification of loan sanction requirements (RBI, 2000). Further, the activities of NBFCs in India
have undergone qualitative changes over the years through functional specialization. NBFCs are
NBFC
Fund Based Activities
Equipment Leasing
Hire Purchase
Bill Discounting
Loans/Investments
Factoring
Equity Participants
Short Term Loans
Inter Corporate Loans
Fee based Activities
Investment Banking
Portfolio Management
Wealth Management
Corporate Consulting
Project Consulting
Loan/Lease Syndication
Advisory Service

29
perceived to have inherent ability and flexibility to take quicker decisions, assume greater risks,
and customize their services and charges according to the needs of the clients. hese features, as
compared to the banks, have tremendously contributed to the proliferation of NBFCs in the eighties
and nineties. Their flexible structures allowed them to unbundle services provided by banks and
market the components on a competitive basis. Banks on the other hand, had all along been known
for their rigid structure, especially the public sector banks. This compelled them carry out such
services by establishing ‘banking subsidiaries’ in the form of NBFCs. The willingness of NBFCs
to engage in varied forms of financial intermediation, hitherto unavailable to the banking system,
has provided the valuable flexibility in financing new areas of business. Though the NBFCs are
different species and smaller in size as a segment when compared with the banking system, their
relevance to the overall economic development and to certain specified areas cannot be
undermined.
Over a period as the regulatory requirements were made progressively stringent, the total
number of NBFCs registered with the Reserve Bank stood at 12,409 by end-March 2013. The
number of NBFCs-D declined considerably with conversion into non-deposit taking companies,
besides closure and mergers of weaker companies. Incidentally, the regulatory regime also seems
to be in favour of reducing the number of deposit taking NBFCs and consequent migration of
depositors towards the banking system which is better regulated and supervised in line with the
global standards.
It may be underlined that the public deposits of NBFCs, after showing a steady increase till
20010, declined thereafter and sharply by end-March 2014. However, the size of total assets, have
grown more than double from Rs. 53,878 crore as at end-March 2001 to Rs. 1,16,897 crore by
end-March 2014, clearly indicating greater demand for the services provided by these companies
in a fast growing economy. The net owned fund (NoF) of NBFCs has also increased sharply
between end-March 2001 and end-March 2014 by more than three times to Rs. 17,975 crore,
showing the strength of the NBFCs segment.

30
3.3 INDIAN SCENARIO OF NBFC
According to the Economic Survey 2012-13, it has been reported that NBFCs as a whole
account for 11.2 per cent of assets of the total financial system. With the growing importance
assigned to financial inclusion, NBFCs have come to be regarded as important financial
intermediaries particularly for the small-scale and retail sectors.
In the multi-tier financial system of India, importance of NBFCs in the Indian financial
system is much discussed by various committees appointed by RBI in the past and RBI has been
modifying its regulatory and supervising policies from time to time to keep pace with the changes
in the system. NBFCs have turned out to be engines of growth and are integral part of the Indian
financial system, enhancing competition and diversification in the financial sector, spreading risks
specifically at times of financial distress and have been increasingly recognized as complementary
of banking system at competitive prices. The Banking sector has always been highly regulated,
however simplified sanction procedures, flexibility and timeliness in meeting the credit needs and
low cost operations resulted in the NBFCs getting an edge over banks in providing funding. Since
the 90s crisis the market has seen explosive growth, as per a Fitch Report1 the compounded annual
growth rate of NBFCs was 40% in comparison to the CAGR of banks being 22% only.
NBFCs have been pioneering at retail asset backed lending, lending against securities,
microfinance etc and have been extending credit to retail customers in under-served areas and to
unbanked customers.
Number of NBFCs registered with the RBI:
The following table shows the number of NBFCs registered with the Reserve Bank of India
and the trend of registration of companies as NBFC since the last decade. The table as given below
also indicates registration of deposit accepting NBFCs of the total NBFCs registered with RBI.

31
Table No - 3.1
Registered NBFCs in India
End June Number of Registered NBFC in India
2009 12,630
2010 12,740
2011 12,809
2012 12,968
2013 13,014
2014 13,261 Source: RBI
Funding sources of NBFCs:
Funding sources of NBFCs include debentures, borrowings from banks and FIs,
Commercial Paper and inter-corporate loans. Table below provides for funding sources of Non-
Banking Financial Companies – Non Deposit Taking – Systematically Important:
Table No - 3.2
Major source funding by NBFCs
S.No. Source of Fund March 2013
(Percentage to total
liability)
March 2014
(Percentage to total
liability)
1 Debentures 21.7 28.3
2 Commercial papers 4.9 4.5
3 Borrowing from banks
and Fin. Institutions 19.8 18.5
4 Inter-corporate loans 5.4 2.8
5 Others 14.1 15.2 Source: RBI Report on Trend and progress of Banks
Banks are also a major source of funding for NBFCs either directly or indirectly. So in a way
NBFCs have a dependence on banks making them vulnerable to systemic risks in the financial
system.

32
Funding by NBFCs:
Historically, banks have played the role of intermediaries between the savers and the
investors. However, in the last few decades, the importance and nature of financial intermediation
has undergone a dramatic transformation the world over. The dependence on bank credit to fund
investments is giving way to raising resources through a range of market based instruments such
as the stock and bond markets, new financial products and instruments like mortgage and other
asset backed securities, financial futures and derivative instruments like swaps and complex
options. Besides transferring resources from savers to investors, these instruments enable
allocation of risks and re-allocation of capital to more efficient use. The increase in the breadth
and depth of financial markets has also coincided with a pronounced shift among the ultimate
lenders who have moved away from direct participation in the financial markets to participation
through a range of intermediaries. These developments in international financial markets have
been mirrored in the financial market in India. NBFCs account for 11.2% of the assets of the total
financial system2. NBFCs have emerged as an important financial intermediary especially in the
small scale and retail sector. There are a total of 12,630 NBFCs (end of June 2013) registered with
RBI consisting of NBFCs-D and NBFCs-ND. Of the 11.2%, asset finance companies held the
largest share of assets of nearly 74.5% and also held the largest share of deposits amongst the
NBFCs-D segment by end of March, 2013.

33
CHAPTER-4
ANALYSIS AND INTERPRETATION
LIQUIDITY RATIO
4.1.1 CURRENT RATIO
Table No 4.1.1 CURRENT RATIO
Year Current Assets Current Liabilities Current Ratio
2009-2010 524482068 513786193 1.02
2010-2011 756609010 743337434 1.02
2011-2012 1023269513 754239108 1.36
2012-2013 1661366540 1378547685 1.21
2013-2014 543591577 1459463172 0.37
Chart No 4.1.1 CURRENT RATIO
It is inferred from the above table that the Current ratio is high (1.36%) in the year 2011-12 and it
is low (0.38%) in the year 2013-14.
2009-10 2010-11 2011-12 2012-13 2013-14
0.00
0.20
0.40
0.60
0.80
1.00
1.20
1.40
1.60
YEARS
CU
RR
EN
T R
AT
IO

34
4.1.2 QUICK RATIO
Table No 4.1.2 QUICK RATIO
Year quick asset Current Liabilities Quick Ratio
2009-2010 524482068 513786193 1.02
2010-2011 756522177 743337434 1.02
2011-2012 1020533865 7542239108 0.14
2012-2013 1659571826 1378547685 1.20
2013-2014 537553637 1459463172 0.37
Chart No 4.1.2 QUICK RATIO
It is inferred from the above table that the Quick Ratio is high (1.2) in the year 2012-13 and it is
low (0.14) in the year 2011-12.
2009-10 2010-11 2011-12 2012-13 2013-14
0.00
0.20
0.40
0.60
0.80
1.00
1.20
1.40
YEAR
QU
ICK
RA
TIO

35
4.1.3 ABSOLUTE LIQUID RATIO
Table No 4.1.3 Absolute Liquid Ratio
Year Absolute Liquid Assets Current Liabilities Absolute Liquid Ratio
2009-2010 74028046 513786193 0.14
2010-2011 95462671 743337434 0.13
2011-2012 134799705 754239108 0.18
2012-2013 185230012 1378547685 0.13
2013-2014 537553637 1459463172 0.37
Chart No 4.1.3 Absolute Liquid Ratio
It is inferred from the above table that the Absolute Liquid Ratio is high (0.36) in the year 2013-
14 and it is low (0.13) in the year 2012-13.
0
0.1
0.2
0.3
0.4
AB
LS
OL
UT
E L
IQU
ID R
AT
IO
YEAR
2009-10 2010-11 2011-12 2012-13 2013-14

36
PROFITABILITY RATIO
4.1.4 GROSS PROFIT RATIO
Table No 4.1.4 GROSS PROFIT RATIO
Year Gross Profit Net Sales Gross Profit Ratio
2009-2010 159142 64261734 0.25
2010-2011 8220111 96483112 8.52
2011-2012 9708641 134683787 7.21
2012-2013 28674400 236927939 12.10
2013-2014 10883195 283345806 3.84
Chart No 4.1.4 GROSS PROFIT RATIO
It is inferred from the above table that the Gross Profit Ratio is high (12.10) in the year 2012-13
and it is low (0.25) in the year 2011-12.
0.00
5.00
10.00
15.00
2009-10 2010-11 2011-12 2012-13 2013-14
RA
TIO
(IN
PE
RC
EN
TA
GE
)
YEAR

37
4.1.5 NET PROFIT RATIO
Table No 4.1.5 NET PROFIT RATIO
Year Net Profit After Tax Net Sales Net Profit Ratio
2009-2010 3968179 64261734 6.18
2010-2011 5589540 96483112 5.79
2011-2012 16755403 134683787 12.44
2012-2013 19201370 236927939 8.10
2013-2014 7328680 283345806 2.59
Chart No 4.1.5 NET PROFIT RATIO
It is inferred from the above table that the Net Profit Ratio is high (12.44) in the year 2011-12 and
it is low (2.59) in the year 2011-12.
0.00
2.00
4.00
6.00
8.00
10.00
12.00
14.00
2009-10 2010-11 2011-12 2012-13 2013-14
RA
TIO
(IN
PE
RC
EN
TA
GE
)
YEAR

38
4.1.6 OPERATING RATIO
Table No 4.1.6 OPERATING RATIO
Year Operating Cost Net Sales Operating Ratio
2009-2010 6977295 64261734 10.86
2010-2011 9105311 96483112 9.44
2011-2012 12702917 134683787 9.43
2012-2013 24545809 236927939 10.36
2013-2014 29873816 283345806 10.54
Chart No 4.1.6 OPERATING RATIO
It is inferred from the above table that the Operating Ratio is high (10.86) in the year 2009-10 and
it is low (9.43) in the year 2011-12.
8.50
9.00
9.50
10.00
10.50
11.00
2009-10 2010-11 2011-12 2012-13 2013-14
RA
TIO
(IN
PE
RC
EN
TA
GE
)
YEAR

39
4.1.7 OPERATING PROFIT RATIO
Table No 4.1.7 OPRATING PROFIT RATIO
Year Operating Profit Net Sales Operating Profit Ratio
2009-2010 57284439 64261734 89.14
2010-2011 87377801 96483112 90.56
2011-2012 121980870 134683787 90.57
2012-2013 212382130 236927939 89.64
2013-2014 253471990 283345806 89.46
Chart No 4.1.7 OPERATING PROFIT RATIO
It is inferred from the above table that the Operating Profit Ratio is high (90.57) in the year 2011-
12 and it is low (89.14) in the year 2009-10.
88.00
88.50
89.00
89.50
90.00
90.50
91.00
2009-10 2010-11 2011-12 2012-13 2013-14
RA
TIO
(IN
PE
RC
EN
TA
GE
)
YEAR

40
4.1.8 RETURN ON EQUITY RATIO
Table No 4.1.8 RETURN ON EQUITY RATIO
Year Net profit After int.& tax Share holder fund Return equity ratio
2009-2010 3968179 26731328 14.84
2010-2011 5589540 36901559 15.15
2011-2012 16755403 56132785 29.85
2012-2013 19201370 94818451 20.25
2013-2014 7328680 101898373 7.19
Chart No 4.1.8 RETURN ON EQUITY RATIO
It is inferred from the above table that the Return on Equity Ratio is high (29.84) in the year
2011-12 and it is low (7.19) in the year 2013-14.
0.00
5.00
10.00
15.00
20.00
25.00
30.00
35.00
2009-10 2010-11 2011-12 2012-13 2013-14
RA
TIO
(IN
PE
RC
EN
TA
GE
)
YEAR

41
SOLVENCY RATIO
4.1.9 DEBT EQUITY RATIO
Table No 4.1.9 DEBT EQUITY RATIO
Year Total Long Term Debt Shareholders fund Debt-Equity Ratio
2009-2010 16745185 26731328 0.63
2010-2011 239039500 36901559 6.48
2011-2012 268034860 56132785 4.78
2012-2013 274882162 94818451 2.90
2013-2014 554763784 101898373 5.44
Chart No 4.1.9 DEBT EQUITY RATIO
It is inferred from the above table that the Debt Equity Ratio is high (4.48) in the year 2010-11
and it is low (0.62) in the year 2009-10.
0.00
1.00
2.00
3.00
4.00
5.00
6.00
7.00
2009-10 2010-11 2011-12 2012-13 2013-14
RA
TIO
(IN
PE
RC
EN
TA
GE
)
YEAR

42
4.1.10 PROPRIETARY RATIO
Table No 4.1.10 PROPRIETARY RATIO
Year Share Holders Fund Total Tangible Assets Proprietary Ratio
2009-2010 26731328 16035453 1.67
2010-2011 36901559 36987055 1.00
2011-2012 56132785 49333598 1.14
2012-2013 94818451 70445727 1.35
2013-2014 101898373 86192921 1.18
Chart No 4.1.10 PROPRIETARY RATIO
It is inferred from the above table that the Proprietary Ratio is high (1.68) in the year 2009-10 and
it is low (0.10) in the year 2009-10.
0.00
0.20
0.40
0.60
0.80
1.00
1.20
1.40
1.60
1.80
2009-10 2010-11 2011-12 2012-13 2013-14
RA
TIO
(IN
PE
RC
EN
TA
GE
)
YEAR
43
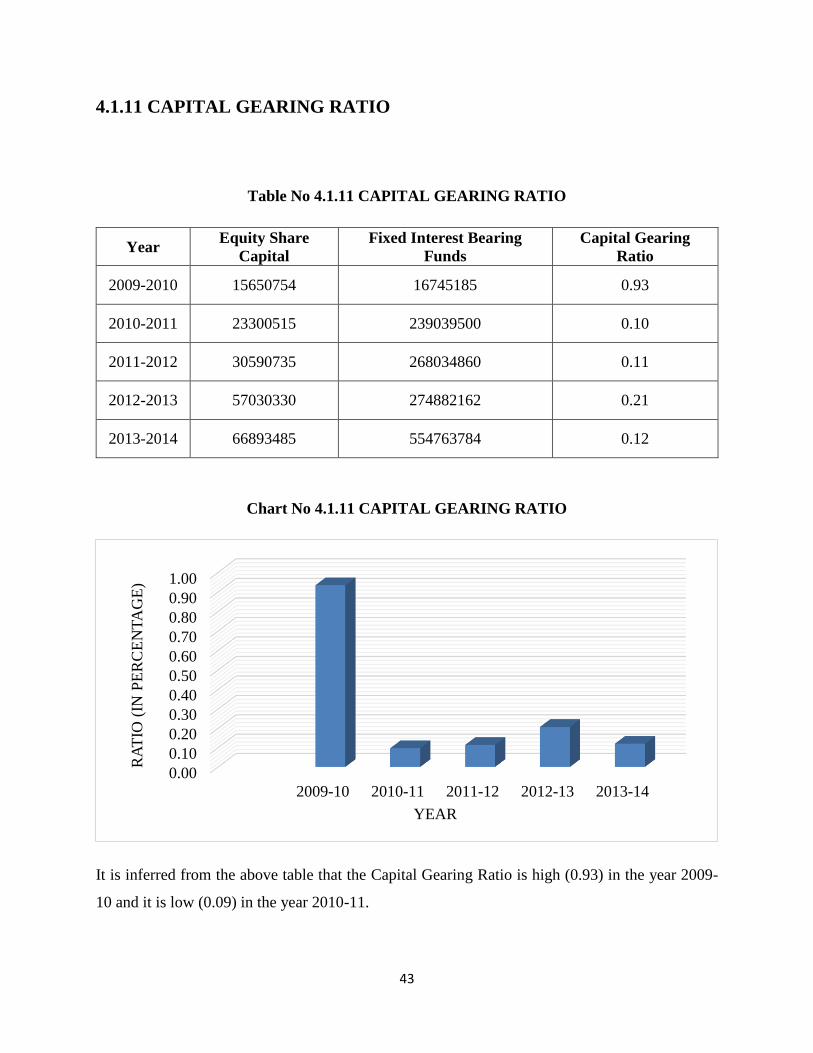
4.1.11 CAPITAL GEARING RATIO
Table No 4.1.11 CAPITAL GEARING RATIO
Year Equity Share
Capital
Fixed Interest Bearing
Funds
Capital Gearing
Ratio
2009-2010 15650754 16745185 0.93
2010-2011 23300515 239039500 0.10
2011-2012 30590735 268034860 0.11
2012-2013 57030330 274882162 0.21
2013-2014 66893485 554763784 0.12
Chart No 4.1.11 CAPITAL GEARING RATIO
It is inferred from the above table that the Capital Gearing Ratio is high (0.93) in the year 2009-
10 and it is low (0.09) in the year 2010-11.
0.00
0.10
0.20
0.30
0.40
0.50
0.60
0.70
0.80
0.90
1.00
2009-10 2010-11 2011-12 2012-13 2013-14
RA
TIO
(IN
PE
RC
EN
TA
GE
)
YEAR

44
4.2 COMPARATIVE STATEMENT
4.2.1 COMPARATIVE INCOME STATEMENT OF TOWN BENEFIT FUND
(KUMBAKONAM) LIMITED FOR THE YEAR ENDED 31.3.2011
INCOME 31/03/2010 31/03/2011
Increase or
Decrease in
Rs
Increase or
Decrease in
%
Interest Earned 63,963,818 96,088,397 32,124,579 50.22
Other Income 297,916 394,715 96,799 32.49
Total 64,261,734 96,483,112 32,221,378 50.14
Expenditure
Interest paid 44,893,825 68,313,404 23,419,579 52.17
Establishment expenses 6,000,673 10,046,738 4,046,065 67.43
Operating Expenses 1,605,256 1,460,588 -
144,668 -9.01
Administration Expenses 5,372,039 7,705,692 2,333,653 43.44
Depreciation 506,805 797,548 290,743 57.37
Total 58,378,598 88,323,970 29,945,372 51.30
Profit Before tax 5,883,136 8,159,142 2,276,006 38.69
Less: Provision for Taxes 1,914,957 2,569,602 654,645 34.19
Profit After Tax 3,968,179 5,589,540 1,621,361 40.86
Opening Balance 2,609,365 3,307,980 698,615 26.77
Amount Available for
Appropriation 6,577,544 8,897,520 2,319,976 35.27
Proposed Dividend +
Dividend Tax 1,541,032 3,069,070 1,528,038 99.16
General Reserve 1,541,032 2,631,932 1,090,900 70.79
Dividend Equalisation &
Charitable Reserves 187,500
-
187,500 -100.00
Total Appropriation 3,269,564 5,701,002 2,431,438 74.37
Surplus Transferred to
Balanced Sheet 3,307,980 3,196,518
-
111,462 -3.37

45
It is inferred from the above table that the comparative income statement for year 2010-11
the total revenue has increased (50.14%) in the year 2011.
Expenses have increased (51.30%) in the year 2011.
Profit before tax has been increased (38.69%) in the year 2011.
Profit after tax amount decreased (40.86%) in the year 2011.

46
4.2.2 COMPARATIVE BALANCE SHEET OF TOWN BENEFIT FUND
(KUMBAKONAM) LIMITED FOR THE YEAR ENDED 31.3.2011
I.EQUITY AND
LIABLITES 31/03/2010 31/03/2011
Increase or
Decrease in
Rs
Increase or
Decrease in
%
Share capital 15,650,754 23,300,515 7,649,761 48.88
Reserves & Surplus 11,080,574 13,601,044 2,520,470 22.75
Secured loans - Banks 5,268,008 16,745,185 11,477,177 217.87
Unsecured loans - Deposits 508,364,017 726,261,695 217,897,678 42.86
Deferred Tax Liability 154,168 330,554 176,386 114.41
Total 540,517,521 780,238,993 239,721,472 44.35
II.ASSETS
Application of Funds
Fixed Assets
Gross Block 18,318,985 40,054,764 21,735,779 118.65
Less: Depreciation 2,283,532 3,036,249 752,717 32.96
Net Block 16,035,453 37,018,515 20,983,062 130.85
Current Assets, Loans &
Advances
Cash & Balance with Banks 74,028,046 95,462,672 21,434,626 28.95
Loans & Advances 452,315,647 652,672,004 200,356,357 44.30
Other Current Assets 6,578,483 8,474,334 1,895,851 28.82
Less: Current Liabilities &
Provisions 8,440,108 13,388,532 4,948,424 58.63
Net Current Assets 524,482,068 743,220,478 218,738,410 41.71
Total 1,065,844,352 1,593,327,548 527,483,196 49.49

47
It is inferred from the above table that the comparative balance sheet for the year 2010-11
the share capital has increased (48.88%) in the year 2011
Reserves & Surplus has increased (22.75%) in the year 2011
Current asset has increased (41.71%) in the year 2011
Total assets and liabilities have increased (44.35%) during the year 2011

48
4.2.3 COMPARATIVE INCOME STATEMENT OF TOWN BENEFIT FUND
(KUMBAKONAM) LIMITED FOR THE YEAR ENDED 31.3.2012
Revenue
Year Ended
March
31,2011
Year Ended
March
31,2012
Increase or
Decrease in
Rs
Increase or
Decrease in
%
I. Revenue from
Operation 96,088,397 133,973,471 37,885,074 39.43
II. Other Income 394,715 710,316 315,601 79.96
TOTAL REVENUE 96,483,112 134,683,787 38,200,675 39.59
Expenses -
III. (a) Employee Benefit
expense 10,046,738 14,822,133 4,775,395 47.53
(b) Finance costs 68,313,404 96,134,533 27,821,129 40.73
© Depreciation and
amortization expense 797,548 1,315,563 518,015 64.95
(d) Administrative and
Other expense 9,105,311 12,702,917 3,597,606 39.51
Total Expenses 88,263,001 124,975,146 36,712,145 41.59
Profit before exceptional
items and tax (I+II-III) 8,220,111 9,708,641 1,488,530 18.11
Exceptional Items 60,969 11,680,434 11,619,465 19057.99
IV. Profit Before Tax 8,159,142 21,389,075 13,229,933 162.15
V. (a) Current Tax 2,393,216 4,066,408 1,673,192 69.91
(b) Deferred tax 176,386 567,264 390,878 221.60
VI. Profit After tax 5,589,540 16,755,403 11,165,863 199.76
It is inferred from the above table that the comparative income statement for year 2011-12
the total revenue has increased (39.59%) in the year 2012.
Expenses have increased (41.59%) in the year 2012.
Profit before tax has been increased (162.15%) in the year 2012.
Profit after tax amount decreased (199.76%) in the year 2012.

49
4.2.4 COMPARATIVE BALANCE SHEET OF TOWN BENEFIT FUND
(KUMBAKONAM) LIMITED FOR THE YEAR ENDED 31.3.2012
I.EQUITY AND
LIABLITES
Year Ended
March 31,2013
Year Ended
March 31,2014
Increase or
Decrease in
Rs
Increase or
Decrease in
%
SHARE HOLDER'S
FUNDS
(a) Share Capital 23,300,515 30,590,735 7,290,220 31.29
(b) Reserves and
Surplus 13,601,044 25,542,050 11,941,006 87.79
NON-CURRENT
LIABILITIES -
(a) Long-term
borrowings 239,039,500 268,034,860 28,995,360 12.13
(b) Deferred tax
liabilities 330,554 897,818 567,264 171.61
CURRENT
LIABLITIES -
(a) Short-term
borrowings 503,967,380 741,610,271 237,642,891 47.15
(b) Other current
liabilities 6,878,159 10,656,891 3,778,732 54.94
© Short-term
provisions 1,135,834 1,971,946 836,112 73.61
TOTAL-EQUITY
AND LIABILITIES 788,252,986 1,079,304,571 291,051,585 36.92
II.ASSETS -
NON-CURRENT
ASSETS -
Fixed Assets -
(a) Tangible assets 36,987,055 49,433,598 12,446,543 33.65
(b) Capital work-in-
progress 31,460 1,231,460 1,200,000 3814.37
Non-current
investments - 5,370,000
CURRENT ASSETS -
(a) Inventories 86,833 2,735,648 2,648,815 3050.47
(b) Cash and
equivalents 95,462,671 134,799,705 39,337,034 41.21
© Short-term loans
and advances 652,735,105 880,743,600 228,008,495 34.93
(d) Others current
assets 2,949,862 4,990,560 2,040,698 69.18
TOTAL – ASSETS 788,252,986 1,079,304,571 291,051,585 36.92

50
It is inferred from the above table that the comparative balance sheet for the year 2011-12
the share capital has increased (31.29%) in the year 2012
Short-term borrowings has increased (47.15%) in the year 2012
Short-term loans and advances has increased (34.93%) in the year 2012
Total assets and liabilities have increased (36.92%) during the year 2012

51
4.2.5 COMPARATIVE INCOME STATEMENT OF TOWN BENEFIT FUND
(KUMBAKONAM) LIMITED FOR THE YEAR ENDED 31.3.2013
Revenue
Year Ended
March
31,2013
Year Ended
March
31,2014
Increase or
Decrease in Rs
Increase or
Decrease in
%
I. Revenue from
Operation 133,973,471 236,123,406 102,149,935 76.25
II. Other Income 710,316 804,533 94,217 13.26
TOTAL REVENUE 134,683,787 236,927,939 102,244,152 75.91
Expenses -
III. (a) Employee
Benefit expense 14,822,133 22,962,334 8,140,201 54.92
(b) Finance costs 96,134,533 159,018,523 62,883,990 65.41
© Depreciation and
amortization expense 1,315,563 1,726,873 411,310 31.26
(d) Administrative and
Other expense 12,702,917 24,545,809 11,842,892 93.23
Total Expenses 124,975,146 208,253,539 83,278,393 66.64
Profit before exceptional
items and tax (I+II-III) 9,708,641 28,674,400 18,965,759 195.35
Exceptional Items 11,680,434 109,073 -
11,571,361 -99.07
IV. Profit Before Tax 21,389,075 28,783,473 7,394,398 34.57
V. (a) Current Tax 4,066,408 8,599,301 4,532,893 111.47
(b) Deffered tax 567,264 982,802 415,538 73.25
VI. Profit After tax 16,755,403 19,201,370 2,445,967 14.60
It is inferred from the above table that the comparative income statement for year 2012-13
the total revenue has increased (75.91%) in the year 2013.
Expenses have increased (66.64%) in the year 2013.
Profit before tax has been increased (34.57%) in the year 2013.
Profit after tax amount decreased (14.60%) in the year 2013.

52
4.2.6 COMPARATIVE BALANCE SHEET OF TOWN BENEFIT FUND
(KUMBAKONAM) LIMITED FOR THE YEAR ENDED 31.3.2013
I.EQUITY AND
LIABLITES
Year Ended
March 31,2013
Year Ended
March 31,2014
Increase or
Decrease in
Rs
Increase or
Decrease in
%
SHARE HOLDER'S
FUNDS
(a) Share Capital 30590735 57030330 26439595 86.43
(b) Reserves and
Surplus 25542050 37788121 12246071 47.94
NON-CURRENT
LIABILITIES 0 0.00
(a) Long-term
borrowings 268034860 274882162 6847302 2.55
(b) Deferred tax
liabilities 897818 1429909 532091 59.26
CURRENT
LIABLITIES
(a) Short-term
borrowings 741610271 1360147251 618536980 83.40
(b) Other current
liabilities 10656891 16401834 5744943 53.91
© Short-term
provisions 1971946 1998660 26714 1.35
TOTAL-EQUITY
AND LIABILITIES 1079304571 1749678267 670373696 62.11
II.ASSETS
NON-CURRENT
ASSETS
Fixed Assets
(a) Tangible assets 49433598 70445727 21012129 42.51
(b) Capital work-in-
progress 1231460 - 0.00
Non-cuttent
investments 5370000 17866000 12496000 232.70
CURRENT ASSETS 0.00
(a) Inventories 2735648 1794714 -940934 -34.40
(b) Cash and
equivalents 134799705 185230012 50430307 37.41
© Short-term loans
and advances 880743600 1465742258 584998658 66.42
(d) Others current
assets 4990560 8599556 3608996 72.32
TOTAL - ASSETS 1079304571 1749678267 670373696 62.11

53
It is inferred from the above table that the comparative balance sheet for the year 2012-13
the share capital has increased (86.43%) in the year 2013
Short-term borrowings has increased (83.40%) in the year 2013
Short-term loans and advances has increased (66.42%) in the year 2013
Total assets and liability has increased (62.11%) during the year 2013.

54
4.2.7 COMPARATIVE INCOME STATEMENT OF TOWN BENEFIT FUND
(KUMBAKONAM) LIMITED FOR THE YEAR ENDED 31.3.2014
Revenue
Year Ended
March
31,2013
Year Ended
March
31,2014
Increase or
Decrease in Rs
Increase or
Decrease in
%
I. Revenue from
Operation 236,123,406 281,641,913 45,518,507 19.28
II. Other Income 804,533 1,703,893 899,360 111.79
TOTAL REVENUE 236,927,939 283,345,806 46,417,867 19.59
Expenses
III. (a) Employee
Benefit expense 22,962,334 30,750,830 7,788,496 33.92
(b) Finance costs 159,018,523 208,897,584 49,879,061 31.37
© Depreciation and
amortization expense 1,726,873 2,940,381 1,213,508 70.27
(d) Administrative and
Other expense 24,545,809 29,873,816 5,328,007 21.71
Total Expenses 208,253,539 272,462,611 64,209,072 30.83
Profit before exceptional
items and tax (I+II-III) 28,674,400 10,883,195
-
17,791,205 -62.05
Exceptional Items 109,073 2,532 -
106,541 -97.68
IV. Profit Before Tax 28,783,473 10,885,727 -
17,897,746 -62.18
V. (a) Current Tax 8,599,301 2,877,578 -
5,721,723 -66.54
(b) deferred tax 982,802 679,469 -
303,333 -30.86
VI. Profit After tax 19,201,370 7,328,680 -
11,872,690 -61.83
It is inferred from the above table that the comparative income statement for year 2013-14
the total revenue has increased (19.59%) in the year 2014.
Expenses have increased (30.83%) in the year 2014.
Profit before tax has been decreased (-62.18%) in the year 2014.
Profit after tax amount decreased (-61.83%) in the year 2014.

55
4.2.8 COMPARATIVE BALANCE SHEET OF TOWN BENEFIT FUND
(KUMBAKONAM) LIMITED FOR THE YEAR ENDED 31.3.2014
I.EQUITY AND
LIABLITES
March
31,2013
March
31,2014
Increase or
Decrease in
Rs
Increase or
Decrease in
%
SHARE HOLDER'S
FUNDS
(a) Share Capital 57,030,330 66,893,485 9,863,155 17.29
(b) Reserves and Surplus 37,788,121 35,004,888 -
2,783,233 -7.37
NON-CURRENT
LIABILITIES -
(a) Long-term borrowings 274,882,162 554,763,784 279,881,622 101.82
(b) Deferred tax liabilities 1,429,909 2,109,378 679,469 47.52
CURRENT LIABLITIES -
(a) Short-term borrowings 1,360,147,251 1,437,940,417 77,793,166 5.72
(b) Other current liabilities 16,401,834 19,055,453 2,653,619 16.18
© Short-term provisions 1,998,660 2,467,302 468,642 23.45
TOTAL-EQUITY AND
LIABILITIES 1,749,678,267 2,118,234,707 368,556,440 21.06
II.ASSETS -
NON-CURRENT ASSETS -
Fixed Assets -
(a) Tangible assets 70,445,727 86,192,921 15,747,194 22.35
Non-current investments 17,866,000 17,990,158 124,158 0.69
CURRENT ASSETS -
(a) Inventories 1,794,714 6,037,940 4,243,226 236.43
(b) Cash and equivalents 185,230,012 537,553,637 352,323,625 190.21
© Short-term loans and
advances 1,465,742,258 1,444,066,062
-
21,676,196 -1.48
(d) Others current assets 8,599,556 26,393,989 17,794,433 206.92
TOTAL – ASSETS 1,749,678,267 2,118,234,707 368,556,440 21.06

56
It is inferred from the above table that the comparative balance sheet for the year 2013-14
the share capital funds has increased (17.29%) in the year 2014
Short-term borrowings has increased (5.72%) in the year 2014
Short-term loans and advances has decreased (-1.48%) in the year 2014
Total assets and liability has increased (21.06%) during the year 2014.

57
4.3.1 COMMONSIZE INCOME STATEMENT OF TOWN BENEFIT FUND
(KUMBAKONAM) LIMITED FOR THE YEAR ENDED 31.3.2011
PARTICULARS Year Ended March
31,2010
Year Ended March
31,2011
INCOME Amount Percentage
(%) Amount
Percentage
(%)
Interest Earned 63,963,818 99.54 96,088,397 99.59
Other Income 297,916 0.46 394,715 0.41
Total 64,261,734 100.00 96,483,112 100.00
Expenditure
Interest paid 44,893,825 69.86 68,313,404 70.80
Establishment expenses 6,000,673 9.34 10,046,738 10.41
Operating Expenses 1,605,256 2.50 1,460,588 1.51
Administration Expenses 5,372,039 8.36 7,705,692 7.99
Depreciation 506,805 0.79 797,548 0.83
Total 58,378,598 90.85 88,323,970 91.54
Profit Before tax 5,883,136 9.15 8,159,142 8.46
Less: Provision for Taxes 1,914,957 2.98 2,569,602 2.66
Profit After Tax 3,968,179 6.18 5,589,540 5.79
Opening Balance 2,609,365 4.06 3,307,980 3.43
Amount Available for Appropriation 6,577,544 10.24 8,897,520 9.22
Proposed Dividend + Dividend Tax 1,541,032 2.40 3,069,070 3.18
General Reserve 1,541,032 2.40 2,631,932 2.73
Dividend Equalisation & Charitable
Reserves 187,500 0.29 0.00
Total Appropriation 3,269,564 5.09 5,701,002 5.91
Surplus Transferred to Balanced
Sheet 3,307,980 5.15 3,196,518 3.31

58
It is inferred from the above that the common size income statement for year 2010-11 the
total revenue taken as100% other components are expressed in term of total revenue.
Total Expenses has increased (91.54%) in the year 2011 compare with previous year it
was (90.85%)
Profit before tax has increased (9.15%) in the year 2010 compare with previous year it
was (8.46)
Profit after tax amount decreased (6.18%) during 2010 compare with previous year it
was (5.79%)

59
4.3.2 COMMONSIZE BALANCE SHEET OF TOWN BENEFIT FUND
(KUMBAKONAM) LIMITED FOR THE YEAR ENDED 31.3.2011
PARTICULARS Year Ended March 31,2010 Year Ended March
31,2011
I.EQUITY AND LIABLITES Amount Percentage
(%) Amount
Percentage
(%)
Share capital 15,650,754 2.90 23,300,515 2.99
Reserves & Surplus 11,080,574 2.05 13,601,044 1.74
Secured loans - Banks 5,268,008 0.97 16,745,185 2.15
Unsecured loans - Deposits 508,364,017 94.05 726,261,695 93.08
Deferred Tax Liability 154,168 0.03 330,554 0.04
Total 540,517,521 100.00 780,238,993 100.00
II.ASSETS
Application of Funds
Fixed Assets
Gross Block 18,318,985 1.72 40,054,764 2.51
Less: Depreciation 2,283,532 0.21 3,036,249 0.19
Net Block 16,035,453 1.50 37,018,515 2.32
Current Assets, Loans &
Advances
Cash & Balance with Banks 74,028,046 6.95 95,462,672 5.99
Loans & Advances 452,315,647 42.44 652,672,004 40.96
Other Current Assets 6,578,483 0.62 8,474,334 0.53
Less: Current Liabilities &
Provisions 8,440,108 0.79 13,388,532 0.84
Net Current Assets 524,482,068 49.21 743,220,478 46.65
Total 1,065,844,352 100.00 1,593,327,54
8 100.00

60
It is inferred from the above table that the common size balance sheet for year 2010-11
the total assets and liabilities are taken as100% other components are expressed in term
of total assets and liabilities.
Share capital has increased (2.99%) in the year 2011 compare with previous year it
was (2.90%)
Reserves & Surplus has decreased (1.74%) in the year 2011 compare with previous year it
was (2.05%)
Current assets decreased (46.65%) in the year 2011 compare with previous year it was
(49.21%)

61
4.3.3 COMMONSIZE INCOME STATEMENT OF TOWN BENEFIT FUND
(KUMBAKONAM) LIMITED FOR THE YEAR ENDED 31.3.2012
PARTICULARS Year Ended March
31,2011
Year Ended March
31,2012
Revenue Amount Percentage
(%) Amount
Percentage
(%)
I. Revenue from Operation 96,088,397 99.59 133,973,47
1 99.47
II. Other Income 394,715 0.41 710,316 0.53
TOTAL REVENUE 96,483,112 100.00 134,683,78
7
Expenses
III. (a) Employee Benefit expense 10,046,738 10.41 14,822,133 11.01
(b) Finance costs 68,313,404 70.80 96,134,533 71.38
© Depreciation and amortization
expense 797,548 0.83 1,315,563 0.98
(d) Administrative and Other expense 9,105,311 9.44 12,702,917 9.43
Total Expenses 88,263,001 91.48 124,975,14
6 92.79
Profit before exceptional items and tax
(I+II-III) 8,220,111 8.52 9,708,641 7.21
Exceptional Items 60,969 0.06 11,680,434 8.67
IV. Profit Before Tax 8,159,142 8.46 21,389,075 15.88
V. (a) Current Tax 2,393,216 2.48 4,066,408 3.02
(b) deferred tax 176,386 0.18 567,264 0.42
VI. Profit After tax 5,589,540 5.79 16,755,403 12.44
It is inferred from the above that the common size income statement for year 2011-12 the
total revenue taken as100% other components are expressed in term of total revenue.
Total Expenses has increased (92.79%) in the year 2012 compare with previous year it
was (91.48%)
Profit before tax has increased (15.88%) in the year 2012 compare with previous year it
was (8.46%)
Profit after tax amount increased (12.44%) during 2012 compare with previous year it
was (5.79%)

62
4.3.4 COMMONSIZE BALANCE SHEET OF TOWN BENEFIT FUND
(KUMBAKONAM) LIMITED FOR THE YEAR ENDED 31.3.2012
PARTICULARS Year Ended March
31,2011 Year Ended March 31,2012
I.EQUITY AND LIABLITES Amount Percentage
(%) Amount
Percentage
(%)
SHARE HOLDER'S FUNDS
(a) Share Capital 23,300,515 2.96 30,590,735 2.83
(b) Reserves and Surplus 13,601,044 1.73 25,542,050 2.37
NON-CURRENT LIABILITIES
(a) Long-term borrowings 239,039,500 30.33 268,034,860 24.83
(b) Deferred tax liabilities 330,554 0.04 897,818 0.08
CURRENT LIABLITIES
(a) Short-term borrowings 503,967,380 63.93 741,610,271 68.71
(b) Other current liabilities 6,878,159 0.87 10,656,891 0.99
© Short-term provisions 1,135,834 0.14 1,971,946 0.18
TOTAL-EQUITY AND
LIABILITIES 788,252,986 100.00 1,079,304,571 100.00
II.ASSETS
NON-CURRENT ASSETS
Fixed Assets
(a) Tangible assets 36,987,055 4.69 49,433,598 4.58
(b) Capital work-in-progress 31,460 0.00 1,231,460 0.11
Non-cuttent investments - 5,370,000 0.50
CURRENT ASSETS
(a) Inventories 86,833 0.01 2,735,648 0.25
(b) Cash and equivalents 95,462,671 12.11 134,799,705 12.49
© Short-term loans and advances 652,735,105 82.81 880,743,600 81.60
(d) Others current assets 2,949,862 0.37 4,990,560 0.46
TOTAL - ASSETS 788,252,986 100.00 1,079,304,571 100.00

63
It is inferred from the above table that the common size balance sheet for year 2011-12
the total assets and liabilities are taken as100% other components are expressed in term
of total assets and liabilities.
Share capital decreased (2.83%) in the year 2010 compare with previous year it
was (2.96)
Short-term borrowings has increased (68.71%) in the year 2010 compare with previous year
it was (63.93%)
Short-term loans and advances decreased (81.60%) in the year 2010 compare with previous
year it was
(82.81%)

64
4.3.5 COMMONSIZE INCOME STATEMENT OF TOWN BENEFIT FUND
(KUMBAKONAM) LIMITED FOR THE YEAR ENDED 31.3.2013
PARTICULARS Year Ended March
31,2012
Year Ended March
31,2013
Revenue Amount Percentage
(%) Amount
Percentage
(%)
I. Revenue from Operation 133,973,471 99.47 236,123,406 99.66
II. Other Income 710,316 0.53 804,533 0.34
Total Revenue 134,683,787 100.00 236,927,939 100.00
Expenses
III. (a) Employee Benefit expense 14,822,133 11.01 22,962,334 9.69
(b) Finance costs 96,134,533 71.38 159,018,523 67.12
© Depreciation and amortization
expense 1,315,563 0.98 1,726,873 0.73
(d) Administrative and Other expense 12,702,917 9.43 24,545,809 10.36
Total Expenses 124,975,146 92.79 208,253,539 87.90
Profit before exceptional items and tax
(I+II-III) 9,708,641 7.21 28,674,400 12.10
Exceptional Items 11,680,434 8.67 109,073 0.05
IV. Profit Before Tax 21,389,075 15.88 28,783,473 12.15
V. (a) Current Tax 4,066,408 3.02 8,599,301 3.63
(b) Deferred tax 567,264 0.42 982,802 0.41
VI. Profit After tax 16,755,403 12.44 19,201,370 8.10
It is inferred from the above that the common size income statement for year 2012-13 the
total revenue taken as100% other components are expressed in term of total revenue.
Total Expenses has decreased (87.90%) in the year 2013 compare with previous year it
was (92.79)
Profit before tax has decreased (12.15%) in the year 2013 compare with previous year it
was (15.88%)
Profit after tax amount decreased (8.10%) during 2013 compare with previous year it
was (12.44%)

65
4.3.6 COMMONSIZE BALANCE SHEET OF TOWN BENEFIT FUND
(KUMBAKONAM) LIMITED FOR THE YEAR ENDED 31.3.2013
PARTICULARS Year Ended March 31,2012 Year Ended March 31,2013
I.EQUITY AND LIABLITES Amount Percentage
(%) Amount
Percentage
(%)
SHARE HOLDER'S FUNDS
(a) Share Capital 30,590,735 2.83 57,030,330 3.26
(b) Reserves and Surplus 25,542,050 2.37 37,788,121 2.16
NON-CURRENT LIABILITIES
(a) Long-term borrowings 268,034,860 24.83 274,882,162 15.71
(b) Deferred tax liabilities 897,818 0.08 1,429,909 0.08
CURRENT LIABLITIES
(a) Short-term borrowings 741,610,271 68.71 1,360,147,251 77.74
(b) Other current liabilities 10,656,891 0.99 16,401,834 0.94
© Short-term provisions 1,971,946 0.18 1,998,660 0.11
TOTAL-EQUITY AND
LIABILITIES 1,079,304,571 100.00 1,749,678,267 100.00
II.ASSETS
NON-CURRENT ASSETS
Fixed Assets
(a) Tangible assets 49,433,598 4.58 70,445,727 4.03
(b) Capital work-in-progress 1,231,460 0.11 -
Non-cuttent investments 5,370,000 0.50 17,866,000 1.02
CURRENT ASSETS
(a) Inventories 2,735,648 0.25 1,794,714 0.10
(b) Cash and equivalents 134,799,705 12.49 185,230,012 10.59
© Short-term loans and advances 880,743,600 81.60 1,465,742,258 83.77
(d) Others current assets 4,990,560 0.46 8,599,556 0.49
TOTAL - ASSETS 1,079,304,571 100.00 1,749,678,267 100.00

66
It is inferred from the above table that the common size balance sheet for year 2012-13
the total assets and liabilities are taken as100% other components are expressed in term
of total assets and liabilities.
Share capital has increased (3.26%) in the year 2013 compare with previous year it
was (2.83%)
Short-term borrowings has increased (77.74%) in the year 2013 compare with previous year
it was (68.71%)
Short-term loans and advances increased (83.77%) in the year 2013 compare with previous
year it was (81.60%)

67
4.3.7 COMMONSIZE INCOME STATEMENT OF TOWN BENEFIT FUND
(KUMBAKONAM) LIMITED FOR THE YEAR ENDED 31.3.2014
PARTICULARS Year Ended March
31,2013
Year Ended March
31,2014
Revenue Amount Percentage
(%) Amount
Percentage
(%)
I. Revenue from Operation 236,123,406 99.66 281,641,913 99.40
II. Other Income 804,533 0.34 1,703,893 0.60
Total Revenue 236,927,939 100.00 283,345,806 100.00
Expenses
III. (a) Employee Benefit expense 22,962,334 9.69 30,750,830 10.85
(b) Finance costs 159,018,523 67.12 208,897,584 73.73
© Depreciation and amortization
expense 1,726,873
0.73 2,940,381 1.04
(d) Administrative and Other expense 24,545,809 10.36 29,873,816 10.54
Total Expenses 208,253,539 87.90 272,462,611 96.16
Profit before exceptional items and tax
(I+II-III) 28,674,400
12.10 10,883,195 3.84
Exceptional Items 109,073 0.05 2,532 0.00
IV. Profit Before Tax 28,783,473 12.15 10,885,727 3.84
V. (a) Current Tax 8,599,301 3.63 2,877,578 1.02
(b) Deffered tax 982,802 0.41 679,469 0.24
VI. Profit After tax 19,201,370 8.10 7,328,680 2.59
It is inferred from the above that the common size income statement for year 2013-14 the
total revenue taken as100% other components are expressed in term of total revenue.
Total Expenses has increased (96.16%) in the year 2014 compare with previous year it
was (87.90)
Profit before tax has decreased (3.84%) in the year 20104 compare with previous year it
was (12.15%)
Profit after tax amount decreased (2.59%) during 2014 compare with previous year it
was (8.10%)

68
4.3.8 COMMONSIZE BALANCE SHEET OF TOWN BENEFIT FUND
(KUMBAKONAM) LIMITED FOR THE YEAR ENDED 31.3.2014
PARTICULARS Year Ended March 31,2013 Year Ended March 31,2014
I.EQUITY AND LIABLITES Amount Percentage
(%) Amount
Percentage
(%)
SHARE HOLDER'S FUNDS
(a) Share Capital 57,030,330 3.26 66,893,485 3.16
(b) Reserves and Surplus 37,788,121 2.16 35,004,888 1.65
NON-CURRENT LIABILITIES
(a) Long-term borrowings 274,882,162 15.71 554,763,784 26.19
(b) Deferred tax liabilities 1,429,909 0.08 2,109,378 0.10
CURRENT LIABLITIES
(a) Short-term borrowings 1,360,147,251 77.74 1,437,940,417 67.88
(b) Other current liabilities 16,401,834 0.94 19,055,453 0.90
© Short-term provisions 1,998,660 0.11 2,467,302 0.12
TOTAL-EQUITY AND
LIABILITIES 1,749,678,267 100.00 2,118,234,707 100.00
II.ASSETS
NON-CURRENT ASSETS
Fixed Assets
(a) Tangible assets 70,445,727 4.03 86,192,921 4.07
Non-cuttent investments 17,866,000 1.02 17,990,158 0.85
CURRENT ASSETS
(a) Inventories 1,794,714 0.10 6,037,940 0.29
(b) Cash and equivalents 185,230,012 10.59 537,553,637 25.38
© Short-term loans and advances 1,465,742,258 83.77 1,444,066,062 68.17
(d) Others current assets 8,599,556 0.49 26,393,989 1.25
TOTAL - ASSETS 1,749,678,267 100.00 2,118,234,707 100.00

69
It is inferred from the above table that the common size balance sheet for year 2013-14
the total assets and liabilities are taken as100% other components are expressed in term
of total assets and liabilities.
Share capital has decreased (3.16%) in the year 2010 compare with previous year it
was (3.26%)
Short-term borrowings has decreased (67.88%) in the year 2010 compare with previous year
it was (77.74%)
Short-term loans and advances decreased (68.17%) in the year 2010 compare with previous
year it was (83.7%)

70
4.4 TRENT ANALYSIS
4.4.1 TREND PERCENTAGES IN SHARE CAPITAL
Table No 4.4.1 TREND PERCENTAGES IN SHARE CAPITAL
Year Amount Trent %
Increase/Decrease
Base Year Previous Year
2010 15650754 100.00 0.00 0.00
2011 23300515 148.88 48.88 48.88
2012 30590735 195.46 95.46 46.58
2013 57030330 364.39 264.39 168.93
2014 66893485 427.41 327.41 63.02
Chart No 4.4.1 TREND PERCENTAGES IN SHARE CAPITAL
The above table shows in the year 2010 share capital is 100% whereas in 2014 it is
427.41%. Hence it shows increasing trend and gradual improvement of the organization.
0
50
100
150
200
250
300
350
400
450
2010 2011 2012 2013 2014
TR
EN
D %
YEAR

71
4.4.2 TREND PERCENTAGES IN RESERVES & SURPLUS
Table No 4.4.2 TREND PERCENTAGES IN RESERVES & SURPLUS
Year Amount Trent %
Increase/Decrease
Base Year Previous Year
2010 11080574 100 0 0
2011 13601044 122.75 22.75 22.75
2012 25542050 230.51 130.51 107.77
2013 37788121 341.03 241.03 110.52
2014 35004888 315.91 215.91 -25.12
Chart No 4.4.2 TREND PERCENTAGES IN RESERVES & SURPLUS
Reserves & surplus shown an increasing trend in the period 2013.
The Reserves & surplus was showing decreasing trend in the period 2010.
0
50
100
150
200
250
300
350
400
2010 2011 2012 2013 2014
TR
EN
T %
YEAR

72
4.4.3 TREND PERCENTAGES IN FIXED ASSETS
Table No 4.4.3 TREND PERCENTAGES IN FIXED ASSETS
Year Amount Trent %
Increase/Decrease
Base Year Previous Year
2010 16035453 100 0 0
2011 36987055 230.66 130.66 130.66
2012 49433598 308.28 208.28 77.62
2013 70445727 439.31 339.31 131.04
2014 86192921 537.51 437.51 98.20
Chart No 4.4.3 TREND PERCENTAGES IN FIXED ASSETS
Fixed Assets shown an increasing trend in the period 2014.
The Fixed Assets was showing decreasing trend in the period 2010.
2010
2011
2012
2013
2014
0
200
400
600
Trent %
YE
AR
TR
EN
DT
%
2010 2011 2012 2013 2014

73
4.4.4 TREND PERCENTAGES IN CURRENT LIABILITIES
Table No 4.4.4 TREND PERCENTAGES IN CURRENT LIABILITIES
Year Amount Trent %
Increase/Decrease
Base Year Previous Year
2010 513786193 100 0 0
2011 743337434 144.68 44.68 44.68
2012 754239108 146.80 46.80 2.12
2013 1378547685 268.31 168.31 121.51
2014 1459463172 284.06 184.06 15.75
Chart No 4.4.4 TREND PERCENTAGES IN CURRENT LIABILITIES
Current Liabilities shown an increasing trend in the period 2014.
The Current Liabilities was showing decreasing trend in the period 2010.
0
50
100
150
200
250
300
TR
EN
T %
YEAR
2010 2011 2012 2013 2014

74
4.4.5 TREND PERCENTAGES IN REVENUE
Table No 4.4.5 TREND PERCENTAGES IN REVENUE
Year Amount Trent %
Increase/Decrease
Base Year Previous Year
2010 64261734 100 0 0
2011 96483112 150.14 50.14 50.14
2012 134683787 209.59 109.59 59.45
2013 236927939 368.69 268.69 159.11
2014 283345806 440.92 340.92 72.23
Chart No 4.4.5 TREND PERCENTAGES IN REVENUE
The above table shows in the year 2010 Revenue is 100% whereas in 2014 it is 440.92%.
Hence it shows increasing trend and gradual improvement of the organization.
0
50
100
150
200
250
300
350
400
450
2010 2011 2012 2013 2014
TR
EN
T %
YEAR

75
CHAPTER -5
CONCLUSION
5.1 FINDINGS AND RECOMMENDATIONS
5.1.1 FINDINGS
Current ratio is high (1.36%) in the year 2011-12 and it is low (0.38%) in the year 2013-
14.
Quick Ratio is high (1.2) in the year 2012-13 and it is low (0.14) in the year 2011-12.
Absolute Liquid Ratio is high (0.36) in the year 2013-14 and it is low (0.13) in the year
2012-13.
Gross Profit Ratio is high (12.10) in the year 2012-13 and it is low (0.25) in the year 2011-
12.
Net Profit Ratio is high (12.44) in the year 2011-12 and it is low (2.59) in the year 2011-
12.
Operating Ratio is high (10.86) in the year 2009-10 and it is low (9.43) in the year 2011-
12.
Operating Profit Ratio is high (90.57) in the year 2011-12 and it is low (89.14) in the year
2009-10.
Return on Equity Ratio is high (29.84) in the year 2011-12 and it is low (7.19) in the year
2013-14.
Debt Equity Ratio is high (4.48) in the year 2010-11 and it is low (0.62) in the year 2009-
10.
PROPRIETARY RATIO is high (1.68) in the year 2009-10 and it is low (0.10) in the year
2009-10
Capital Gearing Ratio is high (0.93) in the year 2009-10 and it is low (0.09) in the year
2010-11.
The comparative income statement for year 2010-11 the total revenue has increased
(50.14%) in the year 2011. Expenses have increased (51.30%) in the year 2011. Profit
before tax has been increased (38.69%) in the year 2011. Profit after tax amount decreased
(40.86%) in the year 2011.

76
The comparative balance sheet for the year 2010-11 the share capital has increased
(48.88%) in the year 2011. Reserves & Surplus has increased (22.75%) in the year
2011.Current asset has increased (41.71%) in the year 2011.Total assets and liabilities have
increased (44.35%) during the year 2011.
The comparative income statement for year 2011-12 the total revenue has increased
(39.59%) in the year 2012. Expenses have increased (41.59%) in the year 2012. Profit
before tax has been increased (162.15%) in the year 2012. Profit after tax amount decreased
(199.76%) in the year 2012.
The comparative balance sheet for the year 2011-12 the share capital has increased
(31.29%) in the year 2012. Short-term borrowings has increased (47.15%) in the year
2012.Short-term loans and advances has increased (34.93%) in the year 2012.Total assets
and liabilities have increased (36.92%) during the year 2012.
The comparative income statement for year 2012-13 the total revenue has increased
(75.91%) in the year 2013. Expenses have increased (66.64%) in the year 2013. Profit
before tax has been increased (34.57%) in the year 2013. Profit after tax amount decreased
(14.60%) in the year 2013.
The comparative balance sheet for the year 2012-13 the share capital has increased
(86.43%) in the year 2013. Short-term borrowings has increased (83.40%) in the year 2013.
Short-term loans and advances has increased (66.42%) in the year 2013. Total assets and
liability has increased (62.11%) during the year 2013.
The comparative income statement for year 2013-14 the total revenue has increased
(19.59%) in the year 2014. Expenses have increased (30.83%) in the year 2014. Profit
before tax has been decreased (-62.18%) in the year 2014. Profit after tax amount decreased
(-61.83%) in the year 2014.
The comparative balance sheet for the year 2013-14 the share capital funds has increased
(17.29%) in the year 2014. Short-term borrowings has increased (5.72%) in the year 2014.
Short-term loans and advances has decreased (-1.48%) in the year 2014. Total assets and
liability has increased (21.06%) during the year 2014.
The common size income statement for year 2010-11 the total revenue taken as100% other
components are expressed in term of total revenue. Total Expenses has increased (91.54%)
in the year 2011 compare with previous year it was (90.85%) Profit before tax has increased

77
(9.15%) in the year 2010 compare with previous year it was (8.46). Profit after tax amount
decreased (6.18%) during 2010 compare with previous year it was (5.79%).
The common size balance sheet for year 2010-11 the total assets and liabilities are taken
as100% other components are expressed in term of total assets and liabilities. Share capital
has increased (2.99%) in the year 2011 compare with previous year it was (2.90%).
Reserves & Surplus has decreased (1.74%) in the year 2011 compare with previous year it
was (2.05%). Current assets decreased (46.65%) in the year 2011 compare with previous
year it was (49.21%)
The common size income statement for year 2011-12 the total revenue taken as100% other
components are expressed in term of total revenue. Total Expenses has increased (92.79%)
in the year 2012 compare with previous year it was (91.48%) Profit before tax has increased
(15.88%) in the year 2012 compare with previous year it was (8.46%).Profit after tax
amount increased (12.44%) during 2012 compare with previous year it was (5.79%)
The common size balance sheet for year 2011-12 the total assets and liabilities are taken
as100% other components are expressed in term of total assets and liabilities. Share capital
decreased (2.83%) in the year 2010 compare with previous year it was (2.96). Short-term
borrowings has increased (68.71%) in the year 2010 compare with previous year it was
(63.93%). Short-term loans and advances decreased (81.60%) in the year 2010 compare
with previous year it was (82.81%)
The common size income statement for year 2012-13 the total revenue taken as100% other
components are expressed in term of total revenue. Total Expenses has decreased (87.90%)
in the year 2013 compare with previous year it was (92.79). Profit before tax has decreased
(12.15%) in the year 2013 compare with previous year it was (15.88%). Profit after tax
amount decreased (8.10%) during 2013 compare with previous year it was (12.44%)
The common size balance sheet for year 2012-13 the total assets and liabilities are taken
as100% other components are expressed in term of total assets and liabilities. Share capital
has increased (3.26%) in the year 2013 compare with previous year it was (2.83%) Short-
term borrowings has increased (77.74%) in the year 2013 compare with previous year it
was (68.71%). Short-term loans and advances increased (83.77%) in the year 2013
compare with previous year it was (81.60%)

78
The common size income statement for year 2013-14 the total revenue taken as100% other
components are expressed in term of total revenue. Total Expenses has increased (96.16%)
in the year 2014 compare with previous year it was (87.90). Profit before tax has decreased
(3.84%) in the year 20104 compare with previous year it was (12.15%). Profit after tax
amount decreased (2.59%) during 2014 compare with previous year it was (8.10%)
The common size balance sheet for year 2013-14 the total assets and liabilities are taken
as100% other components are expressed in term of total assets and liabilities. Share capital
has decreased (3.16%) in the year 2010 compare with previous year it was (3.26%).Short-
term borrowings has decreased (67.88%) in the year 2010 compare with previous year it
was (77.74%). Short-term loans and advances decreased (68.17%) in the year 2010
compare with previous year it was (83.7%)
Trent percentage in share capital in the year 2010 share capital is 100% whereas in 2014 it
is 427.41%. Hence it shows increasing trend and gradual improvement of the organization.
Trent percentage in Reserves & surplus shown an increasing trend in the period 2013. The
Reserves & surplus was showing decreasing trend in the period 2010.
Trent percentage in Fixed Assets shown an increasing trend in the period 2014. The Fixed
Assets was showing decreasing trend in the period 2010.
Trent percentage in Current Liabilities shown an increasing trend in the period 2014. The
Current Liabilities was showing decreasing trend in the period 2010.
Trent percentage in Revenue shows in the year 2010 Revenue is 100% whereas in 2014 it
is 440.92%. Hence it shows increasing trend and gradual improvement of the organization.
5.1.2 RECOMMENDATION
The company has to increase its gross profit and net profit by reducing their expenses which
in turn will increase the profitability ratio.
The company can adopt a better debt equity mix in the future to control the fluctuations in
returns.
The company should control fluctuations in cash and bank balances as it impacts the
current ratio of the company.

79
REFERENCES
JOURNALS
SudeepKalakkar (2012), “Key Factors in Determining the Financial Performance of the
Indian Banking Sector”, The IUP Journal of Managerial Economics, Vol.4,No.2,pp.56-
62, June 2012
McGowan Jr. ,Carl B Stambaughan and Andrew R, (20011), ‘Financial Analysis of Bank
Al Bilad’, International Business & Economical Research Journal; Mar 2011, Vol.10 Issue
3, p 9-16
M. Cathy Claiborne and Kirkland A. Wilcox (2011), ‘Home Heaters: A Holistic View of
Financial statement’, Issues In Accounting Education, Vol.26, No.4 2011 p 797-806
Beaver William H,Correia Maria and McNichols, Maureen F (2010), ‘Financial statement
analysis and the prediction of Financial’, Foundations & Trends in Accounting; 2010,
Vol.5 Issue 2, p 99-102
Venus C. Ibrara (2009), ‘Cash flow ratios; Tools for financial analysis’, Journal of
International Business Research, Volume 8, Special Issue1,2009
Professor M.R. Kumara swamy (2009), ‘Financial Management cell for New approach to
Ethical-Based Financial statement analysis’, Journal of Financial Management and
Analysis 22(2):2009 p 70-84
B. Sathish kumar (2008) , article on “Evaluation of the financial performance of Indian
private sector banks”, International journal of motivation, Management and technology,
vol.2,No.3,June2011
Mark T. Soliman (2004), ‘Using Industry-Adjusted Dupont Analysis to predict future
Profitability’ Graduate School of Business, Stanford University, Standford
Ehsan.H. Feroz, Sungsoo kim, Raymond L. Raab (2003) Conducted a study on “Financial
statement analysis : Data Envelopment approach”,Journal of the Operational Research
Society, Vol.54,pp.48-58.
Jaan Vainu (2002), ‘Bank performance analysis: Methodology and Empirical Evidence’,
Journal of Economic Literature Classification number 22(2):2009 p 70-84
John wild.J, Financial statement analysis ,5th Edition Tata MC Graw Hill

80
N.Ramachandran and Ramkumar, How to Analyze financial statement,Tata MC Graw Hill
Erich.A.Helfert, Techniques of Financial Analysis: A practical guide to measuring
business performance, 9th edition.
Oliver.G.Wood, Analysis of Bank financial statements.
WEBSITES
www.townbenefitfund.com
www.financial ratios.com
www.indiarating.co.in/upload/research/special/reports/2013/1/31/fitch31major.pdfrbi.org
www.articlebase.com
www.investorworld.com/nbfc