financial inclusion global initiative (figi)
TRANSCRIPT

I n t e r n a t i o n a l T e l e c o m m u n i c a t i o n U n i o n
FINANCIAL INCLUSION GLOBAL INITIATIVE (FIGI)
TELECOMMUNICATION STANDARDIZATION SECTOR OF ITU
08/2020
Security, Infrastructure and Trust Working Group
Test Campaign Report: Cross-border and inter-operator testing of Digital Financial Services, P2P money transfer
Report of the Quality of Service Workstream

DISCLAIMER
The Financial Inclusion Global Initiative (FIGI) is a three-year program implemented in partnership by
the World Bank Group (WBG), the Committee on Payments and Market Infrastructures (CPMI), and the International Telecommunication Union (ITU), funded by the Bill & Melinda Gates Foundation
(BMGF) to facilitate the implementation of country-led reforms to attain national financial inclusion
targets, and ultimately the global 'Universal Financial Access 2020' goal. FIGI funds initiatives in three
countries-China, Egypt and Mexico; supports working groups to address three distinct challenges for reaching universal financial access:
(1) the Electronic Payment Acceptance Working Group (led by the WBG),
(2) The Digital ID for Financial Services Working Group (led by the WBG), and (3) The Security, Infrastructure and Trust Working Group (led by the ITU).
FIGI hosts three annual symposia to assemble national authorities, the private sector, and other relevant stakeholders to share emerging insights from the Working Groups and country level implementation.
This report is a product of the FIGI Security, Infrastructure and Trust Working Group, led by the
International Telecommunication Union. The findings, interpretations, and conclusions expressed in this work do not necessarily reflect the views of the Financial Inclusion Global Initiative partners
including the Committee on Payments and Market Infrastructures, the Bill & Melinda Gates Foundation,
the International Telecommunication Union, or the World Bank (including its Board of Executive Directors or the governments they represent). The mention of specific companies, or of certain
manufacturers’ products does not imply that they are endorsed nor recommended by ITU in preference
to others of a similar nature that are not mentioned. Errors and omissions excepted, the names of proprietary products are distinguished by initial capital letters. The FIGI partners do not guarantee the
accuracy of the data included in this work. The boundaries, colours, denominations, and other
information shown on any map in this work do not imply any judgment on the part of the FIGI partners
concerning the legal status of any country, territory, city or area or of its authorities or the endorsement or acceptance of such boundaries.
© ITU 2020
Some rights reserved. This work is licensed to the public through a Creative Commons Attribution-Non-
Commercial-Share Alike 3.0 IGO license (CC BY-NC-SA 3.0 IGO).
Under the terms of this licence, you may copy, redistribute and adapt the work for non-commercial purposes, provided the work is appropriately cited. In any use of this work, there should be no suggestion
that ITU or other FIGI partners endorse any specific organization, products or services. The
unauthorized use of the ITU and other FIGI partners’ names or logos is not permitted. If you adapt the
work, then you must license your work under the same or equivalent Creative Commons licence. If you create a translation of this work, you should add the following disclaimer along with the suggested
citation: “This translation was not created by the International Telecommunication Union (ITU). ITU is
not responsible for the content or accuracy of this translation. The original English edition shall be the
binding and authentic edition”.
For more information, please visit https://creativecommons.org/licenses/by-nc-sa/3.0/igo/

Table of Contents
1 Terms and abbreviations .............................................................................................................6
2 Campaign overview ....................................................................................................................7
3 Team structure and Data acquisition ............................................................................................9
4 Data cleansing for final processing ............................................................................................ 11
4.1 Finalization of MSW data .................................................................................................. 11
4.2 Inspection and finalization of the TAL ............................................................................... 12
4.3 Inspection and finalization of the DAL .............................................................................. 13
5 Data Processing ........................................................................................................................ 13
5.1 Overview and Data object name reference ......................................................................... 13
5.2 Validation .......................................................................................................................... 14
5.2.1 Resolved: MSW items with contradicting content .......................................................... 14
5.2.2 Resolved: Transactions not covered by TAL .............................................................. 14
5.3 Process TAL ...................................................................................................................... 15
5.4 Process MSW data ............................................................................................................. 15
5.4.1 Inspect for remarks ........................................................................................................ 15
5.4.2 Create the MSW_Processed table ............................................................................... 16
5.4.3 Create the MSW_TAL_Joined table ............................................................................... 16
5.4.4 Create MSW KPI ....................................................................................................... 16
5.5 Process the background testing data (ObsTool/AVDTA) .................................................... 16
5.5.1 Create the AVDTA_Processed table .............................................................................. 16
5.5.2 Create the AVDTA_TAL_Joined table....................................................................... 17
5.5.3 Calculate aggregated KPI per scenario ........................................................................... 17
5.6 Joining MSW and AVDTA data ........................................................................................ 17
5.6.1 Calculating MSW vs AVDTA KPI ................................................................................ 17
6 Results ...................................................................................................................................... 17
6.1 Scenario overview ............................................................................................................. 17
6.2 Transaction model, MSW generic and standard KPI .......................................................... 18
6.3 MSW transaction count by scenario ................................................................................... 19
6.4 MSW generic KPI per scenario .......................................................................................... 20
6.5 MSW standardized KPI per scenario .................................................................................. 24
6.5.1 KPI Selection................................................................................................................. 24
6.5.2 KPI Output, overview for all use cases ....................................................................... 24
6.5.3 KPI output per use case category.................................................................................... 26
6.5.3.1 Intra-country (same country) .................................................................................. 26
6.5.3.2 Inter-country (cross-border) ................................................................................... 27

6.5.4 Details ....................................................................................................................... 27
6.6 Mobile-network measurement TA count per scenario ......................................................... 28
6.7 Mobile-network KPI per scenario ...................................................................................... 29
6.7.1 KPI and validity rules used ............................................................................................ 29
6.7.2 Network KPI Overview ................................................................................................. 31
6.8 Combined DFS and network KPI ....................................................................................... 35
6.8.1 All scenarios .............................................................................................................. 37
6.8.2 Use case scenario by operator/country ........................................................................ 39
6.8.2.1 Airtel Rwanda ........................................................................................................ 39
6.8.2.2 Airtel Uganda ........................................................................................................ 40
6.8.2.3 MTN Ghana ........................................................................................................... 41
6.8.2.4 MTN Rwanda ........................................................................................................ 42
6.8.2.5 MTN Uganda ......................................................................................................... 44
6.8.2.6 Vodafone Ghana .................................................................................................... 45
7 Annex A: Specific procedures used in the project ...................................................................... 46
7.1 Check on devices for files which have not been uploaded .................................................. 46
7.1.1 MSW ............................................................................................................................. 46
7.1.2 ObsTool......................................................................................................................... 46
8 Annex B: Device set-up and training materials .......................................................................... 47
9 Annex C: Network KPI overview from background testing ....................................................... 47
10 Annex D: SQL Queries used in data processing ........................... Error! Bookmark not defined.
11 Version Log ................................................................................ Error! Bookmark not defined.

About this document
This report was written by Wolfgang Balzer, Focus Infocom and was produced as part of the
deliverable of the Quality of Service (QoS) Workstream of the FIGI Security Infrastructure and
Trust Working Group.
The report describes the workflow and results of the testing campaign for (FI project code
LID2661) in a testing campaign of digital financial services in Ghana, Rwanda and Uganda
The author would like to thank Kwame Baah-Acheamfuor for reviewing the report and
facilitating the process for coordinating with the teams in Ghana, Rwanda and Uganda for the
QoS field measurements. The author would also like to thank Vijay Mauree and Arnold
Kibuuka for reviewing and editing the report and the Security, Infrastructure and Trust Working
Group for their feedback.
If you would like to provide any additional information, please contact Vijay Mauree at
This document is part of the deliverables of a project where creation of an underlying
methodology was the other (main) deliverable. The present document is, in consistence with
the original naming of deliverables, called Report while the term Methodology is used to refer
to that deliverable.
For the convenience of reading as well as out of maintenance considerations, reference to
standards documents and other materials in the present document are made in short form
(example: P.1502 refers to ITU-T recommendation P.1502). The main reference is the
References section of the Methodology document where also hyperlinks for access to original
documents are provided.
Figure 1 Mode of referencing used in the deliverables
Please note, however, that due to the project definition, the actual implementation of data
processing is not included in the deliverables. Therefore, material such as SQL queries or data
base related references are intended only as examples with no warranty of functionality.
1 Terms and abbreviations
Please note: The following is a copy of the T&A in the Methodology, providing for
convenience of reading. Some terms listed may not be used in the present document.
Please refer to P.1502 for a full list of abbreviations. The following list contains only newly
created abbreviations and, for convenience of reading, the most frequently used abbreviations
in the context of Digital Financial Services.
API Application Programming Interface
DAL Device Assignment List (see Methodology for a full explanation)
DFS Digital Financial Services
E2E End-to-end
FTL Field Test Lead (role name, the person responsible for directing field tests)
ITU-T International Telecommunication Union, Telecom Standardization sector
KPI Key Performance Indicator
MSW Multi-stopwatch tool (see Methodology for a full description)
NSMS Notification SMS
PIN Personal Identification Number
P2P Person-to-Person
QoE Quality of Experience
QoS Quality of Service
RAT Radio Access Technology
TA Transaction
TAL Team Assignment List (see Methodology for a full explanation)
SMS Short Message Service (also used for a single text message transmitted by SMS)

2 Campaign overview
The subject of this report is a 3-country testing campaign conducted between 11th May, 2020
and 6th June, 2020 (with campaign set-up, training and pre-testing from middle of April on)1.
Figure 2 Symbolic campaign overview (image credits see footnote):
The campaign was done to test and validate extended methodologies on person-to-person
money transfer in inter-operator, cross-country use cases. Also, the campaign aimed at getting
an information base of DFS services in those countries.
Four categories of tests were performed:
• Same country (Intra-country), same operator/network
• Same country (Intra-country), different operators (inter-operator/network)
• Cross-border (Inter-country), same operator/network (i.e. same group)
• Cross-border (Inter-country), different operators/networks
1 Image credits: Ghana map: By Burmesedays, minor amendments by Joelf - Own work based on Perry-Castañeda Library Map
Collection Ghana Maps, CC BY-SA 3.0, https://commons.wikimedia.org/w/index.php?curid=22745324
Ghana flag: Public Domain, https://commons.wikimedia.org/w/index.php?curid=343073
Uganda map: By OCHA, CC BY 3.0, https://commons.wikimedia.org/w/index.php?curid=34826076
Uganda flag: By tobias - From the Open ClipArt Library website., Public Domain,
https://commons.wikimedia.org/w/index.php?curid=433085
Rwanda location map: By OCHA, CC BY 3.0, https://commons.wikimedia.org/w/index.php?curid=34826078
Rwanda flag: By !Original:UnknownVector: Zscout370 -
http://www.primature.gov.rw/component/option,com_docman/task,doc_download/gid,859/Itemid,95/, Public
Domain, https://commons.wikimedia.org/w/index.php?curid=327857
Logos:
MTN Group: Von MTN - mtn.co.za, Gemeinfrei, https://commons.wikimedia.org/w/index.php?curid=37719378 Vodafone Ghana: By Vodafone - Vodafone UK, Public Domain,
https://en.wikipedia.org/w/index.php?curid=57428450
Airtel Africa: By airtel - www.airtel.in, Public Domain, https://en.wikipedia.org/w/index.php?curid=30177516

Remark: During the editing process of the report, some changes to wording with respect to
use cases and team allocations were made. The tables and diagrams shown in the present
documents use labels from original data (originating from the TAL and DAL) to enable
referencing into that data. Some terms are used synonymously to each other, e.g. same
country = intra-country or inter-country = cross-border. The above bullet point list also
serves to show respective synonyms.
The following table shows the scenarios planned, and information on their status. Some tests
could not be carried out due to either permanent restrictions, or due to unavailability at
campaign time (i.e. NOT POSSIBLE means unavailable at the time of testing).
Table 1 Scenario overview, grouped by status and ordered alphabetically by owner team name. If
limits for transfers are given, they are per day.
Scenario Owner Team Status Characteristics
Cross-country Group network Airtel
Rwanda to Airtel Uganda
Airtel
Rwanda Completed
Limited by 20 Transfers
received by Airtel Uganda
Same Network Airtel Rwanda to Airtel Rwanda
Airtel Rwanda Completed Unlimited transfers
Same Network MTN Rwanda to MTN
Rwanda
Airtel
Rwanda Completed
MTN SIMs used in the
"Airtel" devices
Same Network Airtel Uganda to Airtel Uganda Airtel Uganda Completed
Limited to 20 Transfers out and 20 transfers in
Inter-network Airtel Uganda to MTN
Uganda Airtel Uganda Completed
Limited by 20 Transfers
out
Cross-country Group network Airtel Uganda to Airtel Rwanda Airtel Uganda Completed
Limited by 20 Transfers out
Inter-network MTN Ghana to Vodafone
Ghana MTN Ghana Completed Unlimited transfers
Same Network MTN Ghana to MTN Ghana MTN Ghana Completed Unlimited transfers
Same Network MTN Rwanda to MTN
Rwanda MTN Rwanda Completed
Limited to 10 Transfers
out and 10 transfers in
Cross-country Group network MTN Rwanda to MTN Uganda MTN Rwanda Completed
Limited to 10 Transfers out and 10 transfers in
Cross-country Different network MTN
Rwanda to Airtel Uganda MTN Rwanda Completed
Limited to 10 Transfers
out
Cross-country Group network MTN
Uganda to MTN Rwanda MTN Uganda Completed
Limited to 10 Transfers out received by MTN
Rwanda
Inter-network MTN Uganda to Airtel Uganda MTN Uganda Completed
Limited by 20 Transfers received by Airtel Uganda
Same Network MTN Uganda to MTN
Uganda MTN Uganda Completed
Unlimited transfers except
to Ushs 7,000,000 (approx.
1900 USD)
Same Network Vodafone Ghana to
Vodafone Ghana
Vodafone
Ghana Completed Unlimited transfers
Inter-network Vodafone Ghana to MTN
Ghana
Vodafone
Ghana Completed Unlimited transfers
Inter-network Airtel Rwanda to MTN
Rwanda
Airtel
Rwanda
NOT
POSSIBL
E
No Inter-network
interoperability

Scenario Owner Team Status Characteristics
Cross-country Different network Airtel
Rwanda to MTN Uganda
Airtel
Rwanda
NOT POSSIBL
E
No Cross-country
interoperability
Cross-country Different network Airtel
Uganda to MTN Rwanda Airtel Uganda
NOT POSSIBL
E (see
Remark 1)
No Cross-country
interoperability
Inter-network MTN Rwanda to Airtel
Rwanda MTN Rwanda
NOT POSSIBL
E
No Inter-network
interoperability
Cross-country Different network MTN Uganda to Airtel Rwanda MTN Uganda
NOT
POSSIBLE
No Cross-country interoperability
Remark 1: After closure of the campaign, further investigations were done with respect to
feasibility of tests. It could be determined that transfers from Airtel Uganda to MTN Rwanda
are, as of 14th July 2020 now possible.
3 Team structure and Data acquisition
In the originally planned structure (see Figure 3, the structure shown in the figure below
would have been used, with a total of four teams (where a team may consist of one or more
persons). Instead, due to travel/location restrictions due to the Covid19 pandemic, six teams
were set up where each team was running tests in a separate location; see Figure 4. Team
names were assigned due to the primary set-up of devices.
Remark: Please note that in a later phase of the project, one team was using a different set-
up to increase the number of samples by parallel testing. The methodology was extended
respectively to include the concept of “owner team” vs. configuration.

Figure 4 Actual project structure with team names equal to the primary set-up of respective devices.
Each team was using a DFS testing toll, and an observation devices (see details in the text)
The set-up was following the Methodology. In order to reduce resource usage, the network
background testing and the multi-stopwatch app were run on the same device. Also to save
resources (e.g. transferred data volume), as the tests were done stationary, i.e. in the same
location, mobile network background testing was not run over the whole DFS testing time,
but only for a part of the time.
Devices were of type Samsung A10 (Android smartphone, “out of the box”, i.e. unmodified).
These devices were – also due to Covid19 restrictions - sourced by each team directly. Set-up
was done locally with the MSW app and the DFS Observer app provided “over the air” by
Focus Infocom and with support provided by Focus Infocom.
Remark: See Annex B for a copy of the set-up/training instructions to further describe the set-
up process.
Before starting the actual measurements, several trial and validation runs were made, as well
as a remotely conducted training of teams by support staff from Focus Infocom.
Originally, each team had their specific device set-up for one operator with respective
naming, e.g. the team running the Vodafone Ghana set-up had also that name (logical team).
In some cases, to mitigate transaction-count limits, device set-ups were changed to generate
more samples for a specific scenario. Consequently, the logical structure of the data had to be
Figure 3 Originally planned structure of teams in Ghana, Rwanda and Uganda (w/o Corona)
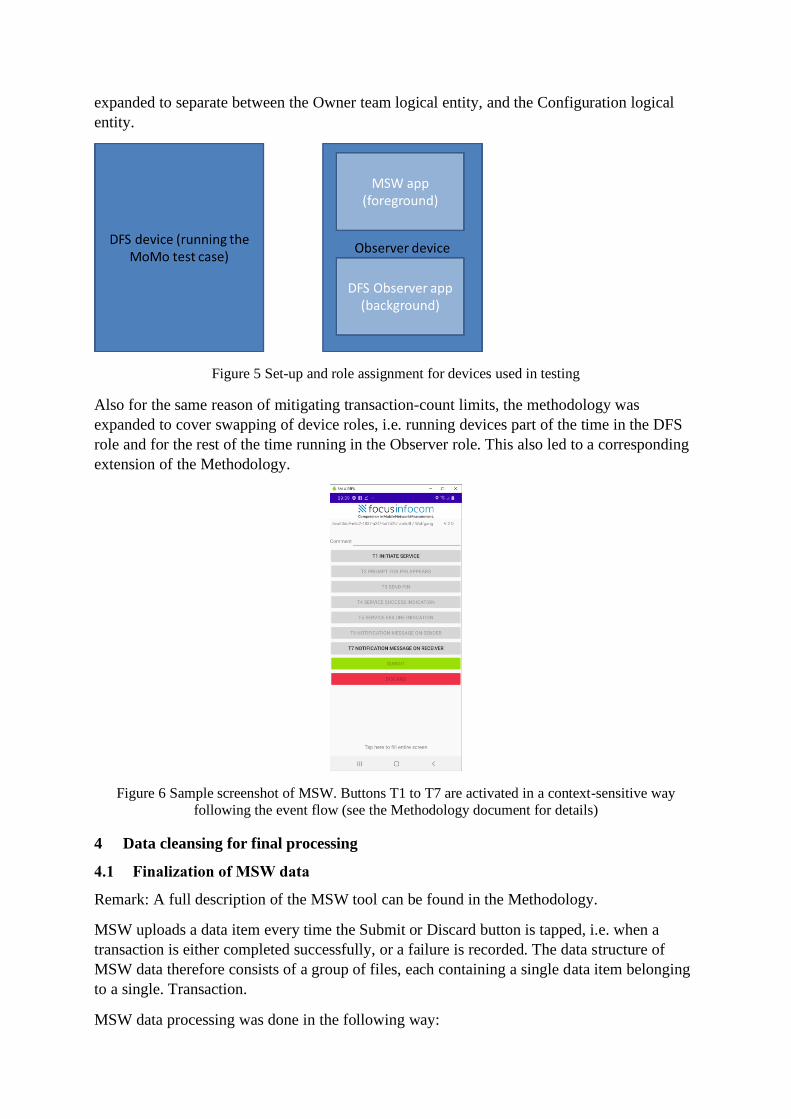
expanded to separate between the Owner team logical entity, and the Configuration logical
entity.
Figure 5 Set-up and role assignment for devices used in testing
Also for the same reason of mitigating transaction-count limits, the methodology was
expanded to cover swapping of device roles, i.e. running devices part of the time in the DFS
role and for the rest of the time running in the Observer role. This also led to a corresponding
extension of the Methodology.
Figure 6 Sample screenshot of MSW. Buttons T1 to T7 are activated in a context-sensitive way
following the event flow (see the Methodology document for details)
4 Data cleansing for final processing
4.1 Finalization of MSW data
Remark: A full description of the MSW tool can be found in the Methodology.
MSW uploads a data item every time the Submit or Discard button is tapped, i.e. when a
transaction is either completed successfully, or a failure is recorded. The data structure of
MSW data therefore consists of a group of files, each containing a single data item belonging
to a single. Transaction.
MSW data processing was done in the following way:

1. Combine uploaded data by a Windows batch file concatenating all data into a single
text file with a header line which is required for subsequent processing. In the current
case, the header line also contained placeholder/instruction text to instruct users how
to run subsequent steps of data handling.
2. Open the output file from step 1 in Excel®, inspect and finalize the data towards a file
which can be imported into the processing database.
4.2 Inspection and finalization of the TAL
As planned, the final TAL structure defined in the Methodology was the result of an evolution
which balanced requirements for simple and easy provision of data with the requirement of
operational robustness and maximum safety against artefacts which could endanger data
integrity and correctness of results.
In the “raw” TAL, team names and descriptions of activity flows were entered in free text.
The formal TAL defines primary entry fields, and automatic generation of descriptors from
these fields:
In the process of TAL finalization, primary input fields were added with content taken from
the original input list. Then, generated descriptors were compared against original input, and
differences were removed.
A typical situation is insertion of additional whitespace characters when inputting text
directly. If the whitespace (e.g. a blank character) is at the end of a word or phrase, it is
impossible to see directly; if whitespaces are between words or at the beginning of a line, it is
at least hard to see, in particular, when one does not directly look for such artefacts.
Therefore, when processing Excel® lists, formula-based text comparisons were used to
identify such effects. This requires a certain effort; this pays off hugely later when data is
processed in databases and where such “clean” data reduces the probability of undetected
serious data-processing errors considerably.
Due to operational requirements, a re-assignment of devices and SIMs was done. Original
text:
(E-mail as of 11.6.20)
MTN Rwanda
The labelled Team ID Airtel Rwanda in the MTN Rwanda log for 1st, 3rd to June was
because Rwanda MTN SIM cards were used in the "Airtel Rwanda phones" to do tests
to Airtel Uganda as MTN Rwanda is limited to 10 transactions a day. This was done to
increase the transactions to 20 tests a day. The Team ID has been relabelled MTN
Rwanda as the network was MTN.
Consequentially, DAL and TAL have been expanded by respective OwnerTeam columns.
Data entities now are:
ConfigName (formerly “TeamName”). Default: Constructed from Operator and Country, =
<Operator><blank space><Country>
OwnerTeam: The name of the team which holds/own a particular set of devices. By default,
set to DeviceConfig.

If an assignment over time changes, this shall be expressed by multiple rows in the DAL, and
respective entries in the TAL.
4.3 Inspection and finalization of the DAL
The finalization of the DAL was done following the same considerations and procedures as
described in the previous subsection for the TAL. In essence, the free-text team names were
replaced by constructed team names (from country and operator) as defined in the
Methodology, and additional check code was added to make sure this was consistent with
original input.
To check for the completeness and correctness of the DAL, an iterative process was then run
(using the already imported MSW data) to check the MSW data against the DAL and see if all
MSW ID’s could be resolved to a valid team name. For input, the logs provide by the teams
(or rather, the processed versions provided by the Field Test lead) were used.
5 Data Processing
5.1 Overview and Data object name reference
The following table shows the names assigned to the data objects. These names will be used
to refer to respective data (meaning the respective cleansed version of that data) for the rest of
this document.
Table 2 Data object and naming overview
Data object type Short data object name Name in database
MSW data combined from all
uploaded data items, with column
header added, into a single data file
which is then imported into a table
MSW_Raw Same as short name
MSW data with added reference
information to configurations
MSW_Processed
Device Assignment List data, cleansed
and imported into a table
DAL
Team Assignment List data, cleansed
and imported into a table
TAL
Imported TAL with additions for
further processing
TAL_Processed
MSW data combined with TAL
information. This table contains the
assignment to scenarios and is the
input source for KPI computation.
MSW_TAL_Joined
Data from background measurement,
pre-processed into a single data file
which is then imported into a table
AVDTA_Raw
AVDTA data with relation to
ConfigName/country and further
information supporting data evaluation
AVDTA_Processed
AVDTA data with assignment of test
scenarios
AVDTA_TAL_Joined

Figure 7 shows the data objects and the processing relations between them (please note that
this figure is only a symbolic view; the textual description has preference).
Figure 7 Symbolic overview of data objects and processing
5.2 Validation
5.2.1 Resolved: MSW items with contradicting content
- Anomalies A1: Nominal number of T exceeded but TA logged as successful
- Anomalies A2: T5 set but T4 and/or T6 also set
These issues have been resolved by consultation with the FTL (24.6.20). Decisions are:
1. For Anomalies A1: Ignore the limits for now and let us see what becomes of the
events after the limits as success or failures. These limitations on Airtel Uganda and
MTN Rwanda were learnt during the testing and we have to use the transactions done
after the limits (i.e. 20 counts for Airtel Uganda and 10 counts for MTN Rwanda) to
establish or otherwise any limits.
Action: modify/extend mask-out logic such that in case of a successful TA, the TA is
not masked out.
2. 2For Anomalies A2, I have consulted with the Teams and they have confirmed that T5
were hit-ons either by mistake or delayed success message. Please consider them as
success and cross check.
Action: Implemented by algorithm using presence of T6 in case of missing T4 as
success.
5.2.2 Resolved: Transactions not covered by TAL
Upon joining MSW data with TAL information (to assign the testing scenario) it was detected
that some TA were not covered by valid TAL entries. After investigating with the FTL, it was
determined that the team did one extra day of measurements. The TAL was adjusted
accordingly, and the data analysis was re-run to include the TA.
Actions:
• Modify the TAL (Team: Airtel Rwanda), change end date from 25.5.20 to 26.5.20

• Re-import the TAL
• Re-create tables/visualizations for TAL scenario time coverage
• Re-run the Join operation for MSW and ObsTool data
• Re-calculate aggregated KPI for DFS and network.
5.3 Process TAL
Create a TAL_Processed table containing the contents of the imported TAL plus
• Generated full scenario description.
• Generated unique index (ScenarioIX, short: SIX). This is – in connection with a look-
up table also generated from TAL_Processed - used for labelling in cases where the
full scenario name would be too long. Please note: If the TAL is created again, make
sure the index is consistent.
5.4 Process MSW data
5.4.1 Inspect for remarks
The MSW tool had an entry field for remarks which allowed free-text entry. Due to the fact
that this project was also a first-time application of this new tool, initially there was no
“protocol” for usage of this field. This way, some first-hand insights could be gained on how
testers would be using this field.
There were total of 467 otherwise valid MSW data items (i.e. assigned to a team and within
the campaign time range) having non-empty remark fields.
Out of those, 382 items contained a “success” indication; all of those were however also
technically classified as successful; also, all these entries had valid Submit timestamps and
empty/NULL Discard timestamps. This means the remark was not a correction of a wrong
entry (e.g. having hit the T5 button instead of the T4 button, but just a confirmation. It is
assumed that the intention of the testers was to support the evaluation but training for future
cases could include the instruction that this is not necessary as long as there are no button-
entry errors to be corrected.
From the remaining 85 items, 27 contained wording referring to time-outs, and the vast
majority of them were from Airtel Uganda with the specific text ‘Timeout waiting for mule
context to be completely started’ and technical classification as unsuccessful.
Also, in some other TA text pointed to problems related with the DFS service. From the
remaining items, there was a cluster of “network down/network failure/connection problem”
items, mostly from MTN Rwanda but also from other teams.
As part of the data cleansing procedure defined by the Methodology, clarification was sought
about inclusion/exclusion of respective categories from the set of valid transactions. In this
particular case, it was decided that two KPI for MTCD were computed to show a corridor of
possible values; see subsequent sections for details.
Decisions about inclusion/exclusion of items based on content of remarks were implemented
in the SQL statements which created the working set of data. This is encouraged as a general
mode of operation as this provides a transparent, reproducible way of processing the data.

5.4.2 Create the MSW_Processed table
After import to the database, use the MSW_Raw table to create this table, to contain
• Columns ConfigName and Country. The content is either created directly via case
statements using the MSW ID, or by joining respectively with the DAL.
• A column isSuccess which has the values 1 or 0 depending on the outcome of the
transaction. This column will later be used for computation of KPI.
• Optional additional Day and Hour columns in case daily our hourly profiles shall be
created.
Mask-out information derived from direct table content (e.g. via the Remark fields), or
through mask-out or mask-in time ranges, can be added depending on actual data content.
5.4.3 Create the MSW_TAL_Joined table
This table uses the start and stop dates and the scenario names to identify, for each TA, the
scenario it belongs to. In the database, this is done by joining the TAL on the ConfigName
and the date range information.
Also, a per-day, per-ID sequence number is generated. Using this sequence number and the
information on the maximum number of transactions per day given in the TAL, a mask-out
indicator for further usage in KPI processing (TAIsValidBySeqno) is also generated.
The indicator is created in the query creating the table. Its value is 1 if the transaction shall be
considered in KPI, and 0 otherwise. For instance, if the maximum number of transactions per
day is 10, this indicator will be set to 1 for sequence numbers of 1-10 (including) and 0 for
sequence numbers > 10.
Remark: The mask-out indicator will typically be extended to also cover individual cases
based on time-range or information from the MSW Remark field.
5.4.4 Create MSW KPI
KPI generation is straightforward, following the usual methods for aggregation in data bases
(grouping).
5.5 Process the background testing data (ObsTool/AVDTA)
5.5.1 Create the AVDTA_Processed table
After import to the database, use the AVDTA_Raw table to create this table, to contain
• Columns ConfigName and Country. The content is either created directly via case
statements using the ObsTool ID (IMEI), or by joining respectively with the DAL.
• Additional Day, Hour and 10-minute slot columns to enable aggregation by time slot.
Depending on information from field logs, single transactions or time ranges may be masked
out, e.g. in case unusual system or network behaviour was observed.
Please note that this table still contains data from the entire time the ObsTool was active.
Masking out based on MSW information will be done in a subsequent step.

5.5.2 Create the AVDTA_TAL_Joined table
This table uses the start and stop dates and the scenario names to identify, for each TA, the
scenario it belongs to. In the database, this is done by joining the TAL on the ConfigName
and the date range information.
5.5.3 Calculate aggregated KPI per scenario
KPI generation is straightforward, following the usual methods for aggregation in data bases
(grouping).
5.6 Joining MSW and AVDTA data
Due to the relatively small number of data items and given the fact that all tests were done in
the same locations per team, the primary method was using per-scenario aggregation over all
data, described in the following subsection.
5.6.1 Calculating MSW vs AVDTA KPI
This output is generated by joining the respective KPI tables by scenario such that a common
output table is created. Each line shows a scenario, with columns for DFS and network KPI,
respectively.
This operation does not create an output table; it is realized by a respective combined SQL
statement which directly produces an Excel-ready output table.
6 Results
6.1 Scenario overview
The following graph shows the timing of scenarios during the campaign.
Figure 8 Scenario overview by date. Please note that the scenario “Same network MTN Rwanda”
appears twice as it was tested by the MTN Rwanda team between 20.5.20 and 26.5.20, and again by
the Airtel Rwanda team between 1.6.20 and 5.6.20.
The table below shows details of scenario assignment to teams. Please note that the team and
configuration names are typically identical (i.e. a team was using the same operator/country
Crosscountry Group network_Airtel Rwanda_to_Airtel Uganda
Crosscountry Group network_Airtel Uganda_to_Airtel Rwanda
Crosscountry Group network_MTN Rwanda_to_MTN Uganda
Crosscountry Group network_MTN Uganda_to_MTN Rwanda
InterNetwork_MTN Ghana_to_Vodafone Ghana
InterNetwork_Vodafone Ghana_to_MTN Ghana
Same Network_Airtel Uganda_to_Airtel Uganda
Same Network_MTN Uganda_to_MTN Uganda
Same Network_MTN Rwanda_to_MTN Rwanda
Same Network_Airtel Rwanda_to_Airtel Rwanda
Same Network_MTN Ghana_to_MTN Ghana
Same Network_Vodafone Ghana_to_Vodafone Ghana
InterNetwork_MTN Uganda_to_Airtel Uganda
InterNetwork_Airtel Uganda_to_MTN Uganda
Crosscountry Different network_MTN Rwanda_to_Airtel Uganda
Same Network_MTN Rwanda_to_MTN Rwanda

set-up throughout the campaign) but in some cases differ where a team was using a different
operator/country set-up.
Table 3 Overview of team assignments to scenarios. SIX is a logical scenario index for later use.
Please note that the To date includes that day.
Team A side config. Scenario From Days To SIX Remarks
Airtel Rwanda Airtel Rwanda
Cross-country Group network Airtel Rwanda to Airtel Uganda 11.05.2020 5 15.05.2020 5
Limited by 20 Transfers received by Airtel Uganda
Airtel Uganda Airtel Uganda
Cross-country Group network Airtel Uganda to Airtel Rwanda 11.05.2020 5 15.05.2020 6
Limited by 20 Transfers out
MTN Rwanda MTN Rwanda Cross-country Group network MTN Rwanda to MTN Uganda 11.05.2020 5 15.05.2020 7
Limited to 10 Transfers out and 10 transfers in
MTN Uganda MTN Uganda Cross-country Group network MTN Uganda to MTN Rwanda 11.05.2020 5 15.05.2020 8
Limited to 10 Transfers out received by MTN Rwanda
MTN Ghana MTN Ghana Inter-network MTN Ghana to Vodafone Ghana 11.05.2020 5 15.05.2020 11
Unlimited transfers
Vodafone Ghana Vodafone Ghana Inter-network Vodafone Ghana to MTN Ghana 11.05.2020 5 15.05.2020 15
Unlimited transfers
Airtel Uganda Airtel Uganda Same Network Airtel Uganda to Airtel Uganda 19.05.2020 7 25.05.2020 17
Limited to 20 Transfers out and 20 transfers in
MTN Uganda MTN Uganda Same Network MTN Uganda to MTN Uganda 19.05.2020 7 25.05.2020 20
Unlimited transfers except to Ushs 7,000,000
MTN Rwanda MTN Rwanda Same Network MTN Rwanda to MTN Rwanda 20.05.2020 7 26.05.2020 19
Limited to 10 Transfers out and 10 transfers in
Airtel Rwanda Airtel Rwanda Same Network Airtel Rwanda to Airtel Rwanda 21.05.2020 6 26.05.2020 16
Unlimited transfers
MTN Ghana MTN Ghana Same Network MTN Ghana to MTN Ghana 23.05.2020 5 27.05.2020 18
Unlimited transfers
Vodafone Ghana Vodafone Ghana Same Network Vodafone Ghana to Vodafone Ghana 23.05.2020 5 27.05.2020 21
Unlimited transfers
MTN Uganda MTN Uganda Inter-network MTN Uganda to Airtel Uganda 26.05.2020 5 30.05.2020 14
Limited by 20 Transfers received by Airtel Uganda
Airtel Uganda Airtel Uganda Inter-network Airtel Uganda to MTN Uganda 26.05.2020 5 30.05.2020 10
Limited by 20 Transfers out
MTN Rwanda MTN Rwanda
Cross-country Different network MTN Rwanda to Airtel Uganda 01.06.2020 5 05.06.2020 3
Limited to 10 Transfers out
Airtel Rwanda MTN Rwanda Same network MTN Rwanda to MTN Rwanda 01.06.2020 5 05.06.2020 13
MTN SIMs used in the "Airtel" devices
6.2 Transaction model, MSW generic and standard KPI
As the implementation of DFS was not identical between countries/operators, the structure of
measurement data was not entirely uniform. Specifically, there were cases where no “T4
events” were present. Figure 9 repeats an excerpt from the Methodology document to show
the events and associated timerflags.

Figure 9 Principal events and associated timer flags
In some scenarios, the implementation produced no primary success indicators (or the
notifications were so fast that they superseded these vents), so testers did not log T4. By
formal definition of DFS KPI, this would mean that no MTCD could be computed. For
pragmatic reasons, in such cases T6 was understood to be equivalent to T4. Nevertheless, to
keep the formal structure, first a generic KPI termed “Execution time” (abbreviated ET) was
defined. Respective results are shown in section MSW generic KPI per scenario. Then, in
section MSW standardized KPI per scenario, the set applicable formal KPI is described and
respective results are shown.
6.3 MSW transaction count by scenario
The following table shows the yield per scenario. Please note that for the “Same network
MTN Rwanda” scenario, two teams were allocated to run tests due to the limitation of 10
transactions per day.
Table 4 MSW transaction count per scenario. Please note that for the MTN Rwanda intra-network
scenario, two entries exist because two teams were tasked to test this scenario.
Scenario A side team
Raw TA
Count
Valid TA
Count Range from Range to
Cross-country Different network MTN Rwanda to Airtel Uganda MTN Rwanda 53 52 01.06.2020 05.06.2020
Cross-country Group network Airtel Rwanda to Airtel Uganda Airtel Rwanda 107 107 11.05.2020 15.05.2020
Cross-country Group network Airtel Uganda to Airtel Rwanda Airtel Uganda 129 114 11.05.2020 15.05.2020
Cross-country Group network MTN Rwanda to MTN Uganda MTN Rwanda 87 62 11.05.2020 15.05.2020
Cross-country Group network MTN Uganda to MTN Rwanda MTN Uganda 41 41 11.05.2020 15.05.2020
Inter-network Airtel Uganda to MTN Uganda Airtel Uganda 211 211 26.05.2020 30.05.2020
Inter-network MTN Ghana to Vodafone Ghana MTN Ghana 195 195 11.05.2020 15.05.2020
Inter-network MTN Uganda to Airtel Uganda MTN Uganda 215 210 26.05.2020 30.05.2020
Inter-network Vodafone Ghana to MTN Ghana Vodafone Ghana 156 156 11.05.2020 15.05.2020
Same Network Airtel Rwanda to Airtel Rwanda Airtel Rwanda 330 330 21.05.2020 26.05.2020
Same Network Airtel Uganda to Airtel Uganda Airtel Uganda 209 209 19.05.2020 25.05.2020
Same Network MTN Ghana to MTN Ghana MTN Ghana 329 329 23.05.2020 27.05.2020
Same Network MTN Rwanda to MTN Rwanda Airtel Rwanda 41 41 01.06.2020 05.06.2020
Same Network MTN Rwanda to MTN Rwanda MTN Rwanda 88 87 20.05.2020 26.05.2020
Same Network MTN Uganda to MTN Uganda MTN Uganda 328 328 19.05.2020 25.05.2020
Same Network Vodafone Ghana to Vodafone Ghana Vodafone Ghana 270 270 23.05.2020 27.05.2020
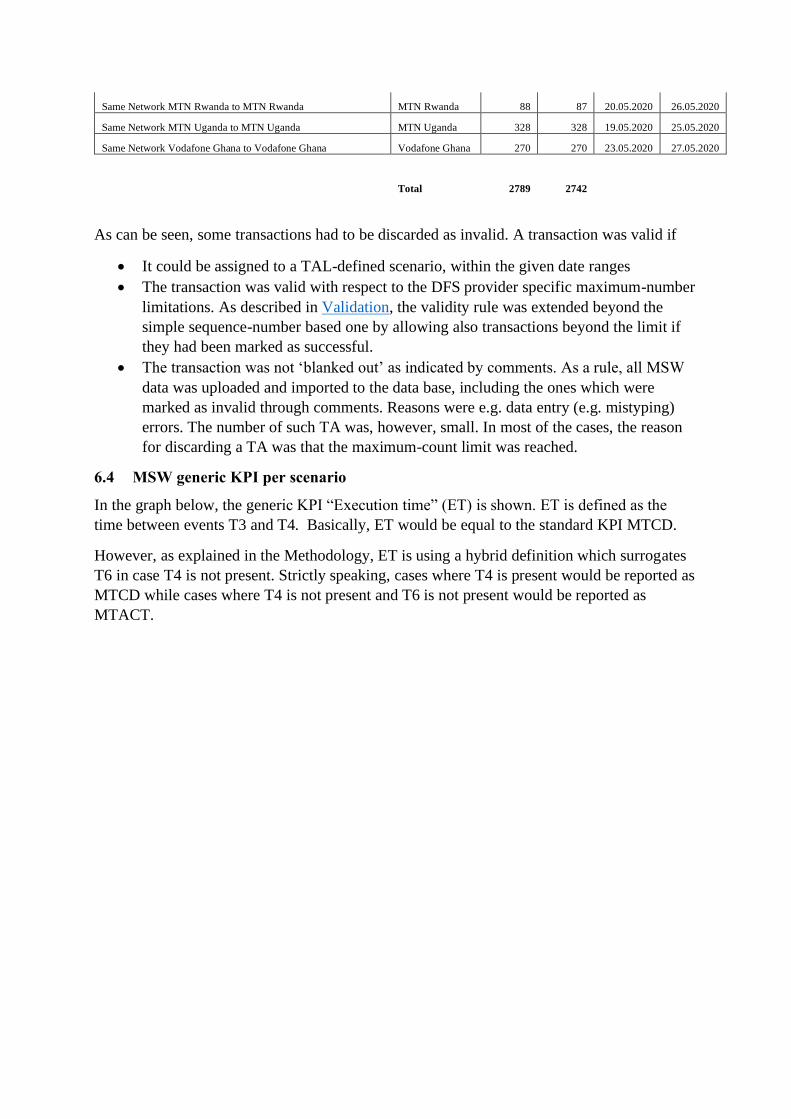
Total 2789 2742
As can be seen, some transactions had to be discarded as invalid. A transaction was valid if
• It could be assigned to a TAL-defined scenario, within the given date ranges
• The transaction was valid with respect to the DFS provider specific maximum-number
limitations. As described in Validation, the validity rule was extended beyond the
simple sequence-number based one by allowing also transactions beyond the limit if
they had been marked as successful.
• The transaction was not ‘blanked out’ as indicated by comments. As a rule, all MSW
data was uploaded and imported to the data base, including the ones which were
marked as invalid through comments. Reasons were e.g. data entry (e.g. mistyping)
errors. The number of such TA was, however, small. In most of the cases, the reason
for discarding a TA was that the maximum-count limit was reached.
6.4 MSW generic KPI per scenario
In the graph below, the generic KPI “Execution time” (ET) is shown. ET is defined as the
time between events T3 and T4. Basically, ET would be equal to the standard KPI MTCD.
However, as explained in the Methodology, ET is using a hybrid definition which surrogates
T6 in case T4 is not present. Strictly speaking, cases where T4 is present would be reported as
MTCD while cases where T4 is not present and T6 is not present would be reported as
MTACT.

Figure 10 Generic DFS KPI "Execution time" (T3 to T4) per scenario. Horizontal
markings/rectangles: Average and median values. Vertical lines indicate the 10% and 90% percentile (P10, P90), using the right-hand y axis. The colorized rectangles (left y-axis) show the number of valid
samples.
Average as well as median values are shown here to give an indication about value spread of
data. While the average (arithmetic mean) is commonly used in QoS, single extreme values in
the data set can easily shift values. A median is, in this respect, more robust against single
extreme values. In the figures, the width of the solid bar indicates the difference between
average and median values.
The thin lines are used to show extremes. In the figures, the 10 and 90% percentile values
(P10, P90) are used rather than the min and max values as inspection of data shows that there
are, for many scenarios, single extremes which would degrade the graphical representation by
compressing the scales for other data. The table at the end of the section shows P10 and P90
as well as min and max values.
Generally speaking, a lower sample count corresponds to a larger spread between median and
average values; there are however exceptions.
Figure 11 shows the same data, but with a clipped y axis for ET to provide a better graphical
resolution of ET values.
Figure 12 shows the same data but ordered by configuration (network/country)2.
2 The tilt angle of text has been chosen deliberately different for more optical separation between the
text ordering types.
0
10
20
30
40
50
60
0
50
100
150
200
250
300
350
Exe
cuti
on
Tim
e, s
Sam
ple
co
un
t (n
TA)
DFS Generic KPI: Execution Time (T3 to T4)
nTA avg_ET P90_ET P10_ET Median_ET
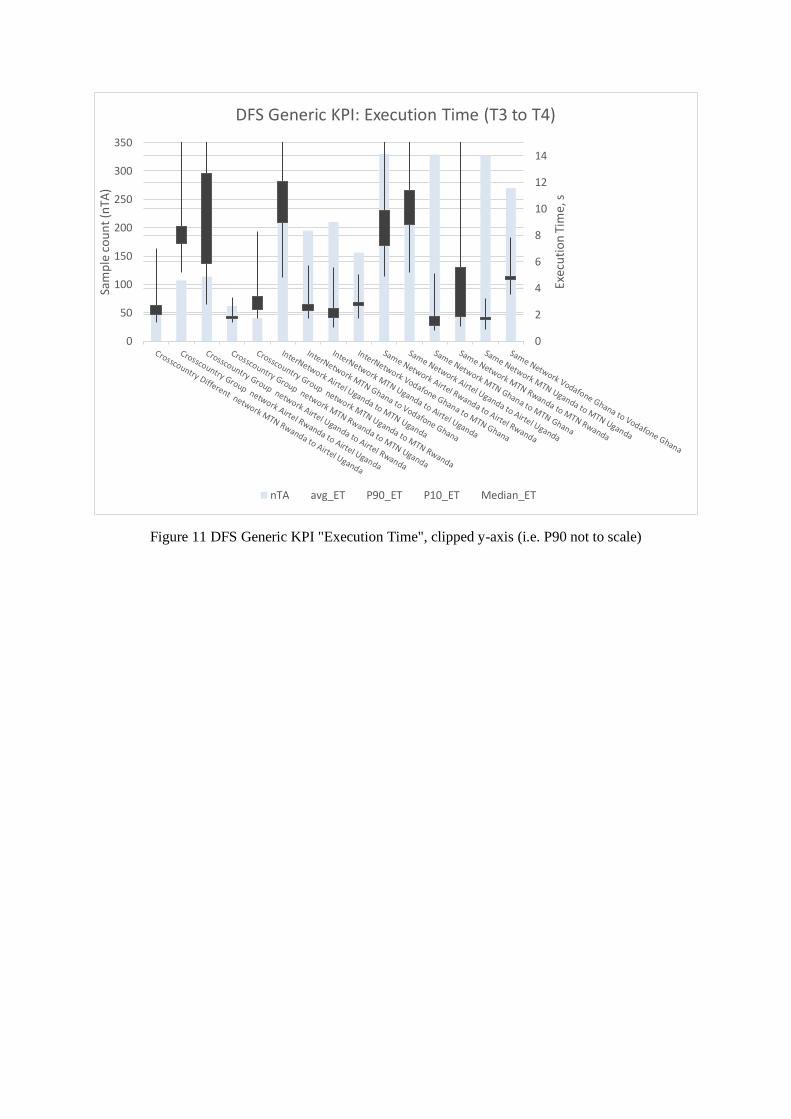
Figure 11 DFS Generic KPI "Execution Time", clipped y-axis (i.e. P90 not to scale)
0
2
4
6
8
10
12
14
0
50
100
150
200
250
300
350
Exec
uti
on
Tim
e, s
Sam
ple
co
un
t (n
TA)
DFS Generic KPI: Execution Time (T3 to T4)
nTA avg_ET P90_ET P10_ET Median_ET

Figure 12 Generic KPI "Execution time" (ET) per scenario; sorted by configuration (network/country);
clipped y axis for KPI value, i.e. some P90 values are not to scale
Table 5 shows the corresponding numerical data, in that case with the min and max values per
scenario.
Table 5 Raw DFS KPI output. ST is the generic session time, see text for detail.
Scenario nTA nSuccess
avg_ET (s)
Median_ET (s)
min_ET (s)
max_ET (s)
Cross-country Different network MTN Rwanda to Airtel Uganda 52 37 2,7 2 0,7 10,4
Cross-country Group network Airtel Rwanda to Airtel Uganda 107 107 8,7 7,4 3,4 30,9
Cross-country Group network Airtel Uganda to Airtel Rwanda 114 74 12,7 5,9 1,7 105
Cross-country Group network MTN Rwanda to MTN Uganda 62 38 1,9 1,7 1,1 4
Cross-country Group network MTN Uganda to MTN Rwanda 41 39 3,4 2,4 0,7 13,6
Inter-network Airtel Uganda to MTN Uganda 211 208 12,1 9 1,3 85,5
Inter-network MTN Ghana to Vodafone Ghana 195 179 2,8 2,3 1 21,4
Inter-network MTN Uganda to Airtel Uganda 210 192 2,5 1,8 0,7 50,6
Inter-network Vodafone Ghana to MTN Ghana 156 153 2,9 2,7 0,8 5,9
Same Network Airtel Rwanda to Airtel Rwanda 330 329 9,9 7,2 2 203,1
Same Network Airtel Uganda to Airtel Uganda 209 206 11,4 8,8 0,8 81,3
Same Network MTN Ghana to MTN Ghana 329 305 1,9 1,2 0,5 15,2
Same Network MTN Rwanda to MTN Rwanda 128 122 5,6 1,9 0,6 20,2
Same Network MTN Uganda to MTN Uganda 328 302 1,8 1,6 0,5 10,3
Same Network Vodafone Ghana to Vodafone Ghana 270 262 4,9 4,7 0,6 17,3
0
2
4
6
8
10
12
14
0
50
100
150
200
250
300
350
Exec
uti
on
tim
e, s
Sam
ple
co
un
t (n
TA)
DFS Generic KPI: Execution Time (T3 to T4)
nTA avg_ET P90_ET P10_ET Median_ET

6.5 MSW standardized KPI per scenario
6.5.1 KPI Selection
Definitions of simplified set (Table 5, ITU-T rec. P.1502), with current set of events. Figure
13 shows a symbolic representation of timerflag usage for the computation of these KPI.
Table 6 Used set of KPI and definition by timerflags. Note: MTCFT shown for formal reasons but not
use due to asynchronous testing mode.
Indicator Abbreviation Computation with events
used in this project
Money Transfer Core Duration [s] MTCD T4-T3
Money Transfer Raw Completion Time
[s]
MTRCT T4-T1
Money Transfer completion rate [%] MTCR T1 present, T4 present: success
(see remark 1)
Money Transfer Full Completion Time
[s]
MTFCT T7-T1: Not reported due to
testing mode (no B-side event
tracking)
Money Transfer A-side Completion
Time [s]
MTACT T6-T1 (see remark 2)
Remark 1: As discussed previously, the numerical value depends on the definition of validity
for TA. For pragmatic reasons, two values will subsequently be shown, establishing a value
corridor.
Remark 2: With respect to the usage of T6 as surrogate for T4 in some cases (see section
Transaction model, MSW generic and standard KPI), MTACT was computed formally but it
should be noted that in such cases, MTACT will partially overlap with MTRCT.
Figure 13 Usage of timerflags for DFS standard KPI. Remark 1: Cases where no T4 is present and T6
is used as a surrogate.
6.5.2 KPI Output, overview for all use cases
The following table shows the KPI per scenario. Please note that for the “Same Network
MTN Rwanda to MTN Rwanda” scenario, there are two rows since this scenario has been
carried out by two different teams.

Table 7 DFS standard KPI per scenario and Owner Team. See text for MTCR variants.
Owner Team Scenario Name MTCR_All (%)
MTCR_Restr (%)
MTCD (s)
MTRCT (s)
MTACT (s)
Airtel Rwanda Cross-country Group network Airtel Rwanda to Airtel Uganda 100 100 8,7
(see remark 1) 67,6
Airtel Rwanda Same Network Airtel Rwanda to Airtel Rwanda 99,7 99,7 9,9
(see remark 1) 54,9
Airtel Rwanda Same Network MTN Rwanda to MTN Rwanda 90,2 90,2 14,4
(see remark 1) 102,4
Airtel Uganda Cross-country Group network Airtel Uganda to Airtel Rwanda 64,9 77,9 12,7 48,8 53,1
Airtel Uganda Inter-network Airtel Uganda to MTN Uganda 98,6 99 12,1 50,3 52,6
Airtel Uganda Same Network Airtel Uganda to Airtel Uganda 98,6 98,6 11,4 40,6 46
MTN Ghana Inter-network MTN Ghana to Vodafone Ghana 91,8 91,8 2,8 35,4 37,4
MTN Ghana Same Network MTN Ghana to MTN Ghana 92,7 92,7 1,9 26,6 29
MTN Rwanda Cross-country Different network MTN Rwanda to Airtel Uganda 71,2 75,5 2,7 58,8 67,8
MTN Rwanda Cross-country Group network MTN Rwanda to MTN Uganda 61,3 69,1 1,9 61,2 79,8
MTN Rwanda Same Network MTN Rwanda to MTN Rwanda 97,7 97,7 1,7 29,5 41,9
MTN Uganda Cross-country Group network MTN Uganda to MTN Rwanda 95,1 95,1 3,4 68,3 74,9
MTN Uganda Inter-network MTN Uganda to Airtel Uganda 91,4 91,9 2,5 35,4 50
MTN Uganda Same Network MTN Uganda to MTN Uganda 92,1 92,1 1,8 26,7 35
Vodafone Ghana Inter-network Vodafone Ghana to MTN Ghana 98,1 99,4 2,9 46,8 57,8
Vodafone Ghana Same Network Vodafone Ghana to Vodafone Ghana 97 98,5 4,9 34 41,1
Remark 1: In some cases MTRCT is not provided. These were the cases where no T4 exists,
i.e. where formally no computation of MTRCT is possible. Due to the use of T6 as surrogate
for T4, MTACT values have to be used instead.
According to the consideration given in the previous subsection, there are two MTCR values.
MTCR_All is computed using all transactions with valid sequence number and not excluded
by other basic mechanisms.
MTCR_Restr is computed from a restricted set. Transactions having remarks indicating
either mobile network or DFS subsystem problems are excluded.
These two values can be understood as giving a corridor for the MTCR value. The higher the
degree of exclusion of network or DFS service related transactions is, the higher the MTCR
value will be. For instance, if network related failures are left in the set, but DFS subsystem
related ones are excluded, the MTCR value will be between MTCR_All and MTCR_Restr.
When interpreting the data, MTCD and MTCR has to be looked at as a closely related
couple3. A short MTCD (equivalent to a session time) alone does not indicate a well-working
service, as success rates still could be low, even more so if time-outs are involved as they will
effectively remove transactions with poor session time from the averaged set. An example
would be the scenarios “Cross-country Different network MTN Rwanda to Airtel Uganda” or,
even more pronounced, “Cross-country Group network MTN Rwanda to MTN Uganda”
where the MTCD shows rather small (good) values but the success rates are also low, in
contrast to other cases where MTCD and MTCR are both in a “fair to good” range.
As for MTRCD and MTCACT, these indicators can be expected to have more fluctuation as
they contain manual operation times. On the other hand, these indicators include multiple
interactions with the service, so they are considered as providing valuable information
nevertheless. As for the component of manual interaction, it is assumed that there are also
mitigating effects: When testers are getting more experienced, their transaction-to-transaction
operating performance will become more uniform, which should also be comparable with not-
too-infrequent users who also will gain experience and dexterity.
When looking at MTRCD and MTACT, some extremes come to attention, most prominently
the “Same Network MTN Rwanda to MTN Rwanda” scenario carried out by the Airtel
Rwanda team. As will be shown in subsequent sections, this team had a rather poor mobile
network coverage for MTN Rwanda. This confirms the value of MTRCD and MTCACT as
indicative of mobile network coverage effects as well of providing a full view of DFS
performance.
6.5.3 KPI output per use case category
In the following subsections, results are shown by category.
Please note: In some cases MTRCT is not provided. These were the cases where no T4
exists, i.e. where formally no computation of MTRCT is possible. Due to the use of T6 as
surrogate for T4, MTACT values have to be used instead.
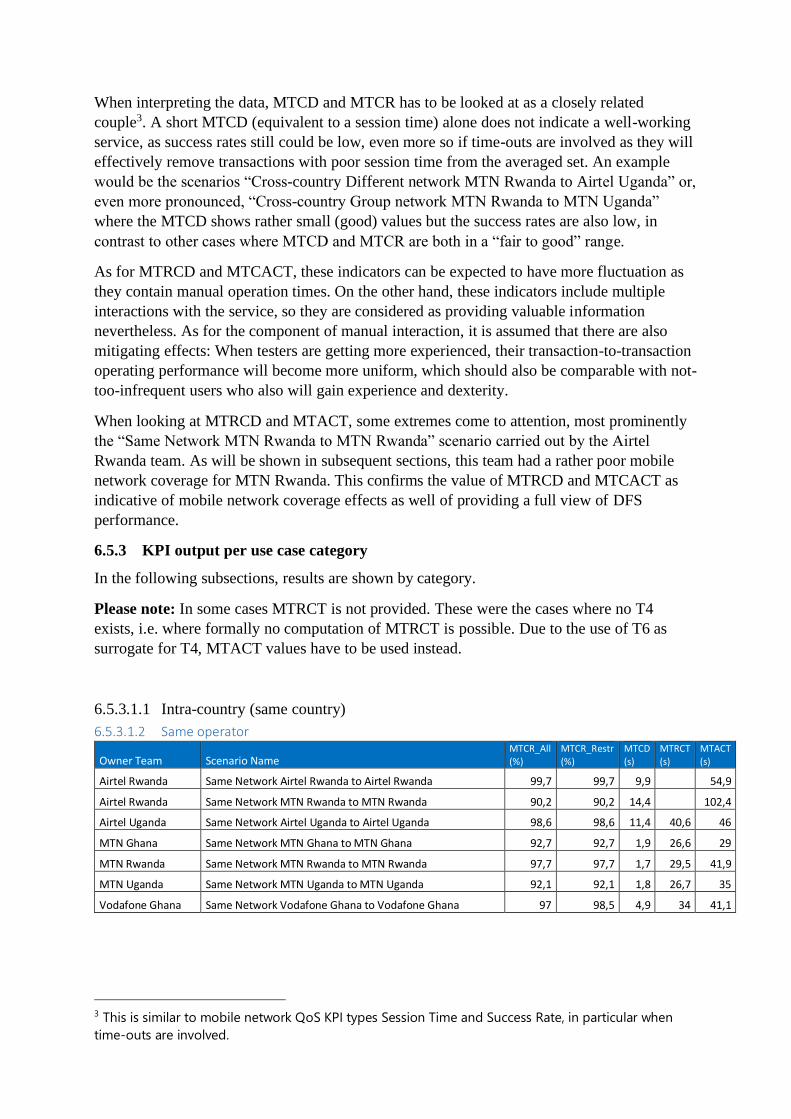
6.5.3.1.1 Intra-country (same country)
6.5.3.1.2 Same operator
Owner Team Scenario Name MTCR_All (%)
MTCR_Restr (%)
MTCD (s)
MTRCT (s)
MTACT (s)
Airtel Rwanda Same Network Airtel Rwanda to Airtel Rwanda 99,7 99,7 9,9 54,9
Airtel Rwanda Same Network MTN Rwanda to MTN Rwanda 90,2 90,2 14,4 102,4
Airtel Uganda Same Network Airtel Uganda to Airtel Uganda 98,6 98,6 11,4 40,6 46
MTN Ghana Same Network MTN Ghana to MTN Ghana 92,7 92,7 1,9 26,6 29
MTN Rwanda Same Network MTN Rwanda to MTN Rwanda 97,7 97,7 1,7 29,5 41,9
MTN Uganda Same Network MTN Uganda to MTN Uganda 92,1 92,1 1,8 26,7 35
Vodafone Ghana Same Network Vodafone Ghana to Vodafone Ghana 97 98,5 4,9 34 41,1
3 This is similar to mobile network QoS KPI types Session Time and Success Rate, in particular when
time-outs are involved.

6.5.3.1.3 Inter-operator
Owner Team Scenario Name MTCR_All (%)
MTCR_Restr (%)
MTCD (s)
MTRCT (s)
MTACT (s)
Airtel Uganda InterNetwork Airtel Uganda to MTN Uganda 98,6 99 12,1 50,3 52,6
MTN Ghana InterNetwork MTN Ghana to Vodafone Ghana 91,8 91,8 2,8 35,4 37,4
MTN Uganda InterNetwork MTN Uganda to Airtel Uganda 91,4 91,9 2,5 35,4 50
Vodafone Ghana InterNetwork Vodafone Ghana to MTN Ghana 98,1 99,4 2,9 46,8 57,8
6.5.3.1.4 Inter-country (cross-border)
6.5.3.1.5 Same operator (group)
Owner Team Scenario Name MTCR_All (%)
MTCR_Restr (%) MTCD(s)
MTRCT (s)
MTACT (s)
Airtel Rwanda Crosscountry Group network Airtel Rwanda to Airtel Uganda 100 100 8,7 67,6
Airtel Uganda Crosscountry Group network Airtel Uganda to Airtel Rwanda 64,9 77,9 12,7 48,8 53,1
MTN Rwanda Crosscountry Group network MTN Rwanda to MTN Uganda 61,3 69,1 1,9 61,2 79,8
MTN Uganda Crosscountry Group network MTN Uganda to MTN Rwanda 95,1 95,1 3,4 68,3 74,9
6.5.3.1.6 Different operators
Owner Team Scenario Name MTCR_All (%)
MTCR_Restr (%)
MTCD (s)
MTRCT (s)
MTACT (s)
MTN Rwanda Crosscountry Different network MTN Rwanda to Airtel Uganda 71,2 75,5 2,7 58,8 67,8
6.5.4 Details
The table below shows more details for DFS KPI. For description of percentile values, refer to
MSW generic KPI per scenario. nTA is the number of all valid transactions in the set.
nValidMinSet is the number of transactions with TA excluded where testers indicated mobile-
network or DFS service unavailability.

Table 8 Standard DFS KPI with min/max and selected percentile values for MTCD. See text for
further details.
Owner Team Scenario Name
nSu
cces
s
nV
alid
Min
Set
nTA
MTC
D (
s)
P9
0_M
TCD
(s)
P1
0_M
TCD
(s)
Med
ian
_M
TCD
(s)
MTR
CT
(s)
MTA
CT
(s)
max
_MTC
D (
s)
min
_MTC
D (
s)
Airtel Rwanda Cross-country Group network Airtel Rwanda to Airtel Uganda 107 107 107 8,7 21,6 5,2 7,4 67,6 30,9 3,4
Airtel Rwanda Same Network Airtel Rwanda to Airtel Rwanda 329 330 330 9,9 17,7 4,9 7,2 54,9 203,1 2
Airtel Rwanda Same Network MTN Rwanda to MTN Rwanda 37 41 41 14,4 17 1,1 1,9 102,4 20,2 2,5
Airtel Uganda Cross-country Group network Airtel Uganda to Airtel Rwanda 74 95 114 12,7 51,5 2,8 5,9 48,8 53,1 105 1,7
Airtel Uganda Inter-network Airtel Uganda to MTN Uganda 208 210 211 12,1 30,4 4,8 9 50,3 52,6 85,5 1,3
Airtel Uganda Same Network Airtel Uganda to Airtel Uganda 206 209 209 11,4 30 5,2 8,8 40,6 46 81,3 0,8
MTN Ghana Inter-network MTN Ghana to Vodafone Ghana 179 195 195 2,8 5,7 1,7 2,3 35,4 37,4 21,4 1
MTN Ghana Same Network MTN Ghana to MTN Ghana 305 329 329 1,9 5,1 0,8 1,2 26,6 29 15,2 0,5
MTN Rwanda Cross-country Different network MTN Rwanda to Airtel Uganda 37 49 52 2,7 7 1,4 2 58,8 67,8 10,4 0,7
MTN Rwanda Cross-country Group network MTN Rwanda to MTN Uganda 38 55 62 1,9 3,3 1,4 1,7 61,2 79,8 4 1,1
MTN Rwanda Same Network MTN Rwanda to MTN Rwanda 85 87 87 1,7 17 1,1 1,9 29,5 41,9 4,6 0,6
MTN Uganda Cross-country Group network MTN Uganda to MTN Rwanda 39 41 41 3,4 8,3 1,7 2,4 68,3 74,9 13,6 0,7
MTN Uganda Inter-network MTN Uganda to Airtel Uganda 192 209 210 2,5 5,6 1 1,8 35,4 50 50,6 0,7
MTN Uganda Same Network MTN Uganda to MTN Uganda 302 328 328 1,8 3,2 0,9 1,6 26,7 35 10,3 0,5
Vodafone Ghana
Inter-network Vodafone Ghana to MTN Ghana 153 154 156 2,9 5 1,7 2,7 46,8 57,8 5,9 0,8
Vodafone Ghana
Same Network Vodafone Ghana to Vodafone Ghana 262 266 270 4,9 7,8 3,5 4,7 34 41,1 17,3 0,6
6.6 Mobile-network measurement TA count per scenario
As data in a DFS transaction is transferred over mobile network, the overall DFS performance
also depends on network performance. If this dependence transforms into a perceivable
correlation between respective KPI, will depend in the relative contributions of each element,
as outlined in P.1502. In short, the effect of network performance will only be visible in DFS
KPI if that performance is less than perfect, and if the performance of the DFS infrastructure
is not the dominating factor4.
Using background measurements to determine transport network performance is therefore a
means to get information about these relations and to gain respective insights.
As in the case of DFS tests, the statistical error in network KPI depends on the number of
samples, in this case the number of transactions done in the network-testing scenario. The
following table provides an overview of item count per use case scenario. In total, there was a
total of 15936 data items collected, with 15093 items being valid with respect to date ranges.
4 Please also refer to section 15 of the Methodology for more considerations on this topic.

Table 9 Number of network background testing transactions per scenario.
Scenario Item Count
Cross-country Different network MTN Rwanda to Airtel Uganda 177
Cross-country Group network Airtel Rwanda to Airtel Uganda 158
Cross-country Group network Airtel Uganda to Airtel Rwanda 270
Cross-country Group network MTN Rwanda to MTN Uganda 425
Cross-country Group network MTN Uganda to MTN Rwanda 160
Inter-network Airtel Uganda to MTN Uganda 9759
Inter-network MTN Ghana to Vodafone Ghana 362
Inter-network MTN Uganda to Airtel Uganda 138
Inter-network Vodafone Ghana to MTN Ghana 195
Same Network Airtel Rwanda to Airtel Rwanda 450
Same Network Airtel Uganda to Airtel Uganda 1569
Same Network MTN Ghana to MTN Ghana 281
Same Network MTN Rwanda to MTN Rwanda 418
Same Network MTN Uganda to MTN Uganda 142
Same Network Vodafone Ghana to Vodafone Ghana 589
In some cases, the ObsTool app was not running over the whole measurement time. Part of
this be to the fact that an app running in the background can be stopped after some time by the
operating system5. As, in this particular case, it was decided that background network testing
was not high priority. On the other hand, tests were done stationary, i.e. all tests were done in
the same place. It is however assumed that the smaller time coverage is still giving sufficient
information about local network coverage.
6.7 Mobile-network KPI per scenario
6.7.1 KPI and validity rules used
The scenario was designed to give a coarse impression of local packet-data performance, i.e.
to run rather light on network usage (no data-heavy test cases). However, due to the specifics
of the test, reference material was hosted on Focus Infocom’s servers. This means that overall
testing conditions6 also included the data route between respective national networks and
Focus Infocom’s infrastructure.
The following test cases and KPI were used:
Test case KPI
Web Browsing (ETSI
Kepler SP reference web
site)
End to end session time (E2E ST) in case of successful
transactions. In contrast to the TS 102 250/E.804 Session
Time, the time window begins with the start of web site
download (not with reception of the first package)
End to End Success Rate (percentage of transactions
successfully completed, from all valid TA. A valid TA is a
5 In the original set-up, it was planned to run the ObsTool on a separate device (a total of 3 devices per team:
DFS, MSW and ObsTool). As the scope was expanded, and due to the fact that, due to Corona restrictions, the
devices could not be handed over between the teams, this would have led to a significantly higher demand for
resources. Therefore, it had been decided to run the ObsTool on the same device as the MSW. 6 Mainly the multi-country nature of testing, the limited scope of the campaign (not meant to be representative or
benchmark testing) along with the expressed secondary role of network KPI.

Test case KPI
TA run via mobile network (not via WiFi), and not blanked
out by e.g. a User Break indication.
HTTP DL with 3 Mbyte
file; time-out 30 sec
End to end session time (ST_E2E) in case of successful
transactions. Analogously to Web browsing, this ST includes
the initial start time.
End to End Success Rate (percentage of transactions
successfully completed, from all valid TA.
Evaluation is done in fixed-size mode, i.e. a TA which ran
into a time-out is not counted as successful.
Mean Data Rate End To End: (MDR_E2E): Effective data
rate. This value is also output if the result if the TA is
unsuccessful (e.-g. dropped or ran into time-out); in that case
the transferred data up to the stopping point, and the time
expired, is used to compute the MDR.
HTTP UL with 1 Mbyte
file in fixed-time mode;
time window 30 sec
(hybrid mode)
In hybrid mode, the TA ends either when the intended data
volume is transferred, or the time window is expired. In this
mode, reaching the end of the time-window does not result in
the result “unsuccessful”. If desired, a computational
“unsuccessful” state can be created by evaluating the TA
duration.
End to end session time (ST_E2E). By computation, this
value is created only when the end of the time window is not
reached (to stay consistent with standardized KPI
computation. Analogously to Web browsing, this ST includes
the initial start time.
End to End Success Rate (percentage of transactions
successfully completed, from all valid TA.
Evaluation is done in “computational fixed-size mode”, i.e. a
TA which ran into a time-out is not counted as successful.
Mean Data Rate End To End: (MDR_E2E): Effective data
rate. This value is also output if the result if the TA is
unsuccessful (e.-g. dropped or ran into time-out); in that case
the transferred data up to the stopping point, and the time
expired, is used to compute the MDR.
The definition of valid TA excludes transactions which are taken via WiFi, were interrupted
by the user (“user break”) or are masked-out otherwise. Also, through joining with the TAL,
there is an effective time-windowing to exclude TA taken outside the date range of respective
scenario. Due to the fact that measurements were taken stationary (in the same location), there
is, however, no time windowing with respect to MSW time ranges.
MDR values are, different from standard MDR averaging, taken over all TA including
unsuccessful ones. This avoids biasing towards higher expected values which occurs when
timed-out transactions are excluded from averaging.
ST values are calculated over values from successful TA only to avoid inconsistencies by
clipping. When interpreting data, success rates need to be considered along with ST values.

6.7.2 Network KPI Overview
This section provides an overview of network KPI from background testing. A detailed table
can be found in Annex C: Network KPI overview from background testing.
For selection of KPI and details of computation, see section KPI and validity rules used.
The following table shows data aggregated per network, i.e. combining data from different
scenarios having the same A side configuration.
Table 10 Network KPI per network. Abbreviations: SR=Success Rate; DL=HTTP DL; UL: HTTP_UL
Airtel Rwanda
Airtel Uganda
MTN Ghana
MTN Rwanda
MTN Uganda
Vodafone Ghana
Web_SR (%) 39,3 92,4 46,6 37,8 55 64,2
Web_ST_E2E (s) 5,2 1,8 5,1 4,4 3 6,2
DL_SR (%) 86,7 82,6 68,2 82,9 95,6 63,2
DL_ST_E2E (s) 15,3 7,5 14,3 8,1 8,7 16,4
DL_MDR_E2E (Mbit/s) 1,7 4,3 1,8 3,7 3,4 1,4
UL_SR (%) 99 97,4 100 91,7 100 100
UL_ST_E2E (s) 9 6,5 10,7 12,1 9,1 7,7
UL_MDR_E2E (Mbit/s) 1,2 1,7 1,2 1,2 1,1 1,3
The figures below show visualizations of KPI per scenario and per network.
Figure 14 Network KPI: Success Rate per network
0
10
20
30
40
50
60
70
80
90
100
AirtelRwanda
AirtelUganda
MTN Ghana MTN Rwanda MTN Uganda VodafoneGhana
Succ
ess
Rat
e (%
)
Network KPI: Success Rate per network
Web_SR DL_SR UL_SR

Figure 15 Network KPI: E2E Session Time per network
Figure 16 Network KPI: E2E Mean Data Rate per network
0
2
4
6
8
10
12
14
16
18
AirtelRwanda
Airtel Uganda MTN Ghana MTN Rwanda MTN Uganda VodafoneGhana
Sess
ion
tim
e (s
)Network KPI: End-to-end Session Time per network
Web_ST_E2E DL_ST_E2E UL_ST_E2E
0
0,5
1
1,5
2
2,5
3
3,5
4
4,5
5
AirtelRwanda
Airtel Uganda MTN Ghana MTN Rwanda MTN Uganda VodafoneGhana
Me
an D
ata
Rat
e (M
bit
/s)
Network KPI: End-to-end MDR per network
DL_MDR_E2E UL_MDR_E2E

Figure 17 Network KPI: Success Rate per scenario
0
10
20
30
40
50
60
70
80
90
100
Succ
ess
Rat
e (%
)Network KPI: Success Rate per scenario
Web_SR DL_SR UL_SR

Table 11 Network KPI end-to-end Session Time per scenario
Figure 18 Network KPI: End-to-end Session Time per scenario
0
5
10
15
20
25
Sess
ion
Tim
e (s
)
Network KPI: E2E Session Time per Scenario
Web_ST_E2E DL_ST_E2E UL_ST_E2E

Figure 19 Network KPI: End-to-end Mean Data Rate per scenario
6.8 Combined DFS and network KPI
As outlined in ITU-T Rec. P.1502, the end-to-end performance of DFS from the customer’s
point of view is both determined by the performance of the DFS-specific infrastructure, and
the performance of the transport network. By looking at the correlation between DFS and
mobile-network performance, it can be determined if the overall DFS performance is
determined or at least influenced by the mobile-network performance.
Likewise, DFS and network KPI data were combined, using the scenario as the common
element (joining on scenario). The following tables and figures show the results. It should be
kept in mind that due to the limited number of samples, relations have considerable
fluctuations and therefore results should be treated as mainly indicative.
0
0,5
1
1,5
2
2,5
3
3,5
4
4,5
5
MD
R (M
bit
/s)
Network KPI: E2E MDR per Scenario
DL_MDR_E2E UL_MDR_E2E

Table 12 Combined DFS and network KPI, overview
Scenario
DFS
_avg
_ET
DFS
_Med
ian
_ET
DFS
_SR
We
b_
SR
We
b_
ST_
E2E
DL_
SR
DL_
ST_
E2E
DL_
MD
R_E
2E
UL_
SR
UL_
ST_E
2E
UL_
MD
R_E
2E
Cross-country Different network MTN Rwanda to Airtel Uganda 2,7 2 71,2 53,8 3,4 100 5,5 4,7 100 12,2 1,9
Cross-country Group network Airtel Rwanda to Airtel Uganda 8,7 7,4 100 50 5,2 94,2 13,1 2,1 98,1 8,3 1,4
Cross-country Group network Airtel Uganda to Airtel Rwanda 12,7 5,9 64,9 96,6 2,9 77,4 11,3 3 88,2 9,8 1,1
Cross-country Group network MTN Rwanda to MTN Uganda 1,9 1,7 61,3 19,8 8,1 80,3 7,4 3,5 93,7 19,3 0,4
Cross-country Group network MTN Uganda to MTN Rwanda 3,4 2,4 95,1 64,6 2,7 100 9,2 3,2 100 8 1,2
Inter-network Airtel Uganda to MTN Uganda 12,1 9 98,6 94,8 1,8 83,2 6,9 4,6 98,2 6,1 1,8
Inter-network MTN Ghana to Vodafone Ghana 2,8 2,3 91,8 42,9 4,6 79,3 14,1 2 100 8,8 1,6
Inter-network MTN Uganda to Airtel Uganda 2,5 1,8 91,4 47,6 3,6 93,3 8,4 3,5 100 9 1,1
Inter-network Vodafone Ghana to MTN Ghana 2,9 2,7 98,1 48,2 4,9 69,8 14,1 1,9 100 5,9 1,5
Same Network Airtel Rwanda to Airtel Rwanda 9,9 7,2 99,7 35,4 5,2 83,6 16,4 1,6 99,3 9,2 1,2
Same Network Airtel Uganda to Airtel Uganda 11,4 8,8 98,6 74,7 2,1 79,3 11,5 2,7 94,7 8,7 1,4
Same Network MTN Ghana to MTN Ghana 1,9 1,2 92,7 51,9 5,7 51,9 14,8 1,4 100 13,6 0,7
Same Network MTN Rwanda to MTN Rwanda 5,6 1,9 95,3 58,6 3 83,3 9,4 3,6 88,6 7,2 1,7
Same Network MTN Uganda to MTN Uganda 1,8 1,6 92,1 51,2 2,9 93,2 8,5 3,3 100 10,8 1
Same Network Vodafone Ghana to Vodafone Ghana 4,9 4,7 97 69,3 6,5 61,1 17,1 1,3 100 8,2 1,3
The figures in the next subsections visualize DFS vs. network KPI in the form of scatter plots,
where the x-axis represents the respective DFS KPI, and the y-axis is used for various
network KPI.
The DFS KPI used here is the generic KPI Execution Time (ET) which is, as described in
section Transaction model, MSW generic and standard KPI, equivalent to MTCD for practical
purposes.
General to these figures: The first group is intended to just show respective value ranges. As
each location was used to carry out different scenarios with assumedly different DFS service
response time components, it is not be expected to see a global correlation here, i.e. there are
cases where the performance of the DFS subsystem clearly dominates the overall
performance.
In contrast, the second group of figures where selection by network/operator was made, shows
that both DFS and network indicators are in a rather close variation range. With all due
caution due to the relatively small number of samples, this supports the assumption that the
transport network’s performance do have a relation to the DFS end to end performance.
Below, some of these cases will be discussed and elaborated in further detail.

6.8.1 All scenarios
For all figures, each data point represents the DFS KPI for one scenario versus the selected
mobile-network KPI aggregated for all transactions taken within the time range associated to
the corresponding scenario7.
Figure 20 and Figure 21 show the network KPI Web Browsing end to end Session Time
versus the average and the median value of DFS ET. As discussed also in previous sections,
the Median is less common to be used in QoS metrics but provides a useful alternative view
on the fluctuations of values, in particular where the sample count is relatively small. As can
be seen, the picture differs in in details but is basically rather similar. This further supports the
assumption that network performance is not the overall dominating component of DFS
performance. Details shown in subsequent section will show, however, that on closer look,
DFS performance is linked to network performance nevertheless.
Figure 20 DFS average Execution Time (ET; practically equivalent to MTCD) vs. Web Browsing End
to end Session Time
Figure 21 DFS median Execution Time (ET) vs. Web Browsing End to end Session Time
7 Please note that in some cases, the ObsTool was not operated over the entire DFS testing time, due
to the fact that the location was fixed and to save resources.
0
2
4
6
8
10
0 2 4 6 8 10 12 14
Web
avg
. E2E
ST
(s)
DFS avg ET (s)
DFS avg. ET vs. Web_ST_E2E, all scenarios
0
2
4
6
8
10
0 2 4 6 8 10Web
avg
. E2E
ST
(s)
DFS median ET (s)
DFS median ET vs Web_ST_E2E, all scenarios

Figure 22 and Figure 23 show the DFS ET versus the network KPI “E2E Session time” and
“E2E MDR” for the test case http DL (see KPI and validity rules used)8.
Figure 22 DFS avg. ET vs E2E Session Time for http Download
Figure 23 DFS avg. ET vs E2E Session Time for http Download
Finally, Figure 24 shows the network KPI UL E2E ST (see KPI and validity rules used).
Figure 24 avg. ET vs. network KPI end-to-end Session Time for http Upload
8 Please keep in mind that MDR is an inverse indicator, i.e. in case of a correlation, high MDR is
expected to correlate to low ET and vice versa.
0
5
10
15
20
0 2 4 6 8 10 12 14
DL
avg.
E2E
ST
(s)
DFS avg ET (s)
DFS avg ET vs DL_ST_E2E
0
1
2
3
4
5
0 2 4 6 8 10 12 14DL
avg.
E2E
MD
R (M
bit
/s)
DFS avg ET (s)
DFS avg. ET vs DL_MDR_E2E
0
5
10
15
20
25
0 2 4 6 8 10 12 14
DL
avg.
E2E
ST
(s)
DFS avg. ET (s)
DFS avg. ET vs. UL_ST_E2E
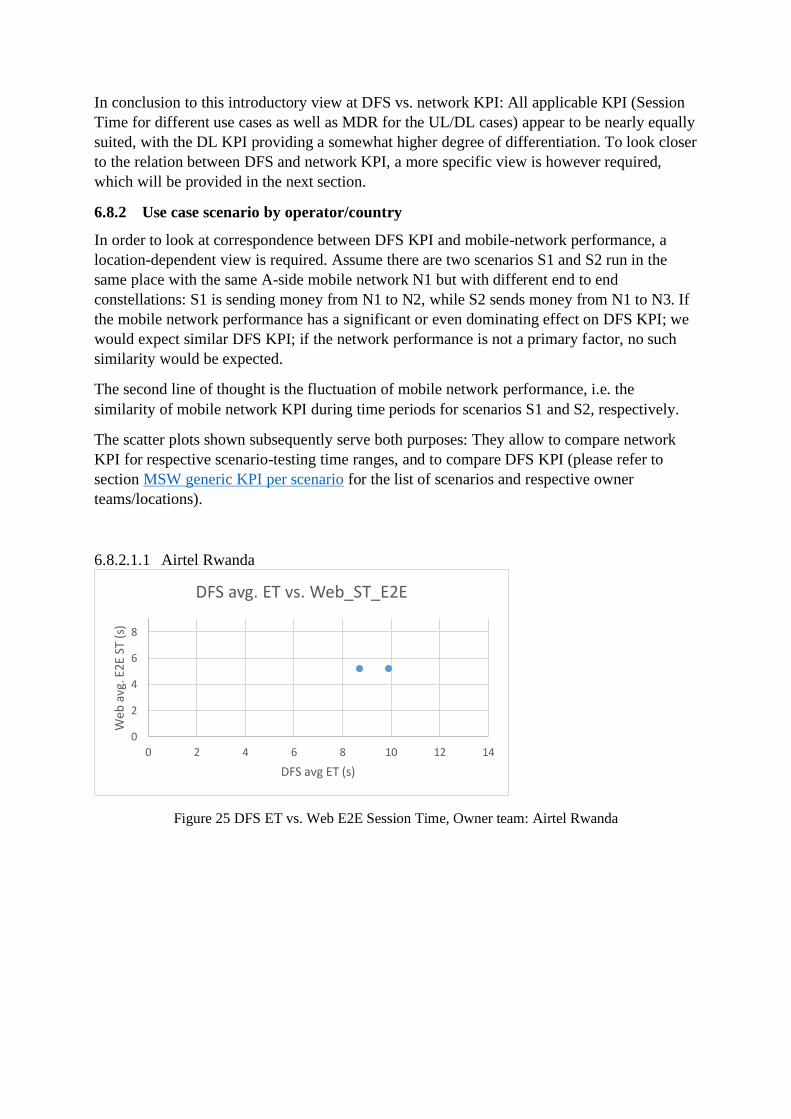
In conclusion to this introductory view at DFS vs. network KPI: All applicable KPI (Session
Time for different use cases as well as MDR for the UL/DL cases) appear to be nearly equally
suited, with the DL KPI providing a somewhat higher degree of differentiation. To look closer
to the relation between DFS and network KPI, a more specific view is however required,
which will be provided in the next section.
6.8.2 Use case scenario by operator/country
In order to look at correspondence between DFS KPI and mobile-network performance, a
location-dependent view is required. Assume there are two scenarios S1 and S2 run in the
same place with the same A-side mobile network N1 but with different end to end
constellations: S1 is sending money from N1 to N2, while S2 sends money from N1 to N3. If
the mobile network performance has a significant or even dominating effect on DFS KPI; we
would expect similar DFS KPI; if the network performance is not a primary factor, no such
similarity would be expected.
The second line of thought is the fluctuation of mobile network performance, i.e. the
similarity of mobile network KPI during time periods for scenarios S1 and S2, respectively.
The scatter plots shown subsequently serve both purposes: They allow to compare network
KPI for respective scenario-testing time ranges, and to compare DFS KPI (please refer to
section MSW generic KPI per scenario for the list of scenarios and respective owner
teams/locations).
6.8.2.1.1 Airtel Rwanda
Figure 25 DFS ET vs. Web E2E Session Time, Owner team: Airtel Rwanda
0
2
4
6
8
0 2 4 6 8 10 12 14
Web
avg
. E2E
ST
(s)
DFS avg ET (s)
DFS avg. ET vs. Web_ST_E2E

Figure 26 DFS ET vs. DL E2E Session Time, Owner team: Airtel Rwanda
Figure 27 DFS ET vs. UL E2E Session Time, Owner team: Airtel Rwanda
6.8.2.1.2 Airtel Uganda
Figure 28 DFS ET vs. Web E2E Session Time, Owner team: Airtel Uganda
0
5
10
15
0 2 4 6 8 10 12 14
DL
avg.
E2E
ST
(s)
DFS avg ET (s)
DFS avg ET vs DL_ST_E2E
0
5
10
15
20
25
0 2 4 6 8 10 12 14
DL
avg.
E2E
ST
(s)
DFS avg. ET (s)
DFS avg. ET vs. UL_ST_E2E
0
1
2
3
4
5
6
7
8
9
0 2 4 6 8 10 12 14
Web
avg
. E2E
ST
(s)
DFS avg ET (s)
DFS avg. ET vs. Web_ST_E2E

Figure 29 DFS ET vs. DL E2E Session Time, Owner team: Airtel Uganda
Figure 30 DFS ET vs. UL E2E Session Time, Owner team: Airtel Uganda
6.8.2.1.3 MTN Ghana
Figure 31 DFS ET vs. Web E2E Session Time, Owner team: MTN Ghana
0
2
4
6
8
10
12
14
16
18
0 2 4 6 8 10 12 14
DL
avg.
E2E
ST
(s)
DFS avg ET (s)
DFS avg ET vs DL_ST_E2E
0
5
10
15
20
25
0 2 4 6 8 10 12 14
DL
avg.
E2E
ST
(s)
DFS avg. ET (s)
DFS avg. ET vs. UL_ST_E2E
0
1
2
3
4
5
6
7
8
9
0 2 4 6 8 10 12 14
Web
avg
. E2E
ST
(s)
DFS avg ET (s)
DFS avg. ET vs. Web_ST_E2E

Figure 32 DFS ET vs. DL E2E Session Time, Owner team: MTN Ghana
Figure 33 DFS ET vs. UL E2E Session Time, Owner team: MTN Ghana
6.8.2.1.4 MTN Rwanda
As compared to other operators, it is visible that the spread of data points is larger.
In this case, some of the data came from a team in a different location (Airtel Rwanda).
The data point in question reveals that the x-axis value with DFS ET ~ 6 s had two component
sets:
Configuration Owner Team Scenario nSuccess nTA avg_ET
MTN Rwanda Airtel Rwanda Same Network MTN Rwanda to MTN Rwanda 37 41 14,4
MTN Rwanda MTN Rwanda Same Network MTN Rwanda to MTN Rwanda 85 87 1,7
Due to the small data base, this is of course not a proof that network coverage has a
significant impact, but it could be a hint towards that direction.
0
2
4
6
8
10
12
14
16
18
0 2 4 6 8 10 12 14
DL
avg.
E2E
ST
(s)
DFS avg ET (s)
DFS avg ET vs DL_ST_E2E
0
5
10
15
20
25
0 2 4 6 8 10 12 14
DL
avg.
E2E
ST
(s)
DFS avg. ET (s)
DFS avg. ET vs. UL_ST_E2E

Figure 34 DFS ET vs. Web E2E Session Time, Owner team: MTN Rwanda. As compared to other teams, it is visible that the spread of values is considerably larger. This due to the fact that some of the
MTN Rwanda tests were done by the Airtel Rwanda team which was in a different location.
Figure 35 DFS ET vs. DL E2E Session Time, Owner team: MTN Rwanda
Figure 36 DFS ET vs. UL E2E Session Time, Owner team: MTN Rwanda
0
1
2
3
4
5
6
7
8
9
0 2 4 6 8 10 12 14
Web
avg
. E2E
ST
(s)
DFS avg ET (s)
DFS avg. ET vs. Web_ST_E2E
0
2
4
6
8
10
12
14
16
18
0 2 4 6 8 10 12 14
DL
avg.
E2E
ST
(s)
DFS avg ET (s)
DFS avg ET vs DL_ST_E2E
0
5
10
15
20
25
0 2 4 6 8 10 12 14
DL
avg.
E2E
ST
(s)
DFS avg. ET (s)
DFS avg. ET vs. UL_ST_E2E

6.8.2.1.5 MTN Uganda
Figure 37 DFS ET vs. Web E2E Session Time, Owner team: MTN Uganda
Figure 38 DFS ET vs. DL E2E Session Time, Owner team: MTN Uganda
Figure 39 DFS ET vs. UL E2E Session Time, Owner team: MTN Uganda
0
1
2
3
4
5
6
7
8
9
0 2 4 6 8 10 12 14
Web
avg
. E2E
ST
(s)
DFS avg ET (s)
DFS avg. ET vs. Web_ST_E2E
0
2
4
6
8
10
12
14
16
18
0 2 4 6 8 10 12 14
DL
avg.
E2E
ST
(s)
DFS avg ET (s)
DFS avg ET vs DL_ST_E2E
0
5
10
15
20
25
0 2 4 6 8 10 12 14
DL
avg.
E2E
ST
(s)
DFS avg. ET (s)
DFS avg. ET vs. UL_ST_E2E
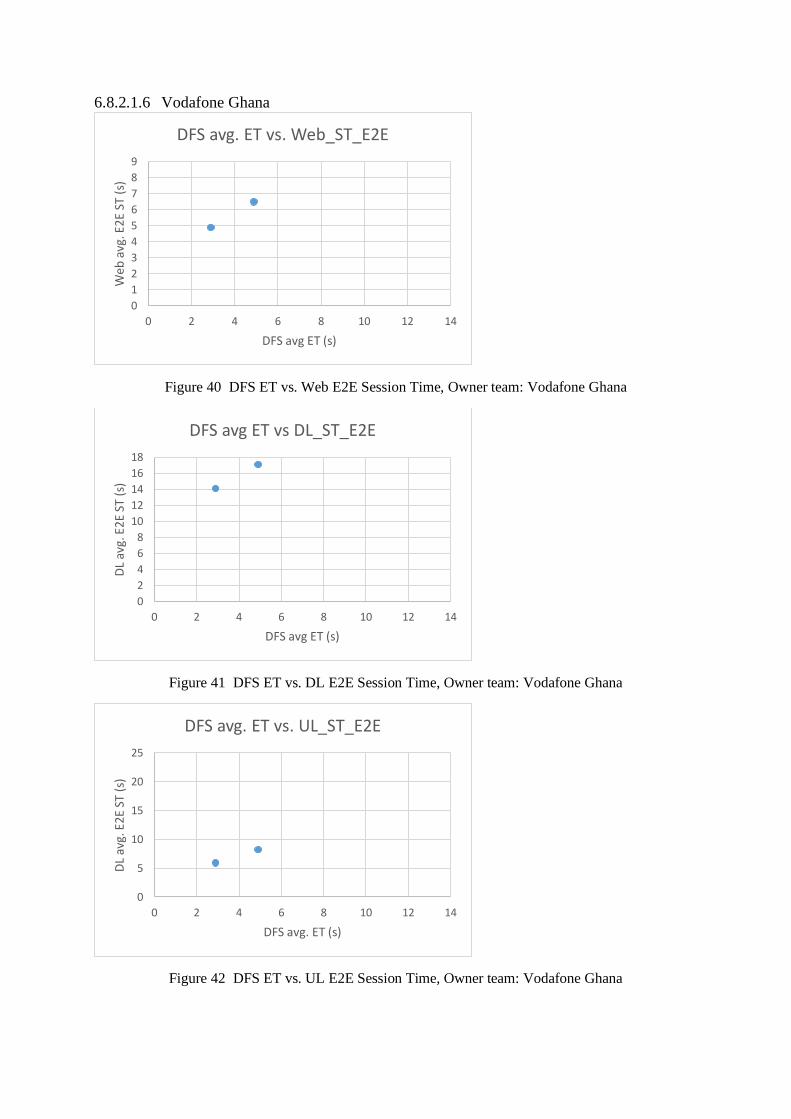
6.8.2.1.6 Vodafone Ghana
Figure 40 DFS ET vs. Web E2E Session Time, Owner team: Vodafone Ghana
Figure 41 DFS ET vs. DL E2E Session Time, Owner team: Vodafone Ghana
Figure 42 DFS ET vs. UL E2E Session Time, Owner team: Vodafone Ghana
0
1
2
3
4
5
6
7
8
9
0 2 4 6 8 10 12 14
Web
avg
. E2E
ST
(s)
DFS avg ET (s)
DFS avg. ET vs. Web_ST_E2E
0
2
4
6
8
10
12
14
16
18
0 2 4 6 8 10 12 14
DL
avg.
E2E
ST
(s)
DFS avg ET (s)
DFS avg ET vs DL_ST_E2E
0
5
10
15
20
25
0 2 4 6 8 10 12 14
DL
avg.
E2E
ST
(s)
DFS avg. ET (s)
DFS avg. ET vs. UL_ST_E2E

7 Annex A: Specific procedures used in the project
7.1 Check on devices for files which have not been uploaded
Basically, all data created by the MSW or ObsTool should have been uploaded. Depending on
local conditions, it cannot be excluded that some files remain on the device. This can be
checked by running the following procedure:
Access to the devices’ file system can be done using an external computer or the on-board file
manager.
7.1.1 MSW
There are two file paths which should be checked:
File path is internal storage -> FI-Multistopwatch->data
And
File path is internal storage -> FI-Multistopwatch->zipped
7.1.2 ObsTool
The file paths to be checked are
Internal storage ->dfs_observer->data
And
Internal storage ->dfs_observer->zipped
If all data have been uploaded, respective folders should be empty.
Otherwise, please send all files in the respective path (best would be to zip the whole folder
and send it as one file) by e-mail or put on the SharePoint.
Please “decorate” the file names or folders to clearly identify the source. The safest way to do
that is to use the whole ID of the device (i.e. the MSW ID or the IMEI in case of DFS
Observer). In practice, the last 5 characters of the MSW ID or the last 4 digits of the IMEI
should be enough.

8 Annex B: Device set-up and training materials
Void, kept for structural consistency. Additional material may be provided as part of the
Contribution.
9 Annex C: Network KPI overview from background testing
The following table shows all results from background testing. For selection of KPI and
details of computation, see section KPI and validity rules used.
Please refer to section Network KPI Overview for interpretation and visualization of selected
elements.
Table 13 Network KPI from background testing. Abbreviations: SR=Success Rate; DL=HTTP DL;
UL: HTTP_UL.
Scenario Web_SR
Web_ST_E2E
DL_SR
DL_ST_E2E
DL_MDR_E2E
UL_SR
UL_ST_E2E
UL_MDR_E2E
Same Network Airtel Rwanda to Airtel Rwanda 35,4 5,2 83,6 16,4 1,6 99,3 9,2 1,2
Cross-country Group network Airtel Rwanda to Airtel Uganda 50 5,2 94,2 13,1 2,1 98,1 8,3 1,4
Cross-country Group network Airtel Uganda to Airtel Rwanda 96,6 2,9 77,4 11,3 3 88,2 9,8 1,1
Same Network Airtel Uganda to Airtel Uganda 74,7 2,1 79,3 11,5 2,7 94,7 8,7 1,4
Inter-network Airtel Uganda to MTN Uganda 94,8 1,8 83,2 6,9 4,6 98,2 6,1 1,8
Inter-network MTN Ghana to Vodafone Ghana 42,9 4,6 79,3 14,1 2 100 8,8 1,6
Same Network MTN Ghana to MTN Ghana 51,9 5,7 51,9 14,8 1,4 100 13,6 0,7
Same Network MTN Rwanda to MTN Rwanda 58,6 3 83,3 9,4 3,6 88,6 7,2 1,7
Cross-country Group network MTN Rwanda to MTN Uganda 19,8 8,1 80,3 7,4 3,5 93,7 19,3 0,4
Cross-country Different network MTN Rwanda to Airtel Uganda 53,8 3,4 100 5,5 4,7 100 12,2 1,9
Same Network MTN Uganda to MTN Uganda 51,2 2,9 93,2 8,5 3,3 100 10,8 1
Cross-country Group network MTN Uganda to MTN Rwanda 64,6 2,7 100 9,2 3,2 100 8 1,2
Inter-network MTN Uganda to Airtel Uganda 47,6 3,6 93,3 8,4 3,5 100 9 1,1
Inter-network Vodafone Ghana to MTN Ghana 48,2 4,9 69,8 14,1 1,9 100 5,9 1,5
Same Network Vodafone Ghana to Vodafone Ghana 69,3 6,5 61,1 17,1 1,3 100 8,2 1,3
Please note that data is shown per scenario but is sorted alphabetically by A side
configuration. Therefore, the same network is represented by different sets of data (taken at
different points in time, aggregated over the whole testing period for a given scenario.
Differences between KPI values for the same network in periods of time are visible. These
can be due to statistical fluctuations as well as day-by-day changes in network performance.