financial highlight - astra otoparts · 2020-01-22 · consolidated financial highlight description...
TRANSCRIPT
Financial Highlight1st Half 2019
‹#› 2
DELIVERING EXCELLENCE
GOING FORWARD
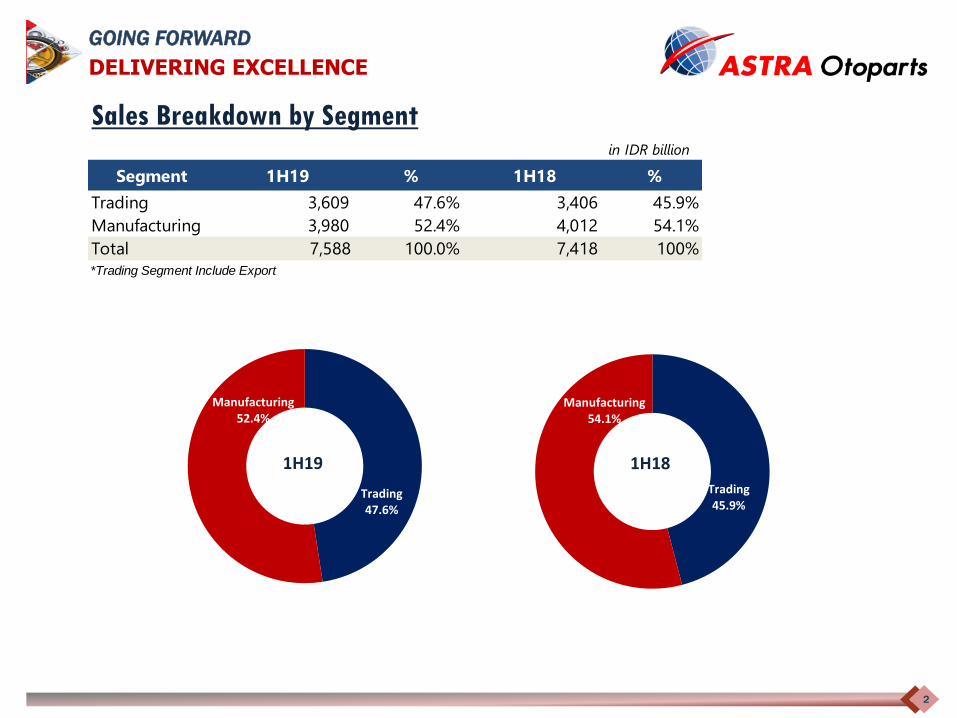
Sales Breakdown by Segment in IDR billion
Segment 1H19 % 1H18 %
Trading 3,609 47.6% 3,406 45.9%
Manufacturing 3,980 52.4% 4,012 54.1%
Total 7,588 100.0% 7,418 100%
*Trading Segment Include Export
Trading 45.9%
Manufacturing54.1%
Trading 47.6%
Manufacturing52.4%
1H19 1H18
‹#› 3
DELIVERING EXCELLENCE
GOING FORWARD
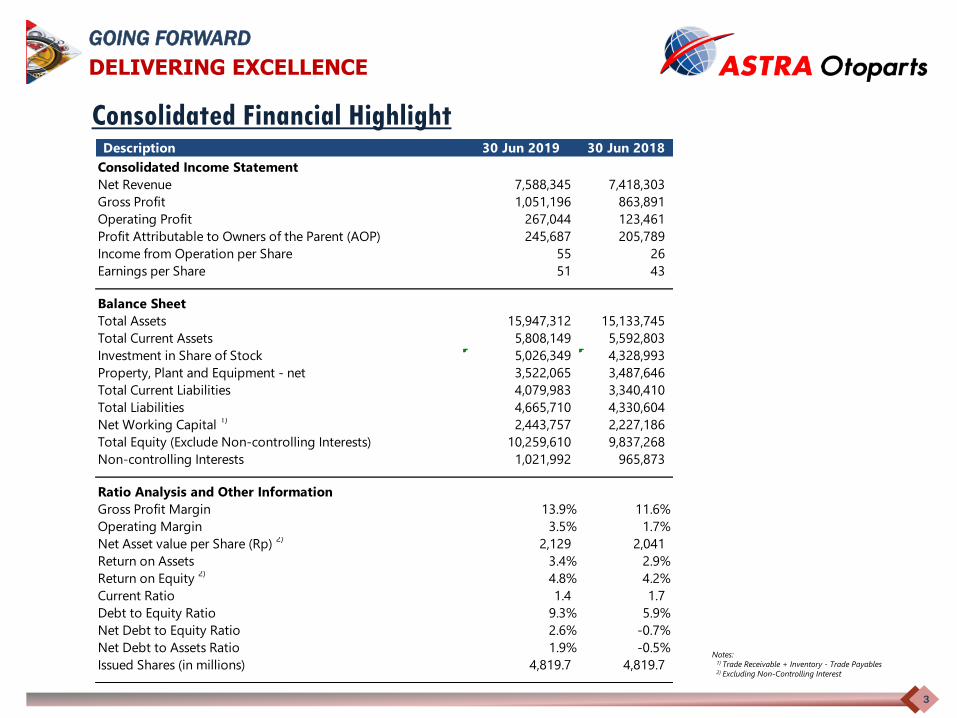
Consolidated Financial HighlightDescription 30 Jun 2019 30 Jun 2018
Consolidated Income Statement
Net Revenue 7,588,345 7,418,303
Gross Profit 1,051,196 863,891
Operating Profit 267,044 123,461
Profit Attributable to Owners of the Parent (AOP) 245,687 205,789
Income from Operation per Share 55 26
Earnings per Share 51 43
Balance Sheet
Total Assets 15,947,312 15,133,745
Total Current Assets 5,808,149 5,592,803
Investment in Share of Stock 5,026,349 4,328,993
Property, Plant and Equipment - net 3,522,065 3,487,646
Total Current Liabilities 4,079,983 3,340,410
Total Liabilities 4,665,710 4,330,604
Net Working Capital 1)
2,443,757 2,227,186
Total Equity (Exclude Non-controlling Interests) 10,259,610 9,837,268
Non-controlling Interests 1,021,992 965,873
Ratio Analysis and Other Information
Gross Profit Margin 13.9% 11.6%
Operating Margin 3.5% 1.7%
Net Asset value per Share (Rp) 2)
2,129 2,041
Return on Assets 3.4% 2.9%
Return on Equity 2)
4.8% 4.2%
Current Ratio 1.4 1.7
Debt to Equity Ratio 9.3% 5.9%
Net Debt to Equity Ratio 2.6% -0.7%
Net Debt to Assets Ratio 1.9% -0.5%
Issued Shares (in millions) 4,819.7 4,819.7 Notes:
1) Trade Receivable + Inventory - Trade Payables2) Excluding Non-Controlling Interest