financial crisis james barth powerpoints march 2009 complete presentation at...
Post on 21-Dec-2015
214 views
TRANSCRIPT
Financial CrisisJames Barth Powerpoints
March 2009
Complete presentation at http://business.auburn.edu/~barthjr/presentations.htm
Follow this link to Barth’s“Leverage and Risk in Financial Institutions”
presentation in Amsterdam, February 2009

2
Did the Fed lower interest rates too much and for too long? Federal funds rate vs. rates on FRMs and ARMs
Sources: Federal Reserve, Mortgage Bankers Association, Moody’s Economy.com, Milken Institute.
Target federal funds rate
0
1
2
3
4
5
6
7
8
2001 2002 2003 2004 2005 2006 2007 2008 2009
Percent
Record low from June 25, 2003 to June 30, 2004: 1%
30-year FRM rate
Apr. 30, 2008: 2%Oct. 8, 2008: 1.5%Oct. 29, 2008: 1%Dec. 16, 2008: 0-0.25%
1-year ARM rate
January 30, 200930-year FRM rate: 5.1%1-year ARM rate: 4.9%

3
Home mortgages: Who borrows, how much has been borrowed, and who funds them?
Note: total residential and commercial mortgages = $14.7 trillion; 5 percent = $700 billion
Government-controlled
46%
Privatesector-
controlled54%
Total value of housing stock = $19.3 trillion
Equity in housing stock$8.7 trillion
Mortgage debt $10.6 trillion
Total value of housing stock = $19.3 trillion
Prime 91.6%
Subprime8.4% Securitized
58%
Non-securitized42%
Sources: Federal Reserve, Milken Institute.

4
Subprime mortgages accounted for half or more of foreclosures since 2006
Sources: Mortgage Bankers Association, Milken Institute.
0
500
1,000
1,500
2,000
2,500
Q12003
Q32003
Q12004
Q32004
Q12005
Q32005
Q12006
Q32006
Q12007
Q32007
Q12008
Q32008
Subprime
FHA and VA
Prime (includes Alt-A)
Number of home mortgage loan foreclosures started (annualized rate in thousands)
Q3 2008Subprime: 12% of loans serviced

55
The mortgage model switches fromoriginate-to-hold to originate-to-distribute
Sources: Federal Reserve, Milken Institute.
Held in portfolio
84.4%
Securitized15.6%
Held in portfolio
41%
Securitized59%
Residential mortgage loans1980: Total = $958 billion
Residential mortgage loansQ3 2008: Total = $11.3 trillion
11%
89%

66
Mortgage-backed securities issued by issuer
Sources: Inside Mortgage Finance, Milken Institute.Note: 2008 data are annualized.
0
500
1,000
1,500
2,000
2,500
3,000
1985 1987 1989 1991 1993 1995 1997 1999 2001 2003 2005 2007
Private label
Ginnie Mae
Freddie Mac
Fannie Mae
US$ billions

7
Home mortgages: Who borrows, how much has been borrowed, and who funds them?
Note: total residential and commercial mortgages = $14.7 trillion; 5 percent = $700 billion
Government-controlled
46%
Privatesector-
controlled54%
Total value of housing stock = $19.3 trillion
Equity in housing stock$8.7 trillion
Mortgage debt $10.6 trillion
Total value of housing stock = $19.3 trillion
Prime 91.6%
Subprime8.4% Securitized
58%
Non-securitized42%
Sources: Federal Reserve, Milken Institute.

…small events at times have large consequences. A liquidity crisis in a fractional reserve banking system is precisely the kind of event that can trigger – and often has triggered – a chain reaction. And economic collapse often has the character of a cumulative process. Let it go beyond a certain point, and it will tend for a time to gain strength from its own development as its effects spread and return to intensify the process of collapse. Because no great strength would be required to hold back the rock that starts a landslide, it does not follow that the landslide will not be of major proportions.
Friedman and SchwartzA Monetary History of the United
States

9
Subprime mortgage meltdown timelineDecember 2006–October 2008
Sources: BusinessWeek, S&P, Global Insight, Milken Institute.
Oct. 12, 2008: Finance leaders endorse G7 plan to calm markets.
Oct. 27, 2008: Down Jones U.S. Financial Index=230
Oct. 31, 2008:Dow Jones U.S. Financial Index=269
200
300
400
500
600
700
12/2006 02/2007 04/2007 06/2007 08/2007 10/2007 12/2007 02/2008 04/2008 06/2008 08/2008 10/2008
Dow Jones U.S. Financial Index
June 9, 2008:Lehman announces a $2.8 billion loss.
July 11, 2008: IndyMac is seized by FDIC.
Aug. 1, 2008: First Priority Bank closes.
Mar. 11, 2008: Fed offers troubled banks as much as $200 billion in loans; Fed introduces Term Securities Lending Facility.
Oct. 24, 2007: Merrill announces $7.9 billion in subprime write-downs, surpassing Citi’s $6.5 billion.
Feburary–March 2007: More than 25 subprime lenders declare bankruptcy.
Aug. 6, 2007: American Home Mortgage files for bankruptcy.
Sept. 30, 2007: NetBank goes bankrupt.
July 30, 2008: President Bush signs a housing rescue law.
Sept. 7, 2008: U.S. seizes Fannie Mae and Freddie Mac.
Dec. 2006: Ownit Mortgage, a subprime lender, files for bankruptcy.
Apr. 2007: New Century, a mortgage broker, files for bankruptcy.
Feb. 2007: HSBC sets aside $10.6 billion for bad loans, including subprime.
July 31, 2007: Two Bear Stearns hedge funds file for bankruptcy.
Aug. 17, 2007: Fed cuts discount rate to 5.75%; Fed introduces Term Discount Window Program.
Jan. 11, 2008: Bank of America agrees to buy Countrywide.Jan. 30, 2008: Fed cuts discount rate to 3.5%.
Dec. 12, 2007: Fed introduces Term Auction Facility.
Feb. 13, 2008: President Bush introduces tax rebate stimulus program of $168 billion.
Aug. 16, 2007: Countrywide gets emergency loan of $11 billion from a group of banks.
Sept. 14, 2008: Lehman files for bankruptcy.
Mar. 18, 2008: Fed cuts discount rate to 2.5%; Fed funds rate to 2.25%.
Mar. 16, 2008: JP Morgan Chase offers to buy Bear Stearns; Fed introduces Primary Dealer Credit Facility.
April. 30, 2008: Fed cuts discount rate to 2.25%; Fed funds rate to 2%.
Oct. 3, 2008: President Bush signs Emergency Economic Stabilization Act, authorizing bailout of $700 billion.Also, Citigroup sues after Wachovia agrees tie-up with Wells Fargo.
Sept. 16, 2008: Fed loans AIG $85 billion.
Sept. 23, 2008: Washington Mutual is seized by FDIC.
Sept. 29, 2008: Citigroup agrees to buy Wachovia.
Oct. 8, 2008: Fed cuts discount rate to 1.75%; Fed funds rate to 1.5%.

-21.4-23.9
-40.1-41.4
-42.9-45.1
-47.9
-54.7-63.7-64.1
-72.3-96.6
-112.9
-169.2-197.9
Bear StearnsCountrywideWells Fargo
Lehman BrothersWashington mutualFreddie Mac
Goldman SachsFannie MaeMorgan Stanley
Merrill LynchJP Morgan & ChaseWachovia
UBS EquityAIGBank of America
US$ billions
Total loss in market value: $1,094 billion, December 2006–January 2009
1010
Financial market capitalization takes big hit
Note: Bear Stearns stock price is to May 2008. Countrywide stock price is to June 2008. Merrill Lynch stock price is to December 2008. Wachovia stock price is to December 2008. Sources: Bloomberg, Milken Institute.
11
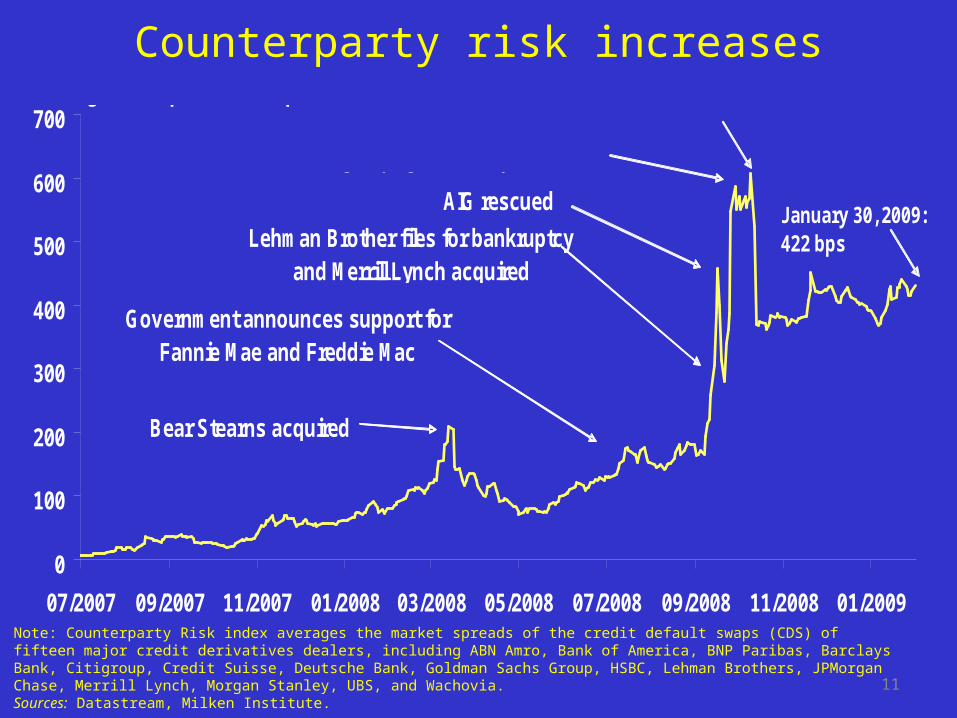
Counterparty risk increases
Note: Counterparty Risk index averages the market spreads of the credit default swaps (CDS) of fifteen major credit derivatives dealers, including ABN Amro, Bank of America, BNP Paribas, Barclays Bank, Citigroup, Credit Suisse, Deutsche Bank, Goldman Sachs Group, HSBC, Lehman Brothers, JPMorgan Chase, Merrill Lynch, Morgan Stanley, UBS, and Wachovia. Sources: Datastream, Milken Institute.
0
100
200
300
400
500
600
700
07/2007 09/2007 11/2007 01/2008 03/2008 05/2008 07/2008 09/2008 11/2008 01/2009
Average CDS spread, basis points
Bear Stearns acquired
Government announces support for Fannie Mae and Freddie Mac
Lehman Brother files for bankruptcy and Merrill Lynch acquired
AIG rescued
Citigroup agreed to buy Wachovia
October 10, 2008: 607 bps
January 30, 2009: 422 bps

12
Federal Reserve assets increased but asset quality deteriorated
Sources: Federal Reserve, Milken Institute.
0
400
800
1,200
1,600
2,000
2,400
2000 2001 2002 2003 2004 2005 2006 2007 2008 2009
US$ billions
Total assets of Federal Reserve banks
U.S. Treasury securities held outright
11/12/2008: $2.21 trillion
12/17/2008: $2.31 trillion
1/28/2009: $1.93 trillion
1/28/2009: $475 billion

13
Balance sheet information on FDIC-insured institutions
Sources: FDIC, Milken Institute.
Cash-to-asset ratio (left axis)
Borrowed funds-to-asset ratio (left axis)
Deposits-to-asset ratio (right axis)
Equity capital-to-asset ratio (right axis)
Insured deposits-to-asset ratio (right axis)
0
2
4
6
8
10
12
14
16
18
20
1992 1994 1996 1998 2000 2002 2004 2006 Q3 2008
0
10
20
30
40
50
60
70
80
90Percent Percent

1414
U.S. regulatory capital requirements and prompt corrective action categories
Tier 1leverage
Tier 1 risk-based
Total risk-based
Well capitalized >= 5% and >= 6% and >= 10%
Adequately capitalized
>= 4% and >= 4% and >= 8%
Undercapitalized < 4% or < 4% or < 8%
Significantly undercapitalized
< 3% or < 3% or < 6%
Critically undercapitalized
Tangible equity capital ratio that is <= 2%
Source: FDIC.

1515
Leverage ratio for commercial banks
Sources: Historical Statistics of the United States, FDIC, Milken Institute.Note: The leverage ratio is the reciprocal of the capital-asset ratio.
0
2
4
6
8
10
12
14
16
18
20
1896 1905 1914 1923 1932 1941 1950 1959 1968 1977 1986 1995 2004
Asset/equity capital ratio
Average, 1896 - Q3 2008: 11.0x
1945: 18.2x 1979: 17.4x
1932: 6.2xQ3 2008: 10.3x
1896: 3.6x

16
XI. When will we hit bottom?

Conservatorship of Fannie Mae and Freddie Mac…

Bailing out AIG…

Capital Purchase Program under the TARP…

Automotive Industry Financing Program…
Targeted Investment Program and Asset Guaranty Program…

And Still……

23
The U.S. regulatory regime: In need of reform?
Sources: Financial Services Roundtable (2007), Milken Institute.
National banks State commercial and savings banks
Federal savings banks
Insurance companies
Securities brokers/dealers
Other financial companies, including mortgage
companies and brokers
• Fed• OTS
• OCC• FDIC
• State bank regulators• FDIC• Fed--state member commerical banks
• OTS• FDIC
• 50 State insurance regulators plus District of Columbia and Puerto Rico
• FINRA• SEC• CFTC• State securities regulators
• Fed• State licensing (if needed)• U.S. Treasury for some products
• OCC• Host county regulator
• Fed• Host county regulator
• OTS• Host county regulator
Federal branch
Foreign branch
Limited foreign branch
Fed is the umbrella or consolidated regulator
Primary/secondaryfunctionalregulator
Notes:Justice Department: Assesses effects of mergers and acquisitions on competitionFederal Courts: Ultimate decider of banking, securities, and insurance productsCFTC: Commodity Futures Trading CommissionFDIC: Federal Deposit Insurance CorporationFed: Federal ReserveFINRA: Financial Industry Regulatory Authority GSEs: Government Sponsored Enterprises OCC: Comptroller of the CurrencyOTS: Office of Thrift SupervisionSEC: Securities and Exchange Commission
• Federal Housing Finance Agency
Fannie Mae, Freddie Mac, and Federal Home Loan Banks
Financial, bank and thrift holding companies
Justice Department• Assesses effects of mergers and acquisitions on competition
Federal courts• Ultimate decider of banking, securities, and insurance products