financial crimes enforcement network - ffiec
TRANSCRIPT

1Mortgage Loan Fraud Update
Financial Crimes Enforcement Network
iMortgage Loan Fraud Update
Financial Crimes Enforcement Network
Mortgage Loan Fraud Update
Suspicious Activity Report Filings from October 1-December 31, 2009
July 2010

iiMortgage Loan Fraud Update
Financial Crimes Enforcement Network
Introduction 1
Summary of Filings 2
Subjects 4
Subject Locations 5
Reported Activities 10
Loan Modification/Foreclosure Rescue Frauds 11
Filers 13
Conclusion 14
Table of Contents

1Mortgage Loan Fraud Update
Financial Crimes Enforcement Network
Introduction
T his update to FinCEN’s prior Mortgage Loan Fraud (MLF) studies looks at sus-picious activity report (SAR) filings from January through December 2009 (CY
2009), with a particular emphasis on the 4th Quarter of CY 2009 (2009 Q4). This report provides information on reported activities, geographic locations, filers and other relevant data for perspectives on filing trends in CY 2009 and 2009 Q4, as well as comparisons to data in 2008 Q4.1 Tables and illustrations also show filings by state, county, and metropolitan areas during the covered periods.
In addition, this report uses a limited amount of data for January to March 2010 (2010 Q1). A future 1. report will include complete data for this period.
2Mortgage Loan Fraud Update
Financial Crimes Enforcement Network
Summary of Filings
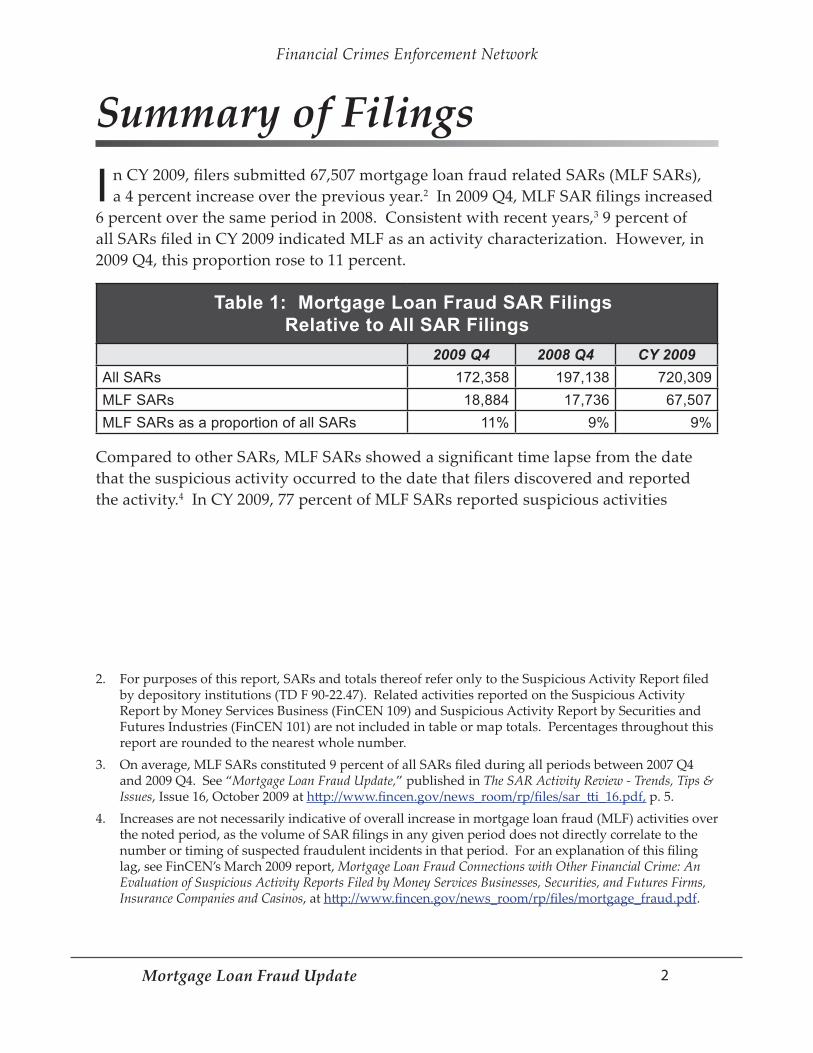
I n CY 2009, filers submi�ed 67,507 mortgage loan fraud related SARs (MLF SARs), a 4 percent increase over the previous year.2 In 2009 Q4, MLF SAR filings increased
6 percent over the same period in 2008. Consistent with recent years,3 9 percent of all SARs filed in CY 2009 indicated MLF as an activity characterization. However, in 2009 Q4, this proportion rose to 11 percent.
Table 1: Mortgage Loan Fraud SAR Filings Relative to All SAR Filings
2009 Q4 2008 Q4 CY 2009All SARs 172,358 197,138 720,309MLF SARs 18,884 17,736 67,507MLF SARs as a proportion of all SARs 11% 9% 9%
Compared to other SARs, MLF SARs showed a significant time lapse from the date that the suspicious activity occurred to the date that filers discovered and reported the activity.4 In CY 2009, 77 percent of MLF SARs reported suspicious activities
For purposes of this report, SARs and totals thereof refer only to the Suspicious Activity Report filed 2. by depository institutions (TD F 90-22.47). Related activities reported on the Suspicious Activity Report by Money Services Business (FinCEN 109) and Suspicious Activity Report by Securities and Futures Industries (FinCEN 101) are not included in table or map totals. Percentages throughout this report are rounded to the nearest whole number.On average, MLF SARs constituted 9 percent of all SARs filed during all periods between 2007 Q4 3. and 2009 Q4. See “Mortgage Loan Fraud Update,” published in The SAR Activity Review - Trends, Tips & Issues, Issue 16, October 2009 at h�p://www.fincen.gov/news_room/rp/files/sar_�i_16.pdf, p. 5.Increases are not necessarily indicative of overall increase in mortgage loan fraud (MLF) activities over 4. the noted period, as the volume of SAR filings in any given period does not directly correlate to the number or timing of suspected fraudulent incidents in that period. For an explanation of this filing lag, see FinCEN’s March 2009 report, Mortgage Loan Fraud Connections with Other Financial Crime: An Evaluation of Suspicious Activity Reports Filed by Money Services Businesses, Securities, and Futures Firms, Insurance Companies and Casinos, at h�p://www.fincen.gov/news_room/rp/files/mortgage_fraud.pdf.

3Mortgage Loan Fraud Update
Financial Crimes Enforcement Network
that occurred more than a year prior to their reporting (Table 2).5 By contrast, filers reported activities less than a year old in 85 percent of SARs that did not include mortgage loan fraud as a suspected activity.6
Table 2: MLF SARs Compared to Other SARs Periods Elapsed Between Activity and Filing Dates in CY 2009Period from activity date to
reporting date MLF SARs All Other SARs (MLF SARs not included)
0 - 90 days 12% 53%90 days - 180 days 6% 19%180 days - 1 year 6% 12%1 - 2 years 21% 8%2 - 3 years 30% 3%3 - 4 years 18% 2%4 - 5 years 5% 1%> 5 years 3% 1%
Time lapses for 2009 Q4 MLF SAR filings showed an increasing focus on older suspected fraud activity. In 2009 Q4, 65 percent of reported activities occurred more than 2 years prior to filing compared to 43 percent in 2008 Q4 (Table 3).
Table 3: Mortgage Loan Fraud (MLF) SARs Time Elapsed from Activity Date to Reporting Date
Time Lapsed 2009 Q4 2008 Q4 CY 20090 - 90 days 12% 15% 12%90 - 180 days 5% 6% 6%180 days - 1 year 5% 10% 6%1 - 2 years 12% 27% 21%2 - 3 years 33% 26% 30%3 - 4 years 25% 10% 18%4 - 5 years 6% 4% 5%> 5 years 2% 3% 3%
Calculations for Tables 2 and 3 derive from Part III, line 33 and Part IV, line 50 of the SAR form. 5. SARs with omi�ed or erroneous filing or activity dates are not represented. [Some figures and percentages in tables are highlighted in bold type to reinforce conclusions made in preceding narrative descriptions.]Due to rounding, sums of figures depicted in tables may not precisely equate to actual totals, and 6. percentages may not aggregate to 100 percent.
4Mortgage Loan Fraud Update
Financial Crimes Enforcement Network
For 2008 Q4 filings, a majority of activities occurred 1 to 3 years prior to filing, while the majority of 2009 Q4 filings – 1 year later – occurred 2 to 4 years prior to filing. For both quarters, a majority of reported activities took place between October 2005 and December 2007.7
FinCEN previously reported on contributing factors that triggered loan reviews and led to the discovery of more dated suspicious activities.8 Among these factors was an increasing prevalence of post origination loan reviews by a variety of businesses, other than the lending institution, that were stakeholders or otherwise involved in the detection of suspected mortgage loan fraud. Mortgage loan purchasers and providers of mortgage insurance, certificate insurance, or similar credit enhancement have taken an increasing role in detecting potential fraud or misrepresentations. As widely reported in the media, originating institutions have consequently faced multibillion dollar repurchase demands and denied or contested claims from credit enhancing institutions, leading to increased se�lement negotiations and litigation.
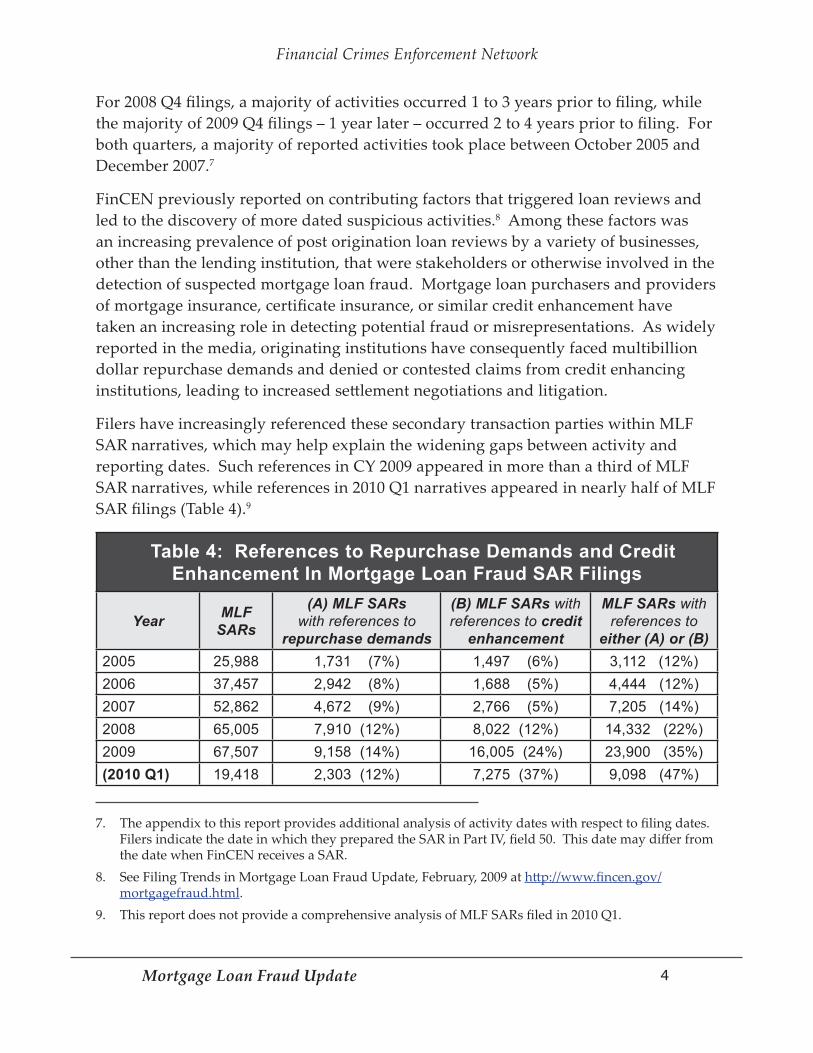
Filers have increasingly referenced these secondary transaction parties within MLF SAR narratives, which may help explain the widening gaps between activity and reporting dates. Such references in CY 2009 appeared in more than a third of MLF SAR narratives, while references in 2010 Q1 narratives appeared in nearly half of MLF SAR filings (Table 4).9
Table 4: References to Repurchase Demands and Credit Enhancement In Mortgage Loan Fraud SAR Filings
Year MLF SARs
(A) MLF SARs with references to
repurchase demands
(B) MLF SARs with references to credit
enhancement
MLF SARs with references to
either (A) or (B)2005 25,988 1,731 (7%) 1,497 (6%) 3,112 (12%)2006 37,457 2,942 (8%) 1,688 (5%) 4,444 (12%)2007 52,862 4,672 (9%) 2,766 (5%) 7,205 (14%)2008 65,005 7,910 (12%) 8,022 (12%) 14,332 (22%)2009 67,507 9,158 (14%) 16,005 (24%) 23,900 (35%)(2010 Q1) 19,418 2,303 (12%) 7,275 (37%) 9,098 (47%)
The appendix to this report provides additional analysis of activity dates with respect to filing dates. 7. Filers indicate the date in which they prepared the SAR in Part IV, field 50. This date may differ from the date when FinCEN receives a SAR. See Filing Trends in Mortgage Loan Fraud Update, February, 2009 at 8. h�p://www.fincen.gov/mortgagefraud.html. This report does not provide a comprehensive analysis of MLF SARs filed in 2010 Q1.9.

5Mortgage Loan Fraud Update
Financial Crimes Enforcement Network
During all periods in this review, more than 80 percent of MLF SARs involved transactions or a�empted transactions for amounts under $500,000. Less than a third of MLF SARs included loss amounts (31 percent in 2009 Q4 and 25 percent in CY 2009). Most of the MLF SARs that reported loss amounts also involved loan amounts under $500,000. Consistent with previous periods, most MLF SARs did not report amounts recovered in the transaction (Table 5).
Table 5: Mortgage Loan Fraud (MLF) SARs Reported Amounts10 of: (1) Suspicious Activity, (2) Loss Prior to Recovery, and (3) Recovery
< $100K $100K - $250K
$250K - $500K
$500K - $1M
$1M -$2M > $2M Not
indicated
SARs reporting suspicious activity amounts
2009 Q43,255 (17%)
7,235 (38%)
5,757 (30%)
1,654 (9%)
414 (2%)
313 (2%)
256 (1%)
2008 Q43,050 (17%)
6,379 (36%)
5,302 (30%)
1,955 (11%)
455 (3%)
288 (2%)
307 (2%)
CY 200911,388 (17%)
23,809 (35%)
21,230 (31%)
6,929 (10%)
1,781 (3%)
1,242 (2%)
1,128 (2%)
SARs reporting loss amounts
2009 Q41,514 (8%)
3,365 (18%)
768 (4%)
174 (1%)
38 - 33 - 12,992 (69%)
2008 Q41,986 (11%)
995 (6%)
391 (2%)
125 (1%)
29 - 22 - 14,188 (80%)
CY 20097,348 (11%)
6,713 (10%)
2,211 (3%)
572 (1%)
130 - 96 - 50,437 (75%)
SARs reporting recovered amounts
2009 Q423 15 18 5 6 1 18,816
2008 Q430 20 21 5 5 1 17,654
CY 200997 67 55 15 15 3 67,255
The amounts of 10. suspicious activity, loss prior to recovery, and recovery are reported in Part III of the SAR form, on lines 34, 36 and 37. Percentages under 1% are omi�ed or indicated with a hyphen for this report.

6Mortgage Loan Fraud Update
Financial Crimes Enforcement Network
Relationships of SubjectsFilers categorized roughly half of subjects in MLF SARs filed in CY 2009 as “Borrower” and a quarter as “Other.”11 Filers described 10 percent of subjects as “Broker” and 8 percent as “Customer” (Table 6).
Table 6: Mortgage Loan Fraud SAR Subjects Relationship to Reporting Institution
Relationship to Filer12
2009 Q4 2008 Q4 CY 2009
Borrower 15,718 (50%) 15,099 (46%) 50,751 (46%)Broker 2,114 (7%) 5,169 (16%) 11,234 (10%)Customer 1,988 (6%) 2,216 (7%) 8,854 (8%)Appraiser 1,772 (6%) 2,044 (6%) 6,031 (5%)Employee 186 - 213 - 792 (1%)Agent 129 - 130 - 476 -Attorney 67 - 79 - 252 -Director 57 - 42 - 157 -Officer 39 - 32 - 154 -Accountant 29 - 44 - 80 -Shareholder 3 - 2 - 7 -Other13 7,841 (25%) 6,306 (19%) 25,629 (23%)
A filer may report one or more subjects in Part II of the SAR, where applicable. Subject totals in this 11. report represent total name variations rather than unique individuals, without consideration for alternate spellings, aliases, identically named subjects, or those with multiple addresses.The “Relationship of the Subject to the Financial Institution” is reported in Part II, line 30 of the SAR 12. form. For each subject, a filer may report one or more “Relationship of the Subject to the Financial Institution,” where applicable.“Other” is a catchall category that is available to filers to report a subject relationship that does not 13. fall under any of those specified in Part II, line 30 of the SAR.
7Mortgage Loan Fraud Update
Financial Crimes Enforcement Network
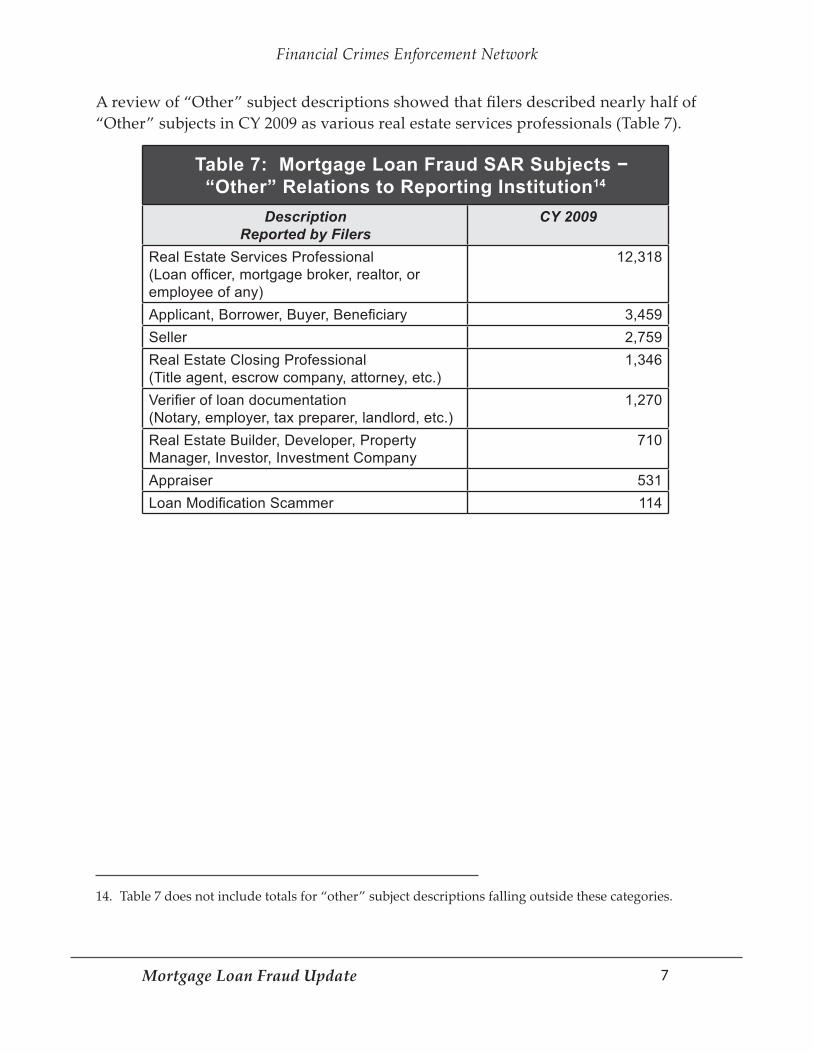
A review of “Other” subject descriptions showed that filers described nearly half of “Other” subjects in CY 2009 as various real estate services professionals (Table 7).
Table 7 does not include totals for “other” subject descriptions falling outside these categories.14.
Table 7: Mortgage Loan Fraud SAR Subjects − “Other” Relations to Reporting Institution14
Description Reported by Filers
CY 2009
Real Estate Services Professional (Loan officer, mortgage broker, realtor, or employee of any)
12,318
Applicant, Borrower, Buyer, Beneficiary 3,459Seller 2,759Real Estate Closing Professional (Title agent, escrow company, attorney, etc.)
1,346
Verifier of loan documentation (Notary, employer, tax preparer, landlord, etc.)
1,270
Real Estate Builder, Developer, Property Manager, Investor, Investment Company
710
Appraiser 531Loan Modification Scammer 114

8Mortgage Loan Fraud Update
Financial Crimes Enforcement Network
Subject LocationsCalifornia and Florida remained the most common subject state locations (Table 8). At the county level, Los Angeles and Miami-Dade had the most subjects, followed by Cook and Maricopa counties (Table 9). Filers reported, in order, the greater Los Angeles, Miami, New York, Chicago, and Riverside areas as the top Metropolitan Statistical Area (MSA) locations of MLF SAR subjects.
Table 8: Mortgage Loan Fraud SAR Subjects by State Location2009 Rank State 2009 Q4 CY 2009 2009 Rank State 2009 Q4 CY 20091 CA 7,745 26,201 27 AL 170 5812 FL 5,223 18,320 28 ID 157 4613 NY 1,678 5,620 29 CT 133 5434 IL 1,662 5,610 30 HI 113 2985 AZ 1,214 3,949 31 LA 110 4756 GA 1,036 3,995 32 OK 103 3497 TX 990 3,759 33 KY 103 3128 MI 920 3,559 34 KS 84 2469 NV 821 2,470 35 AR 76 30310 NJ 770 2,784 36 NM 72 28311 MD 701 2,369 37 MS 65 29912 VA 636 2,618 38 RI 63 37013 WA 603 1,987 39 PR 54 13214 UT 478 1,326 40 NH 52 18215 OH 452 1,667 41 DE 48 16116 CO 448 1,686 42 IA 47 18117 NC 423 1,411 43 DC 45 19318 MN 403 2,327 44 NE 41 11419 PA 398 1,372 45 WV 34 9520 MO 370 1,198 46 MT 26 10921 MA 350 1,221 47 ME 25 11422 OR 312 1,054 48 SD 17 4623 TN 284 1,046 49 AK 12 3824 IN 284 1,026 50 WY 12 4325 WI 252 783 51 VT 6 3326 SC 221 884 52 ND 6 23

9Mortgage Loan Fraud Update
Financial Crimes Enforcement Network
Stat
es a
nd T
erri
tori
es, J
anua
ry -
Dece
mbe
r 20
09M
ortg
age
Loan
Fra
ud S
AR S
ubje
cts
NJ NJ NJNJ NJNJ NJ NJNJ #9 #9 #9#9 #9#9 #9 #9#9CT CT CTCT CTCT CT CTCT #28
#28
#28
#28
#28
#28
#28
#28
#28
RI RI RIRI RIRI RI RIRI #31
#31
#31
#31
#31
#31
#31
#31
#31
DE DE DEDE DEDE DE DEDE #42
#42
#42
#42
#42
#42
#42
#42
#42
MA
MA
MA
MA
MA
MA
MA
MA
MA
#20
#20
#20
#20
#20
#20
#20
#20
#20
CA CA CACA CACA CA CACA #1 #1 #1#1 #1#1 #1 #1#1
VT VT VTVT VTVT VT VTVT #51
#51
#51
#51
#51
#51
#51
#51
#51
NH NH NHNH NHNH NH NHNH #40
#40
#40
#40
#40
#40
#40
#40
#40
MD
MD
MD
MD
MD
MD
MD
MD
MD
#12
#12
#12
#12
#12
#12
#12
#12
#12 DC DC DCD
C DCDC DC DCDC #39
#39
#39
#39
#39
#39
#39
#39
#39
ID ID IDID IDID ID IDID #30
#30
#30
#30
#30
#30
#30
#30
#30
OK
OK
OKOK
OKOK
OK
OK
OK
#32
#32
#32
#32
#32
#32
#32
#32
#32
LA LA LALA LALA LA LALA #29
#29
#29
#29
#29
#29
#29
#29
#29
WV
WV
WV
WV
WV
WV
WV
WV
WV
#47
#47
#47
#47
#47
#47
#47
#47
#47
VA VA VAVA VAVA VA VAVA #10
#10
#10
#10
#10
#10
#10
#10
#10
KY KY KYKY KYKY KY KYKY #33
#33
#33
#33
#33
#33
#33
#33
#33
AL AL ALAL ALAL AL ALAL #27
#27
#27
#27
#27
#27
#27
#27
#27
AR AR ARAR ARAR AR ARAR #34
#34
#34
#34
#34
#34
#34
#34
#34
AZ AZ AZAZ AZAZ AZ AZAZ #6 #6 #6#6 #6#6 #6 #6#6
CO CO COCO COCO CO COCO #15
#15
#15
#15
#15
#15
#15
#15
#15
FL FL FLFL FLFL FL FLFL #2 #2 #2#2 #2#2 #2 #2#2
GA
GA
GAGA
GAGA
GA
GA
GA #5 #5 #5#5 #5#5 #5 #5#5
IA IA IAIA IAIA IA IAIA #41
#41
#41
#41
#41
#41
#41
#41
#41
IL IL ILIL ILIL IL ILIL #4 #4 #4#4 #4#4 #4 #4#4IN IN ININ ININ IN ININ #2
4#2
4#2
4#2
4#2
4#2
4#2
4#2
4#2
4KS KS KSK
S KSKS KS KSKS #38
#38
#38
#38
#38
#38
#38
#38
#38
MI
MI
MI
MI
MI
MI
MI
MI
MI
#8 #8 #8#8 #8#8 #8 #8#8
MO
MO
MO
MO
MO
MO
MO
MO
MO
#21
#21
#21
#21
#21
#21
#21
#21
#21
MS
MS
MS
MS
MS
MS
MS
MS
MS
#35
#35
#35
#35
#35
#35
#35
#35
#35
MT
MT
MT
MT
MT
MT
MT
MT
MT
#46
#46
#46
#46
#46
#46
#46
#46
#46
NC NC NCNC NCNC NC NCNC #17
#17
#17
#17
#17
#17
#17
#17
#17
ND ND NDND NDND ND NDND #52
#52
#52
#52
#52
#52
#52
#52
#52 NE NE NENE NENE NE NENE #45
#45
#45
#45
#45
#45
#45
#45
#45
NM NM NMNM NMNM NM NMNM #37
#37
#37
#37
#37
#37
#37
#37
#37
NV NV NVNV NVNV NV NVNV #11
#11
#11
#11
#11
#11
#11
#11
#11
NY NY NYNY NYNY NY NYNY #3 #3 #3#3 #3#3 #3 #3#3
OH
OH
OHOH
OHOH
OH
OH
OH
#16
#16
#16
#16
#16
#16
#16
#16
#16
OR
OR
OROR
OROR
OR
OR
OR
#22
#22
#22
#22
#22
#22
#22
#22
#22
PA PA PAPA PAPA PA PAPA #18
#18
#18
#18
#18
#18
#18
#18
#18
SD SD SDSD SDSD SD SDSD #48
#48
#48
#48
#48
#48
#48
#48
#48
TN TN TNTN TNTN TN TNTN #23
#23
#23
#23
#23
#23
#23
#23
#23
TX TX TXTX TXTX TX TXTX #7 #7 #7#7 #7#7 #7 #7#7
UT UT UTUT UTUT UT UTUT #19
#19
#19
#19
#19
#19
#19
#19
#19
WI
WI
WI
WI
WI
WI
WI
WI
WI
#26
#26
#26
#26
#26
#26
#26
#26
#26
WY
WY
WY
WY
WY
WY
WY
WY
WY
#49
#49
#49
#49
#49
#49
#49
#49
#49
WA
WA
WA
WA
WA
WA
WA
WA
WA
#14
#14
#14
#14
#14
#14
#14
#14
#14
MN
MN
MN
MN
MN
MN
MN
MN
MN
#13
#13
#13
#13
#13
#13
#13
#13
#13
ME
ME
ME
ME
ME
ME
ME
ME
ME
#44
#44
#44
#44
#44
#44
#44
#44
#44
Top
Loca
tions
of S
ubje
cts
Rep
orte
d in
Mor
tgag
e Lo
an F
raud
SA
Rs
1st T
ier
2nd
Tie
r3r
d T
ier
4th
Tier
5th
Tier

10Mortgage Loan Fraud Update
Financial Crimes Enforcement Network
Mor
tgag
e Lo
an F
raud
SAR
Sub
ject
s
Top
Met
ropo
litan
Are
as, J
anua
ry -
Dec
embe
r 200
9Se
attle
Seat
tleSe
attle
Seat
tleSe
attle
Seat
tleSe
attle
Seat
tleSe
attle
#19
#19
#19
#19
#19
#19
#19
#19
#19
Portl
and
Portl
and
Portl
and
Portl
and
Portl
and
Portl
and
Portl
and
Portl
and
Portl
and
#24
#24
#24
#24
#24
#24
#24
#24
#24
San
Die
goSa
n D
iego
San
Die
goSa
n D
iego
San
Die
goSa
n D
iego
San
Die
goSa
n D
iego
San
Die
go#1
2#1
2#1
2#1
2#1
2#1
2#1
2#1
2#1
2
Phoe
nix
Phoe
nix
Phoe
nix
Phoe
nix
Phoe
nix
Phoe
nix
Phoe
nix
Phoe
nix
Phoe
nix
#7 #7 #7#7 #7#7 #7 #7#7Lo
s An
gele
sLo
s An
gele
sLo
s An
gele
sLo
s An
gele
sLo
s An
gele
sLo
s An
gele
sLo
s An
gele
sLo
s An
gele
sLo
s An
gele
s#1 #1 #1#1 #1#1 #1 #1#1
Riv
ersi
deR
iver
side
Riv
ersi
deR
iver
side
Riv
ersi
deR
iver
side
Riv
ersi
deR
iver
side
Riv
ersi
de#5 #5 #5#5 #5#5 #5 #5#5
Bos
ton
Bos
ton
Bos
ton
Bos
ton
Bos
ton
Bos
ton
Bos
ton
Bos
ton
Bos
ton
#23
#23
#23
#23
#23
#23
#23
#23
#23
New
Yor
kN
ew Y
ork
New
Yor
kN
ew Y
ork
New
Yor
kN
ew Y
ork
New
Yor
kN
ew Y
ork
New
Yor
k#3 #3 #3#3 #3#3 #3 #3#3
Sacr
amen
toSa
cram
ento
Sacr
amen
toSa
cram
ento
Sacr
amen
toSa
cram
ento
Sacr
amen
toSa
cram
ento
Sacr
amen
to#1
7#1
7#1
7#1
7#1
7#1
7#1
7#1
7#1
7
Min
neap
olis
Min
neap
olis
Min
neap
olis
Min
neap
olis
Min
neap
olis
Min
neap
olis
Min
neap
olis
Min
neap
olis
Min
neap
olis
#14
#14
#14
#14
#14
#14
#14
#14
#14
Las
Vega
sLa
s Ve
gas
Las
Vega
sLa
s Ve
gas
Las
Vega
sLa
s Ve
gas
Las
Vega
sLa
s Ve
gas
Las
Vega
s#1
3#1
3#1
3#1
3#1
3#1
3#1
3#1
3#1
3Sa
n Jo
seSa
n Jo
seSa
n Jo
seSa
n Jo
seSa
n Jo
seSa
n Jo
seSa
n Jo
seSa
n Jo
seSa
n Jo
se#1
8#1
8#1
8#1
8#1
8#1
8#1
8#1
8#1
8
San
Fran
cisc
oSa
n Fr
anci
sco
San
Fran
cisc
oSa
n Fr
anci
sco
San
Fran
cisc
oSa
n Fr
anci
sco
San
Fran
cisc
oSa
n Fr
anci
sco
San
Fran
cisc
o#9 #9 #9#9 #9#9 #9 #9#9
Den
ver
Den
ver
Den
ver
Den
ver
Den
ver
Den
ver
Den
ver
Den
ver
Den
ver
#21
#21
#21
#21
#21
#21
#21
#21
#21
Dal
las
Dal
las
Dal
las
Dal
las
Dal
las
Dal
las
Dal
las
Dal
las
Dal
las
#16
#16
#16
#16
#16
#16
#16
#16
#16
Atla
nta
Atla
nta
Atla
nta
Atla
nta
Atla
nta
Atla
nta
Atla
nta
Atla
nta
Atla
nta
#8 #8 #8#8 #8#8 #8 #8#8
Chi
cago
Chi
cago
Chi
cago
Chi
cago
Chi
cago
Chi
cago
Chi
cago
Chi
cago
Chi
cago
#4 #4 #4#4 #4#4 #4 #4#4
Det
roit
Det
roit
Det
roit
Det
roit
Det
roit
Det
roit
Det
roit
Det
roit
Det
roit
#10
#10
#10
#10
#10
#10
#10
#10
#10
Was
hing
ton,
DC
Was
hing
ton,
DC
Was
hing
ton,
DC
Was
hing
ton,
DC
Was
hing
ton,
DC
Was
hing
ton,
DC
Was
hing
ton,
DC
Was
hing
ton,
DC
Was
hing
ton,
DC
#6 #6 #6#6 #6#6 #6 #6#6
Phila
delp
hia
Phila
delp
hia
Phila
delp
hia
Phila
delp
hia
Phila
delp
hia
Phila
delp
hia
Phila
delp
hia
Phila
delp
hia
Phila
delp
hia
#22
#22
#22
#22
#22
#22
#22
#22
#22
Bal
timor
eB
altim
ore
Bal
timor
eB
altim
ore
Bal
timor
eB
altim
ore
Bal
timor
eB
altim
ore
Bal
timor
e#2
5#2
5#2
5#2
5#2
5#2
5#2
5#2
5#2
5
Tam
paTa
mpa
Tam
paTa
mpa
Tam
paTa
mpa
Tam
paTa
mpa
Tam
pa#1
5#1
5#1
5#1
5#1
5#1
5#1
5#1
5#1
5
Hou
ston
Hou
ston
Hou
ston
Hou
ston
Hou
ston
Hou
ston
Hou
ston
Hou
ston
Hou
ston
#20
#20
#20
#20
#20
#20
#20
#20
#20
Orla
ndo
Orla
ndo
Orla
ndo
Orla
ndo
Orla
ndo
Orla
ndo
Orla
ndo
Orla
ndo
Orla
ndo
#11
#11
#11
#11
#11
#11
#11
#11
#11
Mia
mi
Mia
mi
Mia
mi
Mia
mi
Mia
mi
Mia
mi
Mia
mi
Mia
mi
Mia
mi
#2 #2 #2#2 #2#2 #2 #2#2
Subj
ects
per
Met
ropo
litan
Are
aR
epor
ted
in M
ortg
age
Loan
Fra
ud S
AR
s
3,50
1 to
10,
700
1,00
1 to
3,
500
401
to
1,00
010
1 to
40
00
to
100

11Mortgage Loan Fraud Update
Financial Crimes Enforcement Network
Table 9: Mortgage Loan Fraud SAR Subjects Top Counties in CY 2009
Rank County MLF SAR Subjects Rank County MLF SAR
Subjects1 Los Angeles, CA 7,605 26 Fulton, GA 9132 Miami-Dade, FL 6,022 27 Suffolk, NY 8773 Cook, IL 3,785 28 King, WA 8174 Maricopa, AZ 3,355 29 Dallas, TX 7885 Orange, CA 3,051 30 Lee, FL 7856 Broward, FL 2,774 31 Gwinnett, GA 7157 San Diego, CA 2,267 32 Prince George’s, MD 6788 Clark, NV 2,217 33 Salt Lake, UT 6549 Riverside, CA 2,075 34 Montgomery, MD 645
10 San Bernardino, CA 1,568 35 DuPage, IL 61811 Orange, FL 1,534 36 Pinellas, FL 56512 Santa Clara, CA 1,513 37 Ventura, CA 49513 Palm Beach, FL 1,293 38 Seminole, FL 48614 Queens, NY 1,270 39 San Joaquin, CA 48315 Alameda, CA 1,234 40 DeKalb, GA 48116 Wayne, MI 1,171 41 Kern, CA 46717 Hillsborough, FL 1,125 42 Stanislaus, CA 42918 Hennepin, MN 1,090 43 San Mateo, CA 42219 Oakland, MI 1,087 44 Cuyahoga, OH 40220 Sacramento, CA 1,067 45 Cobb, GA 39821 Contra Costa, CA 1,011 46 Marion, IN 39322 Fairfax, VA 981 47 Tarrant, TX 38523 Kings, NY 979 48 Lake, IL 38324 Nassau, NY 966 49 Essex, NJ 36725 Harris, TX 925 50 Mecklenburg, NC 358
12Mortgage Loan Fraud Update
Financial Crimes Enforcement Network
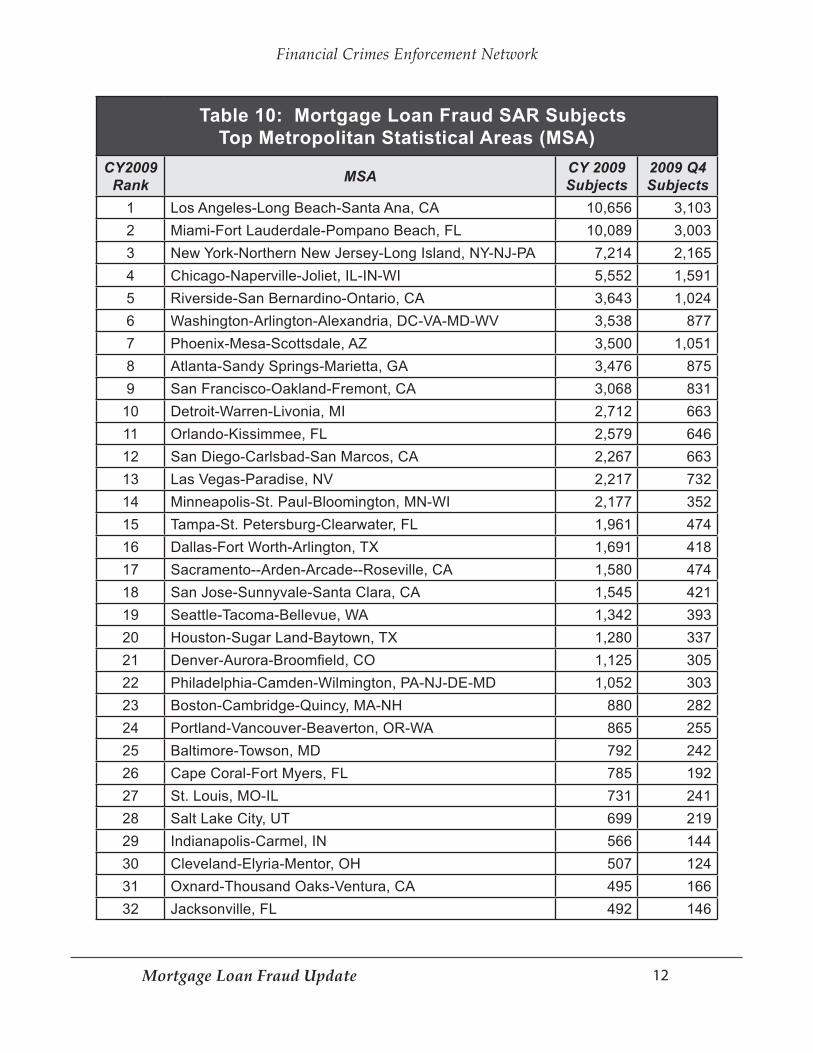
Table 10: Mortgage Loan Fraud SAR Subjects Top Metropolitan Statistical Areas (MSA)
CY2009 Rank MSA CY 2009
Subjects2009 Q4 Subjects
1 Los Angeles-Long Beach-Santa Ana, CA 10,656 3,1032 Miami-Fort Lauderdale-Pompano Beach, FL 10,089 3,0033 New York-Northern New Jersey-Long Island, NY-NJ-PA 7,214 2,1654 Chicago-Naperville-Joliet, IL-IN-WI 5,552 1,5915 Riverside-San Bernardino-Ontario, CA 3,643 1,0246 Washington-Arlington-Alexandria, DC-VA-MD-WV 3,538 8777 Phoenix-Mesa-Scottsdale, AZ 3,500 1,0518 Atlanta-Sandy Springs-Marietta, GA 3,476 8759 San Francisco-Oakland-Fremont, CA 3,068 831
10 Detroit-Warren-Livonia, MI 2,712 66311 Orlando-Kissimmee, FL 2,579 64612 San Diego-Carlsbad-San Marcos, CA 2,267 66313 Las Vegas-Paradise, NV 2,217 73214 Minneapolis-St. Paul-Bloomington, MN-WI 2,177 35215 Tampa-St. Petersburg-Clearwater, FL 1,961 47416 Dallas-Fort Worth-Arlington, TX 1,691 41817 Sacramento--Arden-Arcade--Roseville, CA 1,580 47418 San Jose-Sunnyvale-Santa Clara, CA 1,545 42119 Seattle-Tacoma-Bellevue, WA 1,342 39320 Houston-Sugar Land-Baytown, TX 1,280 33721 Denver-Aurora-Broomfield, CO 1,125 30522 Philadelphia-Camden-Wilmington, PA-NJ-DE-MD 1,052 30323 Boston-Cambridge-Quincy, MA-NH 880 28224 Portland-Vancouver-Beaverton, OR-WA 865 25525 Baltimore-Towson, MD 792 24226 Cape Coral-Fort Myers, FL 785 19227 St. Louis, MO-IL 731 24128 Salt Lake City, UT 699 21929 Indianapolis-Carmel, IN 566 14430 Cleveland-Elyria-Mentor, OH 507 12431 Oxnard-Thousand Oaks-Ventura, CA 495 16632 Jacksonville, FL 492 146
13Mortgage Loan Fraud Update
Financial Crimes Enforcement Network
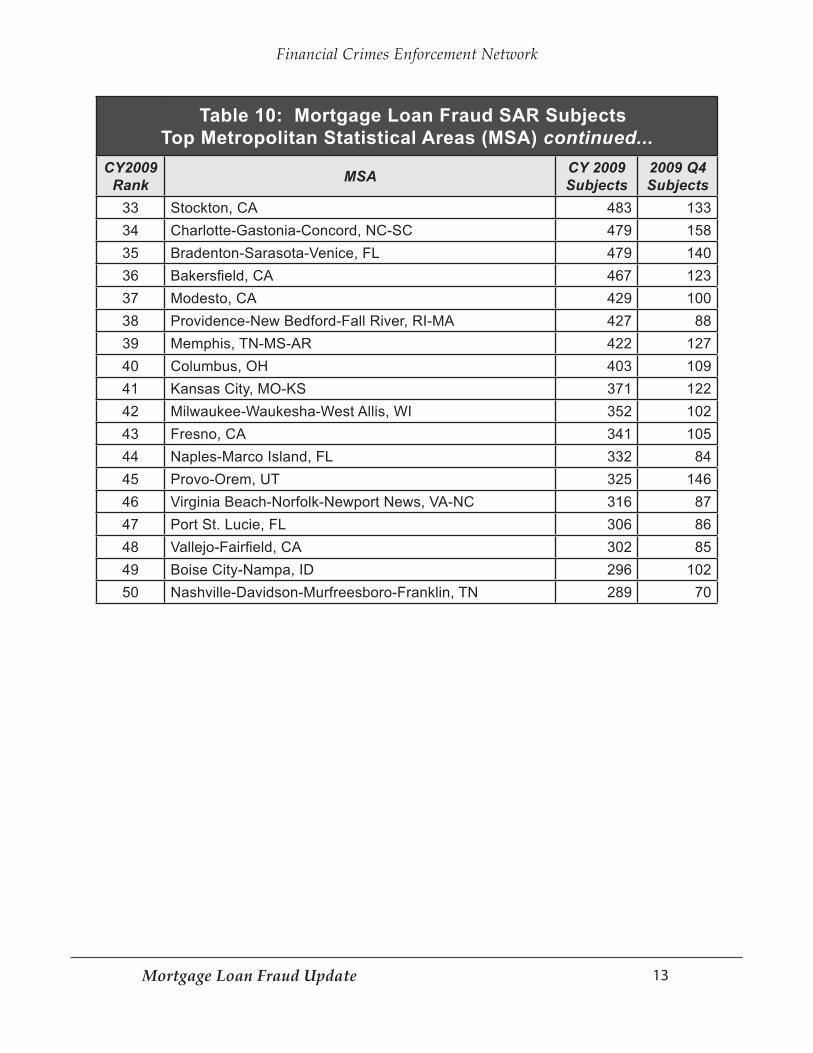
Table 10: Mortgage Loan Fraud SAR Subjects Top Metropolitan Statistical Areas (MSA) continued...
CY2009 Rank MSA CY 2009
Subjects2009 Q4 Subjects
33 Stockton, CA 483 13334 Charlotte-Gastonia-Concord, NC-SC 479 15835 Bradenton-Sarasota-Venice, FL 479 14036 Bakersfield, CA 467 12337 Modesto, CA 429 10038 Providence-New Bedford-Fall River, RI-MA 427 8839 Memphis, TN-MS-AR 422 12740 Columbus, OH 403 10941 Kansas City, MO-KS 371 12242 Milwaukee-Waukesha-West Allis, WI 352 10243 Fresno, CA 341 10544 Naples-Marco Island, FL 332 8445 Provo-Orem, UT 325 14646 Virginia Beach-Norfolk-Newport News, VA-NC 316 8747 Port St. Lucie, FL 306 8648 Vallejo-Fairfield, CA 302 8549 Boise City-Nampa, ID 296 10250 Nashville-Davidson-Murfreesboro-Franklin, TN 289 70

14Mortgage Loan Fraud Update
Financial Crimes Enforcement Network
Reported ActivitiesFilers most frequently cited “False Statement” as a secondary activity, including this characterization in more than 25 percent of MLF SARs (Table 11).
Table 11: Mortgage Loan Fraud SARs Suspicious Activities Characterizations15
Activity2009
Q4 MLF SARs
2008 Q4 MLF SARs
CY 2009 MLF
SARsActivity
2009 Q4 MLF SARs
2008 Q4 MLF SARs
CY 2009 MLF
SARsMortgage Loan Fraud
18,884 17,736 67,507 Counterfeit Instrument (other)
29 12 65
False Statement 4,983 4,809 18,144 Counterfeit Check 26 18 60Identity Theft 706 1,172 2,013 Bribery / Gratuity 8 5 23
Other16 400 455 1,654 Mysterious Disappearance
7 5 21
BSA / Structuring / Money Laundering
83 91 353 Credit Card Fraud 5 9 30
Wire Transfer Fraud
78 29 226 Check Kiting 4 6 23
Consumer Loan Fraud
63 135 463 Debit Card Fraud 4 2 6
Misuse of Position or Self-Dealing
60 80 304 Computer Intrusion
1 - 9
Check Fraud 34 42 125 Counterfeit Credit / Debit Card
1 - 4
Commercial Loan Fraud
33 30 155 Terrorist Financing
- 1 1
Defalcation / Embezzlement
32 13 100
The characterization of suspicious activity is reported in Part III, line 35 of the SAR. A filer may 15. report one or more characterizations of suspicious activity in a SAR, where applicable.The characterization of “Other” is a catchall category that is available to filers to report an activity 16. that does not fall under any of those specified in Part III, line 35 of the SAR. For an explanation of the characterization of “Other,” see The SAR Activity Review - Trends, Tips & Issues, Issue 16, October 2009, Section Two, “Mortgage Loan Fraud Update” found at h�p://www.fincen.gov/news_room/rp/files/sar_�i_16.pdf.

15Mortgage Loan Fraud Update
Financial Crimes Enforcement Network
Loan Modification/Foreclosure Rescue Frauds
As noted in FinCEN’s MLF SAR update for 2009 Q3, SAR filings reporting loan modification/foreclosure scam activities increased sharply in 2009 a�er the issuance of a FinCEN Advisory addressing these activities.17 FinCEN has since conducted an analysis of a sample of SARs reporting loan modification/foreclosure rescue scams from January 1, 2004, through December 31, 2009. Among the filings in this sample, reports by depository institutions of loan modification/foreclosure rescue scams increased more than 150% in 2009 over the entire preceding 5-year period.18 On June 17, 2010, FinCEN issued a separate report on its review and analysis of the sample SARs reporting loan modification/foreclosure rescue scams.19
Primary Federal Regulatory Agencies Reported in MLF SARs
In 2009 Q4, approximately 435 filers submi�ed 18,884 MLF SARs, a 6 percent increase in filings over 2008 Q4. During CY 2009, approximately 1,140 institutions filed 67,507 MLF SARs, a 4 percent increase in filings over CY 2008.
Filers that indicated the Office of the Comptroller of the Currency (OCC) as their primary Federal regulatory authority submi�ed 80 percent of MLF SARs during 2009 Q4 and 69 percent throughout CY 2009 (Table 12). This is a significant increase relative to corresponding filings in 2008 Q4 (54 percent). These filers comprised 18 percent of all institutions that filed MLF SARs during 2009 Q4, and 16 percent that filed during the calendar year.
See FinCEN Advisory FIN-2009-A001, dated April 6, 2009, 17. Guidance to Financial Institutions on Filing Suspicious Activity Reports regarding Loan Modification/Foreclosure Rescue Scams, h�p://www.fincen.gov/statutes_regs/guidance/html/fin-2009-a001.html. See also FinCEN’s February 2010 MLF report, Mortgage Loan Fraud Update, Suspicious Activity Report Filings from July 1 – September 30, 2009, h�p://www.fincen.gov/news_room/nr/html/20100218.html.As noted in footnote 2, filing dates do not necessarily indicate activity dates. 18. See 19. Loan Modification and Foreclosure Rescue Scams – Evolving Trends and Pa�erns in Bank Secrecy Act Reporting, h�p://www.fincen.gov/news_room/nr/html/20100617.html.

16Mortgage Loan Fraud Update
Financial Crimes Enforcement Network
Filers that indicated the Federal Deposit Insurance Corporation (FDIC) as their primary Federal regulatory authority submi�ed 3 percent of MLF SARs during both 2009 Q4 and CY 2009. For the quarter, these filers comprised 34 percent of all institutions that filed MLF SARs, and 37 percent for the calendar year.
Filers that indicated the Office of Thri� Supervision as their primary Federal regulatory authority showed the most significant quarterly decrease in filings, submi�ing 7 percent of MLF SARs in 2009 Q4, down from 22 percent in 2008 Q4.
Table 12: Mortgage Loan Fraud SARs Reported Primary Federal Regulators
OCC FRB OTS FDIC NCUA FHFA20
2009 Q4Total MLF SARs indicating Primary Regulator
15,183 (80%)
1,673 (9%)
1,239 (7%)
502 (3%)
70 -
199 (1%)
2008 Q4 9,566 (54%)
2,918 (16%)
3,949 (22%)
380 (2%)
196 (1%)
701 (4%)
CY 2009 46,854 (69%)
8,559 (13%)
8,681 (13%)
2,023 (3%)
445 (1%)
859 (1%)
2009 Q4Total Filers Indicating Primary Regulator21
79 (18%)
72 (17%)
85 (20%)
150 (34%)
41 (9%) -
2008 Q4 84 (19%)
65 (15%)
105 (24%)
125 (29%)
47 (11%) -
CY 2009 180 (16%)
162 (14%)
171 (15%)
417 (37%)
181 (16%) -
The Federal Housing Finance Agency (FHFA), which is the Federal regulator for Fannie Mae and 20. Freddie Mac, has established a process for the companies to report possible mortgage fraud to FHFA, which in turn files with FinCEN.Filer counts are based on unique filer Employer Identification Numbers (EINs) reported in the SARs. 21. As some businesses may use the same EIN for multiple branches or process all SARs at centralized locations for the entire organization, the total does not represent individual branch locations involved in detecting suspicious activities.
17Mortgage Loan Fraud Update
Financial Crimes Enforcement Network
Conclusion
F inCEN continues to monitor MLF SARs to report trends and identify potential illicit activities. Future reports will further dissect SAR data on a geographic
basis with respect to more current activities. Aside from the mortgage fraud reports, FinCEN will expand its efforts with law enforcement partners to further examine the impact of SARs detailing older activities and their impact on investigations.

18Mortgage Loan Fraud Update
Financial Crimes Enforcement Network
AppendixIn March 2009, FinCEN published a report describing MLF SAR filings based on reported activity dates22 and filing dates.23 This appendix updates that report through December 2009.
From 2003 to 2007, nearly half of all MLF SARs included activity dates in the same calendar year as the filing date. While overall MLF SARs have increased, filers submi�ed fewer reports in CY 2008 and 2009 indicating same year activities, with such filings decreasing to 25 and 15 percent respectively. The following chart and table detail this change.
See 22. Mortgage Loan Fraud Connections with Other Financial Crime: An Evaluation of Suspicious Activity Reports Filed by Money Services Businesses, Securities and Futures Firms, Insurance Companies and Casinos, March 2009, p. 5, at h�p://www.fincen.gov/news_room/rp/files/mortgage_fraud.pdf. Filers indicate the date in which they prepared the SAR in Part IV, field 50. This date differs from the 23. date when FinCEN receives a SAR. As previous tables draw on the la�er date, annual totals in this section differ slightly from earlier sections.
MLF SARs With Activities in the Same Year as the Filing Date

19Mortgage Loan Fraud Update
Financial Crimes Enforcement Network
Table 13: MLF SAR Filings Reporting Activity in the Same Calendar Year
Calendar Year MLF SARs (Calculated by Filing Date)24
MLF SAR-DIs Reporting Same Year Activities
2003 9,342 4,066 (44%)2004 18,139 7,474 (41%)2005 25,825 13,322 (52%)2006 35,360 18,680 (53%)2007 50,180 23,495 (47%)2008 64,417 16,203 (25%)2009 66,760 10,340 (15%)
See previous note.24.

20Mortgage Loan Fraud Update
Financial Crimes Enforcement Network