financial condition reporting aashto audit conference, july 2015 oregon secretary of state audits...
TRANSCRIPT

Financial Condition Reporting
AASHTO Audit Conference, July 2015
OregonSecretary of State Audits Division
Gary BlackmerAudits Director

Overview
Why assess financial condition?
What does a report look like?–For Oregon–For its counties

Why assess financial condition?
• Identify emerging problems• Communicate complex ideas in a clear,
concise way• Extend the financial timeline beyond a
year or biennium• Recommend strategies to improve
financial condition

• Recognize improvements resulting from actions and decisions
• Identify potential audit areas• Show your audit agency’s commitment to
on-going monitoring, to assure the public• Get greater value out of the CAFRs

Introduction to the 2011 report by Secretary of State Kate Brown…
“It is my hope that the analysis provided by the Audits Division will give Oregonians and public officials the tools they need to understand the unfavorable trends the state experienced and identify potential solutions to forge a better future for our state and for our people.”

The most favorable trends are: – Oregon’s unemployment fund helped cover the needs of
many Oregonians during this deep recession, unlike many other states that are borrowing from the federal government to support the unemployed;
– Payments to state PERS retirees appear to be leveling out in recent years; and
– Oregon continues to see a declining rate of violent property crimes.

Unfortunately, less favorable trends are prevalent in this report: – Basic conditions for Oregonians have worsened with
increased unemployment, increasing poverty rates, and greater dependence on Medicaid and other public assistance;
– K-12 education costs have grown substantially in the past 9 years;
– Oregon’s Rainy Day Fund, created 3 years ago, has already been reduced by two-thirds; and
– Oregon has doubled its long-term debt over the last 9 years, limiting its future options.

• big problems can creep up on you• big problems take time to solve• setting goals and policies can prevent,
lessen problems

What does a report look like?
• Revenues• Expenditures• Long-Term Debt• Fiscal Health• Demographics
• Operational indicators are an additional report…
Or some variation on
these sections…

Approach• Apply the skills and insights of our financial
auditors to the task• International City and County Managers
Association published “Evaluating Financial Condition” in 1985 in response to the municipal bankruptcies in the 1980s.
• 36 indicators, which is more than necessary- GASB has more recent guidance
• Instead, identify 10-20 key indicators and put the extra effort into deeper analyses of any emerging trends.

Regular reporting
• State financial condition reports– 2011, 2013, 2015
• County financial condition reports– 2012, 2014
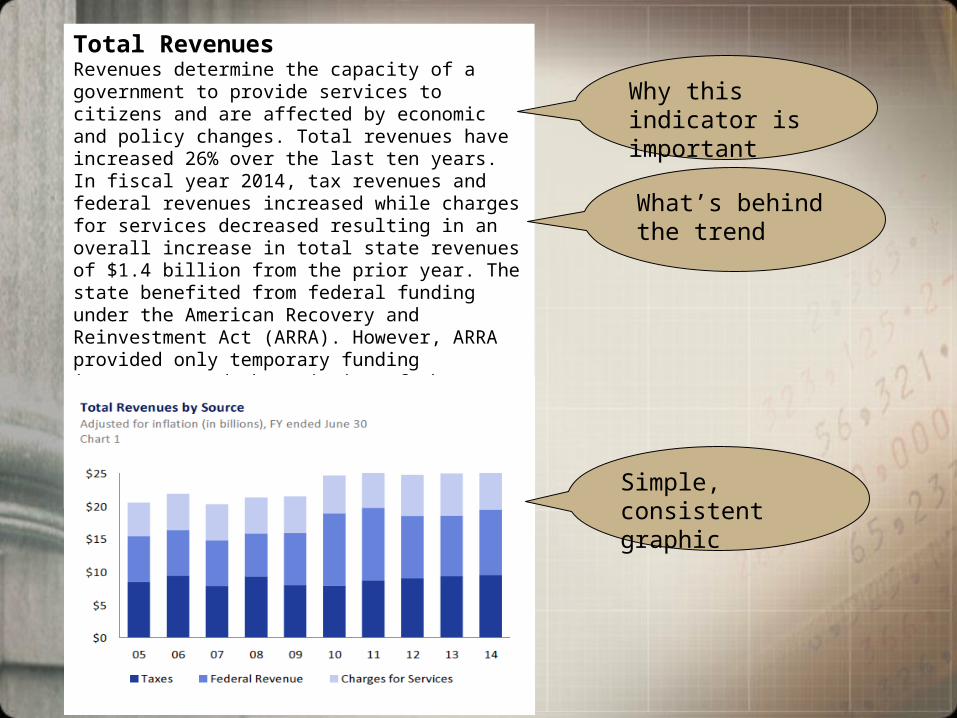
Total RevenuesRevenues determine the capacity of a government to provide services to citizens and are affected by economic and policy changes. Total revenues have increased 26% over the last ten years. In fiscal year 2014, tax revenues and federal revenues increased while charges for services decreased resulting in an overall increase in total state revenues of $1.4 billion from the prior year. The state benefited from federal funding under the American Recovery and Reinvestment Act (ARRA). However, ARRA provided only temporary funding increases, and the majority of those funds were spent in fiscal years 2010 and 2011. In 2014 declines in federal revenues included approximately $327 million in Unemployment Compensation and $73 million to Economic Development.
Why this indicator is important
What’s behind the trend
Simple, consistent graphic

What’s behind the numbers?Federal Revenues by Program AreaThe state received about $9.9 billion in federal assistance in FY14, an increase of $950 million from the previous year. Traditionally, the largest federal revenue source is for Medicaid in the human services program area, for which Oregon receives between $2.0 and $4.8 billion annually. Other large human services programs include Supplemental Nutrition Assistance Program (formerly known as food stamps) and Temporary Assistance to Needy Families.

Human Services
Education
University System
Transportation
Public Safety
Unemployment Compensation
Natural Resources
Lottery Operations
Administration
Other
Economic Development
Liquor Control
Interest on Long Term Debt
Judicial
Consumer and Business Services
State Hospitals
0 1,000 2,000 3,000 4,000 5,000 6,000 7,000 8,000 9,000 10,000
$9,880$4,421
$2,505
$1,556
$1,300
$832
$724
$494
$404
$400
$385
$384
$347
$340
$283
$279
Education
Human Services
Public Safety
Judicial
Administration
Natural Resources
Debt Service Principal
Interest
Legislative
Economic and Community Development
Transportation
Consumer and Business Services
Other Debt Service
0 1,000 2,000 3,000 4,000
$3,764 $1,723
$1,013
$308
$238
$128
$90
$58
$35
$29
$10
$5
$1
Total Expenditures by program
General Fund Expenditures by program

Long-term perspective on financial issues

Patterns emerge


Oregon’s Counties
• We had concerns about the finances of our partners
• After our state assessment, we began looking at counties
• Timber payments changed the game– How many counties, how much?– What actions have other states taken with financially-
troubled municipalities

Adapting to the loss of federal funds
• “Although Federal officials had repeatedly warned that the program would end…many municipal officials expected that the program would be reduced.
• ‘It's forcing a whole rethinking of municipal finances. Many municipalities are stuck. They have no choice but to cut back.’”
New York Times, January 31, 1987
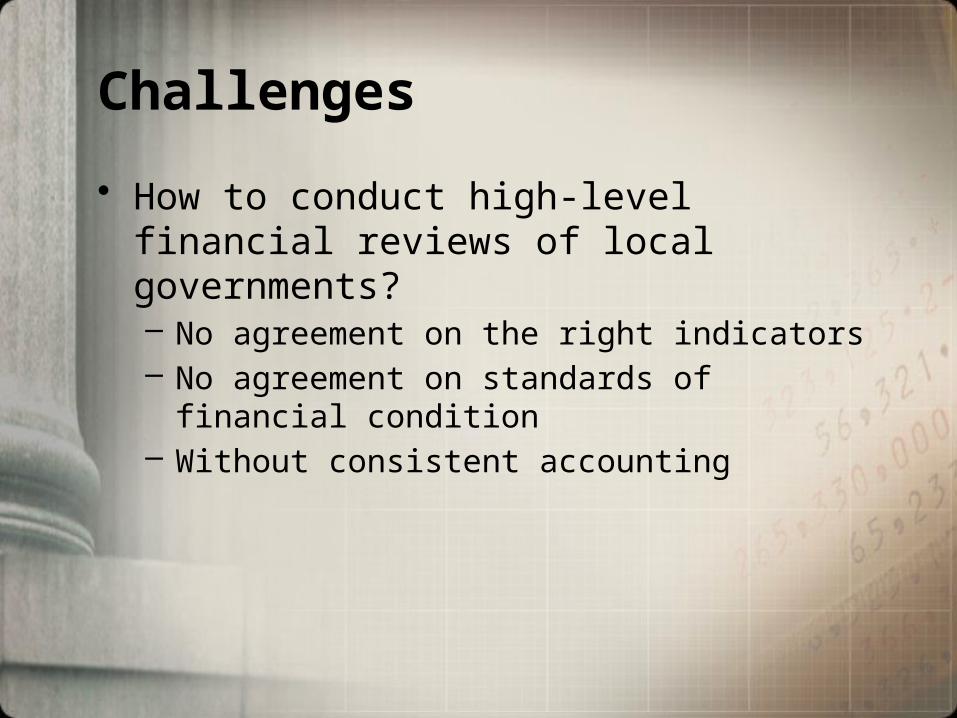
Challenges
• How to conduct high-level financial reviews of local governments?– No agreement on the right indicators– No agreement on standards of financial condition– Without consistent accounting
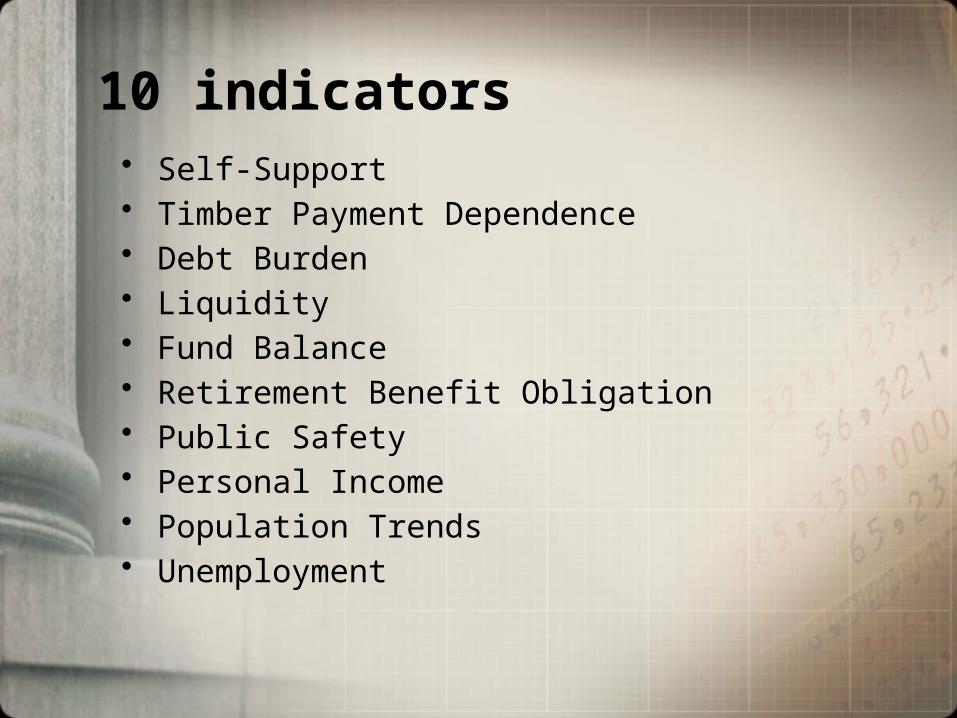
10 indicators• Self-Support • Timber Payment Dependence• Debt Burden• Liquidity• Fund Balance• Retirement Benefit Obligation• Public Safety• Personal Income• Population Trends• Unemployment
ShermanGilliam
WheelerTillamook
MorrowHarney
MultnomahLincoln
GrantClatsop
ClackamasWallowa
DeschutesWashington
LakeCrook
WascoHood River
JeffersonKlamath
BakerUnion
ColumbiaYamhillBenton
LinnCoosCurry
JacksonUmatilla
MarionMalheurDouglas
PolkLane
Josephine
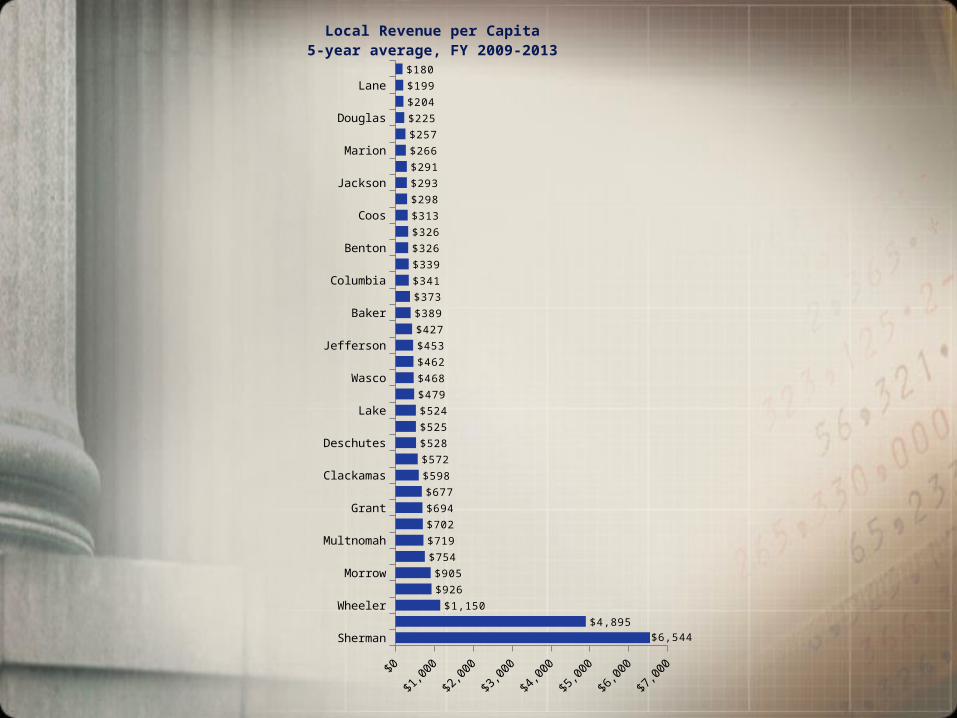
$6,544$4,895
$1,150
$926
$905
$754
$719
$702
$694
$677
$598
$572
$528
$525
$524
$479
$468
$462
$453
$427
$389
$373
$341
$339
$326
$326
$313
$298
$293
$291
$266
$257
$225
$204
$199
$180
Local Revenue per Capita5-year average, FY 2009-2013
Multnomah
Washington
Lincoln
Marion
Yamhill
Clackamas
Tillamook
Linn
Klamath
Benton
Columbia
Polk
Lane
Jackson
Coos
Curry
Douglas
Josephine
0% 5% 10% 15% 20% 25%
0.1%
0.1%
0.5%
0.6%
1.0%
1.0%
1.1%
2.4%
2.9%
4.0%
4.2%
4.5%
4.6%
7.9%
11.0%
13.8%
18.3%
19.7%
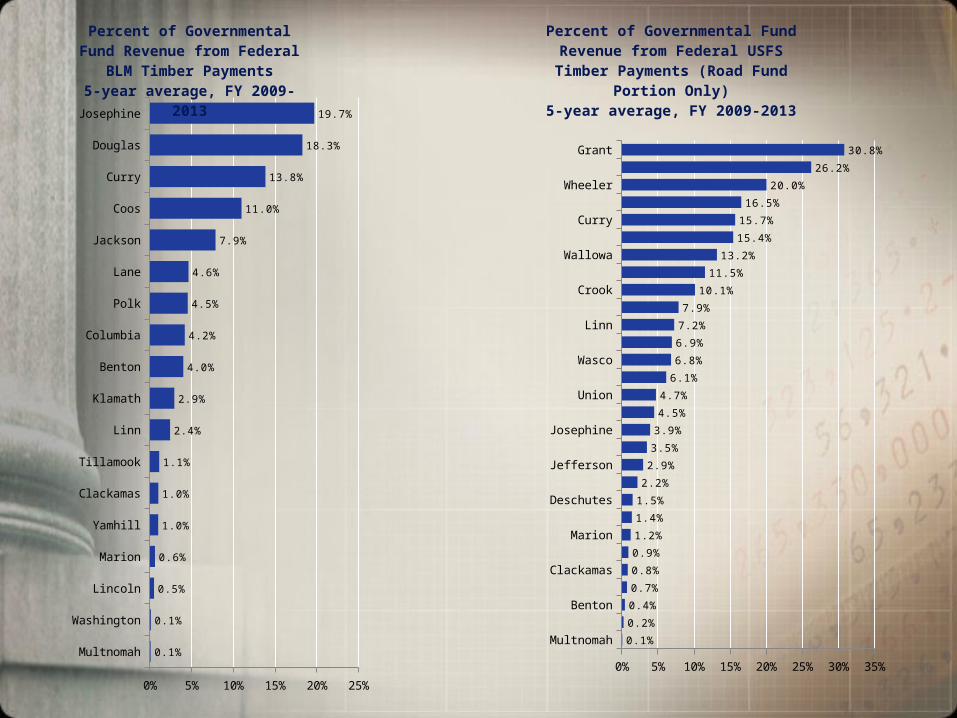
Percent of Governmental Fund Revenue from Federal BLM Timber
Payments5-year average, FY 2009-2013
Multnomah
Umatilla
Benton
Yamhill
Clackamas
Coos
Marion
Morrow
Deschutes
Jackson
Jefferson
Tillamook
Josephine
Lincoln
Union
Baker
Wasco
Lane
Linn
Hood River
Crook
Douglas
Wallowa
Klamath
Curry
Harney
Wheeler
Lake
Grant
0% 5% 10% 15% 20% 25% 30% 35%
0.1%
0.2%
0.4%
0.7%
0.8%
0.9%
1.2%
1.4%
1.5%
2.2%
2.9%
3.5%
3.9%
4.5%
4.7%
6.1%
6.8%
6.9%
7.2%
7.9%
10.1%
11.5%
13.2%
15.4%
15.7%
16.5%
20.0%
26.2%
30.8%
Percent of Governmental Fund Revenue from Federal USFS Timber Payments (Road
Fund Portion Only)5-year average, FY 2009-2013

Washington
Clackamas
Multnomah
Lane
Marion
Jackson
Deschutes
Yamhill
Linn
Josephine
Benton
Douglas
Polk
Umatilla
Columbia
Lincoln
Klamath
Coos
Jefferson
Curry
Crook
Hood River
Wasco
Union
Malheur
Tillamook
Morrow
Clatsop
Lake
Harney
Baker
Wallowa
Sherman
Gilliam
Grant
Wheeler
-50,000 150,000 350,000 550,000 750,000
489,721
299,364
284,993 230,349
221,479
147,800
140,713
67,916
64,348
56,273
56,155
54,301
50,748
36,192
26,883
25,252
24,660
20,595
16,504
16,252
11,699
10,555
10,258
8,363
8,217
6,769
6,642
6,494
1,291
1,147
105
(219)
(491)
(872)
(894)
(1,883)
Population Change, 1950 to 2013
1950 Population
Increase to 2013

CurryJosephine
DouglasCrookCoosBaker
KlamathHarney
GrantLincoln
LinnJackson
JeffersonLake
WheelerLane
BentonDeschutes
UnionTillamookColumbia
MalheurYamhillMorrowMarion
WallowaPolk
ClackamasMultnomah
GilliamClatsop
WashingtonUmatilla
ShermanWasco
Hood River
40% 50% 60% 70% 80% 90%
45%
48%
50%
52%
54%
55%
55%
55%
56%
56%
58%
58%
58%
59%
59%
59%
59%
59%
59%
60%
61%
61%
62%
63%
63%
63%
63%
64%
65%
65%
67%
69%
70%
70%
73%
82%
Labor Force Participation Rate2013 Estimate
Employed+Seeking employmentTotal Population over 16

Identifying counties to watch
• On the weak end of the range for several indicators
• Extra weighting for dependence on federal funds
ColumbiaCoosCurryDouglasJacksonJosephine
LaneLinnPolk

Douglas County
• Overview• County response• Indicators – 10 year trends

Douglas overview• Approximately 50% of Douglas County’s 5,071 square miles
is public land, with forest products and agriculture being key to its economy. The selected financial management indicators show that the county has sound debt management practices and one of the largest fund balances among counties. The indicators also show that Douglas County has strong liquidity and has experienced steady population growth over the past several decades.
• The county levies the fourth lowest property tax rate in Oregon, which limits its ability to generate local revenues. It is the most dependent among counties on federal timber payments, has high unemployment, and a high pension obligation per capita.

County Response• Douglas County has responded to the loss of a safety net
by reducing budgets, service levels and personnel services until a permanent revenue solution is found. The County continues to budget the use of reserves at levels that are not sustainable. Based on current spending patterns, in approximately two years, the County’s General Fund will need to reduce service levels and expenditures to balance the budget with current revenues. Minimum reserve levels needed for operating cash requirements will be reached near that time.

Local revenue per capitaadjusted for inflation
2004
2005
2006
2007
2008
2009
2010
2011
2012
2013
$0
$50
$100
$150
$200
$250
$300
$350
$400
$231
$256$273
$320
$280
$255
$230 $230$216
$236

Fund balanceadjusted for inflation
2004
2005
2006
2007
2008
2009
2010
2011
2012
2013
$0
$10,000,000
$20,000,000
$30,000,000
$40,000,000
$50,000,000
$60,000,000
$70,000,000
$80,000,000
$90,000,000
$100,000,000
Total General Fund Expenditures Unrestricted General Fund Balance

2004 2005 2006 2007 2008 2009 2010 2011 2012 20130
20,000
40,000
60,000
80,000
100,000
120,000
10-Year Population Trend
2004
2005
2006
2007
2008
2009
2010
2011
2012
2013
0%
5%
10%
15%
20%
9.2%
8.2%7.5% 7.7%
9.9%
15.3%14.6%
13.2%
12.2%
10.9%
County Unemployment RatesSeasonally adjusted average

Strategies of other states
• Monitoring– State offices review financial statements– Some track indicators
• Proactive– Engage, advise, assist troubled municipalities
• Intervention– Prevent, react to financial crises– Highly controversial

Portland

Metro

Multnomah County

Why auditors?
• Management may resist this transparency• Auditors have the credibility• Good insights into finances, operations• Organizations never sustain these efforts
