financial capability data – structure - tower hamlets · financial capability data . summary . in...
TRANSCRIPT
Financial capability data Summary In 2007, the Treasury commissioned the Thoresen Review to examine the feasibility of developing a national approach to delivery of generic financial advice (GFA) services. The aim was to improve access to advice for those most in need and to raise levels of financial capability across the population. The Treasury defines ‘financial capability’ as follows:
“…a broad concept, encompassing people’s knowledge and skills to understand their own financial circumstances, along with the motivation to take action. Financially capable consumers plan ahead, find and use information, know when to seek advice and can understand and act on this advice, leading to greater participation in the financial services market.” (Financial Capability: the Government’s long term approach, HM Treasury, 2007)
To inform the review, Experian was commissioned to develop a statistical model to map likely demand for generic financial advice (GFA) across the population, by predicting the level of financial capability and vulnerability among the population at postcode level. The model adopts a 12-point sliding scale (0 to 11) which maps relative levels of need: 0 points represents those who are the least likely to need GFA services, while 11 points represents those who would benefit most from GFA. Those at the top end of the scale are the most likely to be under-confident in financial matters and the least likely to have financial safety nets such as savings or insurance.
This briefing presents analysis of the latest data for Tower Hamlets (2010). The analysis was undertaken to inform the Council’s developing Financial Inclusion Strategy, and is part of a wider evidence base being prepared to underpin the strategy. Key findings include:
• The majority of areas in Tower Hamlets are classified as areas where the population haslow levels of financial capability and highs level of financial vulnerability: 71 per cent ofpostcode areas in the borough are in GFA segments 9 to11 – almost triple thepercentage across London (26 per cent). People who fall into these groups are the mostlikely be at risk of adverse consequences from poor financial decision making and themost likely to benefit from financial advice.
• Across London, the percentage of postcodes falling into the most vulnerable GFA groups(9 to 11) ranges from 3 per cent in Richmond up to 76 per cent in Newham. TowerHamlets ranks second highest at 71 per cent, closely followed by Hackney (66 per cent).
• Tower Hamlets has an exceptionally high percentage of postcode areas in GFA segment11 - the most vulnerable of all 12 GFA groups. One third (32 per cent) of areas in TowerHamlets fall into this group – five times higher than the London average (6 per cent) andthe highest rate in London. People living in these areas are typically on low and unstable
Research Briefing 2011-07

Financial Capability data 2010 Page 2
incomes and likely to have significant exposure to crisis-driven circumstances that cause financial stress (eg unemployment).
• None of the postcode areas in Tower Hamlets fall into the least vulnerable GFA groups0-1, and only 8 per cent fall into GFA groups 2-5. People living in these groups typicallyhave higher levels of financial capability and are the least likely to need financial advice.
• Within the borough, there is significant variation in levels of financial capability at wardlevel: the percentage of postcode areas falling into the most vulnerable GFA groups (9-11) ranges from 95 per cent in the ward of Bromley-by-Bow down to 29 per cent in StKatherine’s & Wapping ward.
• There is considerable similarity between geographical patterns of financial vulnerabilityas measured by the financial capability data, and patterns of poverty and deprivationacross the borough.
Further information: This Briefing was produced by the Corporate Research Unit. Research briefings are designed to improve the use and sharing of data across the Partnership.
For more information about this Briefing please contact: Lorna Spence (Research Officer) on 020 7364 4014.

Financial Capability data 2010 Page 3
Introduction In 2007, the Treasury commissioned the Thoresen Review1 to examine the feasibility of delivering a national approach to delivering generic financial advice. The aim was to ensure greater access to affordable financial advice for those most in need. To inform the review, Experian was commissioned to develop a statistical model to help map likely demand for such advice across the population. In effect - the model profiles the degree of financial capability and vulnerability among residents - at postcode level.
The Treasury defines ‘financial capability’ as follows:
“…a broad concept, encompassing people’s knowledge and skills to understand their own financial circumstances, along with the motivation to take action. Financially capable consumers plan ahead, find and use information, know when to seek advice and can understand and act on this advice, leading to greater participation in the financial services market.” (Financial Capability: the Government’s long term approach, HM Treasury, 2007)
In essence, financial capability is about having the confidence and skills to effectively manage ones finances - the Treasury’s definition emphasises the importance of skills around: managing money, planning ahead, making choices, and getting help.
The most recent data available are financial capability data for 2010. The data for London were made available by the Greater London Authority via its Datastore website2 to support work on Child Poverty Needs Assessments. This briefing presents an analysis of that data for Tower Hamlets. The analysis was undertaken to inform the Council’s developing Financial Inclusion Strategy, and is part of a wider evidence base being prepared to underpin the strategy.
Methodology: The Experian model of financial capability (the 12 point scale) The Experian model predicts the likely need for Generic Financial Advice (GFA) by assessing the level of financial vulnerability and capability among the population. The model adopts a 12 point scale (from 0 to 11) to profile relative levels of financial capability. At the top end of the scale, 11 points represents those who would benefit most from Generic Financial Advice (GFA) ie the most vulnerable to the consequences of poor financial decision making; and 0 points represents those who are the least vulnerable to the consequences of poor financial decision making.
Figure 1 The GFA scale Financial capability (GFA) scale GFA need
low 0 1 2 3 4 5 6 7 8 9 10 11 GFA need high
Least vulnerable
Mostvulnerable
1 The review was led by Otto Thoresen, Chief Executive of AEGON. 2 http://data.london.gov.uk/datastore/package/financial-capability-and-child-poverty

Financial Capability data 2010 Page 4
Figure 2 The GFA scale and how it relates to money guidance needs.
GFA scale
Users of GFA
Level of financial vulnerability Expected needs of GFA
0
1
Occasional users
Some lack of access to commercial advice and poor at keeping track of money but otherwise no significant signs of vulnerability. Consequences of poor decision-making unlikely to be significant (due to high savings). Not at risk due to low capability.
Low need for GFA. However, this group includes many approaching (or in) retirement who may require some support
2
3 4
5
Infrequent users
Some vulnerability in relation to not being experienced at choosing products or keeping track of their money. Some over-indebtedness and lack of savings but majority good at planning ahead and staying informed. At upper end of scores, some are struggling to make ends meet.
Many capable of finding advice without the GFA. However, some help in under-standing products and money management techniques.
6
7
8
Regular users
Some financial vulnerability (eg not experienced at choosing products, some lack of savings, over-indebtedness). One third has low scores on making ends meet. However, generally good at keeping track of money and many have savings. One in ten may have literacy problems and more than 20 per cent live in deprived areas.
Some crisis intervention needed but majority could gain help with advice on interpreting products, managing debt, increasing savings and budgeting.
9
10
11
Most vulnerable
Multiple drivers of vulnerability: lack of access to commercial advisers, poor planning ahead, very limited savings or protection, limited financial portfolio and therefore limited knowledge of products, difficulty making ends meet and over indebtedness (almost half). Many who are working have no pension. One in five may have literacy problems and half live in deprived areas.
Around half of this group might be expected to require crisis intervention or support from specialist agencies. Others expected to need help with pre-crisis managing debt and budgeting.
Source: Thoresen Review of generic financial advice: final report (2008).
Financial Capability data 2010 Page 5
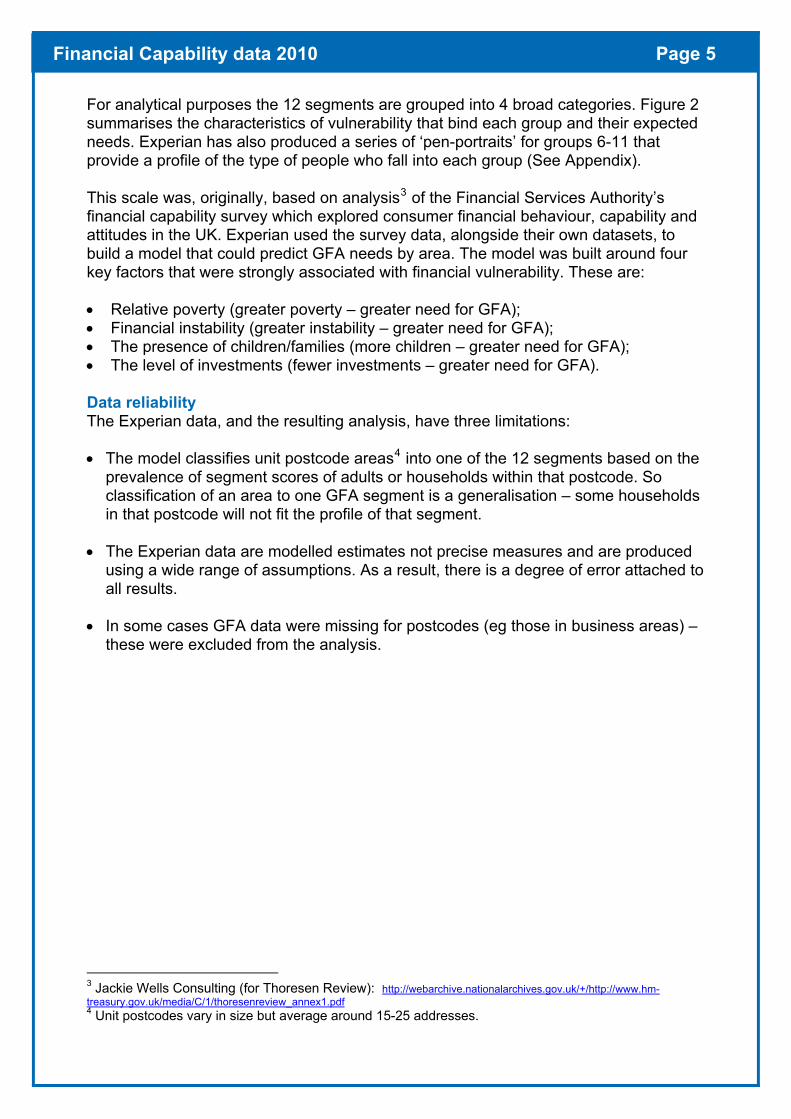
For analytical purposes the 12 segments are grouped into 4 broad categories. Figure 2 summarises the characteristics of vulnerability that bind each group and their expected needs. Experian has also produced a series of ‘pen-portraits’ for groups 6-11 that provide a profile of the type of people who fall into each group (See Appendix). This scale was, originally, based on analysis3 of the Financial Services Authority’s financial capability survey which explored consumer financial behaviour, capability and attitudes in the UK. Experian used the survey data, alongside their own datasets, to build a model that could predict GFA needs by area. The model was built around four key factors that were strongly associated with financial vulnerability. These are: • Relative poverty (greater poverty – greater need for GFA); • Financial instability (greater instability – greater need for GFA); • The presence of children/families (more children – greater need for GFA); • The level of investments (fewer investments – greater need for GFA). Data reliability The Experian data, and the resulting analysis, have three limitations: • The model classifies unit postcode areas4 into one of the 12 segments based on the
prevalence of segment scores of adults or households within that postcode. So classification of an area to one GFA segment is a generalisation – some households in that postcode will not fit the profile of that segment.
• The Experian data are modelled estimates not precise measures and are produced using a wide range of assumptions. As a result, there is a degree of error attached to all results.
• In some cases GFA data were missing for postcodes (eg those in business areas) – these were excluded from the analysis.
3 Jackie Wells Consulting (for Thoresen Review): http://webarchive.nationalarchives.gov.uk/+/http://www.hm-treasury.gov.uk/media/C/1/thoresenreview_annex1.pdf4 Unit postcodes vary in size but average around 15-25 addresses.

Financial Capability data 2010 Page 6
Financial capability in Tower Hamlets The financial capability data for 2010 classify the majority of areas in Tower Hamlets as having a high level of financial vulnerability (Figure 3). Of all postcode areas in Tower Hamlets, 71 per cent are classified into the top quarter of GFA groups: segments 9-11. People who live in these areas typically share multiple drivers of financial vulnerability and are most at risk of adverse consequences from poor financial decision making. The model predicts that people in these groups would benefit most from financial advice.
None of the postcode areas in Tower Hamlets fall into the least vulnerable GFA groups 0-1, and only 8 per cent fall into GFA groups 2-5. People living in these areas are the least likely to need financial advice.
Figure 3 Tower Hamlets postcode areas by financial capability, 2010
The borough has a much higher proportion of financially vulnerable areas than the London average. The percentage of postcode areas falling into GFA groups 9-11 in Tower Hamlets is almost three times higher than in London (71 vs. 26 per cent). The percentage is also high when compared with Inner London (43 per cent). In contrast, the percentage of the borough’s postcode areas in GFA segments 0-5 (the less vulnerable segments) is 8 per cent compared with 45 per cent in London.
Table 1 The percentage of unit postcode areas by Financial Capability segments, Tower Hamlets and London, 2010
Percentage totals (%)
Segments Tower
HamletsInner
LondonOuter
London Greater London
TOTAL = 100% 100 100 100 100GFA groups 0-1 0 1 12 7GFA groups 2-5 8 26 45 37GFA groups 6-8 21 31 28 29GFA groups 9-11: 71 43 15 26 Group 9: 12 15 8 10 Group 10 26 18 5 10 Group 11 32 10 3 6Source: Financial Capability data, Experian, 2010
6 8 712
2632
41<0 30
5
10
15
20
25
30
35
0 1 2 3 4 5 6 7 8 9 10 11
Percentage (%) of unit postcode areas falling into each segment
Financial capability (GFA) segmentsLeast vulnerable Most vulnerable
Source: Financial Capability data, Experian, 2010
%

Financial Capability data 2010 Page 7
Financial capability across London Boroughs Within London, there is considerable variation in levels of financial vulnerability at borough level. The percentage of postcodes falling into the most vulnerable GFA groups 9-11 ranges from 3 per cent in Richmond upon Thames up to 76 per cent in Newham. Of all Boroughs, Tower Hamlets has the second highest percentage of areas falling into groups 9-11 (71 per cent), closely followed by Hackney (66 per cent). Levels of financial vulnerability are typically lower in Outer London boroughs.
Figure 4 Financial capability segments (9-11) by London Borough, 2010
% of postcode areas falling into GFA segments 9-11
356888999101112
151717181920
22293032
3738393940
4751
6166
7176
0 20 40 60 80 100
RichmondKingston
HarrowBromley
HaveringBexleySutton
HillingdonRedbridge
BarnetMerton
CityCroydon
WandsworthEnfield
HounslowKensington & Chelsea
EalingWestminster
Hammersmith & FulhamBrent
Waltham ForestBarking and Dagenham
CamdenLewisham
GreenwichHaringeyLambethIslington
SouthwarkHackney
Tower HamletsNewham
Source: Financial Capability data, Experian, 2010
London average = 26%
People living in GFA 9-11 areas are typically those who:
● are on low incomes;● have very limited savings orprotection;● live in deprived areas;● face multiple drivers offinancial vulnerability;● have difficulty making endsmeet;● are over-indebted;● limited knowledge of financialproducts and lack of access to commercial advice.

Financial Capability data 2010 Page 8
The most vulnerable segment – GFA group 11 ower Hamlets has an exceptionally high percentage of postcode areas falling into FA segment 11 - the most vulnerable of all 12 groups.
ne third (32 per cent) of areas in Tower Hamlets fall into this group – five times higher an the London average (6 per cent). At 32 per cent, Tower Hamlets has the highest te of all London Boroughs by some way: Southwark and Hackney are next highest –
oth at 19 per cent (Figure 5).
xperian has produced a ‘pen-portrait’ of the likely characteristics of people falling into FA group 11. This suggests that people living in these areas are:
The least likely to be confident in financial matters; More likely to face significant exposure to stressful crisis-driven circumstances;
brought on by life-stage changes and employment instability; Typically living on low incomes and to face sporadic and uncertain sources of
income; Likely to have poor provision for retirement and low take up of financial products
such as contents insurance or savings; Likely to focus on the day-to day with little opportunity to plan ahead.
ote: See Appendix 1 for more detail about the pen-portraits of different GFA groups.
igure 5 Percentage of areas falling into GFA group 11 by London Borough, 2010
TG Othrab EG ••
•
•
• N F
% of postcode areas falling into (most vulnerable) GFA segment 11
0 0 0 1 1 1 1 1 1 1 3 3 3 4 4 4 56
2 32 20y y y t y
7 89 10 10
12
16
19 19
32
20
40
ond ton row idg
erto
n
Richm
Kings
Har
Redbr Me
Hillon et le Cit ton rin
gdo
n ter orth
xle ield
sea ow lin
gren ha
m rest
ge den am gto
n eth ham ich am kn
ey ark lets
Source: Financial Capability data, Experian, 2010
ingd
BarnBrom Sut
Have
Croy
Westm
ins
Wands
w Be Enf
Kensin
gton &
Che
l
Houns
lEa B
Hammers
mith & Ful
Waltha
m FoHari
nCam
Lewish
Islin
Lamb
Barking
and D
agenGree
nwNew
hHac
Southw
Tower
Ham
London average = 6%
Financial Capability data 2010 Page 9
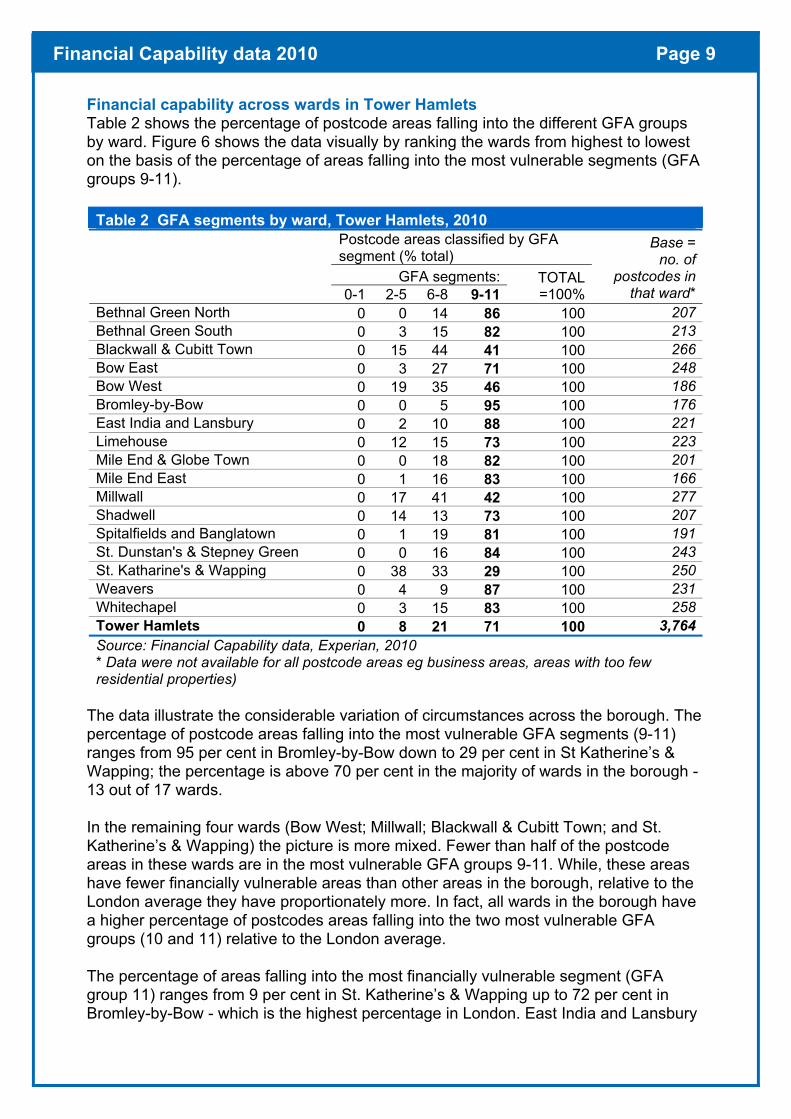
Financial capability across wards in Tower Hamlets Table 2 shows the percentage of postcode areas falling into the diffeb
rent GFA groups y ward. Figure 6 shows the data visually by ranking the wards from highest to lowest
ost vulnerable segments (GFA on the basis of the percentage of areas falling into the mgroups 9-11).
Table 2 GFA segments by ward, Tower Hamlets, 2010
segment (% total) Postcode areas classified by GFA
GFA segments: 0-1 2-5 6-8 9-11
TOTAL=100%
Baseno.
= of
postcodes in that ward*
Bethnal Green North 0 0 14 86 100 207Bethnal Green South 0 3 15 82 100 213Blackwall & Cubitt Town 0 15 44 41 100 266Bow East 0 3 27 71 100 248Bow West 0 19 35 46 100 186Bromley-by-Bow 0 0 5 95 100 176East India and Lansbury 0 2 10 88 100 221Limehouse 0 12 15 73 100 223Mile End & Globe Town 0 0 18 82 100 201Mile End East 0 1 16 83 100 166Millwall 0 17 41 42 100 277Shadwell 0 14 13 73 100 207Spitalfields and Banglatown 0 1 19 81 100 191St. Dunstan's & Stepney Green 0 0 16 84 100 243St. Katharine's & Wapping 0 38 33 29 100 250Weavers 0 4 9 87 100 231Whitechapel 0 3 15 83 100 258Tower Hamlets 0 8 21 71 100 3,764Source: Financial Capability data, Experian, 2010 * Data were not available for all postcode areas eg business areas, areas with too fewresidential properties)
The data illustrate the considerable variation of circumstances across the borough. The percentage of postcode areas falling into the most vulnerable GFA segments (9-11) ranges from 95 per cent in Bromley-by-Bow down to 29 per cent in St Katherine’s & Wapping; the percentage is above 70 per cent in the majority of wards in the borough - 13 out of 17 wards.
the remaining four wards (Bow West; Millwall; Blackwall & Cubitt Town; and St. atherine’s & Wapping) the picture is more mixed. Fewer than half of the postcode
ups 9-11. While, these areas
11) relative to the London average.
T lnerable segment (GFA group 11) ranges from 9 per cent in St. Katherine’s & Wapping up to 72 per cent in Bromley-by-Bow - which is the highest percentage in London. East India and La
InKareas in these wards are in the most vulnerable GFA grohave fewer financially vulnerable areas than other areas in the borough, relative to the London average they have proportionately more. In fact, all wards in the borough have a higher percentage of postcodes areas falling into the two most vulnerable GFA groups (10 and
he percentage of areas falling into the most financially vu
nsbury

Financial Capability data 2010 Page 10
is also high on this indicator, with ju tcode areas in the ward falling into group 11. Again, all wards in Tower Hamlets have a relatively high percentagthis indicator compared with the London ave t
Figure 6 Percentage of postcode ar F egm t by w Tower H
vel. nancial vulnerability and patterns
f deprivation across the borough. The borough’s riverside areas have relatively higher
del
st over half of pose on
rage (6 per cen ).
eas by G A s en s ard, amlets, 2010
Map 1 illustrates patterns in more detail by mapping GFA segments at postcode leThere is considerable similarity between patterns of fiolevels of financial capability and lower levels of deprivation. This is perhaps to be expected, given that relative poverty is one of the indicators Experian use in their moto predict GFA segments. Recently, the Greater London Authority carried out London-wide analysis5 of the 2010 financial capability data and this also identified similaritiesbetween patterns of financial vulnerability and poverty across the capital.
5 GLA Intelligence Update 10-2011: Financial Capability – A London Summary, June 2011
10 10 6
0 20 40 60 80
Greater London
12
17
15
10
13
26
14
9
26
39
38
21
3
32
31
3
25
20
32
15
48
3
3
5
44
40
25
54
72
100
Tower Hamlets
townbe Town
St. Du epney Greenreen North
eavers
11 28 34
Bow EastLimehouse
5 19Shadwell
8
8
reen SouthMile End East
21
3ley-by-Bow
35
0
36
3
1
3
3
29
39
Spitalfields & BanglaMile End & Glo
Bethnal G
Whitechapelnstan's & St
Bethnal GW
East India & LansburyBrom
GFA segment 9 GFA segment 10 G
8
9
9
20
12
20
16
18
9
13
17
8
St. Katharine's & WappingBlackwall & Cubitt Town
MillwallBow West
FA segment 11
eas by ar llin nto GFA segme 9-11):
Source: Financial Capability data,
2010
% of unit postcode ar w d fa g i nts (
Experian,

Financial Capability data 2010 Page 11
ap 1 Financial capability by postcode, Tower Hamlets, 2010 M
Financial Capability data 2010 Page 12
Further information and analysis This report has presented analysis of the financial capability data for Tower Hamlets. The following links provide access to the data and background documentation about the Experian model and its development.
Data: 2010 and 2008 financial capability datasets and London maps via GLAdatastore:http://data.london.gov.uk/datastore/package/financial-capability-and-child-poverty
GLA report on London-wide analysis of financial capability datahttp://www.london.gov.uk/sites/default/files/Update%2010-2011%20Financial%20Capability%20-%20London%20Summary.pdf
Thoresen Review (of Generic Financial Advice):http://webarchive.nationalarchives.gov.uk/+/http://www.hm-treasury.gov.uk/independent_reviews/thoresen_review/thoresenreview_index.cfm
Experian mapping and pen portraits of GFA segments (Annex 7):http://webarchive.nationalarchives.gov.uk/+/http://www.hm-treasury.gov.uk/media/4/B/thoresen_annex7.pdf
For access to research reports around the issue of financial capability and inclusion, the Money Advice Service and the Transact web-site (supported by Toynbee Hall) provide access to a wealth of research and analysis:
Money Advice Service – research about financial capabilityhttp://www.moneyadviceservice.org.uk/about/corporateinformation/research.aspx
Transact (the National Forum for Financial Inclusion): libraryhttp://www.transact.org.uk/library.aspx?sitesectionid=50&sitesectiontitle=Library

Appendix – Pen portraits Page 13
Appendix 1 - Pen portraits: Financial profile of adults in GFA segments 9-11
GFA Group
Financial profile of adults in this segments (based on Experian ‘pen-portraits’):
9 • With below average incomes used to cover day-to-day living requirements, this
likely to be planning for the future, personal pensions have low take-up
• Financial stress can occur, perhaps due to an unexpected expense or impulseoup exhibit low
and a lack
ularly in on how to access affordable credit.
group can have difficulty accessing lower interest credit options.• Less
rates. A minority hold investments.
purchase. However at same time, a significant number in this gr live for today levels of financial stress, possibly due to a tendency to
of forward planning and insight.• The group would benefit from financial advice and guidance, partic
relation to: savings, budgets and information10 average, a large
and are likely to reliance on cash and
lse purchases are generally
• With combined household incomes below the national proportion of these people live from day to day. There is little in the way ofsavings and investments and most households are not familiar with financialproducts that stretch beyond their immediate needs.
indebted• A significant minority are financially stressed and over-be users of debt counselling services. There is a large credit - small unexpected expenses and impufinanced by high-interest credit options. Personal pensions, equity-basedsavings and medical insurance are not common among this group.
• This group would benefit from help with budgeting, getting access to valuecredit facilities and savings.
11 • ial decision s and display a low
• People in this group will have significant exposure to stressful, crisis-drivenanges (births and
• Along with low annual household incomes and scant provision for retirement,financial products such as contents insurance, easy-access savings, basicinvestments and credit cards all have low take-up rates.
• This group would benefit from basic forms of financial advice.
Being the most vulnerable to the consequences of poor financmaking, these are the least confident in financial matterinclination or lack of ability to make reasoned financial decisions.
circumstances brought upon, for example, by life-stage chbereavements), employment instability and access to affordable credit.
Note: The full set of pen portraits for segments 6-11 can be downloaded at the following link: http://webarchive.nationalarchives.gov.uk/+/http://www.hm-treasury.gov.uk/media/4/B/thoresen_annex7.pdf
Further information:
This Briefing was produced by the Corporate Research Unit. Research briefings are designed to improve the use and sharing of data across the Partnership.
For more information about this Briefing please contact: [email protected]
Copyright: Data produced in this briefing have been reproduced with the permission of the controller of Her Majesty’s Stationery Office and are ©Crown Copyright.