financial capability among young adults - nefe · financial capability among young adults* ... are...
TRANSCRIPT

Financial Capability among Young Adults*
November 2014
Carlo de Bassa Scheresberg
Senior Research Associate, Global Financial Literacy Excellence Center
George Washington School of Business
Annamaria Lusardi
Academic Director, Global Financial Literacy Excellence Center
Denit Trust Distinguished Scholar in Economics and Accountancy, The George Washington
University
*We thank the National Endowment for Financial Education (NEFE) for generous financial
support. We would also like to thank participants to the 2014 NEFE Young Adults and Financial
Capability Forum in Washington D.C. for many helpful comments and suggestions.
2
Introduction
Every generation influences the economy but Millennials, also known as Generation Y, is
positioned to exert special impact. This largest generation in U.S. history comprises young,
educated, ethnically diverse, and economically active individuals. Despite the fact that they have
entered the workforce at a time of economic instability, they are energetic and highly optimistic,
and are approaching critical junctures of financial decision-making.
Millennials’ personal finances will more greatly affect the U.S. economy than the
financial behavior of the generations that preceded them, yet it is becoming increasingly apparent
that the financial position of Millennials is more fragile than expected.
This paper discusses key factors associated with Millennials’ personal finances and
identifies critical issues affecting their financial future. Respondents included in this sample are
at key points in their long-term financial decision-making, on the verge of choices that carry
serious implications for the future.
1. An Overview of Millennials
Distinct from its predecessors—the Baby Boomers and Generation X—Millennials is the
largest, most diverse generation in American history, encompassing 70 million to 80 million
individuals born between the late 1970s and the mid-1990s. Its racial composition also makes it
distinctive: Minorities are more broadly represented among Millennials’ most educated, high-
achieving members, and 11 percent of all Millennials have at least one immigrant parent
(National Chamber Foundation, 2012). In addition to being more ethnically diverse than previous
generations, Millennials are “on course to become the most educated generation in American
history” (Fry and Parker, 2012). Within the group of 25- to 29-year-olds alone, one-third has

3
earned at least a bachelor’s degree. Furthermore, in the United States and abroad, Millennials
will soon make up the largest share of the labor market. It is projected that by 2025, three out of
every four workers globally will be Millennials (Schawbel, 2012).
Millennials are often referred to as the “instant-gratification generation,” with high
expectations for their professional and personal lives (Bishop, 2006). The literature attributes this
generation’s buoyant optimism, supreme confidence, and high achievement to changed social
values. Millennials grew up “in an era that placed a high value on children,” and their parents
gave priority to their offsprings’ personal development and self-esteem (Eubanks, 2006).
The confidence instilled in this generation has, indeed, informed its attitudes about
professional achievement. A recent study by the research firm AgencySacks found that three-
quarters of Millennial respondents felt confident about achieving their goals, and 80 percent
reported high expectations for themselves (Bresiger, 2011). With such lofty—and perhaps
unrealistic—aspirations, Millennials are also prone to higher-than-average levels of
disappointment. A 2010 study by the Pew Research Center found that individuals in the
Generation Y age range are the most dissatisfied with their current earnings with regard to their
ability to lead desirable lifestyles (Taylor and Keeter, 2010).
Millennials are also the first truly “digital generation,” raised amid laptop computers, cell
phones, and the other rapidly advancing technology that is changing the way individuals interact
and conduct business. Among other things, technology is altering where and how Millennials get
their information, with the Internet displacing newspapers and television as the source for news
(National Chamber Foundation, 2012). Global interconnectedness has also left Millennials
increasingly reliant on peers for information and motivation.
4
2. Evidence from the 2012 National Financial Capability Study
2.1 The Data
The first National Financial Capability Study (NFCS), supported by FINRA Investor
Education Foundation, was conducted in 2009 to assess and establish a baseline measure of the
financial capability of American adults.1 The 2012 study updated key measures from the 2009
wave and covered highly relevant new topics such as student loans and medical debt. Working
with a sample size of more than 25,000 observations, the overarching research objectives of the
NFCS are to benchmark key indicators of Americans’ financial capability and evaluate how
these indicators vary given underlying demographic, behavioral, attitudinal, and financial
literacy characteristics.
Consistent with surveys on financial capability in other countries (Atkinson, McKay,
Kempson, and Collard, 2007), the NFCS looks at multiple indicators of both financial knowledge
and capability. These indicators include how people manage their resources, how they make
financial decisions, the skill sets they use in decision-making, and the search and information
elaboration that goes into their choices. In other words, financial capability is assessed by
looking at both short-term financial management and medium- and long-term financial planning.
Sources of debt—including student loans, medical debt, and mortgage debt—are richly
illustrated in the data, and new questions added in 2012 provide even greater detail. Moreover, as
in 2009, the NFCS provides subjective and objective measures of financial literacy that are key
to understanding the extent to which individuals are equipped with the knowledge they need to
make financial decisions. One of the new questions addresses exposure to financial education.
1For a detailed analysis of the 2009 NFCS data, see Lusardi (2011). Lusardi was also part of the team of
experts who designed the first (2009) and the second (2012) wave of the NFCS survey.
5
Our analysis uses data from the 2012 wave and focuses on individuals age 23 to 35. Even
though the definition of Millennials can be broader, individuals who are 22 and younger may still
be in school, making them less financially engaged than those who have already started careers.2
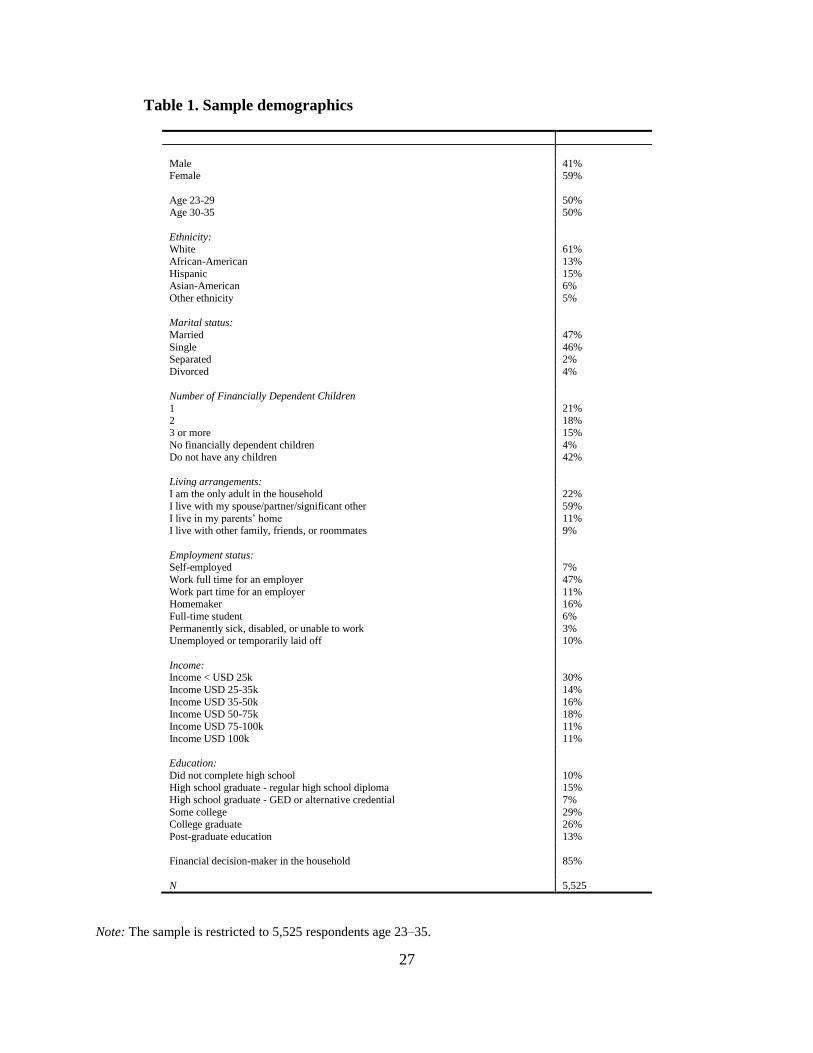
Our final sample is composed of 5,525 observations.3
Nearly 60 percent of respondents in our sample are women, and the average age is 29
(see Table 1). Married respondents make up 47 percent of the sample; many of them have at least
one child. About half (47 percent) are employed full time. Millennials in our sample are
relatively well educated: Nearly 40 percent have at least a college degree, and 29 percent have
some college education. Because of our age restriction, full-time students account for only 6
percent of the sample. Minorities make up two-fifths of the sample, a demographic that, as
mentioned earlier, sets this generation apart from previous ones.
Respondents were asked to report their yearly household incomes using eight ascending
categories. Since income tends to increase with age and experience, it is not surprising to find
that our sample’s average household income is lower than the national average. About 50 percent
of Americans have an annual income above $50,000, while for Millennial respondents it is 40
percent. Respondents with a college degree, however, tend to fare better. Sixty percent of
respondents in this subgroup report annual income above $50,000.
2.2 Assets of Millennials
The NFCS data allow researchers to track asset ownership and respondents’ involvement
in asset management. Among these indicators are whether respondents have bank accounts, real
2 In addition, we excluded 16 observations in which respondents were recorded as retired. 3Because we focus on a specific subgroup of the population, the statistics we report do not use the NFCS
weights, which are calculated to make the NFCS data representative of the U.S. population.
6
estate, financial investments, and retirement accounts. Most Millennials own a variety of assets
(Table 2). Indeed, although the percentage of unbanked Gen-Yers exceeds that of the general
population,4 the vast majority—some 88 percent—of Millennials have either a checking account
or a savings account at a bank or credit union. Moreover, 51 percent of respondents report having
a retirement account, whether employer based or independent,5 and one-fourth of respondents
have investments in stocks, bonds, or mutual funds. That latter statistic compares with a national
average of 37 percent. Additionally, 40 percent of respondents own their homes, and nearly 10
percent own additional real estate, such as second homes, investment properties, or farms.
Disaggregating the data on assets by demographic characteristics, we show that a few
subgroups are disproportionately more likely to have assets. Importantly, the analysis shows that
those who have a full-time job are much better positioned than other respondents: they are 36
percentage points more likely to have a retirement account (70 percent vs. 34 percent), 19
percentage points more likely to have financial investments (36 percent vs. 17 percent), and 18
percentage points more likely to own their home (50 percent vs. 32 percent). Further, those who
are married tend to have higher rates of asset ownership than single respondents, in particular
they are more likely to have a house (54 percent vs. 28 percent). Finally, it is important to note
that while women’s rates of asset ownership tend to be similar to those of men, their rate of
ownership of financial investments is much lower. Only 22 percent of female respondents report
to have financial investments in stocks, bonds or mutual funds, compared to 33 percent of men.
If we consider human capital in addition to financial capital, it is important to note that
Millennials have high levels of education. Millennials are increasingly investing in college
4According to a report by the Federal Deposit Insurance Corporation (2012), in 2011 the percentage of
unbanked in the U.S. was approximately 8 percent. 5That compares with a 60 percent national average.
7
degrees or postgraduate studies hoping to secure better and higher-paying jobs. As we will show
later, this increased level of investment in education is also associated with increased student
debt. In this sample, 38 percent of respondents have a college degree, 29 percent report to have
some college education but not a college degree, and 22 percent have a high-school diploma.
Importantly, those who have a college degree tend to have significantly higher levels of income
and are much more likely than other respondents to have a full-time job (54 percent vs. 25
percent). And as we saw earlier, those who have a full-time job tend to have more assets.
The statistics on assets and investment in education show that a notable percentage of
Millennials is accustomed to making significant financial decisions, such as buying homes or
choosing investment allocations.
However, the asset side of the balance sheet provides only a partial representation of
Millennials’ personal finances. Debt must also be taken into consideration. For example, home-
owning Millennials may carry substantial mortgages on their properties, and those with
retirement accounts may have borrowed against them. This report leverages unique NFCS data
on debt and debt management, enabling us to present a comprehensive overview of Millennials’
financial position and its relevance to financial institutions seeking to serve this generation.
2.3 Millennials Are Borrowing on Their Assets
Once we start to analyze debt in relation to assets, it becomes clear that many Millennials
are heavily leveraged and are borrowing on their assets. Table 3 shows Millennials’ borrowing
behavior associated to five distinct assets and investments: checking accounts, real estate, cars,
retirement accounts, and investment in education. Starting from the simplest asset, we find that
nearly 30 percent of account holders overdrew from their checking accounts in the 12 months

8
prior to the survey. It is also significant that 40 percent of Millennials own their homes, however,
over 70 percent of these homeowners have taken on mortgages to finance the purchase of their
home.6 Further, 36 percent of Millennials who own cars have auto loans.
Millennials are even accustomed to borrowing from retirement accounts. Among those
with self-directed retirement accounts,7 17 percent took a loan from their accounts and 14
percent made hardship withdrawals from such accounts. In total, 22 percent of account holders
tapped their self-directed retirement accounts in the 12 months prior to the survey.
Finally, Millennials are also heavily leveraged on their educational investment. Student
debt is the most common long-term liability among Millennials. According to a report by the
Federal Reserve Bank of New York (2013), 38 million Americans currently owe more than $1
trillion in student debt, the largest form of consumer debt after home mortgages. For Millennials,
student debt is particularly significant. Between 2007 and 2010, student loans significantly
increased as a proportion of young household debt, rising from 34 percent to 40 percent (Fry and
Parker, 2012). In our sample, nearly four of 10 respondents have student loans, whether private
or federal.
Student debt is a transversal liability that crosses demographics such as gender, ethnicity,
and income although, as expected, it disproportionately affects those with higher education.
Fifty-five percent of college-educated respondents carry student loans. This has interesting
implications, as we will address in more detail later. Higher education is typically associated
with higher average income. However, because the costs of education are frequently financed
6 This corresponds to 29 percent among the full sample of Millennials. 7Respondents with self-directed retirement accounts make up 36 percent of the sample.
9
through borrowing, college education may no longer be a guarantee of a better financial
condition.
The data on mortgages, car loans, and student loans show that many Millennials have
outstanding long-term liabilities associated with their assets. In order to understand to what
extent these long-term liabilities are a burden for this generation, we analyze them in a single
framework, obtaining an overview of the overall level of long-term indebtedness among
Millennials.
2.4 Overall Long-term Indebtedness and Financial Distress
By combining the information on long-term obligations, we develop a comprehensive
overview of Millennials’ long-term obligations—and the results are striking. Two-thirds (66
percent) of all Millennials have at least one source of outstanding long-term debt, whether
student loan, home mortgage, or car loan, and 30 percent have more than one source (Figure 1).
College-educated members of Millennials are more likely to have long-term debt due to student
loans. Among the 2,124 college-educated respondents in our sample, a staggering 81 percent
have at least one source of outstanding long-term debt, and 44 percent have more than one
source. In other words, a sizeable share (if not the major share) of young adults’ financial
decision-making has to do with debt and debt management.
Debt normally incurs higher interest rates than do assets, and servicing debt requires
periodic payments that may severely impact young individuals’ balance sheets and their ability
to make ends meet or save. Because of this, we examined responses to a set of questions added to
the 2012 NFCS. To identify potential indicators of financial distress, the survey asks:8
8Each of these questions includes as possible answers: “I do not know” and “I prefer not to say.”

10
Do you currently owe more on your home than you think you could sell it for today?
(Y/N)
How many times have you been late with your mortgage payments in the last 2 years?
(Never/Once/More than Once)
Are you concerned that you might not be able to pay off your student loans? (Y/N)
Do you currently have any unpaid bills from a health care or medical service provider
(e.g., a hospital, a doctor’s office, or a testing lab) that are past due? (Y/N)
These indicators show that the majority of Millennials have too much debt, struggle to
make debt payments, and worry about it.
Nearly a third (32 percent) of homeowners believe they owe more than they could sell
their homes for today, and 24 percent have been late with one or more mortgage payments within
the past two years (Figure 2). Problems with home financing are even more significant among
minorities: 37 percent of non-Asian minorities owe more on their homes than they could sell
them for today, and almost a third (31 percent) have been late with one or more mortgage
payments in the past two years.
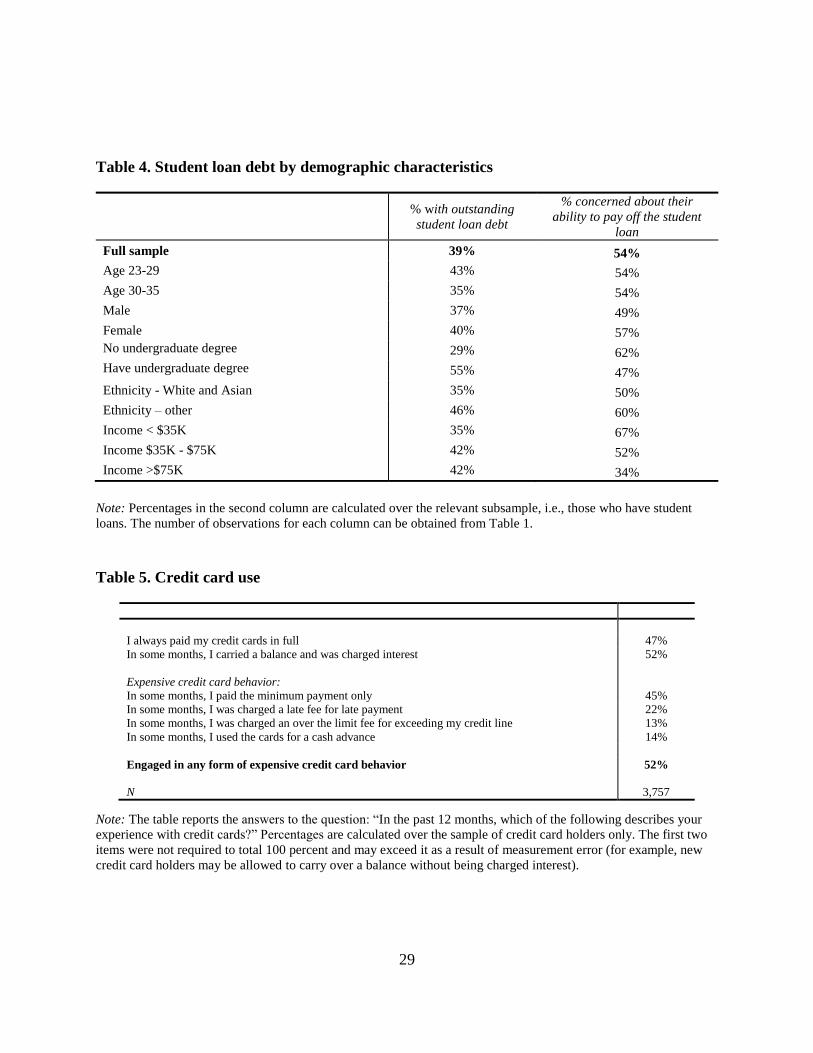
When it comes to student debt, fifty-four percent of respondents with student loans
expressed concerns about their ability to pay off the loans. This was especially true for women
(57 percent), part-time workers (63 percent), and non-Asian minorities (60 percent), and
respondents who have student loan debt but not a college degree (62%) (Table 4). Although
respondents with lower income tend to be more concerned than higher-income earners, even 34
percent of Millennials with annual household income above $75,000 doubt they will be able to
repay their student loans. Moreover, the percentage of individuals worried about repaying
student loans remains high even several years after college. Fifty-four percent of Millennials
older than 30 are worried about repaying student loans.
11
Millennials also struggle to meet other payment obligations. Thirty-five percent of the
respondents report unpaid medical bills. Although this percentage is highest among Millennials
without health insurance (45 percent), women (38 percent), individuals with annual income
below $35,000 (42 percent), and even one-fifth of respondents with annual income above
$75,000 report having unpaid medical bills. All these indicators of long-term indebtedness show
that many members of Millennials display signs of financial distress.
2.5 Short-term Liabilities
In addition to long-term debt, Millennials carry short-term debt. The most prevalent
source is credit cards. The NFCS data show that 68 percent of Millennials have at least one credit
card, and one card holder in five has four or more cards.9 The study also measures to what extent
credit-card holders engage in behaviors that trigger interest payments and fees. Specifically, the
survey asks:
In the past 12 months, which of the following describes your experience with credit cards?
I always paid my credit cards in full.
In some months, I carried over a balance and was charged interest.
In some months, I paid the minimum payment only.
In some months, I was charged a late fee for late payment.
In some months, I was charged an over-the-limit fee for exceeding my credit line.
In some months, I used the cards for a cash advance.
More than half (52 percent) of credit-card users report carrying over a balance—for
which they were charged interest—in the 12 months prior to the study (Table 5). Forty-five
percent report making only the minimum required payment on their balance. Moreover, a
sizeable share of cardholders has been charged late fees (22 percent), over-the-limit fees (13
9Seventy-two percent of the total U.S. population are credit-card holders (as observed in the full NFCS
data).
12
percent), and fees for taking cash advances (14 percent). When we look at those who borrow at
potentially high costs (i.e., pay the minimum only and/or have been charged a late fee, an over-
the-limit fee or used the card for a cash advance), we find that as many as 52 percent of
Millennials with credit cards engaged in one or more potentially expensive credit card behaviors
in the 12 months prior to the survey.
These results differ across demographics. Women are more likely than men to borrow in
expensive ways (54 percent vs. 48 percent). While 48 percent of whites and Asian Americans
engaged in such behavior, 59 percent of non-Asian minority respondents did. Furthermore, even
though expensive credit card use is more common among respondents with lower income and
lower education, 40 percent of card holders earning above $75,000 reported using credit cards in
ways that generate high interest payments and fees. The same is true of 43 percent of card
holders with college degrees.
The use of alternative financial services (AFS) represents another significant source of
short-term debt for Millennials. These services carry steep fees and, as such, have been defined
in related research as high-cost borrowing methods (Lusardi and de Bassa Scheresberg, 2013).
Regarding AFS use, the NFCS asks:10
Please tell me if you’ve done any of the following in the past five years:
Have you taken out an auto title loan? (Y/N)
Have you taken out a short-term “payday” loan? (Y/N)
Have you gotten an advance on your tax refund (sometimes called a “refund anticipation
loan” or “rapid refund”)? (Y/N)
Have you used a pawnshop? (Y/N)
Have you used a rent-to-own store? (Y/N)
More than two respondents in five (42 percent) used AFS at least once during the five
years prior to the survey, meaning that AFS use is not a “fringe” behavior limited to a small
10Each of these questions includes as possible answers “I do not know” and “I prefer not to say.”
13
segment of Millennials. Rather, it is a widespread method of borrowing that is common even for
households generally referred to as “middle class.” Indeed, AFS products were used by more
than a quarter of Millennials with annual household incomes higher than $75,000, which is about
four times the poverty line for a standard household of three (Table 6). Moreover, many
Millennials use non-bank services on a recurrent basis. For example, 19 percent of Millennials
reported using payday loans in the five years prior to the survey. Among these, 31 percent used
them three or more times. Similarly, 27 percent of Millennials used pawnshops and, among those
respondents, nearly half (47 percent) reported having used these products three or more times in
the past five years.
This study confirms the findings by Lusardi and de Bassa Scheresberg (2013), who
documented a strong educational divide in AFS use among Millennials. While 28 percent of
Millennials with a college degree have used AFS, 50 percent of respondents with high school
education or less have relied on AFS. Notable demographic differences also emerge when AFS
use is examined in the context of ethnicity. While 38 percent of White and Asian-American
respondents use high-cost borrowing methods, 49 percent of African Americans, Hispanics, and
other ethnicities engage in such behavior.
Much of the literature on AFS has focused on the need to provide access to the unbanked,
but the NFCS data show that having a bank account or a credit card is not a panacea. Thirty-nine
percent of Millennials with a bank account used an AFS product in the five years prior to the
survey, as did 35 percent of credit card users.
To summarize, Millennials are burdened by short-term debt as a result of expensive credit
card behavior and high-cost borrowing through alternative financial services. Many Millennials
also overdraw their checking accounts and take loans from their retirement accounts. This
14
accumulation of short-term debt, in tandem with long-term debt burden, puts Millennials in a
position of potential financial distress.
2.6 Over-indebtedness and Satisfaction with Current Personal Financial Condition
There are also other, more encompassing, measures of financial stress. To gauge overall
debt levels and respondents’ satisfaction with their personal financial condition, the survey asks:
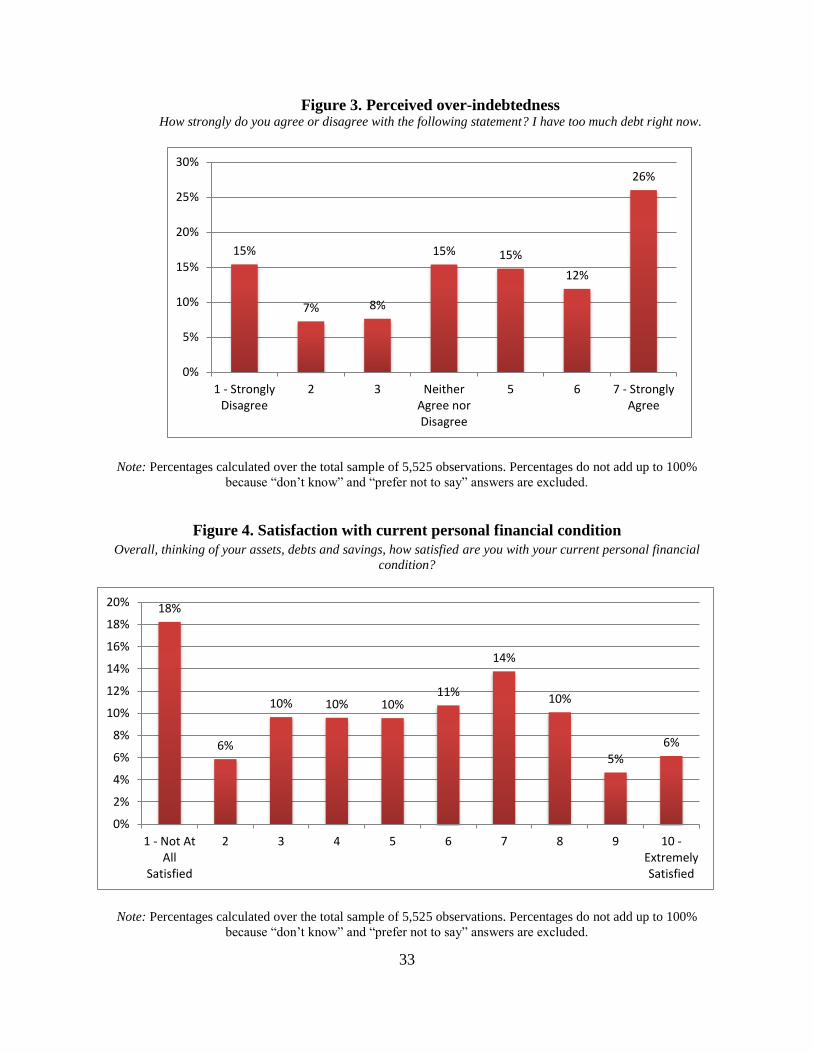
How strongly do you agree or disagree with the following statement? Please give your
answer on a scale of 1 to 7, where 1 = “Strongly Disagree,” 7 = “Strongly Agree,” and 4
= “Neither Agree Nor Disagree.” You can use any number from 1 to 7.
“I have too much debt right now.”
Overall, thinking of your assets, debts and savings, how satisfied are you with your
current personal financial condition? (Answer on a scale of 1 to 10, where 1 = “Not At
All Satisfied” and 10 = “Extremely Satisfied.”)
Given the findings about short-term and long-term debt, it is perhaps not surprising that
53 percent of Millennials agreed with the statement “I have too much debt right now” (Figure 3).
Perceived over-indebtedness is similar across demographic groups. More than half (51 percent)
of college-educated Millennials feel that they have too much debt, as do 46 percent of
respondents with annual incomes higher than $75,000.
Only 21 percent of Millennials reported that they are very satisfied with their current
personal financial condition (8–10). Forty-four percent gave neutral marks (4–7), and 34 percent
gave low marks (1–3) (Figure 4). Interestingly, satisfaction with one’s current personal financial
condition tends to be higher among respondents with long-term debt (perhaps because this debt,
in many cases, is due to education) and much lower among those with short-term debt, those
with expensive credit card behaviors, and those who borrow through AFS products. Satisfaction
is also inversely related to over-indebtedness: Only 16 percent of those who agreed with the
statement “I have too much debt” reported being financially satisfied.
15
In other words, the majority of Millennials start their professional careers with different
sources of debt, and most of them feel they have too much debt.
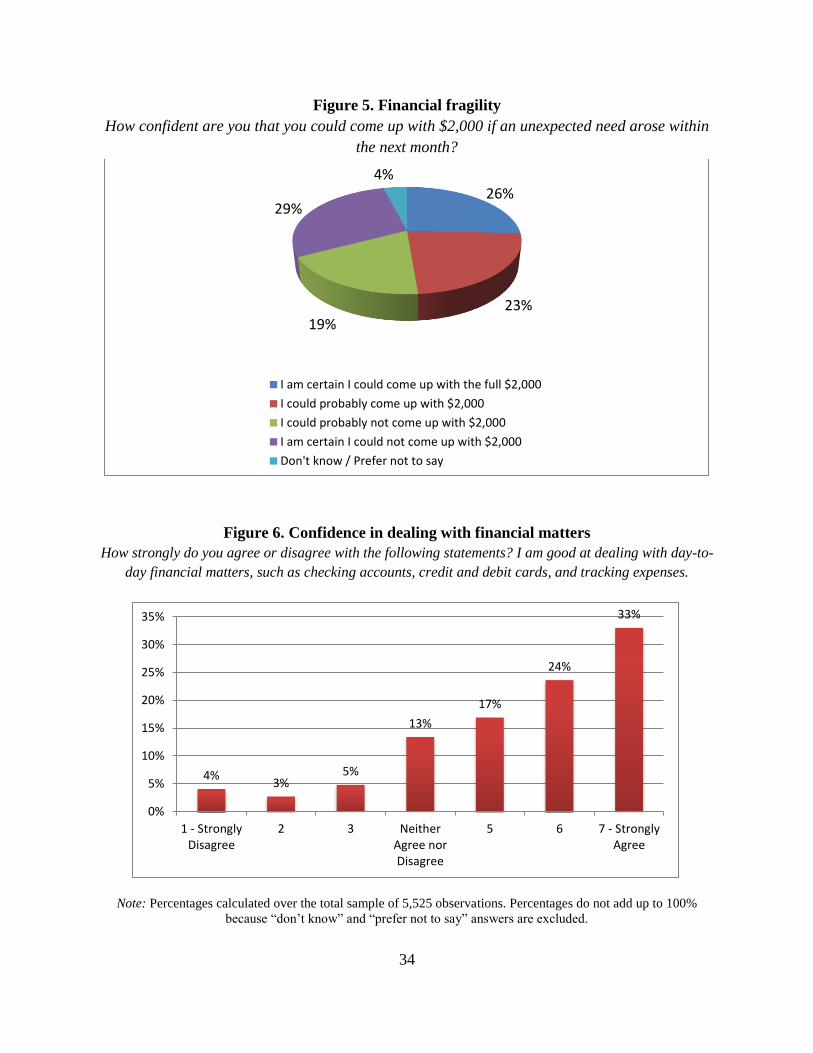
2.7 Financial Fragility
Since debt obligations leave Millennials in a potentially vulnerable financial position, we
look at different measures of financial fragility to better understand the degree of that
vulnerability. The data reveal that despite the prevalence of economic shocks, many Millennials
do not have emergency or “rainy day” funds. Less than a third (32 percent) report setting aside
sufficient funds to cover three months of expenses in the event of an unexpected shock.
Furthermore, those who do not save for the long run also do not save for the short run: Among
those without retirement plans, only 19 percent report having emergency funds.
Responses to another question—How confident are you that you could come up with $2,000 if
an unexpected need arose within the next month?—confirm Millennials’ vulnerability to an
unfavorable economic occurrence. Lusardi, Schneider, and Tufano (2011) were the first to
propose this question as an indicator of financial fragility. The measure was piloted in a small
survey in 2009, revealing that in the midst of the financial crisis, about 50% of Americans were
certainly or probably not able to cope with an unexpected $2,000 expense. This measure was
then added to the 2012 NFCS, making it possible to study young adults’ ability to cope with
shocks and unexpected expenses. Among Millennials, 48 percent report that they either probably
or certainly could not come up with the funds (Figure 5).Millennials are thus unprepared for
short-term economic shocks, having neither savings nor alternative sources of funds to handle
expenses in such a situation.
16
The ability to cover expenses in the event of an unexpected economic shock varies across
subgroups. As we show in other parts of the study, having a full-time job is one of the most
important indicators of financial stability. While 35 percent of those who have a full time job
report that they certainly could come up with $2,000 in one month, only 17 percent of those who
do not have a full time job report to be certain about their ability to come up with such funds.
Moreover, respondents at higher levels of education show much lower levels of financial
fragility. Thirty-six percent of college-educated Millennials and 52 percent of post-graduates are
certain about their ability to come up with $2,000 in one month.
Ultimately, household income is also an important determinant, with 55 percent of those
earning above $75,000 per year, 26 percent of those earning between $35,000 and $75,000 per
year, and 12 percent of those earning below $35,000 per year being certain that they could come
up with $2,000 if needed.
2.8 Financial Literacy, Confidence in Financial Knowledge, and Self-perceptions
Many Millennials carry large amounts of debt and engage in behaviors that generate
costly interest payments and fees, yet they give themselves high marks on their personal
financial management skills. NFCS data show that most Millennials are confident about their
ability to make financial decisions, and they perceive themselves as having a good handle on
financial matters. Seventy-four percent of respondents in our sample agreed with the statement “I
am good at dealing with day-to-day financial matters, such as checking accounts, credit and debit
cards, and tracking expenses” (Figure 6).
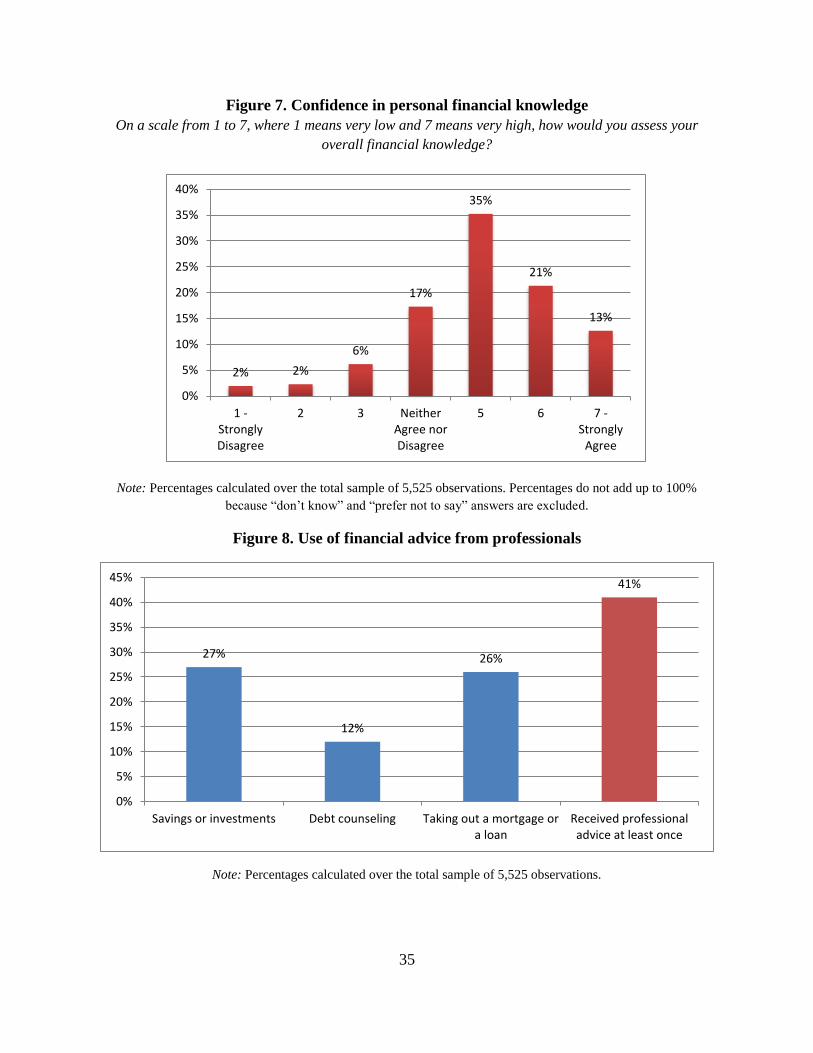
Similarly, there is a disconnect between self-assessed financial literacy and actual levels
of financial literacy. We saw this in the responses to questions that assess understanding of
17
fundamental concepts that underpin financial decision-making. Nearly 70 percent of respondents
rated themselves as having high financial knowledge (Figure 7). That finding was even stronger
for men: Seventy-five percent ranked themselves as highly knowledgeable. In stark contrast to
this self-perception, responses to five financial literacy questions indicate that Millennials have a
generally low level of financial literacy.
To measure financial knowledge, the survey included a set of financial literacy questions
that were designed by Lusardi and Mitchell for the U.S. Health and Retirement Study and
subsequently were included in other surveys in the United States and abroad (Lusardi and
Mitchell, 2008, 2011a).11 The questions, which were worded using the language of everyday
transactions, test five fundamental concepts: numeracy and the capacity to do calculations related
to interest rates; an understanding of inflation; an understanding of risk diversification and of
stocks and mutual funds; an understanding of interest payments on a mortgage; and an
understanding of the relationship between interest rates and bond prices.12 All of these concepts
are very important for Millennials, given that they are already active investors and carry both
short- and long-term debt.
Roughly speaking, correct answers to the first three questions indicate a basic level of
financial literacy. Correctly answering all five questions shows a high level of financial literacy.
Despite high self-perceptions of financial knowledge, only 8 percent of Millennials answered all
five questions correctly, and only 24 percent answered the first three questions correctly (Table
7).13 Not only is the percentage of correct answers low, but many Millennials indicated that they
did not know the answers to the questions—a response that has been shown to indicate a very
11For an international comparison of financial literacy, see Lusardi and Mitchell 2011b, 2014. 12See the appendix for the exact wording of the five financial literacy questions. 13The first three questions aim to measure basic financial knowledge.
18
low level of financial knowledge (Lusardi and Mitchell, 2008, 2011a,b, 2014). Financial
illiteracy is widespread and particularly severe among specific subgroups. Women are much less
likely than men to correctly answer the first three financial literacy questions, and minorities are
less likely to answer correctly than Whites or Asians. Financial literacy also seems to increase
with income. Respondents with annual income higher than $75,000 are more likely to correctly
answer the first three financial literacy questions than are respondents with annual income less
than $35,000.
Not only do Millennials demonstrate much lower levels of financial literacy than they
think they have, but only 37 percent of college-educated Millennials correctly answered the most
basic financial literacy questions. This means that even with high levels of education, Millennials
demonstrate poor financial knowledge. It is important to note, however, that only 22 percent of
all respondents and 29 percent of college-educated respondents report having received financial
education through educational institutions or places of employment. The alarmingly low rates of
financial literacy underscore the serious need to increase financial education.
2.9 Use of Financial Advice and Trust in Financial Professionals
Given their low levels of financial literacy, do Millennials seek the guidance of financial
professionals? The NFCS included a number of questions designed to gauge whether
respondents looked for financial advice. Specifically, respondents were asked to indicate whether
in the five years prior to the survey they sought advice from a financial professional on any of
the following:14
14The survey also includes information on the use of professional advice for insurance or tax planning.
However, since these are not relevant in this context, we concentrate on the three measures reported in the
text.
19
− Savings or investments
− Debt counseling
− Taking out a mortgage or a loan
Forty-one percent of Millennials sought at least one form of financial advice in the five
years prior to the survey (Figure 8), most commonly related to savings and investments (27
percent). Advice on a mortgage or a loan was sought by 26 percent of respondents. The data also
show that only 12 percent of respondents received advice from a financial professional about
debt counseling. Even among those who feel they have too much debt, only 17 percent sought
this type of advice.
These statistics are quite telling. Our analysis shows that most Millennials are not
equipped with the basic skills needed to make good financial decisions, yet the majority seeks no
external guidance, particularly when it comes to debt and debt management.
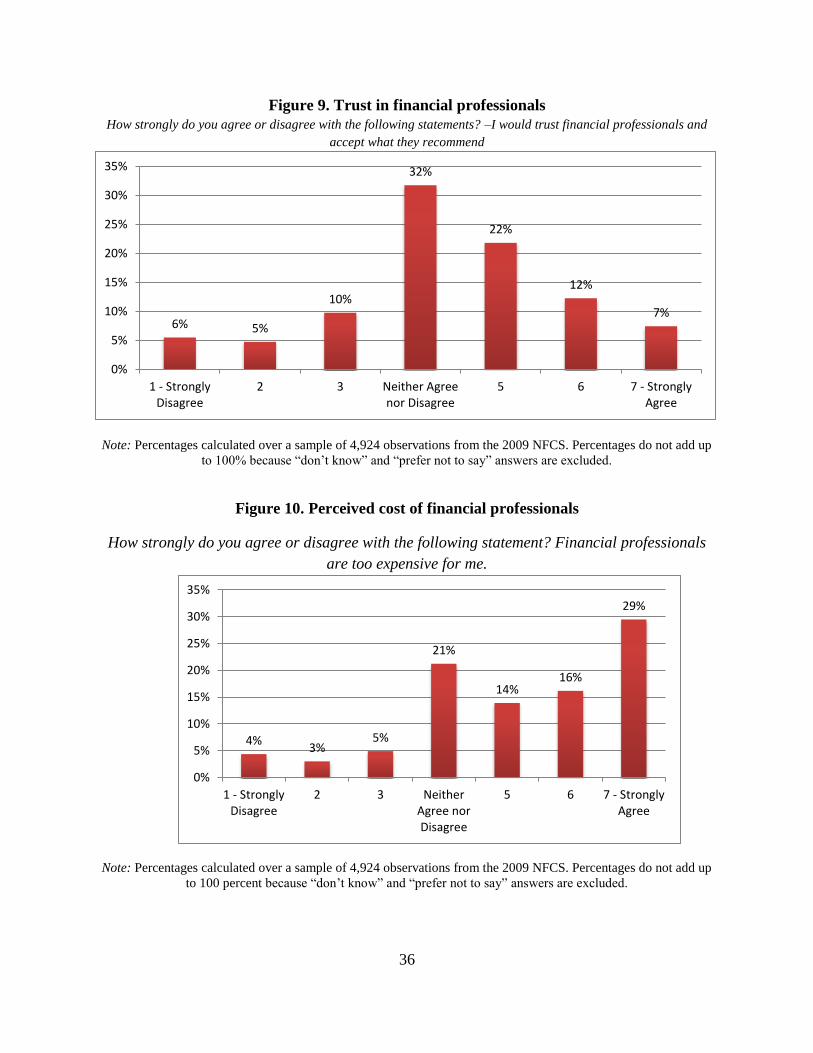
To identify what financial institutions can do to better provide financial advice to
Millennials, we analyze a set of questions that appeared in the 2009 NFCS but were not repeated
in the 2012 wave. These questions looked at respondents’ perceptions of and trust in financial
professionals. Specifically, the 2009 NFCS asked:
How strongly do you agree or disagree with the following statements?
− I would trust financial professionals and accept what they recommend.
− Financial professionals are too expensive for me.
− It is hard to find the right financial professional for me.
All answers were measured on a scale from 1 to 7, where 1 means “Strongly Disagree,” 4 means
“Neither Agree nor Disagree,” and 7 means “Strongly Agree.”15 Because the available age
variable is categorical, we can only restrict the analysis to a narrower age bracket (25–34). The
15Possible answers also included “I do not know” and “I prefer not to say.”
20
total sample consists of 4,924 observations.16 We find that only two respondents in five in our
sample (41 percent) would trust financial professionals and accept what they recommend (Figure
9).17 Interestingly, those with greater financial literacy tend to trust financial professionals more
than those with lower financial literacy (46 percent vs. 39 percent). This creates a potentially
vicious cycle in which those who are less financially literate do not seek financial advice.
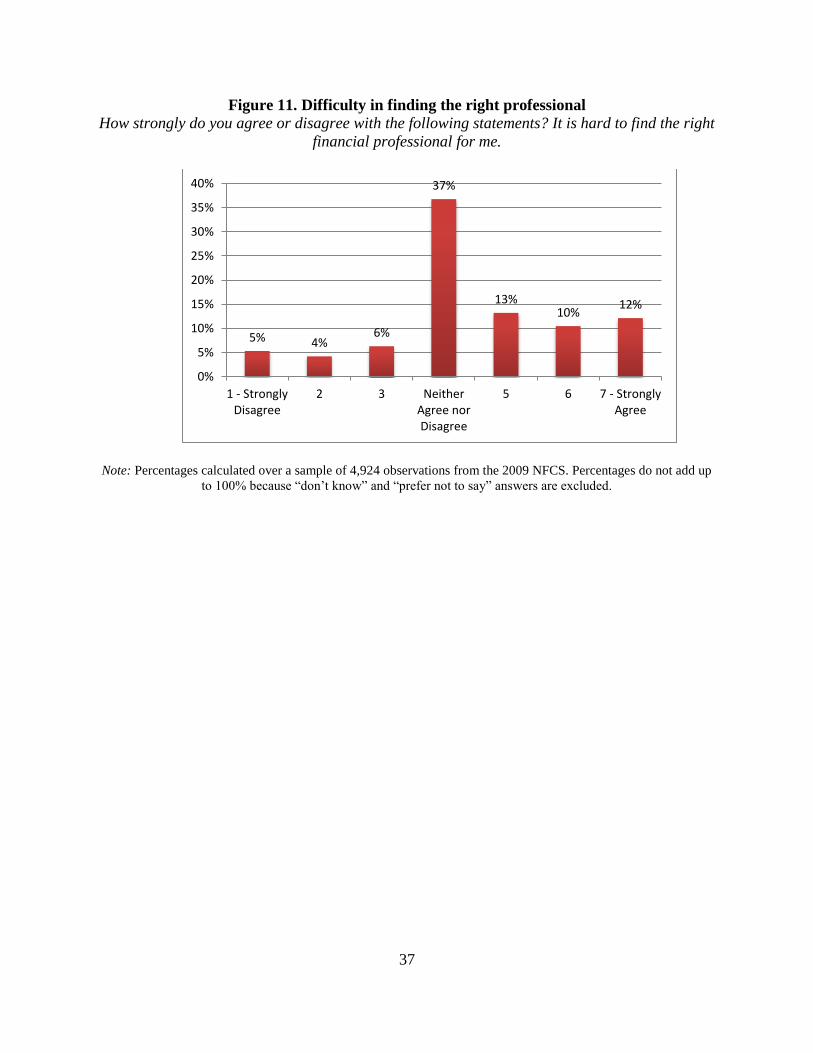
Cost and lack of targeted services are additional barriers. Nearly 60 percent of these
young respondents think financial professionals are too expensive for them (Figure 10), and 35
percent think that it is hard to find the right financial professional for their personal financial
situation (Figure 11).
Financial Behavior and Associated Factors: A Multivariate Analysis
A range of factors influence financial behavior and status, including personal preferences,
willingness to take risks, and economic circumstances. A deeper understanding of behavior and
outcomes can be derived through multivariate analysis of the associated socio-demographic
factors. This study undertook a multivariate analysis of four variables:
1. Indebtedness
2. Use of high-cost borrowing methods
3. Financial fragility
4. Financial advice regarding saving or investing
Each of the four indicators is a dummy variable. The variable measuring indebtedness refers
to the question “On a scale from 1 to 7, how strongly do you agree with the following statement:
I have too much debt right now?” Responses of 5, 6, or 7 are assigned a value of one; all other
responses are assigned a value of zero. The variable measuring use of high cost borrowing methods
16We dropped 10 observations in which respondents were coded as “retired.” 17We calculate respondents who chose values greater than 5.
21
is assigned a value equal to one if the respondent reports having used at least one of five alternative
financial services in the five years prior to the survey.18 Respondents’ ability to come up with
$2,000 in one month in the event of an unexpected expense is used to measure financial fragility;
this dummy variable takes a value of one if respondents indicate they are certainly unable or
probably unable to come up with $2,000, and zero otherwise. Similarly, the variable regarding
professional advice is equal to one if the respondent has consulted a financial professional
regarding saving or investment within the past five years.
The sample for the empirical analysis is composed of 4,999 observations. (About 500
observations from the original sample have been excluded because there is missing information in
one or more of the variables included in the regressions, especially use of high cost borrowing
methods).
The regression specification includes demographic characteristics, indicators for income,
labor market shocks, risk preference, and additional indicators such as respondents’ capacity to
deal with shocks and respondents’ level of financial literacy. In particular, the measurement of
financial literacy is based on respondents’ ability to correctly answer three basic financial literacy
questions related to interest rates, inflation, and risk diversification.
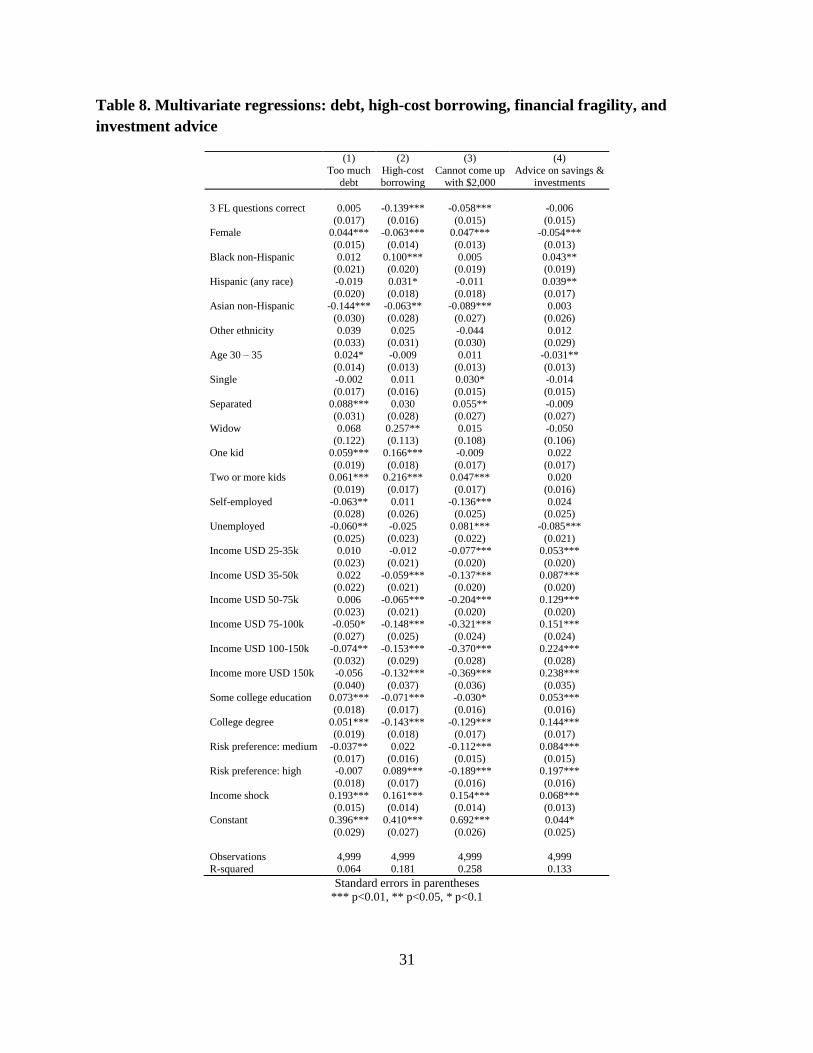
The estimates show that both income and income shocks are important predictors of
financial distress (Table 8). For example, those who are currently unemployed and those who
experienced a large income shock in the twelve months prior to the survey are, respectively, 9 and
15 percentage points more likely to be financially fragile. Moreover, the multivariate analysis
18 Please refer to the short term liabilities section for a list of the five alternative financial services
included in this study.

22
documents that only a few demographic variables are statistically significant when analyzing the
likelihood of being highly indebted. This finding confirms what was highlighted previously:
indebtedness appears to be a transversal characteristic that goes beyond the demographic
differences in the sample and is widespread among different subgroups. An important exception
are Asian-Americans, who are found to be 14 percentage points less likely than whites to feel that
they had too much debt. Additionally, over-indebtedness appears to increase with education,
suggesting an additional impact from student loans taken to finance graduate studies.
The multivariate analysis confirms the descriptive findings indicating that a number of
demographic groups are more likely to be financially vulnerable. The regression results show that
female respondents, individuals with two or more children, and the unemployed are less likely to
be able to come up with $2,000 in one month in the event of an emergency. Financial fragility is
also much more likely among those who experienced an income shock (an additional 15
percentage points), which shows how past shocks can be important determinants of financial
fragility. Moreover, the analysis shows that a few demographic groups are more likely to use use
high-cost methods of borrowing, especially respondents with one or more financially dependent
children and African Americans, who are found to be 10 percentage points more likely than whites
to use these methods. Further, the analysis confirms the existence of an educational divide in use
of alternative of financial services. Respondents without some college education or a college
degree are 5 to 7 percentage points more likely to use high-cost methods of borrowing.
Financial literacy is also a key determinant. Those who correctly answered all five financial
literacy questions are 6 percentage points less likely to be financially fragile and 14 percentage
points less likely to use high-cost borrowing methods. The coefficient related to financial literacy
23
remains significant even after controlling for education, indicating that financial literacy holds
explanatory power beyond the effect of education.
Overall, fewer variables correlate with receiving financial advice. However, income,
education, and income shocks play an important role, implying that lower earners or respondents
without a college degree may also be more exposed to financial insecurity due to a lack of advice.
This is particularly worrisome given that the lower income and lower educated groups also have,
on average, lower levels of financial literacy.
3. Conclusions
This study has used the newest data from the NFCS to analyze salient features related to
Millennials’ financial capability and to identify the key financial challenges they face. It looks at
perceived vs. actual readiness to tackle these challenges and builds a comprehensive outlook of
the financial profile of the typical Millennial. Despite encouraging signs in terms of Millennials’
assets, the analysis reveals that Millennials are deeply indebted and struggle to meet payments on
both short- and long-term obligations. Furthermore, Millennials use credit cards in expensive
ways, tap their retirement accounts and bank accounts, and rely on alternative financial services,
often even if they have a bank account or a credit card. Even more troubling, their high level of
financial engagement is not matched with a correspondingly high level of financial literacy. Most
Millennials feel good about their financial knowledge, yet data show that they consistently lack
the basic skills needed to make savvy financial decisions.
These findings suggest that there is a great need to promote financial capability among
Millennials. Programs aimed at improving financial literacy could help Millennials minimize the
costs incurred in managing its debt, improve its financial safety net in the event of emergencies,

24
and fortify its financial security. The gap between the amount of financial responsibility given to
young Americans and their demonstrated ability to manage financial decisions and take
advantage of financial opportunities is rapidly widening. Unless significant action is taken to
alter this, financial illiteracy will remain a powerful obstacle to financial market efficiency and
Millennials’ use of traditional financial services.
25
References
Atkinson, Adele, Stephen McKay, Elaine Kempson, and Sharon Collard. “Levels of Financial
Capability in the UK: Results of a Baseline Survey.” Public Money & Management
27(1): 29–36. February 2007.
Bishop, Ian. “Hill Scolds Lazy Millennials – ‘They Have to Do Their Part.’” New York Post.
March 12, 2006. http://nypost.com/2006/05/12/hill-scolds-lazy-Millennials-they-have-to-
do-their-part/
Bresiger, Gregory. “To Millennials, Corporate Cubicles Aren’t Cool.” New York Post. July 31,
2011. http://nypost.com/2011/07/31/to-generation-y-corporate-cubicles-arent-cool/
Eubanks, Steve. “Millennials Go To College—Executive Summary.” Azusa Pacific University.
2006. http://eubie.com/Millennials.pdf
Federal Deposit Insurance Corporation, “2011 National Survey of Unbanked and Underbanked
Households.” September 2012.
http://www.fdic.gov/householdsurvey/2012_unbankedreport.pdf
Federal Reserve Bank of New York. “Quarterly Report on Household Debt and Credit.”
November 2013.
http://www.newyorkfed.org/research/national_economy/householdcredit/DistrictReport_
Q32013.pdf
Fry, Richard, and Kim Parker. “Record Shares of Young Adults Have Finished Both High
School and College.” Pew Research Center. November 5, 2012.
http://www.pewsocialtrends.org/2012/11/05/record-shares-of-young-adults-have-
finished-both-high-school-and-college/
Lusardi, Annamaria. “Americans’ Financial Capability.” NBER Working Paper No. 17103.
National Bureau of Economic Research, Cambridge, MA. 2011.
http://www.nber.org/papers/w17103
Lusardi, Annamaria, and Carlo de Bassa Scheresberg. “Financial Literacy and High-Cost
Borrowing in the United States.” NBER Working Paper No.18969. National Bureau of
Economic Research, Cambridge, MA. 2013. http://www.nber.org/papers/w18969
Lusardi, Annamaria, and Olivia S. Mitchell. “Planning and Financial Literacy: How Do Women
Fare?” American Economic Review 98: 413–417. 2008.
Lusardi, Annamaria, and Olivia S. Mitchell. “Financial Literacy and Planning: Implications for
Retirement Wellbeing.” In Financial Literacy: Implications for Retirement Security and
the Financial Marketplace. Eds. O. S. Mitchell and A. Lusardi. Oxford, Oxford
University Press: 17-39. 2011a.
26
Lusardi, Annamaria and Olivia S. Mitchell. “Financial Literacy around the World: An
Overview.” Journal of Pension Economics and Finance 10(4): 497-508. 2011b.
Lusardi, Annamaria, and Olivia S. Mitchell. “The Economic Importance of Financial Literacy:
Theory and Evidence.” Journal of Economic Literature (forthcoming). 2014.
Lusardi, Annamaria, Daniel Schneider, and Peter Tufano. “Financially Fragile Households:
Evidence and Implications.” Brookings Papers on Economic Activity, Spring 2011, pp.
83-134.
National Chamber Foundation. “The Millennial Generation: Research Review.” U.S. Chamber of
Commerce. 2012. http://emerging.uschamber.com/MillennialsReport
Schawbel, Dan. “Millennials vs. Baby Boomers: Who Would You Rather Hire?” Time
Magazine. March 29, 2012. http://business.time.com/2012/03/29/Millennials-vs-baby-boomers-
who-would-you-rather-hire/
Taylor, Paul, and Scott Keeter. “Millennials: Confident. Connected. Open to Change.” Pew
Research Center. 2010. http://www.pewsocialtrends.org/files/2010/10/Millennials-
confident-connected-open-to-change.pdf
27
Table 1. Sample demographics
Male 41% Female 59%
Age 23-29 50% Age 30-35 50%
Ethnicity: White 61%
African-American 13%
Hispanic 15% Asian-American 6%
Other ethnicity 5%
Marital status:
Married 47%
Single 46% Separated 2%
Divorced 4%
Number of Financially Dependent Children
1 21%
2 18% 3 or more 15%
No financially dependent children 4% Do not have any children 42%
Living arrangements: I am the only adult in the household 22%
I live with my spouse/partner/significant other 59%
I live in my parents’ home 11% I live with other family, friends, or roommates 9%
Employment status: Self-employed 7%
Work full time for an employer 47%
Work part time for an employer 11% Homemaker 16%
Full-time student 6%
Permanently sick, disabled, or unable to work 3% Unemployed or temporarily laid off 10%
Income: Income < USD 25k 30%
Income USD 25-35k 14%
Income USD 35-50k 16% Income USD 50-75k 18%
Income USD 75-100k 11%
Income USD 100k 11%
Education:
Did not complete high school 10% High school graduate - regular high school diploma 15%
High school graduate - GED or alternative credential 7%
Some college 29% College graduate 26%
Post-graduate education 13%
Financial decision-maker in the household 85%
N 5,525
Note: The sample is restricted to 5,525 respondents age 23–35.

28
Table 2. Asset ownership
Percentage of respondents with:
Checking accounts 85%
Savings accounts 69%
(% Banked) (88%)
Any retirement accounts, employer-based or independent 51%
Investments in stocks, bonds, or mutual funds 26%
Home 41%
Some college education 29%
College degree 38%
Note: Percentages are calculated over the total sample of Millennials. The number of observations is 5,525. Ten
percent of respondents did not answer the question on investments.
Table 3. Borrowing on assets
Have a checking account 85%
Overdraw from their checking account in the 12 months prior to the survey 29%
Own a home 41%
Have a mortgage on their home 72%
Own a car N/A
Have an auto loan 36%
Have a self-directed retirement account 36%
Took a loan from their retirement account in the 12 months prior to the survey 17%
Made a hardship withdrawal from their retirement account in the 12 months prior to the survey 14%
Either took a loan or made a hardship withdrawal 22%
Have a college degree 38%
Have an outstanding student loan 39%
Note: Percentages are calculated over the total sample of Millennials. The number of observations is 5,525. Statistics
relative to borrowing are conditional on having the associated asset.
29
Table 4. Student loan debt by demographic characteristics
% with outstanding
student loan debt
% concerned about their
ability to pay off the student
loan
Full sample 39% 54%
Age 23-29 43% 54%
Age 30-35 35% 54%
Male 37% 49%
Female 40% 57%
No undergraduate degree 29% 62%
Have undergraduate degree 55% 47%
Ethnicity - White and Asian 35% 50%
Ethnicity – other 46% 60%
Income < $35K 35% 67%
Income $35K - $75K 42% 52%
Income >$75K 42% 34%
Note: Percentages in the second column are calculated over the relevant subsample, i.e., those who have student
loans. The number of observations for each column can be obtained from Table 1.
Table 5. Credit card use
I always paid my credit cards in full 47%
In some months, I carried a balance and was charged interest 52%
Expensive credit card behavior:
In some months, I paid the minimum payment only 45%
In some months, I was charged a late fee for late payment 22%
In some months, I was charged an over the limit fee for exceeding my credit line 13%
In some months, I used the cards for a cash advance 14%
Engaged in any form of expensive credit card behavior 52%
N 3,757
Note: The table reports the answers to the question: “In the past 12 months, which of the following describes your
experience with credit cards?” Percentages are calculated over the sample of credit card holders only. The first two
items were not required to total 100 percent and may exceed it as a result of measurement error (for example, new
credit card holders may be allowed to carry over a balance without being charged interest).

30
Table 6. Use of AFS by demographic characteristic
Column1 % of respondents who used AFS in the
5 years prior to survey
Full sample 42%
Age 23-29 43%
Age 30-35 41%
Male 42%
Female 42%
No undergraduate degree 50%
Have undergraduate degree 28%
Ethnicity - White and Asian 38%
Ethnicity - other 49%
Income <$35K 52%
Income $35 - $75K 40%
Income >$75K 26%
Banked 39%
Credit card holder 35%
Note: The table reports answers to the question: “In the past 5 years, how many times have you…? Taken out an
auto title loan; Taken out a short term 'payday' loan; Gotten an advance on your tax refund; Used a pawn shop; Used
a rent-to-own store.” Percentages are calculated over a total sample of 5,319 observations for which information is
non-missing.
Table 7. Financial literacy among Millennials
% Correct % Don’t Know
Numeracy question 73% 13%
Inflation question 46% 27%
Risk diversification question 40% 48%
Mortgage question 72% 17%
Bond prices question 22% 42%
Answered the first three questions correctly 24% -
Answered all questions correctly 8% -
Note: Percentages are calculated over the total sample of 5,525 respondents.
31
Table 8. Multivariate regressions: debt, high-cost borrowing, financial fragility, and
investment advice
(1) (2) (3) (4)
Too much debt
High-cost borrowing
Cannot come up with $2,000
Advice on savings & investments
3 FL questions correct 0.005 -0.139*** -0.058*** -0.006
(0.017) (0.016) (0.015) (0.015) Female 0.044*** -0.063*** 0.047*** -0.054***
(0.015) (0.014) (0.013) (0.013)
Black non-Hispanic 0.012 0.100*** 0.005 0.043** (0.021) (0.020) (0.019) (0.019)
Hispanic (any race) -0.019 0.031* -0.011 0.039**
(0.020) (0.018) (0.018) (0.017) Asian non-Hispanic -0.144*** -0.063** -0.089*** 0.003
(0.030) (0.028) (0.027) (0.026)
Other ethnicity 0.039 0.025 -0.044 0.012
(0.033) (0.031) (0.030) (0.029)
Age 30 – 35 0.024* -0.009 0.011 -0.031**
(0.014) (0.013) (0.013) (0.013) Single -0.002 0.011 0.030* -0.014
(0.017) (0.016) (0.015) (0.015)
Separated 0.088*** 0.030 0.055** -0.009 (0.031) (0.028) (0.027) (0.027)
Widow 0.068 0.257** 0.015 -0.050 (0.122) (0.113) (0.108) (0.106)
One kid 0.059*** 0.166*** -0.009 0.022
(0.019) (0.018) (0.017) (0.017) Two or more kids 0.061*** 0.216*** 0.047*** 0.020
(0.019) (0.017) (0.017) (0.016)
Self-employed -0.063** 0.011 -0.136*** 0.024 (0.028) (0.026) (0.025) (0.025)
Unemployed -0.060** -0.025 0.081*** -0.085***
(0.025) (0.023) (0.022) (0.021) Income USD 25-35k 0.010 -0.012 -0.077*** 0.053***
(0.023) (0.021) (0.020) (0.020)
Income USD 35-50k 0.022 -0.059*** -0.137*** 0.087*** (0.022) (0.021) (0.020) (0.020)
Income USD 50-75k 0.006 -0.065*** -0.204*** 0.129***
(0.023) (0.021) (0.020) (0.020) Income USD 75-100k -0.050* -0.148*** -0.321*** 0.151***
(0.027) (0.025) (0.024) (0.024)
Income USD 100-150k -0.074** -0.153*** -0.370*** 0.224*** (0.032) (0.029) (0.028) (0.028)
Income more USD 150k -0.056 -0.132*** -0.369*** 0.238***
(0.040) (0.037) (0.036) (0.035) Some college education 0.073*** -0.071*** -0.030* 0.053***
(0.018) (0.017) (0.016) (0.016)
College degree 0.051*** -0.143*** -0.129*** 0.144*** (0.019) (0.018) (0.017) (0.017)
Risk preference: medium -0.037** 0.022 -0.112*** 0.084***
(0.017) (0.016) (0.015) (0.015) Risk preference: high -0.007 0.089*** -0.189*** 0.197***
(0.018) (0.017) (0.016) (0.016)
Income shock 0.193*** 0.161*** 0.154*** 0.068***
(0.015) (0.014) (0.014) (0.013)
Constant 0.396*** 0.410*** 0.692*** 0.044*
(0.029) (0.027) (0.026) (0.025)
Observations 4,999 4,999 4,999 4,999
R-squared 0.064 0.181 0.258 0.133
Standard errors in parentheses
*** p<0.01, ** p<0.05, * p<0.1

32
Figure 1. Sources of long-term debt
Note: Percentages are calculated over the total sample of 5,525 observations. The statistics relative to home
mortgage and car loan are unconditional means.
Figure 2. Indicators of financial distress
Note: Percentages are calculated over the relevant subsamples except for the statistic on medical debt that is
calculated over the full sample.
39%
29%
36%
66%
30%
55%
41% 41%
81%
44%
0%
10%
20%
30%
40%
50%
60%
70%
80%
90%
Student loan Home mortgage Car loan At least onesource of long-
term debt
More than onesource of long-
term debt
All Millennials College-educated millennials
54%
32%
24%
35%
0%
10%
20%
30%
40%
50%
60%
Concerned aboutpaying off student
loan
Owe more on theirhome than home's
value
Have been latewith mortgage
payments
Have unpaidmedical bills
33
Figure 3. Perceived over-indebtedness How strongly do you agree or disagree with the following statement? I have too much debt right now.
Note: Percentages calculated over the total sample of 5,525 observations. Percentages do not add up to 100%
because “don’t know” and “prefer not to say” answers are excluded.
Figure 4. Satisfaction with current personal financial condition
Overall, thinking of your assets, debts and savings, how satisfied are you with your current personal financial
condition?
Note: Percentages calculated over the total sample of 5,525 observations. Percentages do not add up to 100%
because “don’t know” and “prefer not to say” answers are excluded.
15%
7% 8%
15% 15%
12%
26%
0%
5%
10%
15%
20%
25%
30%
1 - StronglyDisagree
2 3 NeitherAgree norDisagree
5 6 7 - StronglyAgree
18%
6%
10% 10% 10%11%
14%
10%
5%6%
0%
2%
4%
6%
8%
10%
12%
14%
16%
18%
20%
1 - Not AtAll
Satisfied
2 3 4 5 6 7 8 9 10 -ExtremelySatisfied
34
Figure 5. Financial fragility
How confident are you that you could come up with $2,000 if an unexpected need arose within
the next month?
Figure 6. Confidence in dealing with financial matters
How strongly do you agree or disagree with the following statements? I am good at dealing with day-to-
day financial matters, such as checking accounts, credit and debit cards, and tracking expenses.
Note: Percentages calculated over the total sample of 5,525 observations. Percentages do not add up to 100%
because “don’t know” and “prefer not to say” answers are excluded.
26%
23%19%
29%
4%
I am certain I could come up with the full $2,000
I could probably come up with $2,000
I could probably not come up with $2,000
I am certain I could not come up with $2,000
Don't know / Prefer not to say
4%3%
5%
13%
17%
24%
33%
0%
5%
10%
15%
20%
25%
30%
35%
1 - StronglyDisagree
2 3 NeitherAgree norDisagree
5 6 7 - StronglyAgree
35
Figure 7. Confidence in personal financial knowledge
On a scale from 1 to 7, where 1 means very low and 7 means very high, how would you assess your
overall financial knowledge?
Note: Percentages calculated over the total sample of 5,525 observations. Percentages do not add up to 100%
because “don’t know” and “prefer not to say” answers are excluded.
Figure 8. Use of financial advice from professionals
Note: Percentages calculated over the total sample of 5,525 observations.
2% 2%
6%
17%
35%
21%
13%
0%
5%
10%
15%
20%
25%
30%
35%
40%
1 -StronglyDisagree
2 3 NeitherAgree norDisagree
5 6 7 -Strongly
Agree
27%
12%
26%
41%
0%
5%
10%
15%
20%
25%
30%
35%
40%
45%
Savings or investments Debt counseling Taking out a mortgage ora loan
Received professionaladvice at least once
36
Figure 9. Trust in financial professionals
How strongly do you agree or disagree with the following statements? –I would trust financial professionals and
accept what they recommend
Note: Percentages calculated over a sample of 4,924 observations from the 2009 NFCS. Percentages do not add up
to 100% because “don’t know” and “prefer not to say” answers are excluded.
Figure 10. Perceived cost of financial professionals
How strongly do you agree or disagree with the following statement? Financial professionals
are too expensive for me.
Note: Percentages calculated over a sample of 4,924 observations from the 2009 NFCS. Percentages do not add up
to 100 percent because “don’t know” and “prefer not to say” answers are excluded.
6% 5%
10%
32%
22%
12%
7%
0%
5%
10%
15%
20%
25%
30%
35%
1 - StronglyDisagree
2 3 Neither Agreenor Disagree
5 6 7 - StronglyAgree
4%3%
5%
21%
14%16%
29%
0%
5%
10%
15%
20%
25%
30%
35%
1 - StronglyDisagree
2 3 NeitherAgree norDisagree
5 6 7 - StronglyAgree
37
Figure 11. Difficulty in finding the right professional
How strongly do you agree or disagree with the following statements? It is hard to find the right
financial professional for me.
Note: Percentages calculated over a sample of 4,924 observations from the 2009 NFCS. Percentages do not add up
to 100% because “don’t know” and “prefer not to say” answers are excluded.
5% 4%6%
37%
13%10%
12%
0%
5%
10%
15%
20%
25%
30%
35%
40%
1 - StronglyDisagree
2 3 NeitherAgree norDisagree
5 6 7 - StronglyAgree

38
Appendix
Financial literacy questions
(**indicates correct answer)
1. Suppose you had $100 in a savings account and the interest rate was 2% per year. After 5
years, how much do you think you would have in the account if you left the money to grow?
o More than $102 ** o Exactly $102 o Less than $102 o Do not know o Refuse to answer
2. Imagine that the interest rate on your savings account was 1% per year and inflation was 2%
per year. After 1 year, how much would you be able to buy with the money in this account?
o More than today o Exactly the same o Less than today ** o Do not know o Refuse to answer
3. Please tell me whether this statement is true or false. “Buying a single company’s stock
usually provides a safer return than a stock mutual fund.”
o True o False ** o Do not know o Refuse to answer
4. A 15-year mortgage typically requires higher monthly payments than a30-year mortgage, but
the total interest paid over the life of the loan will be less.
o True ** o False o Do not know o Prefer not to say
5. If interest rates rise, what will typically happen to bond prices?
o They will rise o They will fall ** o They will stay the same o There is no relationship between bond prices and the interest rates o Do not know o Prefer not to say