financial analysis prime bank
TRANSCRIPT

7/28/2019 Financial Analysis PRIME BANK
http://slidepdf.com/reader/full/financial-analysis-prime-bank 1/21
“Financial Analysis”Prime Bank
Prepared For:
Anju-man-ara begum.Course Instructor
Money and Banking.
Course Code:
Prepared By:
Kazi Mohammad Maruf -ID.2002210000067Istiak Syeed Jenny-ID.2002210000081
A.B.M Khairul Alam Titash -ID.2002210000077
A.T.M Rashadul Karim Rana –ID.2002210000056
----------------------------
2nd Batch
Section-B
Date of submission -

7/28/2019 Financial Analysis PRIME BANK
http://slidepdf.com/reader/full/financial-analysis-prime-bank 2/21
25th August 2005
Anju-man ara
Course Instructor School of Business Studies
Southeast University
Dhaka.
Madam,
I am a student of school of Business Studies. I am about to complete the “ Banking ”
Course. Under this course I have done this financial analysis on Prime Bank. I haveworked hard to complete this term paper successfully. Today I am going to submit this
paper.
Yours truly
…………………
On Behalf of the Group

7/28/2019 Financial Analysis PRIME BANK
http://slidepdf.com/reader/full/financial-analysis-prime-bank 3/21
ACKNOWLEDGEMENT
We with due respect and honors, appreciate the help of our course
instructor of Banking Anju Man Ara. We must honestly say that it was
absolutely impossible for Us to complete this financial analysis without
your proper guidance and also very much thankful to you as he
provided with the information about the different banking functions,
services and others for the term paper financial analysis of Prime Bank.
We also like to thank our fellow classmate who gave us all the support
and once again thanks our madam for expending your valuable time for
us.

7/28/2019 Financial Analysis PRIME BANK
http://slidepdf.com/reader/full/financial-analysis-prime-bank 4/21
Origin
In this semester,fall 2006, we enrolled ourselves in the course Banking. This course has
a requirement for a Term paper. To fulfill this requirement of this course, we have
prepared this Term paper on financial analysis on Prime Bank as our Term paper’s topic.
Rationale of the Study
As a part of course Banking, we had the opportunity to prepare this term paper. The
reason for choosing this topic is we would like to expose the different features of our Course outline and by this we hope that we will be able to introduce ourselves about the
different banking system, functions and services. To full fill this purpose we have made
an effort to study thoroughly about the whole financial operations and transactions on
Prime Bank.
Objective of the study
As a student of Bachelor of business studies, we need in depth knowledge about the
different financial transaction of banks and other financial institutions. This study will
help us to learn about the different banking system, functions and operations. It will also
give us a clear idea about the different money and capital market instruments and will
increase our knowledge about the different aspects of financial transactions of banks and
other financial institutions.

7/28/2019 Financial Analysis PRIME BANK
http://slidepdf.com/reader/full/financial-analysis-prime-bank 5/21
Methodology
All the information has been collected from the Secondary source of information. We
have visited the SEU Library, collected annual report on Prime Bank,
Discussion paper, and web sites.
Limitations
Although we have tried to collect detailed information about Prime Bank and tried to give
proper information about the financial position and risk of the bank, but still we believe
that there might be some lacking in the secondary information/annual report of banks
financial reporting. So we could not collect all the factual material in a row.

7/28/2019 Financial Analysis PRIME BANK
http://slidepdf.com/reader/full/financial-analysis-prime-bank 6/21
Risk Analysis of Prime Bank
Year 2001 2002 2003 2004
Total Assets1573694250
32004770351
22424913064
23236161678
8
Cash asset 938096330 1366744576 1133517980 2247699221
Government securities 1601432100 1931233000 2633114400 2972210900
Total Shareholders Equity 1258263495 1526408120 1781863568 2239801912
Total Loans and advances 9074941476
1268684533
0
1649222440
5
2321967330
5
Total Deposits
1310987340
2
1617228788
0
2048322552
1
2806924265
0
Market Value of share 409.5 307.51 374.25 879.5
Number of shares outstanding 5000000 6000000 10000000 10000000
Net income After Tax 482985103 418144625 375455477 611938344
Earnings per Share 96.5970206 69.69077083 37.5455477 61.1938344
Dividend Paid 120000000 150000000 120000000 154000000
Annual Dividend Per Share 24 25 12 15.4
Credit Risk
Ratio of total loans to Total deposits 69.22% 78.45% 80.52% 82.72%
Liquidity Risk
Loans and advances to Total asset 57.67% 63.28% 68.01% 71.75%
Cash and Govt.Securiries to total assets 16.14% 16.45% 15.53% 16.13%
Market Risk
Price Earning Ratio 4.239261185 4.412492448 9.967892944 14.37236298
Dividend ratio 0.058608059 0.081298169 0.032064128 0.017509949
Earning Risk
Return on Asset(ROA) 3.07% 2.09% 1.55% 1.89%
Return on Equity(ROE) 38.39% 27.39% 21.07% 27.32%
Solvency Risk
Ratio of Equity capital to Total
Assets 8.00% 7.61% 7.35% 6.92%
CURRENT
MARKET
POSITION

7/28/2019 Financial Analysis PRIME BANK
http://slidepdf.com/reader/full/financial-analysis-prime-bank 7/21
TABLE OF CONTENT
1. INTRODUCTION
a. Brief history of Primes Bank 1-2
b. Current market position 3c. Function of banks 4
2. RESEARCH METHODOLOGY
a. Rationale of study 5
b. Objective of study 6c. Data collection Method 7
d. Limitation of study 8
3. ANALYSIS AND FINDINGS
A. Performance Evaluation
Return on asset 9
Return on equity 10
Net interest margin 11 Net non-interest margin 12
Employee productive ratio 13
Asset utilization 14
B. Risk Analysisa. Credit risk 15 b. Liquidity risk 16
c. Market risk 17
d. Earnings risk 18e. Solvency risk 19
4.CONCLUSION 20

7/28/2019 Financial Analysis PRIME BANK
http://slidepdf.com/reader/full/financial-analysis-prime-bank 8/21
APPENDIX
BACKGROUND OF PRIME BANK
Accordingly, Prime Bank Ltd. was created and commencement of business started on17th April 1995. The sponsors are reputed personalities in the field of trade and
commerce and their stake ranges from shipping to textile and finance to energy etc.
As a fully licensed commercial bank, Prime Bank Ltd. is being managed by a highly
professional and dedicated team with long experience in banking. They constantly focus
on understanding and anticipating customer needs. As the banking scenario undergoes
changes so is the bank and it repositions itself in the changed market condition.
Prime Bank Ltd. has already made significant progress within a very short period of its
existence. The bank has been graded as a top class bank in the country through
internationally accepted CAMEL rating. The bank has already occupied an enviable
position among its competitors after achieving success in all areas of business operation.
Prime Bank Ltd. offers all kinds of Commercial Corporate and Personal Banking
services covering all segments of society within the framework of Banking Company Act
and rules and regulations laid down by our central bank. Diversification of products and
services include Corporate Banking, Retail Banking and Consumer Banking right from
industry to agriculture, and real state to software.
The bank has consistently turned over good returns on Assets and Capital. During the
year 2004, the bank has posted an operating profit of Tk. 1146.14 million and its capital
funds stood at Tk 2476.06 million. Out of this, Tk. 1000 million consists of paid up
capital by shareholders and Tk. 1476.06 million represents reserves and retained
earnings. The bank’s current capital adequacy ratio of 10.74% is in the market and much
above the stipulated line of 9%. In spite of complex business environment and default
culture, quantum of classified loan in the bank is very insignificant and stood at less than
1.52%.

7/28/2019 Financial Analysis PRIME BANK
http://slidepdf.com/reader/full/financial-analysis-prime-bank 9/21
In order to retain competitive edge, investment in technology is always a top agenda and
under constant focus. Keeping the network within a reasonable limit, our strategy is to
serve the customers through capacity building across multi delivery channels.
PERFORMANCE ANALYSIS
RETURN ON ASSET (ROA)
The Return on asset of Prime bank for the year 2004 is,
Return on asset = Net income after tax / Total asset
= 611938344/32361616788
= 1.89%
The return on asset of prime bank 1.89% means if the Bank Tk.100 asset then it can
generate 1.89taka net income or the prime banks Tk.100 asset can generate Tk.1.89 netincome. In the same way we can calculate the other years ROA of Prime Bank . After
calculating all of the Prime banks ROA for the year of 2001,2002 &2003 we get 3.75%,
2.09% &1.55%. If we plot all the ROA
values according to the Y-axis and years
according to the X-axis then we will get the
Graphical figure of ROA for Prime bank.
But higher ROA indicates higher net income
in comparison to the total asset of a bank or
Proper asset utilization and lower ROA
indicates lower Net income in comparison to
the total asset or poor asset utilization. From
the Graph it is clearly understandable that the ROA of prime bank in 2001 was very high
3.07%
2.09%
1.55%
1.89%
0.00%
0.50%
1.00%1.50%
2.00%
2.50%
3.00%
3.50%
2001 2002 2003 2004
RETURN ON ASSET 2001 2002
7/28/2019 Financial Analysis PRIME BANK
http://slidepdf.com/reader/full/financial-analysis-prime-bank 10/21
(3.07%) But in 2002(2.09%) and 2003(1.55%) it takes a declining trend in its ROA ratio.
But in the year 2004 we can see that the ROA of prime bank is raising which indicates
that the banks net income in comparison to its total asset is raising or the Bank used its
assets much effectively than the other years.
RETURN ON ASSET (ROA)
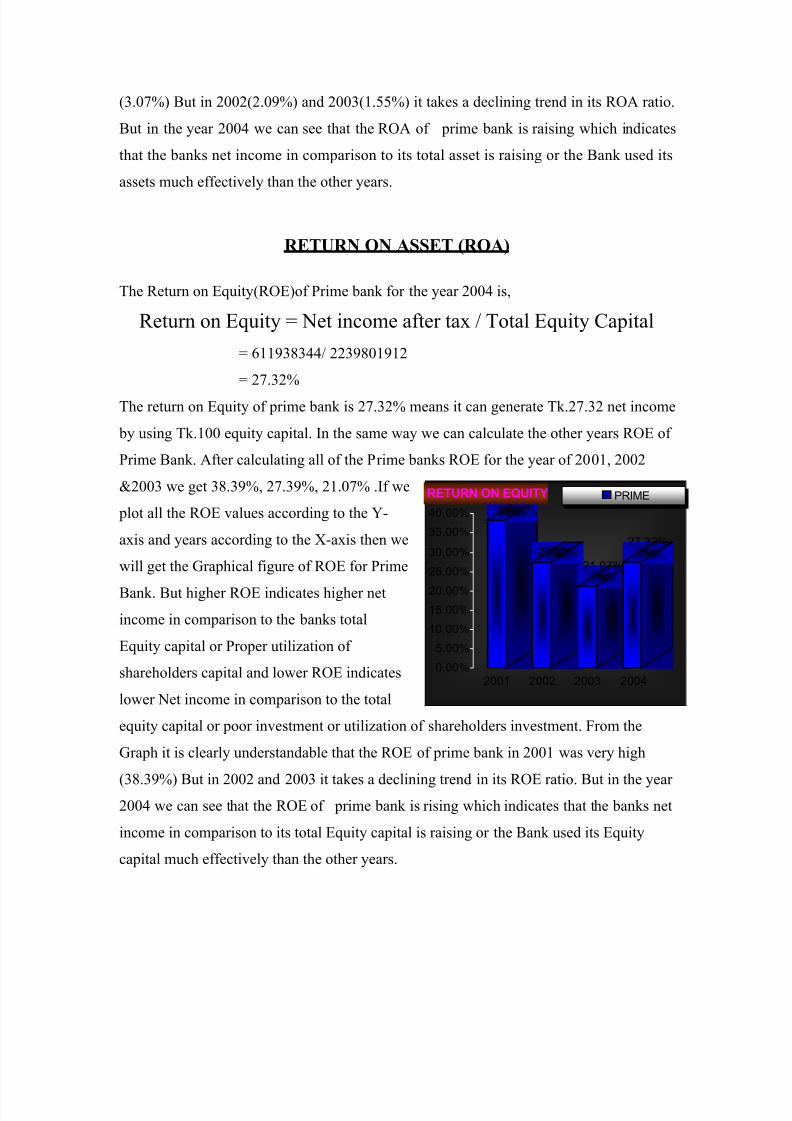
The Return on Equity(ROE)of Prime bank for the year 2004 is,
Return on Equity = Net income after tax / Total Equity Capital
= 611938344/ 2239801912
= 27.32%
The return on Equity of prime bank is 27.32% means it can generate Tk.27.32 net income
by using Tk.100 equity capital. In the same way we can calculate the other years ROE of
Prime Bank. After calculating all of the Prime banks ROE for the year of 2001, 2002
&2003 we get 38.39%, 27.39%, 21.07% .If we
plot all the ROE values according to the Y-
axis and years according to the X-axis then we
will get the Graphical figure of ROE for Prime
Bank. But higher ROE indicates higher net
income in comparison to the banks total
Equity capital or Proper utilization of
shareholders capital and lower ROE indicates
lower Net income in comparison to the total
equity capital or poor investment or utilization of shareholders investment. From the
Graph it is clearly understandable that the ROE of prime bank in 2001 was very high
(38.39%) But in 2002 and 2003 it takes a declining trend in its ROE ratio. But in the year 2004 we can see that the ROE of prime bank is rising which indicates that the banks net
income in comparison to its total Equity capital is raising or the Bank used its Equity
capital much effectively than the other years.
38.39%
27.39%
21.07%
27.32%
0.00%
5.00%
10.00%
15.00%
20.00%
25.00%
30.00%
35.00%
40.00%
2001 2002 2003 2004
RETURN ON EQUITY PRIME

7/28/2019 Financial Analysis PRIME BANK
http://slidepdf.com/reader/full/financial-analysis-prime-bank 11/21
NET INTEREST MARGIN The net interest margin of Prime bank for the year 2004 is,
(Interest income from loans and Securities
Net Interest Margin (NIM) = – Interest Expenses on Deposits and other Debts)
Total asset
2640910158 +196150200 - 1616184117
= ------------------------------------------------------32361616788
= 0.037726058
The Prime banks net interest Margin
0.033726058 means that the bank can
generate Tk.0.033726058 net interest
income by utilizing Tk.1 Asset.
In this way by calculating the NIM of
prime bank for the year 2001,2002 &
2003 we can get 0.04021,0.034 &
0.039 . Now,If we plot all the NIM values according to the Y-axis and years according to
the X-axis then we will get the Graphical figure of NIM for Prime Bank.
0.04021
0.03471
0.0391
0.03773
0.03
0.032
0.034
0.036
0.038
0.04
0.042
2000 2001 2002 2004
NET INTEREST MARGIN 2000 20012002 2004

7/28/2019 Financial Analysis PRIME BANK
http://slidepdf.com/reader/full/financial-analysis-prime-bank 12/21
NET NON-INTEREST INCOME
The Net-Non Interest Margin of Prime bank for the year 2004 is,
Net Noninterest Margin (NNIM) = (Noninterest Revenues – Noninterest Expenses)
Total Assets
= (749489244 – 824227141) / 32361616788
=0.002309461
The Prime banks net Non-interest
Margin -0.002309461 means that the
banks Non-interest expense is higher
than its Non-interest income.
In this way by calculating the NIM of
prime bank for the year 2001, 2002 &
2003 we can get 0.00784, 0.002596 &
0.002195. Now, if we plot all the
NNIM values according to the Y-axis and years according to the X-axis then we will get
the Graphical figure of NNIM for Prime Bank.
NET NON INTEREST MARGIN
0.00784 0.002596 0.002195
-0.00231
-100%
-80%
-60%
-40%
-20%
0%
20%
40%
60%
80%
100%
2001 2002 2003 2004
2001 2002 2003 2004
7/28/2019 Financial Analysis PRIME BANK
http://slidepdf.com/reader/full/financial-analysis-prime-bank 13/21
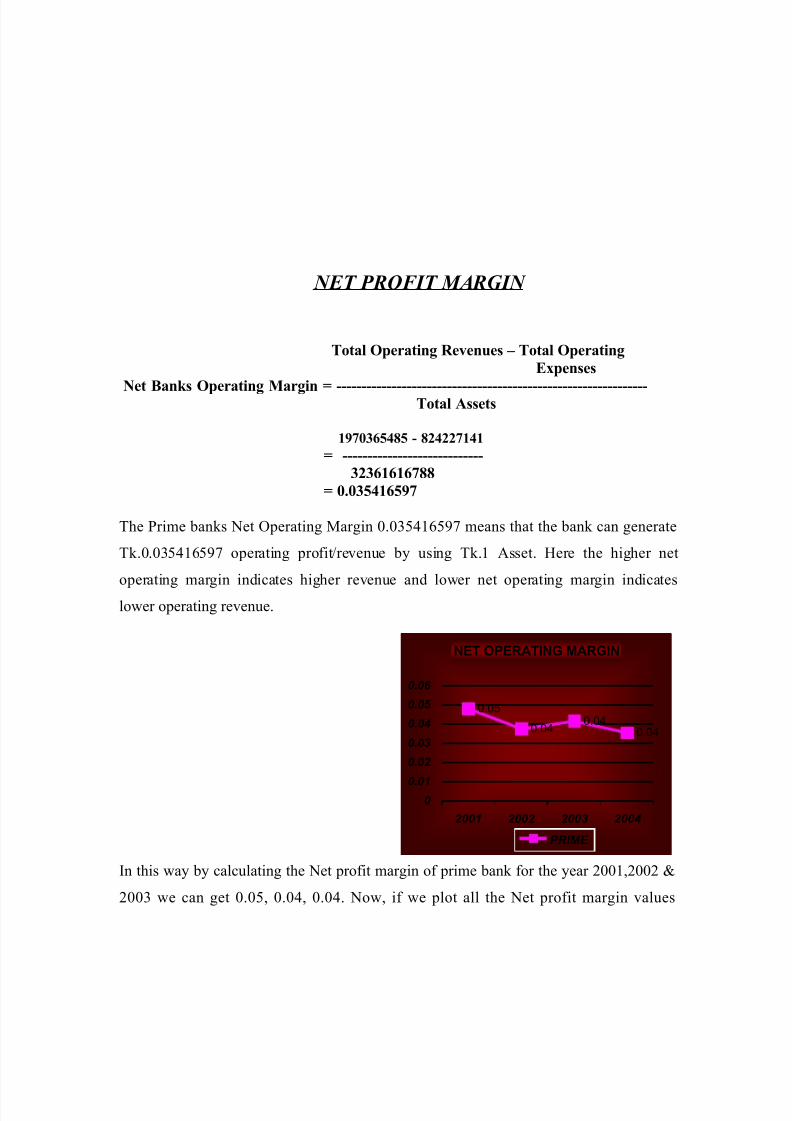
NET PROFIT MARGIN
Total Operating Revenues – Total Operating
Expenses
Net Banks Operating Margin = --------------------------------------------------------------Total Assets
1970365485 - 824227141
= ----------------------------
32361616788
= 0.035416597
The Prime banks Net Operating Margin 0.035416597 means that the bank can generate
Tk.0.035416597 operating profit/revenue by using Tk.1 Asset. Here the higher net
operating margin indicates higher revenue and lower net operating margin indicates
lower operating revenue.
In this way by calculating the Net profit margin of prime bank for the year 2001,2002 &
2003 we can get 0.05, 0.04, 0.04. Now, if we plot all the Net profit margin values
NET OPERATING MARGIN
0.05
0.040.04
0.04
0
0.01
0.02
0.03
0.04
0.05
0.06
2001 2002 2003 2004
PRIME

7/28/2019 Financial Analysis PRIME BANK
http://slidepdf.com/reader/full/financial-analysis-prime-bank 14/21
according to the Y-axis and years according to the X-axis then we will get the Graphical
figure of Net operating margin for Prim Bank.
ASSET UTILIZATION RATIO
The degree of asset utilization of Prime bank for the year 2004 is,
Asset Utilization = Total Operating Revenue / Total asset
= 1970365485 / 32361616788
= 0.060885879
The Prime banks degree of asset utilization or asset utilization ratio 0.06088 means that
the bank can generate Tk.0.060885879 operating profit/revenue by using Tk.1 Asset.
Here the higher ratio of asset utilization
indicates higher revenue and lower rate of
asset utilization indicates lower revenue.
In this way by calculating the degree of asset of prime bank for the year 2001,2002 &
2003 we can get 0.07, 0.06, 0.06 . Now, if we plot all the asset utilization values
according to the Y-axis and years according to the X-axis then we will get the Graphical
figure of degree of asset utilization for Prime Bank
ASSET UTILIZATION RATIO
0.07
0.06
0.07
0.06
5%
6%
6%
7%
7%
8%
2001 2002 2003 2004
PRIME
7/28/2019 Financial Analysis PRIME BANK
http://slidepdf.com/reader/full/financial-analysis-prime-bank 15/21
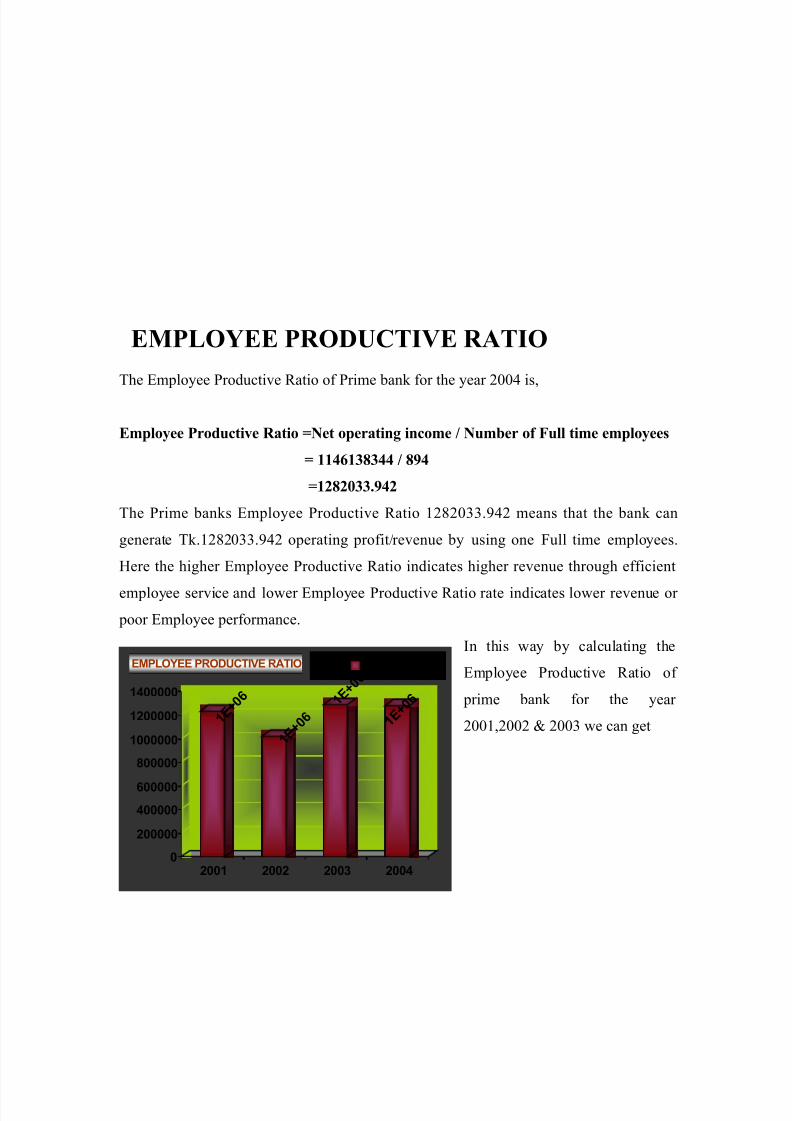
EMPLOYEE PRODUCTIVE RATIO
The Employee Productive Ratio of Prime bank for the year 2004 is,
Employee Productive Ratio =Net operating income / Number of Full time employees
= 1146138344 / 894
=1282033.942
The Prime banks Employee Productive Ratio 1282033.942 means that the bank can
generate Tk.1282033.942 operating profit/revenue by using one Full time employees.
Here the higher Employee Productive Ratio indicates higher revenue through efficient
employee service and lower Employee Productive Ratio rate indicates lower revenue or
poor Employee performance.
In this way by calculating the
Employee Productive Ratio of
prime bank for the year
2001,2002 & 2003 we can get 1 E + 0 6
1 E + 0 6
1 E + 0 6
1 E + 0 6
0
200000
400000
600000
800000
1000000
1200000
1400000
2001 2002 2003 2004
EMPLOYEE PRODUCTIVE RATIO ÿ /

7/28/2019 Financial Analysis PRIME BANK
http://slidepdf.com/reader/full/financial-analysis-prime-bank 16/21
1233422.1,1024444.7&1288816.5 . Now, if we plot all the
Employee Productive Ratio according to the Y-axis and years
according to the X-axis then we will get the Graphical figure of
degree of asset utilization for Prime Bank.
CREDIT RISK
RATIO OF TOTAL LOAN TO TOTAL DEPOSIT
The ratio of total loans to deposits of prime bank for the year 2004 is,
Total loans
Ratio of Total Loans to Total Deposits = --------------------
Total deposits
= 23219673305/28069242650
=82.72%
The ratio of total loans to total deposits of Prime bank 82.72% means that prime bank is
issuing Tk.82.72 loans against Tk.100 deposits or if the prime banks have TK.100 deposit
then it gives Tk.82.72 in loan. In this
way we can Calculate and explain
explain the other years Ratio of total
loans to total deposits of prime bank.
69.22%
78.45%
80.52%82.72%
60.00%
65.00%
70.00%
75.00%
80.00%
85.00%
2001 2002 2003 2004
RATIO OF TOTAL LOANS TO TOTAL DEPOSITSPRIME

7/28/2019 Financial Analysis PRIME BANK
http://slidepdf.com/reader/full/financial-analysis-prime-bank 17/21
After calculating all of the Prime banks ratio of total loans to deposits for the year of
2001, 2002 &2003 we get 69.22%, 78.45%, 80.52%. If we plot all the ratios of total loans
to deposits according to the Y-axis and years according to the X-axis then we will get the
Graphical figure of total loans to deposits for Prime Bank. But ratio of total loans to
deposits indicates higher net income and risk of default and lower total loans to deposits
ratio indicates lower Net income or lower risk gives more loans or invest most of its
deposits as loans than DBBL.
LIQUIDITY RISK
LOANS AND ADVANCES TO TOTAL ASSET The ratio of loans and advances to total asset of prime bank for the year 2004 is,
Loans and Advances to Total Assets = Loans and advances/ Total assets
= 23219673305 / 32361616788
= 71.75%
The ratio of loans and advances to total deposits of Prime bank 71.75% means that prime
bank is issuing Tk.71.75 loans against Tk.100 total asset or if the prime banks have
TK.100 asset then it gives Tk.82.72 in loan. In this way we can Calculate and explain the
other years Ratio of loans and advances to total asset of Prime bank.
57.67%
63.28%68.01%
71.75%
0.00%
10.00%
20.00%
30.00%
40.00%
50.00%
60.00%
70.00%
80.00%
2001 2002 2003 2004
LOANS AND ADVANCES TO TOTAL
ASSET PRIME

7/28/2019 Financial Analysis PRIME BANK
http://slidepdf.com/reader/full/financial-analysis-prime-bank 18/21
After calculating all of the Prime banks ratio of loans and advances to total asset for the
year of 2001, 2002 &2003 we get 57.67%, 63.28%, 68.01%... If we plot all the ratios of
loans and advances to total asset according to the Y-axis and years according to the X-
axis then we will get the Graphical figure of total loans to deposits for Prime Bank. Here,
the higher ratio of loans and advances to total asset indicates higher interest income from
loans and advances and higher risk of loan default and lower ratio of loans and advances
to total asset indicates lower interest income from loans and d advances or lower risk of
loan default.
EARNINGS RISK
ROA &ROE
After analyzing the ROA of Prime bank and DBBl we can clearly say that the position of
prime bank in term of return on asset is higher than DBBl which means that the prime
banks net income is higher than the than the net income of DBBL in comparison to its
total asset or the prime bank is more capable of generating higher revenue than DBBL.
But if we look at the Graph of ROE of DBBl then we will see that from 2001 to 2004 the
banks ROE is declining which indicates that the banks net income is decreasing or poor
utilization of shareholders equity.
So, after analyzing the ROA & ROE of Prime bank and DBBl we can clearly say that the
position of prime bank in term of return on Equity or Asset is higher than DBBl which
means that the prime banks net income is higher than the than the net income of DBBL incomparison to its total Equity capital/Asset or the prime bank is more capable of
generating higher revenue than DBBL. But as we know when there is higher return there
is higher risk. So, prime banks earning risk is higher than DBBL

7/28/2019 Financial Analysis PRIME BANK
http://slidepdf.com/reader/full/financial-analysis-prime-bank 19/21
SOLVENCY RISK
RATIO OF EQUITY CAPITAL TO TOTAL ASSET
The ratio of equity capital to total asset of Prime bank for the year 2004 is,
Ratio of equity capital to risk assets = Equity Capital/ Total Assets
= 2239801912 / 32361616788
= 6.92%
The ratio of equity capital to total asset of Prime bank 6.92% means that prime bank is
issuing Tk.82.72 loans against Tk.100 asset or if the prime banks have TK.100 depositthen it gives Tk.82.72 in loan. In this way
we can Calculate and explain the other
years Ratio of equity capital to total asset
of prime bank.
After calculating all of the Prime banks
ratio of equity capital to total asset for the
year of 2001, 2002 &2003 we get 8.00%,
7.61%, 7.35%. If we plot all the ratios of
equity capital to total asset according to
the Y-axis and years according to the X-axis then we will get the Graphical figure of
equity capital to total asset for Prime Bank. But higher ratio of equity capital to total asset
8.00%
7.61%
7.35%
6.92%
6.20%
6.40%
6.60%
6.80%
7.00%
7.20%
7.40%
7.60%
7.80%
8.00%
2001 2002 2003 2004
RATIO OF EQUITY TO TOTAL ASSET PRIME
7/28/2019 Financial Analysis PRIME BANK
http://slidepdf.com/reader/full/financial-analysis-prime-bank 20/21
indicates higher safe investment and profitability lower equity capital to total asset ratio
indicates lower risk
CONCLUSION
After analyzing the ROA & ROE of Prime bank and DBBl we can clearly say that the net
prime bank is higher which means the prime bank is more capable of generating higher
revenue than DBBL. But as we know when there is higher return there is higher risk. So,
prime banks earning risk is higher than DBBL Also the prime banks average Net interest
& Non-interest income is higher than the Dutch bangla bank. That why although the
prime bank is earning more interest from their loans but it is also in a higher risk of loan
default then the DBBL. So, the prime bank is in a higher credit risk and liquidity risk than
DBBl. But the liquidity risk of DBBl is lower than prime bank because they have enough
liquid assets in hand to meet short-term obligations than prime bank. Investing in prime
bank is more profitable and also risky for shareholders because of higher market value of
shares.
So, at last we have to say that in this case we need to do an portfolio investment means
investing in both the banks which will minimize the investment risk and will ensure more
safe return.

7/28/2019 Financial Analysis PRIME BANK
http://slidepdf.com/reader/full/financial-analysis-prime-bank 21/21