financial analysis of the financial statements and
TRANSCRIPT
COLEGIO UNIVERSITARIO DE ESTUDIOS FINANCIEROS
Trabajo de Fin de Grado
Financial Analysis of the Financial Statements and Industry
Comparison:
THE COCA-COLA COMPANY and PEPSICO
Bilingual Degree in Business and Management
Author: Errandonea Ochoa de Zabalegui, Juan
Tutor: Rivero Menéndez, María José
Madrid, April 25th, 2019
2
INDEX
1. INTRODUCTION......................................................................... 3
1.1 TFG justification and objective ........................................... 3
1.2 Companies history ............................................................... 3
1.3 Non-alcoholic beverages sector analysis and trends ........ 4
1.4 Tax reform act ...................................................................... 7
2. METHODOLOGY ........................................................................ 8
3. BALANCE SHEET AND INCOME STATEMENT ANALYSIS ... 10
3.1 Horizontal analysis............................................................. 10
3.2 Vertical analysis ................................................................. 13
4. RATIOS AND CASH FLOW ANALYSIS ................................... 15
4.1 Activity ratios ..................................................................... 16
4.2 Profitability ratios ............................................................... 18
4.3 Solvency and debt ratios ................................................... 24
4.4 Liquidity ratios ................................................................... 30
4.5 Cash flow analysis ............................................................. 36
5. CONCLUSIONS........................................................................ 36
6. BIBLIOGRAPHY....................................................................... 40
7. GRAPHICS AND TABLES INDEX ............................................ 42
3
1. INTRODUCTION
1.1 TFG Justification and Objective
This world improves with competition. Competing allows individuals and
organizations to be better, more efficient, and smarter. When one company
competes with another for market share and profit, they both learn from each
other and improve together. This is the basis of the choice to analyze the
financial statements of The Coca-Cola company, commonly known as “Coca-
Cola”, and PepsiCo, known as “Pepsi”. Both companies have some similarities,
starting from the time they were created and going on to their unique way of
selling their drinks. Both companies have grown together, but they have also
used different strategies to expand. By comparing their balance sheets and
income statements, it is expected to find be many differences, on which will be
commented and studied. These differences will show how their growth model is
working, their stability, their future expectations, and their inefficiencies —as it is
expected to find inefficiencies in both companies.
1.2 Company Histories
The Coca-Cola company and PepsiCo have been huge rivals throughout the
years. This rivalry started seven years after the creation of Coca-Cola, which took
place in 1886 by pharmacist John S. Pemberton, when Pepsi was created by
another pharmacist, Caleb Bradham.
At first Pepsi was sold in drugstores as a drink for aiding digestion but, as the
years went by, it began being sold as a drink for people to enjoy (Bellis 2018)
(Bhasin 2013). Pepsi went bankrupt in 1923 for “gambling on sugar prices” (they
believed that prices were going to rise, so they purchased an excessive amount
of sugar). In 1931 Pepsi was sold to Loft Candy Co, but it was still not selling
enough, and it was even offered to Coca-Cola during the Great Depression. Loft
Candy’s president, Guth, reformulated the soda and the sales strategy and
suddenly Pepsi was being sold again. In the 1960’s Pepsi reformulated their
strategy and acquired Mountain Dew. Later that decade, Pepsi merged with Frito-
Lay to become what is now known today as PepsiCo. Since then, Pepsi has been
launching new products and has grown to be a bigger and more stable company
than Coca-Cola through their market diversification (Tikkanen, Enciclopaedia
Britannica s.f.).
4
On the other hand, Coca-Cola was first sold in a soda fountain — a very popular
place for social gatherings at that time, usually close to an apothecary — as a
drink to cure ailments. In 1888 its creator, Pemberton, died, but not before selling
the company to Asa Griggs Candler who, by 1892, acquired the company and
incorporated it as The Coca-Cola Company. In 1919, Coca-Cola was sold to a
group of investors that began selling the beverages for home consumption. The
post-World War II years saw diversification in the packaging of Coca-Cola and
the development and acquisition of new products. The trademark “Coke,” first
used in advertising in 1941, was registered in 1945. In 1946 the company
purchased rights to Fanta, a soft drink previously developed in Germany, and to
the lemon-lime drink, Sprite, in 1961. Since then, Coca-Cola has acquired various
different beverages from the same sector — non-alcoholic beverages. In 1981,
Roberto C. Goizueta became chairman of the board of directors and CEO of
Coca-Cola. Goizueta organized the various U.S. Coca-Cola bottling operations
into a new public company, Coca‑Cola Enterprises Inc. Coca-Cola has become
one of the most recognizable brands and trademarks in the world. With over 1.7
billion servings of Coca-Cola products being served each day, Coca-Cola
continues to be one of the world’s most ubiquitous beverages (Tikkanen,
Enciclopaedia Britannica s.f.) (Yafai 2016).
The beginnings of the Coca-Cola company and Pepsi have not differed too
greatly, one of the many reasons why nowadays, the companies still fight for a
position in the marketplace.
1.3 Non-Alcoholic Beverages Sector Analysis and Trends
The non-alcoholic beverages sector includes mainly soft drinks and hot drinks,
such as water, carbonated drinks, juices, tea, coffee, etc. Companies in the soft
drink industry reach the end market in two ways. One way is by selling finished
products, made at company-owned bottling facilities, to distributors and retailers.
Another way is by selling beverage concentrates and syrups to authorized
bottling partners, who then make the final product by combining the concentrates
with still or carbonated water, sweeteners, and other ingredients. Coca-Cola and
Pepsi use both ways to reach the final costumer. These two companies
particularly have an incredible pricing power and can also produce and distribute
third-party brands.

5
The global soft drink market is led by carbonated soft drinks (or CSDs), which
had a market size of $337.8 billion in 2013. In the same year, CSDs were followed
by bottled water, with a market size of $189.1 billion, and juice, with a market size
of $146.2 billion. In this market there are different companies competing, the main
competitors are: The Coca-Cola company, PepsiCo, Dr Pepper Snapple Group,
Monster Beverage Corporation, and Cott Corporation. Coca-Cola and Pepsi are
part of the consumer staple sector, which is essentially composed of products
that people are unlikely to stop buying regardless of their financial situation, such
as beverages, tobacco, producers of non-durable goods, and personal products.
Products like this are considered to be less sensitive to economic cycles. (Fidelity
s.f.) (Bailey, Market Realist 2014) (Bailey, Market Realist 2014)
The term soft drink originated to distinguish the flavored drinks from hard liquor
or distilled spirits. Soft drinks were recommended as a substitute in the effort to
change the hard-drinking habits of early Americans. In fact, health concerns of
modern consumers led to new categories of soft drinks emphasizing low calorie
count, low sodium content, no caffeine, and “all natural” ingredients.
The regular consumption of soft drinks has been associated with multiple chronic
health conditions. These increased risks are largely due to the added ingredients
in soft drinks, especially sugar. Indeed, some sugar-sweetened soft drinks
contain 40 grams of sugar or more per 12-ounce serving, which exceeds the
recommended daily sugar intake for adults. Long-term consumption of soft drinks
is linked to weight gain, obesity, and tooth decay. Sugar-free soft drinks also have
been associated with dental erosion. Concerns about the negative health effects
of soft drinks have given rise to debate about legally restricting their consumption
through soda bans, increased soda taxes, and other regulatory measures. In
January 2014 Mexico became one of the first countries to impose a nationwide
revenue-raising tax on soft drinks containing added sugar. Later that year
Berkeley, California, became the first city in the United States in which voters
unanimously approved a tax on sugary drinks. In 2015, a ban on the sale of
caffeinated soft drinks to children went into effect in the Vologda region of Russia.
That same year authorities in San Francisco approved a measure that would
require soft drink manufacturers to add health warnings to soft drink labels, similar
to the health warnings displayed on labels for alcohol and tobacco products. As
it can be seen, governments form different countries are realizing of the health

6
issues that CSDs bring and acting toward this, but is not only the governmental
institutions realizing this, people have started to realize this too and carbonated
drinks consumption has been decreasing. On the other hand, bottled water,
ready-to-drink coffee, and energy drinks are increasing their volume sales.
(Pietka 2019) (Beverage Marketing Corporation 2015) (Beverage Marketing
Corporation 2017)
Category Millions of gallons CAGR
Bottled Water 4898 4.50%
RTD Tea 514 3.60%
Energy Drinks 350 7.50%
Sport Drinks 183 1.30%
Bvalue-Added Water 100 1.80%
RTD Coffee 94 11.20%
Fruit Beverages -759 -2.20%
CSD -2382 -1.80%
Total 2998 0.90%
U.S volume decade comparison from 2007-2017
Table 1- U.S volume decade comparison from 2007-2017
As it can be seen in this graph, from the Beverage Marketing Corporation about
volume sales from 2007 to 2017 in U.S (the largest CSD consumer country),
CSDs have decreased greatly in the last 10 years, giving rise to bottled water,
which have increased their sales the most, expanding to 4898 more gallons sold
in 2017 than in 2007.
Lastly, in general, overall revenues in the non-alcoholic beverages sector have
been decreasing as well.

7
Table 2- Industry revenue growth from 2014-2017
As it can be seen in this graph, for the last two years analyzed in this paper,
2016 and 2017, the non-alcoholic beverages industry has been decreasing, and
for the last four years, from 2014-2017, there has been no growth in the
industry.
1.4 Tax Reform Act
The tax cuts and jobs act, or TCJ, is a regulatory reform that was imposed by the
new Republican government at the end of 2017 and affected most international
American companies. The TCJ act made several significant changes not only to
companies, but also to households. As it also affected the results of Coca-Cola
and Pepsi for 2017, it is this these aspects that are going to be analyzed.
Essentially, the U.S government made profit repatriation more attractive for
companies by establishing a tax of 15.5% for a onetime repatriation of cash, while
the tax for other non-cash assets was also reduced to 8%. Before, the tax rate
for profits returned to U.S was at 35%, which led many companies to keep the
money that the country generated for a future reinvestment in that country or in
any other one. This meant that U.S didn’t get back some of the money from profits
out of the country. According to The Coca-Cola Company, in their income
statement: “The tax reform act includes net tax expense of $3,610 million
primarily related to our reasonable estimate of the one-time transition tax
resulting from the Tax Reform Act that was signed into law on December 22,
-2.47%
-1.62%
3.22%
0.06%
-3.00%
-2.00%
-1.00%
0.00%
1.00%
2.00%
3.00%
4.00%
2017 2016 2015 2014
INDUSTRY REVENUE GROWTH

8
2017, partially offset by the impact of the lower rate introduced by the Tax Reform
Act on our existing deferred tax balances.” While for Pepsi: “During the fourth
quarter of 2017, the TCJ Act was enacted in the United States. Among its many
provisions, the TCJ Act imposed a mandatory one-time transition tax on
undistributed international earnings and reduced the U.S. corporate income tax
rate from 35% to 21%, effective January 1, 2018. As a result of the enactment of
the TCJ Act, we recognized a provisional net tax expense of $2.5 billion in the
fourth quarter of 2017.” (Bartash 2018) (PepsiCo Inc 2017) (The Coca-Cola
Company 2017).
For the non-alcoholic beverage sector in the fourth quarter of 2017 the effective
industry tax rate was 76% due to this measure, while the average for the past
years had been 25.6%. (CSI market s.f.).
By reading this it can be concluded that the cause of a lower net income in the
year 2017 for Coca-Cola and Pepsi is due to an increase in taxes that year and
that year’s tax increase in both companies was, in particular, due to the TCJ act
that gave an incentive to both companies to repatriate their profits held in other
countries. For Coca-Cola, the TCJ act supposed 53.5% of the total profit before
taxes, while for Pepsi it supposed a net 25.5%. These numbers added to the
other taxes that Coca-Cola and Pepsi had to pay added to total tax rate of 82.5%
and 48.9% respectively.
2. METHODOLOGY
This project is going to be based on the analysis of the financial statements of
Coca-Cola and Pepsi. The initial step was to find the income statements and
balance sheets of both companies from the year 2014 to the year 2017. Using
this information, a horizontal and vertical analysis will be conducted to analyze
these statements. After this first analysis the balance sheet and income
statement information together with the sector information will be used to
calculate different types of ratios that will help to understand both companies’
financial statements. In particular, four types of ratios: Activity ratios, Profitability
ratios, Solvency ratios, and Liquidity ratios. Both companies’ ratios by themselves
can be compared to each other, but cannot be used to evaluate each company’s
performance in reality. As a result, these ratios will also be compared to those of
the non-alcoholic beverages industry, which will be a measurement benchmark

9
and aid in seeing how the companies are performing compared to their industry.
As well, the root of the differences between the companies and the industry will
also be discussed. To generate the non-alcoholic beverages industry ratios the
following companies where used:
New Age Beverages, Corp.
Attitude Drinks, Inc.
Mojo Data Solutions, Inc.
Healthient, Inc.
Coca-Cola Enterprises, Inc.
Celsius Holdings, Inc.
Coca-Cola Consolidated, Inc.
Cott, Corp.
China Ginseng Holdings, Inc.
Dewmar International Bmc, Inc.
Fbec Worldwide, Inc.
Keuring Dr Pepper, Inc.
Satusa, Corp.
Fbec Worldwide, Inc.
National Beverage, Corp.
Life on earth, Inc.
Right on brands, Inc.
Jammin Java, Corp.
Jones Soda, Co.
Coca Cola, Co.
KonaRed, Corp.
Leading Brands, Inc.
Long Blockchain, Corp.
Mojo Data Solutions, Inc.
Monster Beverage, Corp.
Mojo Organics, Inc.
Musclepharm, Corp.
New Age Beverages, Corp.
Peets Coffee & Tea, Inc.

10
PepsiCo, Inc.
Pulse Beverage, Corp.
Reddy Ice Holdings, Inc.
Reeds, Inc.
Rocky Mountain High Brands, Inc.
Sport Endurance, Inc.
Skinny Nutritional Corp.
Smartag International, Inc.
High Performance Beverages Co.
True Drinks Holdings, Inc.
Uplift Nutrition, Inc.
Vim Beverage, Inc.
Diageo Plc.
Ambev S.a.
Table 3- Companies used to generate non-alcoholic beverage industry ratios
The next step will be analyzing the cash flow statement of both companies.
Once finished, final conclusions will be drawn based on the companies and sector
analysis.
3. BALANCE SHEET AND INCOME STATEMENT ANALYSIS 3.1 Horizontal Analysis
The horizontal analysis is used in financial statement analyses to compare
historical data over a number of accounting periods. It’s done by performing a
comparative analysis between the financial statements of every year, comparing
them with the year before statements. This way, the increase from year to year
in each statement can be obtained. The results will show the relevant tendencies.
There are different ways of performing a horizontal analysis, but in this case, the
calculation of the percentage variance of each year, using 2014 as a benchmark
for the rest of the years, is going to be done. In essence, the changes of every
year in respect to 2014 are going to be seen. Therefore, to do the horizontal
analysis the years statements needs to be divided by the initial year statement —
2014. (Merchante 2011) (Jerry Weygandt s.f.) (C. William Thomas s.f.) (Kenton
2018)
THE COCA-COLA COMPANY (% change)

11
INCOME STATEMENT 2017 2016 2015 2014
Net Revenue 77.0% 91.0% 96.3% 100.0%
(Cost of goods sold) 74.1% 92.0% 97.7% 100.0%
Gross profit 78.8% 90.4% 95.4% 100.0%
(operating expenses) 80.7% 90.9% 89.8% 100.0%
EBIT 75.0% 89.3% 106.9% 100.0%
(Interests and taxes) 267.4% 80.3% 118.0% 100.0%
Net income 17.6% 92.0% 103.6% 100.0%
Table 4- Coca-Cola income statement horizontal analysis
As seen above, there is a general and constant decline from the year 2015 to the
year 2016, and from the year 2016 to the year 2017, in almost every part of the
income statement. There is a small decline in taxes from 2015 to 2016 when
revenues are decreasing. But the most important change comes in 2017, when
net income decreases to become 17.6% of the net income that there was in 2014.
When looked at more closely, it can be noticed that in the same year, interests
and taxes increase by more than 250%, which is the main cause of such an
incredible decline in net income. This large increase in interests and taxes is
related, in particular, to new regulatory changes that the United States
government set in 2017, as was explained in section 1.4.
THE COCA-COLA COMPANY (% change)
BALANCE SHEET 2017 2016 2015 2014
Total assets 95.52% 94.83% 97.90% 100.00%
Non-current assets 86.98% 90.21% 96.04% 100.00%
Current assets 110.79% 103.10% 101.24% 100.00%
Equity + Liabilities 95.52% 94.83% 97.90% 100.00%
Equity 62.10% 75.98% 84.30% 100.00%
Non-current liabilities 143.44% 128.98% 128.57% 100.00%
Current liabilities 84.00% 81.95% 83.18% 100.00%
Table 5- Coca-Cola balance sheet horizontal analysis
In the case of the balance sheet, Coca-Cola has stability on the asset side and a
clear growth on external financing (liabilities), while internal financing (equity)
decreases. Most of the increase in liabilities is in long-term liabilities, which
increase by almost 50% from 2014 to 2017. In terms of assets, non-current assets
increase while current assets decrease.
PEPSICO (% change)

12
INCOME STATEMENT 2017 2016 2015 2014
Net Revenue 95.26% 94.18% 94.56% 100.00%
(Cost of goods sold) 93.20% 91.34% 93.03% 100.00%
Gross profit 97.04% 96.62% 95.88% 100.00%
(operating expenses) 92.42% 94.61% 99.06% 100.00%
EBIT 109.69% 102.13% 87.18% 100.00%
(Interests and taxes) 184.22% 112.65% 94.56% 100.00%
Net income 74.57% 97.17% 83.71% 100.00%
Table 6- Pepsi income statement horizontal analysis
Pepsi’s income statement shows more stability than Coca-Cola’s, as revenues
slowly decrease, expenses do the same. Again, everything is completely normal
until the net income of the year 2017 which, again, shows a big decrease. This
decrease is not as big as in Coca-Cola’s case, but it can be clearly seen that the
cause is the same as interest and taxes almost double in 2017. This has to do
with the policy change explained in this paper in section 1.4. Other than this, the
only other important change is the increase in EBIT from 2015 to 2016, while the
revenues stay the same, which later leads to a higher net income in 2016. This
is due to a cost reduction in 2016, as operating expenses and cost of goods sold
(COGS) are both lower that year.
PEPSICO (% change)
BALANCE SHEET 2017 2016 2015 2014
Total assets 113.18% 104.23% 98.81% 100.00%
Non-current assets 97.86% 94.37% 93.56% 100.00%
Current assets 150.16% 128.01% 111.46% 100.00%
Equity + Liabilities 113.18% 104.23% 98.81% 100.00%
Equity 62.58% 63.82% 68.55% 100.00%
Non-current liabilities 138.58% 118.03% 114.88% 100.00%
Current liabilities 113.32% 116.82% 97.16% 100.00%
Table 7- Pepsi balance sheet horizontal analysis
In the balance sheet, it can be seen that, like in Coca-Cola’s case, Current assets
and non-current liabilities increase, but in this case, non-current assets and
current liabilities stay stable over time. This means that this increase is through a
decrease in equity and an overall growth in assets and liabilities. These new
assets are mostly financed with non-current liabilities, which increase by almost
40% since 2015.

13
3.2 Vertical Analysis
A vertical analysis consists of transforming the numbers in percentages of the
total or initial amount of each of the different statements, this way we will see the
weight of each statement over the total amount. Essentially, a benchmark will be
set, that in the case of the income statement will be sales, and in the case of the
balance sheet it will be the total amount of assets or liabilities and equity. The
rest of the financial statements will be compared to their benchmark, being the
result, the statement divided by the benchmark. In the vertical analysis the
objective is to compare the statements within the same year to see how much of
the total percentage of sales, assets and liabilities and equity they account for.
(Merchante 2011) (Jerry Weygandt s.f.) (C. William Thomas s.f.) (kenton 2019)
THE COCA-COLA COMPANY
INCOME STATEMENT 2017 2016 2015 2014
Net Revenue 100.00% 100.00% 100.00% 100.00%
(Cost of goods sold) 37.44% 39.33% 39.47% 38.89%
Gross profit 62.56% 60.67% 60.53% 61.11%
(operating expenses) 43.06% 41.02% 38.30% 41.08%
EBIT 19.50% 19.65% 22.23% 20.03%
(Interests and taxes) 15.98% 4.06% 5.64% 4.60%
Net income 3.52% 15.59% 16.60% 15.43%
Table 8- Coca-Cola income statement vertical analysis
Coca-Cola’s income statement mainly shows that there is stability through the
years on the COGS, being about 1/3 of the company’s revenue. Operating
expenses account for a bit more than COGS, being around 40% of the revenues,
and lastly interests and taxes account for 5% approximately, the net income being
around 15% of the revenues of Coca-Cola. Again, in this case, it can be seen
how in 2017, interests and taxes account for 15% of the total revenue due to the
policy changes of the United States government explained in earlier.
THE COCA-COLA COMPANY

14
BALANCE SHEET 2017 2016 2015 2014
Total assets 100.00% 100.00% 100.00% 100.00%
Non-current assets 58.42% 61.03% 62.93% 64.15%
Current assets 41.58% 38.97% 37.07% 35.85%
Equity + Liabilities 100.00% 100.00% 100.00% 100.00%
Equity 21.59% 26.61% 28.60% 33.21%
Non-current liabilities 47.47% 42.99% 41.51% 31.61%
Current liabilities 30.94% 30.40% 29.89% 35.18%
Table 9- Coca-Cola balance sheet vertical analysis
Coca-Cola’s balance sheet shows how current assets get closer to non-current
assets, which in 2014 were almost 2/3 of the total assets. In the case of equity
and liabilities, equity only accounts for 1/3 of total equity and liabilities in year
2014 and, after a constant decrease, 25% in 2017, while non-current liabilities
account for almost 50% in the year 2017. It can be seen how equity, non-current
liabilities and current liabilities are almost the same amount in the year 2014 and
how only four years after, the weight of the three variables is completely different.
PEPSICO
INCOME STATEMENT 2017 2016 2015 2014
Net Revenue 100.00% 100.00% 100.00% 100.00%
(Cost of goods sold) 45.31% 44.92% 45.56% 46.31%
Gross profit 54.69% 55.08% 54.44% 53.69%
(operating expenses) 38.14% 39.50% 41.19% 39.32%
EBIT 16.54% 15.58% 13.25% 14.37%
(Interests and taxes) 8.90% 5.50% 4.60% 4.60%
Net income 7.65% 10.08% 8.65% 9.77%
Table 10- Pepsi income statement vertical analysis
In this case, it can clearly be seen that Pepsi has a much bigger COGS than
Coca-Cola, but their operating expenses, interest, and taxes amount for more or
less the same percentage of sales than Coca-Cola. This explains how Pepsi’s
net income is not so different from Coca-Cola’s while Coca-Cola’s revenues are
clearly lower than Pepsi’s. Again, in 2017 the effect of the regulatory change
explained in section 1.4 can be seen.
PEPSICO

15
BALANCE SHEET 2017 2016 2015 2014
Total assets 100.00% 100.00% 100.00% 100.00%
Non-current assets 61.12% 64.01% 66.94% 70.69%
Current assets 38.88% 35.99% 33.06% 29.31%
Equity + Liabilities 100.00% 100.00% 100.00% 100.00%
Equity 13.76% 15.24% 17.27% 24.89%
Non-current liabilities 60.55% 56.00% 57.50% 49.45%
Current liabilities 25.69% 28.76% 25.23% 25.66%
Table 11- Pepsi balance sheet vertical analysis
Pepsi’s balance sheet vertical analysis distribution is quite different from Coca-
Cola’s. Pepsi’s current assets are generally lower than Coca-Cola’s, while their
Non-current assets are a bit higher, but just like in Coca-Cola’s case, current
assets increase through the years while non-current assets decrease. The big
differences with Coca-Cola come from the equity and liabilities side. Pepsi’s
equity is much smaller than Coca-Cola’s, but again, the liabilities and equity
trends also follow Coca-Cola’s trends. Due to these differences between both
balance sheet’s vertical analysis it can be determined that Pepsi’s long-term
financing strategy is mostly through external funding (long-term liabilities) while
Coca-Cola relies more on internal investors (equity) but both companies are
going towards external funding since 2014, which in essence is being done by
decreasing their equity and increasing their non-current liabilities.
4. RATIOS AND CASH FLOW ANALYSIS
After doing the vertical and horizontal analysis, this paper is going to analyze
different ratios, these ratios will help analyze particular aspects of the balance
sheet and income statement that are not possible to see solely with the horizontal
and vertical analysis. The ratios, in particular, will not be revealing but the
comparison between the two companies’ ratios and industry ratios will reveal
important information about the companies. These ratios will also reveal
important tendencies. Is important to bear in mind that although ratios are meant
to be used to compare companies and industries, the dimension factor is not fully
neutralized. The importance of the ratios result will also be influenced by how big
the statement’s amount in the balance sheet or income statement are and how
much it varies each year. Small variable amounts cannot determine a trend
successfully while large, not variable amounts, can.

16
4.1 Activity Ratios
Activity ratios measure a firm's ability to convert different accounts within its
balance sheets into cash or sales, in essence, evaluating the quality of the
different capital components. Activity ratios measure the relative efficiency of a
firm based on its use of assets, leverage, or other similar balance sheet
statements. They are important in determining whether a company's
management is doing a good job or not at the time of generating revenues and
cash from its resources. Activity ratios measure the amount of resources invested
in a company’s collection and inventory management, determining an
organizations efficiency and profitability (Keaton 2019).
• Assets Turnover Ratio will measure how efficiently an entity uses its
assets to make a sale. It’s used to evaluate the quality of the investments
the company has or the quality of the total assets. It compares the sales
of a company to its asset base and will express the frequency by which
the assets are renewed. The higher the result is the more return the
company is earning with their investments and the less assets this
company will need to generate revenue, which will mean less debt and
equity required to generate revenue. To calculate this ratio, sales will be
divided by assets. (Jerry Weygandt s.f.)
Table 12- Asset turnover ratio
0.40
0.48 0.49 0.50
0.800.85
0.91 0.95
0.590.65
0.89
0.69
0.00
0.10
0.20
0.30
0.40
0.50
0.60
0.70
0.80
0.90
1.00
2017 2016 2015 2014
ASSET TURNOVER RATIO
THE COCA-COLA COMPANY PEPSICO
NON-ALCOHOLIC BEVERAGES INDUSTRY

17
In this graph it is easy to see how Coca-Cola has a very low revenue
compared to their assets, the sector’s asset turnover ratio is clearly higher
every year, this means that Coca-Cola is not using their assets as well as
the sector and Pepsi are for production purposes. Pepsi is using their
assets better than the benchmark as their asset turnover ratio is the
highest one for every year.
• The Inventory turnover ratio measures the rate at which inventory is used
over a measurement period. In essence, how often the inventory balance
is sold during an accounting period. It can be used to see if a business has
an excessive inventory in comparison to its sales, which can be due to low
sales or bad inventory planning. Particularly a low turnover rate implies
that a business bought too many goods. A low turnover ratio will affect the
return. This ratio is calculated by dividing the COGS by the average
inventory. Inventory days is the number of days in which the company uses
its inventory, and therefore, the range of time in which they will have to
order new merchandise. (C. William Thomas s.f.) (Jerry Weygandt s.f.)
Table 13- Inventory turnover ratio
4.97
5.905.83
10.15 10.379.80
7.76
7.349.87
0.00
2.00
4.00
6.00
8.00
10.00
12.00
2017 2016 2015
INVENTORY TURNOVER RATIO
THE COCA-COLA COMPANY PEPSICO
NON-ALCOHOLIC BEVERAGES INDUSTRY

18
Table 14- Days inventory
In the above graph, it can be seen how Coca-Cola has an inventory
turnover ratio below the sector’s average every year, having the biggest
difference amount in 2015 and 2017. Pepsi’s inventory turnover ratio is
always above Coca-Cola’s and above the industry, which means that
Pepsi has had a good inventory planning and sells what they expect to sell
in the determined period, while Coca-Cola doesn’t.
4.2 Profitability Ratios
The general objective of a company is to maximize profits. The concept of
profitability is used to measure the profits obtained by the company in relative
terms of their costs, revenues, assets, equity... These ratios will indicate if the
company overall is doing well. (Sánchez 2012)
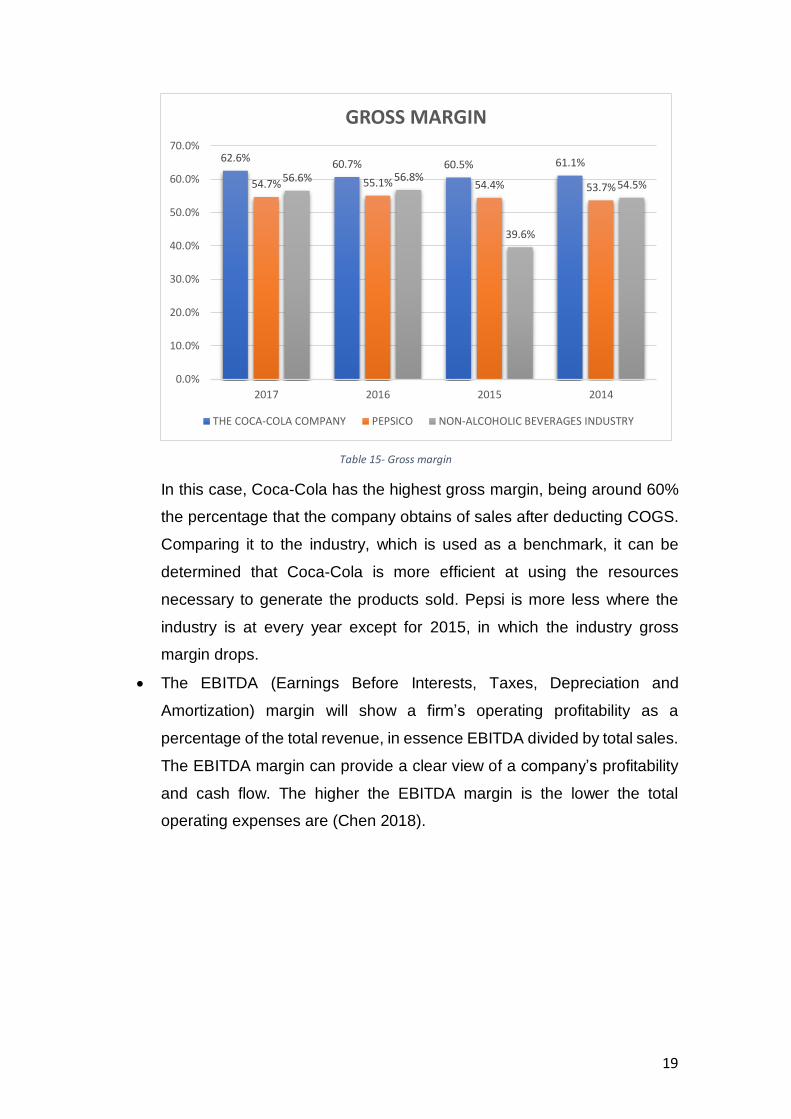
• The gross margin ratio will show the percentage of sales earned as gross
margin. The higher the gross margin rate, the higher the return the
company will have, and therefore, the lower the production costs are. This
ratio will measure the efficiency on the production. The ratio is calculated
by dividing gross margin, which is sales minus cost of goods sold (COGS)
by sales. (C. William Thomas s.f.) (Sánchez 2012)
73.38
61.82 62.66
35.95 35.21 37.24
47.04
49.73 36.98
0.00
10.00
20.00
30.00
40.00
50.00
60.00
70.00
80.00
2017 2016 2015
DAYS INVENTORY
THE COCA-COLA COMPANY PEPSICO
NON-ALCOHOLIC BEVERAGES INDUSTRY
19
Table 15- Gross margin
In this case, Coca-Cola has the highest gross margin, being around 60%
the percentage that the company obtains of sales after deducting COGS.
Comparing it to the industry, which is used as a benchmark, it can be
determined that Coca-Cola is more efficient at using the resources
necessary to generate the products sold. Pepsi is more less where the
industry is at every year except for 2015, in which the industry gross
margin drops.
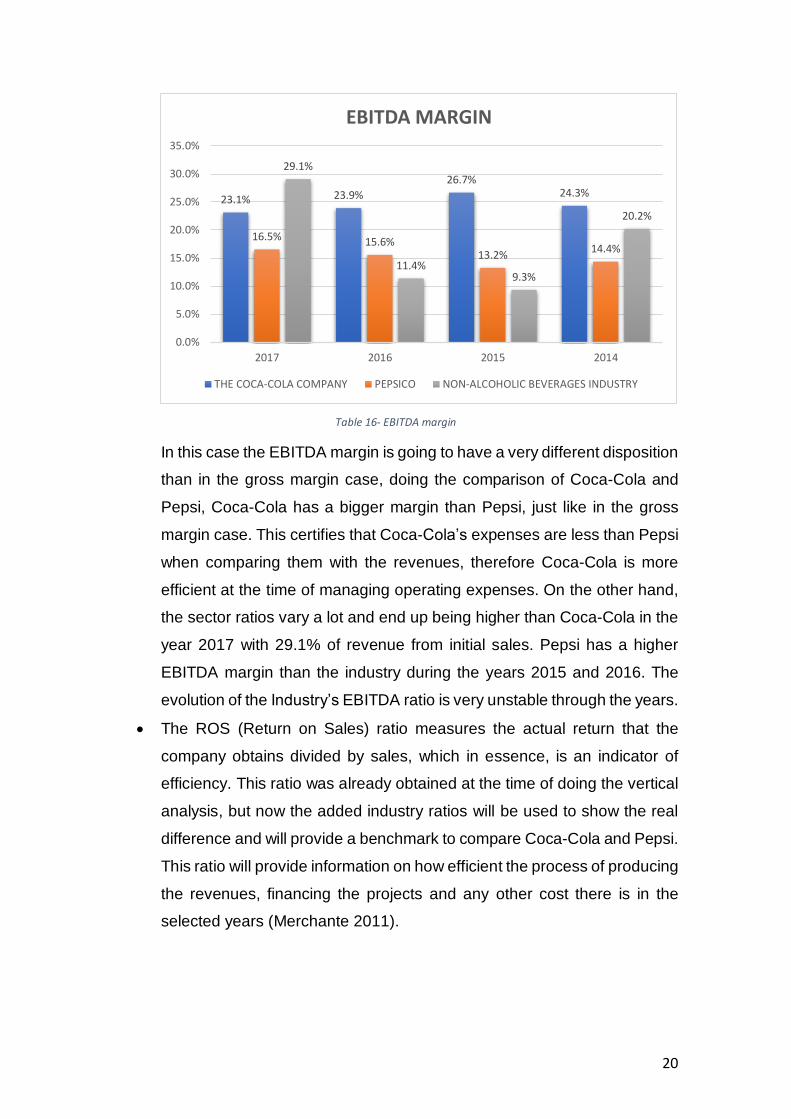
• The EBITDA (Earnings Before Interests, Taxes, Depreciation and
Amortization) margin will show a firm’s operating profitability as a
percentage of the total revenue, in essence EBITDA divided by total sales.
The EBITDA margin can provide a clear view of a company’s profitability
and cash flow. The higher the EBITDA margin is the lower the total
operating expenses are (Chen 2018).
62.6%60.7% 60.5% 61.1%
54.7% 55.1% 54.4% 53.7%56.6% 56.8%
39.6%
54.5%
0.0%
10.0%
20.0%
30.0%
40.0%
50.0%
60.0%
70.0%
2017 2016 2015 2014
GROSS MARGIN
THE COCA-COLA COMPANY PEPSICO NON-ALCOHOLIC BEVERAGES INDUSTRY
20
Table 16- EBITDA margin
In this case the EBITDA margin is going to have a very different disposition
than in the gross margin case, doing the comparison of Coca-Cola and
Pepsi, Coca-Cola has a bigger margin than Pepsi, just like in the gross
margin case. This certifies that Coca-Cola’s expenses are less than Pepsi
when comparing them with the revenues, therefore Coca-Cola is more
efficient at the time of managing operating expenses. On the other hand,
the sector ratios vary a lot and end up being higher than Coca-Cola in the
year 2017 with 29.1% of revenue from initial sales. Pepsi has a higher
EBITDA margin than the industry during the years 2015 and 2016. The
evolution of the Industry’s EBITDA ratio is very unstable through the years.
• The ROS (Return on Sales) ratio measures the actual return that the
company obtains divided by sales, which in essence, is an indicator of
efficiency. This ratio was already obtained at the time of doing the vertical
analysis, but now the added industry ratios will be used to show the real
difference and will provide a benchmark to compare Coca-Cola and Pepsi.
This ratio will provide information on how efficient the process of producing
the revenues, financing the projects and any other cost there is in the
selected years (Merchante 2011).
23.1% 23.9%
26.7%24.3%
16.5% 15.6%13.2%
14.4%
29.1%
11.4%9.3%
20.2%
0.0%
5.0%
10.0%
15.0%
20.0%
25.0%
30.0%
35.0%
2017 2016 2015 2014
EBITDA MARGIN
THE COCA-COLA COMPANY PEPSICO NON-ALCOHOLIC BEVERAGES INDUSTRY

21
Table 17- Return on sales
The Coca-Cola Company is the most efficient during the period 2014-2016
as the return on sales is higher than the industry and Pepsi. On 2017, the
effect of the tax reform act is shown and return on sales decrease a lot for
Coca-Cola and Pepsi but not for the sector as the company’s in the sector
are from a wide variety of countries and have different sizes. Coca-Cola’s
return on sales is over the benchmark, while Pepsi’s is, generally, slightly
under the industry, what means that Pepsi’s net income could be bigger if
a better management of costs was applied to their value chain.
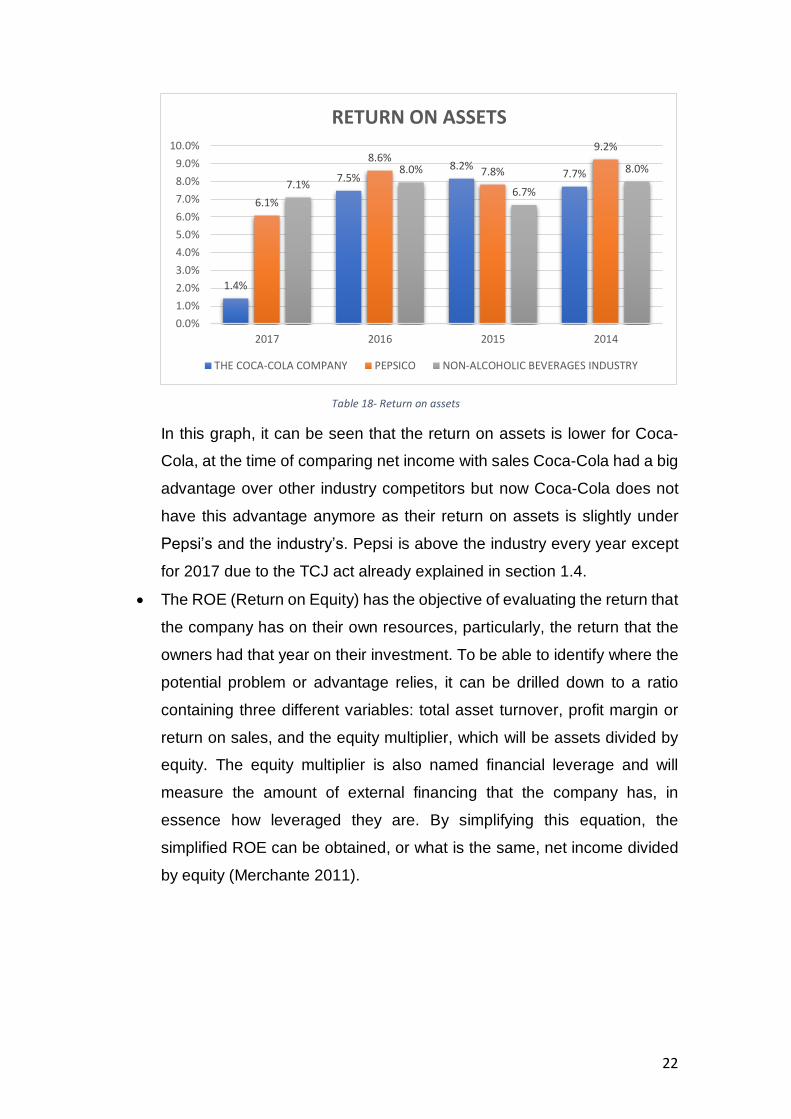
• The ROA (Return on Assets) ratio relates the benefit achieved with the
total amount of assets the company has. Is used to see the efficiency on
the use of a company’s assets to generate revenues independent on
where this financing comes from. To obtain this ratio net income has to be
divided by assets. (Jerry Weygandt s.f.)
3.5%
15.6%16.6%
15.4%
7.6%
10.1%8.6%
9.8%
12.0% 12.2%
7.5%
11.6%
0.0%
2.0%
4.0%
6.0%
8.0%
10.0%
12.0%
14.0%
16.0%
18.0%
2017 2016 2015 2014
RETURN ON SALES
THE COCA-COLA COMPANY PEPSICO NON-ALCOHOLIC BEVERAGES INDUSTRY
22
Table 18- Return on assets
In this graph, it can be seen that the return on assets is lower for Coca-
Cola, at the time of comparing net income with sales Coca-Cola had a big
advantage over other industry competitors but now Coca-Cola does not
have this advantage anymore as their return on assets is slightly under
Pepsi’s and the industry’s. Pepsi is above the industry every year except
for 2017 due to the TCJ act already explained in section 1.4.
• The ROE (Return on Equity) has the objective of evaluating the return that
the company has on their own resources, particularly, the return that the
owners had that year on their investment. To be able to identify where the
potential problem or advantage relies, it can be drilled down to a ratio
containing three different variables: total asset turnover, profit margin or
return on sales, and the equity multiplier, which will be assets divided by
equity. The equity multiplier is also named financial leverage and will
measure the amount of external financing that the company has, in
essence how leveraged they are. By simplifying this equation, the
simplified ROE can be obtained, or what is the same, net income divided
by equity (Merchante 2011).
1.4%
7.5%8.2%
7.7%
6.1%
8.6%7.8%
9.2%
7.1%
8.0%
6.7%
8.0%
0.0%
1.0%
2.0%
3.0%
4.0%
5.0%
6.0%
7.0%
8.0%
9.0%
10.0%
2017 2016 2015 2014
RETURN ON ASSETS
THE COCA-COLA COMPANY PEPSICO NON-ALCOHOLIC BEVERAGES INDUSTRY

23
Table 19- Return on equity
The return on equity graph shows how Pepsi has the highest ROE every
year. Coca-Cola is generally around the sector average, but it goes down
in the last year due to the regulatory reasons explained in section 1.4. It
can be concluded that Coca-Cola’s generates a lower return on their
owner’s investment than Pepsi does. Compared to the industry they are
generating a similar return, so this is not a problem for Coca-Cola, is an
advantage for Pepsi, as this means that Pepsi is more efficient at the time
of using their owners’ resources. This does not mean that Pepsi’s owners
will see a higher part of their investment on profits at the end of the year,
as this will depend on the retained earnings that the company decides to
keep and reinvest.
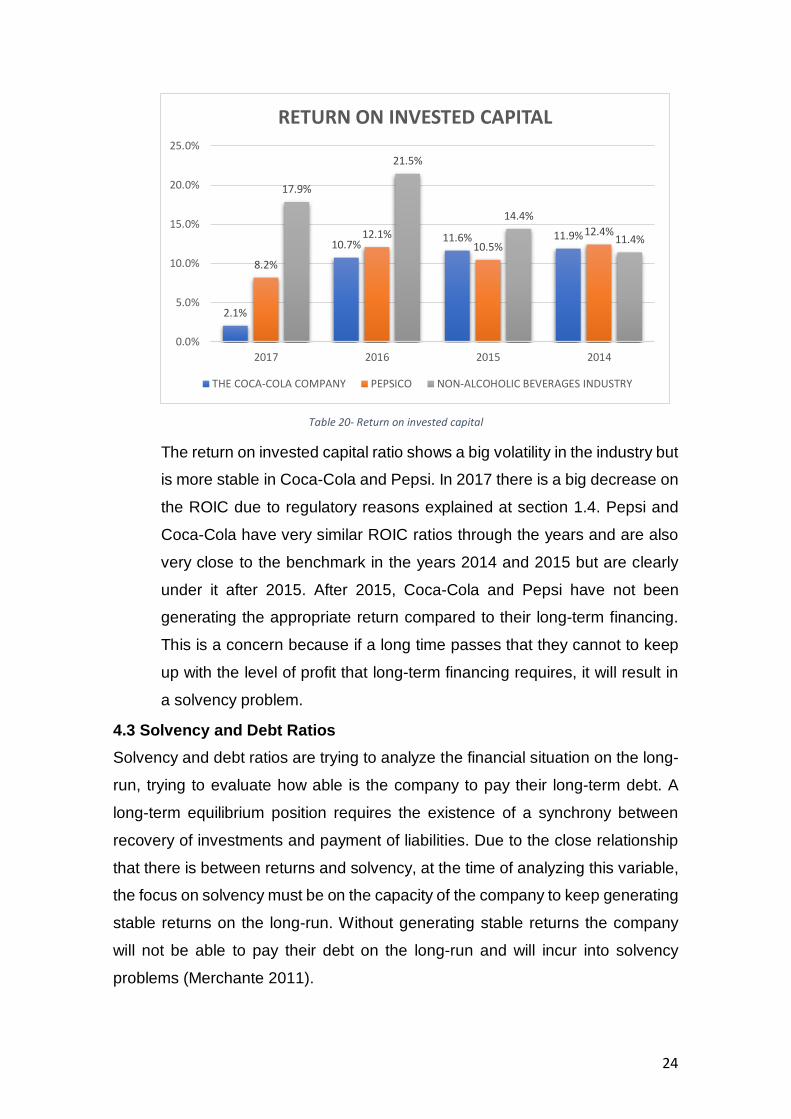
• The ROIC (Return on Invested Capital) ratio refers to the net income
generated during the period with the sources of financing of the company
on the long term (long term liabilities and equity). It is used to see the return
that the company is able to generate for their funders, partners and stable
financial creditors. Therefore, the ratio will be net income divided by the
sum of long-term debt and equity (Sanz 2014).
6.8%
28.2% 28.6%23.3%
44.2%
56.5%
45.3%
37.1%
28.8%32.3%
19.9%25.5%
0.0%
10.0%
20.0%
30.0%
40.0%
50.0%
60.0%
2017 2016 2015 2014
RETURN ON EQUITY
THE COCA-COLA COMPANY PEPSICO NON-ALCOHOLIC BEVERAGES INDUSTRY
24
Table 20- Return on invested capital
The return on invested capital ratio shows a big volatility in the industry but
is more stable in Coca-Cola and Pepsi. In 2017 there is a big decrease on
the ROIC due to regulatory reasons explained at section 1.4. Pepsi and
Coca-Cola have very similar ROIC ratios through the years and are also
very close to the benchmark in the years 2014 and 2015 but are clearly
under it after 2015. After 2015, Coca-Cola and Pepsi have not been
generating the appropriate return compared to their long-term financing.
This is a concern because if a long time passes that they cannot to keep
up with the level of profit that long-term financing requires, it will result in
a solvency problem.
4.3 Solvency and Debt Ratios
Solvency and debt ratios are trying to analyze the financial situation on the long-
run, trying to evaluate how able is the company to pay their long-term debt. A
long-term equilibrium position requires the existence of a synchrony between
recovery of investments and payment of liabilities. Due to the close relationship
that there is between returns and solvency, at the time of analyzing this variable,
the focus on solvency must be on the capacity of the company to keep generating
stable returns on the long-run. Without generating stable returns the company
will not be able to pay their debt on the long-run and will incur into solvency
problems (Merchante 2011).
2.1%
10.7%11.6% 11.9%
8.2%
12.1%10.5%
12.4%
17.9%
21.5%
14.4%
11.4%
0.0%
5.0%
10.0%
15.0%
20.0%
25.0%
2017 2016 2015 2014
RETURN ON INVESTED CAPITAL
THE COCA-COLA COMPANY PEPSICO NON-ALCOHOLIC BEVERAGES INDUSTRY

25
• The debt to equity ratio expresses the proportion that the liabilities have
over the companies own resources. The bigger this ratio is the bigger the
risk the creditors will have and the smaller the ratio is, the more risk the
company owners have. Its calculated by dividing equity by liabilities
(Merchante 2011).
Table 21- Debt to equity ratio
In this graph, it’s clear that both The Coca-Cola Company and PepsiCo
are above the industry average, one of the reasons is that these two
companies are the biggest in the sector and have more possibilities to get
funds from external creditors. In relation with the industry, a bigger part of
the risk is on creditors in Coca-Cola and Pepsi. In the case of Pepsi, the
risk for creditors is almost double that of Coca-Cola, as Coca-Cola’s equity
represents a larger percentage of their liabilities and equity.
• The interest coverage ratio is one way of evaluating the risk that creditors
are exposed to. This ratio compares the interests the company has paid
in the current accounting year with the EBIT (earnings before interest and
taxes). This way it’s possible to evaluate the capacity of the firm to be able
to pay the cost of debt with their yearly earnings. The lower this rate is, the
higher interests the company will be paying for their EBITDA. This ratio is
calculated by dividing EBITDA by interests (Merchante 2011).
3.63
2.762.50
2.01
6.27
5.56
4.79
3.02
0.18 0.21 0.13
1.30
0.00
1.00
2.00
3.00
4.00
5.00
6.00
7.00
2017 2016 2015 2014
DEBT TO EQUITY RATIO
THE COCA-COLA COMPANY PEPSICO NON-ALCOHOLIC BEVERAGES INDUSTRY

26
Table 22- Interest coverage ratio
The industry interest coverage ratio varies a lot through the years, being
at the beginning above both companies, in 2015 and 2016 under them,
and again, in 2017 above them. This means that Coca-Cola and PepsiCo
are paying more interest on their outstanding debt than the industry is. All
of the companies and the industry are above one, which means they
always have enough funds to pay for their interests. By analyzing the
graph, it can be concluded that Coca-Cola and Pepsi are generally
solvent, as they have stability through the years, but it is clear that the first
year was not good enough for them as the market clearly outperformed
them. It is important to consider that in Coca-Cola’s case, the company is
slowly having a decreasing interest coverage ratio every year, being
outscored by both the benchmark and Pepsi in 2017. If this trend keeps
going it will be very dangerous in the future and the company will have
serious solvency problems.
• The equity multiplier or financial leverage ratio measures the portion of a
company’s assets that are financed through equity. This ratio is used to
indicate the level of debt financing that the company has, a higher
multiplier indicates that a significant portion of a firm’s assets are financed
by debt, while a low multiplier shows that either the firm is unable to obtain
debt form lenders, or the managers are avoiding the use of debt to
purchase assets. It’s calculated by dividing assets by equity (Institute s.f.).
8.21
11.22 11.50
19.08
9.347.37
8.6710.6311.1
5.97 5.67
26.88
0.00
5.00
10.00
15.00
20.00
25.00
30.00
2017 2016 2015 2014
INTEREST COVERAGE RATIO
THE COCA-COLA COMPANY PEPSICO NON-ALCOHOLIC BEVERAGES INDUSTRY
27
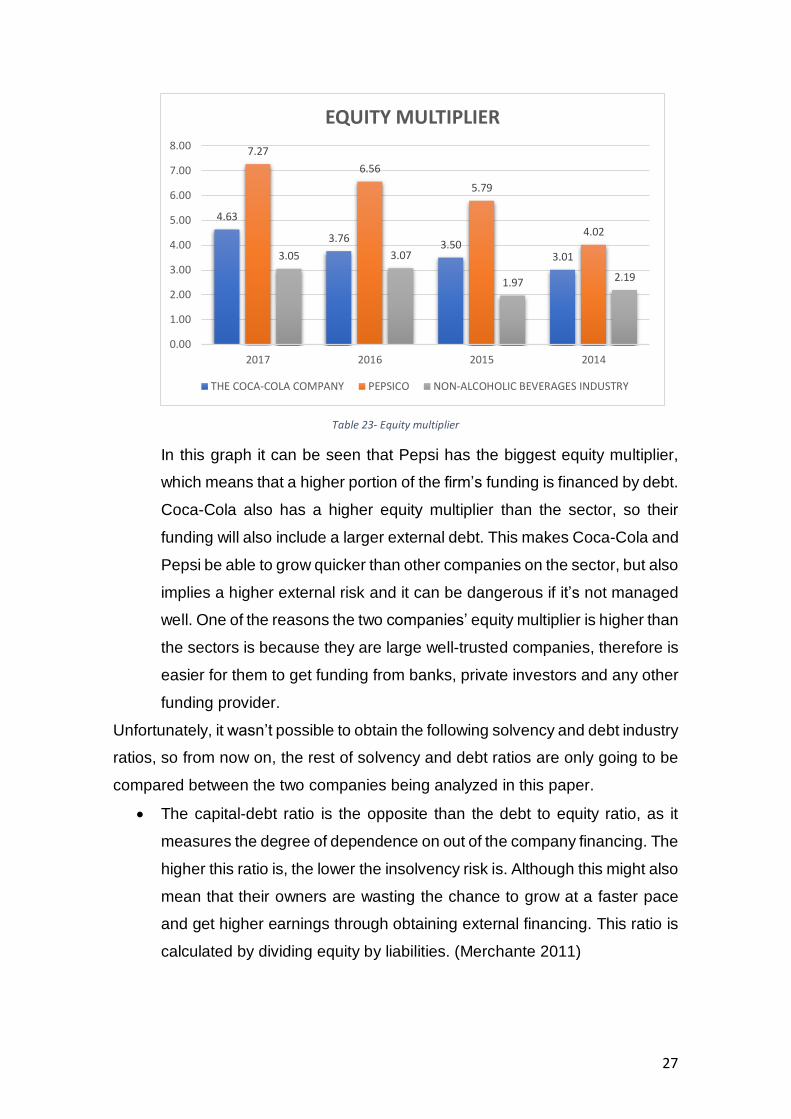
Table 23- Equity multiplier
In this graph it can be seen that Pepsi has the biggest equity multiplier,
which means that a higher portion of the firm’s funding is financed by debt.
Coca-Cola also has a higher equity multiplier than the sector, so their
funding will also include a larger external debt. This makes Coca-Cola and
Pepsi be able to grow quicker than other companies on the sector, but also
implies a higher external risk and it can be dangerous if it’s not managed
well. One of the reasons the two companies’ equity multiplier is higher than
the sectors is because they are large well-trusted companies, therefore is
easier for them to get funding from banks, private investors and any other
funding provider.
Unfortunately, it wasn’t possible to obtain the following solvency and debt industry
ratios, so from now on, the rest of solvency and debt ratios are only going to be
compared between the two companies being analyzed in this paper.
• The capital-debt ratio is the opposite than the debt to equity ratio, as it
measures the degree of dependence on out of the company financing. The
higher this ratio is, the lower the insolvency risk is. Although this might also
mean that their owners are wasting the chance to grow at a faster pace
and get higher earnings through obtaining external financing. This ratio is
calculated by dividing equity by liabilities. (Merchante 2011)
4.63
3.763.50
3.01
7.27
6.56
5.79
4.02
3.05 3.07
1.97 2.19
0.00
1.00
2.00
3.00
4.00
5.00
6.00
7.00
8.00
2017 2016 2015 2014
EQUITY MULTIPLIER
THE COCA-COLA COMPANY PEPSICO NON-ALCOHOLIC BEVERAGES INDUSTRY

28
Table 24- Capital debt ratio
In this graph is possible to see how Coca-Cola has a higher capital-debt
ratio, which in essence means that a bigger part of their funding is through
internal funding. Both companies’ capital-debt ratio is decreasing and has
decreased around 50%. This means that the two companies have been
growing through external financing in the last years.
• The long-term debt ratio or solvency long-term ratio expresses the
relationship between equity and long-term debt and is used to determine
the leverage that a business has taken on. Generally, if the value is high,
it means that the company is financing, with stable resources, their total
fixed structure. If the value is too high, however, it implies that the business
has a greater risk of bankruptcy, since it may not be able to pay for the
interest expense on debt if its cash flows decline, this tends to be a
problem in periods where interest rates are increasing or when the cash
flows of the company vary a lot. To calculate this ratio long-term debt has
to be divided by equity. (Bragg 2018)
0.28
0.360.40
0.50
0.16 0.180.21
0.33
0.00
0.10
0.20
0.30
0.40
0.50
0.60
2017 2016 2015 2014
CAPITAL-DEBT RATIO
THE COCA-COLA COMPANY PEPSICO

29
Table 25- Long term debt ratio
The graph shows how Coca-Cola and Pepsi have both been increasingly
financing their investments with long-term debt rather than equity. At the
beginning, Coca-Cola had a very low long-term debt ratio, which would
have compromised the company’s stability if short-term liabilities were too
high.
• The short-term debt ratio or solvency short-term ratio expresses the
relationship between equity and short-term debt, the higher this ratio is,
the lower chances of being able to pay their short-term debt interests the
company has. On the other hand, if this ratio is too low the company might
not be using their investment possibilities correctly which can mean a
lower growth rate. (Bragg 2018)
2.20
1.62 1.45
0.95
4.40
3.673.33
1.99
0.00
0.50
1.00
1.50
2.00
2.50
3.00
3.50
4.00
4.50
5.00
2017 2016 2015 2014
LONG-TEM DEBT RATIO
THE COCA-COLA COMPANY PEPSICO

30
Table 26- Short term debt ratio
In this case, Coca-Cola and Pepsi’s short-term debt ratio were the same
in 2014, but since 2014, Pepsi’s ratio has been growing at a faster pace
than Coca-Cola, which means higher current liabilities compared to their
equity.
4.4 Liquidity Ratios
The main objective of liquidity ratios is to evaluate the capacity of the company
to attend its liabilities on the short-run, conventionally the short-run is the period
up to twelve months, so liquidity ratios are basically evaluating the capacity of a
company to pay its debts in the following twelve months. There is not a rule that
states that a certain liquidity position is better than another, each company will
have an optimum level of liquidity that will depend on how their expenses and
earnings are structured. The best way to evaluate the level of liquidity is to
compare the company ratios to the industry ratios. An equilibrated short-term
financial position requires a correlation between the investments realized and the
funding sources used, so that the payments and the collections are always in the
same line.
• The working capital expresses the simplest relation between assets and
liabilities in the short-term. The higher the value of working capital is, the
lower the company’s liquidity risk is, but at the end, there is a lot of other
factors that come into play and will determine if the company is liquid.
Factors such as what are the current assets financed with or what are the
1.43
1.141.05 1.06
1.87 1.89
1.46
1.03
0.00
0.20
0.40
0.60
0.80
1.00
1.20
1.40
1.60
1.80
2.00
2017 2016 2015 2014
SHORT-TERM DEBT RATIO
THE COCA-COLA COMPANY PEPSICO
31
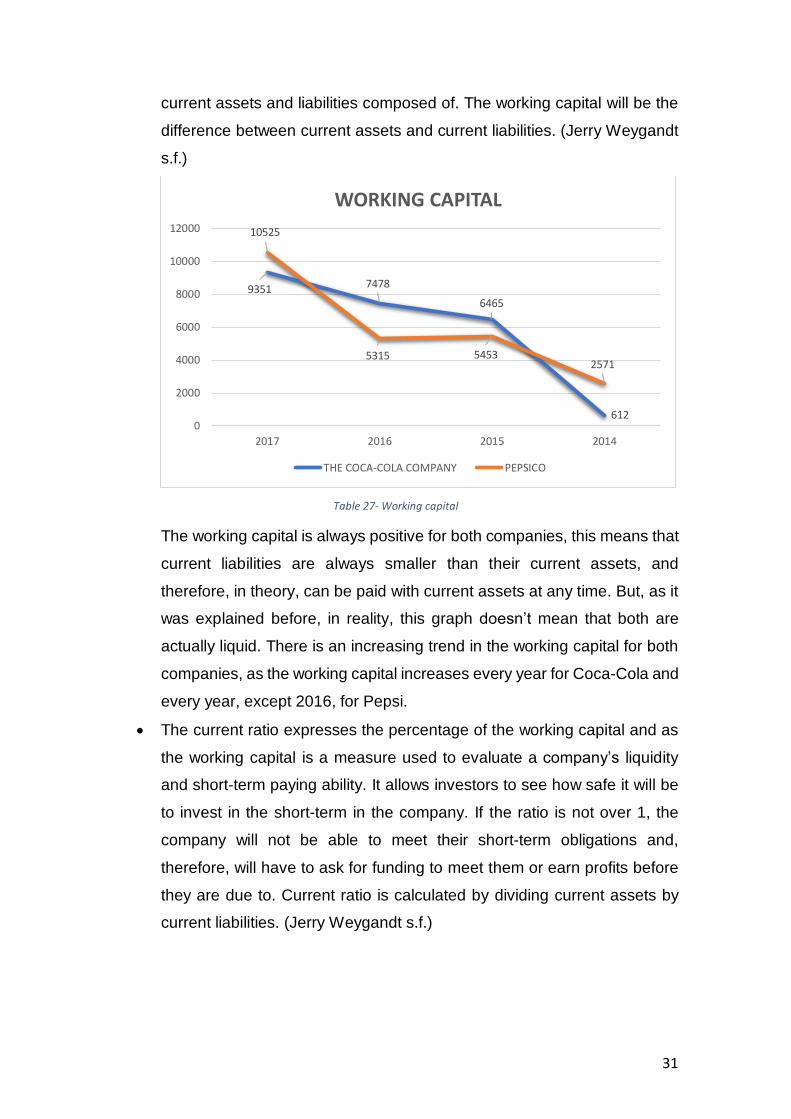
current assets and liabilities composed of. The working capital will be the
difference between current assets and current liabilities. (Jerry Weygandt
s.f.)
Table 27- Working capital
The working capital is always positive for both companies, this means that
current liabilities are always smaller than their current assets, and
therefore, in theory, can be paid with current assets at any time. But, as it
was explained before, in reality, this graph doesn’t mean that both are
actually liquid. There is an increasing trend in the working capital for both
companies, as the working capital increases every year for Coca-Cola and
every year, except 2016, for Pepsi.
• The current ratio expresses the percentage of the working capital and as
the working capital is a measure used to evaluate a company’s liquidity
and short-term paying ability. It allows investors to see how safe it will be
to invest in the short-term in the company. If the ratio is not over 1, the
company will not be able to meet their short-term obligations and,
therefore, will have to ask for funding to meet them or earn profits before
they are due to. Current ratio is calculated by dividing current assets by
current liabilities. (Jerry Weygandt s.f.)
9351 7478
6465
612
10525
5315 54532571
0
2000
4000
6000
8000
10000
12000
2017 2016 2015 2014
WORKING CAPITAL
THE COCA-COLA COMPANY PEPSICO

32
Table 28- Current ratio
The current ratio analysis indicates that Coca-Cola, Pepsi and the industry
are all able to meet their short-term obligations. In this case Coca-Cola
and Pepsi are under the industry overall. This indicates an overall
weakness at the time of paying their short-term liabilities. But, although the
two companies are far under the industry in 2014, they end up being above
the benchmark in 2017, when Pepsi’s current ratio is 1.51 and Coca-Cola’s
1.34; while the market’s is only 1.27.
• The quick ratio or acid test measures the ability of the company to pay its
short-term liabilities using the most liquid current assets (all of the current
assets except inventories). Quick ratio’s interpretation is closer to reality
than the current ratio as only assets that could actually be used to pay
liabilities at any time are used. The higher the ratio is the more liquid the
company is, and the less probability that there is of not paying their debts
in the short-term. This ratio is calculated by subtracting inventories to the
total current assets and dividing the result of this operation by current
liabilities. (Merchante 2011)
1.34
1.51
1.27
1.28
1.25
1.35
1.24
1.31
1.83
1.02
1.14
1.12
0.00 1.00 2.00 3.00 4.00 5.00 6.00
THE COCA-COLA COMPANY
PEPSICO
NON-ALCOHOLIC BEVERAGES INDUSTRY
CURRENT RATIO
2017 2016 2015 2014

33
Table 29- Quick ratio
In this graph, the most liquid companies are Coca-Cola and Pepsi, the
industry is clearly under both companies. This means that Coca-Cola and
Pepsi both have less risk for investors in the short-term. In the current ratio
graph the industry had a higher ratio, which leads to think that the
industries inventory is very big as it will account for the difference between
the industry’s current ratio and their quick ratio. If only Coca-Cola and
Pepsi are compared, Pepsi has a higher quick ratio overall but both
companies are very similar and have close quick ratios.
• The receivable turnover ratio and days receivables measures how quickly
can a company convert certain assets to cash. In particular how liquid are
accounts receivables. Measuring the average number of times that a
company collects their receivables. This will provide insight into the
operational structure. Accounts receivables turnover ratio is computed by
dividing sales by the average accounts receivable. On the other hand, the
days receivables, or average collection period, is a variant of the
receivables turnover that will determine the average number of days that
a company takes to collect their receivables and is calculated by dividing
365 by the receivable turnover ratio. The higher the days receivables and
the lower the receivable turnover, the more compromised the company’s
ability to make interest payments is and the more chances they have of
1.25
1.37
0.71
1.18
1.12
0.81
1.13
1.16
0.76
0.92
0.97
0.59
0.00 0.50 1.00 1.50 2.00 2.50 3.00 3.50 4.00 4.50 5.00
THE COCA-COLA COMPANY
PEPSICO
NON-ALCOHOLIC BEVERAGES INDUSTRY
QUICK RATIO
2017 2016 2015 2014

34
running into liquidity problems. (Jerry Weygandt s.f.) (C. William Thomas
s.f.)
Table 30- Receivable turnover
Table 31- Days receivables
In this graph, it can be seen that Pepsi’s receivable turnover ratio is over
Coca-Cola’s, which indicates more sales on credit. The industry is over
both companies. Therefore, it can be concluded that Pepsi has more credit
sales than Coca-Cola proportionally, while the industry has more credit
sales than both. This means higher earnings with interest revenues, but
also a higher chance of not being able to pay back short-term debtors. As
the industry has more credit sales, the time it takes for them to recover the
credit lend is longer than for the companies being studied. The difference
9.41
9.26
9.11
10.74
9.56
9.2
10.54
9.64
6.76
0.00 5.00 10.00 15.00 20.00 25.00 30.00 35.00
THE COCA-COLA COMPANY
PEPSICO
NON-ALCOHOLIC BEVERAGES INDUSTRY
RECEIVABLE TURNOVER
2017 2016 2015
38.77 39.41 40.07
33.9938.16 39.67
34.6437.88
53.99
0.00
10.00
20.00
30.00
40.00
50.00
60.00
THE COCA-COLA COMPANY PEPSICO NON-ALCOHOLIC BEVERAGESINDUSTRY
DAYS RECEIVABLE
2017 2016 2015

35
between Coca-Cola and Pepsi is very small and won’t make a big
difference in this aspect.
• Payables turnover and days payables are the measures to see how the
company buys their raw materials on credit and how much time does it
take to pay them back. A high payable turnover ratio means that a
business pays its suppliers very quickly, and a lower ratio means a longer
time period for payments to suppliers. Payable turnover is calculated by
dividing COGS by the average account payable. On the other hand, the
days payable is calculated by dividing 365 by the payable turnover. (C.
William Thomas s.f.)
Table 32- Payable turnover
1.45
1.70
1.83
1.98
2.03
2.13
0.00 0.50 1.00 1.50 2.00 2.50 3.00 3.50 4.00 4.50
2017
2016
2015
PAYABLE TURNOVER
THE COCA-COLA COMPANY PEPSICO
251.47215.23 199.50
184.08
179.51170.99
0.00
50.00
100.00
150.00
200.00
250.00
300.00
350.00
400.00
450.00
500.00
2017 2016 2015
DAYS PAYABLE
THE COCA-COLA COMPANY PEPSICO

36
Table 33- Days payable
The payable turnover ratio, in this case, is higher for Pepsi, which means
that Pepsi takes less time to pay suppliers than Coca-Cola. The payable
turnover decreases every year, and therefore, the days payable, increases
from year to year, meaning that both companies are taking more time to
pay their suppliers as the years increase.
4.5 Cash Flow Analysis
The cash flow statement analysis highlights important trends at the time of
making and receiving payments. Pepsi’s cash flow investing activities have a
negative result, making more payments for new investments than investments
that were sold or reached maturity for every year. In the case of their financing
activities, Pepsi issued more long-term debt than the debt paid every year,
something, of course, not sustainable in the long-run except for in a company that
grows every year, which is not the case in the years being analyzed. On the other
hand, Coca-Cola, also had negative investing activity every year, in which
investment purchases and income from investments disposals are more less the
same, but properties purchased are greater than the ones sold. As well, Coca-
Cola makes a big investment in equity methods of investment while Pepsi
doesn’t. The financing activity is also similar to Pepsi, Coca-Cola issues more
long-term debt every year than the long-term debt paid, but the amounts of debt
that Coca-Cola issues and pays are much bigger than Pepsi’s, as the amounts
are around four times bigger.
5. CONCLUSIONS
After analyzing The Coca-Cola Company and PepsiCo, and comparing them to
the industry ratios, there are a couple of conclusions that can be drawn. The first
and most obvious conclusion is that Coca-Cola and Pepsi have had decreasing
revenues and a decreasing net income since the year 2014. This can be seen in
the horizontal analysis done in section 3.1. This is due to different factors, but the
main factor is the decreasing demand for carbonated drinks. The carbonated
drinks Coca-Cola and Pepsi represent one of the main products for both
companies, as according to an article that Kate Taylor wrote on the website
business insider: “Coke and Pepsi brands declined 2% and 4.5%, respectively,
by volume in the US in 2017, according to Beverage Digest's annual report, which

37
was released on Monday. Meanwhile, Aquafina increased 2.6% by volume and
Poland Springs grew 2.5%.
Overall, the carbonated-soft-drink category declined 1.3% by volume, while
bottled water grew 6.2%. The rise of bottled water has been a long time coming.
After a decades-long growth streak, bottled water sales by volume finally
surpassed sales of soft drinks in 2016, reaching 12.8 billion gallons, according to
research and consulting firm Beverage Marketing Corporation.” (Taylor 2018)
CSDs (Carbonated Soft Drinks) are decreasing in volume due to people realizing
health issues with the consumption of this type of product and increasing
regulations. This space left in the market due to the decrease in CSDs has been
taken by other drinks, such as bottled water, ready-to-drink coffee, or energy
dinks as it was explained in section 1.3. This CSD’s volume decline is having a
smaller effect in Pepsi because of their higher diversification.
Furthermore, both companies’ equity has been decreasing since 2014, while non-
current liabilities are increasing. There is also a growth in non-current assets for
both companies, that is financed through long-term debt as it grows for both
companies. Pepsi’s current assets increase is bigger than Coca-Cola’s and is
partly financed with current liabilities, while Coca-Cola’s is entirely financed with
new non-current liabilities. This can be seen in the balance sheet’s horizontal
analysis at section 3.1
Other anomaly found at the time of doing the horizontal and vertical analysis was
the taxes and interests increase that led to a lower net income in 2017 for both
companies while revenues and expenses remained the same or more less
similar. This anomaly was concluded to be due to a tax increase in 2017 that has
its origins in a tax reform act, called TCJ, that, in essence, gave an incentive to
international US companies to repatriate profits from other years.
Lastly, the vertical analysis showed how Pepsi’s cost of goods sold are much
higher than Coca-Cola’s, this explains why Pepsi, despite having higher revenues
every year, doesn’t have a very big difference in their net income when comparing
it with Coca-Cola’s. This was also seen in 4.2, at the time of obtaining the gross
margin and EBITDA margin, it was seen that both ratios were higher for Coca-
Cola having a very big difference against Pepsi, Coca-Cola’s gross margin and
EBITDA margin being 62.6% and 23.1% respectively and Pepsi’s 54.7% and
16.5% on 2017. These ratios were better for Coca-Cola every year. The industry

38
did have a higher EBITDA margin than Coca-Cola in 2017 but was very unstable
and had two years with an EBITDA ratio under 12%. This is also the case when
analyzing the return on sales ratio, where Coca-Cola is over Pepsi and the
industry, while the sector and Pepsi are at a similar rate, Pepsi being slightly
under. Therefore, it can be concluded that Coca-Cola is more efficient than Pepsi
at the time of managing their production costs.
In regard to how Coca-Cola manages to have lower costs than the industry and
Pepsi, Coca-Cola explains in their 2017 annual report: “As a result of our finished
goods operations, which are primarily included in our North America and Bottling
Investments operating segments, the following inputs represent a substantial
portion of the Company's total cost of goods sold: (1) sweeteners, (2) metals, (3)
juices and (4) PET. The Company enters into hedging activities related to certain
commodities in order to mitigate a portion of the price risk associated with
forecasted purchases. Many of the derivative financial instruments used by the
Company to mitigate the risk associated with these commodity exposures,
including any related foreign currency exposure, do not qualify for hedge
accounting. As a result, the changes in fair value of these derivative instruments
have been, and will continue to be, included as a component of net income in
each reporting period. The Company recorded gains related to these derivatives
of $14 million and $79 million during the years ended December 31, 2017 and
December 31, 2016, respectively, and recorded a loss of $206 million during the
year ended December 31, 2015 in the line item cost of goods sold in our
consolidated statements of income.” Explaining that one of the causes that allows
for Coca-Cola’s lower production costs is their exposure to commodities used in
production. Something that is not common in this sector.
On the other hand, there are other ratios that concluded that Coca-Cola, while
being better at production efficiency, are not as good at managing their assets
efficiency. Their asset turnover ratio was under the industry’s average and under
Pepsi’s. In this measure, Pepsi had the best ratio, and was over both, Coca-Cola
and the industry, for every year. This means that Coca-Cola’s assets are not
being translated into revenues as well as they should. Pepsi’s assets however,
are translating well into revenues. When looking at both companies’ asset
distribution, there is a big difference between both, as Coca-Cola has around
25% of their assets in an account called “Equity Method Investment” which, in

39
essence, is equity investment, and accounts for Coca-Cola’s investments in other
companies that Coca-Cola has stake in. Companies such as “Monster Beverage
Corporation” or “Coca-Cola Enterprises”, a company that was part of Coca-Cola
until the late 20th century.
When looking at Coca-Cola’s return on assets, is very similar to Pepsi’s and the
industry’s every year, slightly better in 2015 and slightly worse in 2014 and 2016,
for the year 2017 the reference ratio obtained is unrepresentative as net income
was influenced by the TCJ act. When comparing the revenues with the assets,
Coca-Cola’s assets didn’t get translated into revenues as well as Pepsi’s or the
industry’s assets did, but when comparing the net income to the assets, their
assets do get translated into profits. Moreover, the return on equity analysis
obtained determined increasing equity returns for both companies as they are
reducing their equity every year and financing their new investments with debt.
Pepsi is above the industry average and Coca-Cola has a similar return on assets
to the industry. In the case of invested capital, the return on invested capital ratio
is similar for Coca-Cola and Pepsi every year, again, not considering 2017, but
the industry is clearly over both companies every year, what determines that the
industry obtains its financing through current liabilities more than Coca-Cola as
their return on equity was very similar. The analysis of these profitability ratios is
exposed in section 4.2.
Going on to the solvency and debt ratios, the main conclusion is that Coca-Cola
and Pepsi cover less of their interest expense with their profits than the industry
does. This is because the industry relies more on equity to grow while Coca-Cola
and Pepsi rely on debt, this can be seen in the debt ratio, which is very low for
the industry compared to these companies. Pepsi uses the most debt to grow.
This can also be seen in the equity multiplier, which again, shows how Pepsi has
the highest equity multiplier, being this 7.27 in 2017, while that same year Coca-
Cola had a 4.63 and the industry had a 3.05 on their equity multiplier ratio. All
these ratios show that Coca-Cola and Pepsi are less solvent than the industry
but will be able to grow at a faster pace in the long-run as they are also getting
funding from external funding providers. One of the reasons why Coca-Cola and
Pepsi use more external debt to grow than the industry is due to the financing
possibilities that these companies have as they are big companies with a good
reputation and years of experience in the sector, which leads to them getting

40
lower interest rates from banks and any other funding providing institution. The
solvency and debt ratios are found in section 4.3.
Lastly, the liquidity ratios gave a different view over the ability of the two
companies and the industry to pay short-term debt. The industry did have a higher
current ratio than Coca-Cola and Pepsi from the years 2014 to 2016 but a lower
quick ratio for every year analyzed, which means that they had a higher inventory
compared to their current assets than Coca-Cola and Pepsi. If the industry was
able to sell all of their inventory whenever they wanted they would be more liquid
than the companies analyzed in this paper, but since this is not possible, it can
be concluded that Coca-Cola and Pepsi are more liquid than the industry, and
therefore, have more chances of being able to pay their short-term debt with their
most liquid current assets. Liquidity ratios are analyzed at section 4.4.
To conclude, The Coca-Cola Company and PepsiCo are the biggest companies
in the sector but still have things to improve and could learn from each other as
both companies’ financial statements have some ratios that are situated under
the benchmark and under their competitor. The growth of Coca-Cola’s and
Pepsi’s financial statements will be determined by how they manage to maintain
their competitive advantage while overcoming the decrease in the revenues of
carbonated soft drinks and the increased regulations of the industry.
6. BIBLIOGRAPHY
Bailey, Sharon. 2014. Market Realist.
https://articles.marketrealist.com/2014/11/understanding-value-chain-
soft-drinks-industry/.
—. 2014. Market Realist. https://articles.marketrealist.com/2014/11/guide-non-
alcoholic-beverage-industry/.
Bartash, Jeffry. 2018. Market Watch.
https://www.marketwatch.com/story/repatriated-profits-total-nearly-500-
billion-after-trump-tax-cuts-2018-09-19.
Bellis, Mary. 2018. ThoughtCo. 22 de December.
https://www.thoughtco.com/history-of-pepsi-cola-1991656.
Beverage Marketing Corporation. 2015. Beverage Marketing Corporation. 26 de
March. https://www.beveragemarketing.com/news-detail.asp?id=335.

41
Beverage Marketing Corporation. 2017. «Beverages 2017. The shifting
Beverage Landscape and What it Means for Packaging.» Report.
Bhasin, Kim. 2013. Business Insider. 4 de January.
https://www.businessinsider.com/coca-cola-vs-pepsi-timeline-2013-
1?IR=T.
Bragg, Steven. 2018. Accounting Tools. 18 de January.
https://www.accountingtools.com/articles/long-term-debt-to-equity-
ratio.html.
C. William Thomas, Wendy M. Tietz, Walter T. Harrison, Charles T. Horngren
and Themin Suwardy. s.f. Financial Accounting. Pearson.
Chen, James. 2018. Investopedia.
https://www.investopedia.com/terms/e/ebitda-margin.asp.
CSI market. s.f. CSI market.
https://csimarket.com/Industry/industry_Financial_Strength_Ratios.php?i
nd=502.
Fidelity. s.f. Fidelity Investments.
https://eresearch.fidelity.com/eresearch/markets_sectors/sectors/sectors
_in_market.jhtml?tab=learn§or=30.
Institute, Corporate Finance. s.f. Corporate Finance Institute.
https://corporatefinanceinstitute.com/resources/knowledge/finance/equity
-multiplier/.
Jerry Weygandt, Paul Kimmel and Don Kieso. s.f. Financial Accounting. Wiley.
Keaton, Will. 2019. Investopedia. 26 de Febreuary.
https://www.investopedia.com/terms/a/activityratio.asp.
kenton, Mitchell Grant and Will. 2019. Investopedia. 27 de March.
https://www.investopedia.com/terms/v/vertical_analysis.asp.
Kenton, Will. 2018. Investopedia. 30 de June.
https://www.investopedia.com/terms/h/horizontalanalysis.asp.
Merchante, Ángel Muñoz. 2011. Análisis de Estados Financieros. Madrid:
Ediciones Académicas.
PepsiCo Inc. 2015. «Pepsico 2015 Annual Report Form.» Report, North
Carolina.
PepsiCo Inc. 2017. «Pepsico 2017 annual report form.» Report, North Carolina.

42
Pietka, Harry Edward Korab and Mark Jeffry. 2019. Encyclopaedia Britannica.
https://www.britannica.com/topic/soft-drink.
Sánchez, Pascual Garrido Miralles and Raúl Íñiguez. 2012. Análisis de Estados
Contables. Madrid: Pirámide.
Sanz, Manuel Novalvos. 2014. Novalvos Blog de Bolsa.
https://www.novalvos.com/que-es-el-roic/.
Taylor, Kate. 2018. Business Insider. https://www.businessinsider.com/pepsi-
coke-decline-while-bottled-water-grows-2018-5?IR=T.
The Coca-Cola Company. 2015. «Cocacola 2015 Annual Report Form.»
Report, Delaware.
The Coca-Cola Company. 2017. «Cocacola 2017 Annual Report Form.»
Report, Delaware.
Tikkanen, Amy. s.f. Enciclopaedia Britannica.
https://www.britannica.com/topic/PepsiCo-Inc.
—. s.f. Enciclopaedia Britannica. https://www.britannica.com/topic/The-Coca-
Cola-Company.
Yafai, Nabil. 2016. Inter Exchange. 8 de March.
https://www.interexchange.org/articles/career-training-
usa/2016/03/08/history-coca-cola/.
7. GRAPHICS AND TABLES INDEX
Table 1- U.S volume decade comparison from 2007-2017 .............................................. 6
Table 2- Industry revenue growth from 2014-2017 ......................................................... 7
Table 3- Companies used to generate non-alcoholic beverage industry ratios............. 10
Table 4- Coca-Cola income statement horizontal analysis............................................. 11
Table 5- Coca-Cola balance sheet horizontal analysis .................................................... 11
Table 6- Pepsi income statement horizontal analysis .................................................... 12
Table 7- Pepsi balance sheet horizontal analysis ........................................................... 12
Table 8- Coca-Cola income statement vertical analysis ................................................. 13
Table 9- Coca-Cola balance sheet vertical analysis ........................................................ 14
Table 10- Pepsi income statement vertical analysis....................................................... 14
Table 11- Pepsi balance sheet vertical analysis .............................................................. 15

43
Table 12- Asset turnover ratio ........................................................................................ 16
Table 13- Inventory turnover ratio ................................................................................. 17
Table 14- Days inventory ................................................................................................ 18
Table 15- Gross margin ................................................................................................... 19
Table 16- EBITDA margin ................................................................................................ 20
Table 17- Return on sales ............................................................................................... 21
Table 18- Return on assets ............................................................................................. 22
Table 19- Return on equity ............................................................................................. 23
Table 20- Return on invested capital .............................................................................. 24
Table 21- Debt to equity ratio ........................................................................................ 25
Table 22- Interest coverage ratio ................................................................................... 26
Table 23- Equity multiplier ............................................................................................. 27
Table 24- Capital debt ratio ............................................................................................ 28
Table 25- Long term debt ratio ....................................................................................... 29
Table 26- Short term debt ratio ...................................................................................... 30
Table 27- Working capital ............................................................................................... 31
Table 28- Current ratio ................................................................................................... 32
Table 29- Quick ratio ...................................................................................................... 33
Table 30- Receivable turnover ........................................................................................ 34
Table 31- Days receivables ............................................................................................. 34
Table 32- Payable turnover ............................................................................................ 35
Table 33- Days payable ................................................................................................... 36