financial advisors: a case of babysitters?...financial advisors: a case of babysitters? andreas...
TRANSCRIPT

Financial Advisors:A Case of Babysitters?
Andreas Hackethal Goethe University Frankfurt
Michael HaliassosGoethe University Frankfurt, CFS, CEPR
Tullio JappelliUniversity of Naples, CSEF, CEPR

22
Motivation Household portfolios have become more
involved
Accumulating evidence on investment/debt mistakes and differential financial literacy e.g. Campbell, 2006; Campbell, Calvet Sodini,
2008, Lusardi and Mitchell, 2007; Van Rooij, Lusardi, Alessie, 2008.
Potential Remedies: Financial education (seminars, advertising
campaigns)
Default options and simpler products
Financial advisors

3
Existing Research on Financial Advice
Theoretical: Taking for granted that advisors are matched
with uninformed customers, how can mis-selling be avoided through regulation?
Empirical: What is the potential contribution of stock
analysts and financial advisors? How much can they forecast?
Are they less subject to behavioral biases?

4
Theoretical Literature on Financial Advice
Relatively scant
„Misselling‟: Inderst and Ottaviani (AER): the practice of misdirecting clients to a financial product not
suitable for them (e.g. for tax or horizon reasons)
Conflicts of interest: Between agent and customer:
arises endogenously from agent compensation set by the firm
Between firm and agent: If product is sold to the wrong people, there is a probability
with which the firm receives a complaint and a policy-determined fine it pays, in part to the disgruntled customer.
Flavor: agents are more informed than customers and can misdirect them

5
Empirical LiteratureInformational Advantage?
Cowles (1933)
“45 professional agencies which have attempted, either to select specific common stocks which should prove superior in investment merit to the general run of equities, or to predict the future movements of the stock market itself.”
Barber and Loeffler (1993) on The Wall Street Journal's Dartboard column:
Some investors follow column recommendations and buy; part but not all of the price response gets reversed.
Desai and Jain (1995) on “Superstar” money managers in Barron's Annual Roundtable
The buy recommendations earn significant abnormal returns from recommendation to publication (14 days) but nothingfor one to three year post-publication day holding periods. So, following published advice does not help.

6
Empirical LiteratureInformational Advantage?
Womack (1996): Examines stock price movements following „buy‟ or „sell‟ recommendations by 14 major U.S. brokerage firms.
Significant price and volume reactions within a three-day interval
Significant stock price drift, especially for new „sell‟ recommendations.
However: new „buy‟ recommendations occur seven times more often than „sell‟ recommendations
Brokers avoid harming potential investment banking relationships
maintain future information flows from managers
Metrick (1999): recommendations of 153 investment newsletters
No evidence of superior stock-selection skill, in short or long horizon: e.g., average abnormal returns are close to zero.

Empirical LiteratureInformational Advantage?
Barber et al. (2001)
Compute abnormal gross returns from purchasing (selling short) stocks with the most (least) favorable consensus recommendations (from brokerage houses and analysts)
Once transactions costs are taken into account, abnormal net returns are not statistically significant.
Begrstresser, Chalmers and Tufano (2008):
Compare performance of mutual fund „classes‟ by distribution channel: sold directly versus through brokers
Funds sold through brokers:
offer inferior returns, even before the distribution fee
no superior aggregate market timing ability
same return-chasing behavior as direct-channel funds. 7

10
Empirical LiteratureBehavioral Biases?
Disposition Effect: Shapira and Venezia (2001):
Brokerage clients of an Israeli bank; trades in 1994
Bias found for both professional investors and self-directed retail investors, but less pronounced among professionals
Overtrading (Barber and Odean, 2000)
Discount brokerage; more pronounced for males. Often attributed to overconfidence.
Odean, 1998; 1999; Barber and Odean, 2001; Niessen and Ruenzi, 2006: even professionals
But: Bilias, Georgarakos, Haliassos (2009):
Small proportion of households own brokerage accounts
Those who do, invest small fraction of their financial assets in them

11
Empirical LiteratureOpen questions
Do investors actually use what advisors know?
How about actual rather than theoretical portfolios, including transactions costs?
Do investors with behavioral biases make use of financial advisors?
Barber and Odean data are from discount brokers
Guiso and Jappelli (2006): overconfident investors overvalue
the precision of info they acquire and are less likely to
approach advisors.
Even if advisors are matched with biased investors, will they help them overcome their biases?
Overtrading?
Under-diversification? More promising
13
Our Paper
Compare Actual Account Performance:
How do brokerage accounts actually perform when run by individuals without financial advisors, compared to accounts run by (or in consultation with) financial advisors?
Analyze IFA Use:
Do financial advisors tend to be matched with poorer, uninformed investors or with richer, older but presumably busy investors?
Estimate IFA Contribution to Performance:
Is the contribution of financial advisors to account performance positive, relative to what investors with the characteristics of their clients tend to obtain on their own?

1414
The Data
Administrative data for 2001-2006
One of the largest German internet brokers with about 1m customers
32,751 randomly selected individual customers, 66 months
Some accounts run by individuals themselves
Other accounts run by, or with input from, a financial advisor (IFA)
Our sample did not change IFA status throughout
Returns are net of transactions costs and commissions paid to IFAs by the brokerage house
The brokerage does not compute performance data and does not evaluate IFAs on performance

15
Performance Record
IFA accounts offer on average:
greater returns
Both total returns and excess returns
lower risk
Lower beta; lower fraction of unsystematic risk
lower probabilities of losses
and of substantial losses
greater shares in mutual funds
15

1616
Distributions of Average Monthly Returns
DAX: -5.2% pa
Sample Means
-0.8%pm/-9.17% pa -0.44% pm/-5.14% pa

17
Abnormal (log) returns

1818
Distributions of Abnormal Monthly Returns
Sample Means
-0.5% -0.3%

20
Decomposition of Portfolio Risk

1919
Distributions of Variance of Account Returns
Sample Means
0.100 0.063

2121
Distributions of betas, proportional to systematic risk
Sample Means
1.289 0.843

2222
Distributions of Unsystematic Risk
Sample Means
0.050 0.040
2323
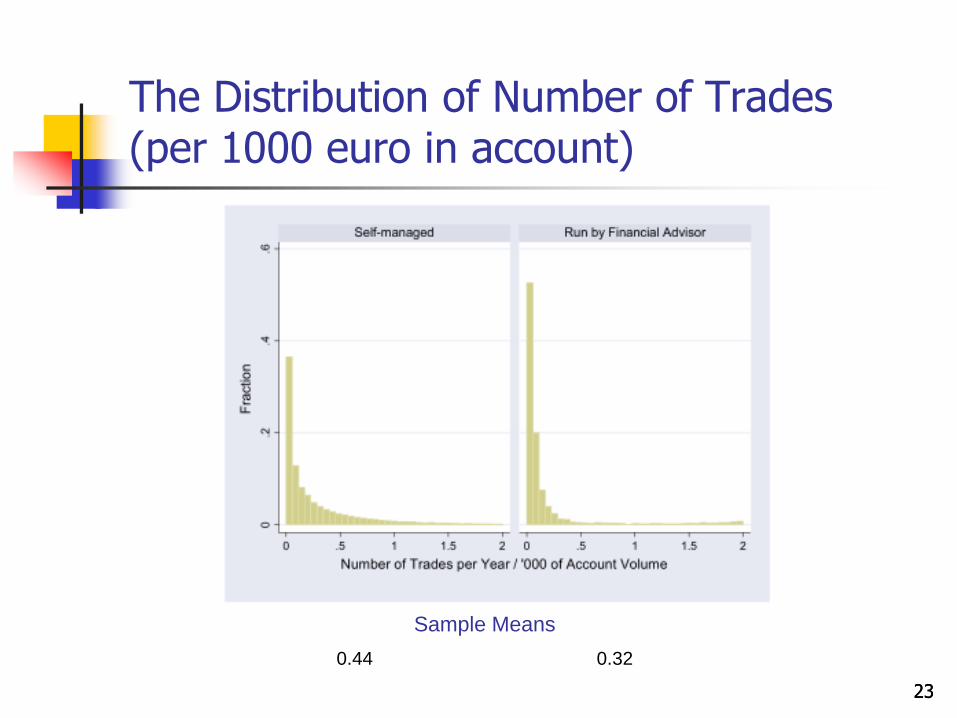
The Distribution of Number of Trades (per 1000 euro in account)
Sample Means
0.44 0.32

2424
The Distribution of Turnover
Sample Means
0.041 0.089

2525
The distribution of shares in directly held stocks
Sample Means
0.588 0.211
26
Who has an IFA?Regression Analysis
IFAs tend to be matched with:
Richer
Older
Female investors
26

2727
The determinants of having the account run by a financial advisor. Probit estimates

28
Effect of IFAs?Regression Analysis
In regression analysis, important to instrument use of IFA.
For example, an unobserved factor (such as being quite risk averse) could simultaneously make customers use an IFA and achieve low returns.
In this case, IFA use is correlated with low performance but the reason is risk aversion and not the use of an IFA per se.
Instruments
We match customer zip codes to 500 broader regions for which we have information from a second data set: the destatis files of the German Federal Statistical Office:
log income in the region
voter participation
fraction of the population with college degree
From a third, commercial, data set: bank branches per capita
Standard errors of estimates are corrected for clustering at the zip code level.
Our instruments pass the test of over-identifying restrictions and the rank test.
The F-test rejects the null hypothesis that the coefficients of the four instruments are jointly equal to zero in the first-stage regression at the 1% level and implies that the rank condition is satisfied 28

29
Effect of IFAs?Regression Analysis
Relative to what account owners with these characteristics tend to achieve on their own, IFAs tend to: lower total and excess returns
29

3030
The determinants of log returns and Jensen‟s Alpha. Instrumental variable estimates

31
Effect of IFAs?Regression Analysis
Relative to what account owners with these characteristics tend to achieve on their own, IFAs tend to: lower total and excess returns
raise account risk: both components (systematic and unsystematic)
31

3232
The determinants of portfolio variance, Beta, unsystematic risk.Instrumental variable estimates

33
Effect of IFAs?Regression Analysis
Relative to what account owners with these characteristics tend to achieve on their own, IFAs tend to: lower total and excess returns
raise account risk (systematic and unsystematic)
increase the probabilities of losses and of substantial losses
33

3434
Determinants of probability of low returnsInstrumental variable estimates

35
Effect of IFAs?Regression Analysis
Relative to what account owners with these characteristics tend to achieve on their own, IFAs tend to: lower total and excess returns
raise account risk (systematic and unsystematic)
increase the probabilities of losses and of substantial losses
increase trading frequency and portfolio turnover
have no significant effect on the share of directly held stocks
35

3636
The determinants of trading frequency, turnover, and share of directly held stocks Instrumental variable estimates

37
What Helps? What Hurts?Regression Analysis
What helps account performance?
Experience with financial products
Account volume
Age (maybe)
What hurts account performance?
Being male!
37

3838
IFAs as Babysitters?
Babysitters: are matched with well-to-do households
they perform a service that parents themselves could do better
they charge for it
but observed child achievement is often better than what people without babysitters obtain, because other contributing factors are favorable

36
How specific are our results to brokerage accounts?Examining a different data set
Very large German commercial bank
Broader customer base than brokerage customers
Customers with investment accounts
Panel data over 34 months
Today: about 3,000 (cross-sectional) observations
Financial advice:
All customers have access to bank advisors
Choose whether they consult one for a specific trade
Can measure intensity of advisor use
Dummy (here): Whether they have consulted an advisor for any single trade in the 34-month period
Can allow for declared risk preferences 36

37
Risk Preference Incidence among
Self-managed
Advised
speculator 10.2 7.6
growth 13.6 13.6
balanced 23.7 36.8
conservative 14.5 17.4
low risk 14.3 14.7
safe 23.7 9.9

38
Some descriptive statistics Self-managed Financial advisor Total sample
Dummy for financial advice 0.000 1.000 0.621
Male 0.536 0.448 0.481
Age 51.476 56.978 54.895
Risk aversion = safe 0.237 0.099 0.137
Risk aversion = low risk 0.143 0.147 0.146
Risk aversion = conservative 0.145 0.174 0.166
Risk aversion = balbnced 0.237 0.368 0.332
Risk aversion = growth 0.136 0.136 0.136
Risk aversion = speculative 0.102 0.076 0.083
White collar 0.493 0.382 0.424
Blue collar 0.034 0.043 0.040
Manager 0.027 0.027 0.027
Retired 0.143 0.204 0.181
Housewife 0.061 0.102 0.087
Student 0.065 0.048 0.055
Missing occupation 0.177 0.193 0.187
Log net returns 0.007 0.004 0.005
Log gross returns 0.011 0.006 0.008
Variance of log net returns (annual) 0.107 0.042 0.064
Mutual funds /total stocks 0.314 0.645 0.521
N. of trades / account volume 1.480 0.577 0.919
Observations 1784 2929 4713

Probit for use of financial advice (ME)
39
Probit for Use of Financial Advisor (marginal effects)
(1)
(2) (3)
Male -0.031* -0.034** -0.040**
(1.91) (2.11) (2.42)
Age 0.001*** 0.000 0.000
(2.75) (0.83) (0.45)
Dummy for speculative 0.018 -0.006 0.001
(0.54) (0.17) (0.03)
Dummy for growth 0.116*** 0.091*** 0.093***
(3.88) (2.93) (2.88)
Dummy for balanced 0.129*** 0.104*** 0.098***
(4.45) (3.43) (3.11)
Dummy for conservative 0.177*** 0.157*** 0.145***
(6.49) (5.64) (4.98)
Dummy for low risk 0.081*** 0.071** 0.062*
(2.66) (2.32) (1.92)
Log account volume 0.030*** 0.034***
(4.60) (4.95)
Mean disposable income in area (in '000 euro) -0.010**
(2.33)
Number of bank braches per '000 inhabitants -0.016
(0.29)
Voter participation in elections -0.009**
(2.37)
Area of region -0.000
(1.33)
Observations 3184 3184 3013

40
OLS Results
(1) (2) (3) (4) (5)
Monthly log
net returns
Monthly log
gross returns
Variance of
portfolio
returns
Share of
mutual funds
in total stocks
Number of
trades / '000
Account
volume
Dummy for financial advice -0.001 -0.001*** 0.014* 0.573*** -0.344***
(1.61) (3.81) (1.81) (14.67) (3.65)
Male 0.001 0.001** 0.007 -0.109*** 0.039
(1.18) (2.28) (1.14) (3.33) (0.47)
Age -0.000 -0.000*** -0.000 -0.001 -0.017***
(1.13) (4.35) (0.62) (0.49) (5.85)
Dummy for speculative 0.011*** 0.009*** -0.025* -0.519*** 0.718***
(8.33) (13.00) (1.71) (5.57) (3.90)
Dummy for growth 0.009*** 0.006*** -0.040*** -0.166* -0.104
(7.60) (9.71) (2.88) (1.83) (0.58)
Dummy for balanced 0.007*** 0.004*** -0.028** -0.061 -0.229
(5.66) (6.18) (2.10) (0.68) (1.33)
Dummy for conservative 0.005*** 0.002*** -0.045*** 0.135 -0.266*
(4.38) (3.16) (3.67) (1.57) (1.72)
Dummy for low risk 0.001 -0.001* -0.048*** 0.362*** -0.264
(1.11) (1.72) (3.38) (3.25) (1.49)
Constant 0.001 0.007*** 0.078*** 0.401*** 1.947***
(0.61) (8.54) (4.20) (3.57) (8.42)
Observations 3208 3208 2963 2440 3208

41
Instruments
average income in the area
area size
voter participation
number of banks per capita
41

42
IV Regressions
(1) (2) (3) (4) (5)
Monthly log
net returns
Monthly log
gross returns
Variance of
portfolio
returns
Share of
mutual funds
in total stocks
Number of
trades / '000
Account
volume
Dummy for financial advice -0.016** -0.012*** 0.176** 0.929*** -0.369
(2.54) (2.85) (2.49) (4.82) (0.34)
Male -0.000 0.000 0.008 -0.012 -0.025
(0.36) (0.34) (1.28) (0.53) (0.26)
Age -0.000 -0.000*** -0.000 -0.001** -0.013***
(0.79) (2.86) (0.96) (2.06) (4.37)
Dummy for speculative 0.009*** 0.009*** 0.013 -0.378*** 0.612***
(8.35) (11.79) (1.04) (6.90) (3.11)
Dummy for growth 0.009*** 0.009*** -0.014 -0.282*** 0.037
(7.03) (8.87) (0.95) (5.01) (0.15)
Dummy for balanced 0.007*** 0.006*** -0.025* -0.197*** -0.090
(5.24) (6.34) (1.71) (3.54) (0.38)
Dummy for conservative 0.005*** 0.005*** -0.019 -0.209*** -0.101
(3.61) (4.37) (1.24) (3.71) (0.39)
Dummy for low risk 0.001 0.001 -0.013 -0.158** -0.144
(0.87) (1.09) (1.03) (2.37) (0.69)
Constant 0.012*** 0.013*** -0.074 0.192 1.677**
(3.13) (4.84) (1.55) (1.33) (2.52)
Observations 3013 3013 2802 2292 3013

43
IV Regressions with occupational dummies and account volume (1) (2) (3) (4) (5)
Monthly log
net returns
Monthly log
gross returns
Variance of
portfolio
returns
Share of
mutual funds
in total stocks
Number of
trades / '000
Account
volume
Dummy for financial advice -0.011** -0.012*** 0.119** 0.849*** -2.355**
(2.09) (3.13) (2.10) (5.03) (2.37)
Male 0.000 0.000 0.007 -0.016 -0.040
(0.03) (0.55) (1.25) (0.70) (0.39)
Age -0.000** -0.000** 0.000 -0.002 0.003
(2.25) (2.47) (0.16) (1.65) (0.69)
Dummy for speculative 0.008*** 0.009*** 0.027** -0.351*** 1.077***
(7.74) (11.57) (2.29) (6.54) (5.27)
Dummy for growth 0.008*** 0.009*** 0.005 -0.239*** 0.843***
(6.77) (9.81) (0.39) (4.54) (3.79)
Dummy for balanced 0.005*** 0.006*** -0.005 -0.156*** 0.752***
(4.55) (7.00) (0.39) (3.02) (3.43)
Dummy for conservative 0.004*** 0.004*** 0.000 -0.176*** 0.668***
(2.96) (4.94) (0.02) (3.40) (2.88)
Dummy for low risk 0.000 0.001 -0.004 -0.130** 0.217
(0.15) (1.05) (0.36) (2.10) (1.06)
Log account volume 0.001*** 0.000 -0.014*** -0.030*** -0.548***
(4.88) (0.49) (5.27) (3.29) (11.16)
Blue collar 0.000 0.002 -0.026 -0.052 0.047
(0.14) (1.44) (1.53) (0.87) (0.16)
Manager -0.000 0.000 0.017 -0.029 0.171
(0.09) (0.13) (1.07) (0.52) (0.61)
Retired 0.001 0.001 -0.025*** 0.015 0.216
(1.02) (1.51) (2.65) (0.48) (1.30)
Housewife 0.001 0.001* -0.018* -0.040 0.105
(1.49) (1.87) (1.68) (1.06) (0.55)
Student 0.002 0.001 -0.061*** -0.128* 0.023
(1.21) (0.90) (3.12) (1.95) (0.07)
Missing occupation -0.000 0.000 -0.024** -0.078** 0.301
(0.36) (0.46) (2.20) (2.32) (1.61)
Constant 0.007*** 0.012*** 0.007 0.364*** 3.268***
(2.77) (6.33) (0.22) (3.51) (6.55)
Observations 3013 3013 2802 2292 3013

39
Concluding Remarks Matching:
Not for granted that financial advisors are matched with uninformed novices and attract low-quality investors
Reliance on advisors to assist those likely to make mistakes
If many of them offer a luxury service to wealthy investors, how should we think about regulation?
Contribution of financial advisors: Even if advisors add value, they end up collecting more in fees and commissions than
what they add
Seems robust across IFAs and BFAs and across brokerage and bank clients
Interpretation: Why do even high-quality investors at the brokerage pay this?
Pay for a service because they have no time (like babysitting)?
Think in relative terms? In first data set:
They get the DAX index return, which is better than others get
Half pay less relative to what they were paying to the bank
Do IFAs turn non-participants to participants?
Policy implication for retirement financing: Financial advice may not be a reliable substitute for financial literacy
More promising: simpler products and default options