financial accounting prof. varadraj bapat school of ...ratio analysis and interpretation 1 ... ratio...
TRANSCRIPT
Financial AccountingProf. Varadraj Bapat
School of ManagementIndian Institute of Technology, Bombay
Lecture - 30Ratio Analysis and Interpretation 1
[FL] In our last station we had started discussion on analysis of financial statement and
its interpretation. So, financial statements give vast amount of data, different users can
extract the relevant information. So, they may either go for horizontal statement, vertical
statement or benchmarking. The most important technique for analysis is Ratio Analysis
where variety of ratios are calculated.
(Refer Slide Time: 01:01)
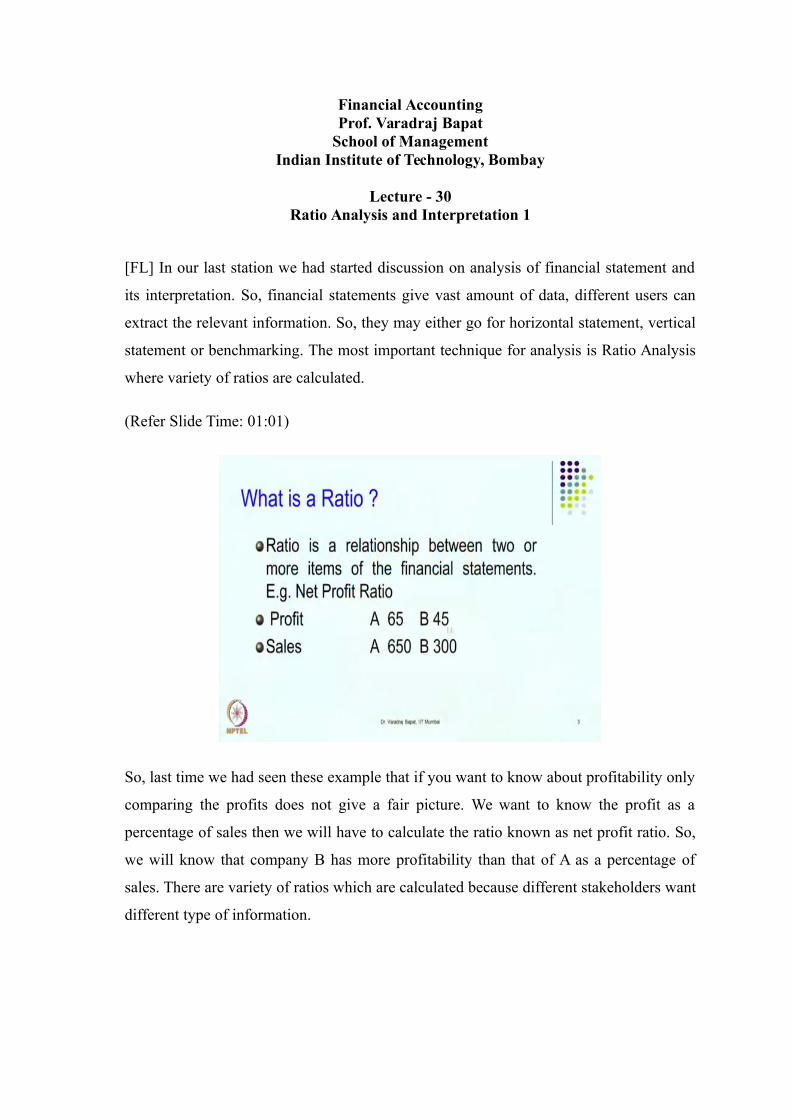
So, last time we had seen these example that if you want to know about profitability only
comparing the profits does not give a fair picture. We want to know the profit as a
percentage of sales then we will have to calculate the ratio known as net profit ratio. So,
we will know that company B has more profitability than that of A as a percentage of
sales. There are variety of ratios which are calculated because different stakeholders want
different type of information.

(Refer Slide Time: 01:31)
Now, the ratios are useful for knowing the strengths and weaknesses of the company,
they are also useful for taking decisions, they are also useful for knowing the
performance. Now, the importance of ratios is that the financial statements tell you about
the present and the past, but the ratios can be used even to project the future. So, we can
make certain assumptions, look for the past trends and make the projections for the
future that is an advantage of the ratios.
(Refer Slide Time: 02:15)

Now, in our last session we had started discussion on first two type of ratios that is
liquidity and capital structure.
(Refer Slide Time: 02:27)
.
Within liquidity current ratio is the most important ratio which is used extensively, here
me want to know whether company has enough current assets to pay for its current
liabilities.
(Refer Slide Time: 02:45)

So, ratio normally is considered to be 2 is to 1 to be acceptable, but it can considerably
change from industry to industry. General idea is we should have enough of current
assets to meet the current liabilities and avoid any default or bankruptcy. Now, a more
conservative measure of this ratio is quick ratio, where we calculate quick assets to quick
liabilities. Then we had started looking at the long term liquidity of the company for that
we calculate the capital structure ratios.
(Refer Slide Time: 03:27)
So, we know that there are two important funding sources one is a equity other is a debt.
So, equity ratio we seek to calculate equity as a percentage of capital employed.

(Refer Slide Time: 03:39)
In debt, debt as a percentage of capital employed.
(Refer Slide Time: 03:43)
And, the debt equity ratio which is perhaps is the most common and extensively used;
debt is calculated as a percentage of equity. But, while calculating the ratio in the
numerator we take debt plus preference share capital. Keep in mind actually normally
shareholders equity includes preferential capital, but for the purpose of this ratio we
deduct it from the denominator and add it to the numerator because, though it is a
shareholders funds it is repayable within 5 to 10 years. So, it has acquired a nature like
debt. So, we add debt plus preference capital and divide it by shareholders equity minus
the preference capital got it.
So, debt equity ratio is a very important ratio where the bankers are extensively
interested. In fact, no loan is granted by any bank unless they calculate debt equity ratio.
How much debt equity ratio is acceptable? Suppose you want to buy a vehicle of 10
lakhs, how much loan bank will give any idea normally, how much loan banks give?
Banks normally say that we will finance 75 percent of vehicle; that means, what debt
equity ratio they are looking for? From 10 lakhs they will give 7.5 lakhs and owner has
to put in 2.5 lakhs.
So, what is the debt equity ratio? 7.5 by 2.5; that means, acceptable debt equity ratio is 3
like that Reserve Bank of India and the regulators fix the maximum debt equity ratio
which bank can give and individual banks also decide the maximum. And, again from
case to case basis they can vary it a bit normally they bring it down. Suppose, the
borrower is not very sound as does not have a very strong position they can also say that
out of 10 lakhs we will finance only 6 lakhs. Then what will be the debt equity? 6 by 4;
that means, it becomes 1.5. So, norm is 3, but they can bring down maximum financing
as per the requirement.
So, debt equity ratio is a very important ratio which is looked by banker while
sanctioning any loan proposal. Other lenders also see it like non-banking companies or
leasing companies many times if a company wants to make a credit sale, they check the
customers debt equity ratio. Because, will the customer be able to repay that loan for that
both current ratio is also important, debt equity ratio is also important. In a short term
transaction current ratio is given more weight, for a long term debt equity is given more
weight.
This debt equity ratio also changes from the nature of project or the asset financed. For
example, as I told you for a vehicle normally bank gives 75 percent loan. So, the debt
equity ratio is how much? 75 by 25 means 3 is to 1. For a housing loan, let us suppose
you are buying a house of 1 crore, how much loan bank will give? Normally, bankers
finance 80 percent of house or even more sometimes, but if they finance 80 percent; that
means, 80 lakhs banks will give 20 lakh the borrower will give.

So, what is the debt equity ratio? 80 by 20 means it is 4 is to 1, many times bankers even
finance 85 percent; that means, 85 by 15. So, it is almost the ratio of 5.5 or 6. So, house
is considered to be much more safer as it than vehicle. So, they are willing to go for
higher debt equity ratio, are you getting me? Suppose some infrastructure project to be to
be started like construction of road or construction of railways, will the debt equity ratio
be higher or lower?
The debt equity ratio for such long term projects is much higher, it can be 6, 10, 15 also
sometimes for railways because, the returns from these assets are going to come over a
longer period of time. And these are much more safer and stable assets, bankers do give
much more debt equity ratio. Have you heard of subprime problem in U.S.? There was
very big crisis in 2008 known as subprime crisis.
In subprime crisis bankers gave lot of loans to those borrowers which were subprime,
subprime means of lower quality. Bankers went on giving more and more debt equity
ratio that created very big problems of non-performing assets that is known as subprime
crisis. Those who are interested you can type subprime crisis in Google, lot of articles
will come and you will get more information right now we will not discuss more about it,
but what I am trying to tell is debt equity ratio is very important. If the debt equity ratio
is violated by bank, bank start giving more debt equity ratio it going it gives a problem to
the bank in the long run.
It also creates problem to the company, if the debt equity ratio is high because you are
taking more and more risk when you are going for more and more debt. The company’s
which has stable assets like more land and building can have more debt equity ratio. But,
if companies are like service sector companies or it companies they must have lower
debt equity ratio. For example, many it company like Infosys in fact, are called as 0 debt
company, they have no debt at also. So, 0 debt equity ratio is a basis they go for later on
we will see some cases of the companies. Now, the next type of ratios are known as
coverage ratios.

(Refer Slide Time: 10:39)
We were discussing about the bankers so, bankers want to decide on maximum debt
equity ratio, but they also look at whether the interest which is going to be repaid is
covered by the income or earnings of the company.
(Refer Slide Time: 11:01)
Now, the fixed claims are like interest on loan or preference dividend or the repayment
of instalments. So, important ratio which is mainly considered by bankers is debt service
coverage ratio.

(Refer Slide Time: 11:11)
So, the numerator is earnings available for debt service upon interest plus instalment. So,
normally net profit is available plus some non-cash expenses like depreciation are added
and some adjustments may be made for loss on sale of assets and interest on debts. So,
this much is a money available is kept as a numerator and the instalment to be paid and
including the interest is to be kept as a denominator.
So, bankers here we know that how many times the earning is available for repaying
their instalment whether the company has capacity to make the repayment on time ok,
that is a debt service coverage ratio. Same way one can also calculate interest coverage
ratio. So, whether the company will be able to at least repay interest for that normally the
numerator is a bit or profit before interest and tax divided by interest good.

(Refer Slide Time: 12:35)
(Refer Slide Time: 12:41)
So, higher ratio both the debt service and interest coverage if the ratio is higher; that
means, there is a good coverage available for repayment of interest or instalment; that
means, the chances of default are less. So, bankers normally insist on at least the
minimum debt coverage ratio which they want to emphasize on.

(Refer Slide Time: 13:05)
Same way, preference shareholders will be interested to know the coverage for their
dividend that is why preference dividend coverage ratio; now the preference dividend
can be paid only after paying interest and taxes. So, numerator now we have taken EAT
or you can also call it PAT: Earning After Tax or Profit After Tax divided by preference
dividend liability.
So, if the profit after tax is sufficient, the company will be able to pay the dividend as per
the contracted terms. So, the coverage is seen in this ratio. Now, there is one important
ratio known as capital gearing ratio.

(Refer Slide Time: 13:59)
This is very similar to debt equity ratio which we discussed earlier. So, in the numerator
we consider the preference capital plus debt and the denominator we see the owners fund
that is equity capital plus reserves minus any possible losses. So, here also if the ratio is
higher the company is considered to be more risky or it can also be calculated for a
particular project, if the ratio is higher the project is considered to be risky; you need to a
balance too high ratio is to be avoided.
(Refer Slide Time: 14:47)

Now, the next type of ratios are known as activity ratios. They are sometimes also called
as efficiency or performance or turnover ratios because, here we calculate how better or
how efficiently the company is able to utilise their assets.
Now, the assets are being used mainly for generating sales. So, a comprehensive ratio for
this is capital turnover ratio.
(Refer Slide Time: 15:21)
Now, we employ the capital in business to generate the sales. So, we are calculating sales
upon capital employed. A company which is efficient will be able to sell more and more
using lesser capital right. So, higher the ratio is preferable, higher ratio means they are
able to generate more turnover and most likely their profits also will be high ok. So, to
do it over all for all the assets taken together we calculate capital turnover ratio. Other
popular ratio is fixed asset turnover ratio.

(Refer Slide Time: 16:05)
So, sales again in the numerator, the denominator we are taking fixed assets or capital
assets. So, what are the long term assets used by the company and how much sales they
are able to generate. This shows the efficiency in utilisation of fixed assets, this can be
also calculated for individual asset, either it can be calculated for the whole company, it
can be calculated for a particular project or a plant, it can even be calculated for a single
asset.
If that asset is able to generate the revenue just see how efficiently you are using the
asset. [FL] simple example [FL], suppose there is a auto rickshaw driver, he or she as a
auto rickshaw let us say the cost of rickshaw is 4 lakhs. He is able to generate a daily
turnover of say 1000 rupees, what will be the fixed asset turnover ratio? Just calculate
daily turnover of 1000 rupees, normally rickshaw cannot be used for the whole year; let
us say it is used for 300 days in a year.
What will be the turnover? 300 in to 1000; that means, 3 lakhs is a turnover and the value
of fixed asset was 4 lakhs. So, 3 by 4; that means, in the year the ratio is less than 1;
assuming that this rickshaw is operated in a single shift of 8 hours turnover generated
was 1000. The ratio is 3 lakhs upon 4 lakhs or 3 by 4, now if the same rickshaw is
operated in 2 shifts so, 1000 in the morning 1000 in afternoon.
So, now the turnover has doubled, what will be the ratio? So, 1000 plus 1000 means
2000 in a day into 300 days so, 6 lakhs divided by 4 lakhs. So now, you can see earlier

the ratio as 0.75, now it has become 6 by 4 that is 1.5. So, the efficiency of use of asset
has improved, I am just giving a simple example that it can also be calculated for one
single auto rickshaw because, one asset is able to generate the turnover, same way it can
be done at various levels.
Now, generation of turnover is very important for success of company because, that is
what is going to give you profits, that is why this ratio is very important for the ability of
the business to generate the sales. Now, just like fixed asset we can also see how
efficiently business is using working capital. So now, it is sales upon working capital that
is current asset minus current liability. So, are they effectively using their working
capital, higher the ratio will be good because that shows a more or a bad more efficiency
of the company.
Now, this ratio is very interesting because if you want to study the working capital
management of the company these ratio is now subdivided into inventory turnover,
debtors turnover and creditors turnover.
(Refer Slide Time: 19:55)
Now, this is about the inventory turnover because, there will be different units or
departments in the company looking after the stock management, debtors management,
creditors management. So, we can know the efficiency of each part of the business. The
first one here we are looking for is inventory turnover over. Now, either we can take
sales upon inventory, but more sophisticated would be cost of sales because you know

inventory is recorded at cost. So, numerator also will take at cost of sales instead of just
taking the closing inventory it will be better if we take average inventory because, we
know that on an average how much is a stock and how much is a sales generated.
So, cost of sales upon average inventory is the better or improved formula getting it.
Now, the same formula can be also converted to number of days to make it more
meaningful. Suppose, a company has let us say a turnover of 4 lakhs and has debtors of
40,000 what will be the ratio; sorry, as an inventory of 40,000 and turn over of 4 lakhs
so, 4 lakhs upon 40,000. So, ratio is 10; inventory turnover ratio is 10, but it can be also
calculated in terms of number of days. Now, can you calculate it in number of days?
(Refer Slide Time: 21:43)
How much was inventory? 40,000, sales was 4 lakhs; now 40,000 upon 4 lakhs instead
of doing 4 lakh upon 40 which was 10 we are doing 40,000 upon 4 lakhs; that means, 1
by 10 multiplied by 365 days. So, you will get 36.5, now this is in terms of days, now
you can I think understand it better. So, company on an average holds inventory of 36.5
days.
Now, we can compare it with their inventory policy, [FL] policy [FL] stock [FL]; that
means, stocks should have been 30 days, but actually they are having 36.5 days. So, we
can compare their policy with the actual and accordingly take the decisions for
improving the efficiency. Now, the same ratio can be calculated for debtors.
(Refer Slide Time: 22:49)
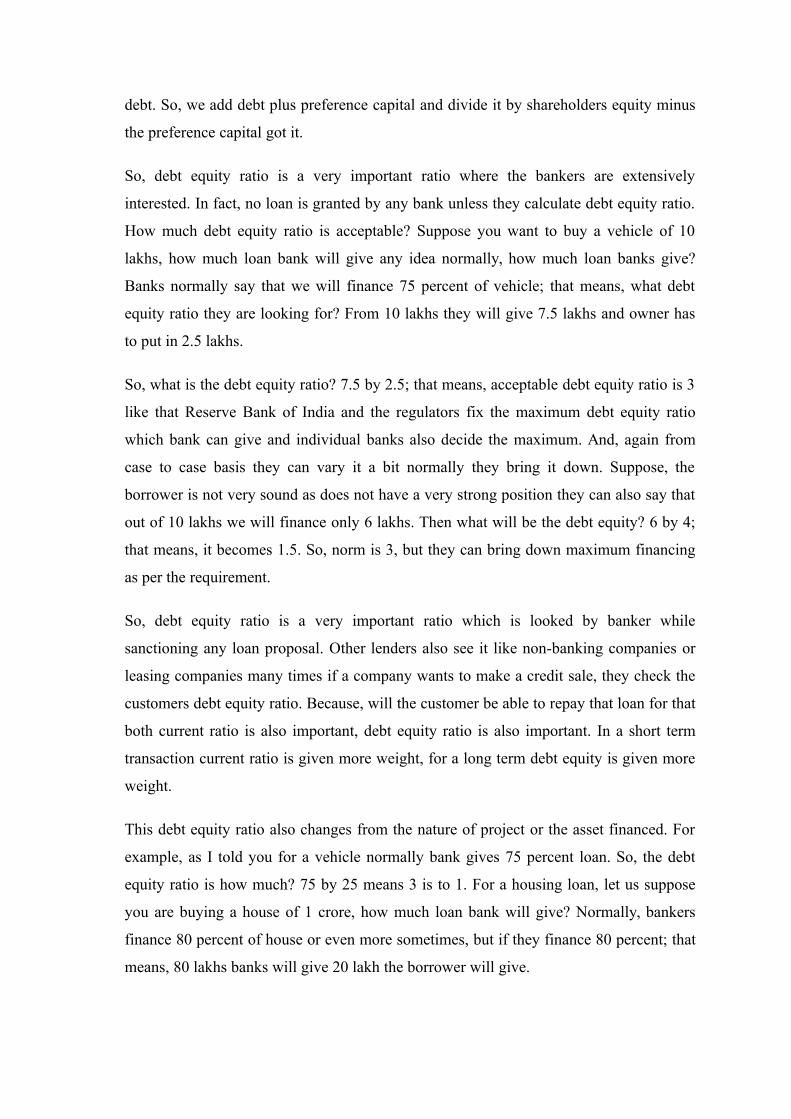
For debtors what will be the formula? It is sales upon debtors or accounts receivables,
but since accounts receivables are only applicable to credit sales we can improvise it by
taking the numerator as credit sales and divide it by average accounts receivable.
(Refer Slide Time: 23:13)
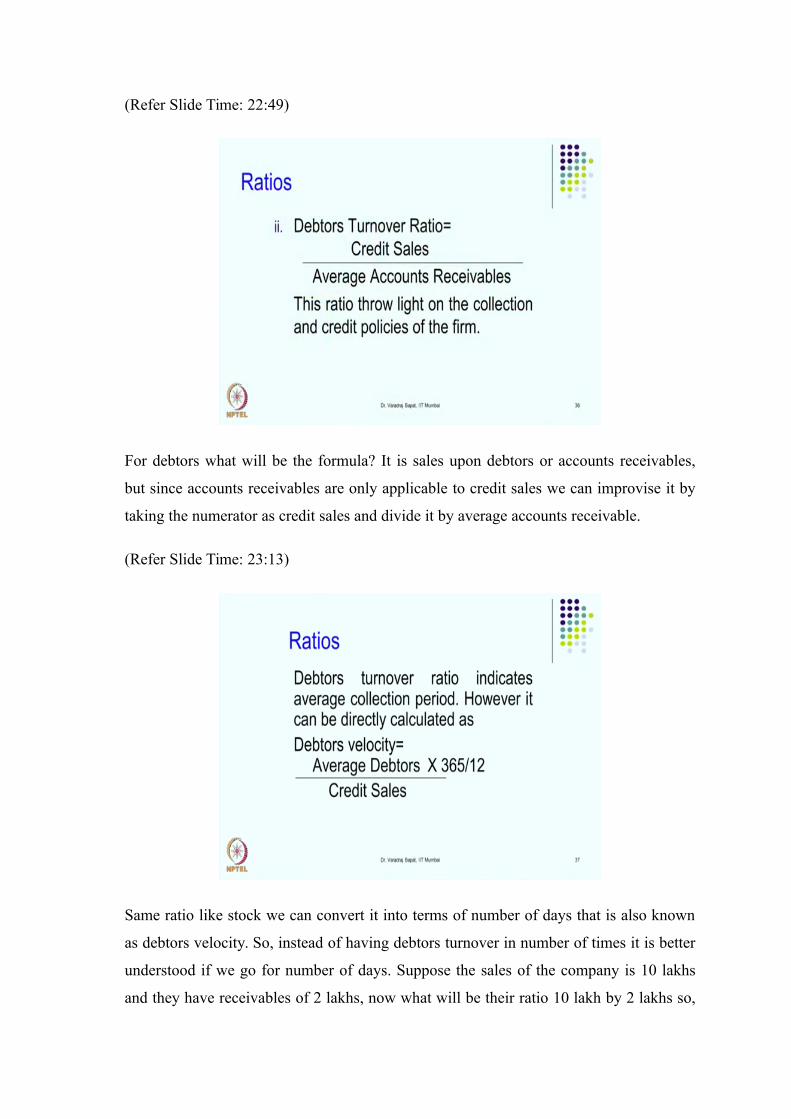
Same ratio like stock we can convert it into terms of number of days that is also known
as debtors velocity. So, instead of having debtors turnover in number of times it is better
understood if we go for number of days. Suppose the sales of the company is 10 lakhs
and they have receivables of 2 lakhs, now what will be their ratio 10 lakh by 2 lakhs so,

how much is the ratio? 5. Now, in terms of days how much it is? 2 lakhs by 10 lakhs; that
means, we get 1 by 5 into 365. So, how much it will be?
If it is more than 70 days, around 70 to 75 days roughly 72 days we can say is the
debtors, now you can really understand the gravity of the situation. Suppose, their policy
is to have credit for 30 days, they must have collected in 30 days at least in 30 to 35
days. But, here they have debtors for 72 days means almost more than a double their
policy; that means, their debtors management system is not efficient. So, for managers
they would continuously calculate this ratio and try to improve their performance. Will it
be useful to investors also or the shareholders also or the auditors also?
Answer is yes, because auditors or shareholders will also calculate this ratio when they
come to know that the policy of the company is 30 days, but the ratio is 72 days what
does it mean? There is every possibility that the debtors which the company as shown
has lot of wrong entries or false entries or there is a windowing dressing, there is a over
statement of debtors. So, we would try to investigate to find out the nature of debtors.
There are more ratios also like aging statements. So, we will try to find out that how
many days that debtors are still there with the company; like that lot of hints can be there
further investigation in that. Now, the next ratio is creditors turnover ratio.
(Refer Slide Time: 25:59)

So, normally we take sales upon that item, but since creditors are related to purchases,
we take purchases particularly we will take credit purchases. So, credit purchase upon
average accounts payable.
(Refer Slide Time: 26:17)
So, here also we can convert it into number of days and know within how many days we
are repaying. Suppose our normal policy is to have a credit of 30 days, but we are
repaying in only 20 days; we will have to check whether we are getting any discount for
early repayment or where our people are unnecessarily paying before time. Or, if it is too
long, investors will be interested in knowing whether there is any problem with the
company; [FL] time [FL] cash [FL] repay [FL] or whether their purchases are dummy,
they are showing some wrong figures in purchase, but do not pay in time. So, this ratio is
also important.
So, we have now covered the liquidity ratios, then we have also discussed the ratios like
debt equity which were about stability and now we have discussed the ratios on
efficiency. In the next session we will go for next round of ratios [FL].