financial accounting consequences of temporary tax … dissertation... · financial accounting...
TRANSCRIPT

Financial Accounting Consequences of Temporary Tax Law: Evidence from the R&D Tax Credit
Jeffrey L. Hoopes Ross School of Business University of Michigan
Current Draft: January 11, 2013
Abstract: This paper investigates the extent to which extensions of a temporary tax law reduce market participants’ ability to predict and understand corporate earnings. Examining evidence from eight separate extensions of the R&D tax credit, I find that market participants adjust their expectations for corporate earnings upwards in response to extensions of the R&D tax credit, but doing so decreases the accuracy of earnings forecasts. The evidence also suggests that bid-ask spreads around quarterly earnings announcements increase by 25% for firms affected by an expired R&D tax credit, suggesting that trading costs rise when markets have difficulty interpreting earnings affected by the expired R&D tax credit. The results of this study call attention to previously unexplored costs of temporary tax laws—capital market confusion related to corporate earnings affected by expired tax laws.
JEL Codes: M41, M48, H25, K34 Keywords: earnings predictability, temporary tax law, R&D tax credit I express gratitude to members of my dissertation committee: Michelle Hanlon (co-chair), Greg Miller (co-chair), Jim Hines, Roby Lehavy and Joel Slemrod. I also appreciate help and input on this paper from B. Blankespoor, E. De George, B. Hepfer, T. Hoopes, R. Hucks, B. Lester, K. Merkley, P. Michaud, J. Miller, J. Pittman, T. Qu, J. Thornock, J Wilde and C. Williams. I thank participants at the University of Michigan’s Kapnick Accounting Seminar and the Public Finance Free Lunch Seminar. This paper has also benefited from discussions with several equity analysts and tax professionals, especially Walter Brickman, Todd Castagno and Greg Jonas, to whom I am indebted. Finally, I am grateful for financial support from the Deloitte Foundation Doctoral Fellowship, the Office for Tax Policy Research, the Paton Fellowship, and the PricewaterhouseCoopers-Norm Auerbach Doctoral Student Fellowship.

1
1. Introduction
U.S. tax law contains an increasing number of temporary provisions. In the late 1990s,
there were fewer than a dozen temporary tax measures. As of 2010, there were 141 (McKinnon,
Fields and Saunders, 2010). A key feature of these temporary tax provisions is that they are
often extended. Many extensions are made retroactively, after the provision has expired.
Although such provisions are increasingly common, little is known about the consequences of
these temporary tax laws. Temporary tax laws directly affect financial reporting because
financial accounting requires firms to assume expired tax provisions will not be extended. This
means managers must initially report a different tax expense than will be reported at year end.
To what extent temporary tax laws create unintended consequences is an open question. To
address this question, I examine eight separate retroactive extensions of the Research and
Development (R&D) tax credit. I find that when market participants revise their earnings
forecasts following an extension of the R&D tax credit, the portion of the revision attributable to
the R&D tax credit extension makes the revised forecast less accurate, moving the forecast
incrementally away from earnings by $0.039. I also find that bid-ask spreads are significantly
larger in earnings announcement periods affected by the expired R&D tax credit. My results call
attention to previously unexplored costs of temporary tax laws: the inability of capital market
participants to understand the financial accounting consequences of temporary tax laws.
The R&D tax credit was introduced in 1981 and has since expired and been extended 15
times.1 Since 1992, these extensions have all been retroactive. Most recently, the credit expired
1 The R&D tax credit is called the “Credit for Increasing Research Activities” on Form 6765, in Internal Revenue Code §41, and in §221 of the Economic Recovery Tax Act of 1981, which initiated the credit. Official IRS sources call it the “Corporate Research Credit.” It is also called the Research and Experimentation tax credit. The credit allows taxpayers a nonrefundable tax credit for a percentage of the difference between their qualifying R&D expenditures and a calculated base that is based on prior year’s R&D spending sales. Calculating the credit requires subjective judgments which must be documented, and is often audited by the IRS (Daily Tax Report, 2012).
2
on December 31, 2011, and was retroactively extended on January 2, 2013 (just missing the
deadline that would have allowed calendar year end firms to take advantage of the credit in
their 2012 annual earnings). A large body of work finds that the R&D credit stimulates
incremental R&D investment.2 However, this literature has generally ignored the temporary
nature of the credit and has also ignored the financial reporting and capital market
consequences of the credit (Klassen et al., 2004).
The investment effects of the temporary nature of the R&D credit are difficult to study
because their study is predicated upon understanding managers’ priors about the tax credit’s
extension. Therefore, I focus on financial reporting related outcomes, both because they are
interesting in their own right and because they do not depend upon managerial expectations
about extension. Financial reporting outcomes will be affected because financial accounting
requires managers to assume that expired provisions will not be extended when calculating the
tax expense (ASC 740-10-30-2). When an extension occurs, managers must include the effect for
all previous quarters in the quarter of extension.
Forecasting earnings per share (EPS) requires understanding the earnings effect of a
firm’s tax position. Market participants may not understand the impact of the tax effect on
earnings or may not have enough information to calculate the impact. Alternatively, they may
understand. Market participants may correctly revise earnings expectations because some
temporary tax laws, such as the R&D tax credit, are well known and frequently expire. Such
frequent expirations and extensions may allow market participants to understand the effect of
the extension of the R&D credit. Further, the extension of the R&D credit is relatively simple.
2 This literature examines the effects of the R&D tax credit on investments in R&D, the trade-off between qualified (incented) expenditures versus non-qualifying expenditures and implicit taxes associated with increased prices of R&D related goods (e.g., Altshuler, 1988; Hines, 1994; Hall and Van Reenen, 2000; Berger, 1993; Bloom, Griffith and Van Reenen, 2002; Klassen, Pittman and Reed, 2004; Wilson, 2009; Rao, 2010 and Gupta, Hwang and Schmidt, 2011).

3
Plumlee (2003) finds that analysts’ understanding of tax law changes decreases in the
complexity of the change—analysts understand simple tax law changes. To what extent market
participants understand the effect of temporary tax laws is an empirical question.
I examine eight instances when the R&D tax credit expired and was then extended
retroactively. I find that market participants misforecast the R&D tax credit’s effect on earnings
directly following an extension of the R&D credit. Analysts do not merely ignore extensions of
the credit—analysts discuss the R&D tax credit just after the credit is extended. Further, the
magnitude and quantity of forecast revisions following extensions of the R&D tax credit
increase. However, these revisions make analysts’ EPS forecasts incrementally less accurate. The
average incremental effect of the R&D tax credit extension on EPS forecast revisions moves the
outstanding forecast away from earnings by $0.039, decreasing accuracy. This incremental
decrease is material. The average forecast revision for all revisions in my sample (both R&D tax
credit firms and non-R&D tax credit firms) moves forecasts $0.065 closer to realized earnings.
I next examine whether this lack of predictability increases trading costs. Prior literature
suggests that if earnings are less predictable, trading costs (i.e., bid-ask spreads) will increase
(Affleck‐Graves, Callahan and Chipalkatti, 2002). I find that the bid-ask spread associated with
the release of quarterly earnings incrementally increases by 25% for firms that usually receive
the credit in quarters when the credit is expired. For 2008, the most recent expiration year with
available data, the aggregated increase in trading costs is about 2% of claimed R&D tax credits.3
The results are robust to an array of sensitivity tests that control for observed and
unobserved heterogeneity across forecasters, firms and earnings announcement periods. For the
3 Like the R&D tax credit itself, this increase in trading costs is not a net cost to society, but a transfer of wealth. The actual cost (deadweight loss) comes from the decreased market efficiency and foregone trades resulting from increased trading costs. Comparing the trading costs associated with the temporary credit to the expenditure cost of the R&D tax credit compares the size of one transfer to another, providing a useful comparison.
4
tests related to earnings predictability, I conduct several robustness tests that consider other
parts of the legislation that extend the R&D tax credit. I also conduct placebo tests examining
time periods (placebo bill enactment dates) and forecasts (pretax earnings forecasts) not affected
by the R&D credit. These tests fail to obtain the same results as when using the true treatment
(time periods and forecasts that should be affected by the credit). I also find predictable cross-
sectional variation related to the level of corporate disclosure in the relationship between
forecast accuracy and the R&D tax credit, and related to the level of investor sophistication in
the relationship between bid-ask spreads and the R&D tax credit.
These findings are useful to both researchers and policymakers. This paper adds to the
literature that examines market participants’ understanding of tax law changes (e.g., Givoly and
Hayn, 1992; Chen and Schoderbek, 2000; Plumlee, 2003) in the novel environment of frequently
extended temporary tax laws. As an increasing number of tax incentives are temporary, my
findings are useful to those trying to understanding the effect of taxes on corporate behavior.
Policymakers will find this evidence useful for several reasons. First, I document
nontrivial costs associated with temporary tax laws. These costs should be netted against any
benefits of maintaining temporary tax laws in order to assess the advisability of making these
laws permanent or rescinding them. Second, this paper confirms concerns that tax law changes
may have unanticipated financial reporting consequences (e.g., Neubig, 2006; Raedy, Seidman
and Shackelford, 2011; Hanlon, 2012). Lastly, the results in my cross-sectional test of disclosure
speak to concerns regulators have had regarding the sufficiency of tax-related disclosures in
firms’ financial statements (e.g., Jaworski, 2012).
The rest of the paper proceeds as follows. In Section 2, I develop the hypotheses. Section
3 outlines the data and discusses research design. Sections 4 and 5 present the results from tests

5
of my first and second hypotheses. Section 6 contains two cross-section tests, and a series of
robustness tests. Section 7 concludes.
2. Hypothesis Development
Temporary tax provisions such as the R&D tax credit have become a common feature of
the U.S. tax code (e.g., McKinnon et al., 2010). They are often derided for being “year-to-year,
start-and-stop, lobby-fest[s] (Beller, 2012),” and are considered one of the largest problems with
U.S. corporate tax law (U.S. Chamber of Commerce, 2011). However, little is known about the
consequences of temporary, but frequently extended, tax laws in general. Even less is known
about the financial reporting and market consequences of temporary tax laws.4
There is work that examines the financial accounting related effects of permanent tax
law changes.5 Givoly and Hayn (1992) examine market reactions surrounding news events
related to the Tax Reform Act of 1986 (TRA 86). They find that the market impounded the effect
of the tax rate decrease on firms’ deferred tax liabilities. Partially consistent with these findings,
Plumlee (2003) also finds that analysts are able to impound the results of simple tax law changes
into their forecasts, but cannot understand more complex tax law changes.6
4 A discussion of any effect of temporary tax laws is currently absent from the literature (Shackelford and Shevlin, 2001; Hanlon and Heitzman, 2010, and Graham, Raedy and Shackelford, 2011 do not discuss temporary tax provisions). There are non-empirical legal papers that discuss the potential causes and consequences of temporary tax law (e.g., Kysar, 2005) but these focus on political reasons such laws are not made permanent. There are also papers that examine the effects of temporary tax laws, but not laws that are frequently extended. These papers find timing of transactions and events to take advantage of favorable tax treatment (e.g., Kopczuk and Slemrod, 2003; House and Shapiro, 2008; Hanlon and Hoopes, 2012). 5 Others examine market participants’ ability to understand tax motivated behavior, finding that market participants understand this behavior (Gleason and Mills, 2008), that they do not understand (Shane and Stock, 2006), and that it depends on the market participant whether the behavior is understood (Erickson, Heitzman and Zhang, 2011). 6 To measure complexity, Plumlee (2003) classifies tax law changes based on the AICPA’s Tax Complexity Index. This 15 question assessment, applicable to any tax law change, is used to score the six different tax law changes that Plumlee (2003) examines. The examined tax law changes received scores ranging from 1.7 to 31.0. The temporary tax law I evaluate, the R&D credit extensions, are relatively simple. For example, Section 301 of the Working Families Tax Relief Act of 2004, which extended the R&D tax credit, has a score of 3. Market participants may well be able to understand these tax law changes.

6
While there is evidence of market participants understanding one-time (non-recurring)
tax law changes, there is also evidence to the contrary. Chen and Schoderbek (2000) find that the
market did not correctly impound the deferred tax effects of a 1% change in the corporate tax
rate in 1993. This change occurred shortly after the financial accounting rules for taxes changed
with the adoption of SFAS No. 109 (now part of ASC 740). Chen and Schoderbek (2000)
attribute some of the failure to correcting impound information to the new accounting standard.
There is conflicting evidence regarding whether market participants understand one-
time tax law changes. Whether market participants understand repeated tax law changes like
the R&D credit extensions hinges on several factors. These factors include whether the specific
temporary tax law under consideration (e.g., the R&D credit) is relatively simple (Plumlee,
2003) and whether market participants understand the financial accounting rules behind the
law change (Chen and Schoderbek, 2000). In general, while calculation of the credit is
complicated, the effects of the expiration reinstatement of the credit are relatively simple.
Further, as the credit has expired repeatedly, market participants can learn from past
expirations.
Forecasting the effects of the R&D tax credit also depends on whether the requisite
information is available to calculate the expected change in earnings because of an expired or
extended tax credit. Disclosure regarding research and development and the R&D tax credit is
often scant, creating an environment where market participants lack relevant information
(Merkley, 2011). Even for firms that disclose precisely how the R&D credit has impacted them
in the past, this may not help predict the effect of the credit in the future.7 In light of the above
7 This is because past values of qualifying R&D expenditures as a fraction of sales affect the current ability to qualify for the credit. Further, firms without taxable income will be limited in the benefit they receive from the credit. For example, Hawker Beechcraft Acquisition stated on 6/27/2010 that “due to our net operating losses and full valuation allowance, a reinstatement of the credit during the year would have no impact on our effective tax rate.”
7
arguments, it is unclear whether market participants will understand the earnings effect of the
R&D tax credit. This leads to the first formal hypothesis, which I present in alternative form:
H1: Retroactive extension of the R&D credit decreases market participants’ earnings forecast accuracy. If earnings are less predictable as a result of the R&D tax credit’s temporary nature, prior
evidence suggests real trading costs will increase (Affleck‐Graves et al., 2002).8 Kim and
Verrecchia (1994) consider a market where firms disclose information that is elsewhere
unobtainable, and which leads to differing interpretations regarding the information’s
implications for value. They show that information disclosures in this environment will increase
bid-ask spreads. In the case of the R&D tax credit, I posit that market participants vary in their
ability to make informed judgments about the earnings effect of the R&D tax credit. In quarters
when the credit is expired, varying ability to understand to what extent depressed earnings are
a result of the expired credit (if the trader is aware of the credit at all) will result in variation in
judgments about firm value, resulting in information asymmetry between traders. This
information asymmetry will increase trading costs, resulting in the following hypothesis:9
H2: Bid-ask spreads will increase around earnings announcements affected by the expired credit. 3. Sample Selection, Variable Measurement and Research Design
3.1 Sample Selection
To test these hypotheses, I use a sample of U.S. firms from non-regulated and non-
financial industries (excluding SICs 4900–4949 and 6000–6999) that have coverage on the
Compustat Quarterly file from 1994–2011. I retain only U.S. firms so the sample is more
8 One could also examine price responses around earnings announcement dates. Returns analysis would conflate the ability to predict the earnings impact of the credit and the cash flow implications surrounding expectations regarding extension of the credit. Under variations in assumptions regarding these items, one could plausibly predict very different returns responses, and it is difficult, if not impossible, to unravel which assumptions hold. 9 Correspondence with analysts shows variation in understanding the credit. One analyst stated, incorrectly, that “the credit is for smaller firms, whereas we are tracking and analyzing companies with well over $100M in assets.” In 2008, 86.9% of R&D tax credit dollars went to firms with assets over $50 million.

8
homogeneous with regard to reporting systems. I retain only non-regulated and non-financial
industries because the financial accounting and tax rules are different for these firms. My
sample period covers only 1994-2011 because machine readable 10-K filings are only available
since 1994, and I rely on 10-Ks to determine that firms receive the R&D tax credit. Only
calendar-year-end firms are used, allowing comparability across firms (i.e., extension in October
is always in the fourth quarter).10 For the earnings forecast analysis, the firm/quarter data is
merged with detailed analyst revisions from IBES. In the bid-ask spread analysis, the quarterly
firm/year data is merged with the TAQ database, allowing a measure of bid-ask spread. Table
1, Panels A and B contain an outline of the sample selection procedure.
Panel C of Table 1 shows the percentage of the firm/quarter level sample by industry,
for all industries that comprise over 1% of the sample. The first column represents the entire
sample. Columns 2–4 show the composition of the portion of the sample that receive the R&D
tax credit during the year, using three different measures of R&D Credit Exposure (described in
the next section). As is expected, the data show that some industries are more likely to receive
the credit than others. For example, Pharmaceutical Products, Electronic Equipment, and
Medical Equipment are much more likely than other industries to have R&D Credit Exposure.
3.2 Variable Measure and Research Design
This section describes how I identify which firms will be affected by the R&D tax credit.
Before I test my hypotheses, I also conduct tests to validate that analysts incorporate the effect
of the credit in their forecasts just following extensions of the credit (i.e., analysts do not ignore
extensions of the R&D credit). This analysis suggests that revisions following an extension of
the R&D credit contain analysts’ understanding of the extension of the R&D credit on earnings.
10 This does not appear to systematically eliminate any research-focused firms from my sample. 71% of U.S. based, non-regulated firms in Compustat in 2011 are calendar year end firms. In this same sample, 74% of the total R&D expense was recorded by calendar year end firms (as well as 79% of assets and 69% of sales).

9
3.2.1 Measurement of Research and Development Tax Credit Exposure
I consider two methods of identifying firms affected by the R&D tax credit (referred to
as R&D Credit Exposure): 1) estimating R&D Credit Exposure using R&D expense from the
financial statements, and 2) hand collecting the firm’s own disclosures regarding the R&D tax
credit. I choose the second option, as Rao (2010) finds financial accounting R&D expense is a
poor proxy for R&D tax credit use.11 Using firm disclosures, I measure R&D Credit Exposure in
three different ways.12 First, R&D Mention is an indicator variable coded to equal one for all
firms that mention the R&D tax credit anywhere in a 10-K (obtained by searching for a variety
of R&D tax credit related words, detailed in Appendix B). Second, R&D Expire Firm is an
indicator variable coded to equal one if the firm ever explicitly discloses that its earnings were
impacted by the expiring R&D tax credit. I obtain this measure by using a computer program to
find over 500 10-Qs that mention the R&D tax credit’s expiration having affected quarterly
earnings. I then manually read each one to ensure the disclosure relates to the U.S. federal R&D
tax credit. Finally, R&D in ETR Reconciliation is coded to equal one if the R&D tax credit is a line
item in the annual effective tax rate (ETR) reconciliation in year t. I obtain this measure by
locating any instance of the word “research” or “R&D” in the annual effective tax rate
reconciliation portion of firms’ 10-Ks. I then manually examine each of these reconciliations and
determine whether the line item involves the federal U.S. R&D tax credit.
11 Using disclosed R&D spending is a poor proxy for R&D tax credit receipts. Expensed R&D for financial accounting purposes is not equal to qualifying R&D spending for R&D tax credit purposes. Rao (2010) uses a sample 755 firm/year observations for which she has both IRS and Compustat data, and she finds that using only the Compustat data, her model incorrectly determines whether a firm is eligible for an unlimited credit 44% of the time, and that only 38% of financial accounting R&D expense qualifies for the R&D tax credit. 12 Using explicit credit related disclosures maximizes construct validity at the cost of external and internal validity. Firms that choose to disclose R&D Credit Exposure may not be representative of all R&D tax credit firms (external validity). Firms that disclose R&D Credit Exposure may be systematically different than other firms in ways related to my outcome variables, and that this sample selection bias results in invalid inference (internal validity). Another concern is that my measures capture disclosure generally. However, I predict that R&D Credit Exposure leads to less predictability and higher bid-ask spreads. Better disclosure generally results in lower bid-ask spreads and more forecastable earnings (e.g., Leuz and Verrecchia, 2000; Lang and Lundholm, 1996).

10
3.2.2 Timing of Analysts Reaction to R&D Tax Credit Extension
In order to test how accurately analysts forecast earnings following an R&D tax credit
extension, I first ensure that analysts are aware of the extension and try to forecast earnings
taking the effect of the R&D credit into account. This examination helps assuage concerns that
analysts merely ignore the effects of the tax credit or that they try to include its effect on
earnings before the credit is officially extended.13
First, analysts’ discussion of the credit peaks just after the credit is extended. Figure 1
graphs the number of analyst reports by month that reference the “R&D Tax Credit” or the
“research and development tax credit,” for 1997–2011 (years with enough data to have
meaning) for all analyst reports on Thomson One. This number is scaled by the total number of
reports on Thomson One in each month. The dark vertical lines represent months when the
R&D tax credit was extended. The credit is mentioned more frequently surrounding extension
months, suggesting that financial analysts do not ignore the effects the R&D tax credit.14
Next, analysts that cover R&D Credit Exposure firms issue more revisions just following
an extension of the R&D tax credit. Figure 2 graphs the number of standardized forecast
revisions per day in event time for R&D in ETR Reconciliation firms and for Non-R&D in ETR
Reconciliation firms. Event day zero represents the eight extensions of the R&D credit. This
graph suggests an increase in the number of revisions for R&D in ETR Reconciliation firms
versus Non-R&D in ETR Reconciliation firms. The number of revisions per day for the R&D in
ETR Reconciliation firms is higher than for Non-R&D in ETR Reconciliation firms 15 of the first 20
13 Correspondence with analysts suggests some analysts ignore the credit. Some analysts stated, “the R&D tax credit often gets lost in the wash…” or “I don’t model anything specific to the tax credit…” Alternatively, others indicated they forecast the credit just after extension of the credit. This occurred in a Prudential Equity Group research report on February 1, 2006: “We will re-visit our EPS estimates once the R&D tax credit is formally extended.” 14 Inspection of some reports reveals that these discussions are about including the credit after extension. For example, Robert Gold of Brigantine Advisors noted on February 9, 2011 that “As a result of the reinstatement of the federal R&D tax credit, we raise our Q4 EPS forecast by $0.02 to $0.20…”
11
days. This difference is statistically significant—if R&D and non-R&D firms had an equal
chance of having more revisions than the other type of firm, there is a 2.069% chance of 15 or
more out of 20 days having more revisions for R&D in ETR Reconciliation firms than for Non-
R&D in ETR Reconciliation. The data suggest that analysts respond to the extension of the credit
by issuing more revisions of forecasted earnings.15
In order to confirm that this heightened number of revisions is not spurious, I replicate
this analysis using placebo extension dates (1 year and 6 months before the actual dates). I
obtain 8, 12, and 11 instances in the first 20 days following extensions where R&D Credit
Exposure firms have more revisions than the non-R&D Credit Exposure firms (outcomes that
happen with greater than 25% probability).
Finally, I find that revisions that span an R&D tax credit extension for R&D Credit
Exposure firms are larger than other revisions. To test this, I estimate the following regression on
a panel of analysts’ forecast revisions of EPS that is outlined in Table 1, Panel A.
Revision = β0 + β1Extension Between Revisions + β2R&D Tax Credit Exposure + β3Extension Between Revisions X R&D Tax Credit Exposure + ∑βkFixed Effects + ϵ
(1)
Revision is equal to the value of the forecast revision of EPS (the outstanding forecast less
the most recent outstanding forecast). Extension Between Revisions is coded to equal one if the
analysts’ most recent outstanding forecast is before an extension of the credit, and the revision
occurs after the extension of the credit. β3 represents the incremental change in the EPS forecast
for a firm with R&D Credit Exposure where the revision spanned the passage of a R&D credit
extension. If analysts include the earnings effects of the extended credit in their revision β3 will
15 This analysis assumes that whether the difference between the number R&D in ETR Reconciliation and Non-R&D in ETR Reconciliation revisions in a day is distributed binomial, with p=0.50. Duplicating this analysis for the other two proxies of R&D Credit Exposure, R&D Mention and R&D Expire Firm yields 15 and 19, respectively, out of the first 20 days having more revisions for R&D Credit Exposure firms. Combined, the chances of achieving 15+19+15=44 or more revisions for R&D Credit Exposure than Non-R&D Credit Exposure out of 60 days (20 days each across the three proxies) of having more revisions for R&D Credit Exposure firms is 0.00000030 (this test assumes independence between the three measures of R&D Credit Exposure).

12
be positive. The results of estimating Model 1 are in Table 3. The coefficient on the variable of
interest, Extension Between Revision X R&D Credit Exposure, is significantly positive, with values
across the three proxies ranging from 0.127 to 0.200. These values suggest that analysts do not
ignore the R&D credit, and include the credit’s effects in their revision following its extension.
In sum, analysts discuss the credit in their reports around credit extensions, they issue
more revisions, and the revisions they issue are on average larger following an extension of the
R&D tax credit. This evidence is consistent with analysts incorporating the credit into their
forecasts just after the extension of the credit.16
4. Test of First Hypothesis - Earnings Forecasts and the R&D Tax Credit
4.1 Research Design
The main test of H1 examines the accuracy of analysts’ forecast revisions when an
analyst has an outstanding forecast, the R&D tax credit is extended, and the analyst revises his
earnings forecast. The test examines the effect of two simultaneous treatments using a
difference in difference test design. For a revision to include the effect of the newly extended
R&D tax credit I argue that the firm must receive the R&D tax credit (the first treatment, R&D
Credit Exposure) and that the revision must be updating a forecast that happened before the
extension of the R&D tax credit (the second treatment, Extension Between Revisions). As a result, I
separate forecast revisions into four different categories: 1) revisions for firms that do not
receive the R&D tax credit and are not updating a forecast that happened before the extension
of the R&D tax credit, 2) revisions for firms that do not receive the R&D tax credit but are
updating a forecast that happened before the extension of the R&D tax credit, 3) revisions for
16 In untabulated analysis, I investigate when analysts remove the effects of the R&D tax credit from their estimates. I find no evidence that analysts remove the effects of the R&D tax credit just following an expiration of the R&D tax credit. Specifically, using annual forecasts of EPS, I find no consistent change in Forecast Improvement following expirations of the R&D tax credit for firms that receive the R&D tax credit.
13
firms that do receive the R&D tax credit but are not updating a forecast that happened before
the extension of the R&D tax credit, and finally, 4) revisions for firms that both receive the R&D
tax credit and update a forecast that happened before the extension of the R&D tax credit. My
test compares whether revisions in the fourth category move the forecast incrementally further
away from earnings than the other three categories. This test is done in a regression framework:
Forecast Improvement = β0 + β1Extension Between Revisions + β2R&D Tax Credit Exposure + β3Extension Between Revisions X R&D Tax Credit Exposure + ∑ βkFixed Effects + ϵ.
(2)
The coefficient of interest, β3, represents the incremental effect of receiving the credit
combined with having the revision update a forecast that occurred before an extension of the
R&D tax credit.17 Forecast Improvement is equal to the signed difference between the absolute
forecast error of a quarterly EPS forecast and the absolute forecast error of the revision to that
forecast, all scaled by price per share at the beginning of the quarter and multiplied by 100.18 It
represents the relative degree to which the revision moves the forecast towards (or away from)
actual realized earnings. Positive values of Forecast Improvement mean that the revision
improved the forecast (i.e. made the forecast more accurate, moving it closer to realized
earnings), and negative values indicate that the revision made the forecast less accurate.
Extension Between Revisions is coded to equal one if, after the enactment of the R&D tax credit,
the analyst revised a forecast that occurred before the R&D tax credit extension (extension dates
are in Appendix A). Fixed Effects include year and quarter fixed effects, controlling for annual
and repeated intra-year variation in Forecast Improvement. I cluster standard errors by analyst. A
negative β3 supports H1, meaning that forecast revisions following extensions of the tax credit
17 β3 will be the difference of the mean value of Forecast Improvement for category 4 less the mean of category 3, all less the mean of category 2 less the mean of category 1. Using the notation of Figure 3, β3 will be the mean value of Forecast Improvement of (AB-BC)-(DE-EF). 18 Cheong and Thomas (2012) document that scaling by price may impose bias on coefficient estimates. They recommend sensitivity tests using dependent variables not scaled by price, and including price as a control variable. Not scaling by price and including price as a control variable does not alter my inference.

14
for R&D Credit Exposure firms decrease the accuracy of the outstanding forecast, suggesting that
the retroactive extension of the R&D credit adversely affects earnings predictability.
Figure 3 contains a timeline of quarterly earnings forecasts and the R&D tax credit
extension date. Firm A has R&D Credit Exposure, while Firm B does not. The test of H1 compares
Forecast Improvement for revisions (i.e., the difference between forecast A and forecast B, revision
AB) that span a R&D tax credit extension date (the lines down the middle of the figure) for R&D
Credit Exposure firms (Firm A), to the other types of revisions. If H1 holds, I expect to see the
incremental effect in forecast accuracy improvements for revisions that span an extension of the
credit for firms affected by the credit (revisions like revision AB in Figure 3) to be negative, and
therefore, β3 to be negative.
4.2 Results
The results of estimating regression 2 are tabulated in Table 4. β1 is positive, which is
consistent with revisions that span an extension of the tax credit being more accurate for firms
that do not receive the R&D tax credit than revisions that do not span an enactment date. I
discuss this more fully in Section 6.2.4.19
The coefficient on Extension Between Revisions X R&D Credit Exposure, β3, is reliably
negative across all three proxies for R&D Credit Exposure, consistent with H1. The coefficient
ranges from negative 0.125 to negative 0.159. The coefficients suggest a non-trivial impact on
forecast accuracy. The most conservative coefficient on the interaction term, obtained using
R&D Mention as a proxy for R&D Credit Exposure, is -0.125, and, after unscaling by lagged price
and dividing by 100, represents a $0.039 movement away from actual earnings. Thus, the data
19 Extension Between Revisions is inclined to be coded to equal one the longer the delay between a forecast and a revision, and the longer the delay, the more accurate a revision. This may bias the estimate of β1. To limit the effect this has on my estimation, I choose a relatively narrow time frame, 30 days, for declaring a forecast stale and discarding it. Limiting my sample to revisions with no more than 30 days also increases the likelihood that the only material event for the firm in that time period was the R&D tax credit extension.

15
are consistent with forecasts becoming less accurate. Put in perspective, the mean value of
Forecast Improvement for my entire sample is 0.19, which corresponds to a $0.065 movement
closer to earnings per share.
5. Tests of Second Hypothesis – Bid-Ask Spreads
I next explore the increase in trading costs associated with earnings announcements
affected by the expired R&D tax credit.20 To do this, I examine bid-ask spreads in the quarters
when the R&D tax credit is expired, but is eventually retroactively extended. I place firm-
quarter observations into four different categories: 1) quarters for firms that do not receive the
R&D tax credit where the credit is not temporarily expired, 2) quarters for firms that do not
receive the R&D tax credit where the credit is temporarily expired, 3) quarters for firms that
receive the R&D tax credit where the credit is not temporarily expired, and, 4) quarters for firms
that receive the R&D tax credit where the credit is temporarily expired. Model 3 compares the
size of the change in the bid-ask spread surrounding earnings announcements for firm-quarters
in these four categories:21
Abnormal Bid-Ask Spread = β0 + β1Lapsed Credit Quarter + β2R&D Tax Credit Exposure + β3 Lapsed Credit Quarter X R&D Tax Credit Exposure + ∑βkFixed Effects + ϵ
(3)
Abnormal Bid-Ask Spread is the average bid-ask spread from the event period
surrounding the earnings announcement date (trading day t-1 to t+1), less the average bid-ask
spread from the days t-45 to t-5. Bid-ask spreads are calculated using TAQ intra-day data,
where the bid-ask spread is first computed at a quote level as the offer price less the bid price,
20 I examine quarters when the credit is expired because this will reduce earnings, and an increase in bid-ask spreads may be more responsive to unexpected losses than unexpected gains. After adding an additional indicator variable for quarters where the credit was extended, and the interaction of this variable and R&D Credit Exposure, the effect on R&D Credit Expiration Quarter X R&D Credit Exposure remains positive and significant, and the sign on the interaction between the after extension quarter indicator and R&D Credit Exposure is either insignificant (in two cases), or significant and positive (in the remaining one case). 21 Specifically, β3 (without the fixed effects) would be the mean value of Abnormal Bid-Ask Spread for firms in categories (4-3)-(2-1).
16
divided by the average of the offer and bid price, all multiplied by 100. This offer level measure
is then averaged during each day for all offers occurring during normal trading hours, resulting
in a daily measure of bid-ask spread.22 The formulation of the dependent variable differences
out firm- and time- specific components of the bid-ask spread, leaving only the component due
to the specific earnings announcement period for a specific firm (Eleswarapu, Thompson and
Venkataraman, 2004).23 This estimation looks for systematic differences in Abnormal Bid-Ask
Spread for firms affected by the R&D tax credit (R&D Tax Credit Exposure) in quarters when
quarterly earnings will be affected by the expired tax credit (Lapsed Credit Quarter). An increase
in trading costs due to the expiration of the R&D tax credit will result in β3>0.
The results of this estimation are tabulated in Table 5. Column 1 uses R&D Mention as a
measure of R&D Credit Exposure. β1<0 indicates that in the quarter in which the credit is expired,
bid-ask spreads are also generally smaller. The estimate of a negative β2 reveals that firms with
R&D Credit Exposure generally have smaller bid-ask spreads than other firms. Using R&D
Mention, the coefficient of interest, β3, has a positive value of 0.066 (significant at the p<.05
level), consistent with an increase in trading costs as a result of the expired credit. The estimates
using the other two proxies for R&D Credit Exposure are also statistically significant at a p<.05
level or better, and range from 0.126 to 0.165 across the measures of R&D Credit Exposure.
22 For firms where an exact announcement time is available from IBES, if the earnings announcement took place after 4:00 PM Eastern Time, day t is moved to t+1 (Berkman and Truong, 2009). Limiting bid-ask spread calculations to trading hours is common (e.g., Lee, Mucklow and Ready, 1993). Much of the increase in bid-ask spread happens within the first half hour after an earnings annoucement (Lee et al. (1993)). Of all quarterly earnings announcements in IBES during my sample period, 15% happen during trading hours. In a random period, January and February, 2004, the mean Abnormal Bid-ask Spread (defined above) during market hours was 4.6, and during nonmarket hours was 9.9. To what extent my results are affected by limiting the bid-ask spread calculation to trades during market hours is not known, and is a limitation of this paper. 23 For example, systematic differences in bid-ask spreads related to the exchange on which the shares are traded (Affleck-Graves, Hedge and Miller, 1994), the number of market makers (Affleck‐Graves et al., 2002), specialist monopoly power (Glosten, 1989), market determined tic-size (Goldstein and Kavajecz, 2000), and general characteristics of the firm and economic conditions should all be differenced out. My simple model of abnormal bid-ask spread is similar to that used by Blankespoor, Miller and White (2012). Van Ness, Van Ness and Warr (2001) note that structural models intended to capture only the adverse selection component of bid-ask spread perform poorly, suggesting that use of a more complex model may induce noise in my measurement.
17
The size of the smallest coefficient of the three estimates using the three proxies for R&D
Credit Exposure, 0.066, suggests that the effect of the expiration of the R&D tax credit on trading
costs is non-trivial. Taking out the effects of scaling, this equates to a mean incremental increase
per share traded of $0.013 associated with the expiration of the R&D credit for affected firm-
quarters. To put this estimate in perspective, I estimate regression 3, replacing the two R&D tax
credit related variables and their interaction with an indicator variable, Big Miss, an indicator
variable equal to one for a firm missing the outstanding consensus earnings forecast by more
than $0.01 per share. The estimated coefficient on Big Miss is 0.208, which equates to a $0.019
increase in bid-ask spreads over the earnings announcement period. While the lapsed R&D tax
credit appears to have a material impact on the increase in bid-ask spreads, it is not as
substantial as the increase that results from missing quarterly earnings.
The aggregate effect of the lapsed R&D credit is large. There are 8,355 Lapsed Credit
Quarters for R&D Mention firms, which have a mean volume of 4.723 million shares during the
three day earnings announcement period. This results in an aggregate trading cost for R&D
credit exposed firms in expiration quarters from 1994–2011 of $525 million
(4,723,064*0.0133*8,355). Put in context, in 2008, the most recent expiration year with data
available, the IRS reports that non pass-through entities filing for a R&D tax credit claimed a
total of $8.1 billion dollars in R&D tax credits (including firms not publicly traded). The trading
cost increase during earnings announcement periods when the credit was expired in 2008 was
$143 million, or nearly 2% of R&D tax credits claimed.
6. Additional Analysis and Sensitivity Tests
6.1.1 Cross-Sectional Test of Disclosure
Lack of disclosure may be one reason analysts are unable to understand tax law changes
(Chen and Schoderbek, 2000). Examining this possibility corroborates the finding for H1 by

18
finding predictable cross-sectional variation. It also demonstrates a mechanism through which
the misunderstanding of the tax law change occurs (and through which it could be resolved). I
examine the effect of disclosure on the ability of analysts to improve their forecasts by
augmenting Model 2 with a proxy for corporate disclosure, Guide, which is an indicator variable
coded to equal one if the firm issued EPS guidance in that quarter (Miller, 2002):24
Forecast Improvement = β0 + β1Extension Between Revisions + β2Guidance + β3R&D Credit Exposure + β4Extension Between Revisions X Guidance + β5Extension Between Revisions X R&D Credit Exposure + β6R&D Credit Exposure X Guidance + β7Extension Between Revisions X R&D Credit Exposure X Guidance + ∑ βkFixed Effects + ϵ.
(4)
The variable of interest is β7, which I expect to be positive, meaning that revisions after
R&D tax credit extensions for R&D Credit Exposure firms incrementally improve forecast
accuracy more for guidance firms than non-guidance firms. Table 6 tabulates the results of
estimating Model 4. The estimate for β7 is positive for all three proxies of R&D Credit Exposure,
suggesting a mitigating effect of disclosure on the relationship between extension of the R&D
tax credit and Forecast Improvement. The estimates using R&D Mention and R&D Expire Firm as a
proxy for R&D Credit Exposure are both significant at the p<.05 level.25
6.1.2 Cross-Sectional Test of Investor Sophistication
Hand (1990) documents that market understanding of difficult accounting issues is
aided by having a sophisticated investor base. Having a larger proportion of the firm held by
relatively sophisticated investors increases the probability that any two investors trading will be
24 To ensure that my results are not biased by the documented biases in the CIG data, I follow Chuk, Matsumoto and Miller (2012) and also estimate my regression using a sample of firms with an above mean amount of analyst coverage. The statistical strength of my results substantially improves in this sample, with all three of the three way interactions being positive and significant at a p<.05 level or better. 25 The use of more tax-specific ways to gauge Disclosure yields the same relationships. Using the number of numbers (Blankespoor, 2012) or the number of words (Li, 2008) in the tax footnote, the natural log of both of these numbers, or an indicator variable coded to one if the firm has an above mean number of numbers in their tax footnote relative to other firms in the year with the three proxies for R&D Credit Exposure (for 15 total regressions), the coefficient on the three-way interaction term, Extension Between Revisions X R&D Credit Exposure X Disclosure, is positive in 15 of the 15 regressions, and significant at a two-tailed p<.10 level or better 6 of those 15 times.

19
sophisticated. Two sophisticated investors trading with each other may decrease the probability
that the bid-ask spread related to information asymmetry will decrease because both traders
will understand the effects of the credit on earnings. If institutional investors understand the
effect of the R&D tax credit on firms’ earnings, I would expect the bid-ask spread to be lower
during earnings announcement periods affected by the expired R&D tax credit for firms held by
institutional investors. To test this prediction, I estimate the following regression:
Abnormal Bid-Ask Spread = β0 + β1 Lapsed Credit Quarter + β2Institutional Investors + β3R&D Credit Exposure + β4 Lapsed Credit Quarter X Institutional Investors + β5 Lapsed Credit Quarter X R&D Credit Exposure + β6R&D Credit Exposure X Institutional Investors + β7 Lapsed Credit Quarter X R&D Credit Exposure X Institutional Investors + ∑ βkFixed Effects + ϵ.
(5)
The variable of interest is β7, and it is expected to be negative. I obtain the percentage of
the firm held by institutional investors through Thomson-Reuter’s Institutional Holdings (13F)
database. If a firm-quarter has more than the mean percentage of the firm held by institutions
for the year, then the variable Institutional Investors is coded to equal one. Model 5 is estimated
in Table 7. The coefficient on Lapsed Credit Quarter X R&D Credit Exposure X Institutional
Investors, β7, is negative in all three of the regressions, and negative and significant at a p<.01
level in two of the three regressions. This result is consistent with the effects of the R&D credit’s
extension being better understood at firms with a relatively more sophisticated investor base.
6.2 Robustness Tests of H1 and H2
The difference in difference test design used to test both H1 and H2 is designed to
eliminate many threats to validity, however, some validity threats may remain. This section
outlines several robustness tests I do to help validate my findings for H1 and H2. Different

20
sensitivity tests are required to help validate H1 and H2, as the two tests have differing
characteristics, different treatments, and differing available data.26
6.2.1 Robustness Tests of H1 – Correlated Omitted Variables
My difference in difference identification strategy limits the ability of correlated omitted
variables to affect my inference. However, in order to verify that my results are robust to the
inclusion of factors that may affect Forecast Improvement, I include controls for time-varying
attributes of the analyst (e.g., Clement, 1999) the firm, and the specific forecast (e.g., Cooper,
Day and Lewis, 2001 and Gleason and Lee, 2003). First, I control for Firm Specific Experience (the
number of years since an analyst issued their first forecast for the firm), General Experience (the
number of years since the analyst’s first forecast is recorded on IBES), Number of Firms Covered
(the number of different firms covered by the analyst in the fiscal year), and Percent R&D
Exposure Firms (the percentage of an analyst’s forecasts related to firms with R&D tax credit
exposure in the fiscal year). Adding these control variables to Model 2 does not affect inference.
Next, I control for firm and forecast specific attributes. I control for Momentum (as a
result of the findings of Cooper et al. (2001), measured as the buy and hold return for the six
months before the earnings announcement), Time Between Forecasts (days between the
outstanding forecast and the revision), Book to Market (the beginning of quarter book to market),
Analyst Coverage (the number of analysts forecasting earnings for the quarter), Forecast Horizon
(the days between quarter end and the forecast date) and Ln(MVE) (the beginning of quarter
logged market value of equity). Controlling for these factors also does not affect inference. In
additional tests, adding analysts fixed effects to Model 2 also does not change my inference.
26 For example, the availability of forecasts from forecasters other than equity analysts, and forecasts not affected by the tax credit (pretax income forecasts) allow for tests not available in the bid-ask spread setting. Further, since the treatment imposed in tests of H1 involve the passage of a specific bill that contains many other legislative items, the possibility that those other items affect my inference must be examined.
21
Table 8 tabulates the results of adding all these controls to Model 2. The three
coefficients from the interaction between R&D Credit Exposure (using the three proxies) and
Extension Between Revisions are -0.143, -0.191, and -0.192 (all significant at the p<.01 level),
comparable to the previous estimates (-0.123, -0.141, -.159). This suggests that the results are
robust to the inclusion of these effects, and that the difference in difference approach was
relatively successful in controlling for these factors.27
6.2.2 Placebo Tests
I next conduct three placebo tests. First, if my tests are capturing the effect of the R&D
tax credit, my results should not obtain in pretax earnings forecasts. To confirm this, I replace
the Forecast Improvement in earnings in Model 2 with the Forecast Improvement in pretax earnings.
In untabulated analysts, β3 for all three proxies of R&D Credit Exposure are insignificant (p>.10)
using a pretax forecast of earnings. This helps alleviate the concern that non-tax components of
the extension bills are responsible for the results.28
Next, while market participants such as equity analysts likely suffer from a lack of
information and may therefore be unable to forecast the credit, managers do not face this same
27 I also examine the possibility that the effect on Forecast Improvement is heterogeneous across bills, depending on certain bill characteristics. I augment model 2 by adding the three way interaction term Extension Between Revisions X R&D Tax Credit Exposure X Bill Characteristic. Since Bill Characteristic does not vary within Extension Between Revisions = 0, including the extra two-way interaction terms, or Bill Characteristic by itself, induces perfect multicollinearity in the estimation. Bill Characteristic is a measure of bill specific characteristics. Specifically, it is the 1) the number of days between the bill’s introduction and final passage (range, 40 to 565 days), 2) the number of words in the bill (range, 13,911 to 458,849 words), 3) the percentage of words in the bill dedicated to extending the R&D tax credit (range, 0.00021 to 0.010), 4-7) the log of (1) and (2), and indicator variables for above median values of (1) and (2). Between these seven measures of Bill Characteristic and the three proxies for R&D Credit Exposure, 21 separate regressions are estimated. In untabulated analysis, no consistent pattern emerges wherein these bill characteristics mediate the relationship between Extension Between Revisions X R&D Tax Credit Exposure and Forecast Improvement. 28 This test has several limitations. Pretax forecasts only exist since 2003 and are systematically different than other forecasts (Bradshaw, Plumlee and Yohn, 2011 and Ertimur, Mayew and Stubben, 2011). Further, coverage of the actual values of pretax earnings provided by IBES is incomplete. In additional analysis, I use Sales forecasts, and find a negative and significant β3. This test is subject to the same concerns as using the pretax forecast, and is therefore limited. That the sales forecast would also become less accurate is somewhat puzzling. It may be that portions of these bills do make sales less predictable for R&D firms, but that that uncertainty is resolved as one works down the income statement, arriving at pretax income. Then, the tax portion become uncertain due to the tax relations parts of bills that extend the R&D tax credit.

22
information shortage. Aboody and Lev (2000) show that managers have access to and
understand firm specific R&D related information. Given that managers have better
information than other market participants, I therefore expect to see no deterioration in
managers’ forecast accuracy surrounding credit extensions. To examine this, I estimate Model 2
using managers’ forecasts of EPS from the CIG database in place of analysts’ forecasts.29 If
managers understand the credit’s impact on earnings, and add the effect of the credit back to
earnings, the coefficient on β3 should be positive. The estimates from this test are displayed in
Table 9. Using all three proxies for R&D Credit Exposure (R&D Mention, R&D Expire Firm and
R&D in ETR Reconciliation), the interaction between R&D Credit Exposure and Extension Between
Revisions has positive and significant coefficients. These coefficients are in line with managers
having the appropriate information to understand the credit’s impact on the firm.
Next, as another way to corroborate that the result for H1 is not due to random chance, I
conduct a bootstrapping placebo test by scrambling the indicator variable Extension Between
Revision and R&D Credit Exposure across random observations, creating a placebo treatment.
Counting the number of times I estimate a coefficient β3 using the placebo treatment that is
larger than β3 using the true treatment is an estimate of the probability that results of a similar
magnitude would obtain if the treatment were random. I repeat this procedure 1,000 times for
the regression explaining Forecast Improvement for all three measures of R&D Credit Exposure.
For these three tests, I obtain coefficients that are larger than the true treatment 0, 0 and 2 times,
for the 1,000 replications. This helps confirm that I am documenting an analyst response to the
R&D tax credit, and not a random effect.
29 Few guidance revisions span an R&D credit extension for R&D Credit Exposure firms. As a result, even after allowing 60 days between revisions, only 16, 4 and 5 observations are equal to one for both Extension Between Revision and R&D Mention, R&D Expire Firm or R&D in ETR Reconciliation, respectively. Further, Chuk et al. (2012) indicate that the dates of managers’ guidance in the CIG database may not always be accurate, further limiting this analysis.

23
6.2.3 Other Portions of the R&D Tax Credit Extending Bills
The simple legislative language that extends the R&D credit is often included in other
legislative vehicles—omnibus bills that cover material from a broad range of topics. Firms that
claim the R&D tax credit may be systematically affected by the other portions of these bills in a
way that decreases forecast accuracy. I attempt to alleviate this concern with four separate tests.
First, I use a set of placebo omnibus bills that do not extend the R&D tax credit. I use the Library
of Congress’ Thomas system to locate 20 bills from the 104th to the 112th Congress that contain
the word “omnibus” in their title, and randomly choose eight with non-duplicative months that
do not extend the R&D tax credit. I use these dates to estimate Model 2, using the legislation
dates of these bills in place of the actual dates of R&D credit extensions. I expect β3 to be
insignificant. In untabulated analysis, I re-estimate Model 2, and find no consistent pattern of
negative, significant coefficients on β3 across the three proxies for R&D Tax Credit Exposure.
Next, I replace the placebo “omnibus” bills with placebo “tax” bills. I use the Thomas
system to obtain a list of all bills with the word “tax” in their title, and select all that seem
relevant to a large number of taxpayers and that do not extend the R&D tax credit.30 When I use
these placebo dates in place of the dates of real R&D tax credit extensions in Model 2, I do not
find consistently negative and significant coefficients on the interaction term between R&D
Credit Exposure and Extension Between Revisions. This means that Forecast Improvement does not
deteriorate for R&D credit firms upon the extension of these non-R&D tax related bills.
The non-R&D tax credit portions of the R&D credit extension bills may make earnings
difficult to predict for specific industries. For example, the effect of the extension of the Orphan
Drug tax credit on pharmaceutical firms may make earnings difficult to predict. If affected
30 I eliminating irrelevant bills such as H.R. 5394, which has as its sole goal “modify[ing] the taxation of arrow components. The final bills I use are the Tax Increase Prevention and Reconciliation Act of 2005, Tax Increase Prevention Act of 2007 and the Economic Growth and Tax Relief Reconciliation Act of 2001.
24
industries also receive the R&D credit (as some pharmaceutical firms do), this may affect
inference. To limit this concern, I estimate within industry regressions by including industry
fixed effects interacted with Extension Between Revisions, and included separately. Inference is
not changed, suggesting that my results are robust to industry characteristics that vary at the
Extension Between Revisions level.
Finally, I directly control for the mean effect of the R&D tax credit extension bills on
firms affected by these bills. I do this by examining the text of each bill and developing a bill
specific dictionary of terms contained in, and related to, the bill, for each of the eight extending
bills. Appendix C contains these dictionaries for each bill. I look for these words in each 10-K for
firms in my sample. If terms in the dictionary for Bill b that was passed in year t are in a firm’s
10-K in year t, that firm/year is coded as having been affected by a bill. I add this indicator
linearly to Model 2 as a control, as well as interact it separately with Extension Between Revisions.
In a separate test, I also limit the dictionary to contain only words specifically about tax credits
(bolded words in Appendix C), as well as search for only the title of the bill, and use indicators
for those 10-Ks matching those sets of words. Controlling for the specific effect of a bill on firms
using these different ways does not change the inference—the estimates of β3 remain negative
and significant. This result is consistent with my documented result being the effect of the R&D
tax credit, and not some other part of the legislation that extends the R&D tax credit.
6.2.4 Construction of the Variable Extension Between Revision
Next, I investigate whether the construction of the variable Extension Between Revision
imposes a relationship between Extension Between Revision and Forecast Improvement, affecting
the β1 coefficient and potentially affecting inference. This may pose a problem because Forecast
Improvement is increasing in the amount of time that elapses between two forecasts (as more
time passes, analysts have more information and are more accurate). In addition, the longer

25
between two forecasts, the more likely it is that any random date will fall between two
forecasts.31 My main tests limit this effect by requiring that the two forecasts be no more than 30
days apart. Further, the null result documented in the placebo test that randomly assigns a
treatment to observations also addresses this concern. However, while β1 does not have any
direct implications for my hypotheses, understanding the effect of the coding of Extension
Between Revision is important to validating my empirical design.
To further ensure that the way Extension Between Revision is coded is not a problem for
my inference, I estimate 24 untabulated regressions. Specifically, I 1) control for the time
between the two forecasts (Time) linearly, 2) control for Time, Time2 and Ln(Time), allowing for
nonlinearity, 3) include Ln(Time) and its interaction with Extension Between Revisions, 4) include
Ln(Time), and its interaction with both Extensions Between Revisions and R&D Credit Exposure, 5)
limit the variance in Time by allowing only 15 days in between forecasts, 6) regress Forecast
Improvement on Time, Time2 and Ln(Time) and then use the residual from that model as the
dependent variable in Model 2, 7) scale Forecast Improvement by Time, thus estimating the effect
of the credit per unit time, and finally, 8) include Time fixed effects, estimating a separate
intercept where Time is equal to x days, for x=1,2,3…30.
These different specifications alter the interpretation of the coefficients. However, all
address, in different ways, the concern that Extension Between Revisions may be mechanically
related to Forecast Improvement. I estimate these eight different specifications for all three of my
proxies for R&D Credit Exposure. In 24 of the 24 regressions, the interaction term between
31 For this reason, the median number of days in between the two forecasts for an observation in the sample coded as Extension Between Revisions=1 is 23, whereas for Extension Between Revisions=0 it is 16. This contrasts with the difference, for example, between the medians number of days for observations with R&D Mention = 1 and R&D Mention = 0, which are both 16. This difference in days is 1 or less for the other two measures of R&D Credit Exposure. It may also be the case that, given a reason to revise (the extension of the R&D tax credit), analysts more quickly update their forecasts. This problem would not occur if revisions were made at some fixed interval, as, for example, in Plumlee (2003) (as result of the use of First Call monthly forecasts).

26
Extension Between Revisions X R&D Credit Exposure is negative, and in 18 of the 24 is significant
at the two-tailed 10% level or better. Further, the size of the main effect for Extension Between
Revisions is reduced in these models (in some cases becoming insignificant), suggesting that
some of the size of the estimated β1 is due to the relationship between the time between
forecasts and Forecast Improvement.
6.2.5 Analyst-Level Specification
Next, I change the unit of observation in my estimation. This change helps assuage
concerns related to using forecast revisions as the unit of observation, which may place more
weight on firms or analysts with more revisions. Changing the unit of observation has the
downside of reducing the variance available in the estimations. I estimate the following model:
Average Forecast Improvement = β0 + β1Extension Bill Month + β2R&D Analyst + β3 Extension Bill Month X R&D Analyst + ∑ βkFixed Effects + ϵ.
(7)
This regression is estimated on a panel of analyst/month observations, where
observations from the original sample of forecast revisions are aggregated to the analyst/month
level. Average Forecast Improvement is the average Forecast Improvement (as previously defined)
for an analyst in the month. Extension Bill Month is an indicator variable coded to equal one if
the R&D tax credit was extended in the month of the observation. R&D Analyst is measured in
two different ways. First, I use an indicator variable coded to equal one if the analyst only
revised earnings for R&D Credit Firms in the month. Second, I define R&D Analyst as the
percentage of the analyst’s total revisions in the month that are for R&D Credit Firms. For this
test, the measure of R&D Credit Firm is a combination of all three measures used elsewhere in
the paper (i.e., it is the max of R&D Mention, R&D Expire Firm and R&D in ETR Reconciliation).
The coefficient of interest is β3, which is expected to be negative, meaning that analysts
that cover R&D Credit Firms are less accurate when they forecast in months with an extension of

27
the R&D tax credit, relative to analysts that do not cover R&D Credit Firms (or cover a smaller
percentage of R&D Credit Firms), and months that do not extend the R&D tax credit. The results
from the estimation of Model 7 are in Table 10. In both columns 1 and 2, which use different
measures of R&D Analyst, the interaction between R&D Analyst and Extension Bill Month is
negative and significant. These regressions suggest that extension of the R&D tax credit
decreased the ability of analysts to forecast earnings for firms affected by the R&D tax credit.
6.3.1 Robustness Tests of H2—Correlated Omitted Variables
I also conduct robustness tests to validate the results from my second hypothesis. Some
factors, such as those that vary from earnings announcement to earnings announcement by
firm, may be correlated omitted variables. If these variables are correlated with the interaction
between R&D Credit Exposure and Lapsed Credit Quarters, the inference could be confounded.
Several factors have been shown to influence bid-ask spreads around earnings announcements,
and in an untabulated sensitivity test, I control for some of these factors. First, I control for
Unexpected Earnings. Since the results from H1 show that analysts’ expectations with regards to
the R&D tax credit are biased, I use a simple time-series expectation model of Unexpected
Earnings, where the unexpected earnings is equal to earnings per share less special items in
quarter q of year t, less earnings per share less special items in quarter q of year t-1. I also control
for Ln(MVE) (the logged market value of equity from the end of the previous quarter (CSHFDQ
t-1*PRCCQ t-1)), and Abnormal Share Volume (the average amount of share turnover (CRSP
variables VOL/SHROUT) during the earnings announcement period minus the average
amount of share turnover from the 45 days prior to the earnings announcement). Following
Armstrong, Core, Taylor and Verrecchia (2011), I also control for the Number of Shareholders (a
rank variable, 1–5, for quintiles of Compustat variable CSHR, ranked by year). Finally, I control
28
for Earnings Announcement Lag (the time lag between a firm’s fiscal period end and the earnings
announcement date, RDQ-DATADATE).
After adding these controls, the coefficients on Lapsed Credit Quarter X R&D Tax Credit
Exposure remain positive and significant. Across the three different measures of R&D tax credit
exposure, the coefficient on the interaction term takes on values ranging from 0.05 to 0.14,
suggesting that even when controlling linearly for these other factors, firms experience higher
bid-ask spreads during earnings announcement associated with the R&D tax credit’s expiration.
6.3.2 Other expired Credits
While the R&D credit being expired complicates the understanding of earnings releases
affected by the expired R&D tax credit, if other tax credits are also expired for R&D credit firms
(other credits included in the corporate extenders) then my result may reflect credits other than
the R&D credit being expired, posing a threat to the validity of the results. To alleviate this
concern, I conduct two tests. First, if other credits are expired for firms in specific industries,
estimating within industry regressions should control for these other credits. My results hold if
I control for Fama-French 48 industry effects by interacting the vector of industry fixed effects
with Lapsed Credit Quarter while including industry effects separately, suggesting that the effect
is not due to industry effects that change with the expiration of the R&D tax credit.
Second, I explicitly control for the existence of tax credits that are extended
simultaneously with the R&D tax credit. I examine each extension bill in my sample, and
compile a list of tax credits included in each bill (the bolded words in Appendix C). I then
search the text of the 10-K for each firm in my sample in year t for words associated with a bill
passed in year t. If a credit was legislated in year t and is mentioned in a firm’s 10-K in year t,
then a variable, Credit, is coded to equal one. I augment model 3 to include the variable Credit
independently, and interact it will Lapsed Credit Quarter. The interaction between Credit and

29
Lapsed Credit Quarter represents the effect on the change in bid-ask spread associated with
having a credit that was passed along with the R&D tax credit extension in that year. The
interaction term between Credit and Lapsed Credit Quarter is significant and positive, consistent
with legislated credits causing difficulties in the quarters before they were passed/extended.
Further, the interaction term between R&D Credit Exposure and Lapsed Credit Quarter is positive
and significant. This result suggests that, even controlling for credits that were
passed/extended, the R&D credit’s being expired is still associated with increased trading costs.
6.3.3 Placebo Test
As an additional way to check the robustness of the results, I conduct a placebo test
using a bootstrapping technique. I randomly assign 12 quarters (the number of quarters with
expired credits) that did not actually contain the expired R&D credit as having a placebo
treatment. I then re-estimate the regressions in Model 3 replacing Lapsed Credit Quarter with
Placebo Treatment, repeating this random assignment 1,000 times. I then count the number of
times the coefficient on the interaction between R&D Tax Credit Exposure and Placebo Treatment
is larger than the coefficients generated by Model 3 with the true treatment. In this untabulated
analysis, 72 out of 1,000, 16 out of 1,000 and 6 out of 1,000 of the coefficients on the interaction
between Placebo Treatment and R&D Mention, R&D Expire Firm and R&D in ETR Reconciliation,
respectively, are larger than the coefficients estimated when using the true treatment effect. This
provides additional assurance that the result I am documenting is not due to random chance.
7. Conclusion
I investigate two financial accounting related consequences of temporary tax laws, using
the R&D tax credit as a case. Critics have long asserted that the temporary status of tax laws is
costly, but have not empirically tested their assertions. I provide evidence that the temporary
nature of the R&D tax credit decreases the predictability of quarterly earnings, degrading the
30
accuracy of revisions directly following extensions of the R&D tax credit. While market
participants revise their earnings in response to an extension of the R&D tax credit, these
revisions make forecasts incrementally less accurate. This result is robust to many different
specifications and sensitivity tests. I also find that bid-ask spreads incrementally increase by
25% during the three-day earnings announcement periods affected by the expired credit. This
increase in trading costs represents a material and measurable cost of temporary tax laws.
These results point to two very specific consequences of temporary tax laws that are
often retroactively extended, and especially of the R&D tax credit. Policymakers should
combine these results with other potential costs associated with temporary tax laws, and
compare them with the benefit society receives from maintaining temporary tax laws. This
comparison should inform policymakers’ choices as they consider making temporary tax laws
permanent, or eliminating these temporary laws altogether.
31
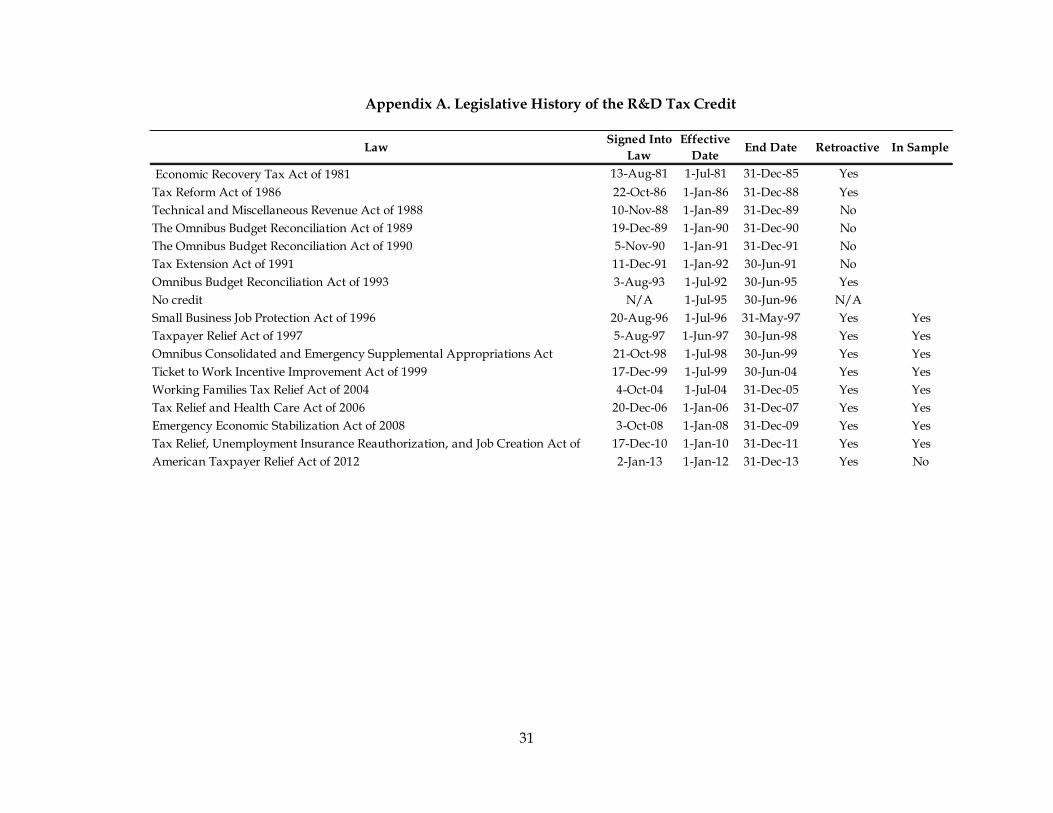
Appendix A. Legislative History of the R&D Tax Credit
LawSigned Into
Law
Effective
DateEnd Date Retroactive In Sample
Economic Recovery Tax Act of 1981 13-Aug-81 1-Jul-81 31-Dec-85 Yes
Tax Reform Act of 1986 22-Oct-86 1-Jan-86 31-Dec-88 Yes
Technical and Miscellaneous Revenue Act of 1988 10-Nov-88 1-Jan-89 31-Dec-89 No
The Omnibus Budget Reconciliation Act of 1989 19-Dec-89 1-Jan-90 31-Dec-90 No
The Omnibus Budget Reconciliation Act of 1990 5-Nov-90 1-Jan-91 31-Dec-91 No
Tax Extension Act of 1991 11-Dec-91 1-Jan-92 30-Jun-91 No
Omnibus Budget Reconciliation Act of 1993 3-Aug-93 1-Jul-92 30-Jun-95 Yes
No credit N/A 1-Jul-95 30-Jun-96 N/A
Small Business Job Protection Act of 1996 20-Aug-96 1-Jul-96 31-May-97 Yes Yes
Taxpayer Relief Act of 1997 5-Aug-97 1-Jun-97 30-Jun-98 Yes Yes
Omnibus Consolidated and Emergency Supplemental Appropriations Act 21-Oct-98 1-Jul-98 30-Jun-99 Yes Yes
Ticket to Work Incentive Improvement Act of 1999 17-Dec-99 1-Jul-99 30-Jun-04 Yes Yes
Working Families Tax Relief Act of 2004 4-Oct-04 1-Jul-04 31-Dec-05 Yes Yes
Tax Relief and Health Care Act of 2006 20-Dec-06 1-Jan-06 31-Dec-07 Yes Yes
Emergency Economic Stabilization Act of 2008 3-Oct-08 1-Jan-08 31-Dec-09 Yes Yes
Tax Relief, Unemployment Insurance Reauthorization, and Job Creation Act of 17-Dec-10 1-Jan-10 31-Dec-11 Yes Yes
American Taxpayer Relief Act of 2012 2-Jan-13 1-Jan-12 31-Dec-13 Yes No

32
Appendix B. Measurement of Variables
Abnormal Bid-Ask Spread = The bid-ask spread from the event period surrounding the earnings announcement date (t-1 to t+1), less the average bid-ask spread from the period t-45 to t-5. The bid-ask spread is first computed at a transaction level as the offer price (TAQ variable OFR) less the bid (BID) price, divided by the average of the offer and bid price, all multiplied by 100. This transaction level measure is then averaged during each day for all transactions occurring during normal trading hours, resulting in a daily measure of bid-ask spread. Extension Between Revision = An indicator variable coded to one if the two forecasts span the enactment date from the sample of R&D credit extensions (i.e., spans 8/20/1996, 8/5/1997, 10/21/1998, 12/17/1999, 10/4/2004, 12/20/2006, 10/3/2008 or 12/17/2010). Forecast Improvement = The unsigned forecast error before the revision (IBES variable abs(VALUE – ACTUAL)) less the unsigned forecast error after the revision, scaled by price at the beginning of the fiscal year period (Compustat Quarterly variable PRCCQ), all multiplied by 100. Lapsed Credit Quarter = An indicator variable coded to one if the R&D tax credit was expired during the entire quarter. Specifically, if the quarters fiscal period beginning and fiscal period end fall between 7/1/1998 and 10/21/1998 or 7/1/2004 and 10/4/2004 or 1/1/2006 and 12/20/2006 or 1/1/2008 and 10/3/2008 or 1/1/2010 and 12/17/2010 or 7/1/1996 and 8/20/1996 or 7/1/1997 and 8/5/1997 or 7/1/1999 and 12/17/1999 or 1/1/2010 and 12/17/2010. R&D Expire Firm = an indicator variable equal to one if the firm ever mentions in a 10-Q that its quarterly earnings were affected because of the expiration of the R&D tax credit. R&D in ETR Reconciliation = An indicator variable equal to one if the firm had a line item for the U.S. Federal Research and Development tax credit in its effective tax rate reconciliation in year t. R&D Mention = an indicator variable equal to one if the firm’s 10-K ever has the words “research and development tax credit,” “R&D tax credit,” “research and experimentation tax credit” or “research tax credit.” Revision = The value of the revision in quarterly EPS (the difference in IBES variables VALUE from one forecast to the forecast directly after follow) scaled by price at the beginning of the fiscal period (Compustat Quarterly variable PRCCQ), all multiplied by 100.
33
Appendix C. Word Lists for Identifying Firms Affected by Each R&D Credit Extension Bill
Bill Title = tax relief and health care act; emergency economic stabilization act; tax relief, unemployment insurance reauthorization, and job creation act; omnibus consolidated and emergency supplemental appropriations act; taxpayer relief act; ticket to work and work incentives improvement act of 1999; working families tax relief act; small business job protection act Small Business Job Protection Act of 1996 = 104-188; small business job protection act; august 20, 1996; biomass and coal facilities; contributions of stock to private foundations; diesel fuel dyeing; employer-provided educational assistance programs; fasit; financial asset securitization investment trusts; futa exemption for alien agricultural workers; gas station convenience stores and similar structures; modified guaranteed contracts; newspaper distributors treated as direct sellers; orphan drug; ozone-depleting chemicals; puerto rican economic activity credit; puerto rico and possession tax credit; r&d credit; r&d
tax credit; research credit; work opportunity tax credit Taxpayer Relief Act of 1997 = 105-34; taxpayer relief act; august 5, 1997; airport and airway trust fund; aviation fuel; brownfields; certain preferred stock treated as boot; clarification of authority to use semi-generic designations on wine labels; clean fuel vehicle; community development financial institutions; computer technology and equipment for elementary or secondary school purposes; contributions of stock to private foundations; controlled foreign corporations not subject to pfic inclusion; distilled spirits excise tax; electric and other clean-fuel motor vehicles; employer-provided educational assistance; employment tax status of securities brokers; empowerment zones; enterprise communities; exception from treatment of publicly traded partnerships as corporations; exemption from alternative minimum tax; expensing of environmental remediation costs; family-owned business exclusion; farmers' installment sales; foreign tax credit carrybacks; foreign tax credit limit; holding period applicable to dividends received deduction; incentives for education zones; limitation on exception for investment companies under section 351; livestock sold on account of weather-related conditions; multiple gasoline retail outlets treated as wholesale distributor; national railroad passenger corporation; orphan drug; passive foreign investment company; percentage depletion for marginal production; presidentially declared disaster; r&d credit; r&d
tax credit; research credit; research tax credit; restoration of leaking underground storage tank trust fund taxes; revitalization of the district of columbia; section 355; self-employment tax for certain termination payments received by former insurance salesmen; separate depreciation lives for minimum tax purposes; shrinkage for inventory accounting; simplified section 904; subpart f; tax treatment of redemptions involving related corporations; temporary unemployment tax; translating foreign taxes; virgin island bonds; welfare-to-work; work opportunity tax credit Omnibus Consolidated and Emergency Supplemental Appropriations Act of 1998 = 105-277; omnibus consolidated and emergency supplemental appropriations act; october 21, 1998; active financing income; biodiesel; commodity credit corporation; fuel use credits; orphan drug; r&d credit; r&d tax credit; research credit; subpart f; welfare-to-work credit; work opportunity credit Ticket to Work Incentive Improvement Act of 1999 = 106-170; ticket to work and work incentives improvement act of 1999; december 17, 1999; active financing income; cancellation of indebtedness income; conversion of character of income from constructive ownership transactions; distributions by a partnership to a corporate partner of stock in another corporation; electricity from certain renewable resources; employer-provided educational assistance; environmental remediation costs; excess pension assets used for retiree health benefits; installment method for accrual method taxpayers; orphan drug; percentage depletion for marginal production; qualified zone academy bonds; r&d credit; r&d tax credit; research credit; rum excise tax; subpart f; subpart f exemption; tax treatment of income and loss on derivatives; ticket to work; welfare-to-work credit; work opportunity credit
34
Working Families Tax Relief Act of 2004 = 108-311; working families tax relief act; october 4, 2004; accelerated depreciation for business property on indian reservation; clean-fuel vehicle; corporate donations of scientific property and computer technology; electricity produced from certain renewable resources; expensing of environmental remediation costs; indian employment tax credit; indian reservation; investment in the district of columbia; medical savings accounts; new york liberty zone benefits; orphan drug; percentage depletion for oil and natural gas; qualified electric vehicles; qualified zone academy bonds; r&d credit; r&d tax credit; research credit; tax on distilled spirits; welfare-to-work
credit; work opportunity credit Tax Relief and Health Care Act of 2006 = 109-432; tax relief and health care act; december 20, 2006; advanced mine safety equipment; american samoa economic development credit; brownfields remediation costs; cellulosic biomass ethanol; clean renewable energy bonds; credit for electricity
produced from certain renewable resources; distilled spirits; domestic production activities in puerto rico; energy credit; energy efficient commercial buildings; energy efficient homes; ethanol; gulf opportunity zone property; indian employment tax credit; indian reservation; investment in the district of columbia; kerosene used in aviation; marginal properties; methanol; mine rescue team training tax
credit; new markets tax credit; orphan drug; qualified restaurant property; qualified zone academy bonds; r&d credit; r&d tax credit; railroad track maintenance credit; research credit; residential energy efficient property; section 355; tonnage tax; welfare-to-work credit; work opportunity tax credit Emergency Economic Stabilization Act of 2008 = 110-343; emergency economic stabilization act; october 3, 2008; advanced coal project investment; advanced mine safety equipment; alternative fuel credit; alternative fuel vehicle refueling property credit; biodiesel; carbon dioxide sequestration; cellulosic biofuel; certain improvements to retail space; clean renewable energy bonds; coal excise tax; coal
gasification investment credit; controlled foreign corporations; domestic production activities in puerto rico; economic development credit for american samoa; energy credit; energy efficient appliance credit; energy efficient commercial buildings deduction; energy efficient home credit; environmental remediation costs; exxon valdez litigation; film and television productions; financial stability oversight board; geothermal heat pump systems; gulf opportunity zone; hope for homeowners amendments; hurricane katrina employees; indian employment credit; indian reservations; investment in the district
of columbia; marginal properties; marine renewables; mine rescue team training credit; motorsports
racing track facility; new markets tax credit; orphan drug; plug-in electric drive motor vehicles; qualified energy conservation bonds; qualified restaurant improvements; qualified zone academy bonds; r&d
credit; r&d tax credit; railroad track maintenance; renewable diesel; renewable energy credit; research
credit; residential energy efficient property; reuse and recycling property; rum excise tax; small wind property; smart grid systems; smart meters; steel industry fuel; subpart f; troubled asset relief program; troubled assets; wooden arrows designed for use by children; work opportunity tax credit Tax Relief, Unemployment Insurance Reauthorization, and Job Creation Act of 2010 = 111-312; tax relief, unemployment insurance reauthorization, and job creation act; december 17, 2010; alcohol used as fuel; alternative fuel; american samoa economic development credit; biodiesel; bonus depreciation; certain film and television productions; credit for nonbusiness energy property; credit for refined coal facilities; domestic production activities in puerto rico; employer wage credit; empowerment zone tax incentives; energy efficient appliance credit; energy efficient home credit; environmental remediation costs; excise
tax credits; go zone; indian employment tax credit; indian reservation; investment in the district of
columbia; low-income housing credit; marginal wells; mine rescue team training credit; motorsports
entertainment complexes; new markets tax credit; orphan drug; qualified leasehold improvements; qualified restaurant buildings; qualified retail improvements; r&d credit; r&d tax credit; railroad track
maintenance credit; rehabilitation credit; renewable diesel; research credit; rum excise taxes; rum excise taxes to puerto rico and the virgin islands; small business stock; temporary 100 percent expensing; work opportunity credit

35
References
Aboody, D. and B. Lev (2000). "Information Asymmetry, R&D, and Insider Gains." The Journal of Finance 55(6): 2747-2766.
Affleck-Graves, J., S.P. Hedge and R.E. Miller (1994). "Trading Mechanisms and the Components of the Bid-Ask Spread." The Journal of Finance 49(4): 1471-1488.
Affleck‐Graves, J., C.M. Callahan and N. Chipalkatti (2002). "Earnings Predictability, Information Asymmetry, and Market Liquidity." Journal of Accounting Research 40(3): 561-583.
Altshuler, R. (1988). "A Dynamic Analysis of the Research and Experimentation Credit." National Tax Journal 41(4): 453-466.
Armstrong, C.S., J.E. Core, D.J. Taylor and R.E. Verrecchia (2011). "When Does Information Asymmetry Affect the Cost of Capital?" Journal of Accounting Research 49(1): 1-40.
Beller, M. (2012). "Interior Secretary Urges Extension of Energy Production Tax Credit; Others Want Limits." Tax Notes. June 6, 2012.
Berger, P.G. (1993). "Explicit and Implicit Tax Effects of the R&D Tax Credit." Journal of Accounting Research 31(2): 131-171.
Berkman, H. and C. Truong (2009). "Event Day 0? After-Hours Earnings Announcements." Journal of Accounting Research 47(1): 71-103.
Blankespoor, E. (2012). "The Impact of Investor Information Processing Costs on Firm Disclosure Choice: Evidence from the XBRL Mandate." SSRN eLibrary.
Blankespoor, E., B.P. Miller and H.D. White (2012). "Initial Evidence on the Market Impact of the XBRL Mandate." SSRN eLibrary.
Bloom, N., R. Griffith and J. Van Reenen (2002). "Do R&D Tax Credits Work? Evidence from a Panel of Countries 1979–1997." Journal of Public Economics 85(1): 1-31.
Bradshaw, M.T., M. Plumlee and T.L. Yohn (2011). "The Relative Accuracy of Analyst and Time-Series Disaggregated Forecasts." Working Paper.
Chen, K.C.W. and M.P. Schoderbek (2000). "The 1993 Tax Rate Increase and Deferred Tax Adjustments: A Test of Functional Fixation." Journal of Accounting Research 38(1): 23-44.
Cheong, F.S. and J.K. Thomas (2012). "Implications of Scale Invariance in Eps Forecast Errors." Working Paper.
Chuk, E., D. Matsumoto and G.S. Miller (2012). "Assessing Methods of Identifying Management Forecasts: CIG Vs. Researcher Collected." SSRN eLibrary.
Clement, M.B. (1999). "Analyst Forecast Accuracy: Do Ability, Resources, and Portfolio Complexity Matter?" Journal of Accounting and Economics 27(3): 285-303.
Daily Tax Report. (2012). "Companies Claiming R&D Credits Face IRS Challenges." Bloomberg BNA. October 17, 2012.
Cooper, R.A., T.E. Day and C.M. Lewis (2001). "Following the Leader: A Study of Individual Analysts’ Earnings Forecasts." Journal of Financial Economics 61(3): 383-416.
Eleswarapu, V.R., R. Thompson and K. Venkataraman (2004). "The Impact of Regulation Fair Disclosure: Trading Costs and Information Asymmetry." Journal of Financial and Quantitative Analysis 39(02): 209-225.
Erickson, M., S. Heitzman and X.F. Zhang (2011). "Analyst and Market Responses to Tax-Motivated Loss Shifting." Working Paper.
Ertimur, Y., W. Mayew and S. Stubben (2011). "Analyst Reputation and the Issuance of Disaggregated Earnings Forecasts to I/B/E/S." Review of Accounting Studies 16(1): 29-58.
36
Givoly, D. and C. Hayn (1992). "The Valuation of the Deferred Tax Liability: Evidence from the Stock Market." The Accounting Review 67(2): 394-410.
Gleason, C. and L. Mills (2008). "Evidence of Differing Market Responses to Beating Analysts’ Targets through Tax Expense Decreases." Review of Accounting Studies 13(2): 295-318.
Gleason, C.A. and C.M.C. Lee (2003). "Analyst Forecast Revisions and Market Price Discovery." The Accounting Review: 193-225.
Glosten, L.R. (1989). "Insider Trading, Liquidity, and the Role of the Monopolist Specialist." The Journal of Business 62(2): 211-235.
Goldstein, M.A. and K. Kavajecz (2000). "Eighths, Sixteenths, and Market Depth: Changes in Tick Size and Liquidity Provision on the NYSE." Journal of Financial Economics 56(1): 125-149.
Graham, J.R., J.S. Raedy and D.A. Shackelford (2011). "Research in Accounting for Income Taxes." Journal of Accounting and Economics.
Gupta, S., Y. Hwang and A.P. Schmidt (2011). "Structural Change in the Research and Experimentation Tax Credit: Success or Failure?" National Tax Journal 64(2): 285-322.
Hall, B. and J. Van Reenen (2000). "How Effective Are Fiscal Incentives for R&D? A Review of the Evidence." Research Policy 29(4–5): 449-469.
Hand, J.R.M. (1990). "A Test of the Extended Functional Fixation Hypothesis." The Accounting Review 65(4): 740-763.
Hanlon, M. (2012). "Testimony of Michelle Hanlon before the United States House Committee on Ways and Means." United States House Committee on Ways and Means. February 8, 2012.
Hanlon, M. and S. Heitzman (2010). "A Review of Tax Research." Journal of Accounting and Economics 50(2): 127-178.
Hanlon, M. and J.L. Hoopes (2012). "What Do Firms Do When Dividend Tax Rates Change? An Examination of Alternative Payout Responses to Dividend Tax Rate Changes." SSRN eLibrary.
Hines, J.R. (1994). "No Place Like Home: Tax Incentives and the Location of R&D by American Multinationals." Tax Policy and the Economy 8: 65-104.
House, C.L. and M.D. Shapiro (2008). "Temporary Investment Tax Incentives: Theory with Evidence from Bonus Depreciation." The American Economic Review 98(3): 737-768.
Jaworski, T. (2012). "A Closer Look at SEC Reviews of Foreign Cash." Tax Notes. August 6, 2012. Kim, O. and R.E. Verrecchia (1994). "Market Liquidity and Volume around Earnings
Announcements." Journal of Accounting and Economics 17(1): 41-67. Klassen, K.J., J.A. Pittman and M.P. Reed (2004). "A Cross-National Comparison of R&D
Expenditure Decisions: Tax Incentives and Financial Constraints." Contemporary Accounting Research 21(3): 639-680.
Kopczuk, W. and J. Slemrod (2003). "Dying to Save Taxes: Evidence from Estate-Tax Returns on the Death Elasticity." Review of Economics and Statistics 85(2): 256-265.
Kysar, R.M. (2005). "Sun Also Rises: The Political Economy of Sunset Provisions in the Tax Code, The." Georgia Law Review 40: 335.
Lang, M.H. and R.J. Lundholm (1996). "Corporate Disclosure Policy and Analyst Behavior." The Accounting Review 71(4): 467-492.
Lee, C.M.C., B. Mucklow and M.J. Ready (1993). "Spreads, Depths, and the Impact of Earnings Information: An Intraday Analysis." Review of Financial Studies 6(2): 345.
Leuz, C. and R.E. Verrecchia (2000). "The Economic Consequences of Increased Disclosure." Journal of Accounting Research 38: 91-124.

37
Li, F. (2008). "Annual Report Readability, Current Earnings, and Earnings Persistence." Journal of Accounting and Economics 45(2): 221-247.
McKinnon, J.D., G. Fields and L. Saunders (2010). "'Temporary' Tax Code Puts Nation in a Lasting Bind." The Wall Street Journal. December 14, 2010.
Merkley, K.J. (2011). "Narrative Disclosure and Earnings Performance: Evidence from R&D Disclosures." SSRN eLibrary.
Miller, G.S. (2002). "Earnings Performance and Discretionary Disclosure." Journal of Accounting Research 40(1): 173-204.
Neubig, T. (2006). "Where’s the Applause? Why Most Corporations Prefer a Lower Rate." Tax Notes. April 24, 2006.
Plumlee, M.A. (2003). "The Effect of Information Complexity on Analysts' Use of That Information." The Accounting Review 78(1): 275-296.
Raedy, J.S., J.K. Seidman and D.A. Shackelford (2011). "Tax Reform, Deferred Taxes, and the Impact on Book Profits." Tax Notes. 1515-1525. December 19, 2011.
Rao, N. (2010). "Do Tax Credits Stimulate R&D Spending? Revisiting the Effect of the R&D Tax Credit in Its First Decade." Working paper, New York University.
Shackelford, D.A. and T. Shevlin (2001). "Empirical Tax Research in Accounting." Journal of Accounting and Economics 31(1): 321-387.
Shane, P.B. and T. Stock (2006). "Security Analyst and Stock Market Efficiency in Anticipating Tax-Motivated Income Shifting." The Accounting Review: 227-250.
U.S. Chamber of Commerce. (2011). "Statement of the U.S. Chamber of Commerce: Hearing on the Need for Comprehensive Tax Reform to Help American Companies Compete in the Global Market and Create Jobs for American Workers." House Committee on Ways and Means. May 12, 2011.
Van Ness, B.F., R.A. Van Ness and R.S. Warr (2001). "How Well Do Adverse Selection Components Measure Adverse Selection?" Financial Management: 77-98.
Wilson, D.J. (2009). "Beggar Thy Neighbor? The in-State, out-of-State, and Aggregate Effects of R&D Tax Credits." Review of Economics and Statistics 91(2): 431-436.

38
Figure 1. Analysts’ Mention of the R&D Tax Credit
Notes: This graph depicts the number of company specific reports on the Investex analyst research service that mention the “R&D Tax Credit” in the text or title of the report, divided by the total number of reports on Investex, graphed by month. The vertical bars represent October 1998, December 1999, October 2004, December 2006, October 2008 and December 2010, which are the months in which the R&D tax credit was extended.
-0.002
6E-17
0.002
0.004
0.006
0.008
0.01
3 6 9 3 6 9 3 6 9 3 6 9 3 6 9 3 6 9 3 6 9 3 6 9 3 6 9 3 6 9 3 6 9 3 6 9 3 6 9 3 6 9 3 6 9
1997 1998 1999 2000 2001 2002 2003 2004 2005 2006 2007 2008 2009 2010 2011
Nu
mb
er
of
Rep
ort
s o
n I
nv
est
ex
Refe
ren
cin
g R
&D
Tax C
red
it
Div
ided
By
To
tal
Rep
ort
s
Year
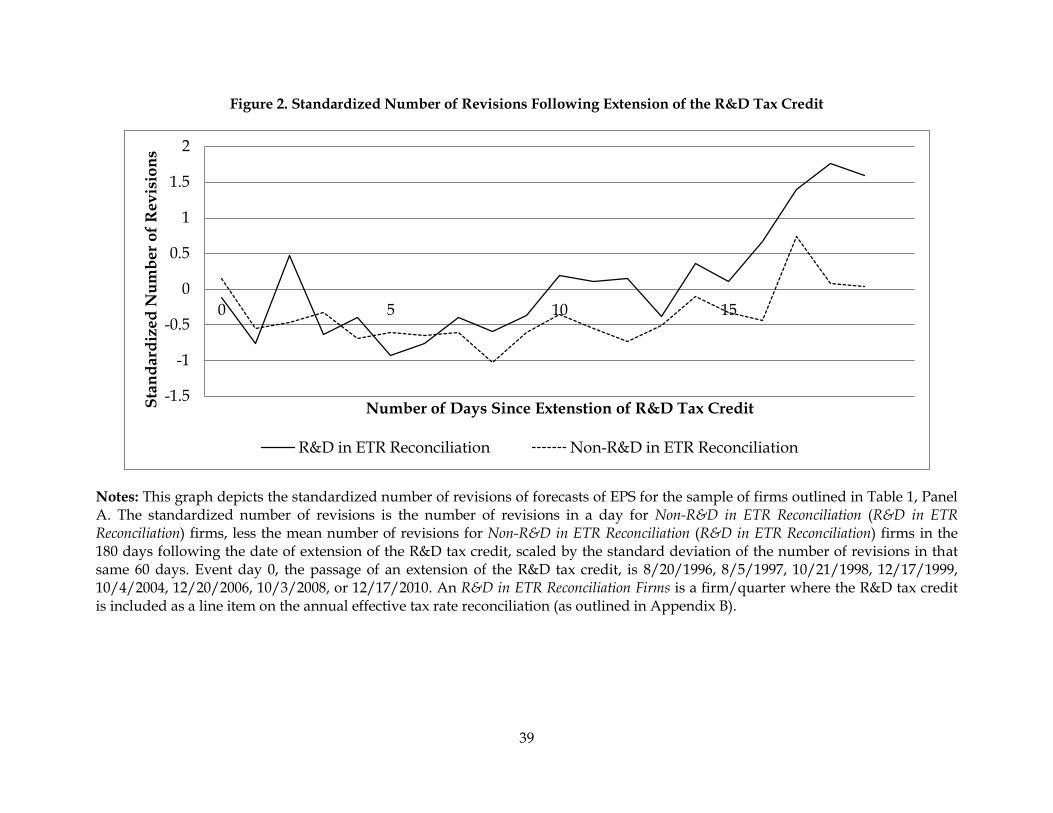
39
Figure 2. Standardized Number of Revisions Following Extension of the R&D Tax Credit
Notes: This graph depicts the standardized number of revisions of forecasts of EPS for the sample of firms outlined in Table 1, Panel A. The standardized number of revisions is the number of revisions in a day for Non-R&D in ETR Reconciliation (R&D in ETR Reconciliation) firms, less the mean number of revisions for Non-R&D in ETR Reconciliation (R&D in ETR Reconciliation) firms in the 180 days following the date of extension of the R&D tax credit, scaled by the standard deviation of the number of revisions in that same 60 days. Event day 0, the passage of an extension of the R&D tax credit, is 8/20/1996, 8/5/1997, 10/21/1998, 12/17/1999, 10/4/2004, 12/20/2006, 10/3/2008, or 12/17/2010. An R&D in ETR Reconciliation Firms is a firm/quarter where the R&D tax credit is included as a line item on the annual effective tax rate reconciliation (as outlined in Appendix B).
-1.5
-1
-0.5
0
0.5
1
1.5
2
0 5 10 15
Sta
nd
ard
ized
Nu
mb
er
of
Rev
isio
ns
Number of Days Since Extenstion of R&D Tax Credit
R&D in ETR Reconciliation Non-R&D in ETR Reconciliation

40
Figure 3. Timeline of Forecast Revisions and R&D Tax Credit Extension
Notes: This figure represents a quarters worth of earnings forecasts for two firms for a single analyst at each firm. Firm A receives the R&D tax credit, and Firm B does not. Interrupting the quarter is the extension of the R&D tax credit, at R&D Tax Credit Extension Date.
Firm A: Firm that receives the R&D Tax Credit
Forecast A Forecast B Forecast C Realized Earnings
R&D Tax Credit Extension Date
Firm B: Firm that does not receive the R&D Tax Credit
Forecast D Forecast E Forecast F Realized Earnings

41
Table 1. Sample Selection
Panel A. Sample Selection for Earnings Forecasts Tests
Panel B. Sample Selection for Bid-ask Spread Tests
Sample Restriction Resultant Number of Observations
IBES Forecast Revisions 1994-2011 2,471,064
Compustat Quarterly Data Available 2,408,289
Calandar Year End Firms 1,774,513
U.S. Headquartered and Incorporated 1,606,142
Non-regulated industries 1,261,838
Time between forecasts 30 days or less 448,377
Required data available 446,647
Sample Restriction Resultant Number of Observations
Observation on Compustat Quarterly 1994-2011 835,204
Calandar Year End Firms 559,320
U.S. Headquartered and Incorporated 446,231
Non-regulated industries 298,544
Required data not missing from Compustat 250,479
Bid-ask spreads available from TAQ 161,711
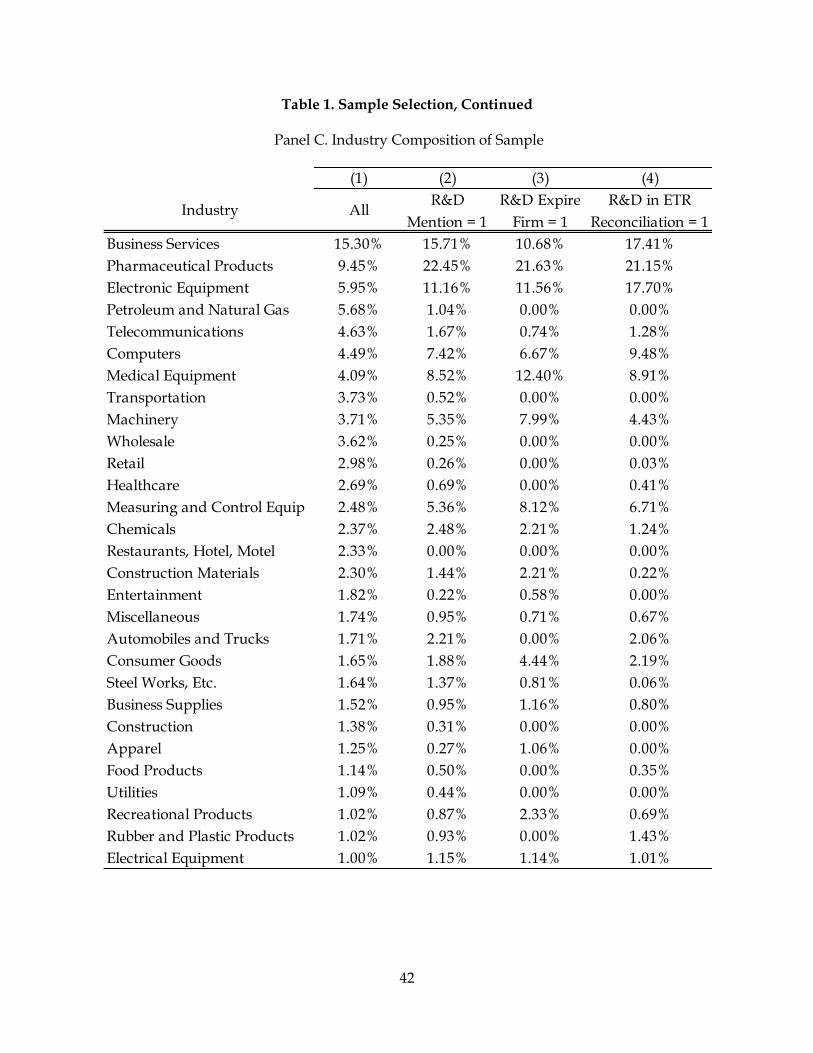
42
Table 1. Sample Selection, Continued
Panel C. Industry Composition of Sample
(1) (2) (3) (4)
Industry AllR&D
Mention = 1
R&D Expire
Firm = 1
R&D in ETR
Reconciliation = 1
Business Services 15.30% 15.71% 10.68% 17.41%
Pharmaceutical Products 9.45% 22.45% 21.63% 21.15%
Electronic Equipment 5.95% 11.16% 11.56% 17.70%
Petroleum and Natural Gas 5.68% 1.04% 0.00% 0.00%
Telecommunications 4.63% 1.67% 0.74% 1.28%
Computers 4.49% 7.42% 6.67% 9.48%
Medical Equipment 4.09% 8.52% 12.40% 8.91%
Transportation 3.73% 0.52% 0.00% 0.00%
Machinery 3.71% 5.35% 7.99% 4.43%
Wholesale 3.62% 0.25% 0.00% 0.00%
Retail 2.98% 0.26% 0.00% 0.03%
Healthcare 2.69% 0.69% 0.00% 0.41%
Measuring and Control Equip 2.48% 5.36% 8.12% 6.71%
Chemicals 2.37% 2.48% 2.21% 1.24%
Restaurants, Hotel, Motel 2.33% 0.00% 0.00% 0.00%
Construction Materials 2.30% 1.44% 2.21% 0.22%
Entertainment 1.82% 0.22% 0.58% 0.00%
Miscellaneous 1.74% 0.95% 0.71% 0.67%
Automobiles and Trucks 1.71% 2.21% 0.00% 2.06%
Consumer Goods 1.65% 1.88% 4.44% 2.19%
Steel Works, Etc. 1.64% 1.37% 0.81% 0.06%
Business Supplies 1.52% 0.95% 1.16% 0.80%
Construction 1.38% 0.31% 0.00% 0.00%
Apparel 1.25% 0.27% 1.06% 0.00%
Food Products 1.14% 0.50% 0.00% 0.35%
Utilities 1.09% 0.44% 0.00% 0.00%
Recreational Products 1.02% 0.87% 2.33% 0.69%
Rubber and Plastic Products 1.02% 0.93% 0.00% 1.43%
Electrical Equipment 1.00% 1.15% 1.14% 1.01%

43
Table 2. Descriptive Statistics
Notes: Revision is equal to the value of forecast revision in EPS, scaled by beginning of fiscal period price, all multiplied by 100. Forecast Improvement is equal to the unsigned forecast error before the revision less the unsigned forecast error after the revision, scaled by price at the beginning of the fiscal year period, all multiplied by 100. Extension Between Revisions is coded as one if the two forecasts span the enactment date from the sample of R&D credit extensions (i.e., spans 8/20/1996, 8/5/1997, 10/21/1998, 12/17/1999, 10/4/2004, 12/20/2006, 10/3/2008, or 12/17/2010). R&D Credit Exposure is measured three ways. R&D Mention is an indicator variable equal to one if a firm’s 10-K ever mentions the R&D tax credit. R&D Expire Firm is an indicator variable equal to one if the firm ever mentions in a 10-Q that its quarterly ETR was lower because of the expiration of the R&D tax credit. R&D in ETR Reconciliation is an indicator variable equal to one if the firm had a line item for the U.S. Federal Research and Development tax credit in its effective tax rate reconciliation in year t. Abnormal Bid-Ask Spread is the bid-ask spread from the event period surrounding the earnings announcement date (t-1 to t+1), less the average bid-ask spread from the period t-45 to t-5. Lapsed Credit Quarter is an indicator variable coded to one if the R&D tax credit was expired during the entire quarter.
Variable n Mean S.D. 0.25 Mdn 0.75
Revision 446,647 -0.1726 1.09 -0.1903 -0.0267 0.0794
Forecast Improvement 446,647 0.1945 1.0077 -0.052 0.0369 0.1891
Extension Between Revisions 446,647 0.0163 0.1266 0 0 0
R&D Mention 446,647 0.2842 0.451 0 0 1
R&D Expire Firm 446,647 0.0715 0.2576 0 0 0
R&D in ETR Reconciliation 446,647 0.0545 0.2269 0 0 0
Abnormal Bid-Ask Spread 161,711 0.0538 1.9856 -0.38 0.0085 0.381
Lapsed Credit Quarter 161,711 0.1681 0.3739 0 0 0
R&D Mention 161,711 0.2833 0.4506 0 0 1
R&D Expire Firm 161,711 0.0375 0.1899 0 0 0
R&D in ETR Reconciliation 161,711 0.0424 0.2015 0 0 0
Sample Used for Earnings Forecasts Tests
Sample Used for Bid-ask Spread Tests

44
Table 3. R&D Tax Credit Extensions and Earnings Forecast Revisions
Notes: The sample used for this analysis is all forecast revisions of all U.S. unregulated and nonfinancial calendar year firms between 1994 and 2011. Revision is equal to the value of forecast revision in EPS, scaled by beginning of fiscal period price, all multiplied by 100. Extension Between Revisions is coded as one if the two forecasts span the enactment date from the sample of R&D credit extensions (i.e., spans 8/20/1996, 8/5/1997, 10/21/1998, 12/17/1999, 10/4/2004, 12/20/2006, 10/3/2008, or 12/17/2010). R&D Credit Exposure is measured three ways. R&D Mention is an indicator variable equal to one if the firm’s 10-K ever mentions the R&D tax credit. R&D Expire Firm is an indicator variable equal to one if the firm ever mentions in a 10-Q that its quarterly ETR was lower because of the expiration of the R&D tax credit. R&D in ETR Reconciliation is an indicator variable equal to one if the firm had a line item for the U.S. Federal Research and Development tax credit in its effective tax rate reconciliation in year t. Standard errors are clustered at the analyst level, and p-values are indicated as *, **, and *** representing two tailed significance at the 10%, 5% and 1% level.
(1) (2) (3)
Dependent Variable:
Measure of R&D Credit Exposure:R&D Mention
R&D Expire
Firm
R&D in ETR
Reconciliation
Extension Between Revisions -0.250*** -0.226*** -0.225***
(-5.42) (-5.86) (-5.91)
R&D Credit Exposure -0.021** 0.096*** -0.052***
(-2.39) (11.97) (-3.24)
Extension Between Revisions X R&D Credit Exposure 0.127** 0.151*** 0.200***
(2.53) (3.29) (3.14)
Constant -0.192*** -0.205*** -0.195***
(-24.61) (-28.51) (-28.31)
Year Fixed Effects Yes Yes Yes
Quarter Fixed Effects Yes Yes Yes
Analyst Clustering Yes Yes Yes
Observations 446,647 446,647 446,647
R-squared 0.01 0.01 0.01
Forecast Revision
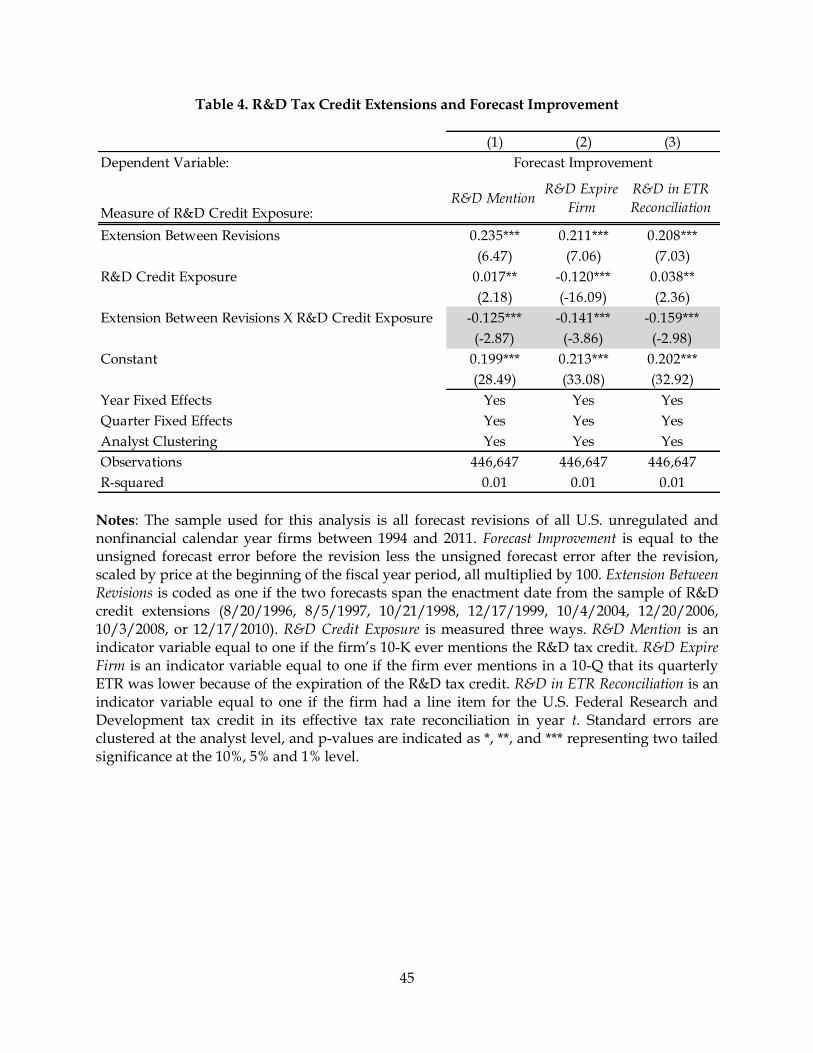
45
Table 4. R&D Tax Credit Extensions and Forecast Improvement
Notes: The sample used for this analysis is all forecast revisions of all U.S. unregulated and nonfinancial calendar year firms between 1994 and 2011. Forecast Improvement is equal to the unsigned forecast error before the revision less the unsigned forecast error after the revision, scaled by price at the beginning of the fiscal year period, all multiplied by 100. Extension Between Revisions is coded as one if the two forecasts span the enactment date from the sample of R&D credit extensions (8/20/1996, 8/5/1997, 10/21/1998, 12/17/1999, 10/4/2004, 12/20/2006, 10/3/2008, or 12/17/2010). R&D Credit Exposure is measured three ways. R&D Mention is an indicator variable equal to one if the firm’s 10-K ever mentions the R&D tax credit. R&D Expire Firm is an indicator variable equal to one if the firm ever mentions in a 10-Q that its quarterly ETR was lower because of the expiration of the R&D tax credit. R&D in ETR Reconciliation is an indicator variable equal to one if the firm had a line item for the U.S. Federal Research and Development tax credit in its effective tax rate reconciliation in year t. Standard errors are clustered at the analyst level, and p-values are indicated as *, **, and *** representing two tailed significance at the 10%, 5% and 1% level.
(1) (2) (3)
Dependent Variable:
Measure of R&D Credit Exposure:R&D Mention
R&D Expire
Firm
R&D in ETR
Reconciliation
Extension Between Revisions 0.235*** 0.211*** 0.208***
(6.47) (7.06) (7.03)
R&D Credit Exposure 0.017** -0.120*** 0.038**
(2.18) (-16.09) (2.36)
Extension Between Revisions X R&D Credit Exposure -0.125*** -0.141*** -0.159***
(-2.87) (-3.86) (-2.98)
Constant 0.199*** 0.213*** 0.202***
(28.49) (33.08) (32.92)
Year Fixed Effects Yes Yes Yes
Quarter Fixed Effects Yes Yes Yes
Analyst Clustering Yes Yes Yes
Observations 446,647 446,647 446,647
R-squared 0.01 0.01 0.01
Forecast Improvement

46
Table 5. Bid-Ask Spreads during Earnings Announcement Periods Affected by the Expiration of the R&D Tax Credit
Notes: The sample used for this analysis is quarterly earnings announcement periods of all U.S. unregulated and nonfinancial calendar year firms between 1994 and 2011. Abnormal Bid-Ask Spread is the bid-ask spread from the event period surrounding the earnings announcement date (t-1 to t+1), less the average bid-ask spread from the period t-45 to t-5. Lapsed Credit Quarter is an indicator variable coded to one if the R&D tax credit was expired during the entire quarter. R&D Credit Exposure is measured three ways. R&D Mention is an indicator variable equal to one if the firm’s 10-K ever mentions the R&D tax credit. R&D Expire Firm is an indicator variable equal to one if the firm ever mentions in a 10-Q that its quarterly ETR was lower because of the expiration of the R&D tax credit. R&D in ETR Reconciliation is an indicator variable equal to one if the firm had a line item for the U.S. Federal Research and Development tax credit in its effective tax rate reconciliation in year t. Standard errors are clustered at the firm level, and p-values are indicated as *, **, and *** representing two tailed significance at the 10%, 5% and 1% level.
Dependent Variable:
Measure of R&D Credit Exposure:R&D
Mention
R&D Expire
Firm
R&D in ETR
Reconciliation
R&D Credit Expiration Quarter -0.246*** -0.232*** -0.234***
(-10.28) (-10.46) (-10.55)
R&D Credit Exposure -0.023** -0.026* -0.022
(-1.99) (-1.96) (-1.08)
R&D Credit Expiration Quarter X R&D Credit Exposure 0.066** 0.126*** 0.165***
(2.51) (3.71) (3.66)
Constant 0.019* 0.014 0.014
(1.79) (1.37) (1.36)
Year Fixed Effects Yes Yes Yes
Quarter Fixed Effects Yes Yes Yes
Firm Clustering Yes Yes Yes
Observations 161,711 161,711 161,711
R-squared 0.01 0.01 0.01
Abnormal Bid-Ask Spread

47
Table 6. Cross-Sectional Test of Disclosure, R&D Tax Credit Extensions and Forecast Improvement
Notes: The sample used for this analysis is all forecast revisions of all U.S. unregulated and nonfinancial calendar year firms between 1994 and 2010. Forecast Improvement is equal to the unsigned forecast error before the revision less the unsigned forecast error after the revision, scaled by price at the beginning of the fiscal year period, all multiplied by 100. Guidance is coded to one if the firm issue an EPS forecast in quarter t. Extension Between Revisions is coded as one if the two forecasts span the enactment date from the sample of R&D credit extensions. R&D Credit Exposure is measured three ways. R&D Mention is an indicator variable equal to one if the firm’s 10-K ever mentions the R&D tax credit. R&D Expire Firm is an indicator variable equal to one if the firm ever mentions in a 10-Q that its quarterly ETR was lower because of the expiration of the R&D tax credit. R&D in ETR Reconciliation is an indicator variable equal to one if the firm had a line item for the U.S. Federal Research and Development tax credit in its effective tax rate reconciliation in year t. Standard errors are clustered at the analyst level, and p-values are indicated as *, **, and *** representing two tailed significance at the 10%, 5% and 1% level.
(1) (2) (3)
Dependent Variable:
Measure of R&D Credit Exposure:
R&D
Mention
R&D Expire
Firm
R&D in ETR
Reconciliation
Extension Between Revisions 0.274*** 0.243*** 0.244***
(6.37) (6.62) (6.64)
Guidance -0.088*** -0.087*** -0.090***
(-10.10) (-10.44) (-11.60)
R&D Credit Exposure 0.033*** -0.139*** 0.038*
(3.22) (-14.42) (1.86)
Extension Between Revisions X Guidance -0.150*** -0.090* -0.096*
(-2.95) (-1.75) (-1.91)
Extension Between Revisions X R&D Credit Exposure -0.164*** -0.177*** -0.193***
(-3.06) (-3.91) (-2.76)
R&D Credit Exposure X Guidance -0.008 0.085*** 0.033
(-0.66) (7.77) (1.28)
Extension Between Revisions X R&D Credit Exposure X Guidance 0.187*** 0.112** 0.098
(2.79) (2.02) (1.07)
Constant 0.226*** 0.244*** 0.233***
(25.93) (29.81) (29.69)
Year Fixed Effects Yes Yes Yes
Quarter Fixed Effects Yes Yes Yes
Analyst Clustering Yes Yes Yes
Observations 402,965 402,965 402,965
R-squared 0.01 0.01 0.01
Forecast Improvement

48
Table 7. Cross-Sectional Test of Institutional Ownership R&D Tax Credit Expirations and Bid-ask Spreads
Notes: The sample used for this analysis is quarterly earnings announcement periods of all U.S. unregulated and nonfinancial calendar year firms between 1994 and 2011. Abnormal Bid-Ask Spread is the bid-ask spread from the event period surrounding the earnings announcement date (t-1 to t+1), less the average bid-ask spread from the period t-45 to t-5. Lapsed Credit Quarter is an indicator variable coded to one if the R&D tax credit was expired during the entire quarter. R&D Credit Exposure is measured three ways. R&D Mention is an indicator variable equal to one if the firm’s 10-K ever mentions the R&D tax credit. R&D Expire Firm is an indicator variable equal to one if the firm ever mentions in a 10-Q that its quarterly ETR was lower because of the expiration of the R&D tax credit. R&D in ETR Reconciliation is an indicator variable equal to one if the firm had a line item for the U.S. Federal Research and Development tax credit in its effective tax rate reconciliation in year t. Institutional Investors is an indicator variable coded to equal one when the share of the firm owned by institutional investors in the quarter is larger than the mean among all firms in year t. Standard errors are clustered at the firm level, and p-values are indicated as *, **, and *** representing two tailed significance at the 10%, 5% and 1% level.
Dependent Variable:
Measure of R&D Credit Exposure: R&D MentionR&D Expire
Firm
R&D in ETR
Reconciliation
R&D Credit Expiration Quarter -0.018 -0.051 -0.081**
(-0.89) (-1.21) (-2.33)
R&D Credit Exposure -0.358*** -0.348*** -0.341***
(-10.93) (-11.87) (-11.76)
Institional Investors 0.023* 0.017 0.018*
(1.86) (1.57) (1.69)
R&D Credit Expiration Quarter X R&D Credit Exposure 0.082 0.350*** 0.331***
(1.64) (3.49) (2.62)
R&D Credit Exposure -0.012 0.044 0.062
(-0.53) (0.97) (1.63)
R&D Credit Expiration Quarter X Institutional Investor 0.248*** 0.243*** 0.238***
(7.90) (9.28) (9.14)
R&D Credit Expiration Quarter X R&D Credit Exposure X Institional Investors -0.065 -0.350*** -0.350***
(-1.22) (-3.36) (-2.81)
Constant 0.009 0.006 0.005
(0.65) (0.46) (0.44)
Year Fixed Effects Yes Yes Yes
Quarter Fixed Effects Yes Yes Yes
Firm Clustering Yes Yes Yes
Observations 161,711 161,711 161,711
R-squared 0.01 0.01 0.01
Abnormal Bid-Ask Spread

49
Table 8. Sensitivity Analysis for R&D Tax Credit Extensions and Forecast Improvement
Notes: The sample used for this analysis is all forecast revisions of all U.S. unregulated and nonfinancial calendar year firms between 1994 and 2011. Forecast Improvement, Extension Between Revisions, R&D Credit Exposure, R&D Mention, R&D Expire Firm, R&D in ETR Reconciliation are all defined in Appendix B. Ln(MVE) is the logged market value of equity of the firm. Book to Market is the book to market ratio from the end of the prior quarter. Analyst Coverage is the number of unique analysts forecasting earnings in the quarter for the firm. Momentum is the buy and hold equity return for the six months prior to the month of the earnings announcement. Time Between Forecasts is the number of days between the two forecasts that comprise the revision. Forecast Horizon is the number of days between the end of the fiscal quarter and the forecast date. Percent R&D Exposure Firms is the percentage of an analyst’s forecasts related to firms with R&D tax credit exposure in the fiscal year. General Experience is the number of years since the analyst’s first forecast was recorded on IBES. Firm Specific Experience is the number of years since an analyst issued their first forecast for the firm. Number of Firms Covered is the number of different firms covered by the analyst in the fiscal year. Standard errors (on the right) are clustered at the analyst level, and p-values are indicated as *, **, and *** representing two tailed significance at the 10%, 5% and 1% level.
Dependent Variable:
Measure of R&D Credit Exposure:
Extension Between Revisions 0.221*** (5.70) 0.194*** (6.11) 0.190*** (6.06)
R&D Exposure 0.009 (1.05) -0.077*** (-8.99) 0.015 (0.99)
Between Revisions X R&D Credit Exposure -0.143*** (-3.11) -0.191*** (-5.13) -0.192*** (-3.63)
Ln(MVE) -0.091*** (-21.11) -0.089*** (-20.84) -0.091*** (-21.15)
Book to Market 0.123*** (7.40) 0.123*** (7.38) 0.123*** (7.35)
Analyst Coverage 0.005*** (8.16) 0.005*** (8.28) 0.005*** (8.15)
Momentum -0.150*** (-13.68) -0.149*** (-13.63) -0.150*** (-13.68)
Time Between Forecasts 0.001*** (3.58) 0.001*** (3.46) 0.001*** (3.59)
Forecast Horizon -0.000*** (-10.07) -0.000*** (-10.02) -0.000*** (-10.08)
Percent R&D Exposure Firms 0.068*** (4.71) 0.098*** (8.25) 0.072*** (6.89)
General Experience -0.002** (-2.19) -0.002** (-2.19) -0.002** (-2.20)
Firm Specific Experience 0.009*** (5.15) 0.009*** (5.23) 0.009*** (5.16)
Number of Firms Covered -0.001 (-0.93) -0.001 (-1.06) -0.001 (-0.92)
Constant 0.772*** (20.26) 0.760*** (19.99) 0.774*** (20.32)
Year Fixed Effects
Quarter Fixed Effects
Analyst Clustering
Observations
R-squared 0.04
409,523
0.04
409,523
Forecast Improvement
Yes
Yes
Yes
0.04
409,523
Yes
Yes
Yes Yes
Yes
Yes
R&D Mention R&D Expire FirmR&D in ETR
Reconciliation
(1) (2) (3)
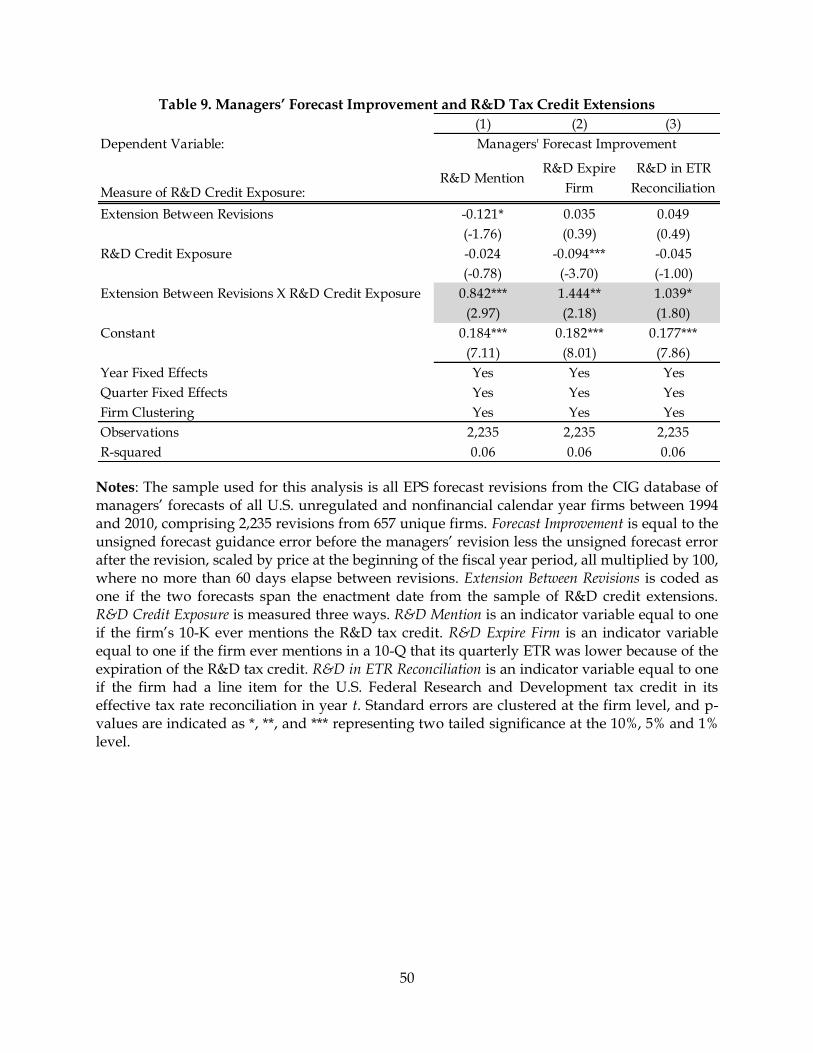
50
Table 9. Managers’ Forecast Improvement and R&D Tax Credit Extensions
Notes: The sample used for this analysis is all EPS forecast revisions from the CIG database of managers’ forecasts of all U.S. unregulated and nonfinancial calendar year firms between 1994 and 2010, comprising 2,235 revisions from 657 unique firms. Forecast Improvement is equal to the unsigned forecast guidance error before the managers’ revision less the unsigned forecast error after the revision, scaled by price at the beginning of the fiscal year period, all multiplied by 100, where no more than 60 days elapse between revisions. Extension Between Revisions is coded as one if the two forecasts span the enactment date from the sample of R&D credit extensions. R&D Credit Exposure is measured three ways. R&D Mention is an indicator variable equal to one if the firm’s 10-K ever mentions the R&D tax credit. R&D Expire Firm is an indicator variable equal to one if the firm ever mentions in a 10-Q that its quarterly ETR was lower because of the expiration of the R&D tax credit. R&D in ETR Reconciliation is an indicator variable equal to one if the firm had a line item for the U.S. Federal Research and Development tax credit in its effective tax rate reconciliation in year t. Standard errors are clustered at the firm level, and p-values are indicated as *, **, and *** representing two tailed significance at the 10%, 5% and 1% level.
(1) (2) (3)
Dependent Variable:
Measure of R&D Credit Exposure:R&D Mention
R&D Expire
Firm
R&D in ETR
Reconciliation
Extension Between Revisions -0.121* 0.035 0.049
(-1.76) (0.39) (0.49)
R&D Credit Exposure -0.024 -0.094*** -0.045
(-0.78) (-3.70) (-1.00)
Extension Between Revisions X R&D Credit Exposure 0.842*** 1.444** 1.039*
(2.97) (2.18) (1.80)
Constant 0.184*** 0.182*** 0.177***
(7.11) (8.01) (7.86)
Year Fixed Effects Yes Yes Yes
Quarter Fixed Effects Yes Yes Yes
Firm Clustering Yes Yes Yes
Observations 2,235 2,235 2,235
R-squared 0.06 0.06 0.06
Managers' Forecast Improvement

51
Table 10. Analyst-Month Level Analysis of Forecast Improvement
Notes: This estimation is estimated on a panel of analyst-month observations created by aggregating the sample described in Table 1, Panel A up to the analyst-month level. Average Forecast Improvement is equal to the unsigned forecast error before the revision less the unsigned forecast error after the revision, scaled by price at the beginning of the fiscal year period, all multiplied by 100. This is then averaged for each analyst in each month. Extension Bill Month is an indicator variable coded to equal one for months when the R&D tax credit is extended (8/1996, 8/1997, 10/1998, 12/1999, 10/2004, 12/2006, 10/2008, and 12/2010). R&D Analyst is measured two ways. Only R&D Credit Firms Forecasted in Month is an indicator variable coded to equal one when the analyst only forecasted firms that have R&D Credit Exposure, R&D Mention, R&D Expire Firm or R&D in ETR Reconciliation equal to one in the month. Percentage R&D Credit Firms Forecasted in Month is a continuous variable that is equal to the number of forecasts issued for firms with R&D Credit Exposure, R&D Mention, R&D Expire Firm or R&D in ETR Reconciliation equal to one in the month, divided by the total number of forecasts in the month. Standard errors are clustered at the analyst level, and p-values are indicated as *, **, and *** representing two tailed significance at the 10%, 5% and 1% level.
(1) (2)
Dependent Variable:
Measure of R&D Analyst:
Only R&D Credit
Firms Forecasted in
Month
Percentage R&D
Credit Firms
Forecasted in Month
Extension Bill in Month 0.086*** 0.083***
(4.74) (4.13)
R&D Analyst 0.005 0.013*
(0.66) (1.66)
Extension Bill Month X R&D Analyst -0.073** -0.051*
(-2.47) (-1.65)
Constant 0.058 0.054
(1.28) (1.20)
Analyst Clustering Yes Yes
Month Fixed Effects Yes Yes
Year Fixed Effects Yes Yes
Observations 106,891 106,891
R-squared 0.01 0.01
Analyst's Average Forecast Improvement
in Month