finances of the - cag.gov.in
TRANSCRIPT

1
FINANCES OF THE
GOVERNMENT
This chapter provides an audit perspective on finances of the State
Government during 2017-18 and analyses changes in major fiscal aggregates
relative to 2016-17 keeping in view overall trends during the preceding five
years.
The analysis is based on details contained in the Finance Accounts of the
Government of Uttar Pradesh (State Government). The profile of the State is
given in Appendix 1.1.
1.1 Gross State Domestic Product (GSDP)1
The trends in annual growth of Gross Domestic Product (GDP) of India and
GSDP of the State at current prices and constant prices (Base year: 2011-12)
are given in Table 1.1.
Table 1.1: GDP of India and GSDP of the State
Particulars 2013-14 2014-15 2015-16 2016-17 2017-18
GDP of India at current
prices (` in crore)
1,12,33,522 1,24,67,959 1,37,64,037 1,52,53,714 1,67,73,145
Growth rate of GDP
(in per cent)
12.97 10.99 10.40 10.82 9.96
GSDP of the State at
current prices (` in crore)
9,40,356 10,11,790 11,37,210 12,50,213 13,75,6072
Growth rate of GSDP at
current prices (in per cent)
14.3 7.6 12.4 9.9 10.0
GSDP of the State at
constant prices (` in crore)
8,02,070 8,34,432 9,07,700 9,74,120 10,36,149
Growth rate of GSDP at
constant prices (in per cent)
5.8 4.0 8.8 7.3 6.4
(Source: GDP/GSDP figures issued by Ministry of Statistics and Programme Implementation, Government of India
(MoSPI , GoI) dated 28.08.2018)
The structure of the Government Accounts is explained in Part A and the
layout of the Finance Accounts in Part B of Appendix 1.2.
1.2 Summary of fiscal transactions
Summary of fiscal transactions of the State Government during the years
2013-14 to 2017-18 is depicted in Table 1.2 and Table 1.3. Details of the
receipts and disbursements as well as the overall fiscal position during
2017-18 were given in Appendix 1.3.
1 GDP and GSDP are the market value of all officially recognised final goods and services produced within the
Country and the State respectively in a given period of time and are an important indicator of the Country and
State‟s economy. 2 State Government informed (June 2019) that as per projected GSDP estimates (01.08.2017), GSDP of the State for
the year 2017-18 was ` 13,78,643 crore. However, the revised GSDP figure for the year 2017-18, as per GSDP
Statement released by MoSPI on 28.08.2018, has been included in this Audit Report.

State Finances Audit Report for the year ended 31 March 2018
2
Table 1.2: Summary of Receipts during 2013-18 (` in crore)
Particulars 2013-14 2014-15 2015-16 2016-17 2017-18 Percentage
increase in
2017-18
with
respect to
2016-17
Section A:Revenue
Revenue Receipts 1,68,214 1,93,422 2,27,076 2,56,875 2,78,775 8.53
Own Tax Revenue
(OTR)
66,582 74,172 81,106 85,966 97,393 13.29
OTR/RR (per cent) 39.58 38.35 35.72 33.47 34.94 1.47
Own Non-Tax
Revenue (NTR)
16,450 19,935 23,135 28,944 19,795 (-) 31.61
Own NTR/ RR
(per cent)
9.78 10.31 10.19 11.27 7.10 (-) 4.17
Share of Union
Taxes/ Duties
62,777 66,623 90,974 1,09,428 1,20,939 10.52
Grants from GoI 22,405 32,692 31,861 32,537 40,648 24.93
Section B: Capital and Others
Miscellaneous
Receipts under the
Capital Section
- - - - - -
Recoveries of Loans and
Advances
589 262 726 259 236 (-) 8.88
Inter State
Settlement
- - - - - -
Public Debt
Receipts
14,900 35,520 74,514 67,685 47,417 (-) 29.94
Contingency Fund 262 1 201 173 258 49.13
Public Account
Receipts
2,26,078 2,30,199 2,65,972 3,06,406 3,20,471 4.59
Opening Cash
Balance3
15,218 4,066 (-) 356 (-) 157 944 701.27
Total 4,25,261 4,63,470 5,68,133 6,31,241 6,48,101 2.67
(Source: Finance Accounts of the respective years)
State‟s own revenue receipts form 42.04 per cent of total receipts for the year
2017-18. Further, the share of own tax revenue in total revenue receipt of the
State decreased from 39.58 per cent in 2013-14 to 34.94 per cent in 2017-18.
While the share of own non-tax revenue increased from 9.78 per cent in
2013-14 to 11.27 per cent in 2016-17, during 2017-18, it decreased to seven
per cent. The decrease in non-tax revenue during 2017-18 was mainly due to
change in accounting procedure for receipts under the head „Education, Sports,
Art and Culture‟ as detailed in Para 1.4.1.1.
3 The opening and closing cash balances includes the investment of earmarked fund, whereas in the preceding years
report the cash balances excluding the investment of earmarked fund was exhibited.
Chapter 1- Finances of the Government
3
Table 1.3: Summary of Expenditure during 2013-18 (` in crore)
Particulars 2013-14 2014-15 2015-16 2016-17 2017-18 Percentage
increase in
2017-18 with
respect to
2016-17
Section A: Revenue
Revenue Expenditure 1,58,147 1,71,027 2,12,736 2,36,592 2,66,224 12.52
General Services 61,984 64,305 72,228 88,255 1,05,782 19.86
Social Services 60,756 60,906 82,487 91,861 84,252 (-)8.28
Economic Services 25,711 34,885 47,881 45,834 64,635 41.02
Grants-in-aid and
Contributions
9,696 10,931 10,140 10,642 11,555 8.58
Section B: Capital and Others
Capital Expenditure 32,863 53,297 64,423 69,789 39,088 (-)43.99
Loans and Advances
disbursed
1,473 1,873 9,118 6,741 1,509 (-)77.61
Inter State Settlement - - - - - -
Repayment of Public
Debt
8,167 9,411 17,673 20,303 15,002 (-)26.11
Appropriation to
Contingency Fund
87 203 44 349 413 18.34
Public Account
Disbursements
2,20,459 2,28,014 2,64,294 2,96,523 3,14,384 6.02
Closing Cash
Balance
4,066 -356 -157 944 11,481 1116.21
Total 4,25,262 4,63,469 5,68,131 6,31,241 6,48,101 2.67 (Source: Finance Accounts of the respective years)
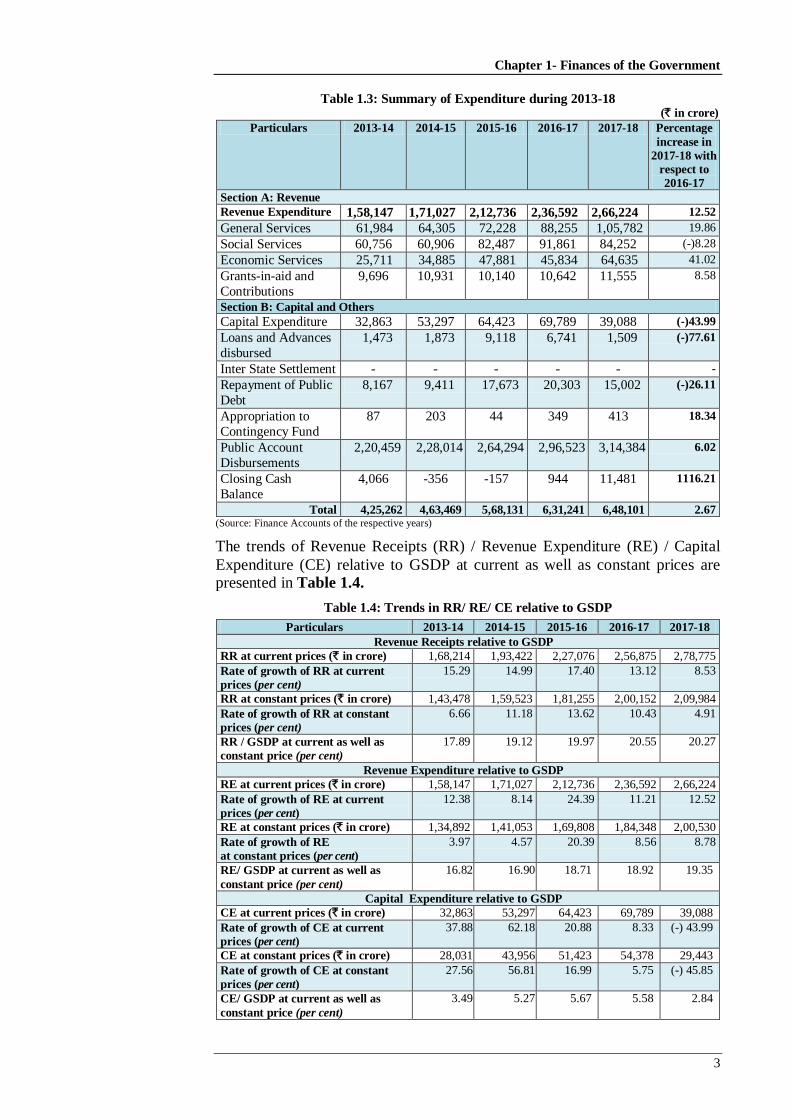
The trends of Revenue Receipts (RR) / Revenue Expenditure (RE) / Capital
Expenditure (CE) relative to GSDP at current as well as constant prices are presented in Table 1.4.
Table 1.4: Trends in RR/ RE/ CE relative to GSDP
Particulars 2013-14 2014-15 2015-16 2016-17 2017-18
Revenue Receipts relative to GSDP
RR at current prices (` in crore) 1,68,214 1,93,422 2,27,076 2,56,875 2,78,775
Rate of growth of RR at current
prices (per cent)
15.29 14.99 17.40 13.12 8.53
RR at constant prices (` in crore) 1,43,478 1,59,523 1,81,255 2,00,152 2,09,984
Rate of growth of RR at constant
prices (per cent)
6.66 11.18 13.62 10.43 4.91
RR / GSDP at current as well as
constant price (per cent)
17.89 19.12 19.97 20.55 20.27
Revenue Expenditure relative to GSDP
RE at current prices (` in crore) 1,58,147 1,71,027 2,12,736 2,36,592 2,66,224
Rate of growth of RE at current
prices (per cent)
12.38 8.14 24.39 11.21 12.52
RE at constant prices (` in crore) 1,34,892 1,41,053 1,69,808 1,84,348 2,00,530
Rate of growth of RE
at constant prices (per cent)
3.97 4.57 20.39 8.56 8.78
RE/ GSDP at current as well as
constant price (per cent)
16.82 16.90 18.71 18.92 19.35
Capital Expenditure relative to GSDP
CE at current prices (` in crore) 32,863 53,297 64,423 69,789 39,088
Rate of growth of CE at current
prices (per cent)
37.88 62.18 20.88 8.33 (-) 43.99
CE at constant prices (` in crore) 28,031 43,956 51,423 54,378 29,443
Rate of growth of CE at constant
prices (per cent)
27.56 56.81 16.99 5.75 (-) 45.85
CE/ GSDP at current as well as
constant price (per cent)
3.49 5.27 5.67 5.58 2.84

State Finances Audit Report for the year ended 31 March 2018
4
● Revenue receipts as well as revenue expenditure had an upward trend
during 2013-14 to 2017-18. However, the revenue receipts as a per cent of
GSDP increased from 2013-14 to 2016-17 but dipped in 2017-18, whereas
revenue expenditure as a per cent of GSDP increased from 2013-14 to
2017-18 even after accounting for inflation.
● Capital expenditure had increased from 2013-14 to 2016-17 but during
2017-18, it recorded a decline of 44 per cent. Further, the capital expenditure
as a per cent of GSDP also declined to 2.84 per cent in 2017-18 as compared
to 3.49 per cent in 2013-14. The decline in capital expenditure during 2017-18
was on account of the fact that capital expenditure of ` 6,083 crore and
` 3,700 crore were expended during 2015-16 and 2016-17 respectively on
UDAY4, whereas there was no such expenditure during 2017-18. Further,
some schemes were non-operational during the year 2017-18 which led to
decline in capital expenditure such as roads in Bharat Nepal frontline districts,
Agra Lucknow Expressway and road works Samajwadi Purvanchal
Expressway. Besides, there was decline of 26 per cent in the budget provision
for capital expenditure during the year 2017-18 (` 53,258 crore) as compared
to the year 2016-17 (` 71,878 crore) due to substantial budget provision of
` 36,000 crore for farm loan waiver of small/marginal farmers.
1.3 Review of fiscal situation
The performance of the State during 2017-18 under key fiscal indicators
provided in the recommendations of the Fourteenth Finance Commission
(XIV FC), budget estimates and targeted in the Uttar Pradesh Fiscal
Responsibility Management (UPFRBM) Act as well as Medium Term Fiscal
Restructuring Policy (MTFRP), 2017 laid under UPFRBM Act, is given
in Table 1.5.
Table 1.5: Performance of the State during 2017-18
Key fiscal indicators Targets set
by the XIV
FC
Targets as
per UPFRBM
Act
Targets as per
Budget Estimate/
MTFRP
Actuals
Revenue deficit (-)
/surplus(+) (` in crore)
Nil deficit Nil deficit Surplus of
` 12,279 crore
Surplus of
` 12,552 crore
Fiscal deficit (-) / GSDP
(per cent)
3.25 Not more than
three per cent 2.97 2.02
Ratio of total outstanding
debt to GSDP (per cent)
32.44 30.50 28.60 34.01
(Source: Budget documents of the State Government, Report of Fourteenth Finance Commission, UPFRBM Act,
2004 and UPFRBM (Amendment) Act, 2016)
Though the State has achieved revenue surplus of ` 12,552 crore, but the same
is overstated by ` 6,341 crore. Similarly, the fiscal deficit (` 27,810 crore) was
also understated by ` 6,405 crore as detailed in Para 3.8.
4 Under Ujjwal Discom Assurance Yojana (UDAY) scheme launched by GoI in November 2015, State Governments
were required to take over 75 per cent of the Discom debt as on 30 September 2015 (50 per cent in the year
2015-16 and 25 per cent in the year 2016-17).
Chapter 1- Finances of the Government
5
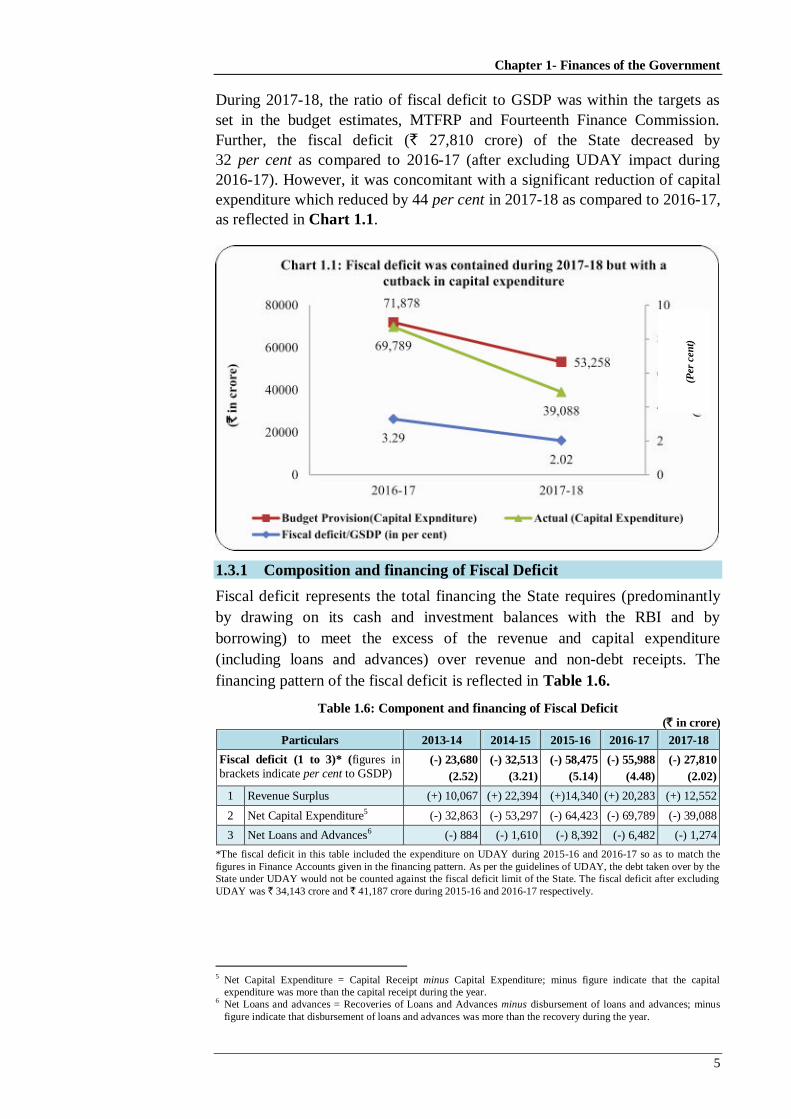
During 2017-18, the ratio of fiscal deficit to GSDP was within the targets as
set in the budget estimates, MTFRP and Fourteenth Finance Commission.
Further, the fiscal deficit (` 27,810 crore) of the State decreased by
32 per cent as compared to 2016-17 (after excluding UDAY impact during
2016-17). However, it was concomitant with a significant reduction of capital
expenditure which reduced by 44 per cent in 2017-18 as compared to 2016-17,
as reflected in Chart 1.1.
1.3.1 Composition and financing of Fiscal Deficit
Fiscal deficit represents the total financing the State requires (predominantly
by drawing on its cash and investment balances with the RBI and by
borrowing) to meet the excess of the revenue and capital expenditure
(including loans and advances) over revenue and non-debt receipts. The
financing pattern of the fiscal deficit is reflected in Table 1.6.
Table 1.6: Component and financing of Fiscal Deficit (` in crore)
Particulars 2013-14 2014-15 2015-16 2016-17 2017-18
Fiscal deficit (1 to 3)* (figures in
brackets indicate per cent to GSDP) (-) 23,680
(2.52)
(-) 32,513
(3.21)
(-) 58,475
(5.14)
(-) 55,988
(4.48)
(-) 27,810
(2.02)
1 Revenue Surplus (+) 10,067 (+) 22,394 (+)14,340 (+) 20,283 (+) 12,552
2 Net Capital Expenditure5 (-) 32,863 (-) 53,297 (-) 64,423 (-) 69,789 (-) 39,088
3 Net Loans and Advances6 (-) 884 (-) 1,610 (-) 8,392 (-) 6,482 (-) 1,274
*The fiscal deficit in this table included the expenditure on UDAY during 2015-16 and 2016-17 so as to match the
figures in Finance Accounts given in the financing pattern. As per the guidelines of UDAY, the debt taken over by the
State under UDAY would not be counted against the fiscal deficit limit of the State. The fiscal deficit after excluding
UDAY was ` 34,143 crore and ` 41,187 crore during 2015-16 and 2016-17 respectively.
5 Net Capital Expenditure = Capital Receipt minus Capital Expenditure; minus figure indicate that the capital
expenditure was more than the capital receipt during the year. 6 Net Loans and advances = Recoveries of Loans and Advances minus disbursement of loans and advances; minus
figure indicate that disbursement of loans and advances was more than the recovery during the year.
(Per
cen
t)
State Finances Audit Report for the year ended 31 March 2018
6
Financing pattern# of fiscal deficit
Particulars 2013-14 2014-15 2015-16 2016-17 2017-18
1 Market Borrowings 5,054 13,513 25,301 36,904 37,178
2 Loans from GoI (-)1,075 (-) 875 (-) 803 (-)409 (-)438
3 Special Securities issued to NSSF 2,768 6,325 4,339 (-)4,532 (-)4,643
4 Loans from Financial Institutions (-)12 7,146 28,005 15,441 317
5 Small Savings, PF etc. 2,363 1,686 1,534 1,619 2,530
6 Deposits and Advances 5,037 1,050 (-) 1,543 (-)301 1,414
7 Suspense and miscellaneous (-)9,637 535 (-) 677 592 (-)2,215
8 Remittances (-)98 1,608 (-) 197 748 (-)3,906
9 Others7 19,280 1,525 2,516 5,926 (-)2,427
Total 23,680 32,513 58,475 55,988 27,810
#All the figures are net of disbursements/ outflows during the year.
(Source: Finance Accounts of the respective years)
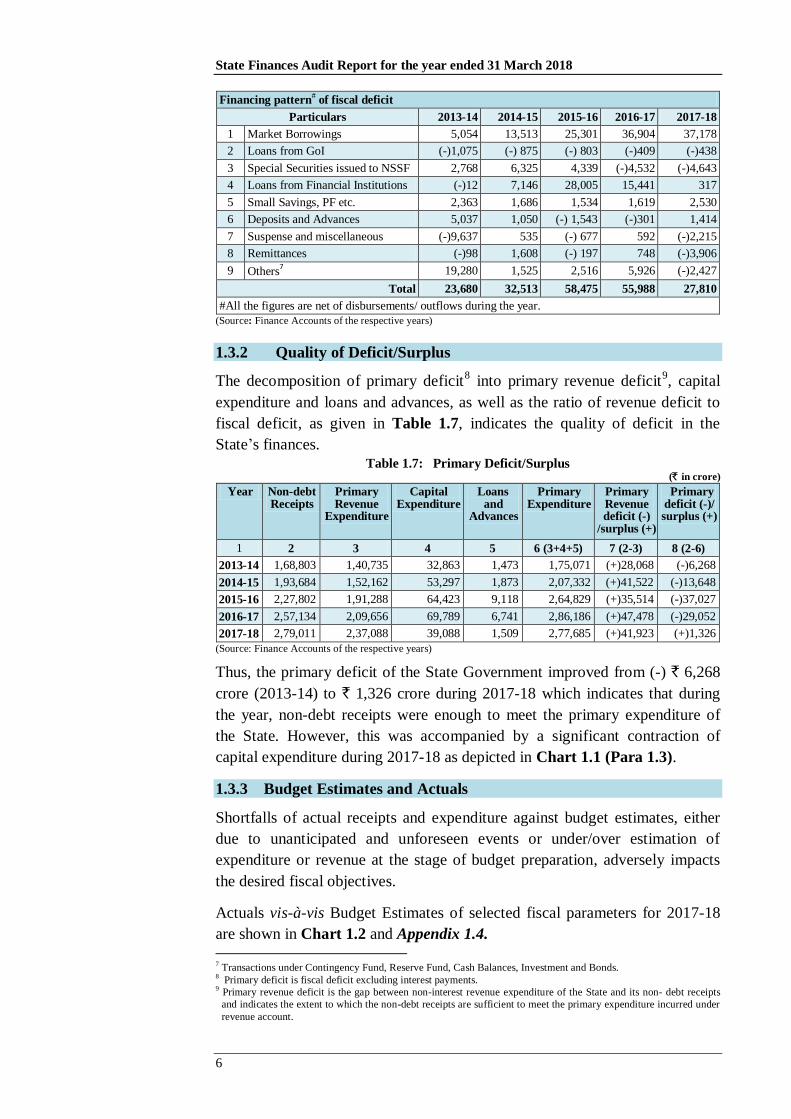
1.3.2 Quality of Deficit/Surplus
The decomposition of primary deficit8 into primary revenue deficit
9, capital
expenditure and loans and advances, as well as the ratio of revenue deficit to
fiscal deficit, as given in Table 1.7, indicates the quality of deficit in the
State‟s finances.
Table 1.7: Primary Deficit/Surplus (` in crore)
Year Non-debt Receipts
Primary Revenue
Expenditure
Capital Expenditure
Loans and
Advances
Primary Expenditure
Primary Revenue deficit (-)
/surplus (+)
Primary deficit (-)/ surplus (+)
1 2 3 4 5 6 (3+4+5) 7 (2-3) 8 (2-6)
2013-14 1,68,803 1,40,735 32,863 1,473 1,75,071 (+)28,068 (-)6,268
2014-15 1,93,684 1,52,162 53,297 1,873 2,07,332 (+)41,522 (-)13,648
2015-16 2,27,802 1,91,288 64,423 9,118 2,64,829 (+)35,514 (-)37,027
2016-17 2,57,134 2,09,656 69,789 6,741 2,86,186 (+)47,478 (-)29,052
2017-18 2,79,011 2,37,088 39,088 1,509 2,77,685 (+)41,923 (+)1,326
(Source: Finance Accounts of the respective years)
Thus, the primary deficit of the State Government improved from (-) ` 6,268
crore (2013-14) to ` 1,326 crore during 2017-18 which indicates that during
the year, non-debt receipts were enough to meet the primary expenditure of
the State. However, this was accompanied by a significant contraction of
capital expenditure during 2017-18 as depicted in Chart 1.1 (Para 1.3).
1.3.3 Budget Estimates and Actuals
Shortfalls of actual receipts and expenditure against budget estimates, either
due to unanticipated and unforeseen events or under/over estimation of
expenditure or revenue at the stage of budget preparation, adversely impacts
the desired fiscal objectives.
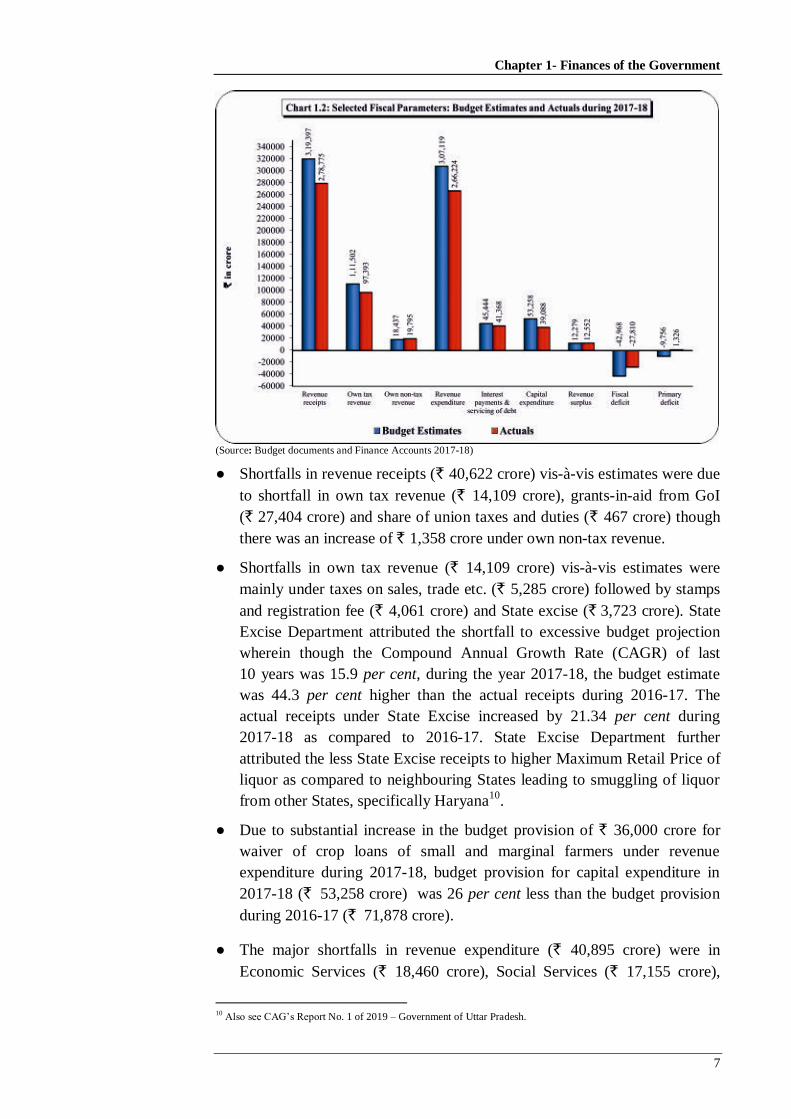
Actuals vis-à-vis Budget Estimates of selected fiscal parameters for 2017-18
are shown in Chart 1.2 and Appendix 1.4.
7 Transactions under Contingency Fund, Reserve Fund, Cash Balances, Investment and Bonds.
8 Primary deficit is fiscal deficit excluding interest payments.
9 Primary revenue deficit is the gap between non-interest revenue expenditure of the State and its non- debt receipts
and indicates the extent to which the non-debt receipts are sufficient to meet the primary expenditure incurred under
revenue account.
Chapter 1- Finances of the Government
7
(Source: Budget documents and Finance Accounts 2017-18)
● Shortfalls in revenue receipts (` 40,622 crore) vis-à-vis estimates were due
to shortfall in own tax revenue (` 14,109 crore), grants-in-aid from GoI
(` 27,404 crore) and share of union taxes and duties (` 467 crore) though
there was an increase of ` 1,358 crore under own non-tax revenue.
● Shortfalls in own tax revenue (` 14,109 crore) vis-à-vis estimates were
mainly under taxes on sales, trade etc. (` 5,285 crore) followed by stamps
and registration fee (` 4,061 crore) and State excise (` 3,723 crore). State
Excise Department attributed the shortfall to excessive budget projection
wherein though the Compound Annual Growth Rate (CAGR) of last
10 years was 15.9 per cent, during the year 2017-18, the budget estimate
was 44.3 per cent higher than the actual receipts during 2016-17. The
actual receipts under State Excise increased by 21.34 per cent during
2017-18 as compared to 2016-17. State Excise Department further
attributed the less State Excise receipts to higher Maximum Retail Price of
liquor as compared to neighbouring States leading to smuggling of liquor
from other States, specifically Haryana10
.
● Due to substantial increase in the budget provision of ` 36,000 crore for
waiver of crop loans of small and marginal farmers under revenue
expenditure during 2017-18, budget provision for capital expenditure in
2017-18 (` 53,258 crore) was 26 per cent less than the budget provision
during 2016-17 (` 71,878 crore).
● The major shortfalls in revenue expenditure (` 40,895 crore) were in
Economic Services (` 18,460 crore), Social Services (` 17,155 crore),
10
Also see CAG‟s Report No. 1 of 2019 – Government of Uttar Pradesh.

State Finances Audit Report for the year ended 31 March 2018
8
General Services (` 5,257 crore) and Grants-in-aid and contribution
(` 23 crore). Decreases in capital expenditure (` 14,170 crore) were due to
decrease in expenditure on Economic Services (` 9,859 crore), Social
Services (` 3,486 crore) and under General Services (` 825 crore). The
shortfall in revenue and capital expenditure, as ascertained from the
Appropriation Accounts 2017-18 of the State Government, was due to
excess budget provision, non-issuance of financial sanction, non-release of
fund, non-sanction of scheme, vacant posts, etc.
Recommendation: The Finance Department should rationalise the budget
preparation exercise, so that the persisting gaps between the budget estimate
and actuals are bridged.
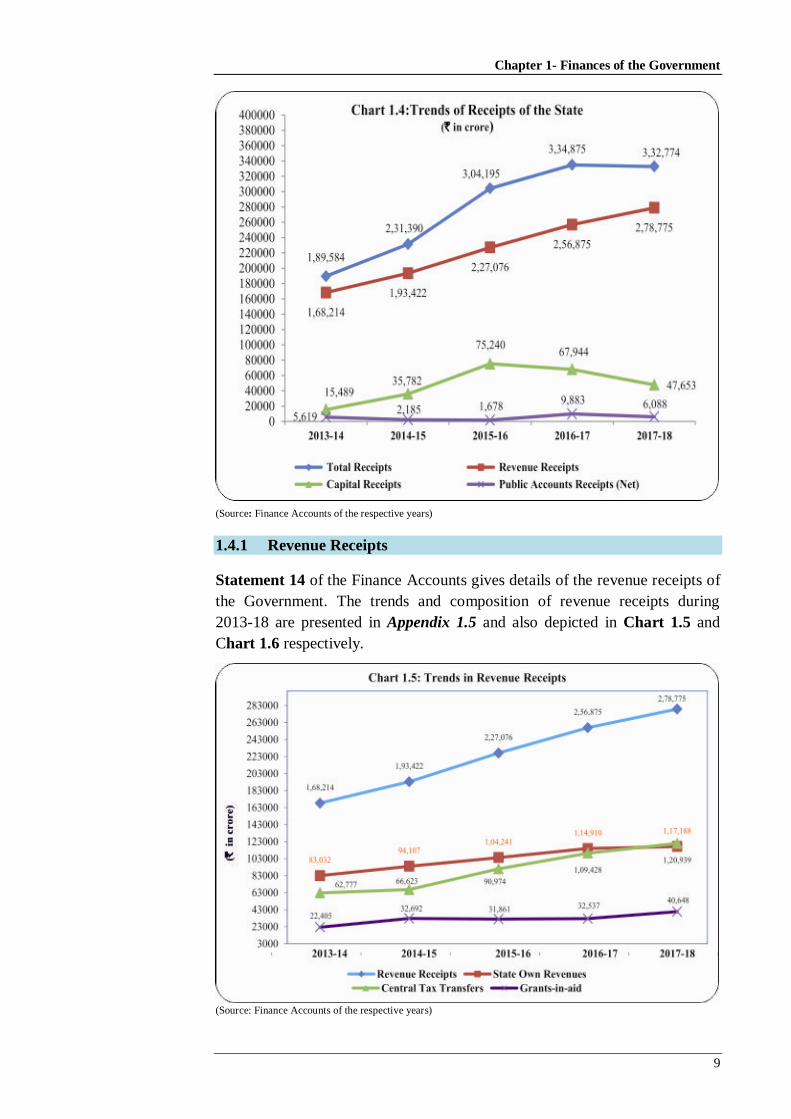
1.4 Financial Resources of the State
Resources of the State as per Annual Finance Accounts
Revenue receipts consist of own tax revenues, own non-tax revenues, State‟s
share of union taxes and duties and grants-in-aid from Government of India
(GoI). Receipts under capital section comprise miscellaneous capital receipts
under the capital section such as proceeds from disinvestments, recoveries of
loans and advances, debt receipts from internal sources (market loans,
borrowings from financial institutions/commercial banks) and loans and
advances from GoI as well as balances in Public Accounts.
Chart 1.3 and Chart 1.4 depict the composition of aggregate receipts, the
trends in various components of receipts during 2013-18 and the composition
of resources during 2017-18 respectively.
Chart 1.3: Composition of aggregate receipts during 2017-18
9(
(Source: Finance Accounts 2017-18)
Total Receipts (` 3,32,774 crore)
• Total Receipts (`
305931 croreTotal
Receipts (` 305931
crore)
Own Tax
Revenue
(` 97,393
crore)
Own Non-tax
Revenue
(` 19,795
crore)
State‟s Share of
Union Taxes and
Duties (` 1,20,939
crore)
Grants-in-aid
from GoI
(` 40,648
crore)
Public Debt
Receipts
(` 47,417
crore)
Non-debt
Receipts
(` 236
crore)
Public Accounts (Net)
(` 6,088 crore,
two per cent)
Small savings
(` 2,530 crore),
Reserve Funds
(` 8,265 crore),
Deposits and
Advances
(` 1,414 crore),
Suspense and
Miscellaneous
(`(-)2,215
crore),
Remittances
(` (-)3,906
crore)
Recoveries
of Loans and
Advances
(` 236 crore)
Contingency Fund
(` 258 crore,
0.08 per cent)
Receipts under the Capital
Section (` 47,653 crore,
14 per cent)
Revenue Receipts
(` 2,78,775 crore,
84 per cent)
Internal debt (` 46,314
crore), Loans and
Advances from GoI
(` 1,103 crore)
SGST (` 25,374 crore ), Taxes on
Sales, Trade etc. (` 31,113 crore),
State Excise (`17,320 crore),
Stamps and Registration fees
(` 13,398 crore), Taxes on Vehicles
(` 6,404 crore), Land Revenue
(` 1,336 crore), and Other taxes
(` 2,448 crore)
Chapter 1- Finances of the Government
9
(Source: Finance Accounts of the respective years)
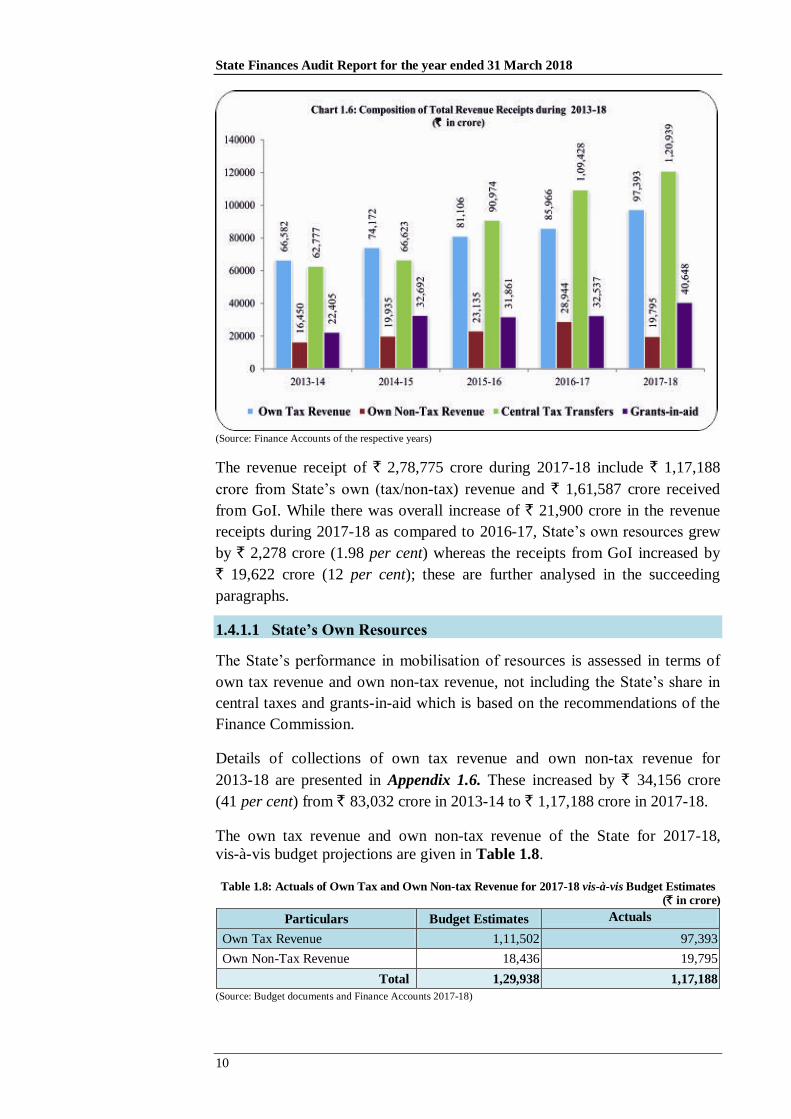
1.4.1 Revenue Receipts
Statement 14 of the Finance Accounts gives details of the revenue receipts of
the Government. The trends and composition of revenue receipts during
2013-18 are presented in Appendix 1.5 and also depicted in Chart 1.5 and
Chart 1.6 respectively.
(Source: Finance Accounts of the respective years)
State Finances Audit Report for the year ended 31 March 2018
10
(Source: Finance Accounts of the respective years)
The revenue receipt of ` 2,78,775 crore during 2017-18 include ` 1,17,188
crore from State‟s own (tax/non-tax) revenue and ` 1,61,587 crore received
from GoI. While there was overall increase of ` 21,900 crore in the revenue
receipts during 2017-18 as compared to 2016-17, State‟s own resources grew
by ` 2,278 crore (1.98 per cent) whereas the receipts from GoI increased by
` 19,622 crore (12 per cent); these are further analysed in the succeeding
paragraphs.
1.4.1.1 State’s Own Resources
The State‟s performance in mobilisation of resources is assessed in terms of
own tax revenue and own non-tax revenue, not including the State‟s share in
central taxes and grants-in-aid which is based on the recommendations of the
Finance Commission.
Details of collections of own tax revenue and own non-tax revenue for
2013-18 are presented in Appendix 1.6. These increased by ` 34,156 crore
(41 per cent) from ` 83,032 crore in 2013-14 to ` 1,17,188 crore in 2017-18.
The own tax revenue and own non-tax revenue of the State for 2017-18,
vis-à-vis budget projections are given in Table 1.8.
Table 1.8: Actuals of Own Tax and Own Non-tax Revenue for 2017-18 vis-à-vis Budget Estimates
(` in crore)
Particulars Budget Estimates Actuals
Own Tax Revenue 1,11,502 97,393
Own Non-Tax Revenue 18,436 19,795
Total 1,29,938 1,17,188
(Source: Budget documents and Finance Accounts 2017-18)
Chapter 1- Finances of the Government
11
Own Tax Revenue
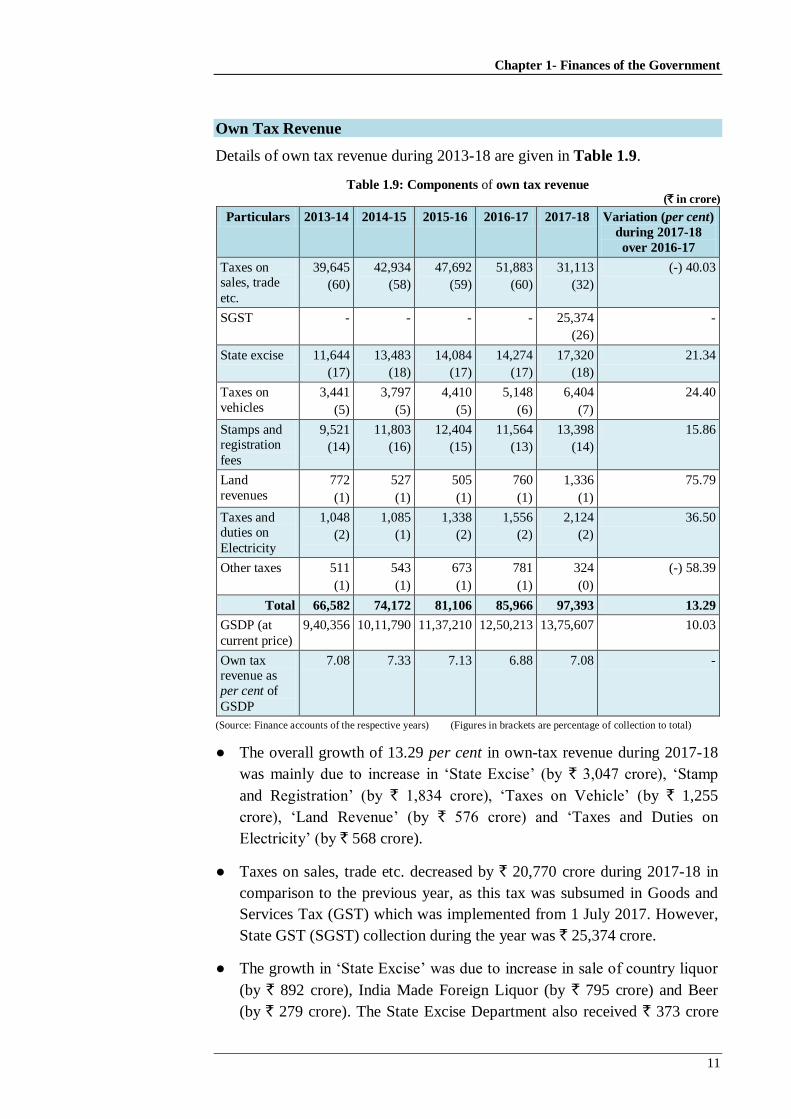
Details of own tax revenue during 2013-18 are given in Table 1.9.
Table 1.9: Components of own tax revenue (` in crore)
Particulars 2013-14 2014-15 2015-16 2016-17 2017-18 Variation (per cent)
during 2017-18
over 2016-17
Taxes on sales, trade
etc.
39,645
(60)
42,934
(58)
47,692
(59)
51,883
(60)
31,113
(32)
(-) 40.03
SGST - - - - 25,374
(26)
-
State excise 11,644
(17)
13,483
(18)
14,084
(17)
14,274
(17)
17,320
(18)
21.34
Taxes on
vehicles
3,441
(5)
3,797
(5)
4,410
(5)
5,148
(6)
6,404
(7)
24.40
Stamps and registration
fees
9,521
(14)
11,803
(16)
12,404
(15)
11,564
(13)
13,398
(14)
15.86
Land
revenues
772
(1)
527
(1)
505
(1)
760
(1)
1,336
(1)
75.79
Taxes and duties on
Electricity
1,048
(2)
1,085
(1)
1,338
(2)
1,556
(2)
2,124
(2)
36.50
Other taxes 511
(1)
543
(1)
673
(1)
781
(1)
324
(0)
(-) 58.39
Total 66,582 74,172 81,106 85,966 97,393 13.29
GSDP (at
current price)
9,40,356 10,11,790 11,37,210 12,50,213 13,75,607 10.03
Own tax revenue as
per cent of
GSDP
7.08 7.33 7.13 6.88 7.08 -
(Source: Finance accounts of the respective years) (Figures in brackets are percentage of collection to total)
● The overall growth of 13.29 per cent in own-tax revenue during 2017-18
was mainly due to increase in „State Excise‟ (by ` 3,047 crore), „Stamp
and Registration‟ (by ` 1,834 crore), „Taxes on Vehicle‟ (by ` 1,255
crore), „Land Revenue‟ (by ` 576 crore) and „Taxes and Duties on
Electricity‟ (by ` 568 crore).
● Taxes on sales, trade etc. decreased by ` 20,770 crore during 2017-18 in
comparison to the previous year, as this tax was subsumed in Goods and
Services Tax (GST) which was implemented from 1 July 2017. However,
State GST (SGST) collection during the year was ` 25,374 crore.
● The growth in „State Excise‟ was due to increase in sale of country liquor
(by ` 892 crore), India Made Foreign Liquor (by ` 795 crore) and Beer
(by ` 279 crore). The State Excise Department also received ` 373 crore
State Finances Audit Report for the year ended 31 March 2018
12
during the year from e-lottery tendering process for shops for the year
2018-19.
● The receipts under „Stamp and Registration‟ increased mainly due to
annual revision of circle rates of land, more receipts from fees for
registering documents (58 per cent) and sale of judicial and non-judicial
stamps (23 per cent). The increase of receipts „Taxes and Duties on
Electricity‟ was due to more collection on taxes on sale and consumption
of electricity (41 per cent).
● Own tax revenue relative to GSDP of the State was 7.08 per cent
during 2017-18 which was higher as compared to other States i.e.
Chhattisgarh (6.82 per cent), Madhya Pradesh (6.34 per cent), Rajasthan
(6.02 per cent), Gujarat (5.42 per cent), Jharkhand (4.84 per cent) and
Bihar (4.74 per cent).
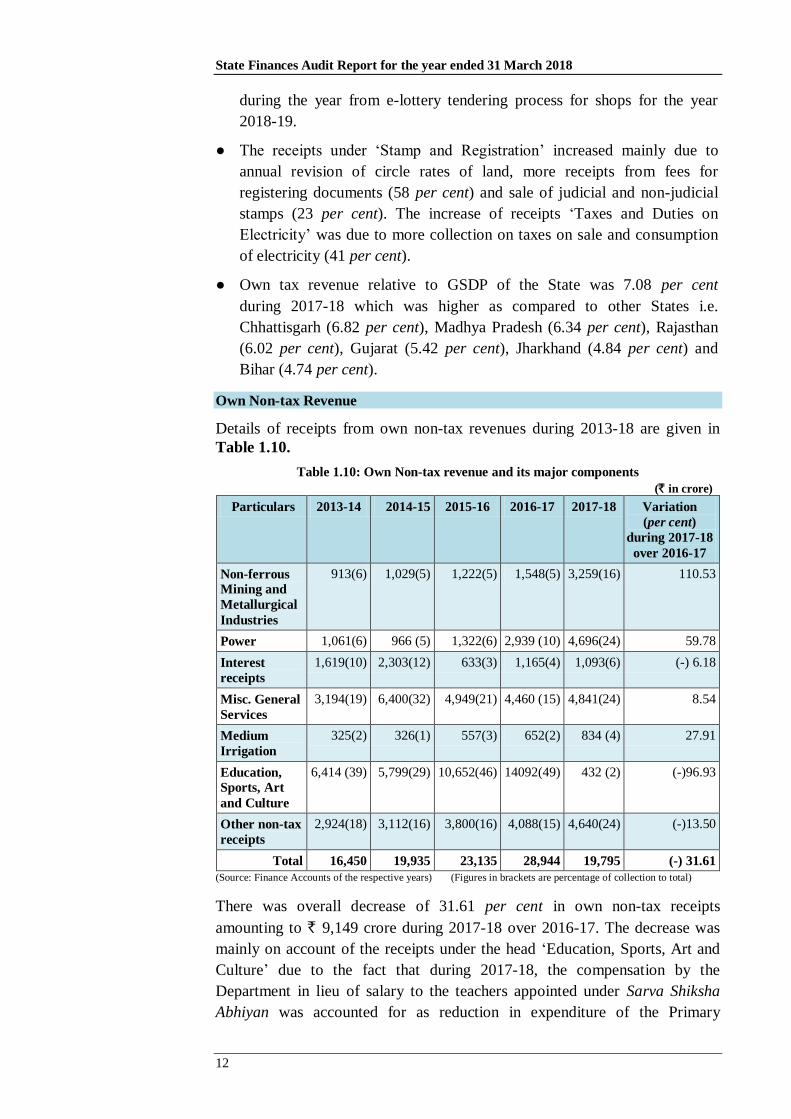
Own Non-tax Revenue
Details of receipts from own non-tax revenues during 2013-18 are given in
Table 1.10.
Table 1.10: Own Non-tax revenue and its major components
(` in crore)
Particulars 2013-14 2014-15 2015-16 2016-17 2017-18 Variation
(per cent)
during 2017-18
over 2016-17
Non-ferrous
Mining and
Metallurgical
Industries
913(6) 1,029(5) 1,222(5) 1,548(5) 3,259(16) 110.53
Power 1,061(6) 966 (5) 1,322(6) 2,939 (10) 4,696(24) 59.78
Interest
receipts
1,619(10) 2,303(12) 633(3) 1,165(4) 1,093(6) (-) 6.18
Misc. General
Services
3,194(19) 6,400(32) 4,949(21) 4,460 (15) 4,841(24) 8.54
Medium
Irrigation
325(2) 326(1) 557(3) 652(2) 834 (4) 27.91
Education,
Sports, Art
and Culture
6,414 (39) 5,799(29) 10,652(46) 14092(49) 432 (2) (-)96.93
Other non-tax
receipts
2,924(18) 3,112(16) 3,800(16) 4,088(15) 4,640(24) (-)13.50
Total 16,450 19,935 23,135 28,944 19,795 (-) 31.61
(Source: Finance Accounts of the respective years) (Figures in brackets are percentage of collection to total)
There was overall decrease of 31.61 per cent in own non-tax receipts
amounting to ` 9,149 crore during 2017-18 over 2016-17. The decrease was
mainly on account of the receipts under the head „Education, Sports, Art and
Culture‟ due to the fact that during 2017-18, the compensation by the
Department in lieu of salary to the teachers appointed under Sarva Shiksha
Abhiyan was accounted for as reduction in expenditure of the Primary
Chapter 1- Finances of the Government
13
Education Department, which was earlier was shown as own non-tax receipts
of the Government. Further, the increase in realisation of mineral concession
fees, rent and royalties (186 per cent) led to higher receipts under „Non-
ferrous mining and metallurgical industry‟, which was mainly due to revision
of rates of royalty/dead rent of various minerals.
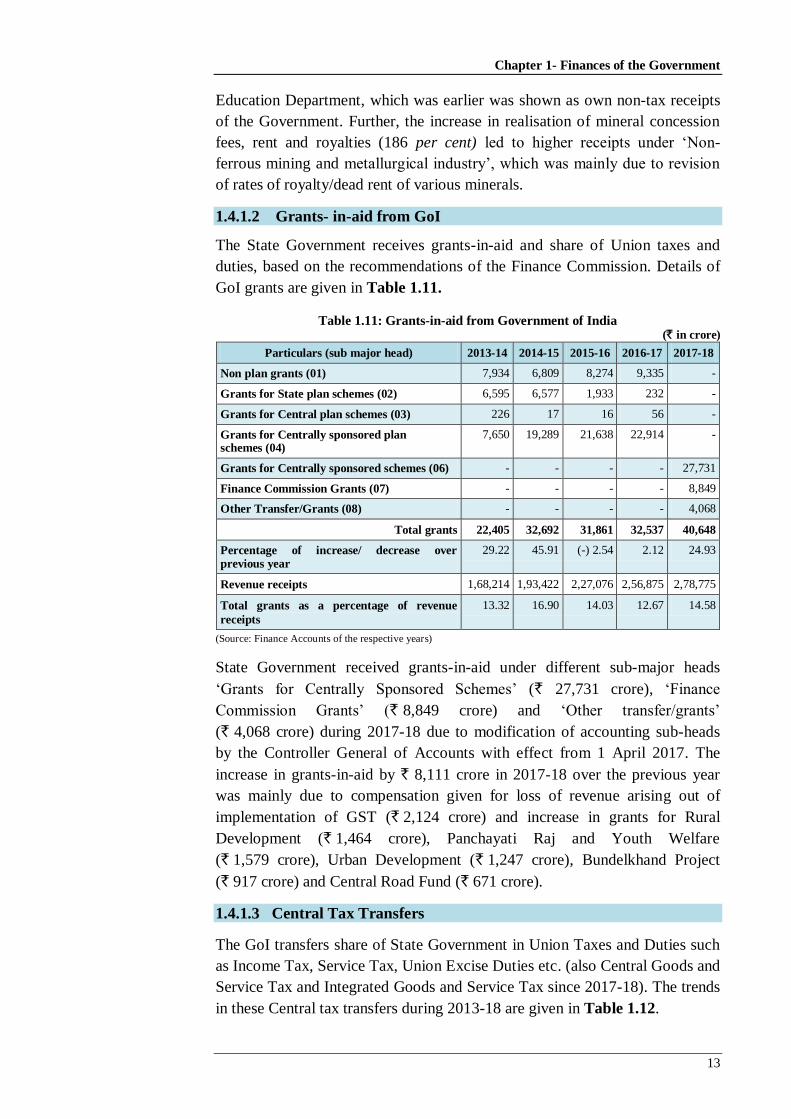
1.4.1.2 Grants- in-aid from GoI
The State Government receives grants-in-aid and share of Union taxes and
duties, based on the recommendations of the Finance Commission. Details of
GoI grants are given in Table 1.11.
Table 1.11: Grants-in-aid from Government of India (` in crore)
Particulars (sub major head) 2013-14 2014-15 2015-16 2016-17 2017-18
Non plan grants (01) 7,934 6,809 8,274 9,335 -
Grants for State plan schemes (02) 6,595 6,577 1,933 232 -
Grants for Central plan schemes (03) 226 17 16 56 -
Grants for Centrally sponsored plan schemes (04)
7,650 19,289 21,638 22,914 -
Grants for Centrally sponsored schemes (06) - - - - 27,731
Finance Commission Grants (07) - - - - 8,849
Other Transfer/Grants (08) - - - - 4,068
Total grants 22,405 32,692 31,861 32,537 40,648
Percentage of increase/ decrease over previous year
29.22 45.91 (-) 2.54 2.12 24.93
Revenue receipts 1,68,214 1,93,422 2,27,076 2,56,875 2,78,775
Total grants as a percentage of revenue
receipts
13.32 16.90 14.03 12.67 14.58
(Source: Finance Accounts of the respective years)
State Government received grants-in-aid under different sub-major heads
„Grants for Centrally Sponsored Schemes‟ (` 27,731 crore), „Finance
Commission Grants‟ (` 8,849 crore) and „Other transfer/grants‟
(` 4,068 crore) during 2017-18 due to modification of accounting sub-heads
by the Controller General of Accounts with effect from 1 April 2017. The
increase in grants-in-aid by ` 8,111 crore in 2017-18 over the previous year
was mainly due to compensation given for loss of revenue arising out of
implementation of GST (` 2,124 crore) and increase in grants for Rural
Development (` 1,464 crore), Panchayati Raj and Youth Welfare
(` 1,579 crore), Urban Development (` 1,247 crore), Bundelkhand Project
(` 917 crore) and Central Road Fund (` 671 crore).
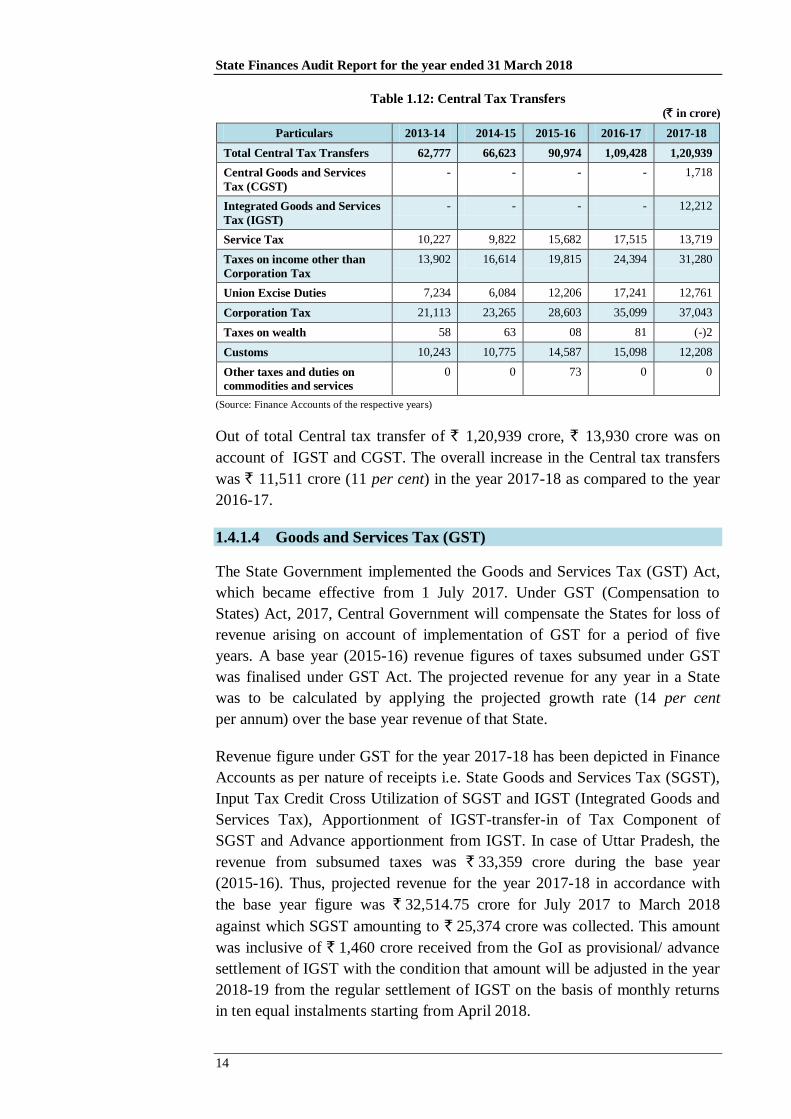
1.4.1.3 Central Tax Transfers
The GoI transfers share of State Government in Union Taxes and Duties such
as Income Tax, Service Tax, Union Excise Duties etc. (also Central Goods and
Service Tax and Integrated Goods and Service Tax since 2017-18). The trends
in these Central tax transfers during 2013-18 are given in Table 1.12.
State Finances Audit Report for the year ended 31 March 2018
14
Table 1.12: Central Tax Transfers (` in crore)
Particulars 2013-14 2014-15 2015-16 2016-17 2017-18
Total Central Tax Transfers 62,777 66,623 90,974 1,09,428 1,20,939
Central Goods and Services
Tax (CGST)
- - - - 1,718
Integrated Goods and Services
Tax (IGST)
- - - - 12,212
Service Tax 10,227 9,822 15,682 17,515 13,719
Taxes on income other than
Corporation Tax
13,902 16,614 19,815 24,394 31,280
Union Excise Duties 7,234 6,084 12,206 17,241 12,761
Corporation Tax 21,113 23,265 28,603 35,099 37,043
Taxes on wealth 58 63 08 81 (-)2
Customs 10,243 10,775 14,587 15,098 12,208
Other taxes and duties on
commodities and services
0 0 73 0 0
(Source: Finance Accounts of the respective years)
Out of total Central tax transfer of ` 1,20,939 crore, ` 13,930 crore was on
account of IGST and CGST. The overall increase in the Central tax transfers
was ` 11,511 crore (11 per cent) in the year 2017-18 as compared to the year
2016-17.
1.4.1.4 Goods and Services Tax (GST)
The State Government implemented the Goods and Services Tax (GST) Act,
which became effective from 1 July 2017. Under GST (Compensation to
States) Act, 2017, Central Government will compensate the States for loss of
revenue arising on account of implementation of GST for a period of five
years. A base year (2015-16) revenue figures of taxes subsumed under GST
was finalised under GST Act. The projected revenue for any year in a State
was to be calculated by applying the projected growth rate (14 per cent
per annum) over the base year revenue of that State.
Revenue figure under GST for the year 2017-18 has been depicted in Finance
Accounts as per nature of receipts i.e. State Goods and Services Tax (SGST),
Input Tax Credit Cross Utilization of SGST and IGST (Integrated Goods and
Services Tax), Apportionment of IGST-transfer-in of Tax Component of
SGST and Advance apportionment from IGST. In case of Uttar Pradesh, the
revenue from subsumed taxes was ` 33,359 crore during the base year
(2015-16). Thus, projected revenue for the year 2017-18 in accordance with
the base year figure was ` 32,514.75 crore for July 2017 to March 2018
against which SGST amounting to ` 25,374 crore was collected. This amount
was inclusive of ` 1,460 crore received from the GoI as provisional/ advance
settlement of IGST with the condition that amount will be adjusted in the year
2018-19 from the regular settlement of IGST on the basis of monthly returns
in ten equal instalments starting from April 2018.
Chapter 1- Finances of the Government
15
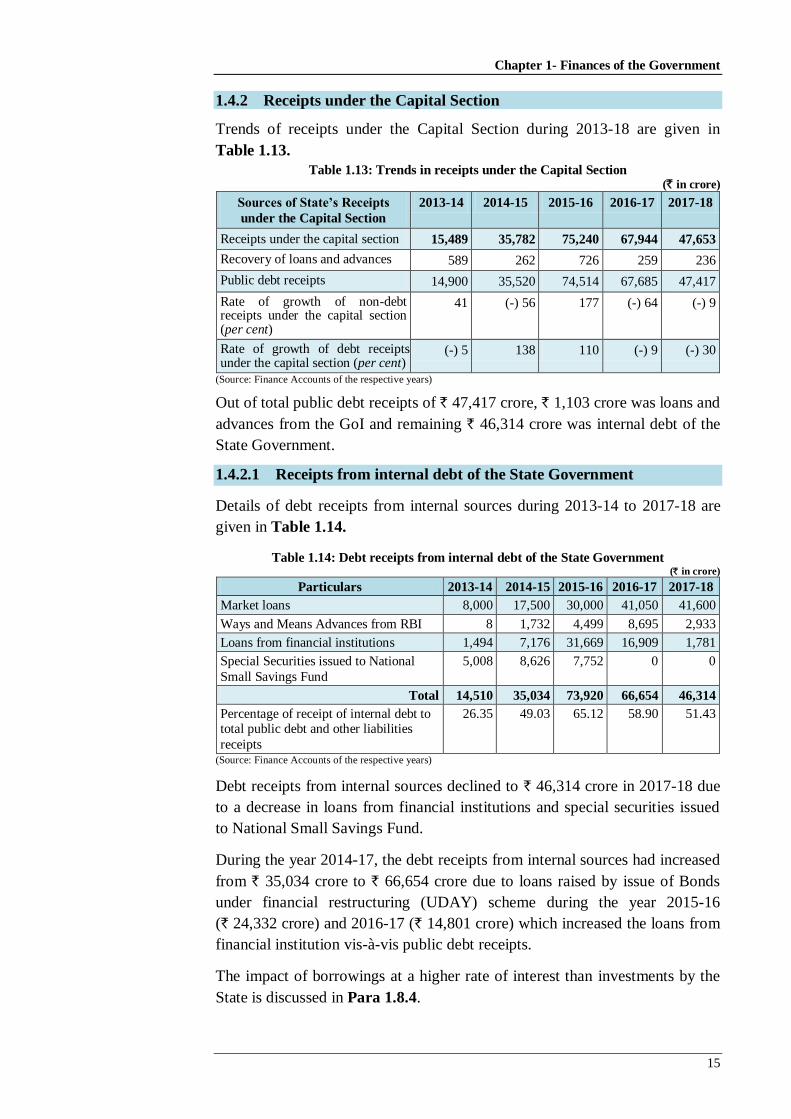
1.4.2 Receipts under the Capital Section
Trends of receipts under the Capital Section during 2013-18 are given in
Table 1.13.
Table 1.13: Trends in receipts under the Capital Section (` in crore)
Sources of State’s Receipts
under the Capital Section
2013-14 2014-15 2015-16 2016-17 2017-18
Receipts under the capital section 15,489 35,782 75,240 67,944 47,653
Recovery of loans and advances 589 262 726 259 236
Public debt receipts 14,900 35,520 74,514 67,685 47,417
Rate of growth of non-debt receipts under the capital section (per cent)
41 (-) 56 177 (-) 64 (-) 9
Rate of growth of debt receipts under the capital section (per cent)
(-) 5 138 110 (-) 9 (-) 30
(Source: Finance Accounts of the respective years)
Out of total public debt receipts of ` 47,417 crore, ` 1,103 crore was loans and
advances from the GoI and remaining ` 46,314 crore was internal debt of the
State Government.
1.4.2.1 Receipts from internal debt of the State Government
Details of debt receipts from internal sources during 2013-14 to 2017-18 are
given in Table 1.14.
Table 1.14: Debt receipts from internal debt of the State Government (` in crore)
Particulars 2013-14 2014-15 2015-16 2016-17 2017-18
Market loans 8,000 17,500 30,000 41,050 41,600
Ways and Means Advances from RBI 8 1,732 4,499 8,695 2,933
Loans from financial institutions 1,494 7,176 31,669 16,909 1,781
Special Securities issued to National
Small Savings Fund
5,008 8,626 7,752 0 0
Total 14,510 35,034 73,920 66,654 46,314
Percentage of receipt of internal debt to total public debt and other liabilities
receipts
26.35 49.03 65.12 58.90 51.43
(Source: Finance Accounts of the respective years)
Debt receipts from internal sources declined to ` 46,314 crore in 2017-18 due
to a decrease in loans from financial institutions and special securities issued
to National Small Savings Fund.
During the year 2014-17, the debt receipts from internal sources had increased
from ` 35,034 crore to ` 66,654 crore due to loans raised by issue of Bonds
under financial restructuring (UDAY) scheme during the year 2015-16
(` 24,332 crore) and 2016-17 (` 14,801 crore) which increased the loans from
financial institution vis-à-vis public debt receipts.
The impact of borrowings at a higher rate of interest than investments by the
State is discussed in Para 1.8.4.
State Finances Audit Report for the year ended 31 March 2018
16
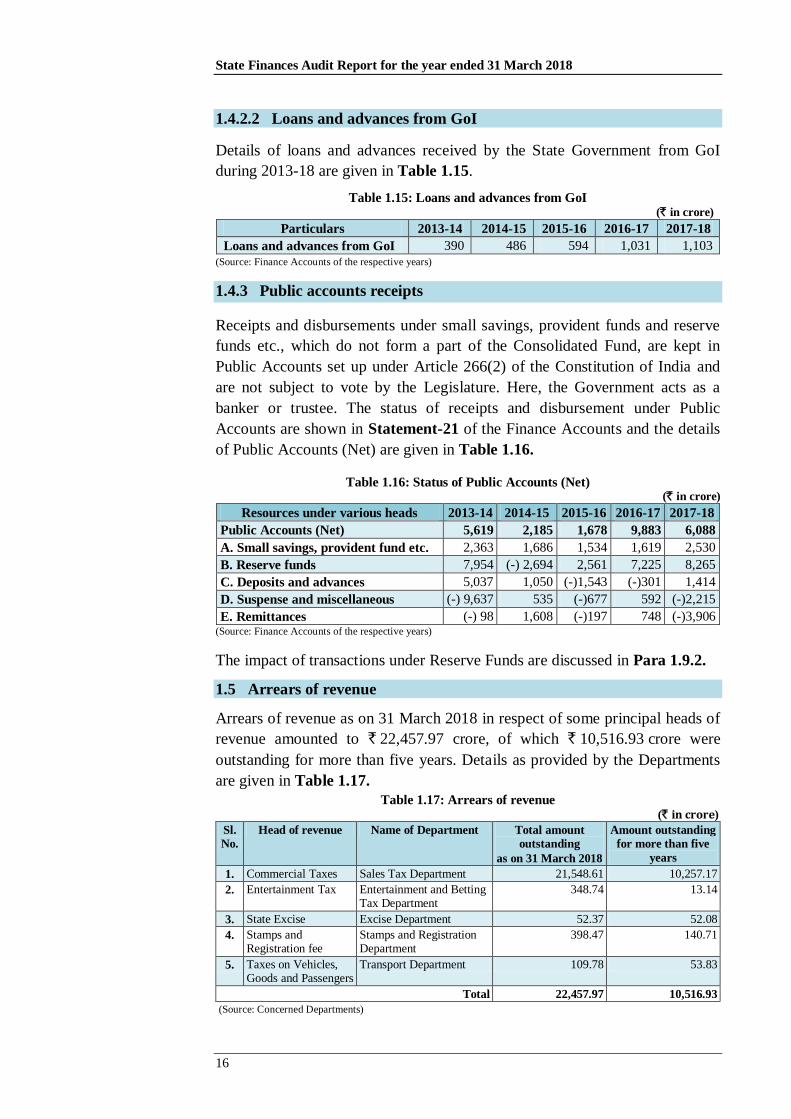
1.4.2.2 Loans and advances from GoI
Details of loans and advances received by the State Government from GoI
during 2013-18 are given in Table 1.15.
Table 1.15: Loans and advances from GoI (` in crore)
Particulars 2013-14 2014-15 2015-16 2016-17 2017-18
Loans and advances from GoI 390 486 594 1,031 1,103
(Source: Finance Accounts of the respective years)
1.4.3 Public accounts receipts
Receipts and disbursements under small savings, provident funds and reserve
funds etc., which do not form a part of the Consolidated Fund, are kept in
Public Accounts set up under Article 266(2) of the Constitution of India and
are not subject to vote by the Legislature. Here, the Government acts as a
banker or trustee. The status of receipts and disbursement under Public
Accounts are shown in Statement-21 of the Finance Accounts and the details
of Public Accounts (Net) are given in Table 1.16.
Table 1.16: Status of Public Accounts (Net) (` in crore)
Resources under various heads 2013-14 2014-15 2015-16 2016-17 2017-18
Public Accounts (Net) 5,619 2,185 1,678 9,883 6,088
A. Small savings, provident fund etc. 2,363 1,686 1,534 1,619 2,530
B. Reserve funds 7,954 (-) 2,694 2,561 7,225 8,265
C. Deposits and advances 5,037 1,050 (-)1,543 (-)301 1,414
D. Suspense and miscellaneous (-) 9,637 535 (-)677 592 (-)2,215
E. Remittances (-) 98 1,608 (-)197 748 (-)3,906 (Source: Finance Accounts of the respective years)
The impact of transactions under Reserve Funds are discussed in Para 1.9.2.
1.5 Arrears of revenue
Arrears of revenue as on 31 March 2018 in respect of some principal heads of
revenue amounted to ` 22,457.97 crore, of which ` 10,516.93 crore were
outstanding for more than five years. Details as provided by the Departments
are given in Table 1.17.
Table 1.17: Arrears of revenue (` in crore)
Sl.
No.
Head of revenue Name of Department Total amount
outstanding
as on 31 March 2018
Amount outstanding
for more than five
years
1. Commercial Taxes Sales Tax Department 21,548.61 10,257.17
2. Entertainment Tax Entertainment and Betting Tax Department
348.74 13.14
3. State Excise Excise Department 52.37 52.08
4. Stamps and Registration fee
Stamps and Registration Department
398.47 140.71
5. Taxes on Vehicles, Goods and Passengers
Transport Department 109.78 53.83
Total 22,457.97 10,516.93
(Source: Concerned Departments)
Chapter 1- Finances of the Government
17
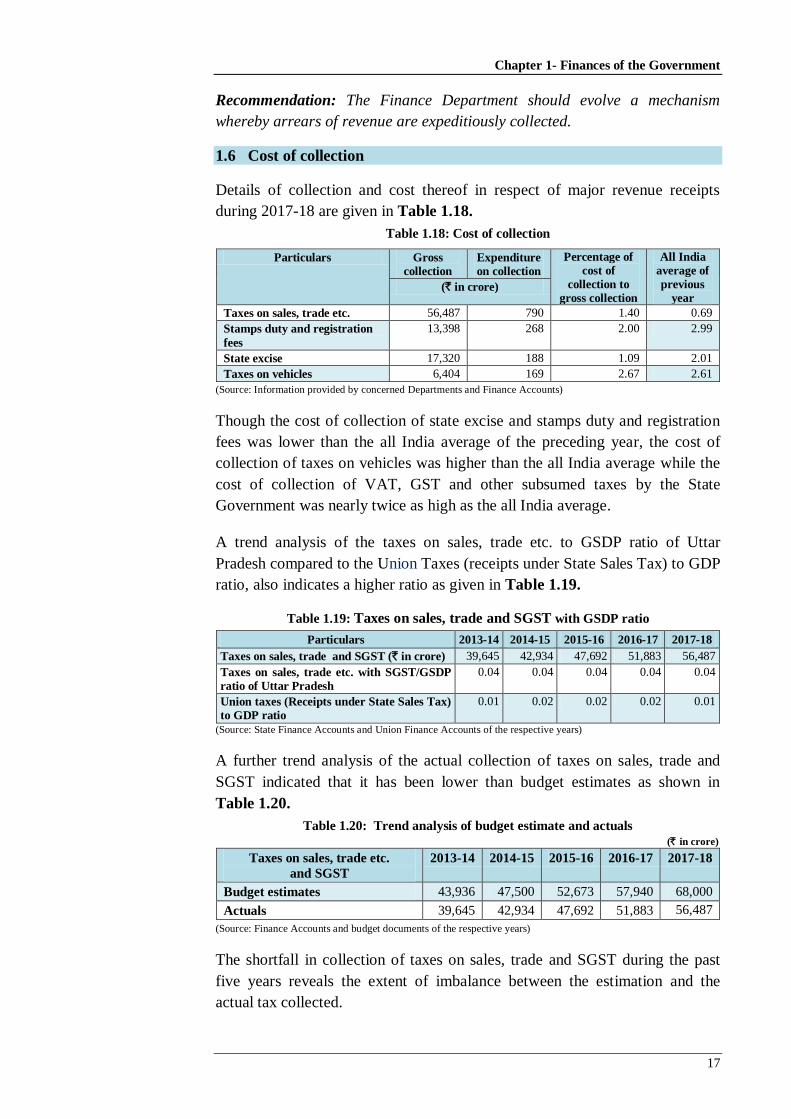
Recommendation: The Finance Department should evolve a mechanism
whereby arrears of revenue are expeditiously collected.
1.6 Cost of collection
Details of collection and cost thereof in respect of major revenue receipts
during 2017-18 are given in Table 1.18.
Table 1.18: Cost of collection
Particulars Gross
collection
Expenditure
on collection
Percentage of
cost of
collection to
gross collection
All India
average of
previous
year (` in crore)
Taxes on sales, trade etc. 56,487 790 1.40 0.69
Stamps duty and registration
fees
13,398 268 2.00 2.99
State excise 17,320 188 1.09 2.01
Taxes on vehicles 6,404 169 2.67 2.61
(Source: Information provided by concerned Departments and Finance Accounts)
Though the cost of collection of state excise and stamps duty and registration
fees was lower than the all India average of the preceding year, the cost of
collection of taxes on vehicles was higher than the all India average while the
cost of collection of VAT, GST and other subsumed taxes by the State
Government was nearly twice as high as the all India average.
A trend analysis of the taxes on sales, trade etc. to GSDP ratio of Uttar
Pradesh compared to the Union Taxes (receipts under State Sales Tax) to GDP
ratio, also indicates a higher ratio as given in Table 1.19.
Table 1.19: Taxes on sales, trade and SGST with GSDP ratio
Particulars 2013-14 2014-15 2015-16 2016-17 2017-18
Taxes on sales, trade and SGST (` in crore) 39,645 42,934 47,692 51,883 56,487
Taxes on sales, trade etc. with SGST/GSDP
ratio of Uttar Pradesh
0.04 0.04 0.04 0.04 0.04
Union taxes (Receipts under State Sales Tax)
to GDP ratio
0.01 0.02 0.02 0.02 0.01
(Source: State Finance Accounts and Union Finance Accounts of the respective years)
A further trend analysis of the actual collection of taxes on sales, trade and
SGST indicated that it has been lower than budget estimates as shown in
Table 1.20.
Table 1.20: Trend analysis of budget estimate and actuals (` in crore)
Taxes on sales, trade etc.
and SGST
2013-14 2014-15 2015-16 2016-17 2017-18
Budget estimates 43,936 47,500 52,673 57,940 68,000
Actuals 39,645 42,934 47,692 51,883 56,487
(Source: Finance Accounts and budget documents of the respective years)
The shortfall in collection of taxes on sales, trade and SGST during the past
five years reveals the extent of imbalance between the estimation and the
actual tax collected.

State Finances Audit Report for the year ended 31 March 2018
18
Recommendation: The Finance Department and the Sales Tax Department
should analyse why the cost of collection of VAT, GST and other subsumed
taxes is nearly twice as high as the all India average and introduce measures
to reduce the cost of collection.
1.7 Application of resources
1.7.1 Growth and composition of expenditure
Chart 1.7 and Chart 1.8 present the trends and composition of total
expenditure during 2013-18 respectively.
(Source: Finance Accounts of the respective years)
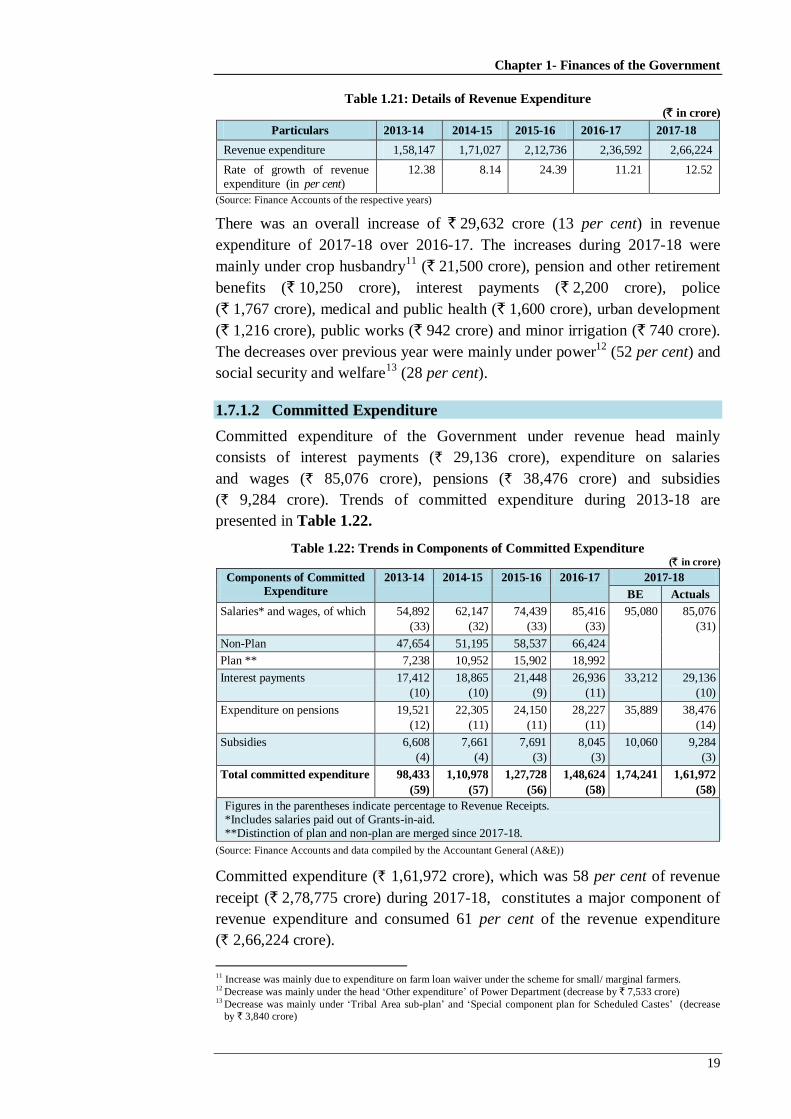
1.7.1.1 Revenue Expenditure
Details of revenue expenditure are given in Table 1.21.
Chart: 1.8 Expenditure by activity as a percent of total expenditure
Chapter 1- Finances of the Government
19
Table 1.21: Details of Revenue Expenditure (` in crore)
Particulars 2013-14 2014-15 2015-16 2016-17 2017-18
Revenue expenditure 1,58,147 1,71,027 2,12,736 2,36,592 2,66,224
Rate of growth of revenue
expenditure (in per cent)
12.38 8.14 24.39 11.21 12.52
(Source: Finance Accounts of the respective years)
There was an overall increase of ` 29,632 crore (13 per cent) in revenue
expenditure of 2017-18 over 2016-17. The increases during 2017-18 were
mainly under crop husbandry11
(` 21,500 crore), pension and other retirement
benefits (` 10,250 crore), interest payments (` 2,200 crore), police
(` 1,767 crore), medical and public health (` 1,600 crore), urban development
(` 1,216 crore), public works (` 942 crore) and minor irrigation (` 740 crore).
The decreases over previous year were mainly under power12
(52 per cent) and
social security and welfare13
(28 per cent).
1.7.1.2 Committed Expenditure
Committed expenditure of the Government under revenue head mainly
consists of interest payments (` 29,136 crore), expenditure on salaries
and wages (` 85,076 crore), pensions (` 38,476 crore) and subsidies
(` 9,284 crore). Trends of committed expenditure during 2013-18 are
presented in Table 1.22.
Table 1.22: Trends in Components of Committed Expenditure (` in crore)
Components of Committed
Expenditure
2013-14 2014-15 2015-16 2016-17 2017-18
BE Actuals
Salaries* and wages, of which 54,892
(33)
62,147
(32)
74,439
(33)
85,416
(33)
95,080 85,076
(31)
Non-Plan 47,654 51,195 58,537 66,424
Plan ** 7,238 10,952 15,902 18,992
Interest payments 17,412
(10)
18,865
(10)
21,448
(9)
26,936
(11)
33,212 29,136
(10)
Expenditure on pensions 19,521
(12)
22,305
(11)
24,150
(11)
28,227
(11)
35,889 38,476
(14)
Subsidies 6,608
(4)
7,661
(4)
7,691
(3)
8,045
(3)
10,060 9,284
(3)
Total committed expenditure 98,433
(59)
1,10,978
(57)
1,27,728
(56)
1,48,624
(58)
1,74,241 1,61,972
(58)
Figures in the parentheses indicate percentage to Revenue Receipts. *Includes salaries paid out of Grants-in-aid. **Distinction of plan and non-plan are merged since 2017-18.
(Source: Finance Accounts and data compiled by the Accountant General (A&E))
Committed expenditure (` 1,61,972 crore), which was 58 per cent of revenue
receipt (` 2,78,775 crore) during 2017-18, constitutes a major component of
revenue expenditure and consumed 61 per cent of the revenue expenditure
(` 2,66,224 crore).
11
Increase was mainly due to expenditure on farm loan waiver under the scheme for small/ marginal farmers. 12
Decrease was mainly under the head „Other expenditure‟ of Power Department (decrease by ` 7,533 crore) 13
Decrease was mainly under „Tribal Area sub-plan‟ and „Special component plan for Scheduled Castes‟ (decrease
by ` 3,840 crore)

State Finances Audit Report for the year ended 31 March 2018
20
1.7.1.3 Defined Contribution Pension Scheme
State Government employees recruited on or after 1 April 2005 are covered
under the Defined Contribution Pension Scheme. It is also applicable to the
new entrants of Government aided educational institutions and autonomous
bodies financed by the Government as well. In terms of the Scheme, the
Government employees contribute 10 per cent of basic pay and dearness
allowance, which is matched by the State Government and the entire amount
is transferred to the designated fund manager through the National Securities
Depository Limited (NSDL)/ Trustee Bank.
State Government did not discharge its statutory liability as it failed to
contribute ` 465.10 crore during the financial year 2017-18 as its matching
share under Defined Contribution Pension Scheme in respect of employees of
Government aided institutions and autonomous bodies. During the previous
financial years 2008-09 to 2016-17, State Government did not contribute
` 211.69 crore as its matching share under Defined Contribution Pension
Scheme in respect of Government employees and employees of Government
aided institutions and autonomous bodies.
Further, State Government collected ` 8,205.66 crore as share of Government
employees, employees of Government aided institutions and autonomous
bodies as well as Government share, under Defined Contribution Pension
Scheme during 2008-09 to 2017-18, but did not deposit ` 703.16 crore with
the designated authority for further investment as per provisions of the
Scheme. Thus, as on 31 March 2018, there was a short transfer of ` 1,379.95
crore (` 465.10 crore + ` 211.69 crore+ ` 703.16 crore) to the designated
authority and the current liability stands deferred to future year(s). Further, the
State Government has created uncertainty in respect of benefits due to the
employees/ avoidable financial liability to Government in future, and, thus
leading to possible failure of the scheme itself.
There was an outstanding balance of ` 545.68 crore at the beginning of the
year 2017-18 under Deposits bearing interest, relating to Defined Contribution
Pension Scheme and the State Government had paid interest thereon of
` 25.78 crore which was calculated on the basis of annual interest rate
applicable on the interest rate of GPF of the Government employees.
However, the adequacy of interest paid on outstanding balance could not be
vouched, as Directorate of Pension did not provide the related calculation for
audit examination.
Recommendation: The State Government should initiate action immediately
to ensure that employees recruited on or after 1 April 2005 are fully covered
under the Defined Contribution Pension Scheme from the date of their
recruitment. This is to be done by ensuring that employees’ deductions
are fully deducted, fully matched by Government contributions and fully
transferred to the designated fund manager through NSDL in a timely manner.

Chapter 1- Finances of the Government
21
1.7.1.4 Capital Expenditure
Details of capital expenditure are given in Table 1.23.
Table 1.23: Details of Capital Expenditure (` in crore)
Particulars 2013-14 2014-15 2015-16 2016-17 2017-18
Capital expenditure 32,863 53,297 64,423 69,789 39,088
Rate of growth of Capital
expenditure (in per cent)
37.88 62.18 20.88 8.33 (-) 43.99
Capital expenditure as a percentage of GSDP at current
prices (in per cent)
3.49 5.27 5.67 5.58 2.84
(Source: Finance Accounts of the respective years)
Out of total capital expenditure of ` 39,088 crore during 2017-18, State
Government made an investment of ` 8,380 crore in Public Sector
Undertakings (PSUs), Statutory Corporations and Cooperative Societies, of
which ` 8,271 crore was invested as Share Capital in Power Sector PSUs for
rural electrification, strengthening of distribution network, Deen Dayal
Upadhyay Gram Jyoti Yojna, Har Ghar Bijli Yojna, etc. Other major areas
included a spending of ` 7,635 crore on roads and bridges, ` 2,313 crore on
rural development programme, ` 5,617 crore on housing, ` 1,811 crore on
water supply and sanitation and ` 1,010 crore on public works.
There was an overall decrease in capital expenditure by ` 30,701 crore
(44 per cent) over the previous year. Decreases were mainly under roads and
bridges, power projects, food storage and warehousing, housing and forestry
and wild life as detailed in Table 1.24.
Table 1.24: Details on decrease in capital expenditure in 2017-18
Major Head of
Expenditure
Decrease in capital
expenditure from 2016-17
Main Reason for decrease in
expenditure in 2017-18 as compared
to 2016-17 (` in crore) Percentage
5054-Capital Outlay
on Roads and Bridges
14,724 66 Decrease in expenditure on construction work of State Highways
and upgradation of district roads.
4801-Capital Outlay
on Power Projects
3,369 29 Decrease in expenditure on investment in Uttar Pradesh State Electricity
Production Nigam Limited and share
capital to Uttar Pradesh Power
Corporation Limited for strengthening
of transmission and distribution; no
expenditure on account of UDAY in
2017-18.
4408-Capital Outlay on Food Storage and
Warehousing
1,748 61 It was due to decrease in expenditure
on Food Grains Supply Projects.
4700-Capital Outlay
on Major Irrigation
1,586 44 Decrease in expenditure on Upper Ganga Canal, Lower Ganga Canal,
Sharda Canal and Sharda Sahayak
Canal etc.
4202-Capital Outlay on Education, Sports,
Art and Culture
1,080 55 Decrease in expenditure on establishment of Government Schools
and State University.

State Finances Audit Report for the year ended 31 March 2018
22
Major Head of
Expenditure
Decrease in capital
expenditure from 2016-17
Main Reason for decrease in
expenditure in 2017-18 as compared
to 2016-17 (` in crore) Percentage
4216-Capital Outlay
on Housing
1,045 16 Decrease in expenditure on Lohiya Gramin Awas Yojna, Ashrya Yojana
and construction of Government
residential buildings.
4406-Capital Outlay on Forestry and Wild
Life
491 67 Decrease in expenditure on Green Belt Development Scheme, Social Forestry
and forestry related project.
(Source: Finance Accounts 2017-18)
Capital expenditure relative to GSDP of the State was 2.84 per cent during
2017-18 which was lower than other States of Bihar (5.93 per cent),
Jharkhand (4.68 per cent), Madhya Pradesh (4.37 per cent) and Chhattisgarh
(3.43 per cent), but was higher than Rajasthan (2.45 per cent) and Gujarat
(1.99 per cent).
1.7.2 Quality of Expenditure
Quality of expenditure basically involves three aspects, viz., adequacy of the
expenditure (i.e., adequate provisions for providing public services);
efficiency of expenditure use, and effectiveness (assessment of outlay-
outcome relationships for services).
1.7.2.1 Adequacy of Public Expenditure
The fiscal priorities of the State Government with regard to development
expenditure, social services expenditure, economic services expenditure and
capital expenditure during 2013-14 and 2017-18 are compared with General
Category States in Table 1.25.
Table 1.25: Fiscal Priorities of the State during 2013-14 and 2017-18 (in per cent)
Fiscal Priority
(Percentage to GSDP)
AE/
GSDP
DE#/
AE
SSE/
AE
ESE/
AE
CE/
AE
Education/
AE
Health/
AE
General Category States* Average (Ratio) 2013-14
14.7 66.5 37.6 28.9 13.6 17.2 4.5
Uttar Pradesh Average (Ratio) 2013-14
20.5 60.9 35.4 25.5
17.1 16.7 4.8
General Category States* Average (Ratio) 2017-18
16.1 67.9 36.7 29.6 14.4 15.5 4.9
Uttar Pradesh
(Ratio) 2017-18
22.3 60.8 31.3 29.5 12.7 15.3 5.5
AE: Aggregate Expenditure; DE: Development Expenditure; SSE: Social Services Expenditure; ESE:
Economic Services Expenditure; CE: Capital Expenditure.
*Excluding Goa.
#Development expenditure includes Development Revenue Expenditure, Development Capital Expenditure and Loans and Advances disbursed.
During 2017-18, the ratio of aggregate expenditure to GSDP and expenditure
on health services to aggregate expenditure was higher than the average for the
General Category States. However, the ratio of development expenditure,
expenditure on education and expenditure on economic services to aggregate
expenditure was less than the average of the General Category States. The
decline in ratio of social services expenditure for 2017-18 was on account of
Chapter 1- Finances of the Government
23
the lower rate of increase in the social services expenditure (41 per cent) as
compared to the increase in the aggregate expenditure (59 per cent) during the
period 2013-18.
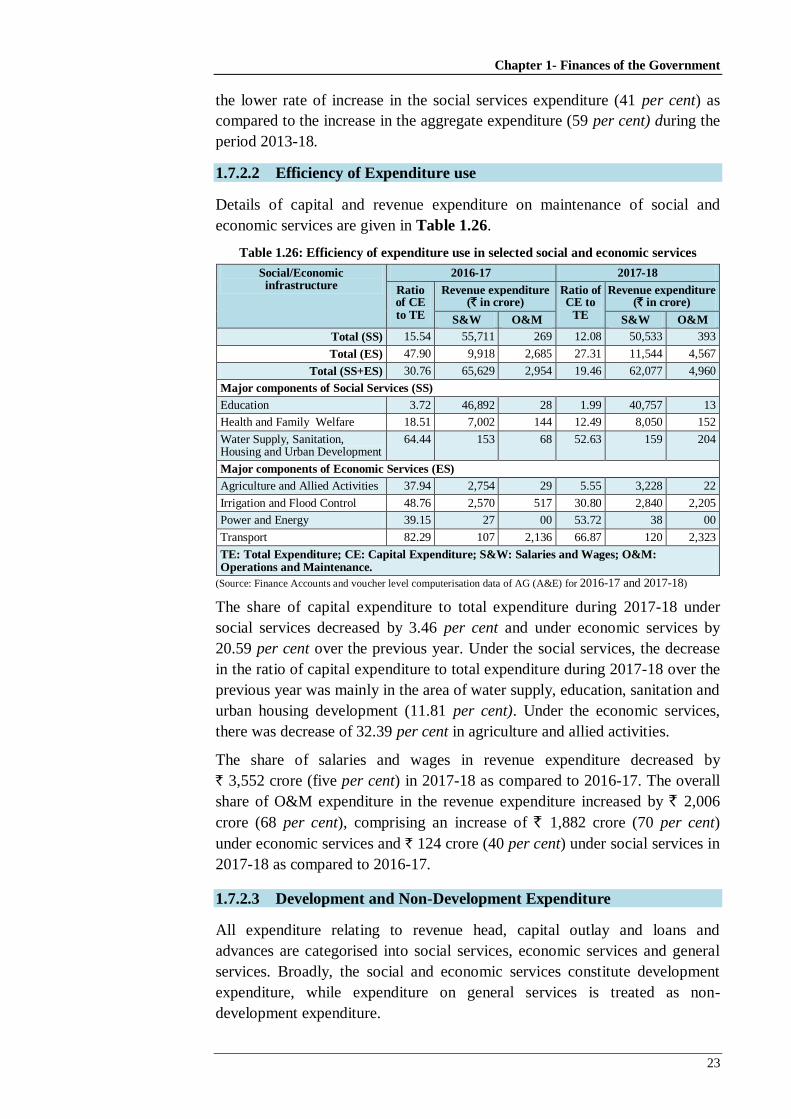
1.7.2.2 Efficiency of Expenditure use
Details of capital and revenue expenditure on maintenance of social and
economic services are given in Table 1.26.
Table 1.26: Efficiency of expenditure use in selected social and economic services
Social/Economic infrastructure
2016-17 2017-18
Ratio of CE to TE
Revenue expenditure (` in crore)
Ratio of CE to
TE
Revenue expenditure (` in crore)
S&W O&M S&W O&M
Total (SS) 15.54 55,711 269 12.08 50,533 393
Total (ES) 47.90 9,918 2,685 27.31 11,544 4,567
Total (SS+ES) 30.76 65,629 2,954 19.46 62,077 4,960
Major components of Social Services (SS)
Education 3.72 46,892 28 1.99 40,757 13
Health and Family Welfare 18.51 7,002 144 12.49 8,050 152
Water Supply, Sanitation, Housing and Urban Development
64.44 153 68 52.63 159 204
Major components of Economic Services (ES)
Agriculture and Allied Activities 37.94 2,754 29 5.55 3,228 22
Irrigation and Flood Control 48.76 2,570 517 30.80 2,840 2,205
Power and Energy 39.15 27 00 53.72 38 00
Transport 82.29 107 2,136 66.87 120 2,323
TE: Total Expenditure; CE: Capital Expenditure; S&W: Salaries and Wages; O&M: Operations and Maintenance.
(Source: Finance Accounts and voucher level computerisation data of AG (A&E) for 2016-17 and 2017-18)
The share of capital expenditure to total expenditure during 2017-18 under
social services decreased by 3.46 per cent and under economic services by
20.59 per cent over the previous year. Under the social services, the decrease
in the ratio of capital expenditure to total expenditure during 2017-18 over the
previous year was mainly in the area of water supply, education, sanitation and
urban housing development (11.81 per cent). Under the economic services,
there was decrease of 32.39 per cent in agriculture and allied activities.
The share of salaries and wages in revenue expenditure decreased by
` 3,552 crore (five per cent) in 2017-18 as compared to 2016-17. The overall
share of O&M expenditure in the revenue expenditure increased by ` 2,006
crore (68 per cent), comprising an increase of ` 1,882 crore (70 per cent)
under economic services and ` 124 crore (40 per cent) under social services in
2017-18 as compared to 2016-17.
1.7.2.3 Development and Non-Development Expenditure
All expenditure relating to revenue head, capital outlay and loans and
advances are categorised into social services, economic services and general
services. Broadly, the social and economic services constitute development
expenditure, while expenditure on general services is treated as non-
development expenditure.
State Finances Audit Report for the year ended 31 March 2018
24
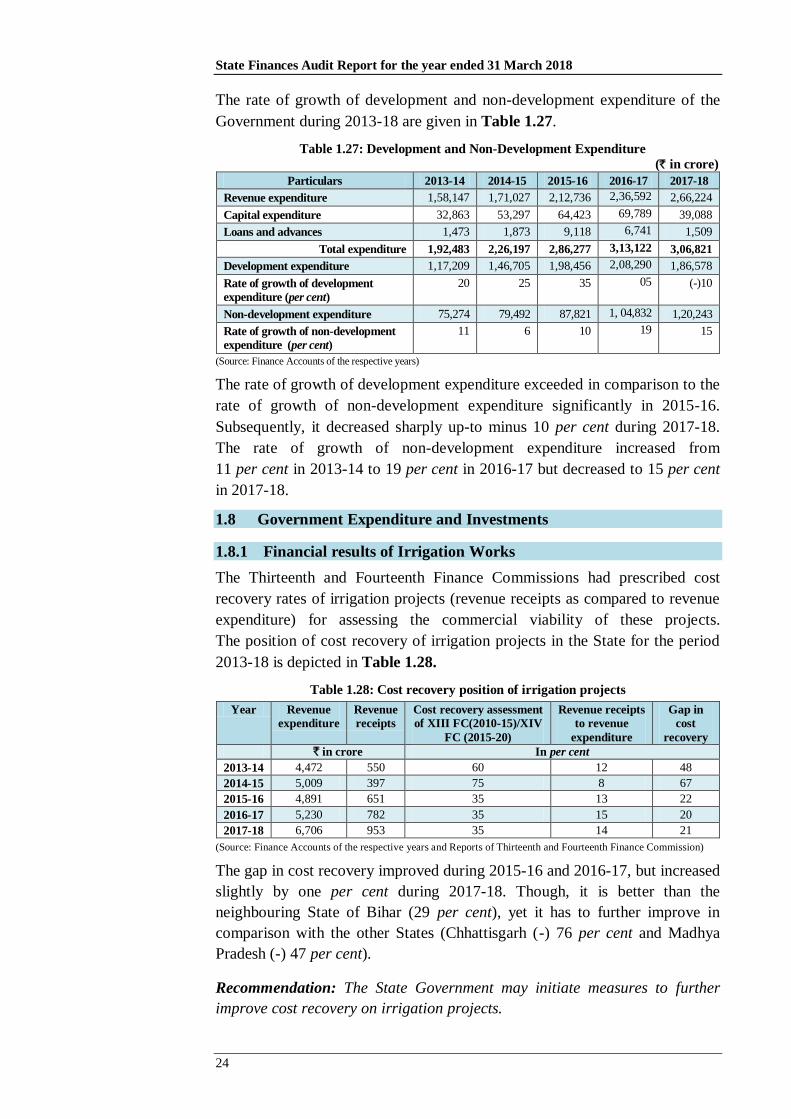
The rate of growth of development and non-development expenditure of the
Government during 2013-18 are given in Table 1.27.
Table 1.27: Development and Non-Development Expenditure
(` in crore)
Particulars 2013-14 2014-15 2015-16 2016-17 2017-18
Revenue expenditure 1,58,147 1,71,027 2,12,736 2,36,592 2,66,224
Capital expenditure 32,863 53,297 64,423 69,789 39,088
Loans and advances 1,473 1,873 9,118 6,741 1,509
Total expenditure 1,92,483 2,26,197 2,86,277 3,13,122 3,06,821
Development expenditure 1,17,209 1,46,705 1,98,456 2,08,290 1,86,578
Rate of growth of development
expenditure (per cent)
20 25 35 05 (-)10
Non-development expenditure 75,274 79,492 87,821 1, 04,832 1,20,243
Rate of growth of non-development
expenditure (per cent)
11 6 10 19 15
(Source: Finance Accounts of the respective years)
The rate of growth of development expenditure exceeded in comparison to the
rate of growth of non-development expenditure significantly in 2015-16.
Subsequently, it decreased sharply up-to minus 10 per cent during 2017-18.
The rate of growth of non-development expenditure increased from
11 per cent in 2013-14 to 19 per cent in 2016-17 but decreased to 15 per cent
in 2017-18.
1.8 Government Expenditure and Investments
1.8.1 Financial results of Irrigation Works
The Thirteenth and Fourteenth Finance Commissions had prescribed cost
recovery rates of irrigation projects (revenue receipts as compared to revenue
expenditure) for assessing the commercial viability of these projects.
The position of cost recovery of irrigation projects in the State for the period
2013-18 is depicted in Table 1.28.
Table 1.28: Cost recovery position of irrigation projects
Year Revenue
expenditure Revenue
receipts Cost recovery assessment
of XIII FC(2010-15)/XIV
FC (2015-20)
Revenue receipts
to revenue
expenditure
Gap in
cost
recovery
` in crore In per cent
2013-14 4,472 550 60 12 48
2014-15 5,009 397 75 8 67
2015-16 4,891 651 35 13 22
2016-17 5,230 782 35 15 20
2017-18 6,706 953 35 14 21
(Source: Finance Accounts of the respective years and Reports of Thirteenth and Fourteenth Finance Commission)
The gap in cost recovery improved during 2015-16 and 2016-17, but increased
slightly by one per cent during 2017-18. Though, it is better than the
neighbouring State of Bihar (29 per cent), yet it has to further improve in
comparison with the other States (Chhattisgarh (-) 76 per cent and Madhya
Pradesh (-) 47 per cent).
Recommendation: The State Government may initiate measures to further
improve cost recovery on irrigation projects.
Chapter 1- Finances of the Government
25
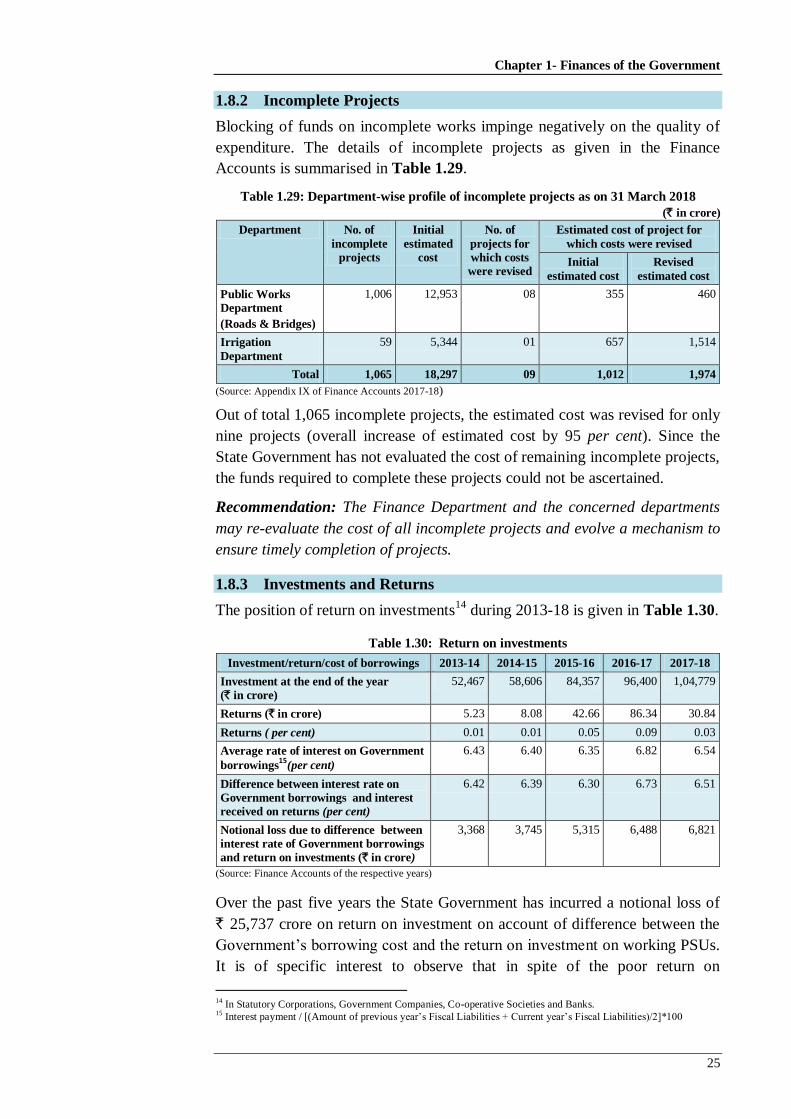
1.8.2 Incomplete Projects
Blocking of funds on incomplete works impinge negatively on the quality of
expenditure. The details of incomplete projects as given in the Finance
Accounts is summarised in Table 1.29.
Table 1.29: Department-wise profile of incomplete projects as on 31 March 2018
(` in crore)
Department No. of
incomplete
projects
Initial
estimated
cost
No. of
projects for
which costs
were revised
Estimated cost of project for
which costs were revised
Initial
estimated cost
Revised
estimated cost
Public Works
Department
(Roads & Bridges)
1,006 12,953 08 355 460
Irrigation
Department
59 5,344 01 657 1,514
Total 1,065 18,297 09 1,012 1,974
(Source: Appendix IX of Finance Accounts 2017-18)
Out of total 1,065 incomplete projects, the estimated cost was revised for only
nine projects (overall increase of estimated cost by 95 per cent). Since the
State Government has not evaluated the cost of remaining incomplete projects,
the funds required to complete these projects could not be ascertained.
Recommendation: The Finance Department and the concerned departments
may re-evaluate the cost of all incomplete projects and evolve a mechanism to
ensure timely completion of projects.
1.8.3 Investments and Returns
The position of return on investments14
during 2013-18 is given in Table 1.30.
Table 1.30: Return on investments
Investment/return/cost of borrowings 2013-14 2014-15 2015-16 2016-17 2017-18
Investment at the end of the year
(` in crore)
52,467 58,606 84,357 96,400 1,04,779
Returns (` in crore) 5.23 8.08 42.66 86.34 30.84
Returns ( per cent) 0.01 0.01 0.05 0.09 0.03
Average rate of interest on Government
borrowings15
(per cent)
6.43 6.40 6.35 6.82 6.54
Difference between interest rate on
Government borrowings and interest
received on returns (per cent)
6.42 6.39 6.30 6.73 6.51
Notional loss due to difference between
interest rate of Government borrowings
and return on investments (` in crore)
3,368 3,745 5,315 6,488 6,821
(Source: Finance Accounts of the respective years)
Over the past five years the State Government has incurred a notional loss of
` 25,737 crore on return on investment on account of difference between the
Government‟s borrowing cost and the return on investment on working PSUs.
It is of specific interest to observe that in spite of the poor return on
14
In Statutory Corporations, Government Companies, Co-operative Societies and Banks. 15
Interest payment / [(Amount of previous year‟s Fiscal Liabilities + Current year‟s Fiscal Liabilities)/2]*100

State Finances Audit Report for the year ended 31 March 2018
26
investments, the Finance Department has regularly provided budgetary
support to these PSUs by way of infusion of equity, loans, grants-in-aid,
subsidies which had not even finalised their accounts as per the provisions of
the Companies Act, as discussed in Para 3.13.
As per the dividend policy, all profit earning PSUs are required to pay a
minimum dividend of five per cent on the paid up share capital contributed by
the State Government. However, out of 20 profit earning PSUs only 11 PSUs
declared a dividend of ` 8.56 crore and the remaining nine profit earning PSUs
did not declare dividend of ` 540.36 crore, as discussed in Para 3.14.
1.8.4 Loans and Advances by State Government
In addition to investments in co-operative societies, corporations and
companies, State Government has also been providing loans and advances to
many of these institutions/organisations, including loans and advances to the
Government Servants. Details are given in Table 1.31.
Table 1.31: Outstanding loans and advances and interest
receipts and payments by State Government (` in crore)
Particulars 2013-14 2014-15 2015-16 2016-17 2017-18
Opening balance of loans and advances 11,572 12,456 14,067 22,459 28,447
Amount advanced during the year 1,473 1,873 9,118 6,741 1,509
Amount repaid during the year 589 262 726 259 236
Closing balance of loans and advances 12,456 14,067 22,459 28,447* 29,720
Net addition of loans and advances 884 1,611 8,392 5,988 1,273
Interest receipts 19 14 26 566 606
Interest receipts as per cent to outstanding
Loans and Advances16
0.15 0.10 0.12 1.99 2.08
Average rate of interest on Government
borrowings17
(per cent)
6.43 6.40 6.35 6.82 6.54
Difference between interest rate on
Government borrowings and interest
received on loans (per cent)
6.28 6.30 6.23 4.83 4.46
Loss due to the difference between
interest rate of Government borrowings
and interest received on loans (` in crore)
93 118 568 326 67
(Source: Finance Accounts of the respective years)
(*` 494 crore pertaining to the period of the composite State of Uttar Pradesh was allocated to Uttarakhand)
Out of total amount repaid during the year (` 236 crore), ` 102 crore
(43 per cent) was repaid by the Government servants. Over the past five years
the State Government has incurred a notional loss of ` 1,172 crore towards
interest on account of difference in the interest received on the loans advanced
and that the Government incurred on its borrowings.
Details of loans and advances made by the Government are detailed in
Section-1 of Statement-18 of Finance Accounts and details of entities
that were in arrears of repayment of loans are detailed in Section-2 of
Statement-18 of Finance Accounts.
16
Interest Received/ [(Opening balance + Closing balance of Loans and Advance )/2}]*100. 17
Interest payment / [(Amount of previous year‟s Fiscal Liabilities + Current year‟s Fiscal Liabilities)/2]*100.
Chapter 1- Finances of the Government
27
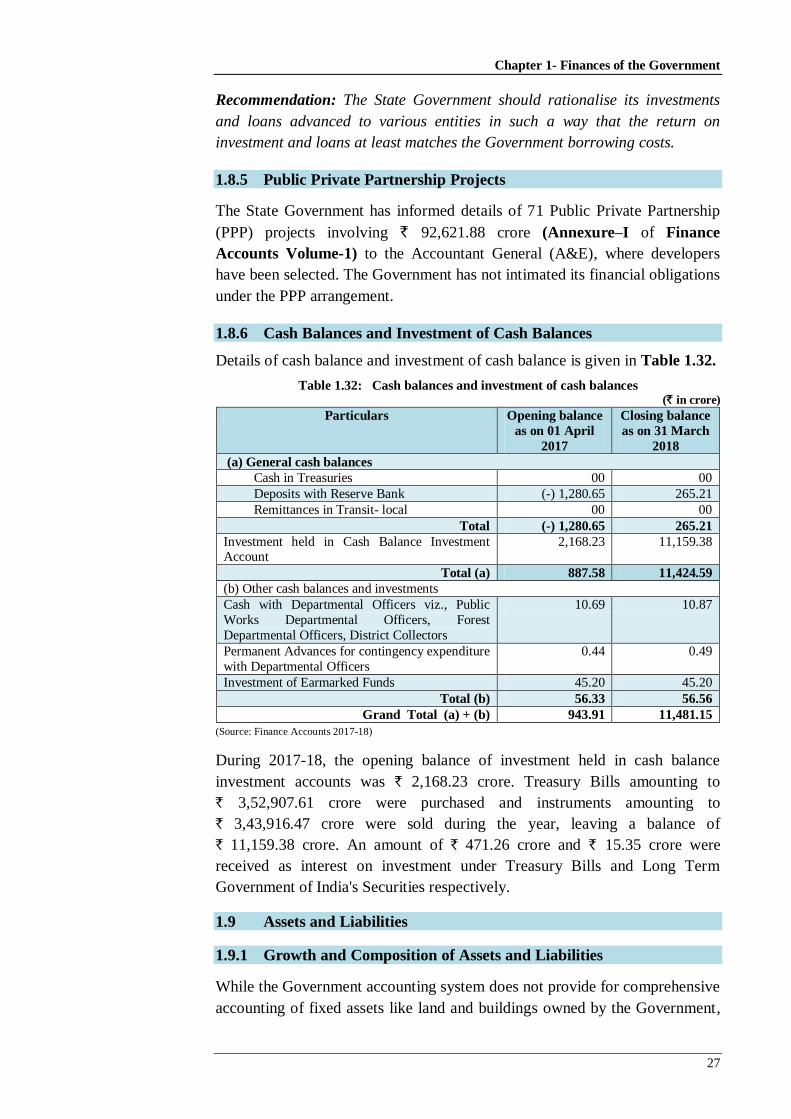
Recommendation: The State Government should rationalise its investments
and loans advanced to various entities in such a way that the return on
investment and loans at least matches the Government borrowing costs.
1.8.5 Public Private Partnership Projects
The State Government has informed details of 71 Public Private Partnership
(PPP) projects involving ` 92,621.88 crore (Annexure–I of Finance
Accounts Volume-1) to the Accountant General (A&E), where developers
have been selected. The Government has not intimated its financial obligations
under the PPP arrangement.
1.8.6 Cash Balances and Investment of Cash Balances
Details of cash balance and investment of cash balance is given in Table 1.32.
Table 1.32: Cash balances and investment of cash balances (` in crore)
Particulars Opening balance
as on 01 April
2017
Closing balance
as on 31 March
2018
(a) General cash balances
Cash in Treasuries 00 00
Deposits with Reserve Bank (-) 1,280.65 265.21
Remittances in Transit- local 00 00
Total (-) 1,280.65 265.21
Investment held in Cash Balance Investment Account
2,168.23 11,159.38
Total (a) 887.58 11,424.59
(b) Other cash balances and investments
Cash with Departmental Officers viz., Public
Works Departmental Officers, Forest
Departmental Officers, District Collectors
10.69 10.87
Permanent Advances for contingency expenditure
with Departmental Officers
0.44 0.49
Investment of Earmarked Funds 45.20 45.20
Total (b) 56.33 56.56
Grand Total (a) + (b) 943.91 11,481.15
(Source: Finance Accounts 2017-18)
During 2017-18, the opening balance of investment held in cash balance
investment accounts was ` 2,168.23 crore. Treasury Bills amounting to
` 3,52,907.61 crore were purchased and instruments amounting to
` 3,43,916.47 crore were sold during the year, leaving a balance of
` 11,159.38 crore. An amount of ` 471.26 crore and ` 15.35 crore were
received as interest on investment under Treasury Bills and Long Term
Government of India's Securities respectively.
1.9 Assets and Liabilities
1.9.1 Growth and Composition of Assets and Liabilities
While the Government accounting system does not provide for comprehensive
accounting of fixed assets like land and buildings owned by the Government,
State Finances Audit Report for the year ended 31 March 2018
28
these can be derived from the accounting of financial liabilities and assets
created out of expenditure incurred. Appendix 1.7 gives an abstract of such
liabilities and assets, as on 31 March 2018, compared with the corresponding
position on 31 March 2017. While the liabilities consist mainly of internal
borrowings, loans and advances from GoI, and receipts from public accounts
and reserve funds, the assets comprise mainly of capital outlay and loans and
advances given by the State Government and the cash balances.
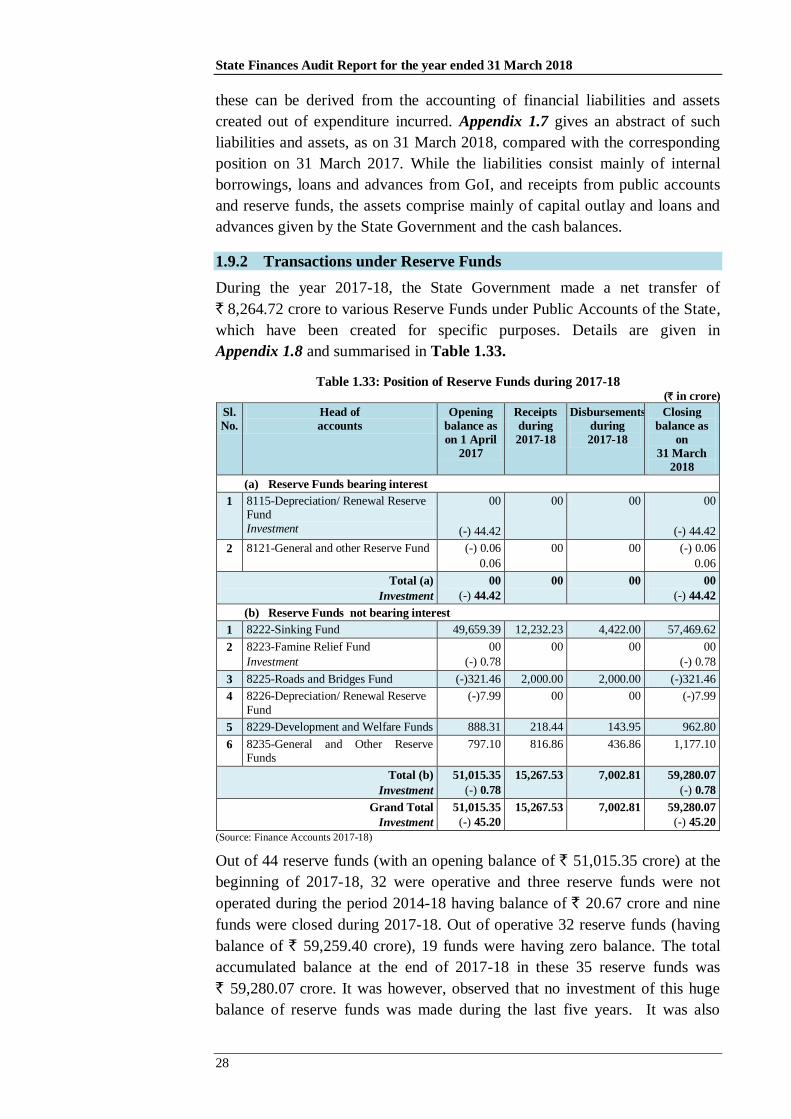
1.9.2 Transactions under Reserve Funds
During the year 2017-18, the State Government made a net transfer of
` 8,264.72 crore to various Reserve Funds under Public Accounts of the State,
which have been created for specific purposes. Details are given in
Appendix 1.8 and summarised in Table 1.33.
Table 1.33: Position of Reserve Funds during 2017-18 (` in crore)
Sl.
No.
Head of
accounts
Opening
balance as
on 1 April
2017
Receipts
during
2017-18
Disbursements
during
2017-18
Closing
balance as
on
31 March
2018
(a) Reserve Funds bearing interest
1 8115-Depreciation/ Renewal Reserve Fund
Investment
00
(-) 44.42
00 00 00
(-) 44.42
2 8121-General and other Reserve Fund (-) 0.06
0.06
00 00 (-) 0.06
0.06
Total (a)
Investment
00
(-) 44.42
00 00 00
(-) 44.42
(b) Reserve Funds not bearing interest
1 8222-Sinking Fund 49,659.39 12,232.23 4,422.00 57,469.62
2 8223-Famine Relief Fund
Investment
00
(-) 0.78
00 00 00
(-) 0.78
3 8225-Roads and Bridges Fund (-)321.46 2,000.00 2,000.00 (-)321.46
4 8226-Depreciation/ Renewal Reserve
Fund
(-)7.99 00 00 (-)7.99
5 8229-Development and Welfare Funds 888.31 218.44 143.95 962.80
6 8235-General and Other Reserve Funds
797.10 816.86 436.86 1,177.10
Total (b)
Investment
51,015.35
(-) 0.78
15,267.53 7,002.81 59,280.07
(-) 0.78
Grand Total
Investment
51,015.35
(-) 45.20
15,267.53 7,002.81 59,280.07
(-) 45.20
(Source: Finance Accounts 2017-18)
Out of 44 reserve funds (with an opening balance of ` 51,015.35 crore) at the
beginning of 2017-18, 32 were operative and three reserve funds were not
operated during the period 2014-18 having balance of ` 20.67 crore and nine
funds were closed during 2017-18. Out of operative 32 reserve funds (having
balance of ` 59,259.40 crore), 19 funds were having zero balance. The total
accumulated balance at the end of 2017-18 in these 35 reserve funds was
` 59,280.07 crore. It was however, observed that no investment of this huge
balance of reserve funds was made during the last five years. It was also
Chapter 1- Finances of the Government
29
observed that in respect of two inoperative reserve funds, an amount of
` 45.20 crore (which was debit book balance) under MH 8115- Depreciation
Reserve Fund (` 44.42 crore) and MH 8223- Famine Relief Fund
(` 0.78 crore) was invested decades ago, but no interest thereon has been
credited in the account.
Transfers into reserve funds and disbursement therefrom are effected through
debit and credit entries under the appropriate revenue and expenditure heads
under the Consolidated Fund. These represent actual cash transfers only if they
impact the Reserve Bank Deposits (RBD) either directly or by way of
investment. The transfer of ` 15,268 crore to reserve fund and disbursements
of ` 7,003 crore therefrom (i.e. net transfer of ` 8,265 crore) during the year
2017-18 were in nature of book adjustments. Since there was no actual cash
outflow, these transactions depicted by the State Government against reserve
funds were merely the book entries which violates the spirit underlying the
creation and operation of reserve funds.
Nevertheless, these balances in the funds lying outstanding over the years
represent huge liability of the State. Negative and debit balances against
specific reserve funds need regularisation by way of appropriation from the
Consolidated Fund. Detailed analysis of some reserve fund transactions are
discussed in subsequent paragraphs.
Recommendation: The Finance Department should review the practice of
treating transactions and balances under reserve funds as book entries and
adhere to the principles of cash accounting by actual investment of balances
with the Reserve Bank of India.
1.9.2.1 Sinking Fund
Creation of Consolidated Sinking Fund
The Twelfth Finance Commission (XII FC) recommended creation of
Consolidated Sinking Fund (CSF) for amortisation of outstanding liabilities18
by the State Governments. The guidelines of the Reserve Bank of India (RBI),
which is responsible for administering the fund, stipulate a minimum annual
contribution of 0.5 per cent of outstanding liabilities at the end of the previous
financial year. Accordingly, the State Government was required to contribute
` 2,116.12 crore (0.5 per cent of ` 4,23,223.78 crore, i.e. the outstanding
liabilities as on 31 March 2017) in 2017-18.
The State Government, however, has not taken any action to setup the CSF
(subsuming the existing Fund) in terms of these guidelines19
.
18
Defined as comprising Internal Debt and Public Account liabilities of the State Government. 19
Unlike States like Andhra Pradesh, Gujarat, Karnataka, West Bengal, Telangana, Odisha and Jammu & Kashmir
which have set up Consolidated Sinking Funds in terms of the guidelines.
State Finances Audit Report for the year ended 31 March 2018
30
Operation of existing Sinking Fund
During 2017-18, the State Government made a provision of ` 12,232.23 crore
for reduction or avoidance of debt (under Major Head 2048) and appropriated
to Sinking Fund (Major Head 8222) under Public Accounts by book transfer.
Out of this fund, an amount of ` 4,422 crore, equivalent to repayment of
market loans, was transferred and credited to Revenue Receipts (under Major
Head 0075-Miscellaneous General Services) under the Consolidated Fund
without involving any cash outflow from Sinking Fund. The amount
transferred from the Sinking Fund (` 4,422 crore) to the Revenue Account
overstated the Revenue Surplus of the Year.
Unlike in the case of the CSF maintained by the other State Governments
which have accepted the XII FC recommendations, the transactions of the
Government of Uttar Pradesh against the Sinking Fund are only book entries
and do not represent actual movement of cash. This militates against the spirit
underlying the creation and operation of Sinking Funds. Further, there was no
investment against the closing balance of ` 57,469.61 crore in the Sinking
Fund as on 31.03.2018. Apart from this, the net addition of ` 7,810 crore to
the Sinking Fund during the year 2017-18 resulted in increasing the
outstanding liabilities of the State to that extent.
Recommendation: The State Government may consider accepting the
recommendation of the XII FC and create a Consolidated Sinking Fund to be
invested by RBI. Further, the transfers out of the fund are not to be treated as
Revenue Receipts. In any event, the State Government should ensure that the
Fund balances are actually invested and are not mere book entries.
1.9.2.2 State Roads and Bridges Fund
State Government had created Roads and Bridges Fund for meeting
expenditure on the development of roads and communications (Bridges) in the
State. During 2017-18, the State Government made provision of ` 1,500 crore
and ` 500 crore under MH 3054 and MH 5054 relating to revenue and capital
expenditure respectively on Roads and Bridges and transferred these amounts
to the Reserve Fund MH 8225- Roads and Bridges Fund. The same amounts
(i.e., ` 1,500 crore and ` 500 crore respectively) were shown as expended
during the year on Roads and Bridges and booked as deduct entries under MH
3054 and MH 5054 respectively. In this connection, Audit observed as under:
● The State Government has been making such identical transfers and
reverse transfers between MH 3054/5054 and MH 8225- Roads and
Bridges Fund for many years.
● Further, the Fund had a negative balance of (-) ` 321.46 crore as on 31
March 2018, indicating excess of disbursement over available balances.
This negative figure has been appearing from the accounts of 2014-15
onwards. The negative balance is to be regularised by appropriation from
the Consolidated Fund.

Chapter 1- Finances of the Government
31
Recommendation: The Finance Department should immediately regularise
the negative balance of (-) ` 321.46 crore.
1.9.2.3 State Disaster Response Fund (SDRF)
Non-accounting of SDRF as interest bearing Reserve Fund
Government of India (GoI) replaced the erstwhile Calamity Relief Fund with
the State Disaster Response Fund (SDRF) with effect from 1 April 2010. The
guidelines of SDRF stipulate the following:
● The Fund should be operated under the category “Reserve Fund bearing
Interest” below Major Head-8121-General and Other Reserve Funds-122-
State Disaster Response Funds.
● The State Government shall pay interest to the SDRF at the interest
applicable to overdrafts under Overdraft Regulation Guidelines of the RBI.
It was observed, however, that the State Government operates its SDRF under
the category “Reserve Funds not bearing Interest” below Major Head 8235-
General and Other Reserve Funds-111- State Disaster Response Funds. The
balances in the Fund are also not invested in the manner specified by the GoI
under the SDRF guidelines. Consequently, the balances in the Fund are only
book entries and do not represent actual cash balances. Further, as per Finance
Accounts 2017-18, the interest of ` 37.22 crore due for the year 2017-18 had
not been paid by the State Government.
The State Government stated (June, 2018) that since only a negligible amount
remains in the Fund at the end of the year, the Fund has not been categorised
as “Interest bearing Reserve Fund” and no provision has been made for
interest payment. The reply is not relevant. By categorising the Fund under
“Reserve Funds not bearing Interest” and by not investing the balances in the
Fund or paying interest thereon, the fund balances are essentially only book
entries, militating against the letter and spirit of the guidelines of the Fund and
also of Government accounting itself, which follows the principle of cash
accounting.
In terms of the National Disaster Response Fund (NDRF) guidelines
(July 2015), the Government of India provides additional assistance to the
States from NDRF which does not require State‟s share, when natural
calamities require expenditure in excess of the balances available under
SDRF. As per Para 11.3 and 11.4 of the guidelines, the State Governments
would make suitable budget provisions on expenditure side of their budget
under the head 2245-80-103, and the actual expenditure out of NDRF should
be booked thereunder. Direct expenditure by the State Government from the
Public Account should not be made.
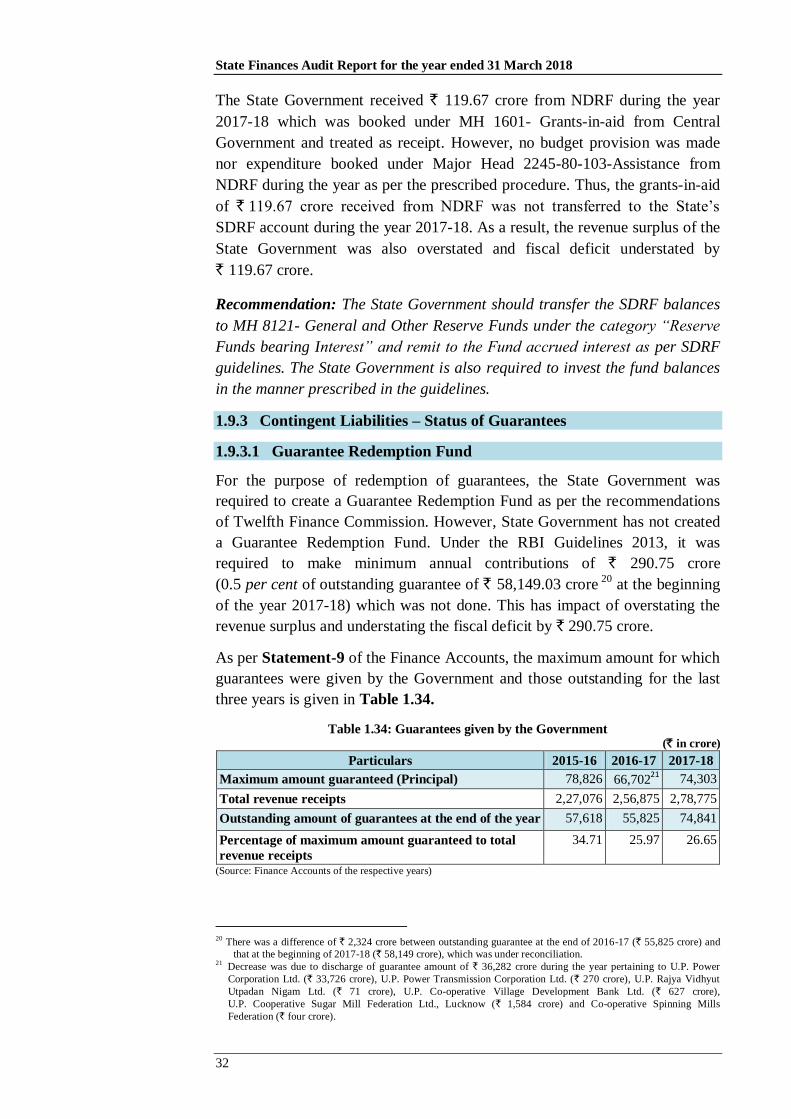
State Finances Audit Report for the year ended 31 March 2018
32
The State Government received ` 119.67 crore from NDRF during the year
2017-18 which was booked under MH 1601- Grants-in-aid from Central
Government and treated as receipt. However, no budget provision was made
nor expenditure booked under Major Head 2245-80-103-Assistance from
NDRF during the year as per the prescribed procedure. Thus, the grants-in-aid
of ` 119.67 crore received from NDRF was not transferred to the State‟s
SDRF account during the year 2017-18. As a result, the revenue surplus of the
State Government was also overstated and fiscal deficit understated by
` 119.67 crore.
Recommendation: The State Government should transfer the SDRF balances
to MH 8121- General and Other Reserve Funds under the category “Reserve
Funds bearing Interest” and remit to the Fund accrued interest as per SDRF
guidelines. The State Government is also required to invest the fund balances
in the manner prescribed in the guidelines.
1.9.3 Contingent Liabilities – Status of Guarantees
1.9.3.1 Guarantee Redemption Fund
For the purpose of redemption of guarantees, the State Government was
required to create a Guarantee Redemption Fund as per the recommendations
of Twelfth Finance Commission. However, State Government has not created
a Guarantee Redemption Fund. Under the RBI Guidelines 2013, it was
required to make minimum annual contributions of ` 290.75 crore
(0.5 per cent of outstanding guarantee of ` 58,149.03 crore 20
at the beginning
of the year 2017-18) which was not done. This has impact of overstating the
revenue surplus and understating the fiscal deficit by ` 290.75 crore.
As per Statement-9 of the Finance Accounts, the maximum amount for which
guarantees were given by the Government and those outstanding for the last
three years is given in Table 1.34.
Table 1.34: Guarantees given by the Government (` in crore)
Particulars 2015-16 2016-17 2017-18
Maximum amount guaranteed (Principal) 78,826 66,70221
74,303
Total revenue receipts 2,27,076 2,56,875 2,78,775
Outstanding amount of guarantees at the end of the year 57,618 55,825 74,841
Percentage of maximum amount guaranteed to total
revenue receipts
34.71 25.97 26.65
(Source: Finance Accounts of the respective years)
20
There was a difference of ` 2,324 crore between outstanding guarantee at the end of 2016-17 (` 55,825 crore) and
that at the beginning of 2017-18 (` 58,149 crore), which was under reconciliation. 21
Decrease was due to discharge of guarantee amount of ` 36,282 crore during the year pertaining to U.P. Power
Corporation Ltd. (` 33,726 crore), U.P. Power Transmission Corporation Ltd. (` 270 crore), U.P. Rajya Vidhyut
Utpadan Nigam Ltd. (` 71 crore), U.P. Co-operative Village Development Bank Ltd. (` 627 crore),
U.P. Cooperative Sugar Mill Federation Ltd., Lucknow (` 1,584 crore) and Co-operative Spinning Mills
Federation (` four crore).
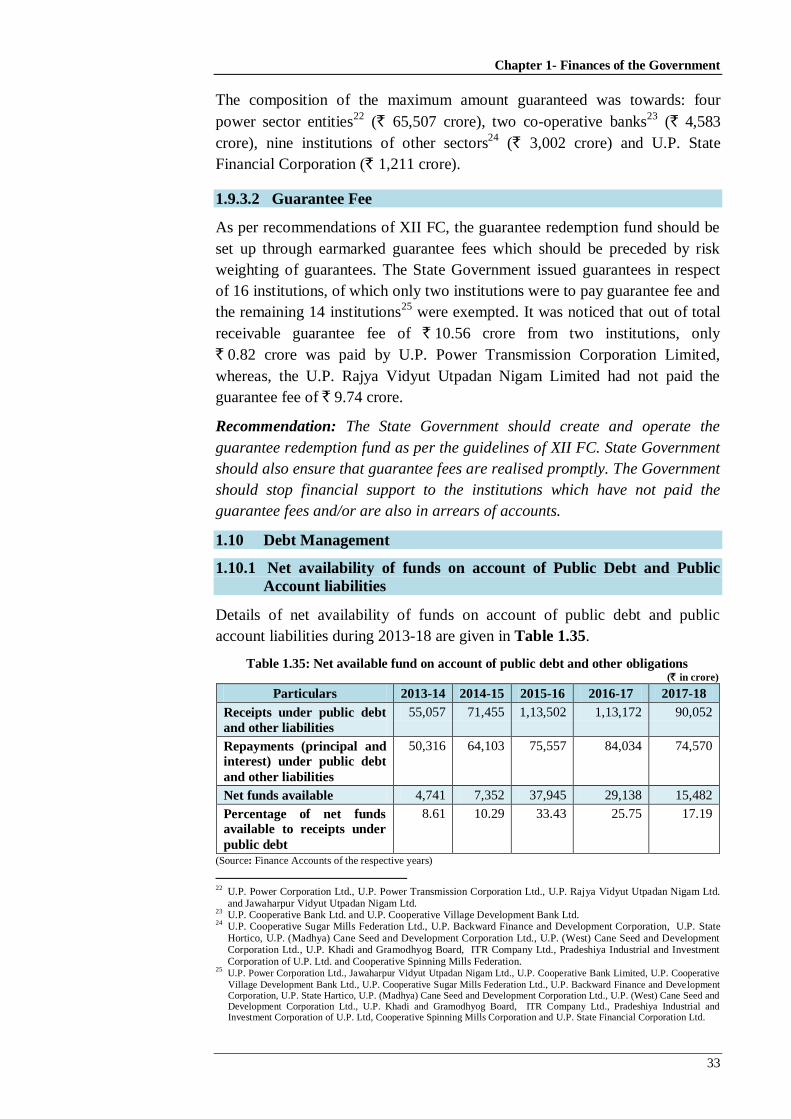
Chapter 1- Finances of the Government
33
The composition of the maximum amount guaranteed was towards: four
power sector entities22
(` 65,507 crore), two co-operative banks23
(` 4,583
crore), nine institutions of other sectors24
(` 3,002 crore) and U.P. State
Financial Corporation (` 1,211 crore).
1.9.3.2 Guarantee Fee
As per recommendations of XII FC, the guarantee redemption fund should be
set up through earmarked guarantee fees which should be preceded by risk
weighting of guarantees. The State Government issued guarantees in respect
of 16 institutions, of which only two institutions were to pay guarantee fee and
the remaining 14 institutions25
were exempted. It was noticed that out of total
receivable guarantee fee of ` 10.56 crore from two institutions, only
` 0.82 crore was paid by U.P. Power Transmission Corporation Limited,
whereas, the U.P. Rajya Vidyut Utpadan Nigam Limited had not paid the
guarantee fee of ` 9.74 crore.
Recommendation: The State Government should create and operate the
guarantee redemption fund as per the guidelines of XII FC. State Government
should also ensure that guarantee fees are realised promptly. The Government
should stop financial support to the institutions which have not paid the
guarantee fees and/or are also in arrears of accounts.
1.10 Debt Management
1.10.1 Net availability of funds on account of Public Debt and Public
Account liabilities
Details of net availability of funds on account of public debt and public
account liabilities during 2013-18 are given in Table 1.35.
Table 1.35: Net available fund on account of public debt and other obligations (` in crore)
Particulars 2013-14 2014-15 2015-16 2016-17 2017-18
Receipts under public debt
and other liabilities
55,057 71,455 1,13,502 1,13,172 90,052
Repayments (principal and
interest) under public debt
and other liabilities
50,316 64,103 75,557 84,034 74,570
Net funds available 4,741 7,352 37,945 29,138 15,482
Percentage of net funds
available to receipts under
public debt
8.61 10.29 33.43 25.75 17.19
(Source: Finance Accounts of the respective years)
22
U.P. Power Corporation Ltd., U.P. Power Transmission Corporation Ltd., U.P. Rajya Vidyut Utpadan Nigam Ltd. and Jawaharpur Vidyut Utpadan Nigam Ltd.
23 U.P. Cooperative Bank Ltd. and U.P. Cooperative Village Development Bank Ltd.
24 U.P. Cooperative Sugar Mills Federation Ltd., U.P. Backward Finance and Development Corporation, U.P. State Hortico, U.P. (Madhya) Cane Seed and Development Corporation Ltd., U.P. (West) Cane Seed and Development Corporation Ltd., U.P. Khadi and Gramodhyog Board, ITR Company Ltd., Pradeshiya Industrial and Investment Corporation of U.P. Ltd. and Cooperative Spinning Mills Federation.
25 U.P. Power Corporation Ltd., Jawaharpur Vidyut Utpadan Nigam Ltd., U.P. Cooperative Bank Limited, U.P. Cooperative
Village Development Bank Ltd., U.P. Cooperative Sugar Mills Federation Ltd., U.P. Backward Finance and Development Corporation, U.P. State Hartico, U.P. (Madhya) Cane Seed and Development Corporation Ltd., U.P. (West) Cane Seed and Development Corporation Ltd., U.P. Khadi and Gramodhyog Board, ITR Company Ltd., Pradeshiya Industrial and Investment Corporation of U.P. Ltd, Cooperative Spinning Mills Corporation and U.P. State Financial Corporation Ltd.
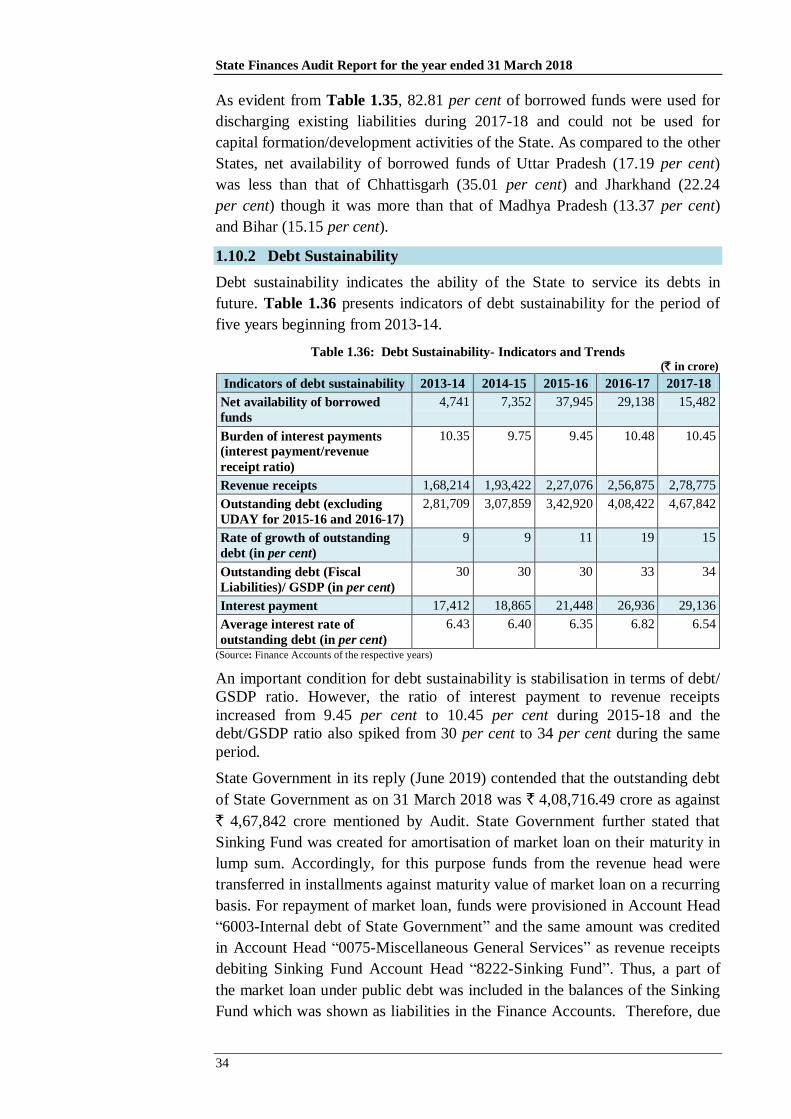
State Finances Audit Report for the year ended 31 March 2018
34
As evident from Table 1.35, 82.81 per cent of borrowed funds were used for
discharging existing liabilities during 2017-18 and could not be used for
capital formation/development activities of the State. As compared to the other
States, net availability of borrowed funds of Uttar Pradesh (17.19 per cent)
was less than that of Chhattisgarh (35.01 per cent) and Jharkhand (22.24
per cent) though it was more than that of Madhya Pradesh (13.37 per cent)
and Bihar (15.15 per cent).
1.10.2 Debt Sustainability
Debt sustainability indicates the ability of the State to service its debts in
future. Table 1.36 presents indicators of debt sustainability for the period of
five years beginning from 2013-14.
Table 1.36: Debt Sustainability- Indicators and Trends (` in crore)
Indicators of debt sustainability 2013-14 2014-15 2015-16 2016-17 2017-18
Net availability of borrowed
funds
4,741 7,352 37,945 29,138 15,482
Burden of interest payments
(interest payment/revenue
receipt ratio)
10.35 9.75 9.45 10.48 10.45
Revenue receipts 1,68,214 1,93,422 2,27,076 2,56,875 2,78,775
Outstanding debt (excluding
UDAY for 2015-16 and 2016-17)
2,81,709 3,07,859 3,42,920 4,08,422 4,67,842
Rate of growth of outstanding
debt (in per cent)
9 9 11 19 15
Outstanding debt (Fiscal
Liabilities)/ GSDP (in per cent)
30 30 30 33 34
Interest payment 17,412 18,865 21,448 26,936 29,136
Average interest rate of
outstanding debt (in per cent)
6.43 6.40 6.35 6.82 6.54
(Source: Finance Accounts of the respective years)
An important condition for debt sustainability is stabilisation in terms of debt/
GSDP ratio. However, the ratio of interest payment to revenue receipts
increased from 9.45 per cent to 10.45 per cent during 2015-18 and the
debt/GSDP ratio also spiked from 30 per cent to 34 per cent during the same
period.
State Government in its reply (June 2019) contended that the outstanding debt
of State Government as on 31 March 2018 was ` 4,08,716.49 crore as against
` 4,67,842 crore mentioned by Audit. State Government further stated that
Sinking Fund was created for amortisation of market loan on their maturity in
lump sum. Accordingly, for this purpose funds from the revenue head were
transferred in installments against maturity value of market loan on a recurring
basis. For repayment of market loan, funds were provisioned in Account Head
“6003-Internal debt of State Government” and the same amount was credited
in Account Head “0075-Miscellaneous General Services” as revenue receipts
debiting Sinking Fund Account Head “8222-Sinking Fund”. Thus, a part of
the market loan under public debt was included in the balances of the Sinking
Fund which was shown as liabilities in the Finance Accounts. Therefore, due

Chapter 1- Finances of the Government
35
to this reason, the outstanding liabilities of the State Government depicted in
the Finance Accounts increased by the same amount of the balances of
Sinking Fund.
The contention of the State Government is not acceptable, as the sinking fund
to the extent to which it has not been invested constitute the liability of the
State Government. Further, outstanding balance of ` 57,469.61 crore as
on 31 March 2018 under Sinking Fund was not invested by the State
Government. Pertinently, while communicating (August 2017) annual
borrowing ceiling of the State Government for the year 2017-18, Ministry of
Finance, GoI also mentioned that borrowings include open market borrowings,
Central Government loans, other liabilities arising out of public account
transfers under small savings, Provident Funds, Reserve Funds, Deposits, etc.,
as reflected in Statement-6 of the State‟s Finance Accounts.
1.11 Follow up
Separate Report on State Finances is being prepared from the year 2008-09
onwards and presented to the State Legislature. The Public Accounts
Committee is yet to discuss these reports.
