finance-growth-and-inequality-bloomberg-london-17-june-2015
TRANSCRIPT

FINANCE, GROWTH AND INEQUALITYCatherine L. MannOECD Chief Economist and G20 Deputy
Bloomberg, London, 17 June 2015
www.oecd.org/eco/finance-growth-inequality.htm

1. Secular trends
2. Finance and growth
3. Finance and inequality
4. Policies for a healthy financial future
Structure of the presentation
2

SECULAR TRENDS
4
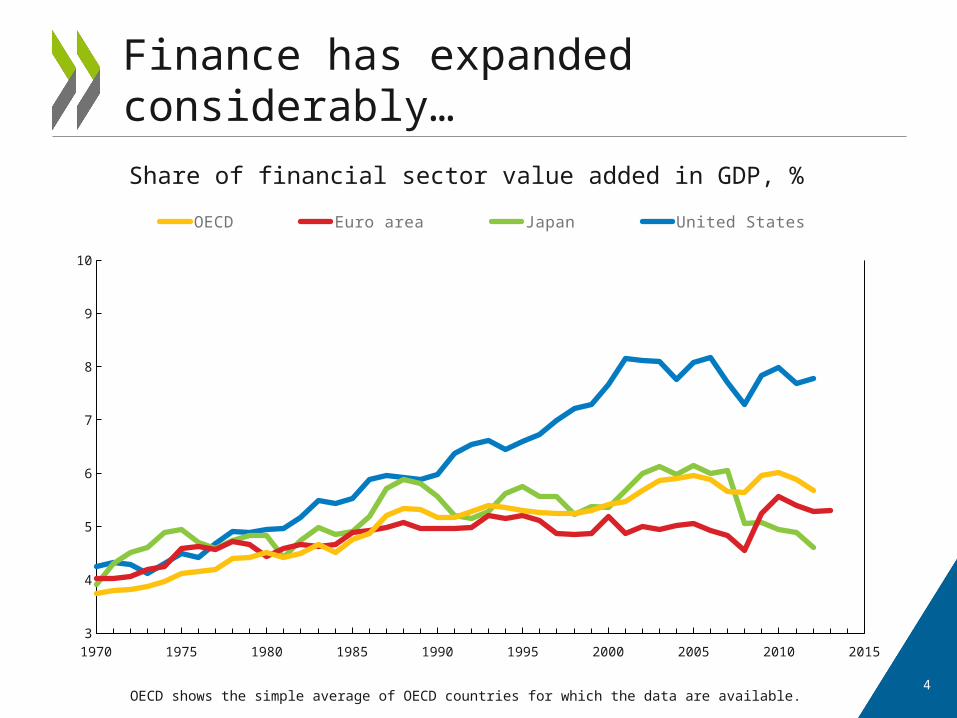
Finance has expanded considerably…
1970 1975 1980 1985 1990 1995 2000 2005 2010 20153
4
5
6
7
8
9
10
OECD Euro area Japan United States
Share of financial sector value added in GDP, %
OECD shows the simple average of OECD countries for which the data are available.
5
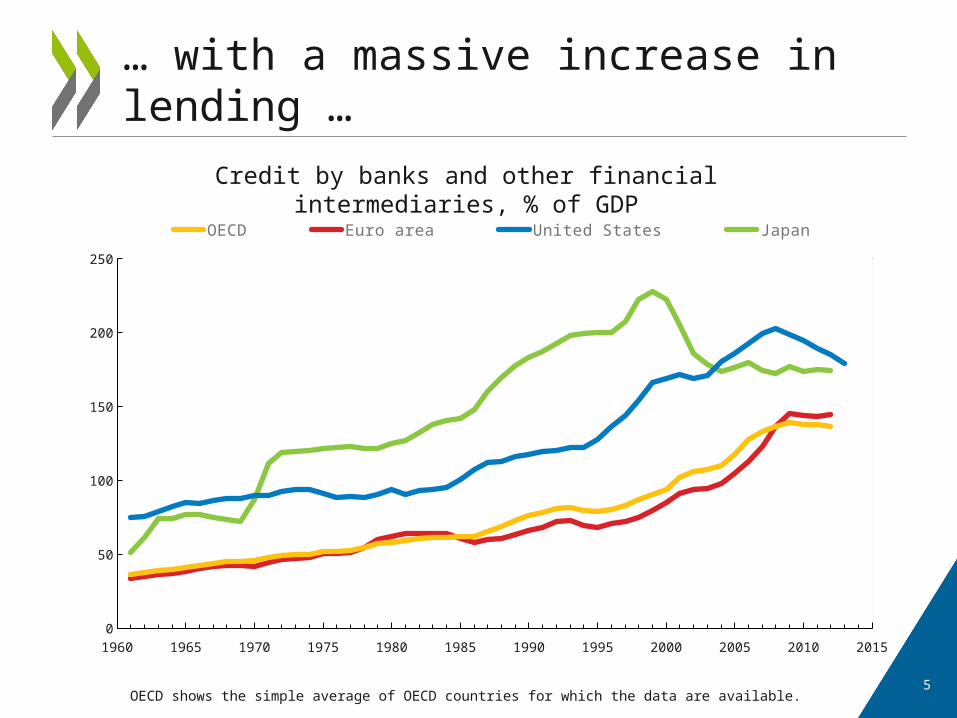
… with a massive increase in lending …
1960 1965 1970 1975 1980 1985 1990 1995 2000 2005 2010 20150
50
100
150
200
250
OECD Euro area United States Japan
Credit by banks and other financial intermediaries, % of GDP
OECD shows the simple average of OECD countries for which the data are available.
6
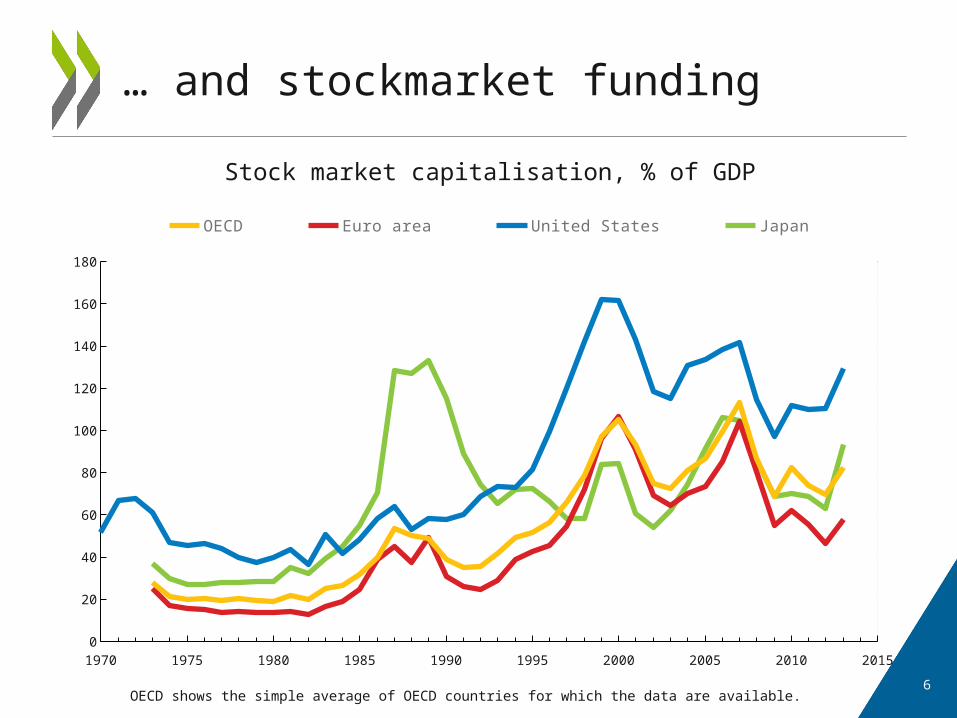
… and stockmarket funding
1970 1975 1980 1985 1990 1995 2000 2005 2010 20150
20
40
60
80
100
120
140
160
180
OECD Euro area United States Japan
Stock market capitalisation, % of GDP
OECD shows the simple average of OECD countries for which the data are available.

FINANCE AND GROWTH

• Reducing the need for self-financing, hence
– allocating capital more efficiently
– monitoring investments more professionally
• Facilitating international trade
• Smoothing cash-flow shocks
• Facilitating monetary policy transmission
Finance boosts growth by:
8
• Misallocating capital
• Magnifying the cost of implicit guarantees
• Distorting allocation of talented labor
• Generating boom-bust cycles
• Heightening the risk of regulatory capture
Too much finance can harm growth by:
9
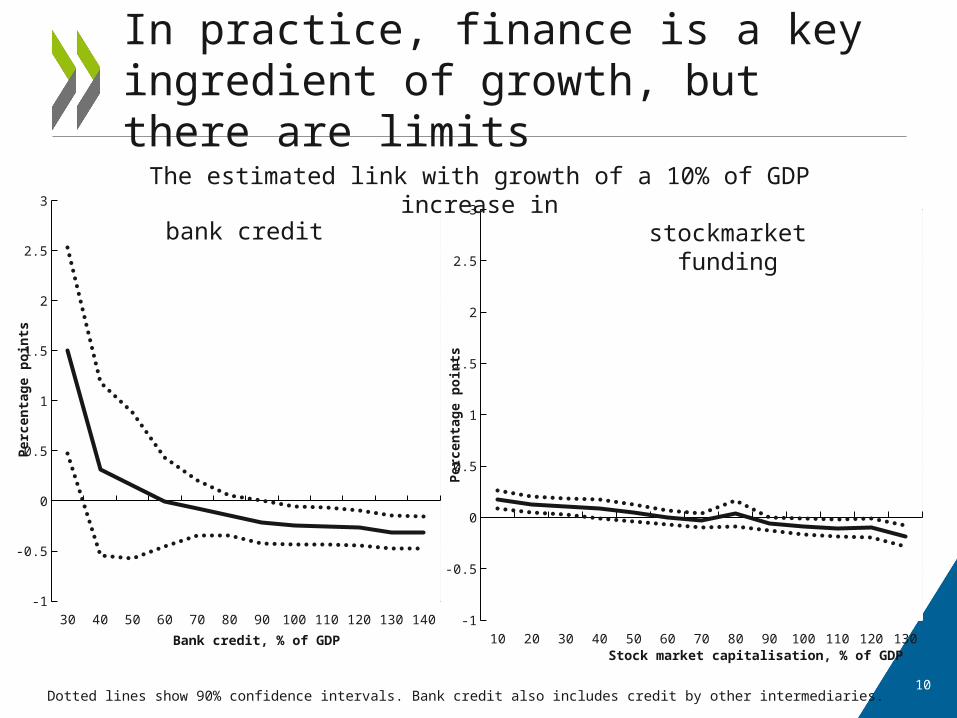
In practice, finance is a key ingredient of growth, but there are limits
30 40 50 60 70 80 90 100 110 120 130 140-1
-0.5
0
0.5
1
1.5
2
2.5
3
Bank credit, % of GDP
Per
cen
tag
e p
oin
ts
10 20 30 40 50 60 70 80 90 100 110 120 130-1
-0.5
0
0.5
1
1.5
2
2.5
3
Stock market capitalisation, % of GDP
Per
cen
tag
e p
oin
ts
The estimated link with growth of a 10% of GDP increase in
bank credit stockmarket funding
Dotted lines show 90% confidence intervals. Bank credit also includes credit by other intermediaries.10
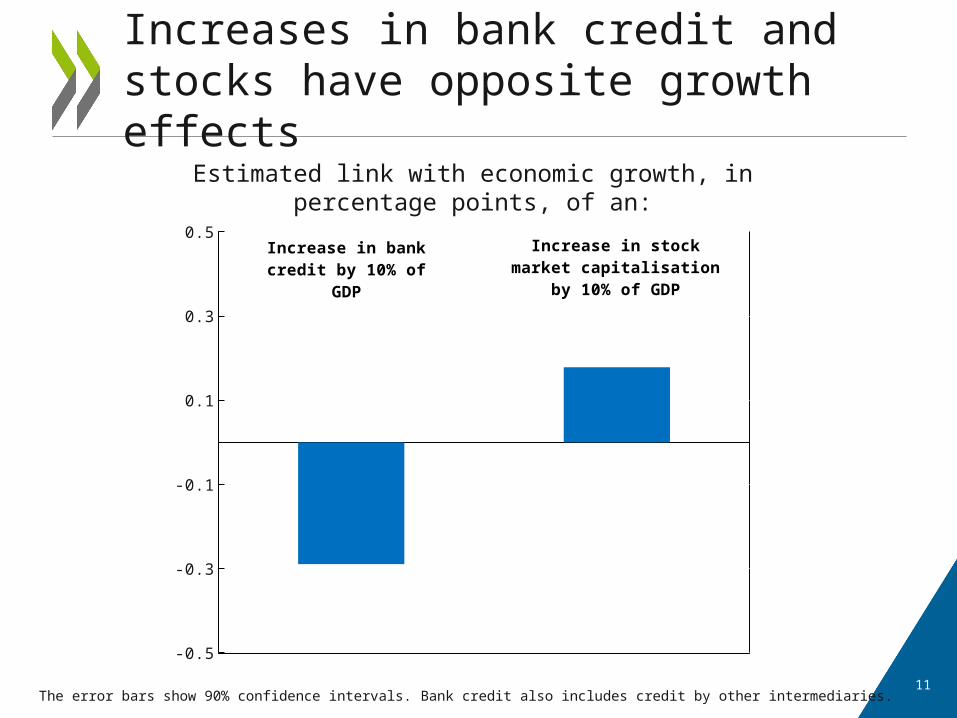
Increases in bank credit and stocks have opposite growth effects
-0.5
-0.3
-0.1
0.1
0.3
0.5
Increase in bank credit by 10% of GDP
Increase in stock market capi-talisation by 10% of GDP
Estimated link with economic growth, in percentage points, of an:
The error bars show 90% confidence intervals. Bank credit also includes credit by other intermediaries.11
12
1. Excessive financial deregulation
2. Too-big-to-fail guarantees
3. Bank lending outpacing bond financing
4. Household credit outpacing business credit
Channels behind the negative link between credit and growth
13
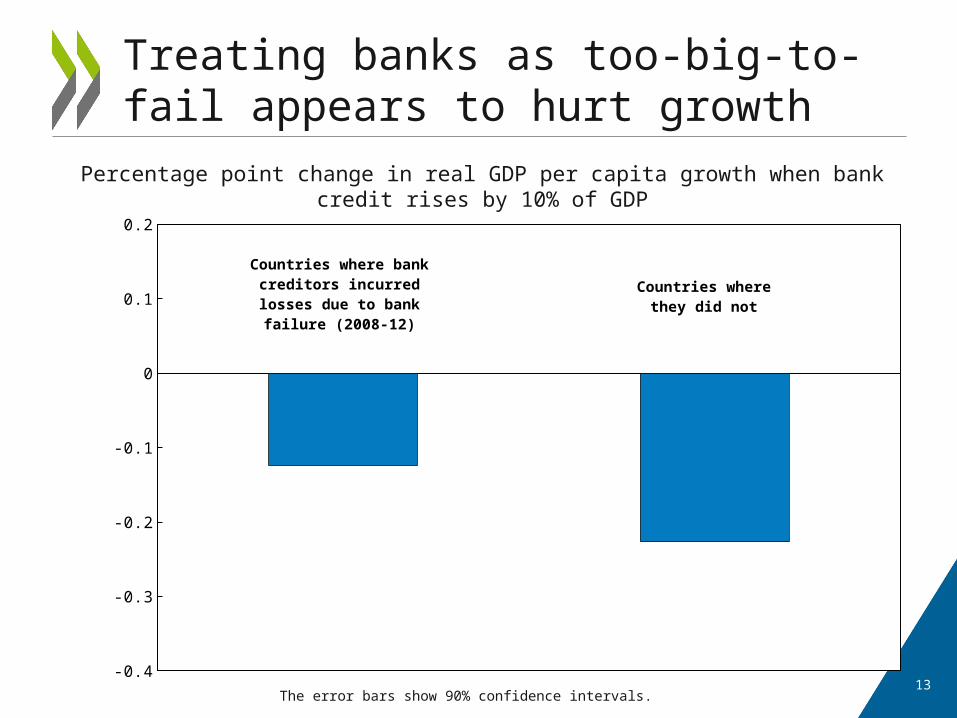
Treating banks as too-big-to-fail appears to hurt growth
Percentage point change in real GDP per capita growth when bank credit rises by 10% of GDP
The error bars show 90% confidence intervals.
-0.4
-0.3
-0.2
-0.1
0
0.1
0.2
Countries where bank credi-tors incurred losses due to
bank failure (2008-12)
Countries where they did not

14
Increases in bank lending have a more negative link with growth than other debt
-0.8
-0.6
-0.4
-0.2
0
0.2
0.4
Increase in bank lend-ing by 10% of GDP
Increase in other debt by 10% of GDP
Estimated link with economic growth, in percentage points, of an:
The error bars show 90% confidence intervals.

15
Business credit has a more favourable link with growth than household credit
-1
-0.8
-0.6
-0.4
-0.2
0
0.2
0.4
Increase in credit to households by 10% of
GDP
Increase in credit to busi-nesses by 10% of GDP
Estimated link with economic growth, in percentage points, of an:
The error bars show 90% confidence intervals.

FINANCE AND INEQUALITY
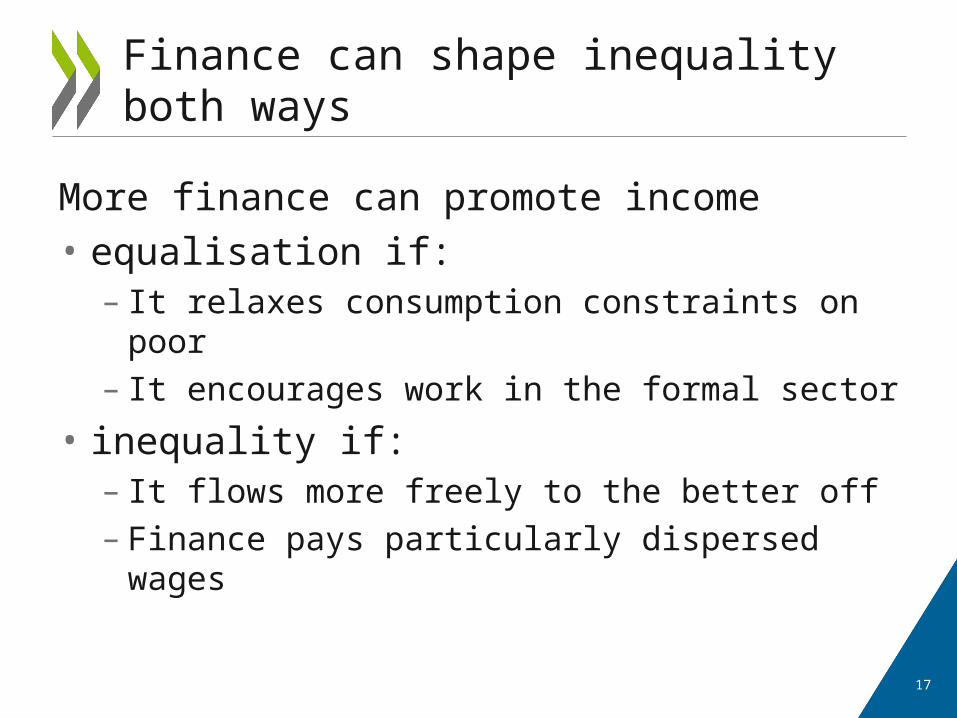
More finance can promote income• equalisation if:
– It relaxes consumption constraints on poor– It encourages work in the formal sector
• inequality if:– It flows more freely to the better off– Finance pays particularly dispersed wages
Finance can shape inequality both ways
17
18
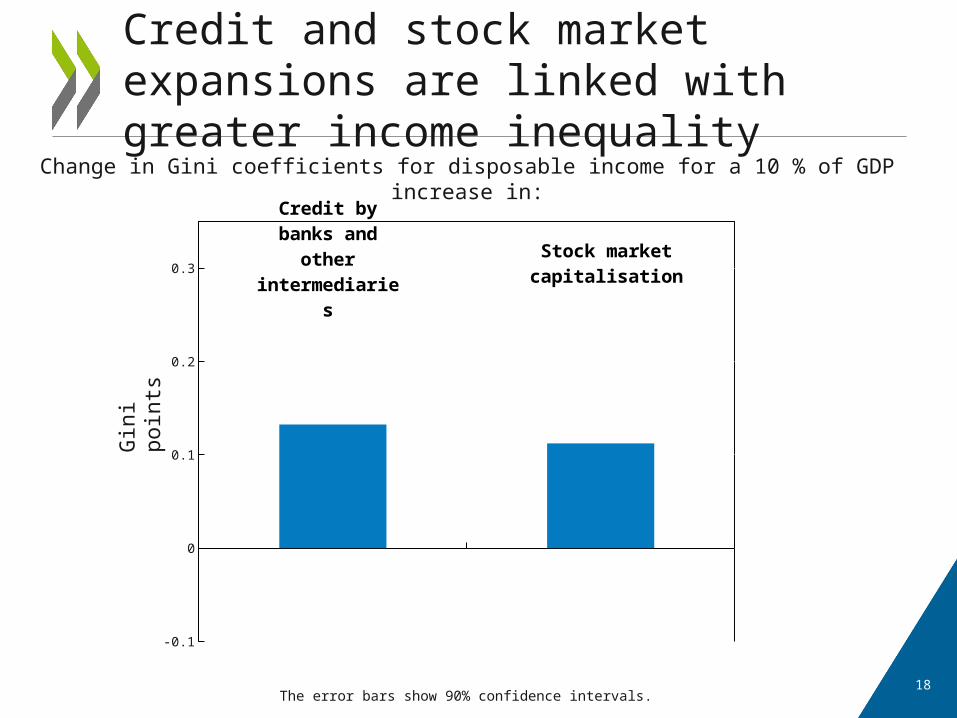
Credit and stock market expansions are linked with greater income inequality
Change in Gini coefficients for disposable income for a 10 % of GDP increase in:
The error bars show 90% confidence intervals.
-0.1
0
0.1
0.2
0.3
Credit by banks and other in-termediaries
Stock market capitalisa-tion
Gin
i poi
nts
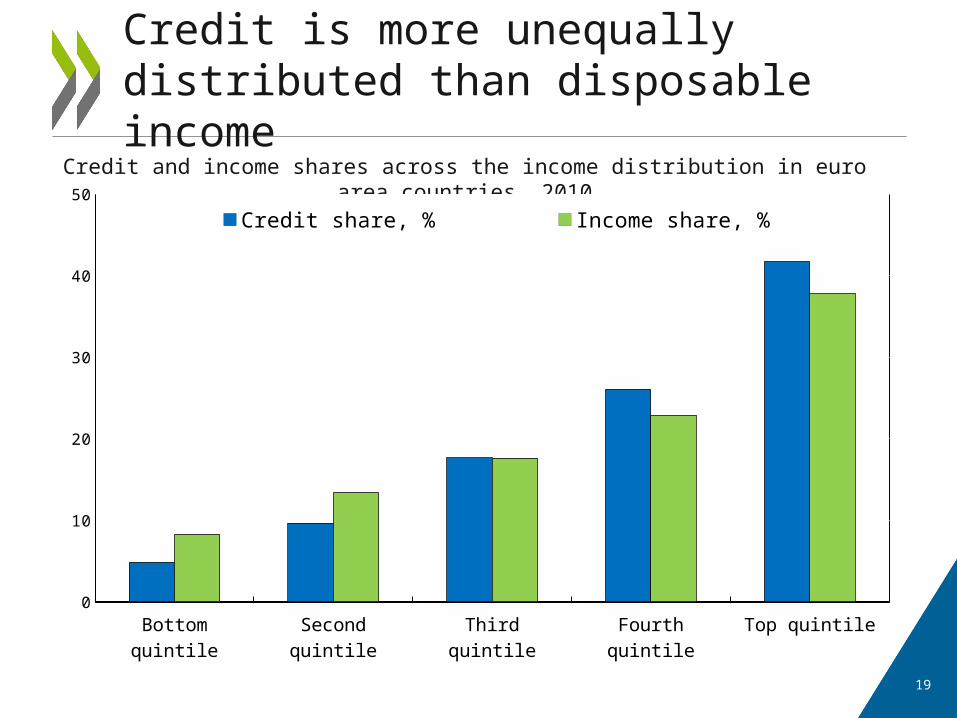
Credit is more unequally distributed than disposable income
Credit and income shares across the income distribution in euro area countries, 2010
Bottom quintile Second quintile Third quintile Fourth quintile Top quintile0
10
20
30
40
50Credit share, % Income share, %
19

20
Lower-income households find access to credit more difficult
Bottom quintile Second quintile Third quintile Fourth quintile Top quintile0
10
20
30
40
50
60
70
Percentage of households expressing difficulty in obtaining credit in euro area countries, 2010

The share of financial-sector employees rises with the income bracket
Percentage of financial-sector employees in each percentile of the income distributionEuropean countries, 2010
Percentile0 10 20 30 40 50 60 70 80 90 1000
2
4
6
8
10
12
14
16
18
20
21
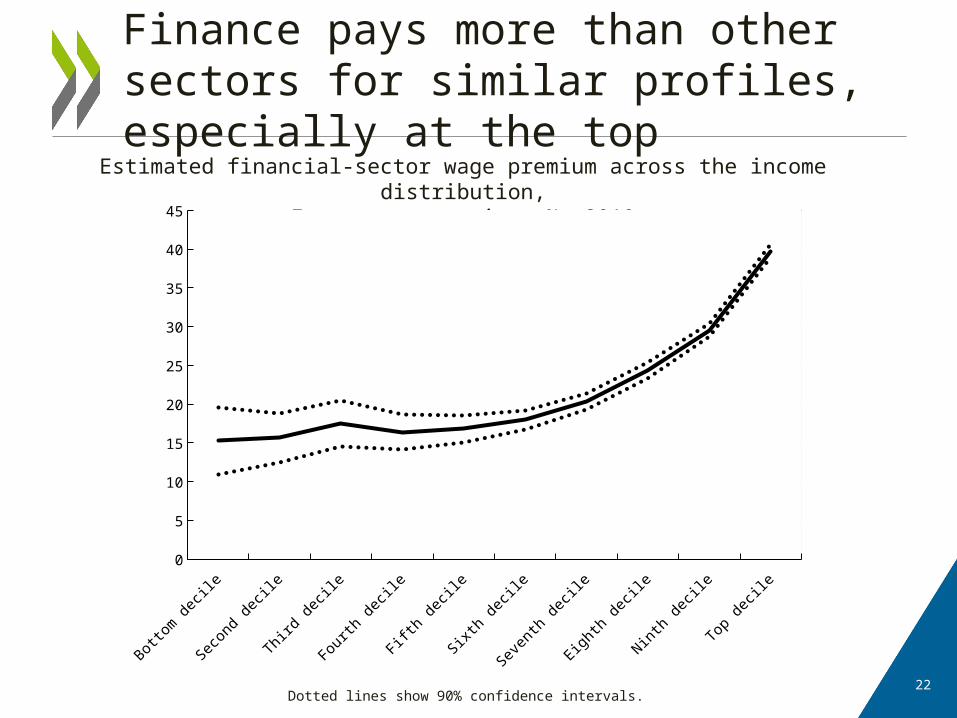
Finance pays more than other sectors for similar profiles, especially at the topEstimated financial-sector wage premium across the income distribution,
European countries, %, 2010
Bottom decile
Second decile
Third decile
Fourth decile
Fifth decile
Sixth decile
Seventh decile
Eighth decile
Ninth decile
Top decile
0
5
10
15
20
25
30
35
40
45
Dotted lines show 90% confidence intervals.22

POLICIES FOR A HEALTHY FINANCIAL FUTURE

• Withdraw implicit too-big-to-fail subsidies– break-ups, capital surcharges, structural
separation, resolution plans
• Implement macro-level financial supervision– debt-service-to-income caps
• Improve compensation practices – clawbacks
• Reduce tax biases against equity – corporate income tax, lending to businesses
(VAT)
A healthy future for finance
24

Financial reform is compatible with inclusive growth
Growth Equality
Win-win
Enforce strong macro-prudential controls + +Split TBTF banks or reduce TBTF support through other means + +Recuperate TBTF subsidies through taxation + +
Income-enhancing Reduce the debt bias in corporate taxation + Reduce the bias against business loans in VAT +
Trade-off Lower barriers to stock market financing + -
25
26
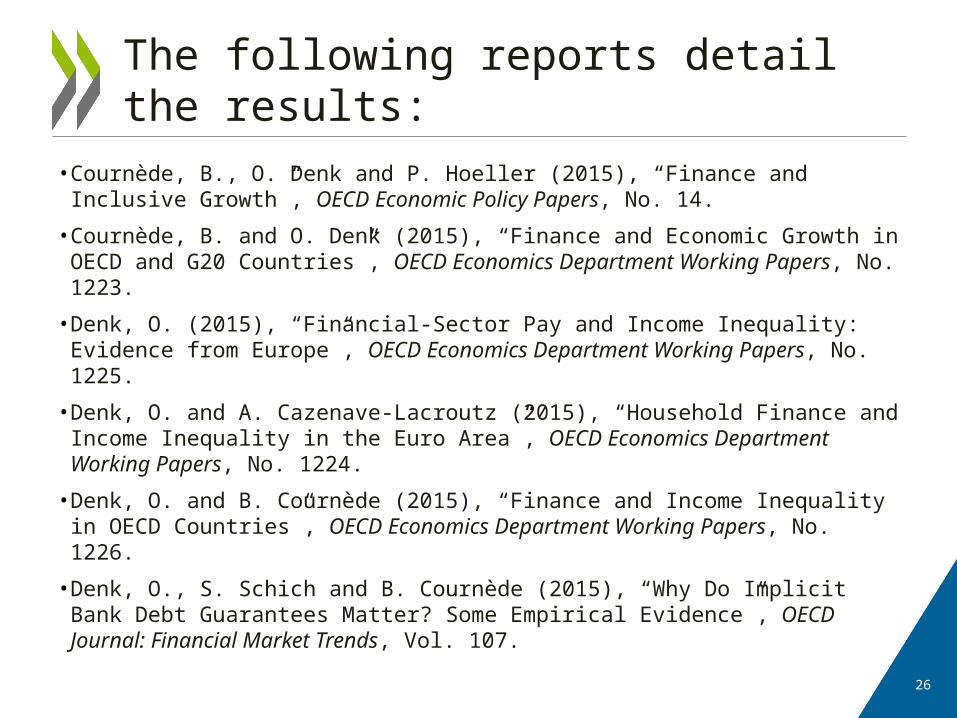
• Cournède, B., O. Denk and P. Hoeller (2015), “Finance and Inclusive Growth”, OECD Economic Policy Papers, No. 14.
• Cournède, B. and O. Denk (2015), “Finance and Economic Growth in OECD and G20 Countries”, OECD Economics Department Working Papers, No. 1223.
• Denk, O. (2015), “Financial-Sector Pay and Income Inequality: Evidence from Europe”, OECD Economics Department Working Papers, No. 1225.
• Denk, O. and A. Cazenave-Lacroutz (2015), “Household Finance and Income Inequality in the Euro Area”, OECD Economics Department Working Papers, No. 1224.
• Denk, O. and B. Cournède (2015), “Finance and Income Inequality in OECD Countries”, OECD Economics Department Working Papers, No. 1226.
• Denk, O., S. Schich and B. Cournède (2015), “Why Do Implicit Bank Debt Guarantees Matter? Some Empirical Evidence”, OECD Journal: Financial Market Trends, Vol. 107.
The following reports detail the results: