finance for climate action - luxflag · pdf filefinance for climate action christopher...
TRANSCRIPT

Finance for Climate Action
Christopher Knowles, EIB
LuxFLAG Breakfast Seminar
Luxembourg, 25 November 2015

Climate Science – What Is The Problem?
2European Investment Bank Group
Source: IPCC
Climate Science – Where Do We Stand?
3European Investment Bank Group
Source: Met Office Hadley Centre for Climate Science and Services, 9 November 2015
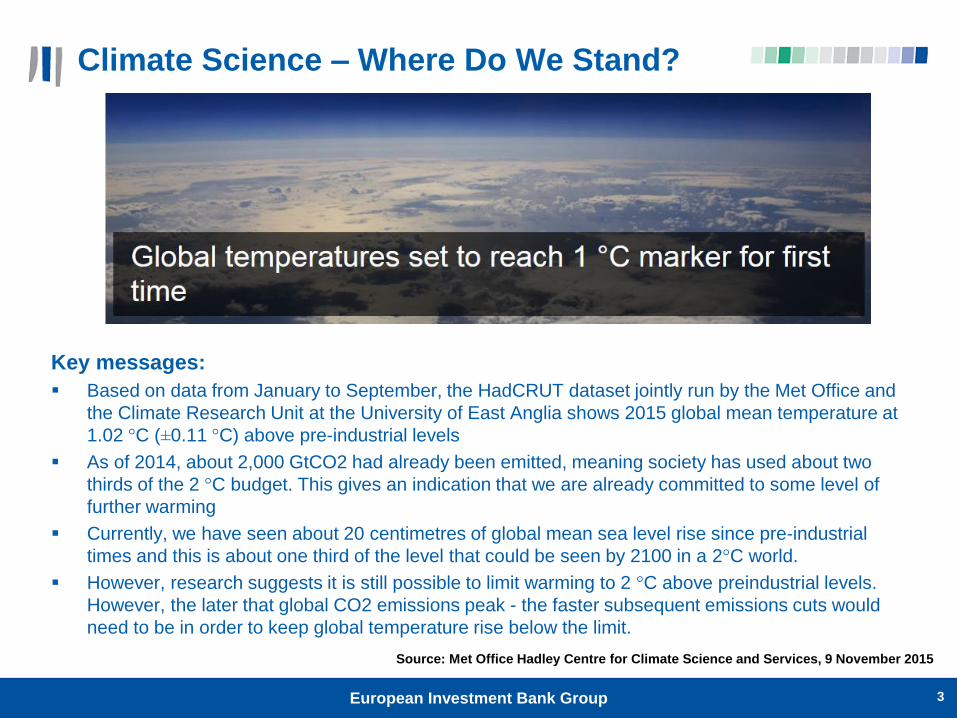
Key messages:
Based on data from January to September, the HadCRUT dataset jointly run by the Met Office and
the Climate Research Unit at the University of East Anglia shows 2015 global mean temperature at
1.02 °C (±0.11 °C) above pre-industrial levels
As of 2014, about 2,000 GtCO2 had already been emitted, meaning society has used about two
thirds of the 2 °C budget. This gives an indication that we are already committed to some level of
further warming
Currently, we have seen about 20 centimetres of global mean sea level rise since pre-industrial
times and this is about one third of the level that could be seen by 2100 in a 2°C world.
However, research suggests it is still possible to limit warming to 2 °C above preindustrial levels.
However, the later that global CO2 emissions peak - the faster subsequent emissions cuts would
need to be in order to keep global temperature rise below the limit.

Laudato Si – Demand Side
4
There is an urgent need
to develop sources of
renewable energy.
Pope Francis
Picture: Wikimedia
European Investment Bank Group

To Get to 2°C Will Require An Additional
$8.6 trillion of Investment into Clean Energy over The Next 25 years
5
Source: Bloomberg New Energy Finance
● If the world is to stay on track to limit global warming to below a 2°C rise average temperatures, world emission must drop
sharply over the coming decades.
● A significant portion of abatement must come from the energy sector. In line with the IPCC’s carbon budget, we estimate that
to keep within a 2°C trajectory will require clean energy investment to double – or an additional $8.6 trillion over the next 25
years.
Note: Estimate based on XXXGt of the carbon budget apportioned to the power sector (IPCC). Investment by
technology assumed to be in the same proportions as in our base case forecast
INVESTMENT IN CLEAN ENERGY OUT TO 2040, BY
FIVE-YEAR PERIOD AND CUMULATIVE TOTAL
($TRILLION)An additional $8.6 trillion of
investment is needed by 2040
to stay on track for 2°C
GLOBAL POWER GENERATION MIX IN 2040, BNEF
FORECAST VS 2°C SCENARIO
25%
1%
18%
5%
14%
23%
14%
23%
10%
16%
8%
13%
6%11%
2% 4%2% 3%
2%
0
5,000
10,000
15,000
20,000
25,000
30,000
35,000
BNEF forecast Needed for 2°C
Other
Offshore wind
Biomass/WtE
Small-scale PV
Utility-scale PV
Nuclear
Onshore wind
Hydro
Gas
Coal0
2
4
6
8
10
12
14
16
18
20
0.0
0.5
1.0
1.5
2.0
2.5
3.0
3.5
4.0
4.5
5.0
2015-2020 2021-2025 2026-2030 2031-2035 2036-2040
024681012141618200.00.51.01.52.02.53.03.54.04.55.0
2015-2020 2021-2025 2026-2030 2031-2035 2036-2040
Needed for 2°C
BNEF forecast BAU
Cumulative total needed for 2°C (right-hand y-axis)
BNEF forecast total (right-hand y-axis)
024681012141618200.00.51.01.52.02.53.03.54.04.55.0
2015-2020 2021-2025 2026-2030 2031-2035 2036-2040
Needed for 2°C
BNEF forecast BAU
Cumulative total needed for 2°C (right-hand y-axis)
BNEF forecast total (right-hand y-axis)
European Investment Bank Group

Global Landscape of Climate Finance 2015
6
Source: Climate Policy Initiative
European Investment Bank Group

New Investment in Clean Energy ($BN)
7
$60bn
$88bn
$128bn
$175bn
$205bn
$206bn
$273bn
$318bn$295bn
$268bn
$318bn
46%
46%
36%
17%
0.4%
33%
16%
-7%
-9%
19%
2004 2005 2006 2007 2008 2009 2010 2011 2012 2013 2014
Note: Total values include estimates for undisclosed deals. Includes corporate and government R&D, and spending for
digital energy and energy storage projects (not reported in quarterly statistics).
Source: Bloomberg New Energy Finance
European Investment Bank Group
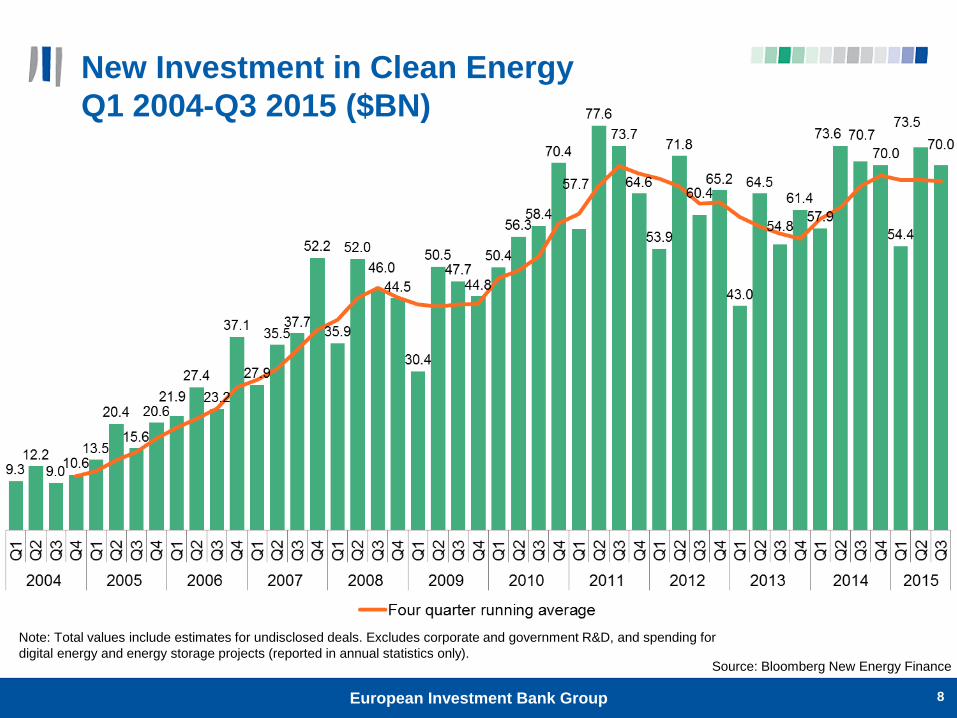
New Investment in Clean Energy
Q1 2004-Q3 2015 ($BN)
8
Note: Total values include estimates for undisclosed deals. Excludes corporate and government R&D, and spending for
digital energy and energy storage projects (reported in annual statistics only).Source: Bloomberg New Energy Finance
European Investment Bank Group

New Investment in Clean Energy by Region
($BN)
9
$28bn$39bn
$53bn$75bn
$90bn $91bn
$126bn $133bn$109bn
$75bn $83bn$13bn
$24bn
$44bn
$58bn
$62bn$50bn
$68bn
$85bn
$74bn
$65bn$74bn
$19bn
$26bn
$31bn
$42bn
$52bn$65bn
$80bn
$99bn
$113bn
$127bn
$161bn
46%
46%
36%
17%
0.4%
33%
16%
-7%
-9%
19%
2004 2005 2006 2007 2008 2009 2010 2011 2012 2013 2014
EMEA AMER APAC
Note: Total values include estimates for undisclosed deals. Includes corporate and government R&D, and spending for
digital energy and energy storage projects (not reported in quarterly statistics).Source: Bloomberg New Energy Finance
European Investment Bank Group

10
APAC New Investment in Clean Energy
by Sector Q1 2004-Q3 2015 ($BN)
Note: Total values include estimates for undisclosed deals. Excludes corporate and government R&D, and spending for
digital energy and energy storage projects (reported in annual statistics only).Source: Bloomberg New Energy Finance
European Investment Bank Group

EMEA New Investment in Clean Energy
by Sector ($BN)
11
Note: Total values include estimates for undisclosed deals. Excludes corporate and government R&D, and spending for
digital energy and energy storage projects (reported in annual statistics only).Source: Bloomberg New Energy Finance
European Investment Bank Group

Many Clean Energy Sources Are Already
Competitive
12
0 100 200 300 400 500
NuclearCHP
Coal firedNatural gas CCGT
Geothermal - flash plantLandfill gas
Large hydroSmall hydro
Wind - onshoreGeothermal - binary plant
Municipal solid wasteBiomass - incinerationBiomass - gasification
Biomass - anaerobic digestionPV - c-Si tracking
PV - c-SiPV - thin film
Wind - offshoreSTEG - tower & heliostatSTEG - parabolic trough
STEG - LFRMarine - tidal
Marine - wave
Q2 2013 central H1 2014 central
8441037
US China Europe AustraliaFossil technologies:
Onshore
wind as low
as $37/MWh
PV projects
as low as
$58/MWh
Note: LCOEs for coal and CCGTs in Europe and Australia assume a carbon
price of $20/t. No carbon prices are assumed for China and the US. Source: Levelised cost of electriicity 2014, Bloomberg New Energy Finance
European Investment Bank Group

Private Investments in Onshore Wind
and Solar PV
13
Source: Climate Policy Initiative
European Investment Bank Group
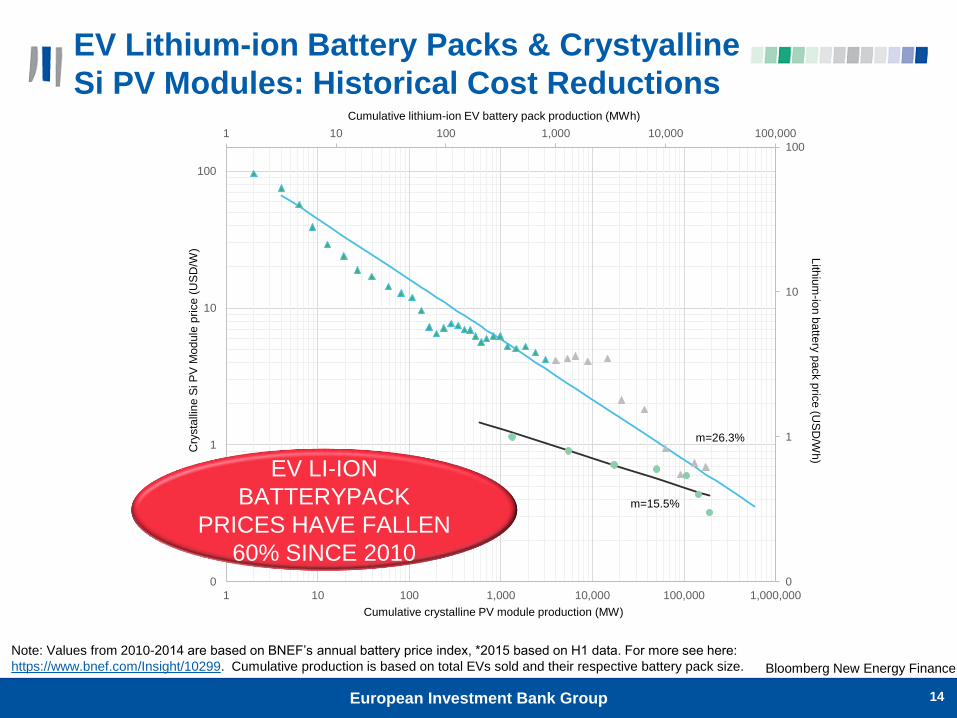
EV Lithium-ion Battery Packs & Crystyalline
Si PV Modules: Historical Cost Reductions
14
1 10 100 1,000 10,000 100,000
0
1
10
100
0
1
10
100
1 10 100 1,000 10,000 100,000 1,000,000
Cumulative lithium-ion EV battery pack production (MWh)
Cumulative crystalline PV module production (MW)
Cry
sta
llin
e S
i P
V M
od
ule
pri
ce
(US
D/W
)
Lith
ium
-ion
ba
ttery
pa
ck p
rice
(US
D/W
h)
m=15.5%
m=26.3%
EV LI-ION
BATTERYPACK
PRICES HAVE FALLEN
60% SINCE 2010
Note: Values from 2010-2014 are based on BNEF’s annual battery price index, *2015 based on H1 data. For more see here:
https://www.bnef.com/Insight/10299. Cumulative production is based on total EVs sold and their respective battery pack size. Bloomberg New Energy Finance
European Investment Bank Group

UK LCOE by Technology
H2 2015 ($/mwh)
15
0 50 100 150 200 250
Wind - onshore
Natural gas CCGT
Coal
PV - c-Si (U)
Note: Natural gas CCGT and coal includes a carbon cost of $26/tonneSource: Bloomberg New Energy Finance
European Investment Bank Group

The Economist Cover, “Sheikhs versus Shale”
December 2014
16
Source: The Economist
European Investment Bank Group

WTI Crude Oil Prices, 2000–2015
($2015 / barrel)
17
0
20
40
60
80
100
120
140
160
180
2000 2002 2004 2006 2008 2010 2012 2014
or ?Note: The Green line represents the WTI Spot price, and has been adjusted for
inflation and is represented here in real 2015 US$
Source: Bloomberg New Energy Finance, EIA,
World Bank
European Investment Bank Group
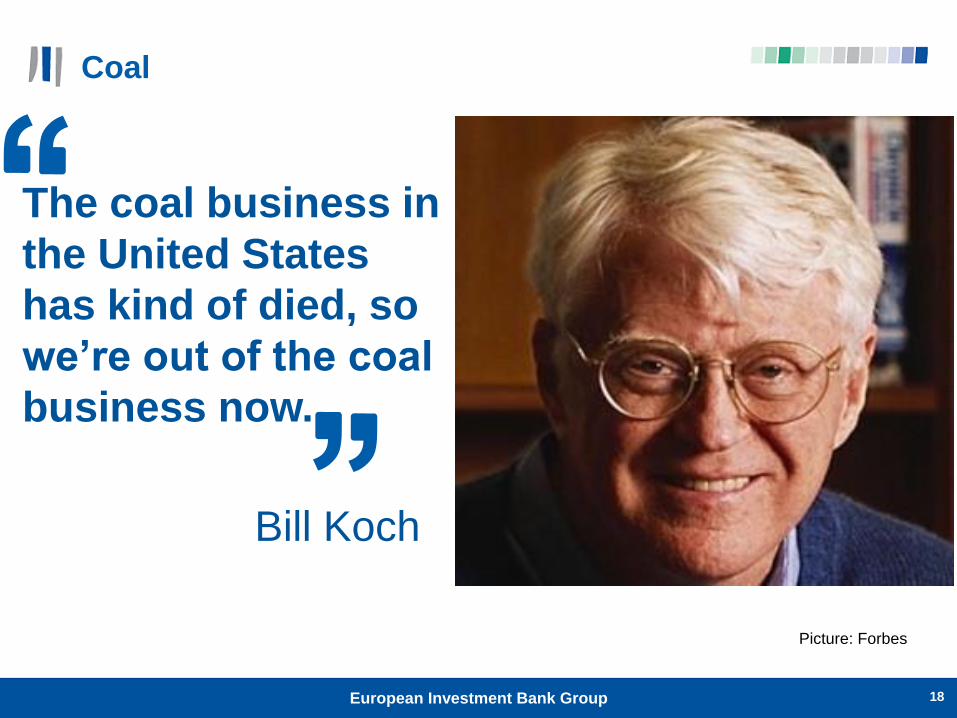
Coal
18
The coal business in
the United States
has kind of died, so
we’re out of the coal
business now.
Bill Koch
Picture: Forbes
European Investment Bank Group
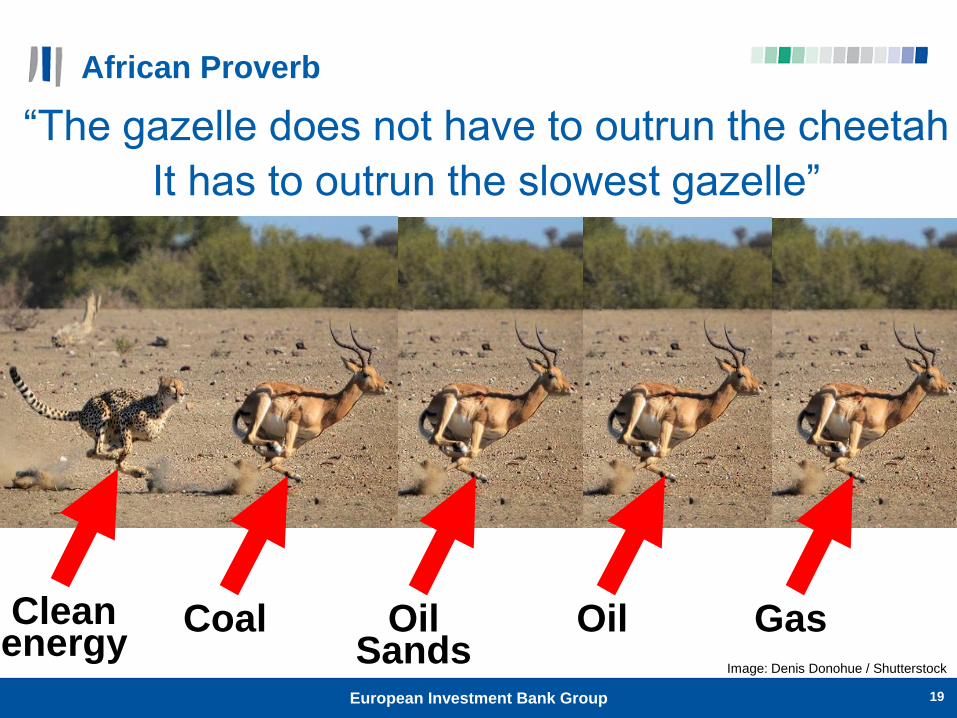
African Proverb
19
“The gazelle does not have to outrun the cheetah
It has to outrun the slowest gazelle”
Cleanenergy
Coal OilSands
Oil GasImage: Denis Donohue / Shutterstock
European Investment Bank Group

However, Challenges for Clean Energy
Investments Remain
20
No long-term policy certainty RE energy technologies
often lack track record
Retroactive changes to
regulatory frameworks
Higher upfront unit
capital cost
Regulatory changes
(e.g. Basel III & Solvency
II) lead to shorter-term
project finance (5-7 yrs
instead of 10-15 yrs)
Very sensitive to cost of
capital due to frontloading of
investment
Many utilities lack balance
sheet for investment
Current trend: shorter debt tenors
& earlier refinancing necessary
Renewable energy (RE) project
perceived as less reliably profitable
Earlier refinancing requirements
may require “refinancing premium”
Challenges lead
to financing
gap and fewer
new projects
while opposite
is needed!
Global Level Project Level
European Investment Bank Group
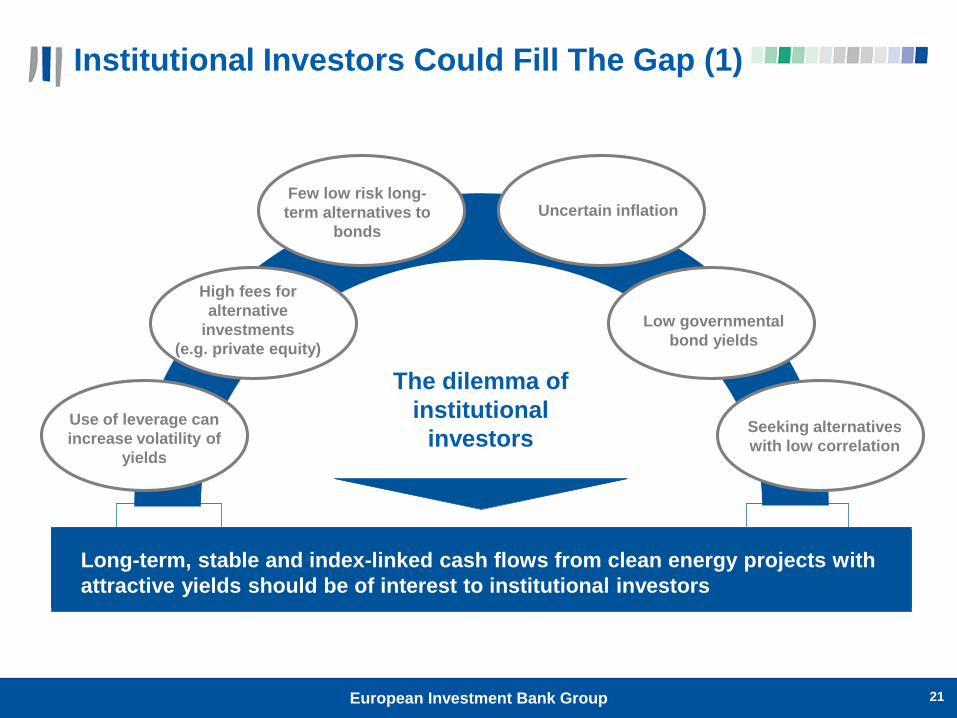
Institutional Investors Could Fill The Gap (1)
21
Few low risk long-
term alternatives to
bonds
High fees for
alternative
investments
(e.g. private equity)
The dilemma of
institutional
investors
Uncertain inflation
Low governmental
bond yields
Use of leverage can
increase volatility of
yields
Seeking alternatives
with low correlation
• Institutional investors currently lack investment opportunities
• Should be interested in long-term, stable and index-linked cash flows from
renewable energy (RE) projects
Long-term, stable and index-linked cash flows from clean energy projects with
attractive yields should be of interest to institutional investors
European Investment Bank Group

Institutional Investors Could Fill The Gap (2)
22
Re-directing even a small fraction of institutional investors’ allocations
could provide significant capital flows to clean energy investments
Institutional investors’ assets under management Potential for more
RE investment
exists
~USD 83 trillion
under management
by institutional
investors (2012)
Only a small portion
(1%) invested in
infrastructure
Even less in clean
energy such as RE
European Investment Bank Group

Need To Address Barriers to Clean Energy
Investments for Institutional Investors
23
Need to transform long-term finance need for low carbon into an investable
product that can be assessed within existing risk/reward framework
Acknowledge different risk/reward appetite from institutional investors
Main difficulty for
institutional
investors: “low
carbon” not an
investment class
Investments in RE
projects require
special knowledge
and capacity to
assess underlying
assets, which only
few institutional
investors have
Typical institutional investors’ asset allocation
Source: IFC (adapted)
Possible
asset
classes
European Investment Bank Group

What Is the European Investment Bank?
EIB is the EU’s long-term lending bank set up in 1958 by the
Treaty of Rome, headquartered in Luxembourg
EIB shareholders are the 28 EU Member States
Largest multilateral lender and borrower in the world
Around 400 projects annually in more than 160 countries
Around 10% of financing is for projects outside the EU
Financing is in support for EU priority objectives (climate change,
infrastructure, energy, SMEs, regional development, etc.)
24European Investment Bank Group

Green Bond Issuance
Outstanding environmental bonds
issued by MDBs (size > USD 100m)^
^Source: market data collected by Credit Agricole CIB; as of 27 April 2015
ADB4% AFDB
4%
EBRD1%
EIB45%
IBRD26%
IFC15%
NIB5%
CAB issuance to date: EUR 9bn equivalent in 10 currencies
EUR CAB due 2019 - largest green bond in the market at EUR 3bn
Focus on EUR & USD, tenors up to 10 years
EIB CAB issuance by currency*
EUR54%
GBP14%
SEK11%
USD9%
ZAR3%
CHF3%
AUD2%
BRL2%
TRY1%
JPY0.4%
*As of 23 April 2015
25European Investment Bank Group

EIB Climate Awareness Bonds – Key Features
Scale: Largest green bond issuer to date (EUR 9bn) and in 2014 (EUR 4.3bn)
Liquidity: Largest green bond (EUR 3bn), liquid size in USD and GBP
Capacity: Large flow of climate action lending
Green Bond curve in EUR: two references in 5- and 12-yr tenors
Clear sector focus: Projects in Renewable Energy and Energy Efficiency
Quality: Project due diligence expertise, applying high EU standards
Transparency: Detailed reporting on use of proceeds (audited sustainability report
+ dedicated newsletter) and policies (required as Aarhus signatory)
Project impact reporting (2014 CAB newsletter) released 27th March 2015
Verification / audit: external audit of reporting on the use of proceeds
Exposure to EIB credit, not projects: CABs rated pari passu with other EIB bonds
(AAA/Aaa/AAA)
No premium charged - priced like other EIB bonds of same size & maturity
Open to SRI and mainstream investors
26European Investment Bank Group
0
2,000
4,000
6,000
8,000
10,000
12,000
14,000
16,000
18,000
20,000
22,000
2010 2011 2012 2013 2014
EUR
m
Renewable Energy Energy efficiency RD & I Transport Other & miscellaneous** Adaptation
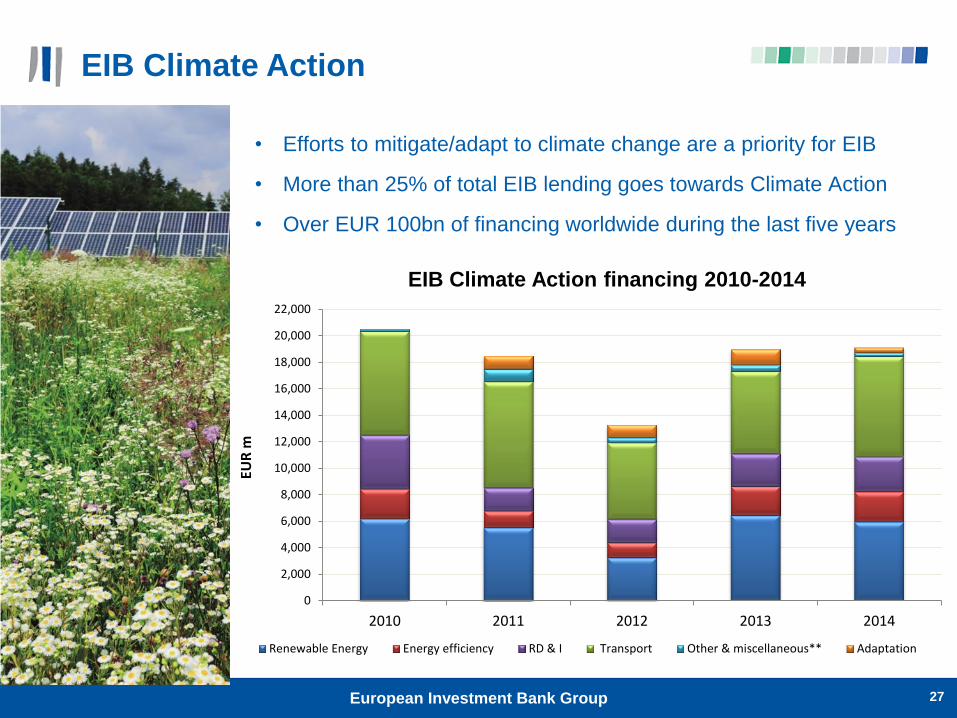
EIB Climate Action
• Efforts to mitigate/adapt to climate change are a priority for EIB
• More than 25% of total EIB lending goes towards Climate Action
• Over EUR 100bn of financing worldwide during the last five years
27
EIB Climate Action financing 2010-2014
European Investment Bank Group

EIB Financing Instruments
The EIB has an extensive range of instruments to finance public and private
sectors at investment and sub-investment grades of risk to its disposal
28
EIB lending instrument for Investment Grade operations
Special Activities
For low and sub investment Grade operations
Project Finance
Direct Loans
Project
Project finance with
direct project risk
LGTT/RSFF
(Mezzanine)
Equity through
Funds
Intermediated Loans
Banks
Public Sector
Financing
European Investment Bank Group

Fund Investments
29European Investment Bank Group
Fund investments demonstrate the EIB’s catalytic effect
Efficient use of EIB capital through a leverage effect
Policy test upfront and project driven (i.e. primary focus on the underlying
assets in terms of fit with EIB objectives and economic benefit)
Can invest time to work with a fund manager from concept stage
Can go into segments not quite mainstream yet
(e.g. bio-diversity, land decontamination, land use/carbon)
Can support start-up teams and new concepts
Can play different management roles alongside investment
€10 EIB commitment
€100 of Equity
available to projects
that meet
EIB objectives €90 third party
commitments
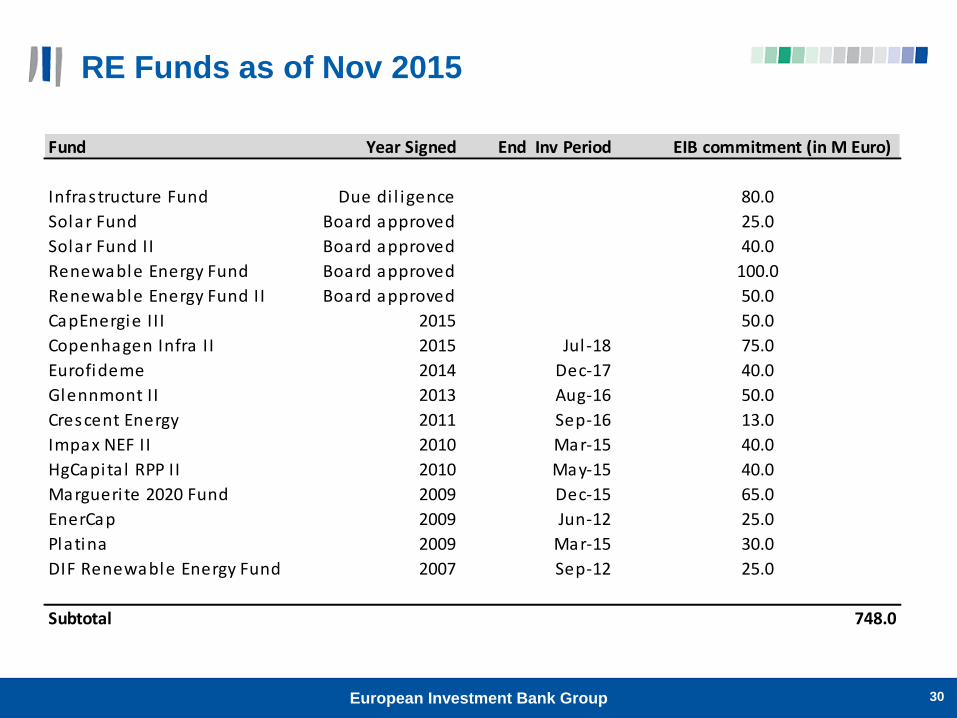
RE Funds as of Nov 2015
30European Investment Bank Group
Fund Year Signed End Inv Period EIB commitment (in M Euro)
Infrastructure Fund Due di l igence 80.0
Solar Fund Board approved 25.0
Solar Fund II Board approved 40.0
Renewable Energy Fund Board approved 100.0
Renewable Energy Fund II Board approved 50.0
CapEnergie II I 2015 50.0
Copenhagen Infra II 2015 Jul -18 75.0
Eurofideme 2014 Dec-17 40.0
Glennmont II 2013 Aug-16 50.0
Crescent Energy 2011 Sep-16 13.0
Impax NEF II 2010 Mar-15 40.0
HgCapita l RPP II 2010 May-15 40.0
Margueri te 2020 Fund 2009 Dec-15 65.0
EnerCap 2009 Jun-12 25.0
Platina 2009 Mar-15 30.0
DIF Renewable Energy Fund 2007 Sep-12 25.0
Subtotal 748.0

By Energy Source
RE Funds Signed Exposure Analysis – Nov 2015
By Country
France22,4%
UK10,9%
Sweden10,2%
Germany10,5%
Ireland8,2%
Poland7,5%
Finland5,8%
Italy3,8%
Portugal3,7%
Spain2,8%
Benelux2,6%
Romania1,7%
Croatia1,0%
Cyprus0,9%
Slovakia0,6%
Czech0,3%
Bulgaria0,2%
Greece0,0% Other EU
1,6%Non EU
5,2%
PV Solar 24%
Onshore Wind48%
Offshore Wind10%
Hydro4%
Biomass7%
Other7%
31European Investment Bank Group
Example Sustainable Land Use Fund: Althelia
32
The Althelia Climate Fund is an innovative, pilot sustainable land use
investment fund.
Focus: nature conservation and sustainable forestry management, in particular
REDD+ (tropical forest conservation activities that reduce greenhouse gas (GHG)
emissions by avoiding deforestation and forest degradation, protecting and
enhancing forest carbon stocks)
EIB cornerstone investment with BNP Paribas, FMO (Netherlands
Development Finance Company), FinnFund & Church of Sweden. Fund
closed in 2013 with EUR 60m+ in commitments
Project investments: generate revenues from forest carbon stock
conservation and non-carbon sources (e.g. non-timber forest products,
sustainable agriculture and other services/commodities)
Risk mitigation: Althelia finalised negotiations for an USAID guarantee to partially
offset the price risk for generated carbon credits (so-called Advanced Market
Commitment)
Good example of new market segment with policy risk mitigation
European Investment Bank Group

New Initiative: Natural Capital Facility (NCF)
33
Promote Green Infrastructure (GI), conservation, adaptation to climate
change Financing GI: urban, rural, built structures using nature
Natural Conservation: site preservation, recreation activities
Ecosystem-based Climate Adaptation: marine/coastal protection, natural management of basins,
rivers/canals
Water Cycle catchment management: rainwater collection, SUDS, natural wastewater filtration, flood
defence
Projects optimised through use of market-based instruments (e.g. PES and
Offsetting Credits) Payment for Ecosystem Services (provided by biodiversity, watershed etc.) on the principle of beneficiary
pays
Compensation and offsettings (for impacts on biodiversity, soil etc.) on the principle of polluter pays,
eventually subsequent “no net loss and securing net gain” with generation of offsetting credits
Soil and forest sequestration of carbon with generation of carbon credits
Pro-biodiversity businesses generating green services & commodities
markets / Nature-based climate change adaptation businesses Small pro-biodiversity businesses
Sustainable Forestry and Agriculture (including biomass), Sustainable Aquaculture
Nature-based processes or technologies for climate change adaptation
Waste: Remediation and regeneration of polluted land
Restoration of natural sinks absorbing waste
Recycling of organic waste including. bioenergy
European Investment Bank Group

Layered-Risk Funds
Layered-risk funds allow the issuance of different share tranches and notes to offer
investors different risk-return profiles.
The capital structure of such an investment vehicle typically rests upon the provision
of a first loss piece (termed junior C shares in the figure below) by donors.
Once the asset side of the fund develops, this structure allows the possibility to
issue notes to private investors who remain most senior in the cash waterfall.
34European Investment Bank Group
Example: Layered Debt/Equity Fund: EEEF
35
The European Energy Efficiency Fund (EEEF) is managed by Deutsche Bank
(www.eeef.eu) aims to provide market-based financing for commercially
viable public energy efficiency (70%) and renewable energy projects (30%)
within the European Union
Total size: EUR 265m (EUR 125 Mio EERP, EUR 75m EIB, EUR 60m CDP
and EUR 5m DB)
Beneficiaries: Local & regional Public authorities, but PPPs are possible
Financing in form of loans, guarantees, forfeiting schemes (to finance ESCO
projects).
Technical Assistance (grant) is available to structure projects
EEEF offers a layered risk/return structure for investors with a
fixed commitment of EU budget funds
European Investment Bank Group
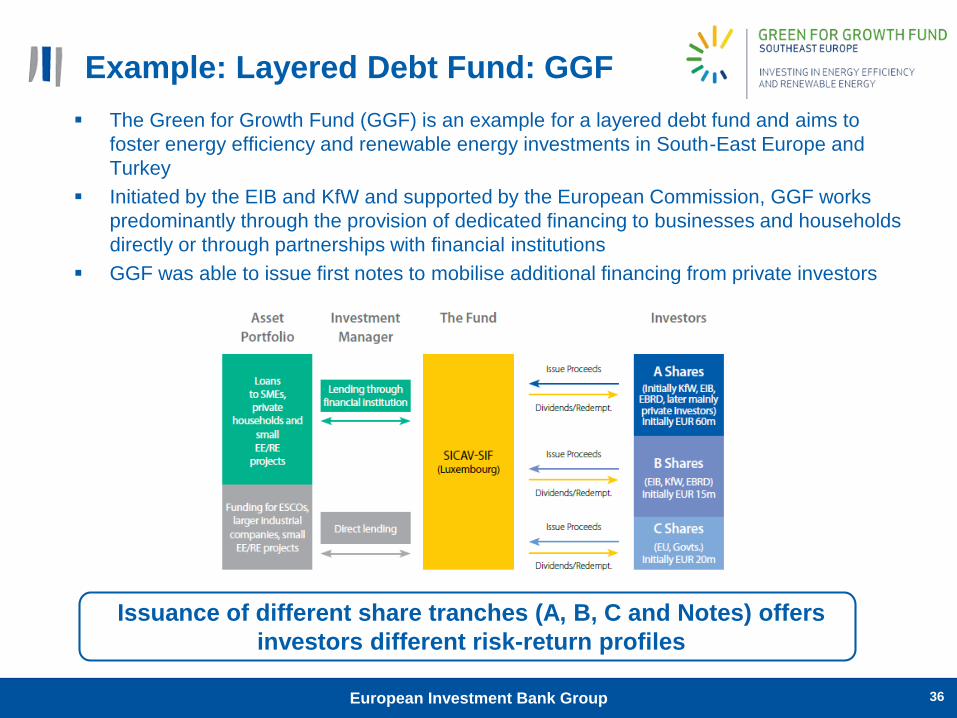
Example: Layered Debt Fund: GGF
The Green for Growth Fund (GGF) is an example for a layered debt fund and aims to
foster energy efficiency and renewable energy investments in South-East Europe and
Turkey
Initiated by the EIB and KfW and supported by the European Commission, GGF works
predominantly through the provision of dedicated financing to businesses and households
directly or through partnerships with financial institutions
GGF was able to issue first notes to mobilise additional financing from private investors
36
Issuance of different share tranches (A, B, C and Notes) offers
investors different risk-return profiles
European Investment Bank Group

Example: Fund of Funds: GEEREF
37
GEEREF is a fund of funds and provides global risk capital to energy
efficiency and renewable energy projects in developing countries and
economies in transition (African, Caribbean and Pacific region, non-EU
Eastern Europe, Latin America and Asia)
GEEREF is sponsored by the European Union, Germany and Norway and
advised by the European Investment Bank Group focusing on a triple bottom
line of people, planet and profit
GEEREF completed a fundraising campaign in June 2015 and raised over
EUR 110m in private capital in additional to the EUR 112m contributions from
the sponsors
GEEREF is one of the first instruments that has demonstrated that it is
possible to mobilise private financing by using public funds a risk capital in a
financing structure
European Investment Bank Group

Concept: Renewable Energy Platform for
Institutional Investors (REPIN)
38
REPIN bridges between short-term lenders and long-term institutional
investors
REPIN
Need to overcome “chicken and egg” dilemma: developers lack investment signals while institutional investors lack suitable products for RE investments
Guaranteed access to refinancing should stimulate more deal flow
Institutional investors have interest in long-term, stable and index-linked cash flows from operational RE projects
Regulatory changes (Basel III & Solvency II) should lead to shorter debt tenors and earlier RE refinancing requirements
Aggregation of projects and standardisation can streamline approval process and reduce transaction cost
Technical support required to structure suitable investments and reduce knowledge gaps
European Investment Bank Group

REPIN Concept: Key Objectives
39
Create more
RE deal flow
Focus is on
refinancing of
commercial
bank debt
Main objective
Free commercial lending capacity for further RE
investments2
Enable institutional investors with varying risk/reward
profiles to acquire mature long-term RE assets3
Lower cost of capital to improve RE project bankability:
provide commercial lenders with ‘guaranteed exit’ and
remove refinancing risk premium from equity1
Key elements
Ultimate goal: simultaneously stimulate deal flow and engage
institutional investors to increase overall RE financing
European Investment Bank Group

REPIN Concept: Structure
40
Straight pass-through of
loans from a project or
portfolio
Banks
Renewable Energy Platform for
Institutional Investors (REPIN)
Equity
provider
Other
sponsors
RE debt
providerInstitutional
Investors
for example:for example: for example:
Pension
funds
Insurers
& Re-
insurer
Other
asset
manager
Issuance of notes from a
portfolio
Securitisation of loan
portfolio(s)
Sets eligibility requirements for
operational projects
Helps sourcing projects/portfolios
Develops eligibility requirements
with investors
Provides quality assurance
Service
provider(s)
Financial
intermediary
Due diligence
Project
risk/rating
Project /loan
monitoring Underwriting of REPIN
(if required)
Structuring/Arranging
Credit enhancement
Credit
enhancement
(if required)
Insurer/ Re-
insurer Insurance
Warranty protection
European Investment Bank Group

Project Bond Credit Enhancement (PBCE)
41
The PBCE instrument:
Ensures debt service for the Project
Bond Investors up to the total size of
the instrument
Provides additional liquidity to avoid
default, and acts as a first-loss debt
piece
Credit enhances project bonds from
a typical BBB- rating by up to 3
notches (to A-)
Can be provided as either a funded
(subordinated loan) or unfunded
(letter of credit) instrument
Once drawn (unfunded), mezzanine
debt repaid by junior cash sweep
Project
Bonds
PBCE up
to 20% of
total
Project
Bond issue
Project
Company
(e.g.
PPP/PFI)
Equity
Project
Bond
Investors
PBCE
European Investment Bank Group

The Greater Gabbard OFTO
42
Project
• Electricity transmission assets connecting the 140 wind
turbines of the 504MW Greater Gabbard offshore wind
farm to the UK onshore grid
• Construction completed
• Concession of 20 years
Financing
(Bond)
• Size: GBP 305.1m, publicly listed, long term, amortising
senior debt with a tenor of 19 years
• Rating: A3 (with the PBCE)
• Pricing: 125bps over benchmark UK Gilt rate or 4.317%
• Bookbuilding: 3x oversubscribed
PBCE
(L/C)
• Size: GBP 45.8m initially (15% of Bond), amortising with
Bond
European Investment Bank Group

PF4EE
43
Private Finance for Energy Efficiency (PF4EE) is a joint instrument of
the EIB Group and the European Commission (EC) to support the
financing of energy efficiency (EE) investments.
PF4EE supports eligible EE investments identified by schemes
developed within EU Member States and is made up of 3 components:
PF4EE Energy Efficiency Loan: an EIB financing with long tenor and
flexible allocation rules
PF4EE Risk Sharing Facility: Up to 80% coverage of credit losses on a
loan by loan basis up to a given amount
PF4EE Expert Support Facility: A technical consultancy services aiming
at supporting EE financing at Financial Intermediary level
European Investment Bank Group

PF4EE - Structure
44
Financial
Intermediary
(FI)
PF4EE RSF
Cash transfers to
cover up to 80%
of losses.
Delegation Agreement
Eligible EE
Investments
Member State
EE Programme
National EE Action Plan and
EU Directives Compliant
Final Recipients
Expert Support Facility
Trustee
Cash deposit
EIB EE Loan
Benefits of PF4EE:
Better financing conditions because lower credit risk profile and adapted refinancing.
Lower security/collateral requirements due to the Risk Sharing Facility.
Global financing solution, if blended with EE grants from Member State EE
programme.
European Investment Bank Group

45
Contacts
Christopher Knowles
Head
Climate Change &
Environment
European Investment Bank
100, boulevard Konrad Adenauer
L-2950 Luxembourg
Martin Berg
Investment Officer
Climate Change &
Environment
For more information please contact:
European Investment Bank Group