finance committee meeting - cloudinary
TRANSCRIPT

FINANCE COMMITTEEMEETING
Friday, April 9, 2021 at
8:00 a.m.
Kern Health Systems 2900 Buck Owens Blvd. 1st Floor – Board Room Bakersfield, CA 93308
For more information, call (661) 664-5000
KHS Finance Committee Meeting, April 9, 2021
1 / 144


AGENDA
FINANCE COMMITTEE MEETING
KERN HEALTH SYSTEMS 2900 Buck Owens Boulevard Bakersfield, California 93308
Friday, April 9, 2021
8:00 A.M.
COMMITTEE TO RECONVENE
Members: Deats, Martinez, McGlew, Melendez, Rhoades
CONSENT AGENDA/OPPORTUNITY FOR PUBLIC COMMENT: ALL ITEMS LISTED WITH A "CA" ARE CONSIDERED TO BE ROUTINE AND NON-CONTROVERSIAL BY KERN HEALTH SYSTEMS STAFF. THE "CA" REPRESENTS THE CONSENT AGENDA. CONSENT ITEMS WILL BE CONSIDERED FIRST AND MAY BE APPROVED BY ONE MOTION IF NO MEMBER OF THE COMMITTEE OR AUDIENCE WISHES TO COMMENT OR ASK QUESTIONS. IF COMMENT OR DISCUSSION IS DESIRED BY ANYONE, THE ITEM WILL BE REMOVED FROM THE CONSENT AGENDA AND WILL BE CONSIDERED IN LISTED SEQUENCE WITH AN OPPORTUNITY FOR ANY MEMBER OF THE PUBLIC TO ADDRESS THE COMMITTEE CONCERNING THE ITEM BEFORE ACTION IS TAKEN.
STAFF RECOMMENDATION SHOWN IN CAPS
All agenda item supporting documentation is available for public review at Kern Health Systems in the Administration Department, 2900 Buck Owens Boulevard, Bakersfield, CA 93308 during regularbusiness hours, 8:00 a.m. – 5:00 p.m., Monday through Friday, following the posting of the agenda. Any supporting documentation that relates to an agenda item for an open session of any regular meeting that is distributed after the agenda is posted and prior to the meeting will also be available for review at the same location.
PLEASE REMEMBER TO TURN OFF ALL CELL PHONES OR ELECTRONIC DEVICES DURING MEETINGS.
KHS Finance Committee Meeting, April 9, 2021
3 / 144

Agenda Finance Committee Meeting Page 2 Kern Health Systems 4/9/2021
PUBLIC PRESENTATIONS
1) This portion of the meeting is reserved for persons to address the Committee onany matter not on this agenda but under the jurisdiction of the Committee.Committee members may respond briefly to statements made or questions posed.They may ask a question for clarification, make a referral to staff for factualinformation or request staff to report back to the Committee at a later meeting.Also, the Committee may take action to direct the staff to place a matter of businesson a future agenda. SPEAKERS ARE LIMITED TO TWO MINUTES. PLEASESTATE AND SPELL YOUR NAME BEFORE MAKING YOUR PRESENTATION.THANK YOU!
COMMITTEE MEMBER ANNOUNCEMENTS OR REPORTS
2) On their own initiative, Committee members may make an announcement or areport on their own activities. They may ask a question for clarification, make areferral to staff or take action to have staff place a matter of business on a futureagenda (Government Code Section 54954.2(a)(2))
CA-3) Minutes for KHS Finance Committee meeting on February 5, 2021- APPROVE
4) Report by Daniells Phillips Vaughan & Bock on the audited financial statements ofKern Health Systems for the year ending December 31, 2020 (Fiscal Impact: None) –
RECEIVE AND FILE; REFER TO KHS BOARD OF DIRECTORS
5) Proposed Agreement with Office Ally, LLC, to process and submit electronicmedical claims from providers and institutions directly to KHS, from April 15, 2021through April 15, 2024, in an amount not to exceed $0.23 per claim (Fiscal Impact:$180,000 estimated annually; Budgeted) –APPROVE; REFER TO KHS BOARD OF DIRECTORS
6) Report on Kern Health Systems financial statements for December 2020 andJanuary 2021 (Fiscal Impact: None) –RECEIVE AND FILE; REFER TO KHS BOARD OF DIRECTORS
7) Report on Accounts Payable Vendor Report, Administrative Contracts between$30,000 and $100,000 for December 2020 and January 2021 and IT TechnologyConsulting Resources for the period ended December 31, 2020 (Fiscal Impact:None) –RECEIVE AND FILE; REFER TO KHS BOARD OF DIRECTORS
KHS Finance Committee Meeting, April 9, 2021
4 / 144

Agenda Finance Committee Meeting Page 3 Kern Health Systems 4/9/2021
ADJOURN TO FRIDAY, JUNE 4, 2021 AT 8:00 A.M.
AMERICANS WITH DISABILITIES ACT (Government Code Section 54953.2)
The meeting facilities at Kern Health Systems are accessible to persons with disabilities. Disabled individuals who need special assistance to attend or participate in a meeting of the KHS Finance Committee may request assistance at the Kern Health Systems office, 2900 Buck Owens Boulevard, Bakersfield, California 93308 or by calling (661) 664-5000. Every effort will be made to reasonably accommodate individuals with disabilities by making meeting material available in alternative formats. Requests for assistance should be made five (5) working days in advance of a meeting whenever possible.
KHS Finance Committee Meeting, April 9, 2021
5 / 144


SUMMARY
FINANCE COMMITTEE MEETING
KERN HEALTH SYSTEMS 2900 Buck Owens Boulevard Bakersfield, California 93308
Friday, February 5, 2021
8:00 A.M.
COMMITTEE RECONVENED
Members: Martinez, Melendez, Rhoades ROLL CALL: 3 Present; 2 Absent – Deats, McGlew
NOTE: The vote is displayed in bold below each item. For example, Rhoades-Deats denotes Director Rhoades made the motion and Director Deats seconds the motion.
CONSENT AGENDA/OPPORTUNITY FOR PUBLIC COMMENT: ALL ITEMS LISTEDWITH A “CA” WERE CONSIDERED TO BE ROUTINE AND APPROVED BY ONE MOTION.
COMMITTEE ACTION SHOWN IN CAPS
PUBLIC PRESENTATIONS
1) This portion of the meeting is reserved for persons to address the Committee on anymatter not on this agenda but under the jurisdiction of the Committee. Committeemembers may respond briefly to statements made or questions posed. They may aska question for clarification, make a referral to staff for factual information or requeststaff to report back to the Committee at a later meeting. Also, the Committee may takeaction to direct the staff to place a matter of business on a future agenda. SPEAKERSARE LIMITED TO TWO MINUTES. PLEASE STATE AND SPELL YOUR NAMEBEFORE MAKING YOUR PRESENTATION. THANK YOU!NO ONE HEARD
KHS Finance Committee Meeting, April 9, 2021
7 / 144

SUMMARY Finance Committee Meeting Page 2 Kern Health Systems 2/5/2021
COMMITTEE MEMBER ANNOUNCEMENTS OR REPORTS
2) On their own initiative, Committee members may make an announcement or a reporton their own activities. They may ask a question for clarification, make a referral tostaff or take action to have staff place a matter of business on a future agenda(Government Code Section 54954.2(a)(2))NO ONE HEARD
CA-3) Minutes for KHS Finance Committee meeting on December 4, 2020 - APPROVED Melendez-Martinez: 3 Ayes; 2 Absent – Deats, McGlew
4) Report on Kern Health Systems investment portfolio for the fourth quarter endingDecember 31, 2020 (Fiscal Impact: None) –RECEIVED AND FILED; REFERRED TO KHS BOARD OF DIRECTORSMelendez-Martinez: 3 Ayes; 2 Absent – Deats, McGlew
5) Report on 2020 annual review of the Kern Health Systems Investment Policy (FiscalImpact: None) –RECEIVED AND FILED; REFERRED TO KHS BOARD OF DIRECTORSMelendez-Martinez: 3 Ayes; 2 Absent – Deats, McGlew
6) Report on 2020 Annual Travel Report (Fiscal Impact: None) –RECEIVED AND FILED; REFERRED TO KHS BOARD OF DIRECTORSMelendez-Martinez: 3 Ayes; 2 Absent – Deats, McGlew
7) Report on 2020 Annual Report of Disposed Assets (Fiscal Impact: None) –RECEIVED AND FILED; REFERRED TO KHS BOARD OF DIRECTORSMelendez-Martinez: 3 Ayes; 2 Absent – Deats, McGlew
8) Proposed Agreement with FluidEdge, LLC., for Population Health ConsultingServices, from March 1, 2021 through May 31, 2021 (Fiscal Impact: $160,000; Not-Budgeted) –APPROVED; REFERRED TO KHS BOARD OF DIRECTORSMelendez-Martinez: 3 Ayes; 2 Absent – Deats, McGlew
9) Request to Establish 2021 – 2022 Provider Grant Program (Fiscal Impact: Up to $10million; Not-Budgeted) –APPROVED; REFERRED TO KHS BOARD OF DIRECTORSMelendez-Martinez: 3 Ayes; 2 Absent – Deats, McGlew
10) Report on Kern Health Systems financial statements for November 2020 (FiscalImpact: None) –RECEIVED AND FILED; REFERRED TO KHS BOARD OF DIRECTORSMelendez-Martinez: 3 Ayes; 2 Absent – Deats, McGlew
KHS Finance Committee Meeting, April 9, 2021
8 / 144

SUMMARY Finance Committee Meeting Page 2 Kern Health Systems 2/5/2021
11) Report on Accounts Payable Vendor Report, Administrative Contracts between$30,000 and $100,000 for November 2020 and IT Technology Consulting Resourcesfor the period ended November 30, 2020 (Fiscal Impact: None) –RECEIVED AND FILED; REFERRED TO KHS BOARD OF DIRECTORSMelendez-Martinez: 3 Ayes; 2 Absent – Deats, McGlew
ADJOURN TO FRIDAY, APRIL 9, 2021 AT 8:00 A.M. Rhoades
KHS Finance Committee Meeting, April 9, 2021
9 / 144


To: KHS Finance Committee
From: Robert Landis, CFO
Date: April 9, 2021
Re: Report by Daniells Phillips Vaughan & Bock Regarding the 2020 Audit
Representatives from the accounting firm Daniells Phillips Vaughan & Bock will be
providing a report on the 2020 audit. Attached for your review are the December 31, 2020
audited financial statements for Kern Health Systems.
Requested Action
Receive and File; Refer to KHS Board of Directors.
KHS Finance Committee Meeting, April 9, 2021
11 / 144

FINANCIAL REPORT
DECEMBER 31, 2020
KHS Finance Committee Meeting, April 9, 2021
12 / 144

KERN HEALTH SYSTEMS
FINANCIAL REPORT
DECEMBER 31, 2020
KHS Finance Committee Meeting, April 9, 2021
13 / 144

C O N T E N T S INDEPENDENT AUDITOR’S REPORT 1-2 MANAGEMENT’S DISCUSSION AND ANALYSIS 3-11 FINANCIAL STATEMENTS Statements of net position 12 Statements of revenues, expenses and changes in net position 13 Statements of cash flows 14 Notes to financial statements 15-37 REQUIRED SUPPLEMENTARY INFORMATION Schedules of proportionate share of the net pension liability 38 Schedules of pension contributions 39-40 OTHER INDEPENDENT AUDITOR’S REPORT Independent Auditor’s Report on Internal Control Over Financial Reporting and on Compliance and Other Matters Based on an Audit of Financial Statements Performed in Accordance with Government Auditing Standards 41-42
KHS Finance Committee Meeting, April 9, 2021
14 / 144

300 New Stine Road – Bakersfield, CA 93309 – Tel. 661.834.7411 – Fax.661.834.4389 – www. dpvb.com
An independently owned member RSM US Alliance
Member of AICPA Division for Firms Private Companies Practice Section
NANCY C. BELTON
INDEPENDENT AUDITOR’S REPORT
To the Board of DirectorsKern Health Systems Bakersfield, California
Report on the Financial Statements
We have audited the accompanying financial statements of Kern Health Systems, as of and for the years ended December 31, 2020 and 2019, and the related notes to the financial statements, which collectively comprise the entity’s basic financial statements as listed in the table of contents.
Management’s Responsibility for the Financial Statements
Management is responsible for the preparation and fair presentation of these financial statements in accordance with accounting principles generally accepted in the United States of America; this includesthe design, implementation, and maintenance of internal control relevant to the preparation and fair presentation of financial statements that are free from material misstatement, whether due to fraud or error.
Auditor’s Responsibility
Our responsibility is to express an opinion on these financial statements based on our audits. Weconducted our audits in accordance with auditing standards generally accepted in the United States ofAmerica and the standards applicable to financial audits contained in Government Auditing Standards,issued by the Comptroller General of the United States. Those standards require that we plan and perform the audits to obtain reasonable assurance about whether the financial statements are free from material misstatement.
An audit involves performing procedures to obtain audit evidence about the amounts and disclosures in the financial statements. The procedures selected depend on the auditor’s judgment, including theassessment of the risks of material misstatement of the financial statements, whether due to fraud orerror. In making those risk assessments, the auditor considers internal control relevant to the entity’spreparation and fair presentation of the financial statements in order to design audit procedures that are appropriate in the circumstances, but not for the purpose of expressing an opinion on the effectiveness ofthe entity’s internal control. Accordingly, we express no such opinion. An audit also includes evaluating the appropriateness of accounting policies used and the reasonableness of significant accountingestimates made by management, as well as evaluating the overall presentation of the financialstatements.
We believe that the audit evidence we have obtained is sufficient and appropriate to provide a basis for our audit opinion.
-1-
KHS Finance Committee Meeting, April 9, 2021
15 / 144

-2-
Opinion
In our opinion, the financial statements referred to above present fairly, in all material respects, the financial position of Kern Health Systems, as of December 31, 2020 and 2019, and the changes in financial position, and cash flows for the years then ended in accordance with accounting principles generally accepted in theUnited States of America.
Other Matters
Required Supplementary Information
Accounting principles generally accepted in the United States of America require that the management’s discussion and analysis, the schedules of proportionate share of the net pension liability and the schedules ofpension contributions on pages 3-11 and 38-40 be presented to supplement the basic financial statements. Such information, although not a part of the basic financial statements, is required by the Governmental Accounting Standards Board who considers it to be an essential part of financial reporting for placing the basic financial statements in an appropriate operational, economic, or historical context. We have appliedcertain limited procedures to the required supplementary information in accordance with auditing standards generally accepted in the United States of America, which consisted of inquiries of management about themethods of preparing the information and comparing the information for consistency with management’s responses to our inquiries, the basic financial statements, and other knowledge we obtained during our audit of the basic financial statements. We do not express an opinion or provide any assurance on the information because the limited procedures do not provide us with sufficient evidence to express an opinion or provideany assurance.
Other Reporting Required by Government Auditing Standards
In accordance with Government Auditing Standards, we have also issued our report dated March 30, 2021 onour consideration of Kern Health Systems' internal control over financial reporting and on our tests of its compliance with certain provisions of laws, regulations, contracts, and grant agreements and other matters. The purpose of that report is to describe the scope of our testing of internal control over financial reporting and compliance and the results of that testing, and not to provide an opinion on the effectiveness of Kern Health Systems’ internal control over financial reporting or on compliance. That report is an integral part of an audit performed in accordance with Government Auditing Standards in considering Kern Health Systems’internal control over financial reporting and compliance.
Daniells Phillips Vaughan & Bock Bakersfield, California March 30, 2021
KHS Finance Committee Meeting, April 9, 2021
16 / 144

-3-
KERN HEALTH SYSTEMS
Management’s Discussion and Analysis
Our discussion and analysis of Kern Health Systems’ (“KHS”, “We”, “Us”, “Our”) financial performanceprovides an overview of KHS’ financial activities for the calendar years ended December 31, 2020 and2019. Presentation of balances in the financial tables may differ from prior periods. Account balances have been reclassified to better present financial categories. Please read the discussion and analysis in conjunction with the KHS financial statements, which begin on page 12.
Overview:
KHS is a County health authority established for the purpose of providing health care services to meet the health care needs of low-income families and individuals in Kern County, California. As a managed care health plan, KHS manages health care services for an enrolled population that qualifies for Medi-Cal, which is California’s Medicaid health care program. Medicaid was established in 1965 under the U.S. Social Security Act to provide health care and long-term care services and support to low-incomeAmericans. Although jointly funded by federal and state governments, Medicaid is a state-operated and state-implemented program. Subject to federal laws and regulations, states have significant flexibility to structure their own programs in terms of eligibility, benefits, delivery of services, and provider payments. The Department of Health Care Services (“DHCS”) is the single state agency responsible for administering Medi-Cal. In 2020 and 2019, KHS received over 99% of its operating revenue from the State of California. KHS is committed to continually improving the quality of care and service to its members, and to help them access the right care at the right time in the appropriate setting.
Members can select the Medi-Cal health plan of their choice. In Kern County there is one additional Medi-Cal health plan to choose from besides KHS. The opportunity to select a health plan is at the time of initial enrollment and at a minimum, annually thereafter. If a member does not select a plan, the member will be auto-assigned to one of the two Medi-Cal health plans located in Kern County.
In general, KHS members are required to use the KHS provider network to receive care. KHS contracts with various health care providers for the provision of medical care services to its members. The provider network consists of primary and specialty care physicians, hospitals, ancillary providers and pharmacies. Primary Care Physicians (PCPs) play an integral role in coordinating and managing the care of KHS members by delivering preventive services as well as referring members to other providers for medically necessary services. PCPs are typically trained in internal medicine, pediatrics, family practice and general practice. KHS compensates most of its providers on a fee for services basis. Under fee for servicearrangements, KHS retains the financial responsibility for medical care provided and incurs costs basedon the actual utilization of services. Additionally, KHS works with the provider network to operateefficiently by providing financial and utilization information, physician and patient educational programs, and disease and medical management programs. In 2020 and 2019, KHS paid approximately 92% and93%, respectively, of its revenue to providers.
KHS seeks to improve the quality of care delivered by its network providers by continual focus on:
• Provider access• Preventive health and wellness• Care and disease management• Provider credentialing• Provider education and incentives for closing care gaps• Member education and outreach• Information technology initiatives related to the above activities• Advocacy and community-based programs
KHS Finance Committee Meeting, April 9, 2021
17 / 144

-4-
KHS’ mission is dedicated to improving the health status of its members through an integrated managed health care delivery system. KHS is focused on preventive health, wellness and a population health management model that coordinates medical, behavioral, social, and pharmacy programs to provide quality care.
Financial Highlights:
Our net position increased in 2020 by $12,393,808 or approximately 5.8% while in 2019our net position increased by $13,061,405 or 6.5%.
Our Medi-Cal enrollment growth showed an average monthly increase of approximately13,300 members or 5.3% in 2020 compared to 2019. This compared to an averagemonthly increase of approximately 3,400 members or 1.4% in 2019 compared to 2018.The increase in average monthly membership was due largely to the State notperforming redeterminations as a result of the COVID-19 Public Health Emergency (PHE)and increased eligibility as a result of the PHE.
We have a capitated arrangement required by the California Department of Health CareServices (DHCS) with another health plan which allows for that plan to provide healthcare services for assigned members. Assigned membership to this other health plan was10,909 members at the end of 2020 compared to 9,007 members at the end of 2019. Thepremium revenue earned for this population was $25.6 million and $22.0 million for theyears ended December 31, 2020 and 2019, respectively. As we have no obligation toprovide care for this population, the Premiums earned amount reported for the yearsended December 31, 2020 and 2019 is net of the $25.0 million and $21.6 million,respectively, of associated capitated expense and the member months shown have beenadjusted to remove capitated member months.
We reported an operating income of $14,204,450 or $4.51 PMPM in 2020 and operatingincome of $8,335,611 or $2.80 PMPM in 2019. The operating income in 2020 is largelydue to increased membership experienced in 2020 and a lower Medical Loss ratio(Medical and Hospital Services expense as a percentage of Total Operating Revenueexcluding MCO tax revenue and Hospital directed payments earned).
Managed Care Organization (MCO) Tax Revenues of $98,918,724 or $31.42 PMPM areincluded in premiums earned in 2020 and $48,486,437 or $16.22 PMPM in 2019.Beginning July 1, 2016, under Senate Bill X2-2, the MCO tax methodology changed froma 3.9375% of premium revenue to a fixed PMPM rate. The rate was $30.33 PMPM forthe period January 1, 2020 to December 31, 2020 and $31.50 PMPM for the period July1, 2018 to June 30, 2019. Due to a delay in federal approval by CMS of the extension ofthe MCO tax program, there was no MCO tax assessment for the period July 1, 2019through December 31, 2019. The tax amounts are based on projected membership andMCO expense is payable quarterly. MCO Tax Expense is reported as an operatingexpense and was $100,919,574 or $32.05 PMPM in 2020 and $48,401,624 or $16.19PMPM in 2019.
The decrease in nonoperating income of $6,536,436 between 2020 and 2019 is primarilyattributable to the decrease in investment and other income due to higher interest ratesand better market performance experienced in 2019 compared to 2020. We reportedinvestment and other income of $2,508,382 for 2020 or $0.80 PMPM and $6,725,511 or$2.25 PMPM in 2019. We reported no sale of assets in 2020, while in 2019 a gain of$2,225,369 was recognized from the sale of office building property.
We continued with provider quality incentive programs and reported expenses ofapproximately $5.7 million in 2020 to reward providers who demonstrate improvedHealthcare Effectiveness Data and Information (HEDIS) outcomes.
KHS Finance Committee Meeting, April 9, 2021
18 / 144

-5-
Operational Highlights: As part of fulfilling our mission while maintaining current operations, KHS engaged in the following activities during 2020:
Transitioned most of our employees to working from home, while maintaining or
improving operating metrics. Addressed employee hardships and did not reduce the workforce.
Continued to improve our Health Homes Programs in collaboration with our Safety Net Providers. In 2020, seven (7) health homes were in operation. We expanded the program with a distributive model location that focuses on high-risk pediatric members. The overall Health Homes focus is to develop an integrated care management model incorporating medical, behavioral, social and pharmacy programs.
Expanded the Transitional Care Program to reduce preventable hospital readmissions,
coordinate care, and address any unidentified needs during the post-acute discharge planning.
Expanded Telehealth Specialty Care services to be available for all appropriate services
that can be coordinated and completed virtually versus face-to-face interactions. Participated with a community-based organization network to coordinate resources to
address social determinants of health. Created a Population Health Management (PHM) program that addresses individuals’
health needs across the continuum of care using tailored health solutions. Implemented a Diabetes Prevention Program (DPP) focused on lifestyle change to
prevent members from developing diabetes. To successfully graduate from the program, members are required to attend 26 classes over the year, remain diabetes free, lose at least 5 percent of their weight, and achieve at least 150 minutes of physical activity each week. Due to the pandemic, the program was offered only virtually to a second cohort of eligible members.
Offered virtual asthma and nutrition classes.
Established a Chronic Obstructive Pulmonary Disease (“COPD”) management program
which includes interventions to assess and monitor disease, reduce risk factors, manage stable COPD, and manage exacerbations. KHS created a multi-disciplinary team which includes respiratory therapists, specialty/primary care providers, registered nurses, nutritionists, palliative support and home health agencies to provide services in the home and coordinate care for early diagnosis and treatment interventions to reduce Emergency Room, Urgent Care, and Inpatient admissions.
Implemented various strategies to increase utilization of preventative care to achieve the
revised HEDIS External Accountability Set (EAS) targeted goals for the new Managed Care Accountability Set (MCAS) measures. Such strategies include ongoing member and provider education, member outreach and use of provider and member incentives to encourage utilization of qualified preventative services under the Program.
Provided funding for Housing Case Management to afford KHS members an opportunity
to exit homelessness and receive safe, and affordable housing. The Housing Case Management services will be matched with a housing resource that already exists in the community, such as, short term rental assistance, housing choice vouchers, and low- income public housing.
KHS Finance Committee Meeting, April 9, 2021
19 / 144

-6-
Continued grant funds to public school sites in Kern County to Implement SchoolWellness Programs during the 2020-2021 academic year. The School WellnessPrograms target student nutrition, physical activity, water consumption, outdoor safety,and social and emotional learning.
Administered several Alternative Payment Methodologies (“APM”) within providercontracts that focus on quality care coordination and cost reduction strategies. Also,developed APM’s for providers to encourage patients to return to their doctor fromvolume fall off caused by the State’s stay as home order during the height of thepandemic.
Purchased an Interoperability system to ensure compliance with the CMS InteroperabilityRule to allow members to retrieve from their health plan’s their medical information,claims information, pharmacy and laboratory information. As adoption of this real-timedata exchange increases and evolves, providers and members will have a sound methodof obtaining historical clinical information to ensure better health outcomes.
Enhanced business continuity and disaster recovery systems and protocols afterexecuting the Program due to COVID-19 which resulted in successfully shifting 95% ofemployees to a home-based work environment within a week’s time. The company’soperations continued without interruption.
Created a technical solution to continuously without interruption, stream data to thecompany’s large data processing systems, business reporting systems, third partyvendors (e.g. Vision, Pharmacy, etc.), and contracted providers. This system will assistthe IT department to proactively monitor the hundreds of data delivery and transformationjobs.
Continued to make significant improvements to our thirteen-year-old Enterprise DataWarehouse (EDW). This centralized data repository houses data representing severaladministrative areas including case management, health education, quality improvementmeasures, claims, pharmacy, lab results, vision, 24-hour nurse hotline, transportation,telephonic communication, and more. KHS uses this EDW to manage employees,provide predictive analytics and utilization anomalies on member’s health, show internaloperation’s reporting and analytics, and forecast plan financials.
Contributed over $140,000 to support 4 COVID-19 testing sites in Kern County.
Donated $100,000 to the Kern Community Foundation’s “Kern County COVID-19 ReliefFund” to support local nonprofits serving vulnerable populations with basic needs. Ninelocal organizations benefitted from this funding.
Donated approximately $186,000 to 68 different community-based organizations. Sincethese organizations serve many of the same constituents, many of our members willreceive assistance from these community partners.
Adapted our hiring processes to interview, hire and bring onboard employees virtually tomeet the organization’s staffing needs. Additionally, we were able to convert ourclassroom training programs to virtual training programs while meeting all compliancetraining requirements.
Corporate facility was successfully certified as a Leadership in Energy and EnvironmentalDesign (LEED) Silver building.
KHS Finance Committee Meeting, April 9, 2021
20 / 144

-7-
Project Management Department at KHS was recognized by the Project ManagementInstitute as one of the top 3 organizations for bringing added value through the support ofsuccessful strategic initiatives and demonstrating superior organizational projectmanagement capabilities.
Using this Annual Report
Our financial statements consist of three statements: the Statements of Net Position, the Statements of Revenues, Expenses and Changes in Net Position; and the Statements of Cash Flows. These financial statements and related notes provide information about the activities of KHS.
The Statements of Net Position and Statements of Revenues, Expenses and Changes in Net Position
One of the most important questions asked about our finances is, “Is KHS as a whole better or worse off as a result of the year’s activities?” The Statements of Net Position and the Statements of Revenues, Expenses, and Changes in Net Position report information about our resources and activities in a way that helps answer this question. These statements include all restricted and unrestricted assets and all liabilities using the accrual basis of accounting. All of the current year’s revenues and expenses are taken into account regardless of when cash is received or paid. These two statements report our net positionand changes in it. Our net position, the difference between the assets and liabilities, is one way to measure our financial health. Over time, increases or decreases in net position indicate whether our financial health is improving or deteriorating. Non-financial factors, however, such as changes in member base and measures of the quality of service to members should be considered in evaluating the overall health of KHS.
The Statements of Cash Flows
The final required statement is the Statement of Cash Flows. The statement reports cash receipts, cashpayments, and net changes in cash resulting from operations, investing, and financing activities. It provides answers to such questions as “Where did cash come from?” “What was cash used for?” and “What was the change in cash balance during the reporting period?”
KHS Finance Committee Meeting, April 9, 2021
21 / 144

-8-
Condensed Financial Information
Statements of Net Position
KHS’ net position is the difference between its assets and deferred outflows of resources, and liabilities and deferred inflows of resources, as reported in the Statement of Net Position. Our net position increased in 2020 and 2019 by $12,393,808 and $13,061,405, respectively. Our Statements of Net Position as of December 31, 2020, 2019, and 2018 are as follows:
2020 2019 2018
AssetsHospital directed payments receivable 195,667,272 $ 237,559,106 $ -$ Other current assets 346,708,391 319,732,289 327,383,667 Capital assets, net 68,655,076 69,786,809 55,937,228 Other assets 5,527,956 1,043,644 1,004,750
Total Assets 616,558,695 $ 628,121,848 $ 384,325,645$
Deferred Outflows of Resources 3,018,341 $ 2,889,179 $ 2,657,573$
LiabilitiesAccrued medical expenses payable 153,291,888 $ 161,392,611 $ 142,516,255$ Hospital directed payments payable 195,667,272 237,317,695 - Accrued expenses 35,012,634 10,149,451 36,606,228 Net pension liability 8,432,377 7,038,233 5,865,463
Total Liabilities 392,404,171 $ 415,897,990 $ 184,987,946$
Deferred Inflows of Resources 86,684 $ 420,664 $ 364,304$
Net PositionNet investment in capital assets 68,655,076 $ 69,786,809$ 55,937,228$ Restricted 300,000 300,000 300,000 Unrestricted 158,131,105 144,605,564 145,393,740
Total Net Position 227,086,181 $ 214,692,373 $ 201,630,968$
KHS’ net position for 2020, 2019, and 2018 exceeded all regulatory requirements for Tangible Net Equity (TNE).
KHS Finance Committee Meeting, April 9, 2021
22 / 144

-9-
Statements of Revenues, Expenses and Changes in Net Position Operating results and changes in our net position show an increase in net position of $12,393,808 and $13,061,405 for the years ended December 31, 2020 and 2019, respectively. The increases are made up of various components as outlined below:
2020 2019 2018 2020 2019 2018Enrollment
Total member months 3,266,674 3,093,144 3,047,435 Less non-risk capitated member months (118,205) (103,876) (99,006)
Net member months 3,148,469 2,989,268 2,948,429 Average monthly members 262,372 249,106 245,702
Operating RevenuePremiums earned 934,262,033 $ 819,211,480 $ 790,046,475 $ 296.74 $ 274.05 $ 267.96 $ Hospital directed payments
earned 56,137,431 300,291,112 - 17.83 100.46 - Other operating revenue 261,987 289,296 1,859,982 0.08 0.10 0.63
Total operating revenue 990,661,451 1,119,791,888 791,906,457 314.65 374.61 268.59
Operating ExpensesMedical and hospital 768,324,559 717,600,716 652,587,721 244.03 240.06 221.33 MCO premium tax 100,919,574 48,401,624 94,216,985 32.06 16.19 31.95 Hospital directed payments 55,897,946 299,923,121 - 17.75 100.33 - Administrative 46,280,714 43,026,853 35,094,430 14.70 14.39 11.90 Depreciation 5,034,208 2,503,963 1,530,726 1.60 0.84 0.52
Total operating expenses 976,457,001 1,111,456,277 783,429,862 310.14 371.81 265.70
Operating income 14,204,450 8,335,611 8,476,595 4.51 2.80 2.89
Nonoperating Revenue (Expenses)Investment and other income 2,508,382 6,725,511 4,979,510 0.80 2.25 1.69 Gain on sale of assets - 2,225,369 - - 0.74 - Community grants (4,319,024) (4,225,086) (2,366,956) (1.37) (1.41) (0.80)
Total nonoperating revenue(expenses) (1,810,642) 4,725,794 2,612,554 (0.57) 1.58 0.89
Changes in net position 12,393,808 13,061,405 11,089,149 3.94 4.38 3.78
Net position, beginning 214,692,373 201,630,968 190,541,819 68.19 67.45 64.62 Net position, ending 227,086,181 $ 214,692,373 $ 201,630,968 $ 72.12 $ 71.83 $ 68.40 $
Per Member Per Month in Dollars
Operating Income The first component of the overall change in net position is our operating income. This is the difference between the premiums earned and the cost of medical services. We earned operating income for the years ended December 31, 2020 and 2019 of $14,204,450 and $8,335,611, respectively.
KHS Finance Committee Meeting, April 9, 2021
23 / 144

-10-
The primary components of the operating income for 2020 are:
Premiums earned increased $115,050,553 or $22.68 PMPM in 2020 from 2019.Approximately $55.3 million or $6.12 PMPM is attributed to an increase in premiumcapitation due primarily to membership increases in 2020 from 2019. Approximately$50.4 million or $15.20 PMPM is due to increased MCO premiums received due to a fullyear of MCO tax premiums received in 2020 verses 6 months of MCO tax premiumsreceived in 2019. Approximately $15.4 million or $4.11 PMPM is attributed to anincrease in Proposition 56 rates and the introduction of new Proposition 56 programsbetween 2020 and 2019.
The Medi-Cal average monthly membership increased by approximately 13,300members or 5.3% over 2019.
The medical and hospital services costs increased by $50,723,843 and $3.97 PMPMbetween 2020 and 2019. This increase is attributed to increased supplemental providerpayments payable under Proposition 56, increased utilization of medical services such asinpatient hospital services, provider contract rate increases, and new programs aimed atassisting members and providers in response to the pandemic. The Medical Loss ratiowas 92.0% in 2020 and 93.1% in 2019.
Administrative expenses increased by $3,253,861 or $0.31 PMPM over 2019 which isattributed to the increase in salaries and benefits for additional staff needed to meet theneeds of the organization and regulatory requirements in 2020 and retirementcontribution expense adjustments recognized under GASB 68 reporting requirements.Administrative expense as a percentage of total Operating Revenue (excluding MCO taxrevenue and Hospital directed payments earned) was 5.53% in 2020 compared to 5.58%in 2019.
Nonoperating Revenues and Expenses
Nonoperating revenues and expenses consisted primarily of investment income, proceeds from the saleof assets and community grants. In 2020, Investment and Other Income earned was $2,508,382 or $0.80 PMPM which helped offset Community Grant Expense of $4,319,024 or $1.37 PMPM.
KHS’ Cash Flow
Changes in KHS’ cash flows are consistent with changes in operating income and nonoperating revenues and expenses and are reflective of timing differences pertaining to payment of accrued medical services and paid rates.
General Economic and Political Environment Factors
Our continued growth may be affected by a variety of factors, including macro-economic conditions and enacted health care reforms that could affect our results of operations. Our operations depend primarily on the continuation of our contract with and funding by the State for the Two-Plan Model of the Medi-Cal Managed Care Program. We believe that the State and Federal Governments are committed to keeping these programs in place, but they will continue to look for budgetary savings through reductions in health care costs.
KHS Finance Committee Meeting, April 9, 2021
24 / 144

-11-
Contacting KHS’ Financial Management This financial report is designed to provide our members, providers, suppliers, regulatory agencies, taxpayers, and creditors with a general overview of KHS’ finances and show KHS’ accountability for the money it receives. If you have questions about this report or need additional financial information please contact Robert Landis, CFO, Kern Health Systems, at 2900 Buck Owen Blvd, Bakersfield, California 93308.
KHS Finance Committee Meeting, April 9, 2021
25 / 144

-12-
KERN HEALTH SYSTEMS
STATEMENTS OF NET POSITIONDecember 31, 2020 and 2019
2020 2019
ASSETS AND DEFERRED OUTFLOWS OF RESOURCES
Current AssetsCash and cash equivalents (Note 2) 74,866,934 $ 92,405,797$ Investments (Notes 2 and 3) 169,078,187 111,853,223 Premiums receivable 97,593,440 111,563,581 Hospital directed payments receivable (Note 4) 195,667,272 237,559,106 Other receivables (Note 5) 1,111,072 1,218,611 Prepaid expenses 2,223,252 2,691,077 Current portion of provider advances (Note 6) 1,835,506 -
Total current assets 542,375,663 557,291,395
Capital Assets (Note 7)Land 4,090,706 4,090,706 Buildings and improvements 36,482,174 36,471,386 Furniture and equipment 32,109,350 31,706,810 Capital projects in process 12,183,359 8,743,952
84,865,589 81,012,854 Less accumulated depreciation 16,210,513 11,226,045
68,655,076 69,786,809
Other AssetsRestricted investments (Notes 2, 3 and 11) 300,000 300,000 Provider advances, less current portion (Note 6) 3,671,012 - Split dollar life insurance (Note 8) 1,556,944 743,644
5,527,956 1,043,644 Total assets 616,558,695 628,121,848
Deferred Outflows of Resources (Note 12) 3,018,341 2,889,179 Total assets and deferred outflows of resources 619,577,036 $ 631,011,027$
See Notes to Financial Statements.
KHS Finance Committee Meeting, April 9, 2021
26 / 144

2020 2019
LIABILITIES, DEFERRED INFLOWS OF RESOURCES AND NET POSITION
Current LiabilitiesAccrued medical expenses payable (Note 9) 153,291,888 $ 161,392,611$ Hospital directed payments payable (Note 4) 195,667,272 237,317,695 Accrued expenses (Note 10) 35,012,634 10,149,451
Total current liabilities 383,971,794 408,859,757
Noncurrent LiabilitiesNet pension liability (Note 12) 8,432,377 7,038,233
Commitments and Contingencies (Note 14)
Deferred Inflows of Resources (Note 12) 86,684 420,664
Net PositionNet investment in capital assets 68,655,076 69,786,809 Restricted (Note 11) 300,000 300,000 Unrestricted 158,131,105 144,605,564
Total net position 227,086,181 214,692,373
Total liabilities, deferred inflows of resources and net position 619,577,036 $ 631,011,027$
KHS Finance Committee Meeting, April 9, 2021
27 / 144

-13-
KERN HEALTH SYSTEMS
STATEMENTS OF REVENUES, EXPENSES AND CHANGES IN NET POSITIONYears Ended December 31, 2020 and 2019
2020 2019
Operating RevenuePremiums earned 934,262,033 $ 819,211,480$ Hospital directed payments earned (Note 4) 56,137,431 300,291,112 Stop-loss insurance recoveries (Note 13) 261,987 289,296
Total operating revenue 990,661,451 1,119,791,888
Operating ExpensesMedical and hospital 768,324,559 717,600,716 MCO premium tax 100,919,574 48,401,624 Hospital directed payments (Note 4) 55,897,946 299,923,121 Administrative 46,280,714 43,026,853 Depreciation 5,034,208 2,503,963
Total operating expenses 976,457,001 1,111,456,277 Operating income 14,204,450 8,335,611
Nonoperating Revenue (Expenses)Investment and other income 2,508,382 6,725,511 Gain on sale of office building property - 2,225,369 Community grants (4,319,024) (4,225,086)
Total nonoperating revenue (expenses) (1,810,642) 4,725,794
Change in net position 12,393,808 13,061,405
Net position, beginning 214,692,373 201,630,968 Net position, ending 227,086,181 $ 214,692,373$
See Notes to Financial Statements.
KHS Finance Committee Meeting, April 9, 2021
28 / 144

-14-
KERN HEALTH SYSTEMS
STATEMENTS OF CASH FLOWSYears Ended December 31, 2020 and 2019
2020 2019
Cash Flows From Operating ActivitiesPremiums received 948,203,837 $ 800,639,919$ Hospital directed payments earned 98,029,265 62,732,006 Stop-loss insurance recoveries 261,987 557,269 Medical and hospital payments (776,425,282) (700,904,511) Hospital directed payments paid (97,548,369) (62,605,426) Administrative expenses paid (46,855,627) (44,826,477) MCO premium tax expense paid (74,205,406) (72,791,260)
Net cash provided by (used in) operating activities 51,460,405 (17,198,480)
Cash Flows From Noncapital Financing ActivitiesCommunity grants (4,319,024) (4,225,086) Nonoperating income 249,340 2,469,639
Net cash (used in) noncapital financing activities (4,069,684) (1,755,447)
Cash Flows From Capital And Related Financing ActivitiesAcquisition of capital assets (3,902,475) (23,325,925) Proceeds from sale of assets - 9,197,750
Net cash (used in) capital and related financing activities (3,902,475) (14,128,175)
Cash Flows From Investing ActivitiesNet purchases of investments (1,918,586,630) (1,864,329,645) Proceeds from maturities of investments 1,863,879,339 1,899,061,241 Disbursements made on provider advances (5,746,518) - Payments received on provider advances 240,000 - Payment for split dollar life insurance (813,300) (38,894)
Net cash provided by (used in ) investing activities (61,027,109) 34,692,702
Net increase (decrease) in cash and cash equivalents (17,538,863) 1,610,600
Cash and cash equivalents:Beginning 92,405,797 90,795,197 Ending 74,866,934 $ 92,405,797$
See Notes to Financial Statements.
KHS Finance Committee Meeting, April 9, 2021
29 / 144

2020 2019
Reconciliation of operating activities to net cashprovided by (used in) operating activities
Operating income 14,204,450 $ 8,335,611 $ Adjustments to reconcile operating income to net cash
provided by (used in) operating activities:Depreciation 5,034,208 2,503,963 (Gain) loss on sale of assets - (2,225,369) Changes in:
Deferred outflows of resources (129,162) (231,606) Net pension liability 1,394,144 1,172,770 Deferred inflows of resources (333,980) 56,360
Changes in working capital components:(Increase) decrease in:
Premiums receivable and other receivables 13,819,049 (17,989,161) Hospital directed payments receivable 41,891,834 (237,559,106) Prepaid expenses 467,825 (999,216)
Increase (decrease) in:Accrued medical services payable (8,100,723) 18,876,356 Hospital directed payments payable (41,650,423) 237,317,695 Accrued expenses 24,863,183 (26,456,777) Net cash provided by (used in) operating activities 51,460,405 $ (17,198,480) $
KHS Finance Committee Meeting, April 9, 2021
30 / 144

KERN HEALTH SYSTEMS
NOTES TO FINANCIAL STATEMENTS
-15-
Note 1. Nature of Activities and Summary of Significant Accounting Policies
Nature of activities: Kern Health Systems (KHS) was originally formed on August 17, 1993, as a non-profit public benefit corporation. It was later dissolved and converted into a County health authority for the purposeof establishing and operating a comprehensive managed care system to provide health care services; to meet the health care needs of low-income families and individuals in the County of Kern; to demonstrate ways of promoting quality care and cost efficiency; to negotiate and enter into contracts authorized by Welfare and Institutions Code Section 14087.3; to arrange for the provision of health care services provided pursuant to Chapter 7, of Part 3, of Division 9 (commencing with Section 14000) of the Welfare and Institutions Code; and to do all things reasonably related or incidental to those purposes. On December 6, 1994, the County of Kern Board of Supervisors enacted Chapter 2.94 of the Ordinance Code, creating KHS as the County health authority.
Global pandemic: On January 30, 2020 the World Health Organization declared the coronavirus outbreak a “Public Health Emergency of International Concern” and by March 10, 2020 declared it to be a pandemic. Actions taken around the world to help mitigate the spread of the coronavirus (aka COVID-19) include restrictions on travel, and quarantines in certain areas, and forced closures for certain types of public places and businesses. The coronavirus and actions taken to mitigate it have had and are expected to continue to have an adverse impact on the economies and financial markets of many countries, including the geographical area in which KHS operates.
As COVID-19 is unprecedented, it is difficult to determine its impact to operations, its demand on health care and how it may ultimately affect KHS’ bottom line. Government decisions to shelter in place have reduced demand for routine care, while at the same time, demand has increased for other medical services, such as telehealth services and COVID-19 related hospital admissions.
Although utilization for routine care was curtailed during 2020, 2021 could bring a rebound in medical services from pent up demand from patients staying away from their doctor for fear of contracting thevirus in their offices. This increased demand for medical services could result in a significant increase in medical care costs and by extension, related provider claims payments.
KHS continues to assess the financial impact of the pandemic. Despite the challenges it brings to forecasting, KHS believes that KHS’ financial resources and particularly KHS’ cash flow position will be sufficient to withstand the financial effects of the pandemic for the foreseeable future.
A summary of KHS’ significant accounting policies follows:
Accounting policies: KHS uses the accrual basis of accounting. The accompanying financial statements have been prepared in accordance with the standards of the Governmental Accounting Standards Board (GASB). In addition, KHS follows the provisions of the American Institute of Certified Public Accountants Audit and Accounting Guide, Health Care Organizations.
Use of estimates: The preparation of financial statements in conformity with accounting principles generally accepted in the United States of America requires management to make estimates and assumptions that affect the reported amounts of assets and liabilities and disclosure of contingent assets and liabilities at the date of the financial statements and the reported amounts of revenues and expenses during the reporting period. Actual results could differ from those estimates. Significant estimates with respect to KHS’ financial statements include the various components of accrued medical services payable, the deferred outflows and inflows of resources, and the net pension liability.
Cash and cash equivalents: Cash and cash equivalents include highly liquid instruments with an original maturity of three months or less when purchased.
KHS Finance Committee Meeting, April 9, 2021
31 / 144

KERN HEALTH SYSTEMS
NOTES TO FINANCIAL STATEMENTS
-16-
Investment valuation and income recognition: Investments in marketable securities with readily determinable fair values and all investments in debt securities are reported at their fair values in the statements of net position. Fair value is the price that would be received to sell an asset or paid to transfer a liability in an orderly transaction between market participants at the measurement date. See Note 3 for further discussion of fair value measurements.
Capital assets: Capital assets are stated at cost. Depreciation is computed by the straight-line method over the estimated service lives of the related assets, which are as follows:
Years
Buildings and improvements 10-40 Furniture and equipment 3-5
KHS’ capitalization policy is to capitalize all items with a unit cost greater than $1,000 with the exception of computer software which has a per unit capitalization of $5,000 and an expected useful life of greater than one year. Items that do not meet KHS’ capitalization policy and that do not have a useful life of greater than one year are expensed in the period acquired.
Accrued compensated absences: KHS employees earn personal time off (PTO) on a bi-weekly or semi-monthly basis at various rates based on continuous years of service. Employees are allowed to accumulate up to three times their annual benefit rate before accruals cease. Unused PTO is carried forward intosubsequent years. Any unused accumulated balance will be paid to the employee upon separation of service. Compensated balances are accrued and recorded in accordance with GASB Codification Section C60.
Net position: The basic financial statements utilize a net position presentation. Net position is categorized as net investment in capital assets, restricted and unrestricted.
Net investment in capital assets consists of capital assets net of accumulated depreciation, reduced bythe current balance of any outstanding borrowings used to finance the purchase or construction ofthose assets.
Restricted net position is non-capital net position that must be used for a particular purpose, asspecified by regulators, creditors, grantors, or contributors external to KHS.
Unrestricted net position is the remaining net position that does not meet the definition of netinvestment in capital assets or restricted.
Operating revenues and expenses: KHS distinguishes operating revenues and expenses from nonoperatingitems. Operating revenues and expenses generally result from providing services and delivering services in connection with KHS’ principal ongoing operations. The principal operating revenues of KHS are premium revenue received from the California Department of Health Care Services (DHCS). Operating expenses include the cost of medical and hospital services provided to members and administrative expenses. All revenues and expenses not meeting this definition are reported as nonoperating revenues and expenses.
In 2013, KHS entered into a capitated agreement required by the DHCS with another Health Plan which allows for that plan to provide health care services for their assigned members. As KHS had no obligation to provide care for this population, the Premiums earned amount included as part of operating revenue is reported net of the capitated expense associated with assigned members. Capitated expense was $25 million for 10,909 members assigned for the year ended December 31, 2020 and was $21.6 million for 9,007 members assigned for the year ended December 31, 2019.
KHS Finance Committee Meeting, April 9, 2021
32 / 144

KERN HEALTH SYSTEMS
NOTES TO FINANCIAL STATEMENTS
-17-
Premiums revenue: Premiums are due monthly from DHCS and are recognized as revenues during the period in which KHS is obligated to arrange payments for manage health care services provided to KHS members. CMS requires that the rates used in KHS’ premiums are to be actuarially sound. Premium revenue is fixed in advance of the periods covered on a per member per month (PMPM) basis and are generally not subject to significant accounting estimates. Premium payments received from DHCS are based on an eligibility list produced by DHCS. Premium payments are required to be returned if DHCS later discovers that the eligibility list contains individuals who were not eligible. KHS’ PMPM rates are typically adjusted annually. KHS receives additional premium revenue in the form of a “maternity kick payment” which is a one-time payment for the delivery of a child. For the years ended December 31, 2020 and 2019 maternity kick payments in the amount of $31.8 million or 3.4% and $32 million or 3.9%, respectively, of total premium revenue were recognized. KHS also receives premium revenue in the form of a “Hepatitis C kick payment” based on the utilization of certain classes of Hepatitis C drugs prescribed. For the years ended December 31, 2020 and 2019 Hepatitis C payments in the amount of $4.9 million or 0.5% and $6.9 million or 0.8%, respectively, of total premium revenue were recognized. KHS also receives premium revenue in the form of a “Behavioral Health Treatment kick payment” based on the utilization by its members diagnosed with specific Autism criteria. For the years ended December 31, 2020 and 2019 Behavioral Health Treatment payments in the amount of $11.7 million or 1.3% and $11.3 million or 1.4%, respectively, of total premium revenue were recognized. On July 1, 2019, DHCS added as a covered benefit services provided under the Health Homes Program. The Health Homes Program is a program designed to provide enhanced care management and coordination of services for eligible Medi-Cal beneficiaries with complex medical needs and chronic conditions. KHS also receives premium revenue in the form of a “Health Homes Program kick payment” based on utilization of qualifying services by members enrolled in the Health Homes Program. For the years ended December 31, 2020 and 2019, Health Homes Program payments in the amount of $10.6 million or 1.1% and $5.7 million or 0.7%, respectively, oftotal premium revenue were recognized.
KHS receives supplemental revenue funded by the California Healthcare, Research and Prevention Tobacco Tax Act of 2016 (Proposition 56) for the purpose of paying additional amounts for qualifying physician services based on certain specified eligible CPT procedure codes. For the years ended December 31, 2020 and 2019 Proposition 56 payments in the amount of $64.0 million or 6.9% and $45.9 million or 5.6%, respectively, of total premium revenue were recognized. KHS also receives supplemental Ground Emergency Medical Transportation (GEMT) revenue provided to for the purpose of paying additional amounts to qualifying GEMT providers based on certain specified eligible CPT procedure codes. For the years ended December 31, 2020 and 2019 GEMT payments in the amount of $5.7 million or 0.6% and $8 million or 1.0% respectively, of total premium revenue were recognized.
Premiums are also subject to prior year retroactive rate adjustments based on actual and expected healthcare costs and are recognized when known in the current year. For the years ended December 31, 2020 and 2019 KHS recognized a net reduction of $2.2 million or 0.24% and $4.2 million or 0.5%, respectively, ofpremium revenue as a result of retroactive rate adjustments.
KHS’ premiums may be periodically amended to include or exclude certain health benefits such as pharmacy and behavioral health services or introduce new programs such as the services provided under the HealthHome Program. Premium rates can also be amended to include supplemental payments for providers, such as those paid under Proposition 56 or GEMT, or to cover a new population of members such as seniors and persons with disabilities (SPD) or expansion members.
KHS Finance Committee Meeting, April 9, 2021
33 / 144

KERN HEALTH SYSTEMS NOTES TO FINANCIAL STATEMENTS
-18-
Health care service cost recognition: KHS contracts with various health care providers for the provision of certain medical care services to its members. The provider network consists of primary and specialty care physicians, hospitals, ancillary providers and pharmacies. KHS compensates most of these providers on a fee for services basis. Under fee for service arrangements, KHS retains the financial responsibility for medical care provided along with the costs incurred based on the actual utilization of services. The cost of health care services provided but unpaid is accrued in the period in which it is provided to a member based in part on estimates, including an accrual for medical services provided but not reported to KHS. KHS also includes certain medically-related administrative costs such as preventative health and wellness, care management, and other quality improvement costs under medical care services. KHS funds a provider performance quality incentive pool on a per member per month basis (PMPM). Provider participation is based on the similar Healthcare Effectiveness Data and Information Set (HEDIS) scores that DHCS uses to measure KHS in determining member assignment. KHS determines the level of provider participation based on HEDIS scores, with any remaining funds in the pool allocated to the following year incentive pool, community grants, or other quality improvement projects. Additionally, for the years ended December 31, 2020 and 2019, KHS recognized $1.4 million and $2.0 million, respectively, in pharmacy rebates from its pharmacy benefit manager that were received from pharmaceutical manufacturers which have been subtracted from pharmacy expense amounts. Income taxes: KHS is exempt from Federal and State income taxes pursuant to Internal Revenue Code (IRC) Section 115 and similar provisions of the California Franchise Tax Code and is also exempt from Federal and State income tax filing requirements. Managed Care Organization Premium taxes: In 2009 California enacted the Managed Care Organization (MCO) tax under Senate Bill 78 (SB 78). Effective July 1, 2013, under Assembly Bill 1422 (AB 1422), the MCO tax rate was increased to 3.9375% and payable to the California State Board of Equalization. Premium taxes were assessed based on the premium revenue collected. Beginning July 1, 2016, under Senate Bill X2-2, the MCO tax rate is payable to DHCS on a quarterly basis based on projected annual membership. MCO Tax Revenue is received from DHCS monthly based on actual membership on a per member per month fixed dollar amount. This change in MCO tax methodology puts KHS at risk if the assumed membership used in the calculated tax expense is different than the actual membership KHS experiences during the rate year. The premium revenues received include the premium tax assessment. These amounts are reported on a gross basis and are included in total operating revenues with the MCO tax expense presented separate from all other medical and administrative expense. Due to a delayed effective date in federal approval by CMS of the extension of the MCO tax program, there was no MCO tax assessment for the period July 1, 2019 through December 31,2019. The MCO tax program resumed January 1, 2020. Risk management: KHS is exposed to various risks of loss from Health Insurance Portability and Accountability Act (HIPAA) violations; data breaches from cyber-attacks; torts; theft of, damage to, and destruction of assets; business interruption; errors and omissions; employee injuries and illnesses; natural disasters; and employee health, dental, and accident benefits. Commercial insurance coverage is purchased for claims arising from such matters. Pass-through funding from DHCS: During the years ended December 31, 2020 and 2019, KHS received $77.8 million and $119.6 million, respectively, of supplemental fee revenue from DHCS. KHS passes these funds through to the designated hospitals and providers. This amount is not reflected in the statements of revenues, expenses and changes in net position for the years ended December 31, 2020 and 2019, as this pass-through amount does not meet the requirements for revenue recognition under Government Accounting Standards. Advertising: KHS expenses advertising costs as they are incurred. Advertising expense totaled $563,045 and $602,591 for the years ended December 31, 2020 and 2019, respectively. Subsequent events: KHS has evaluated subsequent events through March 30, 2021, the date on which the financial statements were available to be issued. There were no material subsequent events identified by management which would require disclosure in the financial statements.
KHS Finance Committee Meeting, April 9, 2021
34 / 144

KERN HEALTH SYSTEMS
NOTES TO FINANCIAL STATEMENTS
-19-
Authoritative pronouncements not yet adopted: The following statements issued by the Governmental Accounting Standards Board (GASB) are effective for years ending after December 31, 2020 and management is evaluating the impact of the implementation of these statements on their financial statements.
• In June 2017, the GASB issued Statement No. 87, Leases. The objective of this Statement is to bettermeet the information needs of financial statement users by improving accounting and financialreporting for leases by governments. This Statement increases the usefulness of governments’financial statements by requiring recognition of certain lease assets and liabilities for leases thatpreviously were classified as operating leases and recognized as inflows of resources or outflows ofresources based on the payment provisions of the contract. It establishes a single model for leaseaccounting based on the foundational principle that leases are financings of the right to use anunderlying asset. Under this Statement, a lessee is required to recognize a lease liability and anintangible right-to-use lease asset, and a lessor is required to recognize a lease receivable and adeferred inflow of resources, thereby enhancing the relevance and consistency of information aboutgovernments’ leasing activities.
The requirements of this Statement are effective for reporting periods beginning after December 15,2021. Early application is encouraged
• In June 2018, the GASB issued Statement No. 89, Accounting for Interest Cost Incurred Before theEnd of a Construction Period. The objectives of this Statement are (1) to enhance the relevance andcomparability of information about capital assets and the cost of borrowing for a reporting period and(2) to simplify accounting for interest cost incurred before the end of a construction period. ThisStatement requires that interest cost incurred before the end of a construction period be recognized asan expense in the period in which the cost is incurred for financial statements prepared using theeconomic resources measurement focus. As a result, interest cost incurred before the end of aconstruction period will not be included in the historical cost of a capital asset reported in a business-type activity or enterprise fund. This Statement also reiterates that in financial statements preparedusing the current financial resources measurement focus, interest cost incurred before the end of aconstruction period should be recognized as an expenditure on a basis consistent with governmentalfund accounting principles.
The requirements of this Statement are effective for reporting periods beginning after December15, 2020.
KHS Finance Committee Meeting, April 9, 2021
35 / 144

KERN HEALTH SYSTEMS NOTES TO FINANCIAL STATEMENTS
-20-
Note 2. Cash, Cash Equivalents and Investments Cash, cash equivalents and investments at December 31, 2020 are classified in the accompanying financial statements as follows:
Cash and cash equivalents:Deposits 2,742,282 $ LAIF and money market funds 72,124,452 Cash on hand 200
Total cash and cash equivalents 74,866,934 $
Cost Fair ValueInvestments:
Unrestricted:Certificates of deposit 199,800 $ 200,277 $ Corporate bonds and notes 43,710,165 44,062,458 Municipal bonds and notes 2,447,923 2,502,459 Government agency bonds and notes 122,292,012 122,312,993 Total unrestricted 168,649,900 169,078,187
Restricted:Certificates of deposit 300,000 300,000
Total investments 168,949,900 $ 169,378,187 $
Cash, cash equivalents and investments at December 31, 2019 are classified in the accompanying financial statements as follows:
Cash and cash equivalents:Deposits 2,190,589 $ LAIF and money market funds 90,215,008 Cash on hand 200
Total cash and cash equivalents 92,405,797 $
Cost Fair ValueInvestments:
Unrestricted:Certificates of deposit 2,413,034 $ 2,431,405 $ Corporate bonds and notes 34,145,239 34,524,090 Municipal bonds and notes 2,452,248 2,486,915 Government agency bonds and notes 72,290,162 72,410,813 Total unrestricted 111,300,683 111,853,223
Restricted:Certificates of deposit 300,000 300,000
Total investments 111,600,683 $ 112,153,223 $
KHS Finance Committee Meeting, April 9, 2021
36 / 144

KERN HEALTH SYSTEMS
NOTES TO FINANCIAL STATEMENTS
-21-
Investments are principally held in debt securities and are classified as current assets without regard to the securities’ contractual dates because they may be readily liquidated. The securities are recorded at fair value with unrealized gains and losses, if any, recorded on a quarterly basis.
Deposits are carried at cost plus accrued interest. The bank balances are protected by a combination of FDIC insurance and the bank’s collateral pool, in accordance with California Government Code.
Investments Authorized by KHS’ Investment Policy
The investment portfolio is managed by KHS’ Chief Financial Officer (CFO) to meet the short and long-term obligations of the business while maintaining liquidity and financial flexibility. Investments managed by the CFO are invested in accordance with KHS’ investment policy and are reviewed by the KHS Board of Directors and the KHS Finance Committee quarterly. The investment policy stipulates the following order of investment objectives:
• Preservation of principal• Liquidity• Yield
Permitted investments are subject to a maximum maturity of five years. The investment portfolio is designed to attain a market-average rate of return through economic cycles given an acceptable level of risk. Additionally, under the supervision of the CFO, a portion of the investment portfolio is managed by an investment manager that adheres to the KHS investment policy.
The table below identifies the cash equivalent and investment types that are authorized by the KHS investment policy.
Maximum Maximum Allowed or Authorized Maximum Percentage Investment of Portfolio Maximum
Investment Type Maturity Of Portfolio of One Issuer Ratings
U.S. Treasury Obligations 5 years 100% None Not RatedFederal Agencies and U.S. Government
Enterprises 5 years 100% 35% Not RatedState of California and Local Agency
Obligations 5 years 100% 5% A-1State and Local Agency Obligations
outside of California 5 years 20% 5% A-1Banker's Acceptances 180 days 40% (1) A-1Commercial Paper 270 days 25% (2) A-1Negotiable Certificates of Deposit 5 years 30% 5% (7) A-1Government Repurchase Agreements 1 year 100% (3) A-1Corporate Debt Securities 5 years 40% (5) AMoney Market Funds 5 years 40% (4) AAAMortgage or Asset-Backed Securities 5 years 20% (6) AAAVariable and Floating Rate Securities 5 years 30% 5% AAALocal Agency Investment Fund (LAIF) 5 years 50% 5% Not Rated
(1) May not exceed the 5% limit of any one commercial bank and may not exceed the 5% limit for any security on any bank.
KHS Finance Committee Meeting, April 9, 2021
37 / 144

KERN HEALTH SYSTEMS
NOTES TO FINANCIAL STATEMENTS
-22-
(2) May not exceed more than 10% of the outstanding commercial paper of the issuing corporation.
(3) May not exceed 50% if maturity is less than or equal to 7 days; 25% if maturity is greater than 7 days.
(4) May not exceed more than 5% of the money market fund’s assets.
(5) Medium-term notes or other corporate security of any one corporate issuer must not exceed more than 5% of the portfolio or 5% of the issue size of the corporate security.
(6) Rated AAA by a nationally recognized rating service and issued by an issuer having an A or better rating for its long-term debt.
(7) Maturities greater than one year and less than five years may not exceed the FDIC Insurance maximum at the time of purchase.
Disclosures Relating to Interest Rate Risk
Interest rate risk is the risk that changes in market interest rates will adversely affect the fair value of an investment. The longer the maturity of an investment, the greater the sensitivity of its fair value to changes in the market interest rates. Generally, investments will decrease in value if interest rates increase.
Disclosures Relating to Credit Risk
Generally, credit risk is the risk that an issuer of an investment will not fulfill its obligation to the holder of the investment. This is measured by the assignment of a rating by a nationally recognized statistical rating organization. KHS is required to disclose the rating for all investments. Cash invested in the Local Agency Investment Fund (LAIF) is considered “exempt from disclosure” under GASB Codification Section 150.
GASB Codification Section 150 requires disclosure of any investments of any single issuer in excess of 5% of its total investments, excluding investments issued or explicitly guaranteed by the U.S. government and investments in mutual funds, external investment pools, and other pooled investments. There wereno investments of any single issuer that exceeded 5% of its total investments as of December 31, 2020 or 2019.
Custodial Credit Risk
Custodial credit risk for deposits is the risk that, in the event of the failure of a depository financial institution, KHS will not be able to recover its deposits or not be able to recover collateral securities that are in the possession of an outside party. The custodial credit risk for investments is the risk that, in the event of the failure of the counterparty (e.g., broker-dealer) to a transaction, KHS will not be able torecover the value of its investment or collateral securities that are in the possession of another party. The California Government Code and KHS’ investment policy do not contain legal or policy requirements that would limit the exposure to custodial credit risk for deposits or investments, other than the following provision for deposits: The California Government Code requires that a financial institution securedeposits made by state or local governmental units by pledging securities in an undivided collateral pool held by a depository regulated under state law (unless so waived by the governmental unit). The market value of the pledged securities in the collateral pool must equal at least 110% of the total amount deposited by the public agencies.
KHS Finance Committee Meeting, April 9, 2021
38 / 144

KERN HEALTH SYSTEMS NOTES TO FINANCIAL STATEMENTS
-23-
Cash Equivalents in State Investment Pool KHS is a voluntary participant in the Local Agency Investment Fund (LAIF) that is regulated by California Government Code Section 16429 under the oversight of the Treasurer of the State of California. The fair value of the District’s investment in this pool is reported in the accompanying financial statements at amounts based upon the District’s pro-rata share of the fair value provided by LAIF for the entire LAIF portfolio (in relation to be the amortized cost of that portfolio). The balance available for withdrawal is based on the accounting records maintained by LAIF, which are recorded on an amortized cost basis.
Note 3. Fair Value Measurements The framework for measuring fair value provides a fair value hierarchy that prioritizes the inputs to valuation techniques used to measure fair value. The hierarchy gives the highest priority to unadjusted quoted prices in active markets for identical assets or liabilities (Level 1) and the lowest priority to unobservable inputs (Level 3). The three levels of the fair value hierarchy under ASC 820 are described below:
Level 1 Inputs to the valuation methodology are unadjusted quoted prices for identical assets or liabilities in active markets that KHS has the ability to access.
Level 2 Inputs to the valuation methodology include:
Quoted prices for similar assets or liabilities in active markets; Quoted prices for identical or similar assets or liabilities in inactive
markets; Inputs other than quoted prices that are observable for the asset or
liability; Inputs that are derived principally from or corroborated by observable
market data by correlation or other means. If the asset or liability has a specified (contractual) term, the Level 2 input must be observable for substantially the full term of the asset or liability.
Level 3 Inputs to the valuation methodology are unobservable and significant to the fair
value measurement. The asset’s or liability’s fair value measurement level within the fair value hierarchy is based on the lowest level of any input that is significant to the fair value measurement. Valuation techniques used need to maximize the use of observable inputs and minimize the use of unobservable inputs. Following is a description of the valuation methodologies used for assets measured at fair value. Certificates of deposit: Valued based on amortized cost or original cost-plus accrued interest. Corporate, Municipal and Government agency bonds and notes: Valued at the closing price reported on the active market on which the individual securities are traded. All investments held by KHS at December 31, 2020 and 2019 are level 1 assets.
KHS Finance Committee Meeting, April 9, 2021
39 / 144

KERN HEALTH SYSTEMS
NOTES TO FINANCIAL STATEMENTS
-24-
Note 4. Hospital Directed Payments
Beginning with the July 1, 2017, rating period, the Department of Health Care Services (DHCS) implemented two statewide directed payment programs for designated public hospitals (DPH), the Enhanced Payment Program (EPP) and the Quality Incentive Program (QIP), and one statewide directed payment program for private hospitals (PHDP). EPP provides supplemental reimbursement to Network Provider DPHs through uniform dollar increases for select inpatient and non-inpatient services, based on the actual utilization of qualifying services as reflected in encounter data reported to DHCS. QIP provides quality incentive payments to participating Network Provider DPHs that meet quality metrics designated in the program. PHDP provides supplemental reimbursement to participating Network Provider hospitals through uniform dollar increases for select inpatient and outpatient services based on actual utilization of qualifying services as reflected in encounter data reported to DHCS. The Hospital Directed Payment programs were created to maintain access and improve the quality of care for Medi-Cal beneficiaries. These programs direct Managed Care Plans (MCP), like KHS, to pay specified contracted Network Providers in accordance with terms approved by the Centers for Medicare & Medicaid Services (CMS) and directed by DHCS.
The projected value of the program payment obligations to designated hospitals are accounted for as medical expenses and paid through additional capitation revenue. Due to the timing of the program acceptance by CMS and delays in funding to MCPs, KHS retroactively accrued Hospital Directed Payments receivable of approximately $237.6 million and Hospital Directed payments payable of approximately $237.3 million reportedas of December 31, 2019. For the year ended December 31, 2020 KHS has accrued Hospital Directed Payments receivable of approximately $195.7 million and Hospital Directed Payments payable of approximately $195.7 million. The amount of additional premium revenue for Hospital Directed Payment programs recognized for the years ended December 31, 2020 and 2019 were approximately $56.1 million and $300.3 million, respectively, and are reported as part of operating revenues. Hospital Directed Payment expense obligations recognized for the years ended December 31, 2020 and 2019 were approximately $55.9million and $299.9 million, respectively, and are reported as part of operating expenses.
Note 5. Other Receivables
Other receivables consist of the following at December 31, 2020 and 2019:
2020 2019
Pharmacy rebates 510,000 $ 505,976$ Other 489,272 342,204 Interest 111,800 370,431
1,111,072 $ 1,218,611$
Note 6. Provider Advances
In April 2020 as part of the response to the COVID-19 pandemic and in an effort to support its network of providers of care for the more than 258,000 members served, KHS advanced $5.7 million under a COVID-19 Provider Financial Relief Program. Under the Program, provider advance payments wereoffered to select local network providers of up to 50% of their average 2019 monthly claim payments multiplied by three months. The no interest payment advances were aimed at providing financial assistance to those network providers experiencing financial hardships due to lower utilization of medical services as the result of the Governor’s shelter in place order. Monthly repayments of provider advances are due to begin in September 2021. In the event of a program payment default, KHS has the right to offset amounts owed by providers against any future monies owed to the provider. As of December 31, 2020, provider advances due to KHS totaled $5,506,518.
KHS Finance Committee Meeting, April 9, 2021
40 / 144

KERN HEALTH SYSTEMS
NOTES TO FINANCIAL STATEMENTS
-25-
Note 7. Capital Assets
Capital asset activity for the years ended December 31, 2020 and 2019 is as follows:
Balance BalanceJanuary 1, December 31,
2020 Additions Deletions 2020
Capital Assets Not Being Depreciated:Land 4,090,706 $ -$ -$ 4,090,706$ Capital Projects in Progress 8,743,952 3,439,407 - 12,183,359
Subtotal 12,834,658 3,439,407 - 16,274,065
Capital Assets Being Depreciated:Buildings and
Improvements 36,471,386 10,788 - 36,482,174 Furniture and Equipment 31,706,810 452,280 (49,740) 32,109,350
Subtotal 68,178,196 463,068 (49,740) 68,591,524
Accumulated Depreciation:Buildings and
Improvements 226,602 907,292 - 1,133,894 Furniture and Equipment 10,999,443 4,126,916 (49,740) 15,076,619
Subtotal 11,226,045 5,034,208 (49,740) 16,210,513 Net Depreciable
Capital Assets 56,952,151 (4,571,140) - 52,381,011 Total Capital Assets 69,786,809 $ (1,131,733) $ -$ 68,655,076$
Balance BalanceJanuary 1, December 31,
2019 Additions Deletions Transfers 2019
Capital Assets Not Being Depreciated:Land 4,876,562 $ -$ (785,856) $ -$ 4,090,706$ Capital Projects in Progress 34,609,177 21,429,480 - (47,294,705) 8,743,952
Subtotal 39,485,739 21,429,480 (785,856) (47,294,705) 12,834,658
Capital Assets Being Depreciated:Buildings and
Improvements 10,323,166 215,063 (10,323,166) 36,256,323 36,471,386 Furniture and Equipment 20,218,585 1,681,382 (1,231,539) 11,038,382 31,706,810
Subtotal 30,541,751 1,896,445 (11,554,705) 47,294,705 68,178,196
Accumulated Depreciation:Buildings and
Improvements 3,999,467 393,735 (4,166,600) - 226,602 Furniture and Equipment 10,090,795 2,110,228 (1,201,580) - 10,999,443
Subtotal 14,090,262 2,503,963 (5,368,180) - 11,226,045 Net Depreciable
Capital Assets 16,451,489 (607,518) (6,186,525) 47,294,705 56,952,151 Total Capital Assets 55,937,228 $ 20,821,962 $ (6,972,381) $ -$ 69,786,809$
KHS Finance Committee Meeting, April 9, 2021
41 / 144

KERN HEALTH SYSTEMS
NOTES TO FINANCIAL STATEMENTS
-26-
Note 8. Split Dollar Life Insurance
In October 2017, KHS entered into a split-dollar life insurance agreement with a key employee and his beneficiary, whereby the employee is eligible to receive distributions, and KHS will receive $774,526 uponthe death of the employee and his beneficiary or termination of the agreement. The policy had a cashsurrender value of $795,851 and $743,644 at December 31, 2020 and 2019, respectively.
In June 2020, KHS entered into a second split-dollar life insurance agreement with the same employeeand his beneficiary as the 2017 agreement, whereby the employee is eligible to receive distributions, and KHS will receive $847,832 upon the death of the employee and his beneficiary or termination of the agreement. The policy had a cash surrender value of $761,093 at December 31, 2020.
Note 9. Accrued Medical Expenses Payable
KHS accrues a liability of unpaid claims for medical services, including estimates of costs related to incurred but not yet reported (IBNR) claims using standard actuarial development methodologies based upon historical data including the period between the dates services are rendered and the dates claims are received and paid, expected medical cost inflation, utilization trends, seasonality patterns, prior authorization of medical services, provider contract changes and/or changes in Medi-Cal fee schedules and changes in membership. A key component of KHS’ IBNR estimation process is the completion factor, which is a measure of how complete the claims paid to date are relative to the estimate of the claims for services rendered in a given period. The completion factors are more reliable for claims incurred that are older than three months and are more volatile and less reliable for more recent periods, since a large portion of health care claims are not submitted to KHS until several months after services have beenrendered. Accordingly, for the most recent months, the incurred claims are estimated from a trendanalysis based on per member per month claims trends developed from the experience in precedingmonths.
The majority of the IBNR reserve balance held at year-end is associated with the most recent months’ incurred services as these are the services for which the fewest claims have been paid. As mentioned in the preceding paragraph, the degree of uncertainty in the estimates of incurred claims is greater for the most recent months’ incurred services.
Additionally, KHS contracts with an independent actuary to review the IBNR estimates. The independent actuary provides KHS with a review letter that includes the results of their analysis of the IBNR reserve. Actuarial Standards of Practice generally require that the medical claims liability be adequate to cover obligations under moderately adverse conditions. Moderately adverse conditions are situations in which the actual claims are expected to be higher than the otherwise estimated value of such claims at the time of estimate. This analysis is used as additional information, together with management’s judgment, to determine the assumptions used in the calculation of the IBNR reserve.
KHS consistently applies the IBNR estimation from period to period. Any adjustments from the prior year are included in the current period as a change in accounting estimate. As more complete additional information becomes known, KHS will adjust assumptions accordingly to change the IBNR estimate. KHS recognized $12.1 million and $4.7 million of favorable prior year IBNR adjustments for the years ended December 31, 2020 and 2019, respectively, due to lower-than-expected utilization.
KHS Finance Committee Meeting, April 9, 2021
42 / 144

KERN HEALTH SYSTEMS
NOTES TO FINANCIAL STATEMENTS
-27-
The contract covering Expansion members requires KHS to expend a minimum percentage of 85% of premiums and a maximum of 95% on eligible medical benefits expense. To the extent that KHS expends less than the minimum percentage of the premiums on eligible medical benefits, KHS is required torefund to the state all or some portion of the difference between the minimum and its actual allowable medical benefits expense. To the extent KHS expends more than the maximum percentage, KHS is entitled to receive additional reimbursement from the state. At December 31, 2020 and 2019, KHS has accrued $8 million and $30.7 million, respectively, to the state for the period July 1, 2016 to December 31, 2020.
Bridge Risk Corridor: Due to the unprecedented circumstances of the COVID-19 pandemic, DHCS and its contracted actuary determined that a two-sided, symmetrical risk corridor (“Bridge Corridor”) would appropriately provide protection for both the State and Medi-Cal managed care plans (MCPs) like KHS. The purpose of the risk corridor is to mitigate potentially significant upward or downward risk associated with COVID-19 that was not determinable at the time of rate development. The Bridge Corridor was retroactive to July 1, 2019. At December 31, 2020 KHS has accrued $6.9 million owed to the state for theperiod July1, 2019 to December 31, 2020.
Accrued medical services and related claims adjustment expenses payable consist of the following at December 31, 2020 and 2019:
2020 2019
Estimated incurred but not reported claims 73,596,630 $ 74,225,223$ Supplemental Proposition 56 provider payments 31,609,126 33,153,442 Claims payable 25,988,208 17,289,154 Expansion risk corridor 8,013,191 30,671,015 Bridge risk corridor 6,853,666 - Provider performance quality incentive 5,005,163 3,775,315 Allowance for claims processing expense 2,225,904 2,278,462
153,291,888 $ 161,392,611$
Note 10. Accrued Expenses
Accrued expenses consist of the following at December 31, 2020 and 2019:
2020 2019
MCO tax expense 26,536,275 $ -$ Salaries and employee benefits 3,474,673 2,786,847 Community grants payable 2,113,300 2,346,125 Other administrative expenses 1,612,215 2,402,147 Non-operating passthrough liability 833,451 710,696 CalPERS employee and employer contributions 442,720 384,929 New building and construction - 1,518,707
35,012,634 $ 10,149,451$
KHS Finance Committee Meeting, April 9, 2021
43 / 144

KERN HEALTH SYSTEMS
NOTES TO FINANCIAL STATEMENTS
-28-
Note 11. Restricted Investments and Tangible Net Equity
As required by the State of California’s Department of Managed Health Care, Section 1300.76.1, KHS has acquired certificates of deposit with three financial institutions totaling $300,000. These certificates of deposit have been assigned to the Director of the Department of Managed Health Care as part of theprocess of obtaining and maintaining its Knox-Keene license, and are legally restricted for this purpose. These certificates of deposit mature in amounts of $100,000 each on June 5, 2022, June 8, 2022 andJuly 30, 2022.
KHS is a fully licensed health-care service plan under the Knox-Keene Health Care Services Plan Act of 1975 (the “Act”). Under the Act, KHS is required to maintain a minimum level of tangible net equity. The required equity level was approximately $38.9 million and $46.5 million at December 31, 2020 and 2019,respectively. KHS’ tangible net equity was approximately $227.1 million and $214.7 million at December 31, 2020 and 2019, respectively.
Note 12. Employee Pension Plans
CalPERS
Plan description: All qualified permanent and probationary employees are eligible to participate in KHS’ Miscellaneous Employee Pension Plan, a cost-sharing multiple-employer defined benefit pension planadministered by the California Public Employees’ Retirement System (CalPERS). Benefit provisions under the Plan are established by State statute and Local Government resolution. CalPERS issues publicly available reports that include a full description of the pension plan regarding benefit provisions, assumptions and membership information that can be found on the CalPERS website at http://www.calpers.ca.gov.
Benefits provided: CalPERS provides service retirement and disability benefits, annual cost of living adjustments and death benefits to eligible employees. Benefits are based on years of credited service, equal to one year of full-time employment. Members with five years of total service are eligible to retire at age 50 or 52 (classic miscellaneous members or PEPRA miscellaneous members, respectively) with statutorily reduced benefits. All members are eligible for non-duty disability benefits after 10 years of service. The death benefit is one of the following: the Basic Death Benefit, the 1957 Survivor Benefit, or the Optional Settlement 2W Death Benefit. The cost-of-living adjustments for each plan are applied as specified by the Public Employees’ Retirement Law.
KHS Finance Committee Meeting, April 9, 2021
44 / 144

KERN HEALTH SYSTEMS
NOTES TO FINANCIAL STATEMENTS
-29-
The Plans’ provisions and benefits in effect at December 31, 2020 and 2019 are summarized as follows:
Classic PEPRA Classic PEPRA
Hire date
Prior toJanuary 1,
2013
On or after January 1,
2013
On or after January 1,
2013
On or after January 1,
2013
On or after January 1,
2013Benefit formula 2% @ 60 2% @ 60 2% @ 62 2% @ 60 2% @ 62
Benefit vesting schedule5 years of
service5 years of
service5 years of
service5 years of
service5 years of
service
Benefit paymentsMonthly for
lifeMonthly for
lifeMonthly for
lifeMonthly for
lifeMonthly for
lifeRetirement age 50 50 52 50 52Monthly benefits, as a %
of eligible compensation 2% 2% 2% 2% 2%Retirement employee
contribution rates 7% 7% 6.75% 7% 6.75%Required employer 6.709% to 8.081% to 6.985% to 7.634% to 6.842% to
contribution rates 7.159% 8.794% 7.732% 8.081% 6.985%
20192020
Contributions: Section 20814(c) of the California Public Employees’ Retirement Law requires that the employer contribution rates for all public employers be determined on an annual basis by the actuary and shall be effective on the July 1 following notice of a change in the rate. Funding contributions for both Plans are determined annually on the actuarial basis as of June 30 by CalPERS. The actuarially determined rate is the estimated amount necessary to finance the costs of benefits earned by employees during the year, with an additional amount to finance any unfunded accrued liability. KHS is required to contribute the difference between the actuarially determined rate and the contribution rate of employees.
For the years ended December 31, 2020 and 2019, the contributions recognized as part of pension expense were as follows:
2020 2019
Contributions - employer 2,536,160 $ 2,074,974$ Contributions - employee (paid by employer) -$ -$
Pension Liabilities, Pension Expenses, and Deferred Outflows/Inflows of Resources Related to Pensions
As of December 31, 2020, and 2019, KHS reported net pension liability for its proportionate share of the net pension liability of $8,432,377 and $7,038,233, respectively.
KHS’ net pension liability is measured as the proportionate share of the net pension liability. The net pension liability is measured as of June 30, 2020, and the total pension liability used to calculate the net pension liability was determined by an actuarial valuation as of June 30, 2019 rolled forward to June 30, 2020 using standard update procedures. KHS’ proportion of the net pension liability was based on aprojection of KHS’ long-term share of contributions to the plan relative to the projected contributions of all participating employers, actuarially determined. KHS’ proportionate share of the net pension liability as of June 30, 2019 and 2020 was as follows:
KHS Finance Committee Meeting, April 9, 2021
45 / 144

KERN HEALTH SYSTEMS
NOTES TO FINANCIAL STATEMENTS
-30-
Proportion - June 30, 2019 0.2642%Proportion - June 30, 2020 0.2881%Change - Increase 0.0239%
KHS’ net pension liability is measured as the proportionate share of the net pension liability. The net pension liability is measured as of June 30, 2019, and the total pension liability used to calculate the net pension liability was determined by an actuarial valuation as of June 30, 2018 rolled forward to June 30, 2019 using standard update procedures. KHS’ proportion of the net pension liability was based on aprojection of KHS’ long-term share of contributions to the plan relative to the projected contributions of all participating employers, actuarially determined. KHS’ proportionate share of the net pension liability as of June 30, 2018 and 2019 was as follows:
Proportion - June 30, 2018 0.2358%Proportion - June 30, 2019 0.2642%Change - Increase 0.0284%
For the years ended December 31, 2020 and 2019, KHS recognized pension expense of $4,017,997 and $3,464,074, respectively. At December 31, 2020 and 2019, KHS reported deferred outflows of resources and deferred inflows of resources related to pensions from the following sources:
DeferredOutflows of Resources
DeferredInflows of
Resources
DeferredOutflows of Resources
DeferredInflows of
Resources
Pension contributions subsequent to themeasurement date 2,030,993 $ -$ 1,650,097 $ -$
Changes in assumptions - 86,684 504,403 178,807 Differences between expected and
actual experiences 626,308 - 734,679 56,923 Net differences between projected and
actual earnings on pension planinvestments 361,040 - - 184,934
Total 3,018,341 $ 86,684 $ 2,889,179 $ 420,664$
2020 2019
$2,030,993 reported as deferred outflows of resources related to contributions subsequent to the measurement date will be recognized as a reduction of the net pension liability in the year ending December 31, 2021. Other amounts reported as deferred outflows of resources and deferred inflows of resources related to pensions will be recognized as pension expense as follows:
Year ended December 31,
2021 139,265$ 2022 327,370 2023 260,865 2024 173,164
900,664$
KHS Finance Committee Meeting, April 9, 2021
46 / 144

KERN HEALTH SYSTEMS
NOTES TO FINANCIAL STATEMENTS
-31-
Actuarial Methods and Assumptions: The total pension liabilities in the June 30, 2019 and 2018 actuarial valuations were determined using the following actuarial assumptions:
2020 2019
Valuation date June 30, 2019 June 30, 2018Measurement date June 30, 2020 June 30, 2019Actuarial cost method
Actuarial assumptions:Discount rate 7.15% 7.15%Inflation 2.50% 2.50%Payroll growth 2.75% 2.75%Projected salary increaseInvestment rate of return 7.25% (a) 7.38% (a)Mortality
(a) Net of pension plan investment and administrative expenses; includes inflation(b) The mortality table used was developed based on CalPERS' specific data. The table includes
15 years of mortality improvements using Society of Actuaries Scale 90% of scale MP 2016.
Derived using CalPERS'Membership Data for all Funds (b)
Entry-Age Normal Cost Method
Varies by Entry Age and Service
Discount Rate: The discount rate used to measure the total pension liability was 7.15% as of June 30, 2019 and June 30, 2018. To determine whether the municipal bond rate should be used in the calculation of a discount rate for the plan, CalPERS stress tested plans that would most likely result in a discount rate that would be different from the actuarially assumed discount rate. Based on the testing, none of the tested plans run out of assets. Therefore, the current discount rates of 7.15% as of June 30, 2019 and 2018 are adequate and the use of the municipal bond rate calculation is not necessary. The long term expected discount rate of 7.15% will be applied to all plans in the Public Employees Retirement Fund (PERF). The stress test results are presented in a detailed report that can be obtained from the CalPERS website at http://www.calpers.ca.gov.
According to Paragraph 30 of Statement 68, the long-term discount rate should be determined without reduction for pension plan administrative expense. The 7.15% as of June 30, 2019 and June 30, 2018, investment return assumption used in this accounting valuation is net of administrative expenses. Administrative expenses are assumed to be 15 basis points. An investment return excluding administrative expenses would have been 7.30% as of June 30, 2019 and 2018. Using this lower discount rate has resulted in a slightly higher Total Pension Liability and Net Pension Liability. CalPERS checked the materiality threshold for the difference in calculation and did not find it to be a material difference.
The long-term expected rate of return on pension plan investments was determined using a building-block method in which expected future real rates of return (expected returns, net of pension plan investment expense and inflation) are developed for each major class.
KHS Finance Committee Meeting, April 9, 2021
47 / 144

KERN HEALTH SYSTEMS
NOTES TO FINANCIAL STATEMENTS
-32-
In determining the long-term expected rate of return, CalPERS took into account both short-term andlong-term market return expectations as well as the expected pension fund cash flows. Using historical returns of all the funds’ asset classes, expected compound (geometric) returns were calculated over the short-term (first 10 years) and the long-term (11+ years) using a building-block approach. Using the expected nominal returns for both short-term and long-term, the present value of benefits was calculatedfor each fund. The expected rate of return was set by calculating the rounded single equivalent expected return that arrived at the same present value of benefits for cash flows as the one calculated using both short-term and long-term returns. The expected rate of return was then set equivalent to the single equivalent rate calculated above and adjusted to account for assumed administrative expenses.
The table below reflects the long-term expected real rate of return by asset class. The rate of return was calculated using the capital market assumptions applied to determine the discount rate and asset allocation. The rates of return are net of administrative expenses.
Asset ClassNew Strategic
Allocation
Long-Term Expected Rate
of Return
Public Equity 53.1% 9.7%Private Equity 6.3% 10.4%Income 28.2% 5.9%Real Assets 11.3% 8.8%Liquidity 0.9% 1.3%Trust level (a) 0.2% 8.5%
Total 100%
(a) Includes multi-asset class, completion overlay, risk mitigation, absolute return strategies, planlevel transition, and other plan level transition and other total fund level portfolios. These assetsdo not have targets because they are not components of the Total Fund Policy benchmark.
Sensitivity of the Proportionate Share of the Net Pension Liability to Changes in the Discount Rate: Thefollowing presents KHS’ proportionate share of the net pension liability, calculated using the discount rate, as well as what KHS’ proportionate share of the net pension liability would be if it were calculated using adiscount rate that is 1-percentage point lower or 1-percentage point higher than the current rate:
2020 2019
1% Decrease 6.15% 6.15%Net Pension Liability 13,465,820 $ 11,289,694$
Current Discount Rate 7.15% 7.15%Net Pension Liability 8,432,377 $ 7,038,233$
1% Increase 8.15% 8.15%Net Pension Liability 4,273,401 $ 3,528,952$
Pension Plan Fiduciary Net Position: Detailed information about the pension plan’s fiduciary net positionis available in the separately issued CalPERS financial reports.
KHS Finance Committee Meeting, April 9, 2021
48 / 144

KERN HEALTH SYSTEMS
NOTES TO FINANCIAL STATEMENTS
-33-
Retirement Plan
Plan description and funding policy: KHS has a 401(a)-retirement plan, which was approved by the IRS on August 15, 1996. All full-time employees are eligible to participate in the Plan. KHS matches 100% of contributions made by KHS employees to their 457(b) plan up to a maximum of 6% of the employee’s salary. KHS contributions do not vest until the employee has been employed for three years when at such time the employee becomes 100% vested. Participants are not allowed to make contributions to thePlan; only employer contributions are allowable. Expense determined in accordance with the planformula was $1,614,047 and $1,339,433 for the years ended December 31, 2020 and 2019, respectively.
Note 13. Stop-Loss Insurance
KHS purchases stop-loss insurance to reduce the risk associated with large losses on individual hospital claims. The premium costs are based on a deductible for each member in addition to a deductible layer for the plan referred to as an Aggregate Specific Retention amount.
For the years ended December 31, 2020 and 2019 coverage provides reimbursement of approximately 95 percent of the cost of each member’s acute care hospital admission(s) in excess of the deductibles, up to a maximum payable of $2,000,000 per member per contract year.
For the years ended December 31, 2020 and 2019 the premium coverage is $0.29 and $0.51,respectively, per member per month with no minimum annual premium requirement.
The deductible for each individual member was $300,000 and the Aggregate Specific Retention deductible was $0.27 per member per month (PMPM) for the year ended December 31, 2020. The deductible for each individual member was $275,000 and the Aggregate Specific Retention deductiblewas $0.26 per member per month (PMPM) for the year ended December 31, 2019.
Stop-loss insurance premiums of $904,111 and $1,522,366 are included in medical and hospital expense for the years ended December 31, 2020 and 2019, respectively. Stop-loss insurance recoveries of $261,987 and $289,296 are included in operating revenue for the years ended December 31, 2020 and 2019, respectively.
Note 14. Commitments and Contingencies
Litigation
KHS is subject to litigation claims that arise in the normal course of business. A provision for a legal liability is made when it is both probable that a liability has been incurred and the amount of the loss canbe reasonably estimated. These provisions, if any, are reviewed and adjusted to reflect the impacts of negotiations, estimated settlements, legal rulings, advice of legal counsel and other information and events pertaining to a matter. It is the opinion of management that there is no known existing litigation that would have a material adverse effect on the financial position, results of operations or cash flows of KHS.
Professional Liability Insurance
KHS maintains Managed Care Errors and Omissions Liability Insurance for an act, error, or omission inthe performance of any health care or managed care services rendered by KHS. In addition, KHS maintains general liability insurance.
KHS Finance Committee Meeting, April 9, 2021
49 / 144
KERN HEALTH SYSTEMS
NOTES TO FINANCIAL STATEMENTS
-34-
Cyber Insurance
KHS maintains Cyber Insurance to reduce the financial risk associated from a cyber-attack and/or a data breach involving sensitive member or employee information. The policy also assists with notification costs and data restoration expenses.
Pharmacy
KHS currently manages the pharmacy benefit for its members by contracting with a Pharmacy Benefit Manger (“PBM”) to assist with claims processing and pharmacy rebate services. KHS has been notifiedby DHCS that they intend to transition all Medi-Cal pharmacy benefits from managed care plans like KHS to fee-for-service (“FFS”). DHCS believes that this is required to combat rising prices for prescription drugs by increasing the State’s bargaining power in negotiating prescription drug prices with pharmaceutical companies. The date of transition has been pushed back from April 1, 2021 to an undetermined future date, so currently no pharmacy managed care benefits have been impacted. For theyear ended December 31, 2020, KHS recognized $117,750,322 in Pharmacy revenue and $4,867,111 inHepatitis C supplemental kick revenue as part of its premium capitation which in total accounted for approximately 13.1% of reported Premiums earned. For the year ended December 31, 2020, KHS reported $99,509,583 in Pharmacy expense and $3,776,146 in Hepatitis C expense, and received $1,378,251 from Pharmacy Rebates, which in total accounted for approximately 13.3% of reportedMedical and hospital expenses.
Regulatory Matters
The healthcare industry is subject to numerous laws and regulations of federal, state and local governments. Violations of these laws and regulations could result in expulsion from government healthcare programs together with the imposition of significant fines and penalties. KHS is subject to periodic financial and information reporting and comprehensive quality assurance evaluations from state regulators. KHS regularly submits periodic financial, encounters, utilization and operational reports. Management believes that KHS is in compliance with fraud, waste and abuse laws, as well as other applicable government laws and regulations. Compliance with such laws and regulations can be subject to future government review and interpretations as well as regulatory actions unknown or unasserted at this time.
Changes in the regulatory environment and applicable laws and rules also may occur periodically inconnection with political and administrative initiatives at the local, state, or national level. Much of thefederal and state focus in 2020 was related to the COVID-19 response. This included federal and state efforts to expand access to COVID testing and treatment services. The State budget also put forth retro-active and prospective rate reductions for Medi-Cal Managed Care Plans. Additionally, in 2020 there were numerous temporary changes in regulatory requirements related to the COVID-19 Public HealthEmergency (PHE). While most conversations were on hold during the COVID PHE, the Governor’s administration and the legislature also continue to consider a single-payer healthcare system for California.
California Advancing and Innovating Medi-Cal (CalAIM) is a multi-year initiative by DHCS to implement policy changes with the objective of:
1) Reducing variation and complexity across the delivery system;2) Identifying and managing member risk and need through population health management
strategies; and3) Improving quality outcomes and drive delivery system transformation through value-based
initiatives and payment reform.
KHS Finance Committee Meeting, April 9, 2021
50 / 144

KERN HEALTH SYSTEMS
NOTES TO FINANCIAL STATEMENTS
-35-
This initiative will have significant operational impact to Medi-Cal Managed Care Plans (MCPs) like KHS. Some examples include, a proposal to transition the DHCS Health Homes Program and Whole Person Care Program to an Enhanced Care Management and In-Lieu Of Services structure, a proposal to carve-in Long Term Care and Transplant services to MCPs, a proposal requiring all MCPs operate a Duals Special Needs Plan (D-SNP), and a proposal requiring all MCPs become NCQA accredited. Originally expected to begin on January 1, 2021, DHCS postponed CalAIM for one year as a result of the COVID PHE. Recently the State has restarted discussions with Stakeholders.
Information Technology
KHS is dependent on effective and secure enterprise commercial information systems that assist in the operational processing and management of eligibility, benefits, payments, providers, clinical quality, benefit utilization, and clinical population oversight. These third-party systems, vendor relationships, and support models/contracts are critical in managing data that is essential for internal and external (regulators) oversight and required KHS to monitor data security measures to adhere to CMS and HIPAA regulations. This makes our operations vulnerable to adverse effects if such third parties fail to perform adequately. The MIS Group is constantly engaged in the third-party contracts that govern these systems while reviewing technical architectures, third-party operational models, and the business continuity and disaster recovery solutions using private and public cloud systems. In 2020, KHS was impacted by COVID-19 and displaced its workforce to a telecommuting model. KHS had planned for a pandemic as part of the Disaster Recovery Plan and is leveraging third-party solutions to continue its operations for this new telecommuting work model. The KHS information systems require an ongoing commitment of significant resources to maintain, protect, and enhance existing systems while developing new systems tokeep pace with continuing changes in information processing technology, evolving systems andregulatory standards, changing customer preferences, acquisitions, and increased security risks.
Encounter Data
KHS is required to submit complete and correct encounter data to DHCS. The accurate and timely reporting of encounter data is becoming increasingly important to determine compliance with performance standards and in setting KHS’ premium rates. Inaccurate encounter reporting could result in penalties and fines being assessed by DHCS.
The Health Insurance Portability and Accountability Act
The Health Insurance Portability and Accountability Act of 1996 ("HIPAA") and the regulations adopted under HIPAA are intended to improve the portability and continuity of health insurance coverage and simplify the administration of health insurance claims and related transactions. All health plans are considered covered entities subject to HIPAA. HIPAA generally requires health plans, as well as their providers and vendors, to:
• protect patient privacy and safeguard individually identifiable health information; and• establish the capability to receive and transmit electronically certain administrative health care
transactions, such as claims payments, in a standardized format.
Specifically, the HIPAA Privacy Rule regulates use and disclosure of individually identifiable health information, known as “protected health information” ("PHI"). The HIPAA Security Rule requires covered entities to implement administrative, physical and technical safeguards to protect the security of electronic PHI. Certain provisions of the security and privacy regulations apply to business associates (entities that handle PHI on behalf of covered entities), and business associates are subject to direct liability for violation of these provisions. Furthermore, a covered entity may be subject to penalties as a result of abusiness associate violating HIPAA, if the business associate is found to be an agent of the coveredentity. HIPAA violations by covered entities may also result in civil and criminal penalties.
KHS Finance Committee Meeting, April 9, 2021
51 / 144

KERN HEALTH SYSTEMS
NOTES TO FINANCIAL STATEMENTS
-36-
Premium and Eligibility Reconciliations
Premium payments received by KHS from DHCS are based on eligibility lists generated between DHCS and by county agencies that are responsible for determining Medi-Cal eligibility. In a report issued on October 30, 2018 by the California State Auditor, the report indicated “questionable payments” for many counties throughout California, including Kern County. During the period January 1, 2014 through December 31, 2017 amounts of $10,421,757 relating to Managed Care Premiums and $2,854,656relating to Fee For Service Payments for a total of $13,276,413 of payments by DHCS were identified for Kern County primarily due to beneficiaries being eligible on the DHCS eligibility system and not beingeligible on the county agency eligibility system. During the first quarter of 2020, DHCS recouped approximately $563,000 relating to payments previously received by KHS for members that were determined to be deceased by DHCS. This amount was subtracted from KHS’ 2019 revenues. It is unclear if any additional amounts will be recouped by DHCS from KHS. Accordingly, premium revenues could remain subject to reconciliation and recoupment for many years. The refund of a premium overpayment could be significant and would reduce the premium revenue in the year that the repayment obligation is identified.
Expansion Risk Corridor Liability Adjustment
The Risk Corridor Liability is based on management’s best estimate of a medical loss ratio estimate for KHS Expansion members that have medical expenses below 85% of premiums. KHS is required to refund to the State amounts below 85%. The calculation of the 85% medical loss ratio is subject to thefollowing adjustments:
• Revenue rate adjustments by DHCS• The inclusion and/or exclusion of certain medical expenses• Eligibility adjustments• DHCS and CMS audit adjustments
Bridge Corridor Liability Adjustment
Due to the unprecedented circumstances of the COVID-19 pandemic, DHCS and its contracted actuary determined that a two-sided, symmetrical risk corridor (“Bridge Corridor”) would appropriately provide protection for both the State and Medi-Cal managed care plans (MCPs) like KHS. The purpose of the risk corridor is to mitigate potentially significant upward or downward risk associated with COVID-19 that was not determinable at the time of rate development. The Bridge Corridor was retroactive to July 1, 2019. The Bridge Corridor calculation is subject to the following adjustments:
• Revenue rate adjustments by DHCS• The inclusion and/or exclusion of certain medical expenses• Eligibility adjustments• DHCS and CMS audit adjustments
Any adjustments to the Expansion or Bridge Risk Corridor Liability amounts could be significant andwould increase or decrease reported medical expenses in the year the adjustment is required.
KHS Finance Committee Meeting, April 9, 2021
52 / 144

KERN HEALTH SYSTEMS NOTES TO FINANCIAL STATEMENTS
-37-
Patient Protection and Affordable Care Act In March 2010, the President signed into law the Patient Protection and Affordable Care Act and the Health Care and Education Reconciliation Act of 2010 (collectively referred to as the Healthcare Reform Legislation), which considerably transformed the U.S. health-care system and increased regulations within the U.S. health insurance industry. This legislation expanded the availability of health insurance coverage to millions of Americans. The Healthcare Reform Legislation contains provisions that took effect from 2010 through 2020, with most measures effective in 2014. Under the Healthcare Reform Legislation, Medi-Cal coverage expanded as of January 2014 to nearly all low-income people under age 65 with income at or below 138% of the federal poverty line. The federal government paid 100% of the entire cost for Medicaid Expansion coverage for newly eligible beneficiaries from 2014 through 2016, 95% in 2017, 94% in 2018, 93% in 2019, and 90% in 2020. For the years ended December 31, 2020 and 2019, KHS served an average of 64,929 and 60,347 Medi-Cal Expansion members per month, respectively, which generated revenues of approximately $320.6 million and $290.2 million, respectively. Contract Commitment In September 2014 KHS entered into a ten-year contract with a vendor to supply software, licensing, support and maintenance, including a migration process from the existing software. Expenses are paid annually and are subject to change based on changes to the Consumer Price Index and changes in membership. At December 31, 2020 the total future contract commitments are as follows: Years ending December 31,
2021 658,210 $ 2022 386,142 2023 386,142 2024 386,142
1,816,636 $
Note 15. Concentration of Revenue KHS’ operating revenue is primarily derived from the California Department of Health Care Services (DHCS). KHS’ current contract term with DHCS is to provide health care services through December 31, 2021, and is subject to cancellation upon giving at least six months written notice. For the years ended December 31, 2020 and 2019 over 99% of KHS’ total revenues were received from DHCS. Future levels of funding and premium rates received by KHS could be impacted by state and federal budgetary constraints.
KHS Finance Committee Meeting, April 9, 2021
53 / 144

REQUIRED SUPPLEMENTARY INFORMATION
KHS Finance Committee Meeting, April 9, 2021
54 / 144

-38-
KERN HEALTH SYSTEMS
SCHEDULES OF PROPORTIONATE SHARE OF THE NET PENSION LIABILITYAs of December 31, 2020
2020 2019 2018 2017 2016 2015
CalPERS - Miscellaneous Classic Plan- Last 10 Years*
Proportion of the net pension liability 0.28810% 0.26415% 0.23579% 0.21146% 0.19046% 0.17122%
Proportionate share of the net pension liability 8,432,377 $ 7,038,233 $ 5,865,463 $ 6,082,752 $ 4,769,187 $ 3,104,717$
Covered - employee payroll 19,428,164$ 19,020,118$ 17,733,290$ 17,150,840$ 17,364,146$ 9,949,051$
Proportionate share of the net pension liability as apercentage of covered-employee payroll 43.40% 37.00% 33.08% 35.47% 27.47% 31.21%
Plan's fiduciary net position 14,702,361,183 $ 13,979,687,268 $ 13,122,440,092 $ 12,074,499,781 $ 10,923,476,287 $ 10,896,036,068$
Plan fiduciary net position as a percentage of the total pension liability 77.71% 77.73% 77.69% 75.39% 75.87% 79.89%
* Fiscal year 2015 was the first year of implementation, therefore only six years are shown. For the fiscal year ended December 31, 2016 CALPERS combined the Classicand Pepra Plans into one plan. Therefore, the information presented for 2020, 2019, 2018, 2017 and 2016 for the miscellaneous Classic Plan includes the Pepra Plan.
CalPERS - Miscellaneous PEPRA Plan - Last 10 Years**
Proportion of the net pension liability 0.00362%
Proportionate share of the net pension liability (30,922) $
Covered - employee payroll 6,909,343$
Proportionate share of the net pension liability as a percentageof covered-employee payroll -0.45%
Plan's fiduciary net position 10,639,461,174$
Plan fiduciary net position as a percentage of the total pension liability 79.89%
** Fiscal year 2015 was the first year of implementation, therefore only one year is shown. For the fiscal year ended December 31, 2016 CALPERS combined the Classicand Pepra Plans into one plan. Therefore, there is no information reported for the Pepra Plan subsequent to the year ended December 31, 2015.
KHS Finance Committee Meeting, April 9, 2021
55 / 144

-39-
KERN HEALTH SYSTEMS
SCHEDULES OF PENSION CONTRIBUTIONSYear Ended December 31, 2020
2020 2019 2018 2017 2016 2015
CalPERS - Miscellaneous Classic Plan - Last 10 Years*
Contractually required contribution (actuariallydetermined) 2,536,160 $ 2,074,974 $ 1,822,052 $ 1,625,952 $ 1,314,297 $ 841,252 $
Contributions in relation to the actuarially determined contributions 2,536,160 2,074,974 1,822,052 1,625,952 1,314,297 841,252
Contribution deficiency (excess) -$ -$ -$ -$ -$ -$
Covered-employee payroll 19,428,164 $ 19,020,118 $ 17,733,290 $ 17,150,940 $ 17,364,146 $ 9,949,051 $
Contributions as a percentage ofcovered-employee payroll 13.05% 10.91% 10.27% 9.48% 7.57% 8.46%
Notes to ScheduleValuation date: June 30, 2019 June 30, 2018 June 30, 2017 June 30, 2016 June 30, 2015 June 30, 2014
Methods and assumptions used to determine contribution rates:
Actuarial cost methodAmortization methodRemaining amortization period 24 years 25 years 26 years 27 years 28 years 29 yearsAsset valuation methodInflation 2.50% 2.50% 2.50% 2.75% 2.75% 2.75%Salary increases 2.75% 2.75% 2.75% 3.00% 3.00% 3.00%Investment rate of return (a) 7.15% 7.15% 7.15% 7.15% 7.65% 7.50%Retirement ageMortality
(a) Net of pension plan investment and administrative expenses; includes inflation
* Fiscal year 2015 was the first year of implementation, therefore only six years are shown. For the fiscal year ended December 31, 2016 CALPERS combined the Classic and Pepra Plans into one plan. Therefore, the information presented for 2020, 2019, 2018, 2017 and 2016 for the miscellaneous Classic Plan includes the Pepra Plan.
Entry-Age Normal Cost MethodLevel percentage of assumed future payrolls
5-year smoothed market
50 years and 5 years of serviceThe mortality table used was developed based on CalPERS' specific data. The table includes 15
years of mortality improvements using Society of Actuaries Scale 90% of scale MP 2016.
KHS Finance Committee Meeting, April 9, 2021
56 / 144

-40-
KERN HEALTH SYSTEMS
SCHEDULES OF PENSION CONTRIBUTIONSYear Ended December 31, 2020
2015
CalPERS - Miscellaneous PEPRA Plan - Last 10 Years*
Contractually required contribution (actuariallydetermined) 367,525 $
Contributions in relation to the actuarially determined contributions 367,525
Contribution deficiency (excess) -$
Covered-employee payroll 6,909,343 $
Contributions as a percentage of covered-employeepayroll 5.32%
Notes to ScheduleValuation date: June 30, 2014
Methods and assumptions used to determine contribution rates:
Actuarial cost methodAmortization methodRemaining amortization period 29 yearsAsset valuation methodInflation 2.75%Salary increases 3.00%Investment rate of return (a) 7.50%Retirement ageMortality
* For the fiscal year ended December 31, 2016 CalPERS combined the Classic and Pepra Plans into one plan. Therefore, there is no information reported for the Pepra Plan subsequent to the year ended December 31, 2015.
20 years of projected on-going mortality improvement using Scale BB published by the
Society of Actuaries
Entry-Age Normal Cost MethodLevel percentage of assumed future payrolls
5-year smoothed market
52 years and 5 years of service
KHS Finance Committee Meeting, April 9, 2021
57 / 144

OTHER INDEPENDENT AUDITOR’S REPORT
KHS Finance Committee Meeting, April 9, 2021
58 / 144

300 New Stine Road – Bakersfield, CA 93309 – Tel. 661.834.7411 – Fax.661.834.4389 – www. dpvb.com
An independently owned member RSM US Alliance
Member of AICPA Division for Firms Private Companies Practice Section
NANCY C. BELTON
INDEPENDENT AUDITOR’S REPORT ON INTERNAL CONTROL OVER FINANCIALREPORTING AND ON COMPLIANCE AND OTHER MATTERS BASED ON ANAUDIT OF FINANCIAL STATEMENTS PERFORMED IN ACCORDANCE WITH
GOVERNMENT AUDITING STANDARDS
Board of DirectorsKern Health Systems Bakersfield, California
We have audited, in accordance with the auditing standards generally accepted in the United States of America and the standards applicable to financial audits contained in Government Auditing Standards,issued by the Comptroller General of the United States, the financial statements of Kern HealthSystems, as of and for the year ended December 31, 2020, and the related notes to the financialstatements, which collectively comprise Kern Health Systems’ basic financial statements, and have issued our report thereon dated March 30, 2021.
Internal Control Over Financial Reporting
In planning and performing our audit of the financial statements, we considered Kern Health Systems'internal control over financial reporting (internal control) to determine the audit procedures that are appropriate in the circumstances for the purpose of expressing our opinion on the financial statements,but not for the purpose of expressing an opinion on the effectiveness of Kern Health Systems’ internal control. Accordingly, we do not express an opinion on the effectiveness of Kern Health Systems’ internal control.
A deficiency in internal control exists when the design or operation of a control does not allowmanagement or employees, in the normal course of performing their assigned functions, to prevent, ordetect and correct, misstatements on a timely basis. A material weakness is a deficiency, or a combination of deficiencies, in internal control, such that there is a reasonable possibility that a material misstatement of the entity’s financial statements will not be prevented, or detected and corrected on a timely basis. A significant deficiency is a deficiency, or a combination of deficiencies, in internal control that is less severe than a material weakness, yet important enough to merit attention by those charged with governance.
Our consideration of internal control was for the limited purpose described in the first paragraph of thissection and was not designed to identify all deficiencies in internal control that might be materialweaknesses or significant deficiencies. Given these limitations, during our audit we did not identify anydeficiencies in internal control that we consider to be material weaknesses. However, material weaknesses may exist that have not been identified.
-41-
KHS Finance Committee Meeting, April 9, 2021
59 / 144

-42-
Compliance and Other Matters As part of obtaining reasonable assurance about whether Kern Health Systems' financial statements are free from material misstatement, we performed tests of its compliance with certain provisions of laws, regulations, contracts and grant agreements, noncompliance with which could have a direct and material effect on the determination of financial statement amounts. However, providing an opinion on compliance with those provisions was not an objective of our audit, and accordingly, we do not express such an opinion. The results of our tests disclosed no instances of noncompliance or other matters that are required to be reported under Government Auditing Standards. Purpose of this Report The purpose of this report is solely to describe the scope of our testing of internal control and compliance and the results of that testing, and not to provide an opinion on the effectiveness of the entity’s internal control or on compliance. This report is an integral part of an audit performed in accordance with Government Auditing Standards in considering the entity’s internal control and compliance. Accordingly, this communication is not suitable for any other purpose.
Daniells Phillips Vaughan & Bock Bakersfield, California March 30, 2021
KHS Finance Committee Meeting, April 9, 2021
60 / 144

KERN HEALTH SYSTEMS
Report to the Finance Committee
March 30, 2021
KHS Finance Committee Meeting, April 9, 2021
61 / 144

300 New Stine Road – Bakersfield, CA 93309 – Tel. 661.834.7411 – Fax.661.834.4389 – www. dpvb.com
An independently owned member RSM US Alliance
Member of AICPA Division for Firms Private Companies Practice Section
Finance Committee Kern Health Systems Attention: Wayne Deats Jr., Finance Committee Chair We are pleased to present this report related to our audit of the financial statements of Kern Health Systems for the year ended December 31, 2020. This report summarizes certain matters required by professional standards to be communicated to you in your oversight responsibility for Kern Health Systems’ financial reporting process. This report is intended solely for the information and use of the Board of Directors, Finance Committee, and management and is not intended to be and should not be used by anyone other than these specified parties. It will be our pleasure to respond to any questions you have about this report. We appreciate the opportunity to continue to be of service to Kern Health Systems.
Daniells Phillips Vaughan & Bock March 30, 2021
KHS Finance Committee Meeting, April 9, 2021
62 / 144

Contents
Required Communications ......................................................................................................................... 1-2
Summary of Significant Accounting Estimates ............................................................................................. 3
Exhibit A - Representation Letter ............................................................................................................... 4-8
KHS Finance Committee Meeting, April 9, 2021
63 / 144
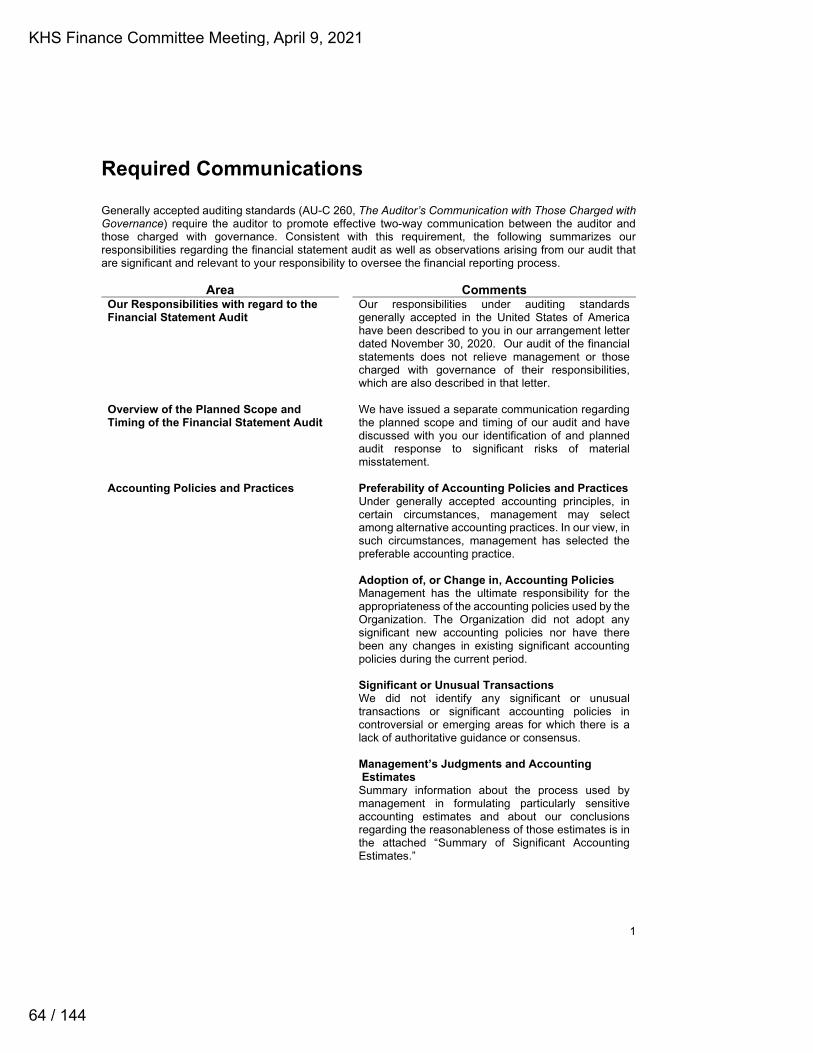
1
Required Communications
Generally accepted auditing standards (AU-C 260, The Auditor’s Communication with Those Charged withGovernance) require the auditor to promote effective two-way communication between the auditor and those charged with governance. Consistent with this requirement, the following summarizes our responsibilities regarding the financial statement audit as well as observations arising from our audit that are significant and relevant to your responsibility to oversee the financial reporting process.
Area Comments Our Responsibilities with regard to the Financial Statement Audit
Our responsibilities under auditing standards generally accepted in the United States of Americahave been described to you in our arrangement letter dated November 30, 2020. Our audit of the financial statements does not relieve management or thosecharged with governance of their responsibilities, which are also described in that letter.
Overview of the Planned Scope and Timing of the Financial Statement Audit
We have issued a separate communication regarding the planned scope and timing of our audit and havediscussed with you our identification of and plannedaudit response to significant risks of material misstatement.
Accounting Policies and Practices Preferability of Accounting Policies and Practices Under generally accepted accounting principles, in certain circumstances, management may select among alternative accounting practices. In our view, in such circumstances, management has selected the preferable accounting practice.
Adoption of, or Change in, Accounting Policies Management has the ultimate responsibility for theappropriateness of the accounting policies used by the Organization. The Organization did not adopt any significant new accounting policies nor have therebeen any changes in existing significant accountingpolicies during the current period.
Significant or Unusual Transactions We did not identify any significant or unusual transactions or significant accounting policies in controversial or emerging areas for which there is alack of authoritative guidance or consensus.
Management’s Judgments and Accounting Estimates Summary information about the process used by management in formulating particularly sensitiveaccounting estimates and about our conclusions regarding the reasonableness of those estimates is inthe attached “Summary of Significant Accounting Estimates.”
KHS Finance Committee Meeting, April 9, 2021
64 / 144

2
Area Comments
Audit Adjustments There were no audit adjustments, proposed by us, made to the original trial balance presented to us to begin our audit.
Uncorrected Misstatements We are not aware of any uncorrected misstatements other than misstatements that are clearly trivial.
Disagreements with Management We encountered no disagreements with management over the application of significant accounting principles, the basis for management’s judgments on any significant matters, the scope of the audit, or significant disclosures to be included in the financial statements.
Consultations with Other Accountants We are not aware of any consultations management had with other accountants about accounting or auditing matters.
Significant Issues Discussed with Management
No significant issues arising from the audit werediscussed with or were the subject of correspondence with management.
Significant Difficulties Encountered in Performing the Audit
We did not encounter any significant difficulties in dealing with management during the audit.
Certain Written Communications Between Management and Our Firm
Copies of significant written communications betweenour firm and the management of the Organization, including the representation letter provided to us by management, are attached as Exhibit A.
KHS Finance Committee Meeting, April 9, 2021
65 / 144

3
Kern Health Systems
Summary of Significant Accounting Estimates Year Ended December 31, 2020
Accounting estimates are an integral part of the preparation of financial statements and are based upon management’s current judgment. The process used by management encompasses their knowledge andexperience about past and current events and certain assumptions about future events. You may wish to monitor throughout the year the process used to determine and record these accounting estimates. The following describes the significant accounting estimates reflected in the Organization’s December 31, 2020, financial statements:
Estimate Managements Estimation Process Basis for Our Conclusions on Reasonableness of Estimate
Estimated claims payable
Estimates are based on historical information for total claims receivedand paid
Estimate is in accordance withaccounting principles generally accepted in the United States of America
Provider performancequality incentiveliabilities
Estimates are based on historical information for total claims receivedand paid
Estimate is in accordance withaccounting principles generally accepted in the United States of America
Incurred but not reported claims
Estimates are based on historical information for total claims receivedand paid
Estimate is in accordance withaccounting principles generally accepted in the United States of America
Net pension liability Estimate is based on actuarial reports provided by CalPERS
Estimate is in accordance withaccounting principles generally accepted in the United States of America
Expansion and bridgerisk corridor liabilities
Estimates are based on management’s best estimate of medical loss ration
Estimate is in accordance withaccounting principles generally accepted in the United States of America
KHS Finance Committee Meeting, April 9, 2021
66 / 144

Exhibit A Representation Letter
KHS Finance Committee Meeting, April 9, 2021
67 / 144

4
KHS Finance Committee Meeting, April 9, 2021
68 / 144

5
KHS Finance Committee Meeting, April 9, 2021
69 / 144

6
KHS Finance Committee Meeting, April 9, 2021
70 / 144

7
KHS Finance Committee Meeting, April 9, 2021
71 / 144

8
KHS Finance Committee Meeting, April 9, 2021
72 / 144

To: KHS Finance Committee
From: Robin Dow-Morales, Director of Claims
Date: April 9, 2021
Re: Office Ally, Inc., Electronic Claims Process
______________________________________________________________________________
Background
In 2009 Kern Health Systems engaged multiple claims clearinghouses to provide various
alternatives for the community to submit electronically. Office Ally provides KHS with the 837i
and 837p claims transactions. Electronic data transactions increase the accuracy of the data and
eliminate the need for paper processes and storage.
Discussion
KHS currently uses four different clearinghouse vendors: The SSI Group, Cognizant, Change
Healthcare (consisting of Emdeon and Relay Health) and Office Ally. Office Ally provides KHS
with approximately 30% of the claims that are submitted electronically to the health plan. Office
Ally does not charge the submitting provider for the transaction rather KHS. The fees are based
on a per transaction basis, and the rate will be constant for a three-year period. The current price
per claims is $0.25 with the new negotiated rate of $0.23 per claim. Based on last year’s claims
volume, this would net a savings of about $16,000.00.
Financial Impact
Not to exceed $0.23 per claim.
Requested Action
Approve; Refer to KHS Board of Directors.
KHS Finance Committee Meeting, April 9, 2021
73 / 144

Office Ally Contract ExtensionApril 9, 2021
Robin Dow-MoralesDirector of Claims
1
KHS Finance Committee Meeting, April 9, 2021
74 / 144

Agenda
• Background
• Scope of services
• Provider Advantages
• RFP /Contract Extension
• Recommendation
• Questions
2
KHS Finance Committee Meeting, April 9, 2021
75 / 144

Background
• We receive over 3 million claims a year, and 97% of thoseclaims are submitted electronically.
• Kern Health Systems offers four different clearinghouses fromwhich providers can choose to utilize.
• One of the most popular, is Office Ally, making up almost 30%of the electronic submissions.
• Our 3-year contract is up for renewal.
• Cost per claim has remained stagnant at $.25 per transactionfor the last 12 years.
3
KHS Finance Committee Meeting, April 9, 2021
76 / 144

Scope of Services
• Clearinghouses accept claims direct from Providers or 3rd
party Clearinghouses and converts to appropriate format andsubmits to Kern Health Systems.
• Adheres to legislated timeliness guidelines.
• Notifies provider of acceptance or rejection of the claimsubmission and if rejected, the reason as to why thesubmission is rejected.
• This allows the provider to correct errors and resubmit at amuch faster pace than awaiting a denial from Kern HealthSystems for a corrected billing.
4
KHS Finance Committee Meeting, April 9, 2021
77 / 144

Provider Advantages
• Claims submitted through KHS Clearinghouses are at no costto the provider.
• No mailing/paper/form costs.
• Many billing errors are identified immediately and returned tothe provider for correction – no waiting for KHS action.
• Easier tracking and receipt of acknowledgement of claims.
• Faster submission = faster payment = better cash flow for theprovider!
5
KHS Finance Committee Meeting, April 9, 2021
78 / 144

Request for Contract Extension
• RFP is not necessary as multiple vendors are used for thisservice.
• This contract extension is at the reduced rate of $.23 pertransaction.
• Estimated annual number of claims ~ 805,000
• Estimated annual cost $185,000
• Estimated savings from prior years ~$16,000.00.
• Puts in line with other vendors ranging $.22-$.25 pertransaction.
6
KHS Finance Committee Meeting, April 9, 2021
79 / 144

Recommendation
• Request the Board of Directors to authorize the CEO toapprove a three-year contract with Office Ally in the amountnot to exceed $0.23 per claims transaction.
7
KHS Finance Committee Meeting, April 9, 2021
80 / 144

Questions
For additional information, please contact:
Robin Dow-Morales
Director of Claims
661-617-2598
8
KHS Finance Committee Meeting, April 9, 2021
81 / 144

Proposed Administrative Contract over $100,000, April 9, 2021
1. Operational Expenditure with Office Ally, Inc.
a. Recommended Action
Approve; Authorize Chief Executive Officer to Sign
b. Contact
Robin Dow-Morales; Director of Claims
c. Background
In 2009 Kern Health Systems engaged multiple claims
clearinghouses to provide various alternatives for the community
to submit electronically. Office Ally provides KHS with the 837i
and 837p claims transactions. Electronic data transactions increase
the accuracy of the data and eliminate the need for paper processes
and storage.
d. Discussion
Office Ally provides KHS with approximately 30% of the claims
that are submitted electronically to the health plan. Office Ally
does not charge the submitting provider for the transaction rather
KHS. The fees are based on a per transaction basis, and the rate
will be constant for a three-year period. The current price per
claims is $0.25 but will decrease with this contract to $0.23 per
claim.
e. Fiscal Impact
Not to exceed $0.23 per claim.
f. Risk Assessment
The potential risk of not receiving electronic claims would result
in a backlog in claims and an increase in staffing budget. Without
KHS Finance Committee Meeting, April 9, 2021
82 / 144
electronic submission we would need staff to open, prepare and
scan the claims, as well as support staff to verify and validate that
claims were read correctly in the OCR process. Electronic
submission ensures that accurate data was received which helps in
the auto adjudication process. Also, if auto adjudication decreased,
there would be a need for more claims examiners to process the
claims.
g. Attachments
Agreement at a Glance form is attached.
h. Reviewed by Chief Compliance Officer and/or Legal Counsel
This contract has been approval by KHS legal counsel per PSA.
KHS Finance Committee Meeting, April 9, 2021
83 / 144

KHS Finance Committee Meeting, April 9, 2021
84 / 144

KHS Finance Committee Meeting, April 9, 2021
85 / 144


To: KHS Finance Committee
From: Robert Landis, CFO
Date: April 9, 2021
Re: December 2020 Financial Results
_______________________________________________________________________________
The December results reflect a $836,353 Net Increase in Net Position which is a $1,715,848
favorable variance to the budget. Listed below are the major variances for the month:
1) Total Revenues reflect a $6.3 million favorable variance primarily due to:
A) $6.4 million favorable variance primarily due to higher than expected budgeted membership.
B) $2.8 million favorable variance in Proposition 56 Supplemental Revenue due to an
unbudgeted rate increase in tobacco tax revenue funds in fiscal year 19/20 for additional CPT
procedure codes along with unbudgeted new Prop 56 programs that became effective January
1, 2020 offset against amounts included in 2D below.
C) $1.3 million unfavorable variance in Premium MCO Tax due to a revised reduction in our
MCO tax liability rates that occurred with an agreement between CMS and DHCS which is
offset against MCO Tax Expense included in Item 4 below.
D) $1.4 million unfavorable variance in Premium-Hospital Directed Payments primarily due to
receiving revised 18/19 HDP rates. This amount is offset against amounts included in 2E
below.
2) Total Medical Costs reflect a $6.3 million unfavorable variance primarily due to:
A) $1.8 million favorable variance in Physician Services primarily due to lower than expected
utilization of Referral Specialty Services.
B) $2.0 million favorable variance in Emergency Room primarily due to lower than expected
utilization.
C) $5.6 million unfavorable variance in Inpatient primarily due to higher than expected
utilization.
KHS Finance Committee Meeting, April 9, 2021
87 / 144

D) $6.0 million unfavorable variance in Other Medical primarily due to accruing for
estimated Proposition 56 expenses relating to unbudgeted additional CPT procedure codes
along with increases in supplemental allowable payable amounts that became effective
January 1, 2020 offset against revenue included in 1B above ($2.3 million) and Covid-19
provider relief expenses ($3.8 million).
E) $1.4 million favorable variance in Hospital Directed Payments primarily due to receiving
revised 18/19 HDP rates. This amount is offset against amounts included in 1D above.
3) Total Administrative Expenses reflect a $1.8 million unfavorable variance primarily due to a
$1.4 million unfavorable variance in Administrative Expense Adjustment relating to a CalPERS net
pension liability expense for the period July 1, 2019 to June 30, 2020 required under GASB 68.
4) $1.3 million favorable variance in MCO Tax due to a revised reduction in our MCO tax liability
rates that occurred with an agreement between CMS and DHCS which is partially offset against
MCO Tax Premium included in Item 1C above.
The December Medical Loss Ratio is 92.5% which is favorable to the 93.5% budgeted amount. The
December Administrative Expense Ratio is 8.2% which is unfavorable to the 6.5% budgeted amount
due to the GASB 68 adjustment mention in item 3 above. Excluding this adjustment, the
administrative ratio would have been 6.3%.
The results for the 12 months ended December 31, 2020 reflect a Net Increase in Net Position of
$12,393,805. This is a $21,223,577 favorable variance to budget and includes approximately $11.5
million of favorable adjustments from the prior year. The year-to-date Medical Loss Ratio is 91.7%
which is favorable to the 93.3% budgeted amount. The year-to-date Administrative Expense Ratio
is 6.1% which is favorable to the 6.6% budgeted amount.
KHS Finance Committee Meeting, April 9, 2021
88 / 144

Kern Health SystemsFinancial Packet December 2020
KHS – Medi-Cal Line of Business
Comparative Statement of Net Position Page 1
Statement of Revenue, Expenses, and Changes in Net Position Page 2
Statement of Revenue, Expenses, and Changes in Net Position - PMPM Page 3
Statement of Revenue, Expenses, and Changes in Net Position by Month Page 4
Statement of Revenue, Expenses, and Changes in Net Position by Month - PMPM Page 5
Schedule of Revenues Page 6
Schedule of Medical Costs Page 7
Schedule of Medical Costs - PMPM Page 8
Schedule of Medical Costs by Month Page 9
Schedule of Medical Costs by Month – PMPM Page 10
Schedule of Administrative Expenses by Department Page 11
Schedule of Administrative Expenses by Department by Month Page 12
KHS Group Health Plan – Healthy Families Line of Business
Comparative Statement of Net Position Page 13
Statement of Revenue, Expenses, and Changes in Net Position Page 14
KHS Administrative Analysis and Other Reporting
Monthly Member Count Page 15
KHS Finance Committee Meeting, April 9, 2021
89 / 144

KERN HEALTH SYSTEMSMEDI-CAL
STATEMENT OF NET POSITIONAS OF DECEMBER 31, 2020
ASSETS DECEMBER 2020 NOVEMBER 2020 INC(DEC)CURRENT ASSETS:
Cash and Cash Equivalents 74,866,934$ 77,825,996$ (2,959,062)$ Short-Term Investments 169,078,187 154,301,299 14,776,888
Premiums Receivable - Net 97,593,440 93,226,885 4,366,555 Premiums Receivable - Hospital Direct Payments 195,667,272 185,930,497 9,736,775
Interest Receivable 111,800 381,917 (270,117) Provider Advance Payment 5,506,518 5,746,518 (240,000)
Other Receivables 999,272 1,230,780 (231,508) Prepaid Expenses & Other Current Assets 2,223,252 1,159,952 1,063,300
Total Current Assets 546,046,675$ 519,803,844$ 26,242,831$
CAPITAL ASSETS - NET OF ACCUM DEPRE:Land 4,090,706 4,090,706 -
Furniture and Equipment - Net 2,121,548 2,167,198 (45,650) Computer Hardware and Software - Net 14,911,184 15,157,865 (246,681)
Building and Building Improvements - Net 35,348,281 35,423,975 (75,694) Capital Projects in Progress 12,183,359 11,563,748 619,611
Total Capital Assets 68,655,078$ 68,403,492$ 251,586$
LONG TERM ASSETS:Restricted Investments 300,000 300,000 -
Officer Life Insurance Receivables 1,556,944 1,503,894 53,050 Total Long Term Assets 1,856,944$ 1,803,894$ 53,050$
DEFERRED OUTFLOWS OF RESOURCES 3,018,341$ 2,889,179$ 129,162$
TOTAL ASSETS AND DEFERRED OUTFLOWS OF RESOURCES 619,577,038$ 592,900,409$ 26,676,629$
LIABILITIES AND NET POSITIONCURRENT LIABILITIES:
Accrued Salaries and Employee Benefits 3,474,673$ 4,015,907$ (541,234) Accrued Other Operating Expenses 2,054,935 1,547,512 507,423
Accrued Taxes and Licenses 26,536,275 17,631,626 8,904,649 Claims Payable (Reported) 25,988,208 23,081,047 2,907,161 IBNR - Inpatient Claims 33,478,470 29,387,438 4,091,032 IBNR - Physician Claims 15,114,732 16,238,253 (1,123,521)
IBNR - Accrued Other Medical 25,003,428 25,041,289 (37,861) Risk Pool and Withholds Payable 5,005,162 5,005,162 -
Statutory Allowance for Claims Processing Expense 2,225,904 2,066,234 159,670 Other Liabilities 49,422,734 49,720,472 (297,738)
Accrued Hospital Directed Payments 195,667,272 185,930,497 9,736,775 Total Current Liabilities 383,971,793$ 359,665,437$ 24,306,356$
NONCURRENT LIABILITIES:Net Pension Liability 8,432,377 6,564,477 1,867,900
TOTAL NONCURRENT LIABILITIES 8,432,377$ 6,564,477$ 1,867,900$
DEFERRED INFLOWS OF RESOURCES 86,684$ 420,664$ (333,980)$
NET POSITION:Net Position - Beg. of Year 214,692,379 214,692,379 -
Increase (Decrease) in Net Position - Current Year 12,393,805 11,557,452 836,353 Total Net Position 227,086,184$ 226,249,831$ 836,353$
TOTAL LIABILITIES, DEFERRED INFLOWS OF RESOURCES AND NET POSITION 619,577,038$ 592,900,409$ 26,676,629$
KHS3/29/2021Management Use Only Page 1
KHS Finance Committee Meeting, April 9, 2021
90 / 144

KERN HEALTH SYSTEMS
MEDI-CAL - ALL COA
CURRENT MONTH MEMBERS
STATEMENT OF REVENUE, EXPENSES, AND CHANGES IN NET POSITION YEAR-TO-DATE MEMBER MONTHS
ACTUAL BUDGET VARIANCE FOR THE MONTH ENDED DECEMBER 31, 2020 ACTUAL BUDGET VARIANCE
E N R O L L M E N T183,143 171,900 11,243 Family Members 2,090,898 2,036,400 54,498
70,741 61,090 9,651 Expansion Members 779,144 733,080 46,06415,677 14,730 947 SPD Members 188,095 176,760 11,335
7,891 6,205 1,686 Other Members 90,332 74,460 15,87210,909 8,660 2,249 Kaiser Members 118,205 103,920 14,285
288,361 262,585 25,776 T o t a l M e m b e r s - MCAL 3,266,674 3,124,620 142,054
R E V E N U E S32,216,002 27,737,504 4,478,498 Title XIX - Medicaid - Family and Other 358,586,218 330,503,421 28,082,79727,197,954 23,145,509 4,052,445 Title XIX - Medicaid - Expansion Members 295,668,076 277,746,111 17,921,96515,504,966 14,884,621 620,345 Title XIX - Medicaid - SPD Members 182,444,049 178,615,454 3,828,595
8,830,398 10,157,000 (1,326,602) Premium - MCO Tax 98,918,724 120,828,000 (21,909,276)9,738,038 11,113,880 (1,375,842) Premium - Hospital Directed Payments 107,913,519 133,083,820 (25,170,301)
147,197 403,496 (256,299) Investment Earnings And Other Income 2,508,382 4,800,000 (2,291,618)73,638 (73,638) Reinsurance Recoveries - 876,003 (876,003)
(2,692) - (2,692) Rate Adjustments - Hospital Directed Payments (51,776,089) - (51,776,089)226,726 - 226,726 Rate/Income Adjustments (1,093,042) - (1,093,042)
93,858,589 87,515,649 6,342,940 TOTAL REVENUES 993,169,837 1,046,452,808 (53,282,971)
E X P E N S E SMedical Costs:
12,660,363 14,491,234 1,830,871 Physician Services 161,329,321 172,781,008 11,451,6874,935,401 4,658,089 (277,312) Other Professional Services 50,123,357 55,618,439 5,495,0823,194,257 5,202,479 2,008,222 Emergency Room 53,283,940 61,951,060 8,667,120
19,183,080 13,592,759 (5,590,321) I n p a t i e n t 196,200,624 162,271,155 (33,929,469)77,390 73,638 (3,752) Reinsurance Expense 904,111 876,003 (28,108)
6,565,195 6,587,593 22,398 Outpatient Hospital 76,997,217 78,700,252 1,703,03513,070,247 7,076,003 (5,994,244) Other Medical 126,766,744 84,351,333 (42,415,411)
9,651,881 9,762,500 110,619 Pharmacy 110,545,817 116,680,328 6,134,511- 507,850 507,850 Pay for Performance Quality Incentive 5,721,372 6,041,400 320,028 - - - Risk Corridor Expense - - -
9,738,038 11,113,880 1,375,842 Hospital Directed Payments 107,913,519 133,083,820 25,170,301 (1,263) - 1,263 Hospital Directed Payment Adjustment (52,015,573) - 52,015,573 1,598 - (1,598) Non-Claims Expense Adjustment (2,453,956) - 2,453,956
316,193 - (316,193) IBNR, Incentive, Paid Claims Adjustment (11,093,983) - 11,093,983 79,392,380 73,066,026 (6,326,354) Total Medical Costs 824,222,510 872,354,797 48,132,287
14,466,209 14,449,623 16,586 GROSS MARGIN 168,947,327 174,098,011 (5,150,684)
Administrative:2,766,869 2,662,765 (104,104) Compensation 31,125,056 32,037,320 912,2641,172,530 863,602 (308,928) Purchased Services 9,801,258 10,334,292 533,034
39,305 119,220 79,915 Supplies 820,862 1,430,519 609,657421,301 337,375 (83,926) Depreciation 5,034,206 4,002,500 (1,031,706)351,189 348,062 (3,127) Other Administrative Expenses 3,338,727 4,202,042 863,315
1,407,045 - (1,407,045) Administrative Expense Adjustment 1,194,816 - (1,194,816) 6,158,239 4,331,024 (1,827,215) Total Administrative Expenses 51,314,925 52,006,674 691,749
85,550,619 77,397,050 (8,153,569) TOTAL EXPENSES 875,537,435 924,361,471 48,824,036
8,307,970 10,118,599 (1,810,629) OPERATING INCOME (LOSS) BEFORE TAX 117,632,402 122,091,338 (4,458,935)
8,904,649 10,157,000 1,252,351 MCO TAX 100,919,574 120,828,000 19,908,426
(596,679) (38,401) (558,278) OPERATING INCOME (LOSS) NET OF TAX 16,712,828 1,263,338 15,449,491
NONOPERATING REVENUE (EXPENSE)- - - Gain on Sale of Assets - - -
903,360 (333,334) 1,236,694 Provider Recruitment and Retention Grants (3,180,388) (4,000,000) 819,612 529,672 (507,760) 1,037,432 Health Home (1,138,635) (6,093,109) 4,954,474
1,433,032 (841,094) 2,274,126 TOTAL NONOPERATING REVENUE (EXPENSE) (4,319,023) (10,093,109) 5,774,086
836,353 (879,495) 1,715,848 NET INCREASE (DECREASE) IN NET POSITION 12,393,805 (8,829,771) 21,223,577
92.5% 93.5% 1.0% MEDICAL LOSS RATIO 91.7% 93.3% 1.6%
8.2% 6.5% -1.6% ADMINISTRATIVE EXPENSE RATIO 6.1% 6.6% 0.4%
KHS3/29/2021Management Use Only Page 2
KHS Finance Committee Meeting, April 9, 2021
91 / 144

KERN HEALTH SYSTEMS
MEDI-CAL
CURRENT MONTH
STATEMENT OF REVENUE, EXPENSES, AND CHANGES IN NET POSITION - PMPM YEAR-TO-DATE
ACTUAL BUDGET VARIANCE FOR THE MONTH ENDED DECEMBER 31, 2020 ACTUAL BUDGET VARIANCE
E N R O L L M E N T183,143 171,900 11,243 Family Members 2,090,898 2,036,400 54,498
70,741 61,090 9,651 Expansion Members 779,144 733,080 46,06415,677 14,730 947 SPD Members 188,095 176,760 11,335
7,891 6,205 1,686 Other Members 90,332 74,460 15,87210,909 8,660 2,249 Kaiser Members 118,205 103,920 14,285
288,361 262,585 25,776 T o t a l M e m b e r s - MCAL 3,266,674 3,124,620 142,054
R E V E N U E S168.64 155.74 12.90 Title XIX - Medicaid - Family and Other 164.40 156.57 7.82384.47 378.88 5.60 Title XIX - Medicaid - Expansion Members 379.48 378.88 0.60989.03 1,010.50 (21.47) Title XIX - Medicaid - SPD Members 969.96 1,010.50 (40.54)
31.83 40.00 (8.17) Premium - MCO Tax 31.42 40.00 (8.58)35.10 43.77 (8.67) Premium - Hospital Directed Payments 34.27 44.06 (9.78)
0.53 1.59 (1.06) Investment Earnings And Other Income 0.80 1.59 (0.79)0.00 0.29 (0.29) Reinsurance Recoveries 0.00 0.29 (0.29)
(0.01) 0.00 (0.01) Rate Adjustments - Hospital Directed Payments (16.44) 0.00 (16.44)0.82 0.00 0.82 Rate/Income Adjustments (0.35) 0.00 (0.35)
338.29 344.65 (6.36) TOTAL REVENUES 315.45 346.43 (30.98)
E X P E N S E SMedical Costs:
45.63 57.07 11.44 Physician Services 51.24 57.20 5.9617.79 18.34 0.56 Other Professional Services 15.92 18.41 2.4911.51 20.49 8.98 Emergency Room 16.92 20.51 3.5969.14 53.53 (15.61) I n p a t i e n t 62.32 53.72 (8.60)
0.28 0.29 0.01 Reinsurance Expense 0.29 0.29 0.0023.66 25.94 2.28 Outpatient Hospital 24.46 26.05 1.6047.11 27.87 (19.24) Other Medical 40.26 27.92 (12.34)34.79 38.45 3.66 Pharmacy 35.11 38.63 3.52
0.00 2.00 2.00 Pay for Performance Quality Incentive 1.82 2.00 0.180.00 0.00 0.00 Risk Corridor Expense 0.00 0.00 0.00
35.10 43.77 8.67 Hospital Directed Payments 34.27 44.06 9.78(0.00) 0.00 0.00 Hospital Directed Payment Adjustment (16.52) 0.00 16.520.01 0.00 (0.01) Non-Claims Expense Adjustment (0.78) 0.00 0.781.14 0.00 (1.14) IBNR, Incentive, Paid Claims Adjustment (3.52) 0.00 3.52
286.15 287.75 1.60 Total Medical Costs 261.79 288.79 27.01
52.14 56.91 (4.77) GROSS MARGIN 53.66 57.63 (3.97)Administrative:
9.97 10.49 0.51 Compensation 9.89 10.61 0.724.23 3.40 (0.83) Purchased Services 3.11 3.42 0.310.14 0.47 0.33 Supplies 0.26 0.47 0.211.52 1.33 (0.19) Depreciation 1.60 1.33 (0.27)1.27 1.37 0.10 Other Administrative Expenses 1.06 1.39 0.335.07 0.00 (5.07) Administrative Expense Adjustment 0.38 0.00 (0.38)
22.20 17.06 (5.14) Total Administrative Expenses 16.30 17.22 0.92
308.34 304.80 (3.54) TOTAL EXPENSES 278.08 306.01 27.93
29.94 39.85 (9.90) OPERATING INCOME (LOSS) BEFORE TAX 37.36 40.42 (3.06)
32.09 40.00 7.91 MCO TAX 32.05 40.00 7.95
(2.15) (0.15) (2.00) OPERATING INCOME (LOSS) NET OF TAX 5.31 0.42 4.89
NONOPERATING REVENUE (EXPENSE)0.00 0.00 0.00 Gain on Sale of Assets 0.00 0.00 0.003.26 (1.31) 4.57 Reserve Fund Projects/Community Grants (1.01) (1.32) 0.311.91 (2.00) 3.91 Health Home (0.36) (2.02) 1.665.16 (3.31) 8.48 TOTAL NONOPERATING REVENUE (EXPENSE) (1.37) (3.34) 1.97
3.01 (3.46) 6.48 NET INCREASE (DECREASE) IN NET POSITION 3.94 (2.92) 6.86
92.5% 93.5% 1.0% MEDICAL LOSS RATIO 91.7% 93.3% 1.6%
8.2% 6.5% -1.6% ADMINISTRATIVE EXPENSE RATIO 6.1% 6.6% 0.4%
KHS3/29/2021Management Use Only Page 3
KHS Finance Committee Meeting, April 9, 2021
92 / 144

KERN HEALTH SYSTEMSMEDI-CAL
STATEMENT OF REVENUE, EXPENSES, AND CHANGES IN NET POSITION BY MONTH -
ROLLING 13 MONTHSTHROUGH DECEMBER 31, 2020
E N R O L L M E N TM e m b e r s - MCAL 249,381 248,640 250,007 251,552 252,950 256,134 259,592 261,732 264,749 278,100 272,481 275,080 277,452 3,397,850
R E V E N U E STitle XIX - Medicaid - Family and Other 28,289,680 28,111,536 28,136,428 28,589,738 27,567,358 28,170,470 30,522,053 29,997,411 30,548,160 30,419,692 33,387,274 30,920,096 32,216,002 386,875,898
Title XIX - Medicaid - Expansion Members 24,658,622 23,135,804 23,419,130 23,548,401 22,679,789 23,386,527 24,776,875 24,533,357 24,848,094 25,069,155 27,568,938 25,504,052 27,197,954 320,326,698Title XIX - Medicaid - SPD Members 15,294,321 15,020,731 15,113,713 15,275,980 14,884,891 14,967,019 15,603,750 15,224,387 15,192,022 15,191,965 14,457,143 16,007,482 15,504,966 197,738,370
Premium - MCO Tax (52,290,862) - 16,158,895 7,586,709 7,915,338 7,915,091 8,023,287 8,236,232 8,333,151 8,332,682 9,166,454 8,420,487 8,830,398 46,627,862Premium - Hospital Directed Payments 136,163,466 11,276,584 11,391,396 11,495,457 11,614,664 11,614,663 12,149,677 (8,860,821) 9,112,870 9,112,869 9,955,034 9,313,088 9,738,038 244,076,985Investment Earnings And Other Income 731,395 190,131 301,265 424,094 266,256 323,827 62,534 315,583 173,465 (14,474) 151,948 166,556 147,197 3,239,777
Reinsurance Recoveries - - - - - - - - - - - - - 0Rate Adjustments - Hospital Directed Payments 101,394,310 118,333 60,959 42,436 36,523 36,524 (10,733) (52,075,301) 4,234 2,924 77 10,627 (2,692) 49,618,221
Rate/Income Adjustments (391,644) 819,618 809,261 616,798 (4,529,302) 444,891 476,588 135,705 291,820 70,321 (582,499) 127,031 226,726 (1,484,686)TOTAL REVENUES 253,849,288 78,672,737 95,391,047 87,579,613 80,435,517 86,859,012 91,604,031 17,506,553 88,503,816 88,185,134 94,104,369 90,469,419 93,858,589 1,247,019,125
E X P E N S E SMedical Costs:
Physician Services 15,556,899 14,757,546 13,873,238 14,351,280 12,418,888 12,429,908 11,806,601 13,357,636 13,134,194 14,514,021 14,157,774 13,867,872 12,660,363 176,886,220 Other Professional Services 4,371,702 4,334,953 3,966,515 4,024,762 3,908,759 3,489,408 3,385,134 4,421,687 4,619,091 4,841,378 3,806,785 4,389,484 4,935,401 54,495,059
Emergency Room 4,729,725 5,226,947 5,258,084 5,370,795 3,813,875 4,212,272 3,363,172 3,651,975 4,813,363 4,926,059 4,814,428 4,638,713 3,194,257 58,013,665 I n p a t i e n t 14,449,035 14,911,677 13,893,706 14,743,904 15,995,368 14,410,696 17,115,732 17,082,368 16,635,497 17,879,275 17,137,251 17,212,070 19,183,080 210,649,659
Reinsurance Expense 128,012 72,320 144,425 (213) 77,341 69,310 73,356 75,202 76,284 76,523 77,652 84,521 77,390 1,032,123Outpatient Hospital 4,767,801 6,734,395 6,204,610 6,566,090 6,270,816 5,199,240 6,447,664 6,446,825 6,894,371 6,804,640 6,653,372 6,209,999 6,565,195 81,765,018
Other Medical 6,649,662 5,661,784 10,021,013 10,653,430 8,832,073 10,860,308 9,199,742 11,504,806 9,055,443 14,033,235 12,916,278 10,958,385 13,070,247 133,416,406Pharmacy 9,267,277 9,971,687 9,246,208 10,311,873 8,667,925 8,616,291 8,313,457 8,780,407 9,180,669 9,829,083 9,259,169 8,717,167 9,651,881 119,813,094
Pay for Performance Quality Incentive 498,762 497,280 500,014 503,104 509,814 508,354 519,184 523,464 529,498 529,498 556,200 544,962 - 6,220,134Risk Corridor Expense - - - - - - 4,700,000 (2,000,000) - (2,700,000) - - - -
Hospital Directed Payments 136,163,466 11,276,584 11,391,396 11,495,457 11,614,664 11,614,663 12,149,677 (8,860,821) 9,112,870 9,112,869 9,955,034 9,313,088 9,738,038 244,076,985Hospital Directed Payment Adjustment 101,154,229 118,333 60,959 42,436 36,523 36,524 (10,733) (52,075,301) (233,958) 4,234 77 6,596 (1,263) 49,138,656
Non-Claims Expense Adjustment 4,624 57,172 232,393 (1,583,770) 1,420 167,936 (325,027) (23,790) (157) (777,546) 5,124 (209,309) 1,598 (2,449,332) IBNR, Incentive, Paid Claims Adjustment (259,737) 816 (8,559) (2,649,204) (4,444,586) 11,543 (426,819) 344,451 (120,764) (4,317,566) (5,474) 205,986 316,193 (11,353,720)
Total Medical Costs 297,481,457 73,621,494 74,784,002 73,829,944 67,702,880 71,626,453 76,311,140 3,228,909 73,696,401 74,755,703 79,333,670 75,939,534 79,392,380 1,121,703,967
GROSS MARGIN (43,632,169) 5,051,243 20,607,045 13,749,669 12,732,637 15,232,559 15,292,891 14,277,644 14,807,415 13,429,431 14,770,699 14,529,885 14,466,209 125,315,158Administrative: Compensation 2,589,213 2,577,348 2,407,112 2,447,667 2,678,816 2,375,693 2,835,739 2,732,099 2,597,575 2,636,509 2,613,272 2,456,357 2,766,869 33,714,269
Purchased Services 1,358,494 805,903 728,049 867,391 644,717 903,379 1,142,683 859,845 819,771 421,612 689,841 745,537 1,172,530 11,159,752 Supplies (7,208) 35,806 149,042 99,552 60,138 59,208 29,774 71,551 63,919 71,111 34,967 106,489 39,305 813,654
Depreciation 304,894 287,390 287,536 300,318 300,318 924,253 418,036 417,768 418,389 419,251 419,796 419,850 421,301 5,339,100 Other Administrative Expenses 344,959 353,414 181,493 269,559 441,804 223,548 345,337 240,778 254,091 296,858 137,960 242,696 351,189 3,683,686
Administrative Expense Adjustment 1,325,136 - - - - - (212,229) - - - - - 1,407,045 2,519,952 Total Administrative Expenses 5,915,488 4,059,861 3,753,232 3,984,487 4,125,793 4,486,081 4,559,340 4,322,041 4,153,745 3,845,341 3,895,836 3,970,929 6,158,239 57,230,413
TOTAL EXPENSES 303,396,945 77,681,355 78,537,234 77,814,431 71,828,673 76,112,534 80,870,480 7,550,950 77,850,146 78,601,044 83,229,506 79,910,463 85,550,619 1,178,934,380
OPERATING INCOME (LOSS) BEFORE TAX (49,547,657) 991,382 16,853,813 9,765,182 8,606,844 10,746,478 10,733,551 9,955,603 10,653,670 9,584,090 10,874,863 10,558,956 8,307,970 68,084,745
MCO TAX (52,962,035) - 16,159,021 7,586,709 7,915,243 7,914,997 7,915,244 8,904,648 8,905,117 8,904,649 8,904,648 8,904,649 8,904,649 47,957,539
OPERATING INCOME (LOSS) NET OF TAX 3,414,378 991,382 694,792 2,178,473 691,601 2,831,481 2,818,307 1,050,955 1,748,553 679,441 1,970,215 1,654,307 (596,679) 20,127,206
TOTAL NONOPERATING REVENUE (EXPENSE) (425,785) (942,282) (569,882) (1,076,457) 424,682 (587,120) (479,019) 462,756 (687,453) (176,843) (1,188,755) (931,682) 1,433,032 (4,744,808)
NET INCREASE (DECREASE) IN NET POSITION 2,988,593 49,100 124,910 1,102,016 1,116,283 2,244,361 2,339,288 1,513,711 1,061,100 502,598 781,460 722,625 836,353 15,382,398
MEDICAL LOSS RATIO 87.7% 92.5% 93.4% 91.0% 92.1% 89.1% 89.8% 91.4% 91.2% 92.8% 92.5% 91.6% 92.5% 91.4%
ADMINISTRATIVE EXPENSE RATIO 8.6% 6.0% 5.5% 5.8% 6.8% 6.7% 6.4% 6.2% 5.8% 5.4% 5.2% 5.5% 8.2% 6.3%
DECEMBER 2019
13 MONTH TOTAL
JANUARY 2020
FEBRUARY 2020
MARCH 2020
APRIL 2020
MAY 2020
JUNE 2020
JULY 2020
AUGUST 2020
SEPTEMBER 2020
OCTOBER 2020
NOVEMBER 2020
DECEMBER 2020
KHS3/29/2021Management Use Only
Page 4
KHS Finance Committee Meeting, April 9, 2021
93 / 144

KERN HEALTH SYSTEMSMEDI-CAL
STATEMENT OF REVENUE, EXPENSES, AND CHANGES IN NET POSITION BY MONTH - PMPM
ROLLING 13 MONTHSTHROUGH DECEMBER 31, 2020
E N R O L L M E N TM e m b e r s - MCAL 249,381 248,640 250,007 251,552 252,950 256,134 259,592 261,732 264,749 278,100 272,481 275,080 277,452 3,397,850
R E V E N U E STitle XIX - Medicaid - Family and Other 162.50 162.42 161.68 163.16 157.08 158.57 169.56 165.45 166.87 166.16 173.40 164.62 168.64 164.26
Title XIX - Medicaid - Expansion Members 410.96 386.25 387.18 388.37 369.04 373.98 388.48 377.98 376.19 379.54 393.46 371.41 384.47 381.73Title XIX - Medicaid - SPD Members 1,000.74 958.75 975.52 973.74 930.77 938.61 987.39 981.08 972.23 972.22 945.03 1,012.68 989.03 972.27
Premium - MCO Tax (209.68) 0.00 64.63 30.16 31.29 30.90 30.91 31.47 31.48 29.96 33.64 30.61 31.83 13.72Premium - Hospital Directed Payments 546.01 45.35 45.56 45.70 45.92 45.35 46.80 (33.85) 34.42 32.77 36.53 33.86 35.10 71.83Investment Earnings And Other Income 2.93 0.76 1.21 1.69 1.05 1.26 0.24 1.21 0.66 (0.05) 0.56 0.61 0.53 0.95
Reinsurance Recoveries 0.00 0.00 0.00 0.00 0.00 0.00 0.00 0.00 0.00 0.00 0.00 0.00 0.00 0.00Rate Adjustments - Hospital Directed Payments 406.58 0.48 0.24 0.17 0.14 0.14 (0.04) (198.96) 0.02 0.01 0.00 0.04 (0.01) 14.60
Rate/Income Adjustments (1.57) 3.30 3.24 2.45 (17.91) 1.74 1.84 0.52 1.10 0.25 (2.14) 0.46 0.82 (0.44)TOTAL REVENUES 1,017.92 316.41 381.55 348.16 317.99 339.12 352.88 66.89 334.29 317.10 345.36 328.88 338.29 367.00
E X P E N S E SMedical Costs:
Physician Services 62.38 59.35 55.49 57.05 49.10 48.53 45.48 51.04 49.61 52.19 51.96 50.41 45.63 52.06Other Professional Services 17.53 17.43 15.87 16.00 15.45 13.62 13.04 16.89 17.45 17.41 13.97 15.96 17.79 16.04
Emergency Room 18.97 21.02 21.03 21.35 15.08 16.45 12.96 13.95 18.18 17.71 17.67 16.86 11.51 17.07I n p a t i e n t 57.94 59.97 55.57 58.61 63.24 56.26 65.93 65.27 62.83 64.29 62.89 62.57 69.14 61.99
Reinsurance Expense 0.51 0.29 0.58 (0.00) 0.31 0.27 0.28 0.29 0.29 0.28 0.28 0.31 0.28 0.30Outpatient Hospital 19.12 27.08 24.82 26.10 24.79 20.30 24.84 24.63 26.04 24.47 24.42 22.58 23.66 24.06
Other Medical 26.66 22.77 40.08 42.35 34.92 42.40 35.44 43.96 34.20 50.46 47.40 39.84 47.11 39.26Pharmacy 37.16 40.10 36.98 40.99 34.27 33.64 32.03 33.55 34.68 35.34 33.98 31.69 34.79 35.26
Pay for Performance Quality Incentive 2.00 2.00 2.00 2.00 2.02 1.98 2.00 2.00 2.00 1.90 2.04 1.98 0.00 1.83Risk Corridor Expense 0.00 0.00 0.00 0.00 0.00 0.00 18.11 (7.64) 0.00 (9.71) 0.00 0.00 0.00 0.00
Hospital Directed Payments 546.01 45.35 45.56 45.70 45.92 45.35 46.80 (33.85) 34.42 32.77 36.53 33.86 35.10 71.83Hospital Directed Payment Adjustment 405.62 0.48 0.24 0.17 0.14 0.14 (0.04) (198.96) (0.88) 0.02 0.00 0.02 (0.00) 14.46
Non-Claims Expense Adjustment 0.02 0.23 0.93 (6.30) 0.01 0.66 (1.25) (0.09) (0.00) (2.80) 0.02 (0.76) 0.01 (0.72)IBNR, Incentive, Paid Claims Adjustment (1.04) 0.00 (0.03) (10.53) (17.57) 0.05 (1.64) 1.32 (0.46) (15.53) (0.02) 0.75 1.14 (3.34)
Total Medical Costs 1,192.88 296.10 299.13 293.50 267.65 279.64 293.97 12.34 278.36 268.81 291.15 276.06 286.15 330.12
GROSS MARGIN (174.96) 20.32 82.43 54.66 50.34 59.47 58.91 54.55 55.93 48.29 54.21 52.82 52.14 36.88 Administrative:
Compensation 10.38 10.37 9.63 9.73 10.59 9.28 10.92 10.44 9.81 9.48 9.59 8.93 9.97 9.92Purchased Services 5.45 3.24 2.91 3.45 2.55 3.53 4.40 3.29 3.10 1.52 2.53 2.71 4.23 3.28
Supplies (0.03) 0.14 0.60 0.40 0.24 0.23 0.11 0.27 0.24 0.26 0.13 0.39 0.14 0.24Depreciation 1.22 1.16 1.15 1.19 1.19 3.61 1.61 1.60 1.58 1.51 1.54 1.53 1.52 1.57
Other Administrative Expenses 1.38 1.42 0.73 1.07 1.75 0.87 1.33 0.92 0.96 1.07 0.51 0.88 1.27 1.08Administrative Expense Adjustment 5.31 0.00 0.00 0.00 0.00 0.00 (0.82) 0.00 0.00 0.00 0.00 0.00 5.07 0.74
Total Administrative Expenses 23.72 16.33 15.01 15.84 16.31 17.51 17.56 16.51 15.69 13.83 14.30 14.44 22.20 16.84
TOTAL EXPENSES 1,216.60 312.43 314.14 309.34 283.96 297.16 311.53 28.85 294.05 282.64 305.45 290.50 308.34 346.96
OPERATING INCOME (LOSS) BEFORE TAX (198.68) 3.99 67.41 38.82 34.03 41.96 41.35 38.04 40.24 34.46 39.91 38.39 29.94 20.04
MCO TAX (212.37) 0.00 64.63 30.16 31.29 30.90 30.49 34.02 33.64 32.02 32.68 32.37 32.09 14.11
OPERATING INCOME (LOSS) NET OF TAX 13.69 3.99 2.78 8.66 2.73 11.05 10.86 4.02 6.60 2.44 7.23 6.01 (2.15) 5.92
TOTAL NONOPERATING REVENUE (EXPENSE) (1.71) (3.79) (2.28) (4.28) 1.68 (2.29) (1.85) 1.77 (2.60) (0.64) (4.36) (3.39) 5.16 (1.40)
NET INCREASE (DECREASE) IN NET POSITION 11.98 0.20 0.50 4.38 4.41 8.76 9.01 5.78 4.01 1.81 2.87 2.63 3.01 4.53
MEDICAL LOSS RATIO 87.7% 92.5% 93.4% 91.0% 92.1% 89.1% 89.8% 91.4% 91.2% 92.8% 92.5% 91.6% 92.5% 91.4%
ADMINISTRATIVE EXPENSE RATIO 8.6% 6.0% 5.5% 5.8% 6.8% 6.7% 6.4% 6.2% 5.8% 5.4% 5.2% 5.5% 8.2% 6.3%
13 MONTH TOTAL
DECEMBER 2019
JANUARY 2020
FEBRUARY 2020
MARCH 2020
APRIL 2020
MAY 2020
JUNE 2020
JULY 2020
AUGUST 2020
SEPTEMBER 2020
OCTOBER 2020
NOVEMBER 2020
DECEMBER 2020
KHS3/29/2021Management Use Only Page 5
KHS Finance Committee Meeting, April 9, 2021
94 / 144

KERN HEALTH SYSTEMS
MEDI-CALCURRENT MONTH SCHEDULE OF REVENUES - ALL COA YEAR-TO-DATE
ACTUAL BUDGET VARIANCE FOR THE MONTH ENDED DECEMBER 31, 2020 ACTUAL BUDGET VARIANCER E V E N U E S
Title XIX - Medicaid - Family & Other
25,208,935 22,380,311 2,828,624 Premium - Medi-Cal 278,680,092 266,640,300 12,039,7922,162,393 2,375,503 (213,110) Premium - Maternity Kick 28,345,862 28,506,036 (160,174)
83,691 74,145 9,546 Premium - Hep C Kick 724,444 878,748 (154,304)517,514 607,441 (89,927) Premium - BHT Kick 4,990,388 7,199,255 (2,208,867)204,206 318,799 (114,593) Premium - Health Home Kick 2,158,083 3,778,332 (1,620,249)
3,613,689 1,728,475 1,885,214 Premium - Provider Enhancement 40,388,365 20,484,300 19,904,065177,982 158,519 19,463 Premium - Ground Emergency Medical Transportation 1,972,977 1,887,202 85,775137,706 - 137,706 Premium - Behavorial Health Integration Program 137,706 - 137,706109,886 94,311 15,575 Other 1,188,301 1,129,248 59,053
32,216,002 27,737,504 4,478,498 Total Title XIX - Medicaid - Family & Other 358,586,218 330,503,421 28,082,797Title XIX - Medicaid - Expansion Members
24,593,677 21,183,611 3,410,066 Premium - Medi-Cal 267,589,247 254,203,333 13,385,914265,443 214,189 51,254 Premium - Maternity Kick 3,004,172 2,570,269 433,903240,609 303,377 (62,768) Premium - Hep C Kick 2,819,315 3,640,525 (821,210)392,566 519,998 (127,432) Premium - Health Home Kick 4,167,547 6,239,977 (2,072,430)
1,439,612 742,244 697,369 Premium - Provider Enhancement 15,694,704 8,906,927 6,787,778181,599 152,964 28,635 Premium - Ground Emergency Medical Transportation 1,979,203 1,835,568 143,635
50,991 - 50,991 Premium - Behavorial Health Integration Program 50,991 - 50,99133,457 29,126 4,331 Other 362,897 349,512 13,385
27,197,954 23,145,509 4,052,445 Total Title XIX - Medicaid - Expansion Members 295,668,076 277,746,111 17,921,965Title XIX - Medicaid - SPD Members
13,749,355 13,148,587 600,768 Premium - Medi-Cal 163,507,253 157,783,045 5,724,208104,613 94,152 10,461 Premium - Hep C Kick 1,323,352 1,129,824 193,528 531,772 818,847 (287,075) Premium - BHT Kick 6,238,606 9,826,164 (3,587,558)504,829 416,635 88,194 Premium - Health Home Kick 4,185,688 4,999,620 (813,932)463,574 282,521 181,053 Premium - Provider Enhancement 5,518,712 3,390,252 2,128,460139,522 123,879 15,643 Premium - Ground Emergency Medical Transportation 1,659,137 1,486,548 172,589
11,301 - 11,301 Premium - Behavorial Health Integration Program 11,301 - 11,30115,504,966 14,884,621 620,345 Total Title XIX - Medicaid - SPD Members 182,444,049 178,615,453 3,828,596
KHS3/29/2021Management Use Only Page 6
KHS Finance Committee Meeting, April 9, 2021
95 / 144

KERN HEALTH SYSTEMS
MEDI-CALCURRENT MONTH SCHEDULE OF MEDICAL COSTS - ALL COA YEAR-TO-DATE
ACTUAL BUDGET VARIANCE FOR THE MONTH ENDED DECEMBER 31, 2020 ACTUAL BUDGET VARIANCE
PHYSICIAN SERVICES3,149,306 2,899,018 (250,288) Primary Care Physician Services 33,584,705 34,497,932 913,2278,104,692 10,141,905 2,037,213 Referral Specialty Services 111,914,003 121,039,398 9,125,3951,397,065 1,441,011 43,946 Urgent Care & After Hours Advise 15,720,813 17,133,879 1,413,066
9,300 9,300 - Hospital Admitting Team 109,800 109,800 -
12,660,363 14,491,234 1,830,871 TOTAL PHYSICIAN SERVICES 161,329,321 172,781,008 11,451,687
OTHER PROFESSIONAL SERVICES280,205 272,397 (7,808) Vision Service Capitation 3,312,525 3,251,683 (60,842)202,794 212,779 9,985 221 - Business Intelligence 2,484,467 2,553,348 68,881576,533 560,329 (16,204) 310 - Health Services - Utilization Management - UM Allocation * 6,940,669 6,671,968 (268,701)122,403 169,507 47,104 311 - Health Services - Quality Improvement - UM Allocation * 1,714,160 2,034,046 319,886125,888 127,991 2,103 312 - Health Services - Education - UM Allocation * 1,390,735 1,535,888 145,15387,073 94,630 7,557 313 - Health Services - Pharmacy - UM Allocation * 1,015,587 1,135,565 119,978
133,500 139,492 5,992 314 - Health Homes - UM Allocation * 1,320,504 1,629,491 308,987266,254 258,856 (7,398) 315 - Case Management - UM Allocation * 3,167,483 3,106,275 (61,208)59,314 61,775 2,461 616 - Disease Management - UM Allocation * 717,270 741,297 24,027
1,309,847 1,426,288 116,441 Behavior Health Treatment 11,877,951 17,025,420 5,147,469133,466 171,520 38,054 Mental Health Services 1,431,695 2,050,521 618,826
1,638,124 1,162,525 (475,599) Other Professional Services 14,750,311 13,882,937 (867,374)
4,935,401 4,658,089 (277,312) TOTAL OTHER PROFESSIONAL SERVICES 50,123,357 55,618,439 5,495,082
3,194,257 5,202,479 2,008,222 EMERGENCY ROOM 53,283,940 61,951,060 8,667,120
19,183,080 13,592,759 (5,590,321) INPATIENT HOSPITAL 196,200,624 162,271,155 (33,929,469)
77,390 73,638 (3,752) REINSURANCE EXPENSE PREMIUM 904,111 876,003 (28,108)
6,565,195 6,587,593 22,398 OUTPATIENT HOSPITAL SERVICES 76,997,217 78,700,252 1,703,035
OTHER MEDICAL 1,216,505 1,556,311 339,806 Ambulance and NEMT 14,928,009 18,575,529 3,647,520
546,590 391,165 (155,425) Home Health Services & CBAS 5,469,205 4,676,179 (793,026)429,853 511,873 82,020 Utilization and Quality Review Expenses 3,164,784 6,024,354 2,859,570
1,568,567 941,837 (626,730) Long Term/SNF/Hospice 15,568,858 11,275,540 (4,293,318)(42,600) 485,601 528,201 Health Home Capitation & Incentive 2,439,535 5,808,932 3,369,397
5,029,190 2,753,854 (2,275,336) Provider Enhancement Expense - Prop. 56 58,793,786 32,781,481 (26,012,305)480,982 435,362 (45,620) Provider Enhancement Expense - GEMT 5,362,387 5,209,318 (153,069)
3,841,160 - (3,841,160) Provider COVID-19 Expenes 21,040,180 - (21,040,180)
13,070,247 7,076,003 (5,994,244) TOTAL OTHER MEDICAL 126,766,744 84,351,333 (42,415,411)
PHARMACY SERVICES
8,657,426 8,743,981 86,555 RX - Drugs & OTC 99,509,583 104,500,319 4,990,736
334,193 471,673 137,480 RX - HEP-C 3,776,146 5,649,091 1,872,945
852,003 692,828 (159,175) Rx - DME 8,697,421 8,280,917 (416,504)
(191,741) (145,983) 45,758 RX - Pharmacy Rebates (1,437,333) (1,750,000) (312,667)
9,651,881 9,762,500 110,619 TOTAL PHARMACY SERVICES 110,545,817 116,680,328 6,134,511
- 507,850 507,850 PAY FOR PERFORMANCE QUALITY INCENTIVE 5,721,372 6,041,400 320,028
- - - RISK CORRIDOR EXPENSE - - -
9,738,038 11,113,880 1,375,842 HOSPITAL DIRECTED PAYMENTS 107,913,519 133,083,820 25,170,301
(1,263) - 1,263 HOSPITAL DIRECTED PAYMENT ADJUSTMENT (52,015,573) - 52,015,573
1,598 - (1,598) NON-CLAIMS EXPENSE ADJUSTMENT (2,453,956) - 2,453,956
316,193 - (316,193) IBNR, INCENTIVE, AND PAID CLAIMS ADJUSTMENT (11,093,983) - 11,093,983
79,392,380 73,066,026 (6,326,354) Total Medical Costs 824,222,510 872,354,797 48,132,287
* Medical costs per DMHC regulations KHS3/29/2021Management Use Only Page 7
KHS Finance Committee Meeting, April 9, 2021
96 / 144

KERN HEALTH SYSTEMS
MEDI-CALCURRENT MONTH SCHEDULE OF MEDICAL COSTS - ALL COA - PMPM YEAR-TO-DATE
ACTUAL BUDGET VARIANCE FOR THE MONTH ENDED DECEMBER 31, 2020 ACTUAL BUDGET VARIANCEPHYSICIAN SERVICES
11.35 11.42 0.07 Primary Care Physician Services 10.67 11.42 0.7529.21 39.94 10.73 Referral Specialty Services 35.55 40.07 4.52
5.04 5.67 0.64 Urgent Care & After Hours Advise 4.99 5.67 0.680.03 0.04 0.00 Hospital Admitting Team 0.03 0.04 0.00
45.63 57.07 11.44 TOTAL PHYSICIAN SERVICES 51.24 57.20 5.96OTHER PROFESSIONAL SERVICES
1.01 1.07 0.06 Vision Service Capitation 1.05 1.08 0.020.73 0.84 0.11 221 - Business Intelligence 0.79 0.85 0.062.08 2.21 0.13 310 - Health Services - Utilization Management - UM Allocation * 2.20 2.21 0.000.44 0.67 0.23 311 - Health Services - Quality Improvement - UM Allocation * 0.54 0.67 0.130.45 0.50 0.05 312 - Health Services - Education - UM Allocation * 0.44 0.51 0.070.31 0.37 0.06 313 - Health Services - Pharmacy - UM Allocation * 0.32 0.38 0.050.48 0.55 0.07 314 - Health Homes - UM Allocation * 0.42 0.54 0.120.96 1.02 0.06 315 - Case Management - UM Allocation * 1.01 1.03 0.020.21 0.24 0.03 616 - Disease Management - UM Allocation * 0.23 0.25 0.024.72 5.62 0.90 Behavior Health Treatment 3.77 5.64 1.860.48 0.68 0.19 Mental Health Services 0.45 0.68 0.225.90 4.58 (1.33) Other Professional Services 4.68 4.60 (0.09)17.79 18.34 0.56 TOTAL OTHER PROFESSIONAL SERVICES 15.92 18.41 2.49
11.51 20.49 8.98 EMERGENCY ROOM 16.92 20.51 3.5969.14 53.53 (15.61) INPATIENT HOSPITAL 62.32 53.72 (8.60)
0.28 0.29 0.01 REINSURANCE EXPENSE PREMIUM 0.29 0.29 0.0023.66 25.94 2.28 OUTPATIENT HOSPITAL SERVICES 24.46 26.05 1.60
OTHER MEDICAL 4.38 6.13 1.74 Ambulance and NEMT 4.74 6.15 1.411.97 1.54 (0.43) Home Health Services & CBAS 1.74 1.55 (0.19)1.55 2.02 0.47 Utilization and Quality Review Expenses 1.01 1.99 0.995.65 3.71 (1.94) Long Term/SNF/Hospice 4.94 3.73 (1.21)
(0.15) 1.91 2.07 Health Home Capitation & Incentive 0.77 1.92 1.1518.13 10.85 (7.28) Provider Enhancement Expense - Prop. 56 18.67 10.85 (7.82)
1.73 1.71 (0.02) Provider Enhancement Expense - GEMT 1.70 1.72 0.0213.84 0.00 (13.84) Provider COVID-19 Expenes 6.68 0.00 (6.68)47.11 27.87 (19.24) TOTAL OTHER MEDICAL 40.26 27.92 (12.34)
PHARMACY SERVICES 31.20 34.44 3.23 RX - Drugs & OTC 31.61 34.59 2.99
1.20 1.86 0.65 RX - HEP-C 1.20 1.87 0.673.07 2.73 (0.34) Rx - DME 2.76 2.74 (0.02)
(0.69) (0.57) 0.12 RX - Pharmacy Rebates (0.46) (0.58) (0.12)34.79 38.45 3.66 TOTAL PHARMACY SERVICES 35.11 38.63 3.52
- 2.00 2.00 PAY FOR PERFORMANCE QUALITY INCENTIVE 1.82 2.00 0.180.00 0.00 0.00 RISK CORRIDOR EXPENSE 0.00 0.00 0.00
35.10 43.77 8.67 HOSPITAL DIRECTED PAYMENTS 34.27 44.06 9.78(0.00) 0.00 0.00 HOSPITAL DIRECTED PAYMENT ADJUSTMENT (16.52) 0.00 16.520.01 0.00 (0.01) NON-CLAIMS EXPENSE ADJUSTMENT (0.78) 0.00 0.78 1.14 0.00 (1.14) IBNR, INCENTIVE, AND PAID CLAIMS ADJUSTMENT (3.52) 0.00 3.52
286.15 287.75 1.60 Total Medical Costs 261.79 288.79 27.01
* Medical costs per DMHC regulations
KHS3/29/2021Management Use Only Page 8
KHS Finance Committee Meeting, April 9, 2021
97 / 144

KERN HEALTH SYSTEMSMEDI-CAL
SCHEDULE OF MEDICAL COSTS BY MONTH THROUGH DECEMBER 31, 2020
PHYSICIAN SERVICESPrimary Care Physician Services 2,908,272 3,164,601 2,861,899 2,953,514 2,417,265 2,336,317 2,930,685 2,346,613 2,809,219 2,765,243 2,941,771 3,149,306 33,584,705
Referral Specialty Services 10,425,085 8,803,273 10,044,984 8,437,260 8,955,919 8,510,414 9,270,830 9,094,353 10,281,444 10,322,176 9,663,573 8,104,692 111,914,003Urgent Care & After Hours Advise 1,414,889 1,896,664 1,435,097 1,019,114 1,047,424 950,870 1,146,821 1,683,928 1,414,358 1,061,055 1,253,528 1,397,065 15,720,813
Hospital Admitting Team 9,300 8,700 9,300 9,000 9,300 9,000 9,300 9,300 9,000 9,300 9,000 9,300 109,800
TOTAL PHYSICIAN SERVICES 14,757,546 13,873,238 14,351,280 12,418,888 12,429,908 11,806,601 13,357,636 13,134,194 14,514,021 14,157,774 13,867,872 12,660,363 161,329,321
OTHER PROFESSIONAL SERVICESVision Service Capitation 299,489 261,072 261,072 263,942 267,033 265,598 272,284 276,202 278,450 281,154 306,024 280,205 3,312,525 221 - Business Intelligence 199,939 204,745 195,081 233,961 195,184 234,246 214,511 209,784 225,505 191,532 177,185 202,794 2,484,467
310 - Health Services - Utilization Management - UM Allocation * 550,905 482,617 507,782 619,537 541,633 584,598 629,823 568,977 619,543 626,261 632,460 576,533 6,940,669 311 - Health Services - Quality Improvement - UM Allocation * 130,719 131,973 135,845 172,419 144,487 144,162 159,894 142,027 154,808 159,386 116,037 122,403 1,714,160
312 - Health Services - Education - UM Allocation * 111,799 102,037 108,402 122,087 114,199 123,705 120,317 112,888 121,409 114,483 113,521 125,888 1,390,735 313 - Health Services - Pharmacy - UM Allocation * 88,153 80,696 81,505 86,248 76,014 89,969 88,996 83,460 86,476 81,501 85,496 87,073 1,015,587
314 - Health Homes - UM Allocation * 91,425 88,868 104,710 127,755 101,323 104,978 109,116 99,352 105,987 124,379 129,111 133,500 1,320,504 315 - Case Management - UM Allocation * 267,758 241,370 244,642 304,832 251,817 270,106 281,044 254,766 267,334 253,648 263,912 266,254 3,167,483
616 - Disease Management - UM Allocation * 56,335 54,217 57,384 69,526 56,199 58,667 66,395 58,838 63,644 60,587 56,164 59,314 717,270 Behavior Health Treatment 980,035 935,456 999,720 1,194,682 670,273 685,282 1,162,908 1,118,480 1,146,195 565,425 1,109,648 1,309,847 11,877,951
Mental Health Services 330,842 217,343 131,506 4,228 112,306 55,987 52,159 226,649 86,212 17,366 63,631 133,466 1,431,695 Other Professional Services 1,227,554 1,166,121 1,197,113 709,542 958,940 767,836 1,264,240 1,467,668 1,685,815 1,331,063 1,336,295 1,638,124 14,750,311
TOTAL OTHER PROFESSIONAL SERVICES 4,334,953 3,966,515 4,024,762 3,908,759 3,489,408 3,385,134 4,421,687 4,619,091 4,841,378 3,806,785 4,389,484 4,935,401 50,123,357
EMERGENCY ROOM 5,226,947 5,258,084 5,370,795 3,813,875 4,212,272 3,363,172 3,651,975 4,813,363 4,926,059 4,814,428 4,638,713 3,194,257 53,283,940
INPATIENT HOSPITAL 14,911,677 13,893,706 14,743,904 15,995,368 14,410,696 17,115,732 17,082,368 16,635,497 17,879,275 17,137,251 17,212,070 19,183,080 196,200,624
REINSURANCE EXPENSE PREMIUM 72,320 144,425 (213) 77,341 69,310 73,356 75,202 76,284 76,523 77,652 84,521 77,390 904,111
OUTPATIENT HOSPITAL SERVICES 6,734,395 6,204,610 6,566,090 6,270,816 5,199,240 6,447,664 6,446,825 6,894,371 6,804,640 6,653,372 6,209,999 6,565,195 76,997,217
OTHER MEDICAL Ambulance and NEMT 1,599,375 1,498,607 1,444,299 670,262 1,090,342 366,750 1,660,648 1,632,473 1,199,057 1,324,882 1,224,809 1,216,505 14,928,009
Home Health Services & CBAS 392,407 393,491 349,594 300,546 492,779 171,601 327,117 899,406 655,484 379,453 560,737 546,590 5,469,205Utilization and Quality Review Expenses 308,250 229,353 247,983 245,426 95,995 243,906 275,750 192,375 276,893 497,822 121,178 429,853 3,164,784
Long Term/SNF/Hospice 1,052,766 1,197,702 1,539,187 1,549,960 1,452,690 697,808 1,765,635 1,090,186 1,046,610 1,235,346 1,372,401 1,568,567 15,568,858Health Home Capitation & Incentive 166,060 137,300 112,910 263,565 330,205 249,665 228,950 318,405 50,415 217,080 407,580 (42,600) 2,439,535
Provider Enhancement Expense - Prop. 56 1,820,309 5,971,496 6,564,136 4,841,254 4,373,154 5,297,431 5,004,018 3,659,026 5,102,697 6,361,698 4,769,377 5,029,190 58,793,786 Provider Enhancement Expense - GEMT 322,617 593,064 395,321 399,960 258,923 425,341 518,378 445,212 497,005 556,965 468,619 480,982 5,362,387
Provider COVID-19 Expenes - - - 561,100 2,766,220 1,747,240 1,724,310 818,360 5,205,074 2,343,032 2,033,684 3,841,160 21,040,180
TOTAL OTHER MEDICAL 5,661,784 10,021,013 10,653,430 8,832,073 10,860,308 9,199,742 11,504,806 9,055,443 14,033,235 12,916,278 10,958,385 13,070,247 126,766,744
PHARMACY SERVICES
RX - Drugs & OTC 9,137,997 8,470,785 9,200,496 7,803,679 7,771,494 7,983,954 8,100,996 8,168,036 8,318,159 8,267,808 7,628,753 8,657,426 99,509,583
RX - HEP-C 271,776 331,788 470,380 364,602 292,610 298,687 322,441 286,767 228,266 309,152 265,484 334,193 3,776,146
Rx - DME 696,914 578,635 675,997 634,644 687,187 109,695 591,970 860,866 1,234,371 817,209 957,930 852,003 8,697,421
RX - Pharmacy Rebates (135,000) (135,000) (35,000) (135,000) (135,000) (78,879) (235,000) (135,000) 48,287 (135,000) (135,000) (191,741) (1,437,333)
TOTAL PHARMACY SERVICES 9,971,687 9,246,208 10,311,873 8,667,925 8,616,291 8,313,457 8,780,407 9,180,669 9,829,083 9,259,169 8,717,167 9,651,881 110,545,817
PAY FOR PERFORMANCE QUALITY INCENTIVE 497,280 500,014 503,104 509,814 508,354 519,184 523,464 529,498 529,498 556,200 544,962 - 5,721,372
RISK CORRIDOR EXPENSE - - - - - 4,700,000 (2,000,000) - (2,700,000) - - - -
HOSPITAL DIRECTED PAYMENTS 11,276,584 11,391,396 11,495,457 11,614,664 11,614,663 12,149,677 (8,860,821) 9,112,870 9,112,869 9,955,034 9,313,088 9,738,038 107,913,519
HOSPITAL DIRECTED PAYMENT ADJUSTMENT 118,333 60,959 42,436 36,523 36,524 (10,733) (52,075,301) (233,958) 4,234 77 6,596 (1,263) (52,015,573)
NON-CLAIMS EXPENSE ADJUSTMENT 57,172 232,393 (1,583,770) 1,420 167,936 (325,027) (23,790) (157) (777,546) 5,124 (209,309) 1,598 (2,453,956)
IBNR, INCENTIVE, AND PAID CLAIMS ADJUSTMENT 816 (8,559) (2,649,204) (4,444,586) 11,543 (426,819) 344,451 (120,764) (4,317,566) (5,474) 205,986 316,193 (11,093,983)
Total Medical Costs 73,621,494 74,784,002 73,829,944 67,702,880 71,626,453 76,311,140 3,228,909 73,696,401 74,755,703 79,333,670 75,939,534 79,392,380 824,222,510
YEAR TO DATE 2020
OCTOBER 2020
DECEMBER 2020
AUGUST 2020
SEPTEMBER 2020
JUNE 2020
JULY 2020
NOVEMBER 2020
JANUARY 2020
FEBRUARY 2020
MARCH 2020
APRIL 2020
MAY 2020
KHS3/29/2021Management Use Only
Page 9
KHS Finance Committee Meeting, April 9, 2021
98 / 144

KERN HEALTH SYSTEMSMEDI-CAL
SCHEDULE OF MEDICAL COSTS BY MONTH - PMPMTHROUGH DECEMBER 31, 2020
PHYSICIAN SERVICESPrimary Care Physician Services 11.70 12.66 11.38 11.68 9.44 9.00 11.20 8.86 10.10 10.15 10.69 11.35 10.67
Referral Specialty Services 41.93 35.21 39.93 33.36 34.97 32.78 35.42 34.35 36.97 37.88 35.13 29.21 35.55Urgent Care & After Hours Advise 5.69 7.59 5.70 4.03 4.09 3.66 4.38 6.36 5.09 3.89 4.56 5.04 4.99
Hospital Admitting Team 0.04 0.03 0.04 0.04 0.04 0.03 0.04 0.04 0.03 0.03 0.03 0.03 0.03
TOTAL PHYSICIAN SERVICES 59.35 55.49 57.05 49.10 48.53 45.48 51.04 49.61 52.19 51.96 50.41 45.63 51.24
OTHER PROFESSIONAL SERVICESVision Service Capitation 1.20 1.04 1.04 1.04 1.04 1.02 1.04 1.04 1.00 1.03 1.11 1.01 1.05221 - Business Intelligence 0.80 0.82 0.78 0.92 0.76 0.90 0.82 0.79 0.81 0.70 0.64 0.73 0.79
310 - Health Services - Utilization Management - UM Allocation * 2.22 1.93 2.02 2.45 2.11 2.25 2.41 2.15 2.23 2.30 2.30 2.08 2.20311 - Health Services - Quality Improvement - UM Allocation * 0.53 0.53 0.54 0.68 0.56 0.56 0.61 0.54 0.56 0.58 0.42 0.44 0.54
312 - Health Services - Education - UM Allocation * 0.45 0.41 0.43 0.48 0.45 0.48 0.46 0.43 0.44 0.42 0.41 0.45 0.44313 - Health Services - Pharmacy - UM Allocation * 0.35 0.32 0.32 0.34 0.30 0.35 0.34 0.32 0.31 0.30 0.31 0.31 0.32
314 - Health Homes - UM Allocation * 0.37 0.36 0.42 0.51 0.40 0.40 0.42 0.38 0.38 0.46 0.47 0.48 0.42315 - Case Management - UM Allocation * 1.08 0.97 0.97 1.21 0.98 1.04 1.07 0.96 0.96 0.93 0.96 0.96 1.01
616 - Disease Management - UM Allocation * 0.23 0.22 0.23 0.27 0.22 0.23 0.25 0.22 0.23 0.22 0.20 0.21 0.23Behavior Health Treatment 3.94 3.74 3.97 4.72 2.62 2.64 4.44 4.22 4.12 2.08 4.03 4.72 3.77
Mental Health Services 1.33 0.87 0.52 0.02 0.44 0.22 0.20 0.86 0.31 0.06 0.23 0.48 0.45Other Professional Services 4.94 4.66 4.76 2.81 3.74 2.96 4.83 5.54 6.06 4.88 4.86 5.90 4.68
TOTAL OTHER PROFESSIONAL SERVICES 17.43 15.87 16.00 15.45 13.62 13.04 16.89 17.45 17.41 13.97 15.96 17.79 15.92
EMERGENCY ROOM 21.02 21.03 21.35 15.08 16.45 12.96 13.95 18.18 17.71 17.67 16.86 11.51 16.92
INPATIENT HOSPITAL 59.97 55.57 58.61 63.24 56.26 65.93 65.27 62.83 64.29 62.89 62.57 69.14 62.32
REINSURANCE EXPENSE PREMIUM 0.29 0.58 0.00 0.31 0.27 0.28 0.29 0.29 24.47 0.28 0.31 0.28 0.29
OUTPATIENT HOSPITAL SERVICES 27.08 24.82 26.10 24.79 20.30 24.84 24.63 26.04 0.00 24.42 22.58 23.66 24.46
OTHER MEDICAL Ambulance and NEMT 6.43 5.99 5.74 2.65 4.26 1.41 6.34 6.17 4.31 4.86 4.45 4.38 4.74
Home Health Services & CBAS 1.58 1.57 1.39 1.19 1.92 0.66 1.25 3.40 2.36 1.39 2.04 1.97 1.74Utilization and Quality Review Expenses 1.24 0.92 0.99 0.97 0.37 0.94 1.05 0.73 1.00 1.83 0.44 1.55 1.01
Long Term/SNF/Hospice 4.23 4.79 6.12 6.13 5.67 2.69 6.75 4.12 3.76 4.53 4.99 5.65 4.94Health Home Capitation & Incentive 0.67 0.55 0.45 1.04 1.29 0.96 0.87 1.20 0.18 0.80 1.48 (0.15) 0.77
Provider Enhancement Expense - Prop. 56 7.32 23.89 26.09 19.14 17.07 20.41 19.12 13.82 18.35 23.35 17.34 18.13 18.67Provider Enhancement Expense - GEMT 1.30 2.37 1.57 1.58 1.01 1.64 1.98 1.68 1.79 2.04 1.70 1.73 1.70
Provider COVID-19 Expenes 0.00 0.00 0.00 2.22 10.80 6.73 6.59 3.09 18.72 8.60 7.39 13.84 6.68
TOTAL OTHER MEDICAL 22.77 40.08 42.35 34.92 42.40 35.44 43.96 34.20 50.46 47.40 39.84 47.11 40.26
PHARMACY SERVICES
RX - Drugs & OTC 36.75 33.88 36.57 30.85 30.34 30.76 30.95 30.85 29.91 30.34 27.73 31.20 31.61
RX - HEP-C 1.09 1.33 1.87 1.44 1.14 1.15 1.23 1.08 0.82 1.13 0.97 1.20 1.20
Rx - DME 2.80 2.31 2.69 2.51 2.68 0.42 2.26 3.25 4.44 3.00 3.48 3.07 2.76
RX - Pharmacy Rebates (0.54) (0.54) (0.14) (0.53) (0.53) (0.30) (0.90) (0.51) 0.17 (0.50) (0.49) (0.69) (0.46)
TOTAL PHARMACY SERVICES 40.10 36.98 40.99 34.27 33.64 32.03 33.55 34.68 35.34 33.98 31.69 34.79 35.11
PAY FOR PERFORMANCE QUALITY INCENTIVE 2.00 2.00 2.00 2.02 1.98 2.00 2.00 2.00 1.90 2.04 1.98 0.00 1.82
RISK CORRIDOR EXPENSE 0.00 0.00 0.00 0.00 0.00 18.11 (7.64) 0.00 (9.71) 0.00 0.00 0.00 0.00
HOSPITAL DIRECTED PAYMENTS 45.35 45.56 45.70 45.92 45.35 46.80 (33.85) 34.42 32.77 36.53 33.86 35.10 34.27
HOSPITAL DIRECTED PAYMENT ADJUSTMENT 0.48 0.24 0.17 0.14 0.14 (0.04) (198.96) (0.88) 0.02 0.00 0.02 (0.00) (16.52)
NON-CLAIMS EXPENSE ADJUSTMENT 0.23 0.93 (6.30) 0.01 0.66 (1.25) (0.09) (0.00) (2.80) 0.02 (0.76) 0.01 (0.78)
IBNR, INCENTIVE, AND PAID CLAIMS ADJUSTMENT 0.00 (0.03) (10.53) (17.57) 0.05 (1.64) 1.32 (0.46) (15.53) (0.02) 0.75 1.14 (3.52)
Total Medical Costs 296.10 299.13 293.50 267.65 279.64 293.97 12.34 278.36 268.81 291.15 276.06 286.15 261.79
JUNE 2020
YEAR TO DATE 2020
JULY 2020
AUGUST 2020
SEPTEMBER 2020
OCTOBER 2020
NOVEMBER 2020
DECEMBER 2020
JANUARY 2020
FEBRUARY 2020
MARCH 2020
APRIL 2020
MAY 2020
KHS3/29/2021Management Use Only
Page 10
KHS Finance Committee Meeting, April 9, 2021
99 / 144

KERN HEALTH SYSTEMS
MEDI-CAL
CURRENT MONTH SCHEDULE OF ADMINISTRATIVE EXPENSES BY DEPT YEAR-TO-DATEACTUAL BUDGET VARIANCE FOR THE MONTH ENDED DECEMBER 31, 2020 ACTUAL BUDGET VARIANCE
481,278 314,472 (166,806) 110 - Executive 4,213,814 3,849,044 (364,770)
204,040 198,806 (5,234) 210 - Accounting 2,183,081 2,383,730 200,649
268,648 273,113 4,465 220 - Management Information Systems 3,343,187 3,277,370 (65,817)
17,481 13,049 (4,432) 221 - Business Intelligence 118,591 156,616 38,025
229,193 281,944 52,751 222 - Enterprise Development 3,041,935 3,383,373 341,438
647,221 415,723 (231,498) 225 - Infrastructure 4,527,633 4,988,672 461,039
560,438 559,947 (491) 230 - Claims 6,408,298 6,700,958 292,660
95,260 114,175 18,915 240 - Project Management 1,215,915 1,369,836 153,921
83,855 100,301 16,446 310 - Health Services - Utilization Management 1,202,902 1,197,406 (5,496)
60,254 55,142 (5,112) 311 - Health Services - Quality Improvement 533,898 661,493 127,595
9,846 67 (9,779) 312 - Health Services - Education 10,327 1,100 (9,227)
138,183 143,883 5,700 313- Pharmacy 1,651,472 1,713,091 61,619
7,082 - (7,082) 314 - Health Homes 8,252 - (8,252)
13,653 16,573 2,920 315 - Case Management 199,351 198,873 (478)
18,384 23,135 4,751 616 - Disease Management 261,785 277,579 15,794
260,381 313,556 53,175 320 - Provider Network Management 3,310,304 3,762,628 452,324
568,704 563,886 (4,818) 330 - Member Services 6,306,727 6,766,582 459,855
639,211 533,116 (106,095) 340 - Corporate Services 6,978,086 6,351,392 (626,694)
71,832 67,176 (4,656) 360 - Audit & Investigative Services 871,118 806,112 (65,006)
34,964 54,335 19,371 410 - Advertising Media 533,423 651,800 118,377
72,769 68,457 (4,312) 420 - Sales/Marketing/Public Relations 611,337 821,484 210,147
268,517 220,169 (48,348) 510 - Human Resourses 2,588,673 2,687,536 98,863
1,407,045 - (1,407,045) Administrative Expense Adjustment 1,194,816 - (1,194,816)
6,158,239 4,331,024 (1,827,215) Total Administrative Expenses 51,314,925 52,006,674 691,749
KHS3/29/2021Management Use Only Page 11
KHS Finance Committee Meeting, April 9, 2021
100 / 144

KERN HEALTH SYSTEMS
MEDI-CAL
SCHEDULE OF ADMIN EXPENSES BY DEPT BY MONTH FOR THE MONTH ENDED DECEMBER 31, 2020
110 - Executive 339,242 293,820 365,045 399,347 259,748 354,211 358,020 346,343 374,015 326,229 316,516 481,278 4,213,814
210 - Accounting 173,904 178,919 174,836 183,136 174,058 229,239 197,424 181,448 174,523 158,312 153,242 204,040 2,183,081
220 - Management Information Systems (MIS) 381,511 295,419 338,903 162,587 375,885 409,177 283,465 385,215 (71,269) 340,586 173,060 268,648 3,343,187
221 - Business Intelligence - 11,648 20,702 22,767 15,303 14,750 15,840 100 14,760 (14,760) - 17,481 118,591
222 - Enterprise Development 211,299 225,855 262,079 292,897 213,893 299,686 277,998 269,776 270,074 228,971 260,214 229,193 3,041,935
225 - Infrastructure 359,015 241,507 308,323 274,546 428,168 431,419 409,337 388,698 315,770 353,492 370,137 647,221 4,527,633
230 - Claims 556,280 498,960 493,312 543,105 485,601 547,271 552,376 529,257 570,198 519,409 552,091 560,438 6,408,298
240 - Project Management 85,191 84,709 97,954 100,673 102,586 121,862 123,048 107,034 102,541 91,330 103,727 95,260 1,215,915
310 - Health Services - Utilization Management 98,529 107,809 95,426 112,873 93,694 127,289 99,273 106,044 114,396 82,166 81,548 83,855 1,202,902
311 - Health Services - Quality Improvement 10,824 41,860 43,027 54,448 45,627 46,653 50,493 44,850 48,886 50,333 36,643 60,254 533,898
312 - Health Services - Education - 60 - 61 - - - 102 258 - - 9,846 10,327
313- Pharmacy 156,947 147,980 148,599 141,729 123,386 126,485 118,633 129,761 154,674 135,163 129,932 138,183 1,651,472
314 - Health Homes 222 15,046 98 (14,707) - 76 68 - 258 - 109 7,082 8,252
315 - Case Management 17,349 15,664 15,615 19,456 16,074 17,240 17,939 16,261 17,064 16,190 16,846 13,653 199,351
616 - Disease Management 20,836 20,068 21,223 25,749 20,786 21,699 24,558 21,762 23,538 22,408 20,774 18,384 261,785
320 - Provider Network Management 256,860 252,748 291,995 307,450 269,465 313,902 281,741 260,987 274,601 295,174 245,000 260,381 3,310,304
330 - Member Services 530,714 484,954 496,790 563,492 484,348 547,629 542,035 529,092 504,521 526,135 528,313 568,704 6,306,727
340 - Corporate Services 439,804 482,885 487,474 449,175 1,070,946 640,485 556,403 599,825 606,212 405,269 600,397 639,211 6,978,086
360 - Audit & Investigative Services 81,923 83,979 59,288 87,154 60,510 76,957 69,507 55,676 81,171 63,378 79,743 71,832 871,118
410 - Advertising Media 9,439 47,590 38,083 134,979 29,053 138,348 28,355 (17,205) 18,396 41,471 29,950 34,964 533,423
420 - Sales/Marketing/Public Relations 44,020 35,104 43,800 36,382 55,996 54,859 78,000 3,632 45,864 49,297 91,614 72,769 611,337
510 - Human Resourses 285,952 186,648 181,915 228,494 160,954 252,332 237,528 195,087 204,890 205,283 181,073 268,517 2,588,673
Total Department Expenses 4,059,861 3,753,232 3,984,487 4,125,793 4,486,081 4,771,569 4,322,041 4,153,745 3,845,341 3,895,836 3,970,929 4,751,194 50,120,109
ADMINISTRATIVE EXPENSE ADJUSTMENT - - - - - (212,229) - - - - - 1,407,045 1,194,816
Total Administrative Expenses 4,059,861 3,753,232 3,984,487 4,125,793 4,486,081 4,559,340 4,322,041 4,153,745 3,845,341 3,895,836 3,970,929 6,158,239 51,314,925
NOVEMBER 2020
YEAR TO DATE 2020
DECEMBER 2020
OCTOBER 2020
JUNE 2020
AUGUST 2020
SEPTEMBER 2020
JULY 2020
JANUARY 2020
FEBRUARY 2020
MARCH 2020
APRIL 2020
MAY 2020
KHS3/29/2021Management Use Only Page 12
KHS Finance Committee Meeting, April 9, 2021
101 / 144

KERN HEALTH SYSTEMSGROUP HEALTH PLAN - HFAMBALANCE SHEET STATEMENT
AS OF DECEMBER 31, 2020ASSETS DECEMBER 2020 NOVEMBER 2020 INC(DEC)
CURRENT ASSETS:Cash and Cash Equivalents 1,136,281$ 1,133,718$ 2,563
Interest Receivable 1,785 1,594 191 TOTAL CURRENT ASSETS 1,138,066$ 1,135,312$ 2,754$
LIABILITIES AND NET POSITIONCURRENT LIABILITIES:
Other Liabilities - - - TOTAL CURRENT LIABILITIES -$ -$ -$
NET POSITION:Net Position- Beg. of Year 1,128,885 1,128,885 -
Increase (Decrease) in Net Position - Current Year 9,181 6,427 2,754 Total Net Position 1,138,066$ 1,135,312$ 2,754$
TOTAL LIABILITIES AND NET POSITION 1,138,066$ 1,135,312$ 2,754$
KHS3/29/2021Management Use Only Page 13
KHS Finance Committee Meeting, April 9, 2021
102 / 144

KERN HEALTH SYSTEMS
GROUP HEALTH PLAN - HFAM
CURRENT MONTH
STATEMENT OF REVENUE, EXPENSES, ANDCHANGES IN NET POSITION YEAR-TO-DATE
ACTUAL BUDGET VARIANCE FOR THE MONTH ENDED DECEMBER 31, 2020 ACTUAL BUDGET VARIANCE
E N R O L L M E N T
- - - M e m b e r s - - -
R E V E N U E S
- - - Premium - - - 191 - 191 I n t e r e s t 13,581 - 13,581
2,563 - 2,563 Other Investment Income 600 - 600 2,754 - 2,754 TOTAL REVENUES 14,181 - 14,181
E X P E N S E S
Medical Costs- - - IBNR and Paid Claims Adjustment - - - - - - Total Medical Costs - - -
2,754 - 2,754 GROSS MARGIN 14,181 - 14,181
Administrative- - - Management Fee Expense and Other Admin Exp 5,000 - (5,000)- - - Total Administrative Expenses 5,000 - (5,000)
- - - TOTAL EXPENSES 5,000 - (5,000)
2,754 - 2,754 OPERATING INCOME (LOSS) 9,181 - 9,181
- - - TOTAL NONOPERATING REVENUE (EXPENSES) - - -
2,754 - 2,754 NET INCREASE (DECREASE) IN NET POSITION 9,181 - 9,181
0% 0% 0% MEDICAL LOSS RATIO 0% 0% 0%
0% 0% 0% ADMINISTRATIVE EXPENSE RATIO 35% 0% -35%
KHS3/29/2021Management Use Only Page 14
KHS Finance Committee Meeting, April 9, 2021
103 / 144

KERN HEALTH SYSTEMS
MONTHLY MEMBERS COUNT
KERN HEALTH SYSTEMS
2020 MEMBER
MEDI-CAL MONTHS JAN'20 FEB'20 MAR'20 APR'20 MAY'20 JUN'20 JUL'20 AUG'20 SEP'20 OCT'20 NOV'20 DEC'20
ADULT AND FAMILY
ADULT 566,560 43,519 43,767 44,480 44,402 45,381 46,558 47,144 47,950 50,967 49,961 50,875 51,556CHILD 1,524,338 122,496 123,040 123,357 123,687 124,785 126,031 126,735 127,723 133,883 130,268 130,746 131,587
SUB-TOTAL ADULT & FAMILY 2,090,898 166,015 166,807 167,837 168,089 170,166 172,589 173,879 175,673 184,850 180,229 181,621 183,143
OTHER MEMBERS
BCCTP-TOBACCO SETTLEMENT 332 26 28 26 25 27 27 28 30 29 30 29 27
DUALS
PARTIAL DUALS - FAMILY 5,844 432 432 453 461 474 450 452 462 550 570 554 554
PARTIAL DUALS - CHILD 11 1 1 1 1 1 1 1 1 1 1 1 0PARTIAL DUALS - BCCTP 22 1 1 2 2 2 2 2 2 2 2 2 2SPD FULL DUALS 84,123 6,599 6,759 6,911 6,923 6,983 6,941 6,945 7,021 7,235 7,172 7,326 7,308
SUB-TOTAL DUALS 90,000 7,033 7,193 7,367 7,387 7,460 7,394 7,400 7,486 7,788 7,745 7,883 7,864
TOTAL FAMILY & OTHER 2,181,230 173,074 174,028 175,230 175,501 177,653 180,010 181,307 183,189 192,667 188,004 189,533 191,034
SPD
SPD (AGED AND DISABLED) 188,095 15,667 15,493 15,688 15,992 15,946 15,803 15,518 15,508 15,301 15,810 15,692 15,677
MEDI-CAL EXPANSION
ACA Expansion Adult-Citizen 773,610 59,583 60,197 60,360 61,164 62,179 63,373 64,432 65,545 69,552 68,077 69,160 69,988ACA Expansion Duals 5,534 316 289 274 293 356 406 475 507 580 590 695 753
SUB-TOTAL MED-CAL EXPANSION 779,144 59,899 60,486 60,634 61,457 62,535 63,779 64,907 66,052 70,132 68,667 69,855 70,741
TOTAL KAISER 118,205 8,992 9,125 9,169 9,262 9,475 9,594 9,823 10,138 10,386 10,579 10,753 10,909
TOTAL MEDI-CAL MEMBERS 3,266,674 257,632 259,132 260,721 262,212 265,609 269,186 271,555 274,887 288,486 283,060 285,833 288,361
Page 15
KHS Finance Committee Meeting, April 9, 2021
104 / 144

To: KHS Finance Committee
From: Robert Landis, CFO
Date: April 9, 2021
Re: January 2021 Financial Results
_______________________________________________________________________________
The January results reflect a $1,492,915 Net Increase in Net Position which is a $1,208,876 favorable
variance to the budget. Listed below are the major variances for the month:
1) Total Revenues reflect a $9.0 million favorable variance primarily due to:
A) $2.0 million favorable variance primarily due to higher than expected budgeted membership.
B) $.7 million favorable variance in MCO Tax Premiums primarily due to receiving revised MCO
Tax rates for calendar year 2021 from DHCS.
C) $5.7 million favorable variance in Premium-Hospital Directed Payments primarily due to
receiving revised 19/20 HDP rates. This amount is offset against amounts included in 2E below
D) $.8 million favorable variance in Rate/Income Adjustments primarily due to retroactive revenue
received for the prior year.
2) Total Medical Costs reflect a $8.5 million unfavorable variance primarily due to:
A) $.9 million favorable variance in Emergency Room primarily due to lower than expected
utilization.
B) $4.5 million unfavorable variance in Inpatient primarily due to higher than expected utilization.
C) $.5 million unfavorable variance in Other Medical primarily due to Covid-19 provider relief
expense.
D) $1.4 million favorable variance in Pharmacy primarily due from formulary modifications that
capitalized on new generics that came to market and less costly brands within the same
therapeutic class. There was also a timing impact from the lengthening of the day supply per
prescription of maintenance medications that occurred beginning in March 2020. Additionally,
the Flu Season was not as severe as expected due to increased social distancing, washing
hands, wearing masks and an increase in flu vaccine administration due to our efforts in
reaching out to our members during the 4th quarter of 2020.
E) $5.7 million unfavorable variance in Hospital Directed Payments primarily due to receiving
revised 19/20 HDP rates. This amount is offset against amounts included in 1C above.
The January Medical Loss Ratio is 93.1% which is unfavorable to the 92.5% budgeted amount. The
January Administrative Expense Ratio is 5.7% which is favorable to the 6.7% budgeted amount.
KHS Finance Committee Meeting, April 9, 2021
105 / 144

Kern Health SystemsFinancial Packet
January 2021
KHS – Medi-Cal Line of Business
Comparative Statement of Net Position Page 1
Statement of Revenue, Expenses, and Changes in Net Position Page 2
Statement of Revenue, Expenses, and Changes in Net Position - PMPM Page 3
Statement of Revenue, Expenses, and Changes in Net Position by Month Page 4
Statement of Revenue, Expenses, and Changes in Net Position by Month - PMPM Page 5
Schedule of Revenues Page 6
Schedule of Medical Costs Page 7
Schedule of Medical Costs - PMPM Page 8
Schedule of Medical Costs by Month Page 9
Schedule of Medical Costs by Month – PMPM Page 10
Schedule of Administrative Expenses by Department Page 11
Schedule of Administrative Expenses by Department by Month Page 12
KHS Group Health Plan – Healthy Families Line of Business
Comparative Statement of Net Position Page 13
Statement of Revenue, Expenses, and Changes in Net Position Page 14
KHS Administrative Analysis and Other Reporting
Monthly Member Count Page 15
KHS Finance Committee Meeting, April 9, 2021
106 / 144

KERN HEALTH SYSTEMSMEDI-CAL
STATEMENT OF NET POSITIONAS OF JANUARY 31, 2021
ASSETS JANUARY 2021 DECEMBER 2020 INC(DEC)CURRENT ASSETS:
Cash and Cash Equivalents 105,073,268$ 74,866,934$ 30,206,334$ Short-Term Investments 129,481,278 169,078,187 (39,596,909)
Pass-through Monies Held for Future Payment 63,901,877 - 63,901,877 Premiums Receivable - Net 99,682,751 97,593,440 2,089,311
Premiums Receivable - Hospital Direct Payments 210,829,165 195,667,272 15,161,893 Interest Receivable 96,977 111,800 (14,823)
Provider Advance Payment 5,506,518 5,506,518 - Other Receivables 1,162,978 999,272 163,706
Prepaid Expenses & Other Current Assets 2,977,322 2,223,252 754,070 Total Current Assets 618,712,134$ 546,046,675$ 72,665,459$
CAPITAL ASSETS - NET OF ACCUM DEPRE:Land 4,090,706 4,090,706 -
Furniture and Equipment - Net 2,074,454 2,121,548 (47,094) Computer Hardware and Software - Net 14,611,138 14,911,184 (300,046)
Building and Building Improvements - Net 35,272,587 35,348,281 (75,694) Capital Projects in Progress 12,438,635 12,183,359 255,276
Total Capital Assets 68,487,520$ 68,655,078$ (167,558)$
LONG TERM ASSETS:Restricted Investments 300,000 300,000 -
Officer Life Insurance Receivables 1,556,944 1,556,944 - Total Long Term Assets 1,856,944$ 1,856,944$ -$
DEFERRED OUTFLOWS OF RESOURCES 3,018,341$ 3,018,341$ -$
TOTAL ASSETS AND DEFERRED OUTFLOWS OF RESOURCES 692,074,939$ 619,577,038$ 72,497,901$
LIABILITIES AND NET POSITIONCURRENT LIABILITIES:
Accrued Salaries and Employee Benefits 3,724,831$ 3,474,673$ 250,158 Accrued Other Operating Expenses 2,387,430 2,054,935 332,495
Accrued Taxes and Licenses 8,725,272 26,536,275 (17,811,003) Other Medical Liabilities - Nonoperating Passthrough 63,901,877 - 63,901,877
Claims Payable (Reported) 30,841,482 25,988,208 4,853,274 IBNR - Inpatient Claims 35,269,379 33,478,470 1,790,909 IBNR - Physician Claims 16,682,703 15,114,732 1,567,971
IBNR - Accrued Other Medical 24,247,032 25,003,428 (756,396) Risk Pool and Withholds Payable 5,534,345 5,005,162 529,183
Statutory Allowance for Claims Processing Expense 2,225,904 2,225,904 - Other Liabilities 50,607,359 49,422,734 1,184,625
Accrued Hospital Directed Payments 210,829,165 195,667,272 15,161,893 Total Current Liabilities 454,976,779$ 383,971,793$ 71,004,986$
NONCURRENT LIABILITIES:Net Pension Liability 8,432,377 8,432,377 -
TOTAL NONCURRENT LIABILITIES 8,432,377$ 8,432,377$ -$
DEFERRED INFLOWS OF RESOURCES 86,684$ 86,684$ -$
NET POSITION:Net Position - Beg. of Year 227,086,184 214,692,379 12,393,805
Increase (Decrease) in Net Position - Current Year 1,492,915 12,393,805 (10,900,890) Total Net Position 228,579,099$ 227,086,184$ 1,492,915$
TOTAL LIABILITIES, DEFERRED INFLOWS OF RESOURCES AND NET POSITION 692,074,939$ 619,577,038$ 72,497,901$ KHS3/29/2021Management Use Only Page 1
KHS Finance Committee Meeting, April 9, 2021
107 / 144

KERN HEALTH SYSTEMS
MEDI-CAL - ALL COA
CURRENT MONTH MEMBERS
STATEMENT OF REVENUE, EXPENSES, AND CHANGES IN NET POSITION YEAR-TO-DATE MEMBER MONTHS
ACTUAL BUDGET VARIANCE FOR THE MONTH ENDED JANUARY 31, 2021 ACTUAL BUDGET VARIANCE
183,217 181,400 1,817 Family Members 183,217 181,400 1,81771,400 70,565 835 Expansion Members 71,400 70,565 83516,054 15,230 824 SPD Members 16,054 15,230 824
7,846 7,000 846 Other Members 7,846 7,000 84611,047 10,500 547 Kaiser Members 11,047 10,500 547
289,564 284,695 4,869 T o t a l M e m b e r s - MCAL 289,564 284,695 4,869
R E V E N U E S33,254,490 32,098,951 1,155,539 Title XIX - Medicaid - Family and Other 33,254,490 32,098,951 1,155,53927,548,311 26,523,701 1,024,610 Title XIX - Medicaid - Expansion Members 27,548,311 26,523,701 1,024,61015,326,978 15,473,370 (146,392) Title XIX - Medicaid - SPD Members 15,326,978 15,473,370 (146,392)
9,577,432 8,904,649 672,783 Premium - MCO Tax 9,577,432 8,904,649 672,78315,121,903 9,467,460 5,654,443 Premium - Hospital Directed Payments 15,121,903 9,467,460 5,654,443
4,303 164,743 (160,440) Investment Earnings And Other Income 4,303 164,743 (160,440)- 79,517 (79,517) Reinsurance Recoveries - 79,517 (79,517)
39,990 - 39,990 Rate Adjustments - Hospital Directed Payments 39,990 - 39,990799,886 - 799,886 Rate/Income Adjustments 799,886 - 799,886
101,673,293 92,712,390 8,960,903 TOTAL REVENUES 101,673,293 92,712,390 8,960,903
E X P E N S E SMedical Costs:
14,907,160 15,070,846 163,686 Physician Services 14,907,160 15,070,846 163,6864,421,552 4,713,570 292,018 Other Professional Services 4,421,552 4,713,570 292,0184,676,327 5,532,296 855,969 Emergency Room 4,676,327 5,532,296 855,969
19,853,180 15,343,180 (4,510,000) I n p a t i e n t 19,853,180 15,343,180 (4,510,000)81,215 79,517 (1,698) Reinsurance Expense 81,215 79,517 (1,698)
7,108,674 6,962,569 (146,105) Outpatient Hospital 7,108,674 6,962,569 (146,105)10,641,113 10,097,242 (543,871) Other Medical 10,641,113 10,097,242 (543,871)
9,100,359 10,456,099 1,355,740 Pharmacy 9,100,359 10,456,099 1,355,740529,182 520,971 (8,212) Pay for Performance Quality Incentive 529,182 520,971 (8,212)
- - - Risk Corridor Expense - - - 15,121,903 9,467,460 (5,654,443) Hospital Directed Payments 15,121,903 9,467,460 (5,654,443)
39,990 - (39,990) Hospital Directed Payment Adjustment 39,990 - (39,990) 287,063 - (287,063) Non-Claims Expense Adjustment 287,063 - (287,063)
4,787 - (4,787) IBNR, Incentive, Paid Claims Adjustment 4,787 - (4,787) 86,772,505 78,243,748 (8,528,757) Total Medical Costs 86,772,505 78,243,748 (8,528,757)
14,900,788 14,468,642 432,146 GROSS MARGIN 14,900,788 14,468,642 432,146Administrative:
2,772,584 2,856,030 83,446 Compensation 2,772,584 2,856,030 83,446818,908 1,071,006 252,098 Purchased Services 818,908 1,071,006 252,098
57,592 133,106 75,514 Supplies 57,592 133,106 75,514422,833 500,520 77,687 Depreciation 422,833 500,520 77,687277,245 385,959 108,714 Other Administrative Expenses 277,245 385,959 108,714
18,296 - (18,296) Administrative Expense Adjustment 18,296 - (18,296) 4,367,458 4,946,622 579,164 Total Administrative Expenses 4,367,458 4,946,622 579,164
91,139,963 83,190,370 (7,949,593) TOTAL EXPENSES 91,139,963 83,190,370 (7,949,593)
10,533,330 9,522,020 1,011,310 OPERATING INCOME (LOSS) BEFORE TAX 10,533,330 9,522,020 1,011,310
8,902,943 8,904,649 1,706 MCO TAX 8,902,943 8,904,649 1,706
1,630,387 617,371 1,013,016 OPERATING INCOME (LOSS) NET OF TAX 1,630,387 617,371 1,013,016
NONOPERATING REVENUE (EXPENSE)- - - Gain on Sale of Assets - - -
(81,396) (166,666) 85,270 Provider Recruitment and Retention Grants (81,396) (166,666) 85,270 (56,076) (166,666) 110,590 Health Home (56,076) (166,666) 110,590
(137,472) (333,332) 195,860 TOTAL NONOPERATING REVENUE (EXPENSE) (137,472) (333,332) 195,860
1,492,915 284,039 1,208,876 NET INCREASE (DECREASE) IN NET POSITION 1,492,915 284,039 1,208,876
93.1% 92.5% -0.6% MEDICAL LOSS RATIO 93.1% 92.5% -0.6%
5.7% 6.7% 1.0% ADMINISTRATIVE EXPENSE RATIO 5.7% 6.7% 1.0%
KHS3/29/2021Management Use Only Page 2
KHS Finance Committee Meeting, April 9, 2021
108 / 144

KERN HEALTH SYSTEMS
MEDI-CAL
CURRENT MONTH
STATEMENT OF REVENUE, EXPENSES, AND CHANGES IN NET POSITION - PMPM YEAR-TO-DATE
ACTUAL BUDGET VARIANCE FOR THE MONTH ENDED JANUARY 31, 2021 ACTUAL BUDGET VARIANCE
E N R O L L M E N T183,217 181,400 1,817 Family Members 183,217 181,400 1,817
71,400 70,565 835 Expansion Members 71,400 70,565 83516,054 15,230 824 SPD Members 16,054 15,230 824
7,846 7,000 846 Other Members 7,846 7,000 84611,047 10,500 547 Kaiser Members 11,047 10,500 547
289,564 284,695 4,869 T o t a l M e m b e r s - MCAL 289,564 284,695 4,869
R E V E N U E S174.05 170.38 3.67 Title XIX - Medicaid - Family and Other 174.05 170.38 3.67385.83 375.88 9.95 Title XIX - Medicaid - Expansion Members 385.83 375.88 9.95954.71 1,015.98 (61.27) Title XIX - Medicaid - SPD Members 954.71 1,015.98 (61.27)
34.39 32.48 1.91 Premium - MCO Tax 34.39 32.48 1.9154.29 34.53 19.77 Premium - Hospital Directed Payments 54.29 34.53 19.77
0.02 0.60 (0.59) Investment Earnings And Other Income 0.02 0.60 (0.59)0.00 0.29 (0.29) Reinsurance Recoveries 0.00 0.29 (0.29)0.14 0.00 0.14 Rate Adjustments - Hospital Directed Payments 0.14 0.00 0.142.87 0.00 2.87 Rate/Income Adjustments 2.87 0.00 2.87
365.05 338.13 26.93 TOTAL REVENUES 365.05 338.13 26.93
E X P E N S E SMedical Costs:
53.52 54.96 1.44 Physician Services 53.52 54.96 1.4415.88 17.19 1.32 Other Professional Services 15.88 17.19 1.3216.79 20.18 3.39 Emergency Room 16.79 20.18 3.3971.28 55.96 (15.32) I n p a t i e n t 71.28 55.96 (15.32)
0.29 0.29 (0.00) Reinsurance Expense 0.29 0.29 (0.00)25.52 25.39 (0.13) Outpatient Hospital 25.52 25.39 (0.13)38.21 36.83 (1.38) Other Medical 38.21 36.83 (1.38)32.67 38.13 5.46 Pharmacy 32.67 38.13 5.46
1.90 1.90 0.00 Pay for Performance Quality Incentive 1.90 1.90 0.000.00 0.00 0.00 Risk Corridor Expense 0.00 0.00 0.00
54.29 34.53 (19.77) Hospital Directed Payments 54.29 34.53 (19.77)0.14 0.00 (0.14) Hospital Directed Payment Adjustment 0.14 0.00 (0.14)1.03 0.00 (1.03) Non-Claims Expense Adjustment 1.03 0.00 (1.03)0.02 0.00 (0.02) IBNR, Incentive, Paid Claims Adjustment 0.02 0.00 (0.02)
311.55 285.36 (26.19) Total Medical Costs 311.55 285.36 (26.19)
53.50 52.77 0.73 GROSS MARGIN 53.50 52.77 0.73Administrative:
9.95 10.42 0.46 Compensation 9.95 10.42 0.462.94 3.91 0.97 Purchased Services 2.94 3.91 0.970.21 0.49 0.28 Supplies 0.21 0.49 0.281.52 1.83 0.31 Depreciation 1.52 1.83 0.311.00 1.41 0.41 Other Administrative Expenses 1.00 1.41 0.410.07 0.00 (0.07) Administrative Expense Adjustment 0.07 0.00 (0.07)
15.68 18.04 2.36 Total Administrative Expenses 15.68 18.04 2.36
327.23 303.40 (23.83) TOTAL EXPENSES 327.23 303.40 (23.83)
37.82 34.73 3.09 OPERATING INCOME (LOSS) BEFORE TAX 37.82 34.73 3.09
31.97 32.48 0.51 MCO TAX 31.97 32.48 0.51
5.85 2.25 3.60 OPERATING INCOME (LOSS) NET OF TAX 5.85 2.25 3.60
NONOPERATING REVENUE (EXPENSE)0.00 0.00 0.00 Gain on Sale of Assets 0.00 0.00 0.00
(0.29) (0.61) 0.32 Reserve Fund Projects/Community Grants (0.29) (0.61) 0.32(0.20) (0.61) 0.41 Health Home (0.20) (0.61) 0.41(0.49) (1.22) 0.72 TOTAL NONOPERATING REVENUE (EXPENSE) (0.49) (1.22) 0.72
5.36 1.04 4.32 NET INCREASE (DECREASE) IN NET POSITION 5.36 1.04 4.32
93.1% 92.5% -0.6% MEDICAL LOSS RATIO 93.1% 92.5% -0.6%
5.7% 6.7% 1.0% ADMINISTRATIVE EXPENSE RATIO 5.7% 6.7% 1.0%
KHS3/29/2021Management Use Only Page 3
KHS Finance Committee Meeting, April 9, 2021
109 / 144

KERN HEALTH SYSTEMSMEDI-CAL
STATEMENT OF REVENUE, EXPENSES, AND CHANGES IN NET POSITION BY MONTH -
ROLLING 13 MONTHSTHROUGH JANUARY 31, 2021
E N R O L L M E N TM e m b e r s - MCAL 248,640 250,007 251,552 252,950 256,134 259,592 261,732 264,749 278,100 272,481 275,080 277,452 278,517 3,426,986
R E V E N U E STitle XIX - Medicaid - Family and Other 28,111,536 28,136,428 28,589,738 27,567,358 28,170,470 30,522,053 29,997,411 30,548,160 30,419,692 33,387,274 30,920,096 32,216,002 33,254,490 391,840,708
Title XIX - Medicaid - Expansion Members 23,135,804 23,419,130 23,548,401 22,679,789 23,386,527 24,776,875 24,533,357 24,848,094 25,069,155 27,568,938 25,504,052 27,197,954 27,548,311 323,216,387Title XIX - Medicaid - SPD Members 15,020,731 15,113,713 15,275,980 14,884,891 14,967,019 15,603,750 15,224,387 15,192,022 15,191,965 14,457,143 16,007,482 15,504,966 15,326,978 197,771,027
Premium - MCO Tax - 16,158,895 7,586,709 7,915,338 7,915,091 8,023,287 8,236,232 8,333,151 8,332,682 9,166,454 8,420,487 8,830,398 9,577,432 108,496,156Premium - Hospital Directed Payments 11,276,584 11,391,396 11,495,457 11,614,664 11,614,663 12,149,677 (8,860,821) 9,112,870 9,112,869 9,955,034 9,313,088 9,738,038 15,121,903 123,035,422Investment Earnings And Other Income 190,131 301,265 424,094 266,256 323,827 62,534 315,583 173,465 (14,474) 151,948 166,556 147,197 4,303 2,512,685
Reinsurance Recoveries - - - - - - - - - - - - - - Rate Adjustments - Hospital Directed Payments 118,333 60,959 42,436 36,523 36,524 (10,733) (52,075,301) 4,234 2,924 77 10,627 (2,692) 39,990 (51,736,099)
Rate/Income Adjustments 819,618 809,261 616,798 (4,529,302) 444,891 476,588 135,705 291,820 70,321 (582,499) 127,031 226,726 799,886 (293,156)TOTAL REVENUES 78,672,737 95,391,047 87,579,613 80,435,517 86,859,012 91,604,031 17,506,553 88,503,816 88,185,134 94,104,369 90,469,419 93,858,589 101,673,293 1,094,843,130
E X P E N S E SMedical Costs:
Physician Services 14,757,546 13,873,238 14,351,280 12,418,888 12,429,908 11,806,601 13,357,636 13,134,194 14,514,021 14,157,774 13,867,872 12,660,363 14,907,160 176,236,481 Other Professional Services 4,334,953 3,966,515 4,024,762 3,908,759 3,489,408 3,385,134 4,421,687 4,619,091 4,841,378 3,806,785 4,389,484 4,935,401 4,421,552 54,544,909
Emergency Room 5,226,947 5,258,084 5,370,795 3,813,875 4,212,272 3,363,172 3,651,975 4,813,363 4,926,059 4,814,428 4,638,713 3,194,257 4,676,327 57,960,267 I n p a t i e n t 14,911,677 13,893,706 14,743,904 15,995,368 14,410,696 17,115,732 17,082,368 16,635,497 17,879,275 17,137,251 17,212,070 19,183,080 19,853,180 216,053,804
Reinsurance Expense 72,320 144,425 (213) 77,341 69,310 73,356 75,202 76,284 76,523 77,652 84,521 77,390 81,215 985,326Outpatient Hospital 6,734,395 6,204,610 6,566,090 6,270,816 5,199,240 6,447,664 6,446,825 6,894,371 6,804,640 6,653,372 6,209,999 6,565,195 7,108,674 84,105,891
Other Medical 5,661,784 10,021,013 10,653,430 8,832,073 10,860,308 9,199,742 11,504,806 9,055,443 14,033,235 12,916,278 10,958,385 13,070,247 10,641,113 137,407,857Pharmacy 9,971,687 9,246,208 10,311,873 8,667,925 8,616,291 8,313,457 8,780,407 9,180,669 9,829,083 9,259,169 8,717,167 9,651,881 9,100,359 119,646,176
Pay for Performance Quality Incentive 497,280 500,014 503,104 509,814 508,354 519,184 523,464 529,498 529,498 556,200 544,962 - 529,182 6,250,554Risk Corridor Expense - - - - - 4,700,000 (2,000,000) - (2,700,000) - - - - -
Hospital Directed Payments 11,276,584 11,391,396 11,495,457 11,614,664 11,614,663 12,149,677 (8,860,821) 9,112,870 9,112,869 9,955,034 9,313,088 9,738,038 15,121,903 123,035,422Hospital Directed Payment Adjustment 118,333 60,959 42,436 36,523 36,524 (10,733) (52,075,301) (233,958) 4,234 77 6,596 (1,263) 39,990 (51,975,583)
Non-Claims Expense Adjustment 57,172 232,393 (1,583,770) 1,420 167,936 (325,027) (23,790) (157) (777,546) 5,124 (209,309) 1,598 287,063 (2,166,893) IBNR, Incentive, Paid Claims Adjustment 816 (8,559) (2,649,204) (4,444,586) 11,543 (426,819) 344,451 (120,764) (4,317,566) (5,474) 205,986 316,193 4,787 (11,089,196)
Total Medical Costs 73,621,494 74,784,002 73,829,944 67,702,880 71,626,453 76,311,140 3,228,909 73,696,401 74,755,703 79,333,670 75,939,534 79,392,380 86,772,505 910,995,015
GROSS MARGIN 5,051,243 20,607,045 13,749,669 12,732,637 15,232,559 15,292,891 14,277,644 14,807,415 13,429,431 14,770,699 14,529,885 14,466,209 14,900,788 183,848,115Administrative: Compensation 2,577,348 2,407,112 2,447,667 2,678,816 2,375,693 2,835,739 2,732,099 2,597,575 2,636,509 2,613,272 2,456,357 2,766,869 2,772,584 33,897,640
Purchased Services 805,903 728,049 867,391 644,717 903,379 1,142,683 859,845 819,771 421,612 689,841 745,537 1,172,530 818,908 10,620,166 Supplies 35,806 149,042 99,552 60,138 59,208 29,774 71,551 63,919 71,111 34,967 106,489 39,305 57,592 878,454
Depreciation 287,390 287,536 300,318 300,318 924,253 418,036 417,768 418,389 419,251 419,796 419,850 421,301 422,833 5,457,039 Other Administrative Expenses 353,414 181,493 269,559 441,804 223,548 345,337 240,778 254,091 296,858 137,960 242,696 351,189 277,245 3,615,972
Administrative Expense Adjustment - - - - - (212,229) - - - - - 1,407,045 18,296 1,213,112 Total Administrative Expenses 4,059,861 3,753,232 3,984,487 4,125,793 4,486,081 4,559,340 4,322,041 4,153,745 3,845,341 3,895,836 3,970,929 6,158,239 4,367,458 55,682,383
TOTAL EXPENSES 77,681,355 78,537,234 77,814,431 71,828,673 76,112,534 80,870,480 7,550,950 77,850,146 78,601,044 83,229,506 79,910,463 85,550,619 91,139,963 966,677,398
OPERATING INCOME (LOSS) BEFORE TAX 991,382 16,853,813 9,765,182 8,606,844 10,746,478 10,733,551 9,955,603 10,653,670 9,584,090 10,874,863 10,558,956 8,307,970 10,533,330 128,165,732
MCO TAX - 16,159,021 7,586,709 7,915,243 7,914,997 7,915,244 8,904,648 8,905,117 8,904,649 8,904,648 8,904,649 8,904,649 8,902,943 109,822,517
OPERATING INCOME (LOSS) NET OF TAX 991,382 694,792 2,178,473 691,601 2,831,481 2,818,307 1,050,955 1,748,553 679,441 1,970,215 1,654,307 (596,679) 1,630,387 18,343,215
TOTAL NONOPERATING REVENUE (EXPENSE) (942,282) (569,882) (1,076,457) 424,682 (587,120) (479,019) 462,756 (687,453) (176,843) (1,188,755) (931,682) 1,433,032 (137,472) (4,456,495)
NET INCREASE (DECREASE) IN NET POSITION 49,100 124,910 1,102,016 1,116,283 2,244,361 2,339,288 1,513,711 1,061,100 502,598 781,460 722,625 836,353 1,492,915 13,886,720
MEDICAL LOSS RATIO 92.5% 93.4% 91.0% 92.1% 89.1% 89.8% 91.4% 91.2% 92.8% 92.5% 91.6% 92.5% 93.1% 91.8%
ADMINISTRATIVE EXPENSE RATIO 6.0% 5.5% 5.8% 6.8% 6.7% 6.4% 6.2% 5.8% 5.4% 5.2% 5.5% 8.2% 5.7% 6.1%
13 MONTH TOTAL
JANUARY 2020
FEBRUARY 2020
MARCH 2020
APRIL 2020
MAY 2020
JUNE 2020
JULY 2020
AUGUST 2020
SEPTEMBER 2020
OCTOBER 2020
NOVEMBER 2020
DECEMBER 2020
JANUARY 2021
KHS3/29/2021Management Use Only
Page 4
KHS Finance Committee Meeting, April 9, 2021
110 / 144

KERN HEALTH SYSTEMSMEDI-CAL
STATEMENT OF REVENUE, EXPENSES, AND CHANGES IN NET POSITION BY MONTH - PMPM
ROLLING 13 MONTHSTHROUGH JANUARY 31, 2021
E N R O L L M E N TM e m b e r s - MCAL 248,640 250,007 251,552 252,950 256,134 259,592 261,732 264,749 278,100 272,481 275,080 277,452 278,517 3,426,986
R E V E N U E STitle XIX - Medicaid - Family and Other 162.42 161.68 163.16 157.08 158.57 169.56 165.45 166.87 166.16 173.40 164.62 168.64 174.05 165.17
Title XIX - Medicaid - Expansion Members 386.25 387.18 388.37 369.04 373.98 388.48 377.98 376.19 379.54 393.46 371.41 384.47 385.83 380.01Title XIX - Medicaid - SPD Members 958.75 975.52 973.74 930.77 938.61 987.39 981.08 972.23 972.22 945.03 1,012.68 989.03 954.71 968.89
Premium - MCO Tax 0.00 64.63 30.16 31.29 30.90 30.91 31.47 31.48 29.96 33.64 30.61 31.83 34.39 31.66Premium - Hospital Directed Payments 45.35 45.56 45.70 45.92 45.35 46.80 (33.85) 34.42 32.77 36.53 33.86 35.10 54.29 35.90Investment Earnings And Other Income 0.76 1.21 1.69 1.05 1.26 0.24 1.21 0.66 (0.05) 0.56 0.61 0.53 0.02 0.73
Reinsurance Recoveries 0.00 0.00 0.00 0.00 0.00 0.00 0.00 0.00 0.00 0.00 0.00 0.00 0.00 0.00Rate Adjustments - Hospital Directed Payments 0.48 0.24 0.17 0.14 0.14 (0.04) (198.96) 0.02 0.01 0.00 0.04 (0.01) 0.14 (15.10)
Rate/Income Adjustments 3.30 3.24 2.45 (17.91) 1.74 1.84 0.52 1.10 0.25 (2.14) 0.46 0.82 2.87 (0.09)TOTAL REVENUES 316.41 381.55 348.16 317.99 339.12 352.88 66.89 334.29 317.10 345.36 328.88 338.29 365.05 319.48
E X P E N S E SMedical Costs:
Physician Services 59.35 55.49 57.05 49.10 48.53 45.48 51.04 49.61 52.19 51.96 50.41 45.63 53.52 51.43Other Professional Services 17.43 15.87 16.00 15.45 13.62 13.04 16.89 17.45 17.41 13.97 15.96 17.79 15.88 15.92
Emergency Room 21.02 21.03 21.35 15.08 16.45 12.96 13.95 18.18 17.71 17.67 16.86 11.51 16.79 16.91I n p a t i e n t 59.97 55.57 58.61 63.24 56.26 65.93 65.27 62.83 64.29 62.89 62.57 69.14 71.28 63.04
Reinsurance Expense 0.29 0.58 (0.00) 0.31 0.27 0.28 0.29 0.29 0.28 0.28 0.31 0.28 0.29 0.29Outpatient Hospital 27.08 24.82 26.10 24.79 20.30 24.84 24.63 26.04 24.47 24.42 22.58 23.66 25.52 24.54
Other Medical 22.77 40.08 42.35 34.92 42.40 35.44 43.96 34.20 50.46 47.40 39.84 47.11 38.21 40.10Pharmacy 40.10 36.98 40.99 34.27 33.64 32.03 33.55 34.68 35.34 33.98 31.69 34.79 32.67 34.91
Pay for Performance Quality Incentive 2.00 2.00 2.00 2.02 1.98 2.00 2.00 2.00 1.90 2.04 1.98 0.00 1.90 1.82Risk Corridor Expense 0.00 0.00 0.00 0.00 0.00 18.11 (7.64) 0.00 (9.71) 0.00 0.00 0.00 0.00 0.00
Hospital Directed Payments 45.35 45.56 45.70 45.92 45.35 46.80 (33.85) 34.42 32.77 36.53 33.86 35.10 54.29 35.90Hospital Directed Payment Adjustment 0.48 0.24 0.17 0.14 0.14 (0.04) (198.96) (0.88) 0.02 0.00 0.02 (0.00) 0.14 (15.17)
Non-Claims Expense Adjustment 0.23 0.93 (6.30) 0.01 0.66 (1.25) (0.09) (0.00) (2.80) 0.02 (0.76) 0.01 1.03 (0.63)IBNR, Incentive, Paid Claims Adjustment 0.00 (0.03) (10.53) (17.57) 0.05 (1.64) 1.32 (0.46) (15.53) (0.02) 0.75 1.14 0.02 (3.24)
Total Medical Costs 296.10 299.13 293.50 267.65 279.64 293.97 12.34 278.36 268.81 291.15 276.06 286.15 311.55 265.83
GROSS MARGIN 20.32 82.43 54.66 50.34 59.47 58.91 54.55 55.93 48.29 54.21 52.82 52.14 53.50 53.65 Administrative:
Compensation 10.37 9.63 9.73 10.59 9.28 10.92 10.44 9.81 9.48 9.59 8.93 9.97 9.95 9.89Purchased Services 3.24 2.91 3.45 2.55 3.53 4.40 3.29 3.10 1.52 2.53 2.71 4.23 2.94 3.10
Supplies 0.14 0.60 0.40 0.24 0.23 0.11 0.27 0.24 0.26 0.13 0.39 0.14 0.21 0.26Depreciation 1.16 1.15 1.19 1.19 3.61 1.61 1.60 1.58 1.51 1.54 1.53 1.52 1.52 1.59
Other Administrative Expenses 1.42 0.73 1.07 1.75 0.87 1.33 0.92 0.96 1.07 0.51 0.88 1.27 1.00 1.06Administrative Expense Adjustment 0.00 0.00 0.00 0.00 0.00 (0.82) 0.00 0.00 0.00 0.00 0.00 5.07 0.07 0.35
Total Administrative Expenses 16.33 15.01 15.84 16.31 17.51 17.56 16.51 15.69 13.83 14.30 14.44 22.20 15.68 16.25
TOTAL EXPENSES 312.43 314.14 309.34 283.96 297.16 311.53 28.85 294.05 282.64 305.45 290.50 308.34 327.23 282.08
OPERATING INCOME (LOSS) BEFORE TAX 3.99 67.41 38.82 34.03 41.96 41.35 38.04 40.24 34.46 39.91 38.39 29.94 37.82 37.40
MCO TAX 0.00 64.63 30.16 31.29 30.90 30.49 34.02 33.64 32.02 32.68 32.37 32.09 31.97 32.05
OPERATING INCOME (LOSS) NET OF TAX 3.99 2.78 8.66 2.73 11.05 10.86 4.02 6.60 2.44 7.23 6.01 (2.15) 5.85 5.35
TOTAL NONOPERATING REVENUE (EXPENSE) (3.79) (2.28) (4.28) 1.68 (2.29) (1.85) 1.77 (2.60) (0.64) (4.36) (3.39) 5.16 (0.49) (1.30)
NET INCREASE (DECREASE) IN NET POSITION 0.20 0.50 4.38 4.41 8.76 9.01 5.78 4.01 1.81 2.87 2.63 3.01 5.36 4.05
MEDICAL LOSS RATIO 92.5% 93.4% 91.0% 92.1% 89.1% 89.8% 91.4% 91.2% 92.8% 92.5% 91.6% 92.5% 93.1% 91.8%
ADMINISTRATIVE EXPENSE RATIO 6.0% 5.5% 5.8% 6.8% 6.7% 6.4% 6.2% 5.8% 5.4% 5.2% 5.5% 8.2% 5.7% 6.1%
13 MONTH TOTAL
JANUARY 2020
FEBRUARY 2020
MARCH 2020
APRIL 2020
MAY 2020
JUNE 2020
JULY 2020
AUGUST 2020
SEPTEMBER 2020
OCTOBER 2020
NOVEMBER 2020
DECEMBER 2020
JANUARY 2021
KHS3/29/2021Management Use Only Page 5
KHS Finance Committee Meeting, April 9, 2021
111 / 144

KERN HEALTH SYSTEMS
MEDI-CALCURRENT MONTH SCHEDULE OF REVENUES - ALL COA YEAR-TO-DATE
ACTUAL BUDGET VARIANCE FOR THE MONTH ENDED JANUARY 31, 2021 ACTUAL BUDGET VARIANCER E V E N U E S
Title XIX - Medicaid - Family & Other
26,044,993 24,847,484 1,197,509 Premium - Medi-Cal 26,044,993 24,847,484 1,197,5092,536,842 2,520,887 15,955 Premium - Maternity Kick 2,536,842 2,520,887 15,955
43,682 79,197 (35,515) Premium - Hep C Kick 43,682 79,197 (35,515)461,322 484,909 (23,587) Premium - BHT Kick 461,322 484,909 (23,587)107,059 175,390 (68,331) Premium - Health Home Kick 107,059 175,390 (68,331)
3,522,672 3,458,468 64,204 Premium - Provider Enhancement 3,522,672 3,458,468 64,204174,929 168,237 6,692 Premium - Ground Emergency Medical Transportation 174,929 168,237 6,692255,004 272,653 (17,649) Premium - Behavorial Health Integration Program 255,004 272,653 (17,649)107,987 91,726 16,261 Other 107,987 91,726 16,261
33,254,490 32,098,951 1,155,539 Total Title XIX - Medicaid - Family & Other 33,254,490 32,098,951 1,155,539Title XIX - Medicaid - Expansion Members
24,933,645 24,002,303 931,342 Premium - Medi-Cal 24,933,645 24,002,303 931,342335,055 214,253 120,802 Premium - Maternity Kick 335,055 214,253 120,802192,202 202,017 (9,815) Premium - Hep C Kick 192,202 202,017 (9,815)312,522 356,121 (43,599) Premium - Health Home Kick 312,522 356,121 (43,599)
1,472,890 1,455,050 17,840 Premium - Provider Enhancement 1,472,890 1,455,050 17,840176,094 165,235 10,859 Premium - Ground Emergency Medical Transportation 176,094 165,235 10,859
95,281 102,122 (6,841) Premium - Behavorial Health Integration Program 95,281 102,122 (6,841) 30,622 26,600 4,022 Other 30,622 26,600 4,022
27,548,311 26,523,701 1,024,610 Total Title XIX - Medicaid - Expansion Members 27,548,311 26,523,701 1,024,610Title XIX - Medicaid - SPD Members
13,999,037 13,653,527 345,510 Premium - Medi-Cal 13,999,037 13,653,527 345,51026,209 100,288 (74,079) Premium - Hep C Kick 26,209 100,288 (74,079)
447,015 763,566 (316,551) Premium - BHT Kick 447,015 763,566 (316,551)244,399 351,842 (107,443) Premium - Health Home Kick 244,399 351,842 (107,443)457,090 454,632 2,458 Premium - Provider Enhancement 457,090 454,632 2,458131,841 127,475 4,366 Premium - Ground Emergency Medical Transportation 131,841 127,475 4,366
21,387 22,041 (654) Premium - Behavorial Health Integration Program 21,387 22,041 (654)15,326,978 15,473,370 (146,392) Total Title XIX - Medicaid - SPD Members 15,326,978 15,473,370 (146,392)
KHS3/29/2021Management Use Only Page 6
KHS Finance Committee Meeting, April 9, 2021
112 / 144

KERN HEALTH SYSTEMS
MEDI-CALCURRENT MONTH SCHEDULE OF MEDICAL COSTS - ALL COA YEAR-TO-DATE
ACTUAL BUDGET VARIANCE FOR THE MONTH ENDED JANUARY 31, 2021 ACTUAL BUDGET VARIANCE
PHYSICIAN SERVICES2,962,264 3,045,286 83,022 Primary Care Physician Services 2,962,264 3,045,286 83,022
10,512,215 10,527,368 15,153 Referral Specialty Services 10,512,215 10,527,368 15,1531,423,381 1,488,891 65,510 Urgent Care & After Hours Advise 1,423,381 1,488,891 65,510
9,300 9,300 - Hospital Admitting Team 9,300 9,300 -
14,907,160 15,070,846 163,686 TOTAL PHYSICIAN SERVICES 14,907,160 15,070,846 163,686
OTHER PROFESSIONAL SERVICES294,054 292,954 (1,100) Vision Service Capitation 294,054 292,954 (1,100)210,663 212,115 1,452 221 - Business Intelligence 210,663 212,115 1,452595,003 597,920 2,917 310 - Health Services - Utilization Management - UM Allocation * 595,003 597,920 2,917138,388 189,152 50,764 311 - Health Services - Quality Improvement - UM Allocation * 138,388 189,152 50,764120,621 123,336 2,715 312 - Health Services - Education - UM Allocation * 120,621 123,336 2,71575,046 80,283 5,237 313 - Health Services - Pharmacy - UM Allocation * 75,046 80,283 5,237
120,170 210,465 90,295 314 - Health Homes - UM Allocation * 120,170 210,465 90,295270,657 270,692 35 315 - Case Management - UM Allocation * 270,657 270,692 3562,998 56,773 (6,225) 616 - Disease Management - UM Allocation * 62,998 56,773 (6,225)
867,517 1,248,475 380,958 Behavior Health Treatment 867,517 1,248,475 380,958292,517 188,742 (103,775) Mental Health Services 292,517 188,742 (103,775)
1,373,918 1,242,663 (131,255) Other Professional Services 1,373,918 1,242,663 (131,255)
4,421,552 4,713,570 292,018 TOTAL OTHER PROFESSIONAL SERVICES 4,421,552 4,713,570 292,018
4,676,327 5,532,296 855,969 EMERGENCY ROOM 4,676,327 5,532,296 855,969
19,853,180 15,343,180 (4,510,000) INPATIENT HOSPITAL 19,853,180 15,343,180 (4,510,000)
81,215 79,517 (1,698) REINSURANCE EXPENSE PREMIUM 81,215 79,517 (1,698)
7,108,674 6,962,569 (146,105) OUTPATIENT HOSPITAL SERVICES 7,108,674 6,962,569 (146,105)
OTHER MEDICAL 1,400,971 1,541,820 140,849 Ambulance and NEMT 1,400,971 1,541,820 140,849
490,933 424,091 (66,842) Home Health Services & CBAS 490,933 424,091 (66,842)228,696 491,325 262,629 Utilization and Quality Review Expenses 228,696 491,325 262,629
1,616,577 1,297,752 (318,825) Long Term/SNF/Hospice 1,616,577 1,297,752 (318,825)211,140 393,192 182,052 Health Home Capitation & Incentive 211,140 393,192 182,052
5,190,164 5,091,298 (98,866) Provider Enhancement Expense - Prop. 56 5,190,164 5,091,298 (98,866)456,380 460,947 4,567 Provider Enhancement Expense - GEMT 456,380 460,947 4,567674,580 - (674,580) Provider COVID-19 Expenes 674,580 - (674,580)371,672 396,816 25,144 Behaviorial Health Integration Program 371,672 396,816 25,144
10,641,113 10,097,242 (543,871) TOTAL OTHER MEDICAL 10,641,113 10,097,242 (543,871)
PHARMACY SERVICES
8,174,252 9,340,349 1,166,097 RX - Drugs & OTC 8,174,252 9,340,349 1,166,097
245,144 381,501 136,357 RX - HEP-C 245,144 381,501 136,357
815,963 767,561 (48,402) Rx - DME 815,963 767,561 (48,402)
(135,000) (33,312) 101,688 RX - Pharmacy Rebates (135,000) (33,312) 101,688
9,100,359 10,456,099 1,355,740 TOTAL PHARMACY SERVICES 9,100,359 10,456,099 1,355,740
529,182 520,971 (8,212) PAY FOR PERFORMANCE QUALITY INCENTIVE 529,182 520,971 (8,212)
- - - RISK CORRIDOR EXPENSE - - -
15,121,903 9,467,460 (5,654,443) HOSPITAL DIRECTED PAYMENTS 15,121,903 9,467,460 (5,654,443)
39,990 - (39,990) HOSPITAL DIRECTED PAYMENT ADJUSTMENT 39,990 - (39,990)
287,063 - (287,063) NON-CLAIMS EXPENSE ADJUSTMENT 287,063 - (287,063)
4,787 - (4,787) IBNR, INCENTIVE, AND PAID CLAIMS ADJUSTMENT 4,787 - (4,787)
86,772,505 78,243,748 (8,528,757) Total Medical Costs 86,772,505 78,243,748 (8,528,757)
* Medical costs per DMHC regulations KHS3/29/2021Management Use Only Page 7
KHS Finance Committee Meeting, April 9, 2021
113 / 144

KERN HEALTH SYSTEMS
MEDI-CALCURRENT MONTH SCHEDULE OF MEDICAL COSTS - ALL COA - PMPM YEAR-TO-DATE
ACTUAL BUDGET VARIANCE FOR THE MONTH ENDED JANUARY 31, 2021 ACTUAL BUDGET VARIANCEPHYSICIAN SERVICES
10.64 11.11 0.47 Primary Care Physician Services 10.64 11.11 0.4737.74 38.39 0.65 Referral Specialty Services 37.74 38.39 0.65
5.11 5.43 0.32 Urgent Care & After Hours Advise 5.11 5.43 0.320.03 0.03 0.00 Hospital Admitting Team 0.03 0.03 0.00
53.52 54.96 1.44 TOTAL PHYSICIAN SERVICES 53.52 54.96 1.44OTHER PROFESSIONAL SERVICES
1.06 1.07 0.01 Vision Service Capitation 1.06 1.07 0.010.76 0.77 0.02 221 - Business Intelligence 0.76 0.77 0.022.14 2.18 0.04 310 - Health Services - Utilization Management - UM Allocation * 2.14 2.18 0.040.50 0.69 0.19 311 - Health Services - Quality Improvement - UM Allocation * 0.50 0.69 0.190.43 0.45 0.02 312 - Health Services - Education - UM Allocation * 0.43 0.45 0.020.27 0.29 0.02 313 - Health Services - Pharmacy - UM Allocation * 0.27 0.29 0.020.43 0.77 0.34 314 - Health Homes - UM Allocation * 0.43 0.77 0.340.97 0.99 0.02 315 - Case Management - UM Allocation * 0.97 0.99 0.020.23 0.21 (0.02) 616 - Disease Management - UM Allocation * 0.23 0.21 (0.02)3.11 4.55 1.44 Behavior Health Treatment 3.11 4.55 1.441.05 0.69 (0.36) Mental Health Services 1.05 0.69 (0.36)4.93 4.53 (0.40) Other Professional Services 4.93 4.53 (0.40)15.88 17.19 1.32 TOTAL OTHER PROFESSIONAL SERVICES 15.88 17.19 1.32
16.79 20.18 3.39 EMERGENCY ROOM 16.79 20.18 3.3971.28 55.96 (15.32) INPATIENT HOSPITAL 71.28 55.96 (15.32)
0.29 0.29 (0.00) REINSURANCE EXPENSE PREMIUM 0.29 0.29 (0.00)25.52 25.39 (0.13) OUTPATIENT HOSPITAL SERVICES 25.52 25.39 (0.13)
OTHER MEDICAL 5.03 5.62 0.59 Ambulance and NEMT 5.03 5.62 0.591.76 1.55 (0.22) Home Health Services & CBAS 1.76 1.55 (0.22)0.82 1.79 0.97 Utilization and Quality Review Expenses 0.82 1.79 0.975.80 4.73 (1.07) Long Term/SNF/Hospice 5.80 4.73 (1.07)0.76 1.43 0.68 Health Home Capitation & Incentive 0.76 1.43 0.68
18.63 18.57 (0.07) Provider Enhancement Expense - Prop. 56 18.63 18.57 (0.07)1.64 1.68 0.04 Provider Enhancement Expense - GEMT 1.64 1.68 0.042.42 0.00 (2.42) Provider COVID-19 Expenes 2.42 0.00 (2.42)1.33 1.45 0.11 Behaviorial Health Integration Program 1.33 1.45 0.11
38.21 36.83 (1.38) TOTAL OTHER MEDICAL 38.21 36.83 (1.38)PHARMACY SERVICES
29.35 34.06 4.72 RX - Drugs & OTC 29.35 34.06 4.720.88 1.39 0.51 RX - HEP-C 0.88 1.39 0.512.93 2.80 (0.13) Rx - DME 2.93 2.80 (0.13)
(0.48) (0.12) 0.36 RX - Pharmacy Rebates (0.48) (0.12) 0.3632.67 38.13 5.46 TOTAL PHARMACY SERVICES 32.67 38.13 5.461.90 1.90 0.00 PAY FOR PERFORMANCE QUALITY INCENTIVE 1.90 1.90 0.000.00 0.00 0.00 RISK CORRIDOR EXPENSE 0.00 0.00 0.00
54.29 34.53 (19.77) HOSPITAL DIRECTED PAYMENTS 54.29 34.53 (19.77)0.14 0.00 (0.14) HOSPITAL DIRECTED PAYMENT ADJUSTMENT 0.14 0.00 (0.14)1.03 0.00 (1.03) NON-CLAIMS EXPENSE ADJUSTMENT 1.03 0.00 (1.03) 0.02 0.00 (0.02) IBNR, INCENTIVE, AND PAID CLAIMS ADJUSTMENT 0.02 0.00 (0.02)
311.55 285.36 (26.19) Total Medical Costs 311.55 285.36 (26.19)
* Medical costs per DMHC regulations
KHS3/29/2021Management Use Only Page 8
KHS Finance Committee Meeting, April 9, 2021
114 / 144

KERN HEALTH SYSTEMSMEDI-CAL
SCHEDULE OF MEDICAL COSTS BY MONTH THROUGH JANUARY 31, 2021
PHYSICIAN SERVICESPrimary Care Physician Services 2,962,264 2,962,264
Referral Specialty Services 10,512,215 10,512,215Urgent Care & After Hours Advise 1,423,381 1,423,381
Hospital Admitting Team 9,300 9,300
TOTAL PHYSICIAN SERVICES 14,907,160 14,907,160
OTHER PROFESSIONAL SERVICESVision Service Capitation 294,054 294,054 221 - Business Intelligence 210,663 210,663
310 - Health Services - Utilization Management - UM Allocation * 595,003 595,003 311 - Health Services - Quality Improvement - UM Allocation * 138,388 138,388
312 - Health Services - Education - UM Allocation * 120,621 120,621 313 - Health Services - Pharmacy - UM Allocation * 75,046 75,046
314 - Health Homes - UM Allocation * 120,170 120,170 315 - Case Management - UM Allocation * 270,657 270,657
616 - Disease Management - UM Allocation * 62,998 62,998 Behavior Health Treatment 867,517 867,517
Mental Health Services 292,517 292,517 Other Professional Services 1,373,918 1,373,918
TOTAL OTHER PROFESSIONAL SERVICES 4,421,552 4,421,552
EMERGENCY ROOM 4,676,327 4,676,327
INPATIENT HOSPITAL 19,853,180 19,853,180
REINSURANCE EXPENSE PREMIUM 81,215 81,215
OUTPATIENT HOSPITAL SERVICES 7,108,674 7,108,674
OTHER MEDICAL Ambulance and NEMT 1,400,971 1,400,971
Home Health Services & CBAS 490,933 490,933Utilization and Quality Review Expenses 228,696 228,696
Long Term/SNF/Hospice 1,616,577 1,616,577Health Home Capitation & Incentive 211,140 211,140
Provider Enhancement Expense - Prop. 56 5,190,164 5,190,164Provider Enhancement Expense - GEMT 456,380 456,380
Provider COVID-19 Expenes 674,580 674,580Behaviorial Health Integration Program 371,672 371,672
TOTAL OTHER MEDICAL 10,641,113 10,641,113
PHARMACY SERVICES
RX - Drugs & OTC 8,174,252 8,174,252
RX - HEP-C 245,144 245,144
Rx - DME 815,963 815,963
RX - Pharmacy Rebates (135,000) (135,000)
TOTAL PHARMACY SERVICES 9,100,359 9,100,359
PAY FOR PERFORMANCE QUALITY INCENTIVE 529,182 529,182
RISK CORRIDOR EXPENSE - -
HOSPITAL DIRECTED PAYMENTS 15,121,903 15,121,903
HOSPITAL DIRECTED PAYMENT ADJUSTMENT 39,990 39,990
NON-CLAIMS EXPENSE ADJUSTMENT 287,063 287,063
IBNR, INCENTIVE, AND PAID CLAIMS ADJUSTMENT 4,787 4,787
Total Medical Costs 86,772,505 86,772,505
YEAR TO DATE 2021
JANUARY 2021
KHS3/29/2021Management Use Only
Page 9
KHS Finance Committee Meeting, April 9, 2021
115 / 144

KERN HEALTH SYSTEMSMEDI-CAL
SCHEDULE OF MEDICAL COSTS BY MONTH - PMPMTHROUGH JANUARY 31, 2021
PHYSICIAN SERVICESPrimary Care Physician Services 10.64 10.64
Referral Specialty Services 37.74 37.74Urgent Care & After Hours Advise 5.11 5.11
Hospital Admitting Team 0.03 0.03
TOTAL PHYSICIAN SERVICES 53.52 53.52
OTHER PROFESSIONAL SERVICESVision Service Capitation 1.06 1.06221 - Business Intelligence 0.76 0.76
310 - Health Services - Utilization Management - UM Allocation * 2.14 2.14311 - Health Services - Quality Improvement - UM Allocation * 0.50 0.50
312 - Health Services - Education - UM Allocation * 0.43 0.43313 - Health Services - Pharmacy - UM Allocation * 0.27 0.27
314 - Health Homes - UM Allocation * 0.43 0.43315 - Case Management - UM Allocation * 0.97 0.97
616 - Disease Management - UM Allocation * 0.23 0.23Behavior Health Treatment 3.11 3.11
Mental Health Services 1.05 1.05Other Professional Services 4.93 4.93
TOTAL OTHER PROFESSIONAL SERVICES 15.88 15.88
EMERGENCY ROOM 16.79 16.79
INPATIENT HOSPITAL 71.28 71.28
REINSURANCE EXPENSE PREMIUM 0.29 0.29
OUTPATIENT HOSPITAL SERVICES 25.52 25.52
OTHER MEDICAL Ambulance and NEMT 5.03 5.03
Home Health Services & CBAS 1.76 1.76Utilization and Quality Review Expenses 0.82 0.82
Long Term/SNF/Hospice 5.80 5.80Health Home Capitation & Incentive 0.76 0.76
Provider Enhancement Expense - Prop. 56 18.63 18.63Provider Enhancement Expense - GEMT 1.64 1.64
Provider COVID-19 Expenes 2.42 2.42Behaviorial Health Integration Program 1.33 1.33
TOTAL OTHER MEDICAL 38.21 38.21
PHARMACY SERVICES
RX - Drugs & OTC 29.35 29.35
RX - HEP-C 0.88 0.88
Rx - DME 2.93 2.93
RX - Pharmacy Rebates (0.48) (0.48)
TOTAL PHARMACY SERVICES 32.67 32.67
PAY FOR PERFORMANCE QUALITY INCENTIVE 1.90 1.90
RISK CORRIDOR EXPENSE 0.00 0.00
HOSPITAL DIRECTED PAYMENTS 54.29 54.29
HOSPITAL DIRECTED PAYMENT ADJUSTMENT 0.14 0.14
NON-CLAIMS EXPENSE ADJUSTMENT 1.03 1.03
IBNR, INCENTIVE, AND PAID CLAIMS ADJUSTMENT 0.02 0.02
Total Medical Costs 311.55 311.55
YEAR TO DATE 2021
JANUARY 2021
KHS3/29/2021Management Use Only
Page 10
KHS Finance Committee Meeting, April 9, 2021
116 / 144

KERN HEALTH SYSTEMS
MEDI-CAL
CURRENT MONTH SCHEDULE OF ADMINISTRATIVE EXPENSES BY DEPT YEAR-TO-DATEACTUAL BUDGET VARIANCE FOR THE MONTH ENDED JANUARY 31, 2021 ACTUAL BUDGET VARIANCE
353,943 377,031 23,088 110 - Executive 353,943 377,031 23,088
203,619 212,651 9,032 210 - Accounting 203,619 212,651 9,032
340,212 362,443 22,231 220 - Management Information Systems 340,212 362,443 22,231
- 64,468 64,468 221 - Business Intelligence - 64,468 64,468
250,306 281,931 31,625 222 - Enterprise Development 250,306 281,931 31,625
365,340 448,523 83,183 225 - Infrastructure 365,340 448,523 83,183
550,124 576,323 26,199 230 - Claims 550,124 576,323 26,199
99,808 149,779 49,971 240 - Project Management 99,808 149,779 49,971
103,641 101,775 (1,866) 310 - Health Services - Utilization Management 103,641 101,775 (1,866)
18,870 27,902 9,032 311 - Health Services - Quality Improvement 18,870 27,902 9,032
- 55 55 312 - Health Services - Education - 55 55
141,859 142,146 287 313- Pharmacy 141,859 142,146 287
- 6,642 6,642 314 - Health Homes - 6,642 6,642
23,536 22,357 (1,179) 315 - Case Management 23,536 22,357 (1,179)
32,453 29,325 (3,128) 616 - Disease Management 32,453 29,325 (3,128)
304,995 323,502 18,507 320 - Provider Network Management 304,995 323,502 18,507
567,625 656,475 88,850 330 - Member Services 567,625 656,475 88,850
561,450 702,275 140,825 340 - Corporate Services 561,450 702,275 140,825
68,976 66,363 (2,613) 360 - Audit & Investigative Services 68,976 66,363 (2,613)
27,368 69,250 41,882 410 - Advertising Media 27,368 69,250 41,882
53,401 73,950 20,549 420 - Sales/Marketing/Public Relations 53,401 73,950 20,549
281,636 251,455 (30,181) 510 - Human Resourses 281,636 251,455 (30,181)
18,296 - (18,296) Administrative Expense Adjustment 18,296 - (18,296)
4,367,458 4,946,622 579,164 Total Administrative Expenses 4,367,458 4,946,622 579,164
KHS3/29/2021Management Use Only Page 11
KHS Finance Committee Meeting, April 9, 2021
117 / 144

KERN HEALTH SYSTEMS
MEDI-CAL
SCHEDULE OF ADMIN EXPENSES BY DEPT BY MONTH FOR THE MONTH ENDED JANUARY 31, 2021
110 - Executive 353,943 353,943
210 - Accounting 203,619 203,619
220 - Management Information Systems (MIS) 340,212 340,212
221 - Business Intelligence - -
222 - Enterprise Development 250,306 250,306
225 - Infrastructure 365,340 365,340
230 - Claims 550,124 550,124
240 - Project Management 99,808 99,808
310 - Health Services - Utilization Management 103,641 103,641
311 - Health Services - Quality Improvement 18,870 18,870
312 - Health Services - Education - -
313- Pharmacy 141,859 141,859
314 - Health Homes - -
315 - Case Management 23,536 23,536
616 - Disease Management 32,453 32,453
320 - Provider Network Management 304,995 304,995
330 - Member Services 567,625 567,625
340 - Corporate Services 561,450 561,450
360 - Audit & Investigative Services 68,976 68,976
410 - Advertising Media 27,368 27,368
420 - Sales/Marketing/Public Relations 53,401 53,401
510 - Human Resourses 281,636 281,636
Total Department Expenses 4,349,162 4,349,162
ADMINISTRATIVE EXPENSE ADJUSTMENT 18,296 18,296
Total Administrative Expenses 4,367,458 4,367,458
YEAR TO DATE 2021
JANUARY2021
KHS3/29/2021Management Use Only Page 12
KHS Finance Committee Meeting, April 9, 2021
118 / 144

KERN HEALTH SYSTEMSGROUP HEALTH PLAN - HFAMBALANCE SHEET STATEMENT
AS OF JANUARY 31, 2021ASSETS JANUARY 2021 DECEMBER 2020 INC(DEC)
CURRENT ASSETS:Cash and Cash Equivalents 1,135,503$ 1,136,281$ (778)
Interest Receivable 595 1,785 (1,190) TOTAL CURRENT ASSETS 1,136,098$ 1,138,066$ (1,968)$
LIABILITIES AND NET POSITIONCURRENT LIABILITIES:
Other Liabilities - - - TOTAL CURRENT LIABILITIES -$ -$ -$
NET POSITION:Net Position- Beg. of Year 1,138,066 1,128,885 9,181
Increase (Decrease) in Net Position - Current Year (1,968) 9,181 (11,149) Total Net Position 1,136,098$ 1,138,066$ (1,968)$
TOTAL LIABILITIES AND NET POSITION 1,136,098$ 1,138,066$ (1,968)$
KHS3/29/2021Management Use Only Page 13
KHS Finance Committee Meeting, April 9, 2021
119 / 144

KERN HEALTH SYSTEMS
GROUP HEALTH PLAN - HFAM
CURRENT MONTH
STATEMENT OF REVENUE, EXPENSES, ANDCHANGES IN NET POSITION YEAR-TO-DATE
ACTUAL BUDGET VARIANCE FOR THE MONTH ENDED JANUARY 31, 2021 ACTUAL BUDGET VARIANCE
E N R O L L M E N T
- - - M e m b e r s - - -
R E V E N U E S
- - - Premium - - - 595 - 595 I n t e r e s t 595 - 595
(2,563) - (2,563) Other Investment Income (2,563) - (2,563) (1,968) - (1,968) TOTAL REVENUES (1,968) - (1,968)
E X P E N S E S
Medical Costs- - - IBNR and Paid Claims Adjustment - - - - - - Total Medical Costs - - -
(1,968) - (1,968) GROSS MARGIN (1,968) - (1,968)
Administrative- - - Management Fee Expense and Other Admin Exp - - - - - - Total Administrative Expenses - - -
- - - TOTAL EXPENSES - - -
(1,968) - (1,968) OPERATING INCOME (LOSS) (1,968) - (1,968)
- - - TOTAL NONOPERATING REVENUE (EXPENSES) - - -
(1,968) - (1,968) NET INCREASE (DECREASE) IN NET POSITION (1,968) - (1,968)
0% 0% 0% MEDICAL LOSS RATIO 0% 0% 0%
0% 0% 0% ADMINISTRATIVE EXPENSE RATIO 0% 0% 0%
KHS3/29/2021Management Use Only Page 14
KHS Finance Committee Meeting, April 9, 2021
120 / 144

KERN HEALTH SYSTEMS
MONTHLY MEMBERS COUNT
KERN HEALTH SYSTEMS
2021 MEMBER
MEDI-CAL MONTHS JAN'21 FEB'21 MAR'21 APR'21 MAY'21 JUN'21 JUL'21 AUG'21 SEP'21 OCT'21 NOV'21 DEC'21
ADULT AND FAMILY
ADULT 51,548 51,548 0 0 0 0 0 0 0 0 0 0 0CHILD 131,669 131,669 0 0 0 0 0 0 0 0 0 0 0
SUB-TOTAL ADULT & FAMILY 183,217 183,217 0 0 0 0 0 0 0 0 0 0 0
OTHER MEMBERS
PARTIAL DUALS - FAMILY 403 403 0 0 0 0 0 0 0 0 0 0 0
PARTIAL DUALS - CHILD 0 0 0 0 0 0 0 0 0 0 0 0 0PARTIAL DUALS - BCCTP 2 2 0 0 0 0 0 0 0 0 0 0 0
BCCTP - TABACCO SETTLEMENT 0 0 0 0 0 0 0 0 0 0 0 0 0
FULL DUALS (SPD)
SPD FULL DUALS 7,468 7,468 0 0 0 0 0 0 0 0 0 0 0
SUBTOTAL OTHER MEMBERS 7,873 7,873 0 0 0 0 0 0 0 0 0 0 0
TOTAL FAMILY & OTHER 191,090 191,090 0 0 0 0 0 0 0 0 0 0 0
SPD
SPD (AGED AND DISABLED) 16,027 16,027 0 0 0 0 0 0 0 0 0 0 0
MEDI-CAL EXPANSION
ACA Expansion Adult-Citizen 70,649 70,649 0 0 0 0 0 0 0 0 0 0 0ACA Expansion Duals 751 751 0 0 0 0 0 0 0 0 0 0 0
SUB-TOTAL MED-CAL EXPANSION 71,400 71,400 0 0 0 0 0 0 0 0 0 0 0
TOTAL KAISER 11,047 11,047 0 0 0 0 0 0 0 0 0 0 0
TOTAL MEDI-CAL MEMBERS 289,564 289,564 0 0 0 0 0 0 0 0 0 0 0
Page 15
KHS Finance Committee Meeting, April 9, 2021
121 / 144


December AP Vendor Report
Amounts over $10,000.00
Vendor
No.
Vendor Name Current Month Year-to- Date Description Department
T4722 COGNIZANT TRIZETTO SOFTWARE GROUP,
INC.
593,352.66 965,736.57 ANNUAL MAINTENANCE SUPPORT AND LICENSES,
NOVEMBER 2020 PROFESSIONAL SERVICES, QNXT
MAINT., HPA BILLING & EDI CLAIMS PROCESSING,
CLAIMS INTEGRITY
VARIOUS
T1045 KAISER FOUNDATION HEALTH - HMO 444,969.15 5,371,209.15 DECEMBER 2020 HMO EMPLOYEE HEALTH
BENEFITS
VARIOUS
T4699 ZeOMEGA, INC.***** 330,556.05 487,188.34 MEDICAL MANAGEMENT PLATFORM - ANNUAL
LICENSE & CUSTOMIZATION MAINTENANCE
SUPPORT
MIS INFRASTRUCTURE
T1845 DEPARTMENT OF MANAGED HEALTH
CARE*****
261,270.08 543,607.97 2ND AND FINAL PAYMENT 2020 MCAL/HFAM
ANNUAL ASSESSMENT FEES
ADMINISTRATION
T5229 DIGNITY HEALTH MEDICAL GROUP -
BAKERSFIELD*****
203,340.98 1,502,447.89 JULY & AUG. 2020 HEALTH HOMES GRANT COMMUNITY GRANTS
T4350 COMPUTER ENTERPRISE INC. 198,721.52 2,330,141.89 OCTOBER - NOVEMBER 2020 PROFESSIONAL
SERVICES / CONSULTING SERVICES
CAPITAL PROJECTS IN PROCESS/
MIS
T4695 EDIFECS, INC.***** 196,893.40 196,893.40 ANNUAL TSM MAINTENANCE MIS INFRASTRUCTURE
T5258 GOOD SAMARITAN HOSPITAL, LP ***** 155,714.59 300,000.00 SEPTEMBER 2020 PROVIDER QUALITY CARE
GRANT
COMMUNITY GRANTS
T5319 CITIUSTECH INC.**** 155,000.00 155,000.00 FAST + FRAMEWORK LICENSE FEES CAPITAL PROJECTS IN PROCESS
T2469 DST HEALTH SOLUTIONS, INC.***** 138,540.00 138,540.00 ACG ANNUAL MAINTENANCE RENEWAL MIS INFRASTRUCTURE
T2726 DST PHARMACY SOLUTIONS, INC. 108,321.31 1,401,920.13 NOVEMBER 2020 PHARMACY CLAIMS PHARMACY
T5111 ENTISYS 360***** 100,144.00 613,096.65 HARDWARE- 3 NUTANIX NODES WITH SOFTWARE
LICENSE AND SUPPORT
CAPTAL PROJECT
T2488 THE LINCOLN NATIONAL LIFE INSURANCE 68,110.71 788,074.97 DECEMBER 2020 VOLUNTARY LIFE, AD&D, DENTAL
INSURANCE
VARIOUS
T4237 FLUIDEDGE CONSULTING, INC. 57,921.25 1,167,486.92 NOVEMBER 2020 PROFESSIONAL SERVICES/
CONSULTING SERVICES
VARIOUS
1 of 4
KHS Finance Committee Meeting, April 9, 2021
123 / 144

December AP Vendor Report
Amounts over $10,000.00
Vendor
No.
Vendor Name Current Month Year-to- Date Description Department
T4165 SHI INTERNATIONAL CO. 56,615.86 373,659.37 VMWARE LICENSES & SUPPORT MIS INFRASTRUCTURE
T2941 KERN PRINT SERVICES INC.***** 55,104.61 90,555.41 OTHER PRINTING COSTS, ENVELOPES VARIOUS
T1408 DELL MARKETING L.P. ***** 52,099.84 242,259.84 HARDWARE - 25 LATITUDE 5411 LAPTOPS MIS INFRASTRUCTURE
T2562 CACTUS SOFTWARE LLC***** 50,537.87 64,669.18 2020-2021 CACTUS SOFTWARE ANNUAL LICENSE &
MAINTENANCE
MIS INFRASTRUCTURE
T4959 BERKSHIRE HATHWAY HOMESTATE
COMPANIES*****
45,543.00 248,367.00 WORKERS COMP - TRUE UP ADMINISTRATION
T4353 TWE SOLUTIONS, INC.***** 44,576.52 44,576.52 ANNUAL TECHNICAL SUPPORT AND MAINTENANCE
FOR NIMBLE STORAGE SOLUTIONS
MIS INFRASTRUCTURE
T1861 CERIDIAN HCM, INC. 41,338.55 228,232.92 NOVEMBER & DECEMBER 2020 MONTHLY
SUBSCRIPTION FEES & OCT PROFESSIONAL
SERVICES
HUMAN RESOURCES
T4193 STRIA LLC 40,437.29 410,364.04 NOVEMBER 2020 OCR SERVICES AND
PROFESSIONAL SERVICES
CLAIMS
T4582 HEALTHX, INC. 40,376.00 484,512.00 DECEMBER 2020 MAINTENANCE AND SUPPORT
FEES - PROVIDER AND MEMBER PORTAL
MIS INFRASTRUCTURE
T4391 OMNI FAMILY HEALTH***** 39,116.23 1,826,620.26 SEPTEMBER 2020 HEALTH HOMES AND PROVIDER
QUAILITY CARE GRANT
COMMUNITY GRANTS
T5109 RAND EMPLOYMENT SOLUTIONS 38,572.49 325,843.19 NOVEMBER 2020 TEMP SERVICES- 4MS, 1UM, 1 HE,
1 MIS, 1 HHP, 1 ACCT
VARIOUS
T1272 COFFEY COMMUNICATIONS INC. 32,256.22 180,694.31 FALL 2020 MEMBER NEWSLETTER POSTAGE/
NOVEMBER 2020 WEBSITE IMPLEMENTATION
HEALTH EDUCATION/ MIS
INFRASTRUCTURE
T5321 TYK TECHNOLOGIES LTD***** 30,000.00 30,000.00 API MANAGER - SELF MANAGED PACKAGE
SUBSCRIPTION & SUPPORT
CAPITAL PROJECTS IN PROCESS
2 of 4
KHS Finance Committee Meeting, April 9, 2021
124 / 144

December AP Vendor Report
Amounts over $10,000.00
Vendor
No.
Vendor Name Current Month Year-to- Date Description Department
T5185 HOUSING AUTHORITY COUNTY OF KERN 29,750.00 211,150.00 SEPTEMBER - OCTOBER 2020 HOUSING
AUTHORITY GRANT
UM
T5145 CCS ENGINEERING FRESNO INC., 29,125.64 199,501.89 DECEMBER 2020 JANITORIAL SERVICES CORPORATE SERVICES
T4054 ASSOCIATION FOR COMMUNITY AFFILIATED
PLANS*****
25,500.00 101,000.00 2021 LEADERSHIP ACADEMY REGISTRATION ADMINISTRATION
T5076 MERIDIAN HEALTH SYSTEMS, P.C. 24,050.00 137,410.00 NOVEMBER 2020 PROFESSIONAL SERVICES UTILIZATION MANAGEMENT
T4538 CHANGE HEALTHCARE SOLUTIONS, LLC 21,750.81 253,290.88 NOVEMBER 2020 EDI CLAIM PROCESSING CLAIMS
T3448 SYNERGY HEALTHCARE, INC.***** 20,900.00 49,600.00 SEPTEMBER - OCTOBER 2020 KOMOTO ASTHMA
PROGRAM
DISEASE MANAGEMENT
T4501 ALLIED UNIVERSAL SECURITY SERVICES 20,705.17 235,435.06 NOVEMBER - DECEMBER 2020 ONSITE SECURITY CORPORATE SERVICES
T2167 PG&E 19,549.28 272,517.65 10/16/20-11/15/20 USAGE/UTILITIES CORPORATE SERVICES
T2458 HEALTHCARE FINANCIAL, INC. 18,000.00 285,000.00 OCTOBER 2020 PROFESSIONAL SERVICES ADMINISTRATION
T4733 UNITED STAFFING ASSOCIATES 17,511.82 235,984.35 NOVEMBER - DECEMBER 2020 TEMPORARY HELP-
1 MIS, 1 HHP & 2 HE
VARIOUS
T3011 OFFICE ALLY, INC. 17,355.75 196,533.75 NOVEMBER 2020 EDI CLAIM PROCESSING CLAIMS
T4563 SPH ANALYTICS 17,269.00 60,176.80 2020 HEALTH HOME PROGRAM SURVEY - INITIAL
PAYMENT & 2020 PROVIDER SATISFACTION
SURVEY- FINAL PAYMENT
VARIOUS
T4521 PAYSCALE, INC.***** 16,000.00 32,000.00 COMPENSATION STUDY AND SALARY ANALYTICS HUMAN RESOURCES
T4460 PAYSPAN, INC 15,766.72 200,725.82 NOVEMBER 2020 ELECTRIC CLAIMS/PAYMENTS FINANCE
T2918 STINSON'S 15,435.49 185,812.16 2020 OFFICE SUPPLIES, & ADDITIONAL FEES FOR
CUBICLES RECONFIGURATIONS
VARIOUS
3 of 4
KHS Finance Committee Meeting, April 9, 2021
125 / 144

December AP Vendor Report
Amounts over $10,000.00
Vendor
No.
Vendor Name Current Month Year-to- Date Description Department
T2578 AMERICAN HEART ASSOCIATION - KERN
COUNTY*****
15,000.00 15,000.00 COMMUNITY SPONSORSHIP ADMINISTRATION
T5268 TONY'S FIREHOUSE GRILL & PIZZA***** 14,750.00 22,791.26 2020 EMPLOYEE EVENTS MARKETING
T4607 AGILITY RECOVERY SOLUTIONS INC.***** 14,147.00 54,598.00 OCTOBER - DECEMBER 2020 PROFESSIONAL
SERVICESADMINISTRATION
T1005 COLONIAL LIFE & ACCIDENT ATTN PREMIUM
PROCESSING
12,101.66 149,567.67 NOVEMBER 2020 ACCIDENT & CRITICAL ILLNESS
EMPLOYEE PREMIUM
VARIOUS
T5209 ADOBE, INC.**** 12,000.00 12,000.00 2 YR MAINTENANCE - ROBOHELP SERVER &
TECHNICAL COMMUNICATION SUITE
MIS INFRASTRUCTURE
T5005 CRAYON SOFTWARE EXPERTS LLC 11,447.17 553,772.16 OCTOBER 2020 ESD AZURE OVERAGE MIS INFRASTRUCTURE
T4657 DAPONDE SIMPSON ROWE PC***** 10,112.50 244,016.00 OCTOBER LEGAL SERVICES ADMINISTRATION
T5012 KERN MEDICAL CENTER FOUNDATION**** 10,000.00 10,000.00 COMMUNITY SPONSORSHIP MARKETING
3,987,658.19
TOTAL VENDORS OVER $10,000 3,987,658.19
TOTAL VENDORS UNDER $10,000 242,500.57
TOTAL VENDOR EXPENSES- DECEMBER 4,230,158.76
Note:
****New vendors over $10,000 for the month of December
4 of 4
KHS Finance Committee Meeting, April 9, 2021
126 / 144

Year to Date AP Vendor Report
Amounts over $10,000.00
Vendor
No.Vendor Name Year-to-Date Description Department
T1045 KAISER FOUNDATION HEALTH - HMO 5,371,209.15 HMO EMPLOYEE HEALTH BENEFITS VARIOUS
T4350 COMPUTER ENTERPRISE INC. 2,330,141.89 PROFESSIONAL SERVICES / CONSULTING SERVICES &
TRAVEL EXP.
CAPITAL PROJECTS IN PROCESS/ MIS
T4391 OMNI FAMILY HEALTH 1,826,620.26 HEALTH HOMES AND PROVIDER QUAILITY CARE GRANT COMMUNITY GRANTS
T4290 S.C. ANDERSON, INC. 1,555,742.74 NEW BUILDING RETAINER AND DECEMBER 2019 NEW
BUILDING CONSTRUCTION SERVICES
CAPITAL PROJECT - NEW BUILDING
T5229 DIGNITY HEALTH MEDICAL GROUP -
BAKERSFIELD
1,502,447.89 HEALTH HOMES GRANT COMMUNITY GRANTS
T2726 DST PHARMACY SOLUTIONS, INC. 1,401,920.13 PHARMACY CLAIMS PHARMACY
T4237 FLUIDEDGE CONSULTING, INC. 1,167,486.92 PROFESSIONAL SERVICES / CONSULTING SERVICES &
TRAVEL EXP.
VARIOUS
T4982 NGC US, LLC 1,131,810.99 PREFUND HEALTH HOMES INCENTIVES & HEALTH
EDUCATION MEMBER INCENTIVES
VARIOUS
T4722 COGNIZANT TRIZETTO SOFTWARE GROUP,
INC.
965,736.57 PROFESSIONAL SERVICES VARIOUS
T2488 THE LINCOLN NATIONAL LIFE INSURANCE 788,074.97 VOLUNTARY LIFE, AD&D, DENTAL INSURANCE VARIOUS
T2686 ALLIANT INSURANCE SERVICES INC. 742,417.45 ANNUAL INSURANCE & ACIP CRIME PREMIUMS ADMINISTRATION
T5111 ENTISYS 360 613,096.65 DISASTER RECOVERY CONTINUITY PROJECT MIS INFRASTRUCTURE/CAPITAL PROJECT
T5005 CRAYON SOFTWARE EXPERTS LLC 553,772.16 2019 TRUE UP MAINTENANCE, 2020 ESD ANNUAL
SUPPORT & ESD AZURE OVERAGE
MIS INFRASTRUCTURE
T1845 DEPARTMENT OF MANAGED HEALTH CARE 543,607.97 2020 MCAL/HFAM ANNUAL ASSESSMENT FEES ADMINISTRATION
T4483 INFUSION AND CLINICAL SERVICES, INC. 490,706.91 HEALTH HOMES GRANT COMMUNITY GRANT
T4699 ZeOMEGA, INC. 487,188.34 PROFESSIONAL SERVICES AND TRAVEL EXP. UM
1 of 11
KHS Finance Committee Meeting, April 9, 2021
127 / 144

Year to Date AP Vendor Report
Amounts over $10,000.00
Vendor
No.Vendor Name Year-to-Date Description Department
T4582 HEALTHX, INC. 484,512.00 2020 MAINTENANCE AND SUPPORT FEES - PROVIDER
AND MEMBER PORTAL
MIS INFRASTRUCTURE
T3130 OPTUMINSIGHT, INC. 453,564.00 ANNUAL LICENSED SOFTWARE EASYGROUP &
INCREMENTAL LICENSE
MIS INFRASTRUCTURE
T4193 STRIA LLC 410,364.04 OCR SERVICES AND PROFESSIONAL SERVICES CLAIMS & HUMAN RESOURCES
T4165 SHI INTERNATIONAL CO. 373,659.37 STANDING WORKING STATIONS, LICENSES FEES,
TRUEUP & JUNIPER NETWORKS -QSFP TRANSCEIVER
MODULE
VARIOUS
T5109 RAND EMPLOYMENT SOLUTIONS 325,843.19 TEMPORARY HELP VARIOUS
T5258 GOOD SAMARITAN HOSPITAL, LP 300,000.00 PROVIDER QUALITY CARE GRANT COMMUNITY GRANTS
T2458 HEALTHCARE FINANCIAL, INC. 285,000.00 PROFESSIONAL SERVICES ADMINISTRATION
T2167 PG&E 272,517.65 USAGE/UTILITIES CORPORATE SERVICES
T4538 CHANGE HEALTHCARE SOLUTIONS, LLC 253,290.88 EDI CLAIM PROCESSING (EMDEON) CLAIMS
T4959 BERKSHIRE HATHWAY HOMESTATE
COMPANIES
248,367.00 2020-2021 WORKER'S COMPENSATION INSURANCE
PREMIUM
ADMINISTRATION
T4657 DAPONDE SIMPSON ROWE PC 244,016.00 LEGAL SERVICES PROVIDER RELATIONS
T1408 DELL MARKETING L.P. 242,259.84 HARDWARE & COMPUTER EQUIPMENT MIS INFRASTRUCTURE
T4733 UNITED STAFFING ASSOCIATES 235,984.35 POSTAGE (METER) FUND CORPORATE SERVICES
T5119 PACIFIC WEST SOUND PROFESSIONAL
AUDIO & DESIGN INC.
235,758.22 NEW BUILDING FURNITURE (LIVE STREAM VIA IP) CAPITAL PROJECT - NEW BUILDING
T4501 ALLIED UNIVERSAL SECURITY SERVICES 235,435.06 ONSITE SECURITY CORPORATE SERVICES
T1861 CERIDIAN HCM, INC. 228,232.92 MONTHLY SUBSCRIPTION FEES,PROFESSIONAL
SERVICES/ DAYFORCE HUMAN CAPITAL MANAGEMENT
IMPLEMENTATION & AMENDMENTS
HUMAN RESOURCES
2 of 11
KHS Finance Committee Meeting, April 9, 2021
128 / 144

Year to Date AP Vendor Report
Amounts over $10,000.00
Vendor
No.Vendor Name Year-to-Date Description Department
T5185 HOUSING AUTHORITY COUNTY OF KERN 211,150.00 HOUSING AUTHORITY GRANT UM
T4460 PAYSPAN, INC 200,725.82 ELECTRONIC CLAIMS/PAYMENTS & PPD
REIMBURSEMENTS
FINANCE
T2584 UNITED STATES POSTAL SVC.-HASLER 200,000.00 POSTAGE (METER) FUND CORPORATE SERVICES
T5145 CCS ENGINEERING FRESNO INC., 199,501.89 JANITORIAL SERVICES CORPORATE SERVICES
T4967 ADMINISTRATIVE SOLUTIONS, INC. 197,805.86 FSA EMPLOYEE PREMIUM & SECTION 125
ADMINISTRATION
VARIOUS
T4695 EDIFECS, INC.**** 196,893.40 ANNUAL TSM MAINTENANCE MIS INFRASTRUCTURE
T3011 OFFICE ALLY, INC. 196,533.75 EDI CLAIM PROCESSING CLAIMS
T2918 STINSON'S 185,812.16 2020 OFFICE SUPPLIES, CONFERENCE TABLES, OFFICE
FURNITURE, CABINET FOR TRAINING, DEVELOPMENT
ROOM & ADDITIONAL CUBICLES
VARIOUS
T1272 COFFEY COMMUNICATIONS INC. 180,694.31 MEMBER NEWSLETTER/ WEBSITE IMPLEMENTATION HEALTH EDUCATION/ MIS
INFRASTRUCTURE
T5217 AMERICAN TILE & BRICK VENEER, INC. 157,500.00 FINAL PAYMENT FOR BRICK WALL BUILDING IMPROVEMENT
T5319 CITIUSTECH INC.**** 155,000.00 FAST + FRAMEWORK LICENSE FEES CAPITAL PROJECTS IN PROCESS
T5269 KERN COMMUNITY FOUNDATION 151,000.00 HEALTH HOME GRANT COMMUNITY GRANT
T4696 ZNALYTICS, LLC 149,840.00 PROFESSIONAL SERVICES CAPITAL PROJECT-CASE
MANAGEMENT/DISEASE MANAGEMENT
T1005 COLONIAL LIFE & ACCIDENT ATTN PREMIUM
PROCESSING
149,567.67 EMPLOYEE PREMIUM - ACCIDENT & CRITICAL ILLNESS VARIOUS
T4331 COTIVITI, INC 148,388.00 CALIFORNIA MEDI-CAL MEDICAID MEASURES & ANNUAL
LICENSE FEE
QUALITY IMPROVEMENT
3 of 11
KHS Finance Committee Meeting, April 9, 2021
129 / 144

Year to Date AP Vendor Report
Amounts over $10,000.00
Vendor
No.Vendor Name Year-to-Date Description Department
T4396 KAISER FOUNDATION HEALTH-DHMO 144,997.32 DHMO EMPLOYEE HEALTH BENEFITS VARIOUS
T2469 DST HEALTH SOLUTIONS, INC.**** 138,540.00 ACG ANNUAL MAINTENANCE RENEWAL MIS INFRASTRUCTURE
T5076 MERIDIAN HEALTH SYSTEMS, P.C. 137,410.00 PROFESSIONAL SERVICES UTILIZATION MANAGEMENT
T1189 APPLE ONE INC, EMPLOYMENT SERVICES 136,541.97 TEMPORARY HELP VARIOUS
T4038 POLYCLINIC MEDICAL CENTER, INC 120,000.00 HEALTH HOME AND PROVIDER QUALITY CARE GRANT COMMUNITY GRANTS
T3449 CDW GOVERNMENT 113,890.17 HARDWARE & COMPUTER SUPPLIES VARIOUS
T4902 CHANGE HEALTHCARE TECHNOLOGIES, LLC 112,862.29 EDI CLAIM PROCESSING CLAIMS / MIS
T4785 COMMGAP 112,413.75 INTERPRETATION SERVICES HEALTH EDUCATION
T5132 TIME WARNER CABLE LLC 107,943.86 INTERNET SERVICES MIS INFRASTRUCTURE
T5026 TEL-TEC SECURITY SYSTEMS 105,522.05 ADDITIONAL SECURITY SYSTEM & LABOR CORPORATE SERVICES
T2704 MCG HEALTH LLC 104,263.86 SOFTWARE LICENSE - HEALTH CARE MANAGEMENT UTILIZATION MANAGEMENT
T5227 RIDGECREST MEDICAL TRANSPORTATION 101,880.00 PROVIDER QUALITY CARE GRANT COMMUNITY GRANTS
T1960 LOCAL HEALTH PLANS OF CALIFORNIA 101,221.32 VOLUNTARY LIFE, AD&D, DENTAL INSURANCE VARIOUS
T4054 ASSOCIATION FOR COMMUNITY AFFILIATED
PLANS
101,000.00 2020 ANNUAL DUES, 2019 SALARY SURVEY, &
LEADERSHIP FEES
VARIOUS
T4634 EXECUTIVE STAFFING SOLUTIONS 99,998.00 RECRUITMENT FEES HUMAN RESOURCES
4 of 11
KHS Finance Committee Meeting, April 9, 2021
130 / 144

Year to Date AP Vendor Report
Amounts over $10,000.00
Vendor
No.Vendor Name Year-to-Date Description Department
T1128 HALL LETTER SHOP, INC. 90,574.64 NEW MEMBER LETTER/ENVELOPES, MEMBER
HANDBOOKS, CLINICAL CARE MANUAL FOR HH, NEW
MEMBER PACKETS & POSTERS
VARIOUS
T2941 KERN PRINT SERVICES INC. 90,555.41 OTHER PRINTING COSTS, ENVELOPES, LETTERHEAD VARIOUS
T5121 TPx COMMUNICATIONS 86,435.26 LOCAL CALL SERVICES; LONG DISTANCE CALLS;
INTERNET SERVICES; 800 LINES
MIS INFRASTRUCTURE
T1022 UNUM LIFE INSURANCE CO. 81,151.11 EMPLOYEE PREMIUM PAYROLL DEDUCTION
T4781 EDRINGTON HEALTH CONSULTING, LLC 79,093.75 CONSULTING SERVICES ADMINISTRATION
T4265 SIERRA SCHOOL EQUIPMENT COMPANY 76,189.71 NEW FURNITURE & OFFICE CHAIRS FOR EMPLOYEES CORPORATE SERVICES
T5015 SENTINEL ENGINEERING 74,963.34 JUNIPER NETWORKS - FIBER OPTICS MIS INFRASTRUCTURE
T4813 ADVENTIST HEALTH TEHACHAPI VALLEY 74,074.18 PROVIDER QUALITY CARE GRANT COMMUNITY GRANTS
T2955 DELTA ELECTRIC INC. 69,079.00 BUILDING MAINTENANCE CORPORATE SERVICES
T4963 LINKEDIN CORPORATION**** 68,775.00 ONLINE JOB POSTINGS/RECRUITMENT HUMAN RESOURCES
T2562 CACTUS SOFTWARE LLC 64,669.18 SOFTWARE LICENSE MIS INFRASTRUCTURE
T4503 VISION SERVICE PLAN 64,618.05 EMPLOYEE HEALTH BENEFITS VARIOUS
T2969 AMERICAN BUSINESS MACHINES INC 63,329.22 HARDWARE AND MAINTENANCE CORPORATE SERVICES
T2446 AT&T MOBILITY 61,217.17 CELLULAR PHONE / INTERNET USAGE MIS INFRASTRUCTURE
T4563 SPH ANALYTICS 60,176.80 PROVIDER AND MEMBER SATISFACTION SURVEYS VARIOUS
T4652 BAKERSFIELD SYMPHONY ORCHESTRA 58,399.99 COMMUNITY SPONSORSHIP ADMINISTRATION
T4052 RAHUL SHARMA 58,120.00 PROVIDER QUALITY CARE GRANT COMMUNITY GRANTS
T4415 DANIELLS PHILLIPS VAUGHAN AND BOCK 55,135.00 2019 AUDIT FEES ADMINISTRATION
5 of 11
KHS Finance Committee Meeting, April 9, 2021
131 / 144

Year to Date AP Vendor Report
Amounts over $10,000.00
Vendor
No.Vendor Name Year-to-Date Description Department
T3986 JACQUELYN S. JANS 54,975.00 CONSULTING FOR KHS PUBLIC IMAGE CAMPAIGN ADMINISTRATION/ MARKETING
T4607 AGILITY RECOVERY SOLUTIONS INC. 54,598.00 HARDWARE RENTAL- LAPTOP & MONITOR'S RENTAL FOR
EMPLOYEES WORKING FROM HOME
MIS INFRASTRUCTURE
T1180 LANGUAGE LINE SERVICES INC. 50,016.95 INTERPRETATION SERVICES MEMBER SERVICES
T5226 SAN MICHAEL PEDIATRICS INC. 50,000.00 PROVIDER QUALITY CARE GRANT COMMUNITY GRANTS
T5022 SVAM INTERNATIONAL INC 49,848.00 2020 PROFESSIONAL SERVICES / CONSULTING SERVICES BUSINESS INTELLIGENCE
T3448 SYNERGY HEALTHCARE, INC. 49,600.00 ASTHMA PROGRAM GRANT COMMUNITY GRANTS
T2933 SIERRA PRINTERS, INC. 49,365.61 PRINTING OF MEMBER EDUCATION MATERIAL/PROVIDER
DIRECTORY/BUSINESS CARDS
VARIOUS
T3001 MERCER 47,500.00 CONSULTING SERVICES HUMAN RESOURCES
T2961 SOLUTION BENCH, LLC 46,414.59 M-FILES & SCANFINITY LICENSES SUPPORT MIS INFRASTRUCTURE
T4731 LOGMEIN USA, INC. 46,134.00 INTERNET SERVICES MIS INFRASTRUCTURE
T1326 WALKER-LEWIS RENTS 45,711.96 COVID-19 TESTING SITE EQUIPMENT MARKETING
T4389 EXACT STAFF, INC. 45,048.17 TEMPORARY HELP VARIOUS
T4353 TWE SOLUTIONS, INC.**** 44,576.52 ANNUAL TECHNICAL SUPPORT AND MAINTENANCE FOR
NIMBLE STORAGE SOLUTIONS
MIS INFRASTRUCTURE
T4960 ZELIS CLAIMS INTEGRITY, LLC 42,988.84 POST EDITING SYSTEMS FOR CLAIMS PROCESSING CLAIMS
T4609 GREGORY D. BYNUM AND ASSOCIATES, INC. 42,500.00 CONSTRUCTION CLOSE OUT (SERVICES COMPLETED
DURING 2019) AND DEV LEED MANAGEMENT & POST
CONSTRUCTION
CAPITAL PROJECT/ NEW BUILDING
T2441 LAURA J. BREZINSKI 41,225.00 MARKETING MATERIALS MARKETING
6 of 11
KHS Finance Committee Meeting, April 9, 2021
132 / 144

Year to Date AP Vendor Report
Amounts over $10,000.00
Vendor
No.Vendor Name Year-to-Date Description Department
T2413 TREK IMAGING INC 40,686.24 COMMUNITY AND MARKETING EVENTS, MEMBER &
HEALTH ED INCENTIVES, EMPLOYEE EVENTS, NEW HIRE
SHIRTS
VARIOUS
T5260 HD DYNAMICS 36,995.00 2020 SYSTEM CONFIGURATION, CUSTOMIZATION, &
PROJECT MANAGEMENT
PROVIDER RELATIONS
T3084 KERN COUNTY-COUNTY COUNSEL 36,844.31 LEGAL FEES ADMINISTRATION
T4182 THE LAMAR COMPANIES 35,980.00 OUTDOOR ADVERTISEMENT-BILLBOARDS ADVERTISING
T4466 SMOOTH MOVE USA 35,432.42 MOVING SERVICES CORPORATE SERVICES
T5279 GOOD SAMARITAN HEALTH FOUNDATION 35,000.00 COVID-19 TESTING SITE SUPPORT-SPONSORSHIP COMMUNITY ACTIVITIES
T4792 KP LLC 33,749.67 PROVIDER DIRECTORIES & FORMULARY
(SUPPORT/MAINT.)
PROVIDER RELATIONS/PHARMACY
T4496 VOX NETWORK SOLUTIONS 33,262.60 WORKFORCE MANAGEMENT ADVANCED LICENSE
ANNUAL REVIEW
MIS INFRASTRUCTURE
T1404 CALIFORNIA ASSOCIATION OF HEALTH
PLANS
32,512.00 2020 ANNUAL DUES & CONFERENCE REGISTRATION VARIOUS
T4521 PAYSCALE, INC. 32,000.00 COMPENSATION STUDY AND SALARY ANALYTICS HUMAN RESOURCES
T4663 DEVELOPMENT DIMENSIONS
INTERNATIONAL, INC.
31,625.00 2020-2021 DEVELOPMENT DIMENSIONS INTERNATIONAL
MASTER LICENSE FEE
HUMAN RESOURCES
T4228 THE SSI GROUP, LLC. 31,362.80 EDI CLAIM PROCESSING CLAIMS / MIS
T5321 TYK TECHNOLOGIES LTD 30,000.00 API MANAGER - SELF MANAGED PACKAGE SUBSCRIPTION
& SUPPORT
CAPITAL PROJECTS IN PROCESS
T4873 L5 HEALTHCARE SOLUTIONS, INC. 29,374.47 LICENSE AND SUPPORT FEES - CLAIMS AUDIT TOOL MIS INFRASTRUCTURE
T4216 NEXSTAR BROADCASTING INC 26,766.50 ADVERTISEMENT - MEDIA MARKETING
T2232 DLT SOLUTIONS, LLC 25,733.63 SQL LICENSES MIS INFRASTRUCTURE
7 of 11
KHS Finance Committee Meeting, April 9, 2021
133 / 144

Year to Date AP Vendor Report
Amounts over $10,000.00
Vendor
No.Vendor Name Year-to-Date Description Department
T3454 DEPARTMENT OF MANAGED HEALTH CARE 25,000.00 ENFORCEMENT MATTERS ADMINISTRATION
T1152 MICHAEL K. BROWN LANDSCAPE &
MAINTENANCE CO., INC.
24,842.75 2020 BUILDING MAINTENANCE CORPORATE SERVICE
T2407 KAISER FOUNDATION HEALTH -COBRA 24,504.97 COBRA EMPLOYEE HEALTH BENEFITS VARIOUS
T4544 BARNES WEALTH MANAGEMENT GROUP 24,500.00 RETIREMENT PLAN CONSULTANTS ADMINISTRATION
T4060 HODEL'S DEVELOPMENT CORPORATION 23,975.64 2020 EMPLOYEE AWARDS MARKETING
T4708 HEALTH MANAGEMENT ASSOCIATES, INC. 23,805.00 CONSULTING SERVICES ADMINISTRATION
T4654 DELAWIE 22,825.93 1ST QTR 2020 ARCHITECTURAL SERVICES CAPITAL PROJECT
T5268 TONY'S FIREHOUSE GRILL & PIZZA**** 22,791.26 2020 EMPLOYEE EVENTS MARKETING
T1183 MILLIMAN USA 22,205.00 CY2018/2019 RDT & IBNP CONSULTING - ACTUARIAL ADMINISTRATION
T5161 INTEGRATED HEALTHCARE ASSOCIATION 21,805.00 ADVERTISEMENT - FILMING SERVICES MARKETING
T4523 BERKSHIRE LIFE INSURANCE COMPANY OF
AMERICA
21,548.75 EMPLOYEE PREMIUM ADMINISTRATION
T4546 LEVEL 3 COMMUNICATIONS, LLC 21,169.97 DISASTER RECOVERY, INTERNET, LONG DISTANCE
CALLS
MIS INFRASTRUCTURE
T5277 SUNBELT RENTALS, INC. 20,942.29 COVID-19 TESTING SITE SUPPORT-SPONSORSHIP COMMUNITY ACTIVITIES
T4239 COAST TO COAST COMPUTER PRODUCTS 20,794.77 COMPUTER PRODUCTS & SUPPLIES CORPORATE SERVICES
T5240 ACE EYECARE INC 20,000.00 PROVIDER QUALITY CARE GRANT COMMUNITY GRANTS
T5159 AT&T CORP 19,688.35 INTERNET SERVICES MIS INFRASTRUCTURE
8 of 11
KHS Finance Committee Meeting, April 9, 2021
134 / 144

Year to Date AP Vendor Report
Amounts over $10,000.00
Vendor
No.Vendor Name Year-to-Date Description Department
T5275 CREATIVE FINANCIAL STAFFING, LLC 19,000.00 RECRUITMENT FEES HUMAN RESOURCES
T4261 KAISER FOUNDATION HEALTH PLAN -TX PPO 18,858.88 TX-PPO EMPLOYEE HEALTH BENEFITS VARIOUS
T1097 NCQA 17,290.25 HEDIS, VOL 2 PLUS QUALITY COMPASS AND POPULATION
HEALTH PROGRAM ACCREDIATION
QUALITY IMPROVEMENT
T4962 LIBERTY DATA, INC. 17,100.00 2020 TAX NUMBER VALIDATION SERVICES MIS INFRASTRUCTURE
T5013 ELIZA CORPORATION 17,090.00 2020 DATA MANAGEMENT FEE CASE MANAGEMENT
T1650 UNIVISION TELEVISION GROUP 16,915.00 ADVERTISEMENT - TELEVISION MARKETING
T1347 ADVANCED DATA STORAGE 16,890.91 STORAGE AND SHREDDING SERVICES CORPORATE SERVICES
T4016 FIRST DATABANK, INC 16,060.00 2020-2021 NATIONAL CODE DATABASE WITH THE
GENERIC CODE NUMBER RENEWAL
MIS INFRASTRUCTURE
T4589 KERN VALLEY HOSPITAL FOUNDATION**** 15,880.00 COMMUNITY ACTIVITIES-SPONSORSHIP MARKETING
T3092 LINKS FOR LIFE 15,548.00 COMMUNITY ACTIVITIES-SPONSORSHIP MARKETING
T4993 LEGALSHIELD 15,423.75 EMPLOYEE PAID VOLUNTARY COVERAGE PAYROLL DEDUCTION
T5236 BEST BEST & KRIEGER LLP 15,389.24 LEGAL FEES ADMINISTRATION
T2578 AMERICAN HEART ASSOCIATION - KERN
COUNTY****
15,000.00 COMMUNITY SPONSORSHIP ADMINISTRATION
T5030 KHOA NGUYEN DBA KN CONSULTING LLC 15,000.00 LEGAL FEES ADMINISTRATION
T5313 HEALTH LITERACY INNOVATIONS, LLC 14,854.00 2019 TRUE UP MAINTENANCE, 2020 ESD ANNUAL
SUPPORT & ESD AZURE OVERAGE
MIS INFRASTRUCTURE
T5155 A-C ELECTRIC COMPANY 14,549.48 BUILDING MAINTENANCE CORPORATE SERVICES
9 of 11
KHS Finance Committee Meeting, April 9, 2021
135 / 144

Year to Date AP Vendor Report
Amounts over $10,000.00
Vendor
No.Vendor Name Year-to-Date Description Department
T5201 JAC SERVICES, INC. 14,535.00 SPRING 2020 AC MAINTENANCE & SERVICE CORPORATE SERVICES
T2787 SAGE SOFTWARE, INC 14,381.75 2019-20 SAGE300 ERP SILVER BUSINESS ANNUAL
LICENSE
FINANCE
T2300 AT&T LONG DISTANCE 14,323.81 LONG DISTANCE CALLS MIS INFRASTRUCTURE
T4934 APPLE INC. 14,283.66 HARDWARE, COMPUTER SUPPLIES & 2020 SERVICE
AWARDS
VARIOUS
T4195 SCRIPPS MEDIA, INC. DBA KERO-TV 13,575.00 ADVERTISEMENT - TELEVISION MARKETING
T5156 LIGHTS CAMERA ACTION CINEMA 13,575.00 ADVERTISEMENT - FILMING SERVICES MARKETING
T4782 LEBEAU - THELEN. LLP 13,406.50 LEGAL FEES ADMINISTRATION
T4227 FREESTYLE EVENTS SERVICES INC 12,890.00 SERVICES 2020 EMPLOYEE REVOGNITION AWARDS MARKETING
T2938 SAP AMERICA, INC 12,308.32 SAP BUSINESS OBJECTS SOFTWARE ANNUAL
MAINTENANCE FEE
BUSINESS INTELLIGENCE
T5246 ACCELEBRATE, INC. 12,120.15 ASP.NET CORE 3 DEVELOPMENT TRAINING BUSINESS INTELLIGENCE
T4476 KERN PARTNERSHIP FOR CHILDREN AND
FAMILIES
12,000.00 COMMUNITY ACTIVITIES-SPONSORSHIP COMMUNITY ACTIVITIES
T5209 ADOBE, INC.**** 12,000.00 2 YR MAINTENANCE - ROBOHELP SERVER & TECHNICAL
COMMUNICATION SUITE
MIS INFRASTRUCTURE
T5292 ALL'S WELL HEALTH CARE SERVICES 11,735.80 TEMPORARY HELP VARIOUS
T4417 KAISER FOUNDATION HEALTH PLAN -OR 11,675.84 OR-PPO EMPLOYEE HEALTH BENEFITS VARIOUS
T2292 CITY OF BAKERSFIELD 11,550.94 UTILITES-GARBAGE/SEWER FEES CORPORATE SERVICES
T5251 PREVALENT, INC. 11,412.25 ANNUAL SAAS SUBSCRIPTION MIS INFRASTRUCTURE
10 of 11
KHS Finance Committee Meeting, April 9, 2021
136 / 144

Year to Date AP Vendor Report
Amounts over $10,000.00
Vendor
No.Vendor Name Year-to-Date Description Department
T4211 KERN COUNTY FAMILY MAGAZINE**** 11,399.00 ADVERTISEMENT - DIGITAL & PRINTED MARKETING
T4932 SPECTRUM REACH (MEDIA) 11,107.80 ADVERTISEMENT - TELEVISION MARKETING
T4683 CLAUDIA M. BACA PROJECT MANAGEMENT
CONSULTIN
11,000.00 PROJECT MANAGEMENT CONSULTING SERVICES PROJECT MANAGEMENT
T5300 CENTRAL VALLEY OCCUPATION MEDICAL
GROUP, INC.****
10,720.00 COVID-19 TESTING HUMAN RESOURCES
T2840 ATALASOFT, INC. 10,254.00 DOT IMAGING RENEWAL MIS INFRASTRUCTURE
T5228 CENTRAL SANITARY SUPPLY**** 10,244.99 SUPPLIES - MASKS, GLOVES CORPORATE SERVICES
T5012 KERN MEDICAL CENTER FOUNDATION**** 10,000.00 COMMUNITY SPONSORSHIP MARKETING
T5262 YOUTH CONNECTION, INC. 10,000.00 COMMUNITY SPONSORSHIP COMMUNITY ACTIVITIES
T5270 ENFORCE, LLC 10,000.00 DAYFORCE OPTIMIZATION & CONSULTING SERVICES HUMAN RESOURCES
34,205,816.05
TOTAL VENDORS OVER $10,000 34,205,816.05
TOTAL VENDORS UNDER $10,000 826,601.73
TOTAL VENDOR EXPENSES- December 35,032,417.78$
Note:
****New vendors over $10,000 for the month of December
11 of 11
KHS Finance Committee Meeting, April 9, 2021
137 / 144

January AP Vendor Report
Amounts over $10,000.00
Vendor
No. Vendor Name
Current
Month Description Department
T3130 OPTUMINSIGHT, INC. 630,066.00 2020/2021 ANNUAL LICENSED SOFTWARE
EASYGROUP & INCREMENTAL LICENSE
MIS INFRASTRUCTURE
T1045 KAISER FOUNDATION HEALTH - HMO 432,010.92 JAN. 2021 EMPLOYEE HMO HEALTH BENEFITS
PREMIUM
VARIOUS
T5005 CRAYON SOFTWARE EXPERTS LLC 315,410.49 2021 ANNUAL SOFTWARE LICENSE AND NOV. ESD
AZURE OVERAGE
MIS INFRASTRUCTURE
T4350 COMPUTER ENTERPRISE INC. 225,914.60 NOV. & DEC. 2020 PROFESSIONAL SERVICES /
CONSULTING SERVICES
CAPITAL PROJECT
T5229 DIGNITY HEALTH MEDICAL GROUP -
BAKERSFIELD
217,442.81 SEPT. & OCT. 2020 HEALTH HOME GRANT COMMUNITY GRANTS
T2584 UNITED STATES POSTAL SVC.-HASLER 150,000.00 POSTAGE (METER) FUND CORPORATE SERVICES
T2488 THE LINCOLN NATIONAL LIFE INSURANCE 68,879.40 JAN. 2021 VOLUNTARY LIFE, AD&D, DENTAL
INSURANCE PREMIUM
VARIOUS
T4054 ASSOCIATION FOR COMMUNITY AFFILIATED
PLANS
65,000.00 2021 ANNUAL DUES ASSESSMENT ADMINISTRATION
T4237 FLUIDEDGE CONSULTING, INC. 56,030.00 DEC. 2020 CONSULTING SERVICES/UPDATE TO
STANDARD BUSINESS REPORTING
VARIOUS
T4963 LINKEDIN CORPORATION 52,000.00 ANNUAL ONLINE TRAINING FOR ALL EMPLOYEES HUMAN RESOURCES
T5022 SVAM INTERNATIONAL INC 44,640.00 SEPT., NOV., & DEC., 2020 PROFESSIONAL
SERVICES/UPDATE TO STANDARD BUSINESS
REPORTING
IT BUSINESS INTELLIGENCE
T4582 HEALTHX, INC. 41,576.00 JAN. 2021 MAINTENANCE AND SUPPORT FEES -
PROVIDER AND MEMBER PORTAL
MIS INFRASTRUCTURE
1 of 3
KHS Finance Committee Meeting, April 9, 2021
138 / 144

January AP Vendor Report
Amounts over $10,000.00
Vendor
No. Vendor Name
Current
Month Description Department
T4722 COGNIZANT TRIZETTO SOFTWARE GROUP, INC. 41,285.55 DEC. 2020 PROFESSIONAL SERVICES VARIOUS
T4391 OMNI FAMILY HEALTH 40,109.20 OCT. 2020 SHAFTER HEALTH HOME GRANT COMMUNITY GRANTS
T4193 STRIA LLC 34,184.42 DEC. 2020 OCR SERVICES AND PROFESSIONAL
SERVICES
CLAIMS
T5325 WADE A MCNAIR 32,995.00 LEADABILITY PROGRAM FACILITATION-
CONSULTING SERVICES/ONSITE TRAINING
HUMAN RESOURCES
T2458 HEALTHCARE FINANCIAL, INC. 32,500.00 NOV. 2020 PROFESSIONAL SERVICES ADMINISTRATION
T5109 RAND EMPLOYMENT SOLUTIONS 32,077.49 DEC. 2020 & JAN. 2021 TEMPORARY HELP & ACA
INSURANCE - (7) MIS; (1) UM; (1) CM; (1) HHP; (1) HE
VARIOUS
T4967 ADMINISTRATIVE SOLUTIONS, INC. 28,416.89 FSA EMPLOYEE PREMIUM & SECTION 125
ADMINISTRATION
VARIOUS
T4781 EDRINGTON HEALTH CONSULTING, LLC 25,793.75 DEC. 2020 CONSULTING SERVICES ADMINISTRATION
T5298 TOTALMED, INC. 25,591.00 DIRECT PLACEMENT FEES-QI NURSE MANAGER RN HUMAN RESOURCES
T4792 KP LLC 25,491.91 PROVIDER DIRECTORIES & NOV. & DEC. 2020
FORMULARY (SUPPORT/MAINT.)
PROVIDER RELATIONS/PHARMACY
T4538 CHANGE HEALTHCARE SOLUTIONS, LLC 22,523.45 DEC. 2020 EDI CLAIM PROCESSING (EMDEON) CLAIMS
T4501 ALLIED UNIVERSAL SECURITY SERVICES 20,452.44 DEC. 2020, & JAN. 2021 ONSITE SECURITY CORPORATE SERVICES
T3011 OFFICE ALLY, INC. 18,551.50 DEC. 2020 EDI CLAIM PROCESSING CLAIMS
2 of 3
KHS Finance Committee Meeting, April 9, 2021
139 / 144

January AP Vendor Report
Amounts over $10,000.00
Vendor
No. Vendor Name
Current
Month Description Department
T4460 PAYSPAN, INC 17,984.49 DEC. 2020 ELECTRONIC CLAIMS/PAYMENTS FINANCE
T4733 UNITED STAFFING ASSOCIATES 17,515.63 DEC. 2020 TEMPORARY HELP & ACA INSURANCE -
(1) BI; (1) HH; (1) HR; (1) HE
VARIOUS
T2167 PG&E 16,165.01 NOV./DEC 2020 - USAGE/UTILITIES CORPORATE SERVICES
T4353 TWE SOLUTIONS, INC. 13,803.42 ANNUAL TECHNICAL SUPPORT AND MAINTENANCE
FOR NIMBLE STORAGE SOLUTIONS
MIS INFRASTRUCTURE
T5201 JAC SERVICES, INC. 13,732.00 2021 AC MAINTENANCE & SERVICE CORPORATE SERVICES
T2790 KERN COUNTY DEPT OF PUBLIC HEALTH 12,915.00 INFLUENZA VACCINATION SPONSORSHIP MARKETING
T1005 COLONIAL LIFE & ACCIDENT ATTN PREMIUM
PROCESSING
12,102.53 EMPLOYEE PREMIUM - ACCIDENT & CRITICAL
ILLNESS
VARIOUS
T1861 CERIDIAN HCM, INC. 11,850.00 JAN. 2021 MONTHLY SUBSCRIPTION FEES/
PROFESSIONAL SERVICES/ DAYFORCE HUMAN
CAPITAL MANAGEMENT
HUMAN RESOURCES
T4657 DAPONDE SIMPSON ROWE PC 11,120.50 OCT. & NOV. 2020 LEGAL FEES PROVIDER RELATIONS
T4982 NGC US, LLC 11,000.00 PREFUND HEALTH EDUCATION MEMBER
INCENTIVES
HEALTH EDUCATION
T4396 KAISER FOUNDATION HEALTH-DHMO 10,699.21 JAN. 2020 EMPLOYEE HEALTH BENEFITS VARIOUS
T2840 ATALASOFT, INC. 10,254.00 ANNUAL DOTIMAGE DOCUMENT IMAGING
MAINTENANCE
MIS INFRASTRUCTURE
2,838,084.61
TOTAL VENDORS OVER $10,000 2,838,084.61
TOTAL VENDORS UNDER $10,000 202,582.60
TOTAL VENDOR EXPENSES- JANUARY 3,040,667.21$
3 of 3
KHS Finance Committee Meeting, April 9, 2021
140 / 144

Vendor Name
Contract
Amount Budgeted Department Department Head Services that this vendor will provide to KHS
Effective
Date
Termination
Date
January
Poppyrock Designs $46,200.00 Yes MRK Louie Itturriria Graphic design of KHS-KFHC member & provider MKT materials 1/1/2021 12/31/2021
Symplr/Cactus $35,700.00 Yes IT Richard Pruitt Annual SaaS Application manager & the DEA State license monitor 1/6/2021 1/5/2022
HD Dynamics $50,000.00 Yes PR Emily Duran Consulting Services 1/1/2021 12/31/2021
LinkedIn $52,000.00 Yes HR Anita Martin Online training for managed learners 1/1/2021 12/31/2021
Jacquelyn Jans $60,000.00 Yes MRK Louie Itturriria Marketing and Corporate Image Consulting 1/1/2021 12/31/2021
KHS Finance Committee Meeting, April 9, 2021
141 / 144

KHS Finance Committee Meeting, April 9, 2021
142 / 144

ITEM PROJECT CAP/EXP BUDGET JAN FEB MAR APR MAY JUN JUL AUG SEPT OCT NOV DEC YTD TOTAL
REMAINING
BALANCE
# Project Name
1 Enterprise Logging EXP $18,480 $0 $550 $0 $0 $0 $0 $8,690 $9,207 $0 $18,447 $332 BizTalk Upgrade EXP $14,705 $5,100 $4,590 $4,845 $14,535 $1703 2D - Clinical Engagement CAP $12,500 $0 $4,118 $5,400 $2,633 $12,150 $3504 QNXT Upgrade with NetworX and CES KB Update EXP $500 $0 $0 $468 $0 $468 $325 Hospital Directed Payments (HDP)/Encounters EXP $21,705 $0 $0 $0 $0 $0 $0 $206 $1,687 $6,035 $7,225 $4,250 $2,125 $21,528 $1776 HHP 2020 - CSV Health Homes CAP $166,090 $28,448 $29,143 $12,273 $6,695 $2,833 $15,680 $12,530 $3,554 $773 $14,816 $20,520 $15,120 $162,384 $3,7067 HHP - Member Engagement CAP $18,000 $0 $1,442 $7,501 $824 $4,928 $2,700 $17,395 $6068 Enterprise Data Warehouse CAP $974,490 $58,640 $54,275 $71,995 $73,410 $66,040 $70,090 $72,128 $81,420 $82,320 $77,600 $69,931 $72,760 $850,609 $123,8819 HHP 2020 - Distributive Model CAP $173,810 $0 $412 $6,956 $14,983 $15,726 $15,371 $23,894 $45,612 $30,529 $12,498 $824 $6,480 $173,284 $526
10 Disaster Recovery and Business Continuity Test CAP $446,200 $56,200 $51,475 $54,950 $50,960 $31,920 $46,900 $26,880 $25,200 $23,240 $24,640 $14,560 $18,620 $425,545 $20,65511 Rx PBM Transition EXP $70,860 $0 $0 $0 $6,417 $15,624 $16,368 $14,136 $14,880 $67,425 $3,43512 Auto Adjudication Enhancements CAP $688,240 $40,480 $19,440 $21,120 $35,110 $59,532 $61,379 $51,196 $54,030 $58,359 $57,235 $50,281 $46,574 $554,736 $133,50413 MCAS Member Engagement CAP $200,000 $5,880 $18,970 $2,520 $30,983 $30,890 $25,860 $26,430 $21,630 $36,645 $199,808 $19214 Specialty Med Mgnt. CAP $10,395 $945 $9,450 $0 $10,395 $015 Interoperability CAP $244,660 $0 $2,781 $4,120 $28,068 $52,541 $41,799 $26,853 $43,723 $199,885 $44,77617 Staff Augmentation EXP $1,175,965 $97,401 $87,696 $102,619 $101,804 $104,894 $99,569 $93,860 $65,486 $68,828 $77,389 $71,045 $49,242 $1,019,832 $156,133
Totals: Totals $4,236,600 $286,269 $253,141 $289,072 $301,748 $304,841 $316,990 $324,487 $351,571 $364,108 $355,999 $294,031 $306,168 $3,748,424 $488,176
*Note: State's projects being re-organized due to
mid-year changes.
Updated 1/22/21
2020 TECHNOLOGY CONSULTING RESOURCES
KHS Finance Committee Meeting, April 9, 2021
143 / 144
