finance and facilities committee memorandum and agenda
TRANSCRIPT

CASTLETON UNIVERSITY OFFICE OF THE CHANCELLOR COMMUNITY COLLEGE OF VERMONT PO BOX 7 JOHNSON STATE COLLEGE MONTPELIER, VT 05601 LYNDON STATE COLLEGE P (802) 224-3000 VERMONT TECHNICAL COLLEGE F (802) 224-3035
WWW.VSC.EDU [email protected]
MEMORANDUM TO: VSC Finance & Facilities Committee
M. Jerome Diamond J. Churchill Hindes, Chair
Tim Jerman Bill Lippert
Christopher Macfarlane, Vice Chair Linda Milne Michael Pieciak FROM: Steve Wisloski DATE: February 7, 2018 SUBJ: Finance & Facilities Committee Meeting on February 12, 2018
The Finance and Facilities Committee of the Board of Trustees is scheduled to meet from 2:00 p.m. to 5:00 p.m. in Conference Room 101 at the Chancellor’s Office in Montpelier. The primary goal of this meeting is to establish the framework for FY2019 budget development. Similar to the processes followed for FY2018 and FY2017, the framework anticipates developing budgets over the next three Committee meetings on April 2, April 30 and May 30. The meeting will begin with the Chancellor’s recommendation regarding an amendment to Policy 301 to create a “Welcome Home” initiative to provide in-State tuition to graduates of Vermont high schools returning from out of state. This will be followed by a brief review 2nd quarter FY2018 financials and projected year-end results, which in turn are the starting point of FY2019 budget development. We will then discuss the most important component of budget development – enrollment projections – in terms of the demographic outlook for Vermont and the Northeast region; current class sizes, composition, retention rates; and finally the early outlook for Fall 2018 admissions. This year’s budget process also will continue to develop a framework for multi-year budgeting. As discussed at the December 1 meeting, initially we propose a three-year horizon, including FY2019, FY2020 and FY2021, to better-understand the intermediate-term effects if key budgetary components – tuition and fees, enrollment, State appropriation, room and board,
1

salaries and health insurance – continue on current trends. This budget review will be at the Institution level, “top down” and rolled forward from 2nd quarter year-end projections. These projections necessarily will be approximate and conservative. At the April 2 meeting, each of the Institutions and the Chancellor’s Office will present preliminary budgets developed “bottom up” using actual expectations for major budget categories. These necessarily will still be built from 2nd quarter projections and mid-March admissions and enrollment estimates, and, given the early stage in the process will still tend toward a “worst likely” outcome. The revised budgets presented at the April 30 meeting will be developed to a higher level of detail, including estimated actual staffing, a more fully developed outlook for admissions and enrollments, relative clarity with respect to State appropriations, and a solid estimate of health insurance costs. These should also gravitate toward a central tendency between “worst likely” and “best likely” outcomes for FY2019. The final budgets will be presented on May 30 for the Committee’s approval, and will incorporate refinements to enrollment projections based upon latest-available admissions; anticipated staffing; health insurance experience; and final State funding, as the legislative session almost certainly will have adjourned. These budgets will reflect the Institutions’ and Chancellor’s Office’s best available information as to expected performance during FY2019. The meeting will conclude with a presentation from Trillium Asset Management on behalf of Fossil Free VSC; an endowment review from Morgan Stanley and a presentation of their fossil fuel screening capabilities; proposed updates to the System’s investment policy; and a recommendation from the Chancellor and CFO with respect to FFVSC’s divestment request. Should you have any questions regarding the upcoming meeting or any other matter, or any requested additions to the agenda, please contact me at [email protected] or (802) 224-3022. Thank you. Attachments:
1. Agenda 2. Meeting Materials
cc: VSC Board of Trustees, Council of Presidents and Business Affairs Council
Lisa Cline, President, VSC Faculty Federation David Beatty, Vermont Department of Finance & Management The Honorable Douglas Hoffer, Vermont State Auditor
2

Vermont State Colleges Board of Trustees Finance and Facilities Committee Meeting
February 12, 2018
AGENDA
1. Call to order
2. Consent agenda and approvals: a. Minutes of December 1, 2017 meeting b. The Sugarman of Vermont, Inc., Scholarship Endowment (Johnson State) c. New VSC Policy 434, Merchant Credit Card Policy
3. Review and approval of amendment to VSC Policy 301 (Welcome Home)
4. Review and discussion of 2nd FY2018 financial reports
5. Review and discussion of admissions summary from February 1
6. Discussion of preliminary FY2019-2021 budget projections
7. Discussion and recommendation regarding Fossil Free VSC request
a. Presentation from Trillium Asset Management, LLC b. Presentation from Morgan Stanley c. Proposed changes to Investment Policy Statement d. Discussion and next steps
8. Other business
9. Public comment
10. Adjourn
MEETING MATERIALS
1. Consent agenda 2. Amended Policy 301, Determination of In-State Residency for Tuition Purposes 3. 2nd quarter 2018 financial reports 4. Admissions summary from February 1 5. Historical enrollment and demographic data 6. Preliminary FY2019-21 budget projections [provided at meeting] 7. Memo from Fossil Free VSC 8. Presentation from Morgan Stanley 9. Memo from CFO and revised proposed Investment Policy Statement (IPS) 10. FY2018 Finance & Facilities Committee meetings schedule
3

Item 1: Consent Agenda Items
4
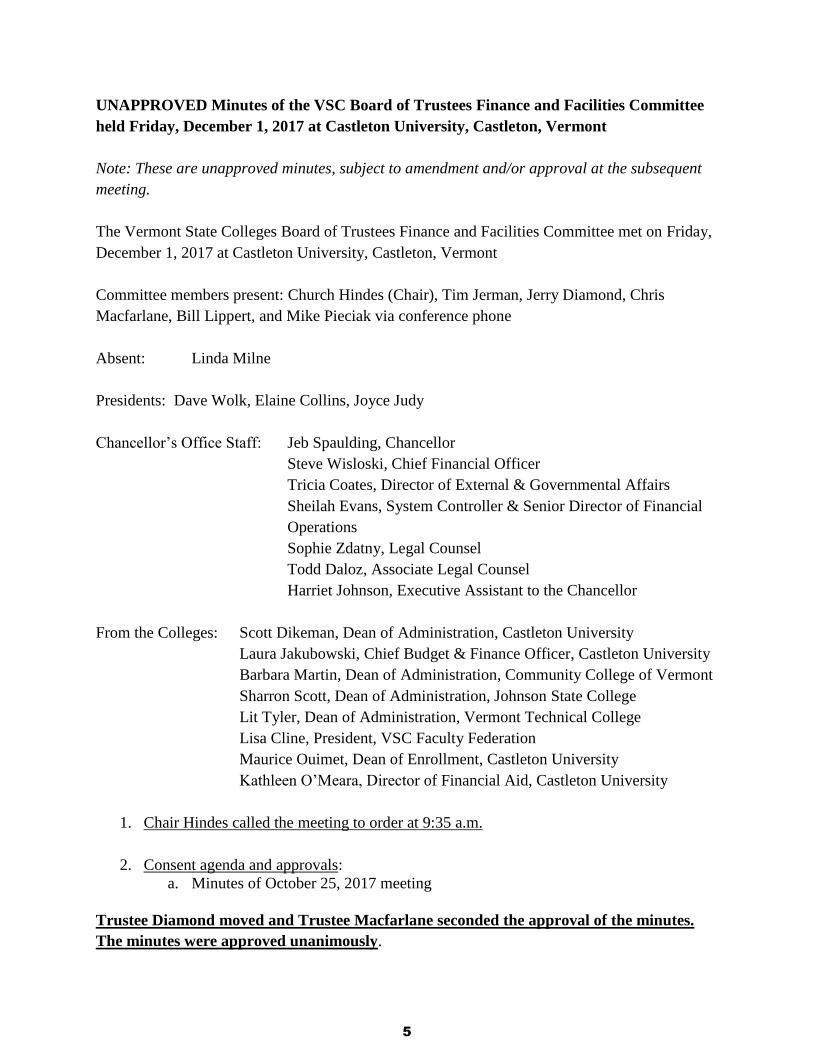
UNAPPROVED Minutes of the VSC Board of Trustees Finance and Facilities Committee
held Friday, December 1, 2017 at Castleton University, Castleton, Vermont
Note: These are unapproved minutes, subject to amendment and/or approval at the subsequent
meeting.
The Vermont State Colleges Board of Trustees Finance and Facilities Committee met on Friday,
December 1, 2017 at Castleton University, Castleton, Vermont
Committee members present: Church Hindes (Chair), Tim Jerman, Jerry Diamond, Chris
Macfarlane, Bill Lippert, and Mike Pieciak via conference phone
Absent: Linda Milne
Presidents: Dave Wolk, Elaine Collins, Joyce Judy
Chancellor’s Office Staff: Jeb Spaulding, Chancellor
Steve Wisloski, Chief Financial Officer
Tricia Coates, Director of External & Governmental Affairs
Sheilah Evans, System Controller & Senior Director of Financial
Operations
Sophie Zdatny, Legal Counsel
Todd Daloz, Associate Legal Counsel
Harriet Johnson, Executive Assistant to the Chancellor
From the Colleges: Scott Dikeman, Dean of Administration, Castleton University
Laura Jakubowski, Chief Budget & Finance Officer, Castleton University
Barbara Martin, Dean of Administration, Community College of Vermont
Sharron Scott, Dean of Administration, Johnson State College
Lit Tyler, Dean of Administration, Vermont Technical College
Lisa Cline, President, VSC Faculty Federation
Maurice Ouimet, Dean of Enrollment, Castleton University
Kathleen O’Meara, Director of Financial Aid, Castleton University
1. Chair Hindes called the meeting to order at 9:35 a.m.
2. Consent agenda and approvals:
a. Minutes of October 25, 2017 meeting
Trustee Diamond moved and Trustee Macfarlane seconded the approval of the minutes.
The minutes were approved unanimously.
5

3. CCV and VTC FY2017 carryover, and Castleton Stafford Fund reallocation requests
Chief Financial Officer Steve Wisloski led a discussion regarding the carryover for Community
College of Vermont, and Vermont Technical College, along with Castleton University’s
reallocation of the Stafford fund.
Trustee Jerman made a motion to recommend approval by the Board of Trustees of the
fiscal year 2017 carryover requests from the Community College of Vermont in the amount
of $28,000, and from Vermont Technical College in the amount of $1,220,446, and also of
Castleton University’s Stafford Fund Reallocation proposal in the amount of $1,410,000 in
each case as described in the meeting material, seconded by Trustee Diamond. The motion
was approved unanimously.
4. FY2018 Budget Adjustment, FY2019 State Appropriations and Capital requests
CFO Wisloski provided an overview of the state appropriation and capital requests. The board
discussed the various scenarios and adjustments made by the Vermont State Colleges System for
continued state support and to continue to move toward a balanced budget.
Trustee Jerman made a motion to recommend approval by the Board of Trustees of the
System’s State appropriation requests as described in the meeting material as follows:
First, a $1,000,000 increase to the System’s base appropriation in the fiscal year 2018
Budget Adjustment Act;
Second, increases of $1,000,000 to the System’s base appropriation to the extent not
approved in the budget adjustment request, plus a cost of living increase to the System’s
fiscal year 2018 appropriation, plus $350,000 of one-time funds for Northern Vermont
University in the fiscal year 2019 Appropriations Bill; and
Third, $2,000,000 for System construction, renovation and major maintenance in the fiscal
year 2019 Capital Bill Adjustment, seconded by Trustee Diamond. The motion was
approved unanimously.
5. Discuss proposed amendment to VSC Policy 301, Determination of In-State Residency
for Tuition
Chancellor Spaulding provided an overview of the proposed policy amendment and
explained the changes. The current policy requires a non-Vermonter to be domiciled in
the state for a year before they qualify for residency tuition. In general, the proposal
would allow a student who is a resident of Vermont and graduates from a Vermont High
School to be eligible for in-state tuition, if the student is domiciled in Vermont at the time
of enrollment. Assistant General Counsel Todd Daloz reported on what the new
language attempts to do, and reported on his conversations with VSAC. Chief Financial
6

Officer Wisloski provided a financial analysis of this proposal and discussed various
scenarios.
The committee agreed to discuss the proposed policy change as part of the Finance &
Facilities Committee Report at the December 1, 2017 Board of Trustees meeting, and to
gather additional comments for the March Board of Trustees meeting.
6. Discuss and approve new VSC Policy 504, Campus Safety Policy
Chair Hindes provided an overview of Policy 504, which ensures that college buildings, grounds,
facilities, and equipment are safe for students, employees, and visitors.
Trustee Diamond made a motion to recommend approval by the Board of Trustees of
Vermont State Colleges System Policy 504, Campus Safety Policy, as provided in the
meeting material, seconded by Trustee Macfarlane. The motion was approved
unanimously.
7. Discussion of FY2019-2021 enrollment and three-year budget projections
CIO Wisloski led a discussion and presented a power point on enrollment and a three-year
budget development process.
8. Cash, investments and endowment update
Wisloski provided a brief update on the cash and investment report.
9. Update regarding Fossil Free VSC requests
Chair Hindes welcomed faculty and students who came to engage in conversation regarding
fossil free requests at Vermont State Colleges. At the May 2017 Finance and Facilities
committee meeting, Fossil Free VSC presented the Chancellor and the Board of Trustees with a
petition “calling upon the Vermont State Colleges System to take concrete steps to align its
banking/investing with environmental and racial justice,” and requested several specific actions
related to the System’s finances. Chief Financial Officer Steve Wisloski presented an
informative memo that addressed some of these requests.
Professor Brendan Lalor of Castleton University, along with VSC students, faculty and adjunct
faculty, addressed the committee and discussed their concerns and noteworthy developments.
After discussion, the committee agreed it would explore the issues of divestment and
reinvestment as a priority, and suggested arranging a presentation with Morgan Stanley and
Trillium.
10. Other business
There was no other business.
7

11. Public comment
There were no public comments.
12. Adjourn
Trustee Jerman moved to adjourn the meeting at 12:10 p.m.
8
9

10
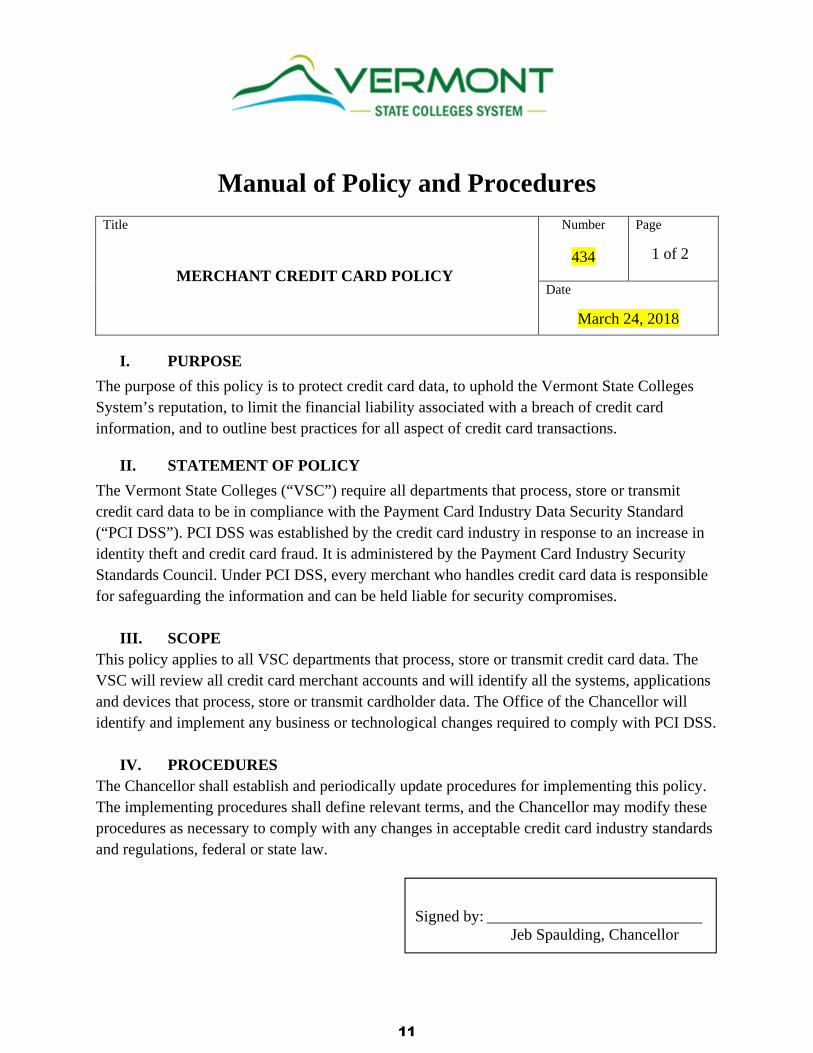
Manual of Policy and Procedures
Title
MERCHANT CREDIT CARD POLICY
Number
434
Page
1 of 2
Date
March 24, 2018
I. PURPOSE
The purpose of this policy is to protect credit card data, to uphold the Vermont State Colleges System’s reputation, to limit the financial liability associated with a breach of credit card information, and to outline best practices for all aspect of credit card transactions.
II. STATEMENT OF POLICY
The Vermont State Colleges (“VSC”) require all departments that process, store or transmit credit card data to be in compliance with the Payment Card Industry Data Security Standard (“PCI DSS”). PCI DSS was established by the credit card industry in response to an increase in identity theft and credit card fraud. It is administered by the Payment Card Industry Security Standards Council. Under PCI DSS, every merchant who handles credit card data is responsible for safeguarding the information and can be held liable for security compromises.
III. SCOPE This policy applies to all VSC departments that process, store or transmit credit card data. The VSC will review all credit card merchant accounts and will identify all the systems, applications and devices that process, store or transmit cardholder data. The Office of the Chancellor will identify and implement any business or technological changes required to comply with PCI DSS.
IV. PROCEDURES The Chancellor shall establish and periodically update procedures for implementing this policy. The implementing procedures shall define relevant terms, and the Chancellor may modify these procedures as necessary to comply with any changes in acceptable credit card industry standards and regulations, federal or state law.
Signed by: ___________________________
Jeb Spaulding, Chancellor
11
Item 2: Amended Policy 301, Determination of In-State Residency for Tuition Purposes
12
Manual of Policy and Procedures
Title
POLICY ON DETERMINATION OF IN-STATE
RESIDENCY FOR TUITION PURPOSES
Number
301
Page
1 of 3 Date
March 25, 2017
PURPOSE
The Vermont State Colleges charges different tuition rates to in- and out-of-state students.
Therefore, criteria and procedures to determine in-state residency for tuition purposes are
required.
STATEMENT OF POLICY
The following requirements must be met by a student prior to being granted resident status for
the purpose of tuition and other VSC charges:
1) The student shall be domiciled in Vermont, said domicile having been continuous for one
year immediately prior to the date of enrollment. Domicile shall mean a person’s true,
fixed and permanent home, to which he/she intends to return when absent. Domicile shall
not be dependent upon a person’s marital status. Although domicile may have been
established, a student is presumed to be an out-of-state resident for tuition purposes if he
or she moved to Vermont or continues residence in Vermont for the purpose of attending
a Vermont institution of higher learning or qualifying for resident status for tuition
purposes. Such presumption is rebuttable.
2) The student must demonstrate such attachment to the community as would be typical of a
permanent resident of his/her age and education. The College’s chief admissions officer
shall consider in the determination of residency for tuition purposes, among other factors:
voter registration, property ownership, payment of income and property taxes,
automobile registration and driver’s license.
3) Receipt of significant financial support from the student’s family will create a rebuttable
presumption that the student’s residence is with his/her family. A student who has not
reached the age of eighteen shall be presumed to hold the residence of his or her parents
or legal guardian. The presumption shall be rebuttable.
4) A student who moves into Vermont within one year of enrollment shall be presumed to
have moved to Vermont for the purposes of attending a Vermont institution of higher
13

learning and qualifying for resident status for tuition purposes. This presumption shall be
rebuttable.
5) A student who is eligible for tuition purposes to enroll as a resident student in another
state shall not be enrolled as a "Vermont Resident." The inability to enroll as a resident
student in another state does not by itself establish residency in Vermont for tuition
purposes. Additionally, a domicile or residency classification assigned by a public or
private authority neither qualifies nor disqualifies a student for in-state residency status at
a member College. However, such classification may be taken into consideration by the
chief admissions officer.
6) Notwithstanding paragraphs 1-5, a student shall be considered a resident for in-state
tuition purposes at the start of the next semester or academic period where:
a. The student, in accordance with 16 V.S.A. § 2185, is a member of the
Armed Forces of the United States on active duty who is transferred to
Vermont for duty other than for the purpose of education; or
b. The student is eligible for in-state tuition and fees, as of July 1, 2017,1
because the student:
i. is a veteran who lives in Vermont (regardless of the student’s
formal state of residence) and enrolls in a member College within
three years of discharge from a period of active duty service of
ninety days or more;
ii. is anyone using a veteran’s transferred benefits, who lives in
Vermont (regardless of the student’s formal state of residence) and
enrolls in a member College within three years of the transferor
veteran’s discharge from a period of active duty service of ninety
days or more;
iii. is anyone using benefits under the Marine Gunnery Sergeant John
David Fry Scholarship, who lives in Vermont (regardless of the
student’s formal state of residence); or
iv. is anyone using a veteran’s transferred benefits, who lives in
Vermont (regardless of the student’s formal state of residence)
while the transferor is a member of the uniformed services serving
on active duty.
After the expiration of the three year period following discharge or
death, as described in 38 U.S.C. § 3679(c), a student who initially
qualifies under subsection (i) and (ii) will continue to be eligible for
in-state tuition and fees as long as the student remains continuously
enrolled (other than during regularly scheduled breaks between
1 The students described in sub-sections (i) and (ii), as well as some of those described in sub-section (iii), are
eligible for in-state tuition and fees, prior to July 1, 2017, in accordance with Section 702 of the Veterans Access,
Choice and Accountability Act of 2014.
14

courses, semesters, or terms) at a member College, even if the student
enrolls in multiple programs.
7) Notwithstanding paragraphs 1-5, effective July 1, 2018, a student shall be considered a
resident for in-state tuition purposes if:
a. After January 1, 2015, the student has earned:
i. a high school diploma from a Vermont public school or a Vermont
approved or recognized independent school, as defined in Title 16
of the Vermont Statues Annotated, including a public or
independent school in another state that is designated as the public
school for the student’s district of residence at the time the diploma
was earned, or from the Community High School of Vermont; or
ii. a high school equivalency certificate from the Vermont State
Board of Education; or
iii. a secondary school equivalency certificate based on successful
completion of General Education Development tests;
and
b. At the time the student earned a diploma or certificate under subsection
(a), the primary legal residence of the student, or the student’s parent(s) or
guardian(s) if the student was under age 18, was in Vermont; and
c. The student is and remains domiciled in Vermont at the time the student
enrolls at the Vermont State Colleges. Domicile shall mean a person’s
true, fixed and permanent home, to which he/she intends to return when
absent. Domicile shall not be dependent upon a person’s marital status.
Eligibility for in-state tuition under this paragraph shall not necessarily constitute in-state
residency for any other purpose within or outside the VSC system.
7)8) A student enrolling at the Vermont State Colleges shall be classified by the
College’s chief admissions officer as a resident or non-resident for tuition purposes. The
decision by the officer shall be based upon information furnished by the student and other
relevant information. The officer is authorized to require such written documents,
affidavits, verifications or other evidence as he/she deems necessary.
8)9) The burden of proof shall, in all cases, rest upon the student claiming to be a
Vermont resident for tuition purposes by clear and convincing evidence.
9)10) Changes in residency status for tuition purposes shall become effective for the
semester following the date of reclassification.
10)11) A student with resident status for tuition purposes will lose that status if he/she, at
any time, fails to meet the above requirements.
11)12) The decision of the College’s chief admissions officer on the classification of a
student as a resident or non-resident for tuition purposes may be appealed in writing to
the College’s Dean of Administration. Further appeal of a classification of a student's
15
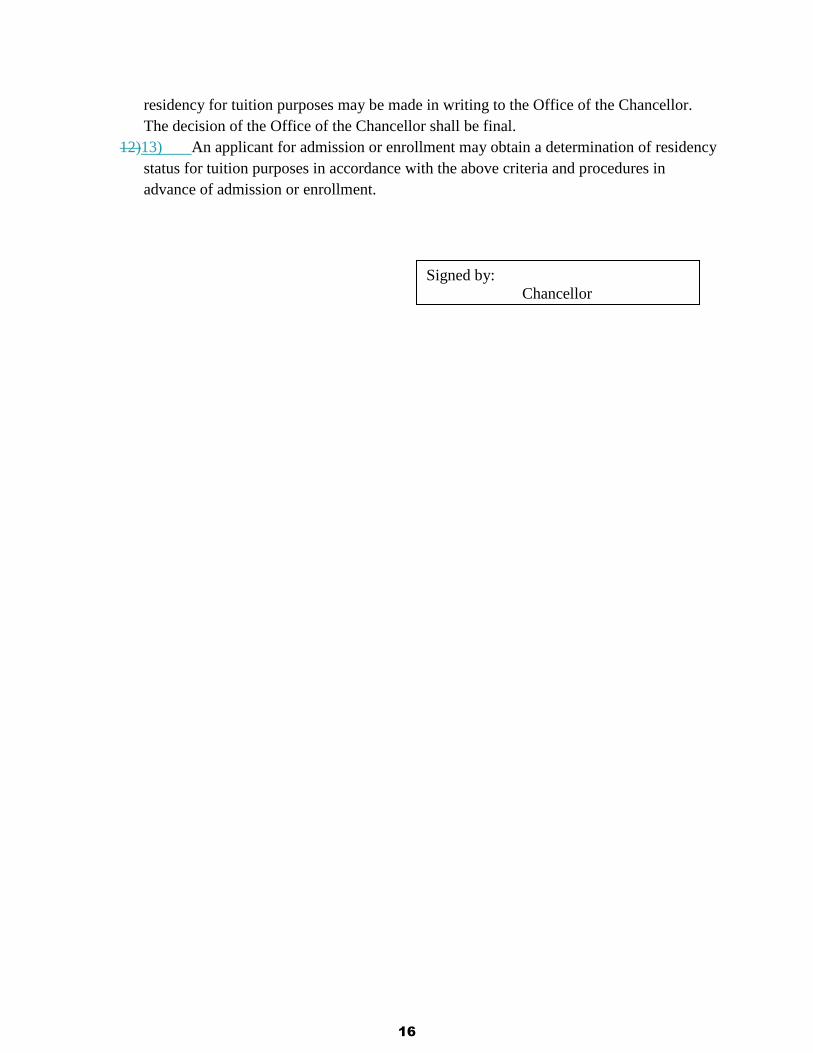
residency for tuition purposes may be made in writing to the Office of the Chancellor.
The decision of the Office of the Chancellor shall be final.
12)13) An applicant for admission or enrollment may obtain a determination of residency
status for tuition purposes in accordance with the above criteria and procedures in
advance of admission or enrollment.
Signed by:
Chancellor
16

Item 3:
2nd Quarter FY2018 Financial Reports
17

Vermont State Colleges
Consolidated Financial Reports
Period ended December 31, 2017
18

FY2018 Outlook as of Outlook as of VarBudget 30‐Sep Dec 31 $ Variance > +3%
REVENUESCastleton University 49,194 48,339 48,264 (930)
Community College of Vermont 27,860 28,140 28,141 281
Northern Vermont University 57,962 55,941 55,622 (2,340) * Johnson State College 29,433 28,863 28,552 (881)
Lyndon State College 28,529 27,078 27,070 (1,459) *Vermont Technical College* 37,833 37,375 37,351 (482)
Chancellor's Office 250 250 250 ‐
TOTAL REVENUES 173,099 170,045 169,628 (3,471)
EXPENSESCastleton University 49,710 49,535 49,775 65
Community College of Vermont 26,950 27,280 27,435 485
Northern Vermont University 59,069 57,846 57,164 (1,905) * Johnson State College 29,980 29,277 28,877 (1,103) * Lyndon State College 29,089 28,569 28,287 (802)
Vermont Technical College* 37,153 37,056 36,616 (537)
Chancellor's Office 250 250 464 214
TOTAL EXPENSES 173,132 171,967 171,454 (1,678)
NET REVENUES/(DEFICIT)Castleton University (516) (1,196) (1,511) (995) *Community College of Vermont 910 860 706 (204) *Northern Vermont University (1,107) (1,905) (1,542) (435) * Johnson State College (547) (414) (325) 222 * Lyndon State College (560) (1,491) (1,217) (657) *Vermont Technical College* 680 319 735 55 *Chancellor's Office ‐ ‐ (214) (214)
NET REVENUES/(DEFICIT) (33) (1,922) (1,826) (1,793) *0.0% ‐1.1% ‐1.1%
* Includes Workforce Development
Unrestricted Revenues and ExpensesFY2018 Budget Outlook as of December 31
Vermont State Colleges System(Amounts rounded to $1,000)
EXECUTIVE SUMMARY
19

Executive Summary December 31, 2017
Summary Enrollment (FPE) Data:
Fall FPEs were lagging by 94 compared to a budgeted 8,344.
There is a near equal distribution in the decrease to FPEs between undergraduate Vermonters
and undergraduate Non-Vermonters at 50 fewer FPEs for Vermonters and 40 fewer FPEs for
Non-Vermonters.
Spring FPEs projections double that negative variance count and result in 7,488 as compared to
a budgeted 7,688, mainly in the way of Vermonters – both undergraduate and graduate.
Summer Session I (July & August 2017) resulted in 12 more FPEs than budgeted, although the
mix was a shift from undergraduate Vermonters to Non-Vermonters and graduate Vermonters.
Total projected FPEs in FY18 is 120 fewer then the budget of 9,482.
Summary Budget to Actual Projections:
Tuition and fees revenue is projected to be $2.1m short of budget, coupled with a projected
shortfall in Room and Board revenue of $886k.
Total Revenues are projected at a $3.5m negative variance from the Board Approved Budget, as
most revenue categories are expected to fall short of budget in FY18.
The positive variance in projected operating expenses of $1.7m is primarily a reflection of the
significant decrease in salaries and benefits as compared to budget.
The VSC is projecting a $1.8m operating deficit for FY18; this net operating result is an
Unfavorable $1.8m or 1% shortfall from a $173 million budget.
Summary Statement of Net Assets/Net Position Yr. over Yr., Dec. 31:
Total Net Assets have increased by $2.5 million.
o The Investment in Capital Assets fund has increased by $1.8m due to a change in how
we reflect capital funding during the course of the year. This is a mere timing issue.
o Restricted Non-Expendable has increased by $856k, due to the growth of the
endowment funds.
o Restricted Expendable Loans – the Perkins Loan Fund – has not changed significantly.
o Restricted Expendable Other has increased by $2.3m mainly due to gift revenue and
investment income from favorable market returns.
o The Unrestricted fund declined by $2.5m as a result of continued deficits in operations.
20

BUDGETED ACTUAL/ESTIMATED
FPE* Revenue FPE* Revenue FPE* Revenue
FALL 2017
Vermonter 6,435 $30,768,135 6,385 $30,363,365 (50) ($404,770)
Non-Vrmtr (o/s) 1,054 $12,541,897 1,014 $12,058,378 (40) (483,519)
NEBHE 532 $6,069,124 531 $5,853,540 (1) (215,584)
Other 135 $959,040 122 $866,688 (13) (92,352)
Grad Vermonter 149 $865,696 162 $938,067 13 72,371
Grad Non- Vermonter 39 $299,045 36 $268,064 (3) (30,981)
Total 8,344 $51,502,938 8,250 $50,348,102 (94) ($1,154,836)
SPRING 2018
Vermonter 5,933 $28,131,604 5,755 $27,143,887 (177) ($987,717)
Non-Vrmtr (o/s) 937 $11,004,977 948 $11,122,353 11 117,376
NEBHE 492 $5,595,506 465 $5,249,597 (27) (345,909)
Other 115 $816,960 122 $866,688 7 49,728
Grad Vermonter 175 $984,234 163 $930,952 (12) (53,282)
Grad Non- Vermonter 37 $277,951 34 $243,980 (3) (33,971)
Total 7,688 $46,811,234 7,488 $45,557,457 (200) ($1,253,777)
SUMMER SESSIONS I. (J/Aug)
Vermonter 795 $2,807,836 751 $2,591,629 (44) ($216,207)
Non-Vrmtr (o/s) 54 $356,898 78 $549,103 23 192,205
NEBHE 17 $158,642 23 $215,448 6 56,806
Grad Vermonter 27 $177,475 45 $282,469 19 104,994
Grad Non- Vermonter 1 $6,955 9 $83,505 9 76,550
Total 894 3,507,806 906 3,722,155 12 214,348
SUMMER SESSIONS II> (May/J)
Vermonter 726 $2,896,645 755 $3,048,664 29 $152,019
Non-Vrmtr (o/s) 33 $254,934 46 $417,179 14 162,245
NEBHE 29 $323,009 27 $299,211 (2) (23,798)
Grad Vermonter 33 $170,992 37 $218,747 4 47,755
Grad Non- Vermonter 2 $13,897 9 $62,210 7 48,313
Total 822 $3,659,478 874 $4,046,011 51 $386,533
FY 2018 TOTAL (Avg)
Fall & Spring
Vermonter 6,184 $58,899,740 6,070 $57,507,252 (113) ($1,392,488)
Non-Vrmtr (o/s) 995 $23,546,875 981 $23,180,731 (14) (366,144)
NEBHE 512 $11,664,631 498 $11,103,137 (14) (561,494)
Other 125 $1,776,000 122 $1,923,376 (3) 147,376
Grad Vermonter 162 $1,849,930 163 $1,869,019 1 19,089
Grad Non- Vermonter 38 $576,996 35 $512,044 (3) (64,952)
S/T 8,016 $98,314,171 7,869 $96,095,559 (147) ($2,218,612)
Summer Sessions (annualized) 1,466 7,167,284 1,492 7,768,166 27 600,881
Total Student Tuition 9,482 $105,481,456 9,361 $103,863,725 (120) ($1,617,731)
Plus: Non-credit tuition & seminars 547,482 500,000 (47,482)
Student Fees 12,115,130 11,555,864 (559,266)
Total Tuition and Fees 75,855 $118,144,068 74,890 $115,919,589 (965) ($2,224,479)
Less: Waivers (6,482,098) (6,400,700) 81,398
Total Net Tuition & Fees $111,661,970 $109,518,889 ($2,143,081)
Auxiliary:
Room & Board Fall 13,177,806 12,519,136 (658,670)
Room & Board Spring 11,709,841 11,488,968 (220,873)
Bookstore 7,000 0 (7,000)
Total Auxiliary 24,894,647 24,008,104 (886,543)
* FPE: Full Paying Equivalent, i.e. # students at full tuition value
** Summer Sessions charge rates utilized in preceeding Academic Year
VERMONT STATE COLLEGES
FY18 TUITION & FEES REVENUE MONITORING REPORT -
VSC - CONSOLIDATED12/31/2017
VARIANCE
21

Total Board Projection Variance
Actual thru Projected Projected Approved vs Budget Var Total Year FY17 Actual to
Dec 2017 Balance of Total Year Budget Variance > 3% 2017 Actual Projected FY18
2018 2018 2018 Fav/(Unfav) Fav/(Unfav)
REVENUES
Tuition and Fees 57,079 52,439 109,518 111,662 (2,144) 112,047 (2,529)
State Appropriations 14,578 14,356 28,934 28,934 - 25,938 2,996
Room & Board 12,402 11,606 24,008 24,894 (886) * 24,533 (525)
Sales and Services 2,628 1,823 4,451 4,936 (485) * 5,262 (811)
Gifts 639 579 1,218 1,413 (195) * 1,582 (364)
Other Revenue 1,054 445 1,499 1,260 239 * 1,889 (390)
TOTAL REVENUES 88,380 81,248 169,628 173,099 (3,471) 171,251 (1,623)
EXPENSES
Employee Wages and Benefits 56,518 55,609 112,127 114,041 1,914 113,192 1,065
Services, Supplies and Travel 18,288 17,324 35,612 35,120 (492) 35,976 364
Scholarships and Fellowships 6,467 6,037 12,504 11,748 (756) * 10,881 (1,623)
Utilities 2,312 3,894 6,206 6,464 258 * 5,475 (731)
Other Expenses - 465 465 437 (28) * - (465)
Debt Service 4,000 3,996 7,996 8,217 221 10,849 2,853
Chancellor's Office - - - - - - -
Other Transfers (4,860) 1,404 (3,456) (2,895) 561 * (1,825) 1,631
TOTAL EXPENSES 82,725 88,729 171,454 173,132 1,678 174,548 3,094
NET REVENUES 5,655 (7,481) (1,826) (33) (1,793) (3,297) 1,471
NON-RECURRING ITEMS
Carry-Forward 79 125 204 28 353
Strategic Reserve - - 1,542 268 766
All Other (5,734) 7,356 80 (263) 2,178
TOTAL (must equal zero) - - - - -
Vermont State Colleges
VSC CONSOLIDATED
For the Quarter Ending December 31, 2017
Budget vs Actual Report
(Amounts rounded to 1,000's)
22

Vermont State CollegesStatement of Net Assets/Net Position
As of December 31, 2017Restricted Restricted Invested Prior Year Variance $ Variance %
Unrestricted Expendable Unexpendable In Capital Loans TOTAL ENTITY TOTAL ENTITY FY18 vs FY17 FY18 vs FY17
ASSETS Current Assets Cash and Cash Equivalents 15,799,011 0 0 0 0 15,799,011 14,781,002 1,018,009 6.9%
Short Term Investments (less than 90 days) 0 0 0 0 0 0 0 0 0.0%
A/R Net (includes accrued interest 59,304,354 3,735,799 0 0 0 63,040,153 59,850,486 3,189,667 5.3%
Inventories 3,455 0 0 0 0 3,455 10,393 (6,938) -66.8%
Deposit with Bond Trustees 1,334,559 0 0 1,460,211 0 2,794,770 1,727,967 1,066,803 61.7%
Notes and Mortgages Receivalabe 0 0 0 0 0 0 (2,591) 2,591 -100.0%
Due To/Due From (46,552,568) 11,895,909 19,080,186 15,763,645 (187,172) 0 0 0 0.0% Other Current Assets 1,929,731 0 0 0 0 1,929,731 2,664,899 (735,168) -27.6%
Total Current Assets 31,818,542 15,631,707 19,080,186 17,223,856 (187,172) 83,567,119 79,032,157 4,534,963 5.7%
Non-Current Assets Cash and Cash Equivalents 0 0 0 0 712,252 712,252 641,862 70,390 11.0%
Long-term investments (Quasi-Endowments) 48,369,368 0 0 0 0 48,369,368 44,200,606 4,168,762 9.4%
Deposit with Bond Trustee 0 0 0 0 0 0 0 0 0.0%
Notes Receivable (Net) 0 697,179 0 0 4,883,637 5,580,816 5,683,693 (102,876) -1.8%
Capital Assets (Net) 0 0 0 166,599,152 0 166,599,152 172,396,443 (5,797,292) -3.4%
Interest Rate Swap Future Inflows 0 0 0 0 0 0 14,963,264 (14,963,264) -100.0%
Other Assets 10,874,196 0 0 0 0 10,874,196 80,594 10,793,602 13392.5%
Total Non-Current Assets 59,243,564 697,179 0 166,599,152 5,595,889 232,135,784 237,966,462 (5,830,678) -2.5%
TOTAL ASSETS 91,062,106 16,328,886 19,080,186 183,823,007 5,408,717 315,702,903 316,998,618 (1,295,715) -0.4%
LIABILITIES Current Liabilities Deposits (For ensuring FY) 151,158 0 0 0 0 151,158 129,132 22,026 17.1%
Accounts Payable and Accrued Liabilities 12,179,927 53,328 0 0 0 12,233,254 14,035,502 (1,802,248) -12.8%
Deferred Revenue (For ensuing FY) 54,953,706 3,724,771 0 0 0 58,678,477 59,937,473 (1,258,996) -2.1%
Long-term Liabilities (Current portion) 0 0 0 1,478,651 0 1,478,651 4,383,369 (2,904,718) -66.3%
Total Current Liabilities 67,284,791 3,778,098 0 1,478,651 0 72,541,541 78,485,475 (5,943,934) -7.6%
Non-Current Liabilities Deposits (Beyond ensuing FY) 0 12,602 0 0 0 12,602 25,860 (13,258) -51.3%
Accounts Payable and Accrued Liabilities 64,914,056 0 0 0 0 64,914,056 59,599,052 5,315,005 8.9%
Refundable Grants 0 0 0 0 6,037,232 6,037,232 6,037,793 (561) 0.0%
Long-term liabilities (Non-current portion) 0 0 0 125,770,451 0 125,770,451 113,955,079 11,815,372 10.4%
FMV Interest Rate Swap 0 0 0 0 0 0 14,963,264 (14,963,264) -100.0%
Other Long-term Liabilities 0 0 0 0 0 0 0 0 0.0%
Total Non-Current Liabilities 64,914,056 12,602 0 125,770,451 6,037,232 196,734,342 194,581,048 2,153,294 1.1%
TOTAL LIABILITIES 132,198,847 3,790,700 0 127,249,103 6,037,232 269,275,883 273,066,523 (3,790,641) -1.4%
NET ASSETS Invested in Capital Assets 56,573,905 56,573,905 54,815,652 1,758,253 3.2%
Restricted Non-Expendable 19,080,186 19,080,186 18,224,453 855,733 4.7%
Restricted Expendable Loans (628,515) (628,515) (670,253) 41,738 -6.2%
Restricted Expendable: Other 12,538,186 12,538,186 10,279,725 2,258,461 22.0%
Unrestricted (41,136,742) (41,136,742) (38,717,482) (2,419,259) 6.2%
TOTAL NET ASSETS (41,136,742) 12,538,186 19,080,186 56,573,905 (628,515) 46,427,021 43,932,095 2,494,926 5.7%
TOTAL LIABILITIES AND NET ASSETS 91,062,106 16,328,886 19,080,186 183,823,007 5,408,717 315,702,903 316,998,618 (1,295,715) -0.4%
23

Vermont State Colleges
Detailed College Financial Reports
Period ended December 31, 2017
24

BUDGETED ACTUAL/ESTIMATED
Rate FPE* Revenue FPE* Revenue FPE* Revenue
FALL 2017 (Semester)
Vermonter 3,132 2,476 $7,753,576 2,520 $7,893,232 45 $139,656
Non-Vrmtr (o/s) 6,264 120 749,950 118 740,509 (2) (9,441)
NEBHE 3,132 27 85,989 52 162,734 25 76,745
Other - - 0 0 0 0
Grad Vermonter - - - - - -
Grad Non- Vermonter - - - - - -
Total 2,623 $8,589,515 2,690 $8,796,475 68 $206,960
SPRING 2018 (Semester)
Vermonter 3,132 2,342 $7,335,181 2,340 $7,330,000 (2) ($5,181)
Non-Vrmtr (o/s) 6,264 135 846,847 136 855,000 1 8,153
NEBHE 3,132 27 84,667 32 100,000 5 15,333
Other - - - 0 0 0 0
Grad Vermonter - - - - - - -
Grad Non- Vermonter - - - - - - -
Total 2,504 $8,266,695 2,509 $8,285,000 5 $18,305
SUMMER SESSIONS I. (J/Aug) **
Vermonter 3,036 612 $1,856,668 601 $1,824,935 (10) ($31,733)
Non-Vrmtr (o/s) 6,072 49 298,580 50 300,897 0 2,317
NEBHE 6,072 6 35,986 8 47,624 2 11,638
Grad Vermonter - - - - - - -
Grad Non- Vermonter - - - - - - -
Total 667 2,191,234 658 2,173,456 (8) (17,778)
SUMMER SESSIONS II> (May/J) **
Vermonter 3,132 523 $1,636,470 523 $1,636,470 0 $0
Non-Vrmtr (o/s) 6,264 23 142,819 23 142,819 0 0
NEBHE 3,132 3 7,934 3 7,934 0 0
Grad Vermonter - - - - - - -
Grad Non- Vermonter - - - - - - -
Total 548 $1,787,223 548 $1,787,223 0 $0
FY 2018 TOTAL (Acad Yr) (Avg)
Fall & Spring
Vermonter 6,264 2,409 $15,088,757 2,430 $15,223,232 21 $134,475
Non-Vrmtr (o/s) 12,528 127 1,596,797 127 1,595,509 (0) (1,288)
NEBHE 6,264 27 170,656 42 262,734 15 92,078
Other - - - 0 190,000 0 190,000
Grad Vermonter - - - - - - -
Grad Non- Vermonter - - - - - - -
S/T 2,564 $16,856,210 2,600 $17,271,475 36 $415,265
Summer Sessions (annualized) 1,214 3,978,457 1,206 3,960,679 (4) (17,778)
Total Student Tuition 3,778 $20,834,667 3,806 $21,232,154 28 $397,487
Plus: Non-credit tuition & seminars 77,482 30,000 (47,482)
Student Fees 1,560,000 1,650,000 90,000
Total Tuition and Fees CP 30,224 $22,472,149 30,447 $22,912,154 223 $440,005
Less: Waivers (428,480) (430,000) (1,520)
Total Net Tuition & Fees $22,043,669 $22,482,154 $438,485
Auxiliary:
Room & Board Fall 0 0 0
Room & Board Spring 0 0 0
Bookstore 0 0 0
Total Auxiliary 0 0 0
* FPE: Full Paying Equivalent, i.e. # students at full tuition value
** Summer Sessions charge rates utilized in preceeding Academic Year
VARIANCE
VERMONT STATE COLLEGES
FY18 TUITION & FEES REVENUE MONITORING REPORT -
Community College of Vermont12/31/2017
25

Total Board Projection Variance
Actual thru Projected Projected Approved vs Budget Var Total Year FY17 Actual to
Dec 2017 Balance of Total Year Budget Variance > 3% 2017 Actual Projected FY18
2018 2018 2018 Fav/(Unfav) Fav/(Unfav)
REVENUES
Tuition and Fees 11,821 10,661 22,482 22,044 438 23,278 (796)
State Appropriations 2,732 2,733 5,465 5,465 - 4,915 550
Room & Board - - - - - -
Sales and Services 2 18 20 200 (180) * 22 (2)
Gifts 53 2 55 50 5 * 25 30
Other Revenue 44 75 119 101 18 * 166 (47)
TOTAL REVENUES 14,652 13,489 28,141 27,860 281 28,406 (265)
EXPENSES
Employee Wages and Benefits 10,990 10,242 21,232 20,881 (351) 21,902 670
Services, Supplies and Travel 2,324 1,646 3,970 3,766 (204) * 4,618 648
Scholarships and Fellowships 122 28 150 150 - 184 34
Utilities 140 150 290 280 (10) * 324 34
Other Expenses - 187 187 187 - - (187)
Debt Service 638 638 1,276 1,276 - 1,941 665
Chancellor's Office 740 740 1,480 1,480 - 1,420 (60)
Other Transfers (1,223) 73 (1,150) (1,070) 80 * (1,334) (184)
TOTAL EXPENSES 13,731 13,704 27,435 26,950 (485) 29,055 1,620
NET REVENUES 921 (215) 706 910 (204) (649) 1,355
NON-RECURRING ITEMS
Carry-Forward 79 125 204 28 353
Strategic Reserve - - -
All Other (1,000) 90 (910) (938) 296
TOTAL (must equal zero) - - - - -
Vermont State Colleges
Community College of Vermont
For the Quarter Ending December 31, 2017
Budget vs Actual Report
(Amounts rounded to 1,000's)
26

Projection vs. Budget
A Sales and Services are projected to be below budget by $180k, primarily due to financial statement
presentation. A large portion of the budgeted activity appears in the 'Tuition and Fees' and 'Other
Revenue' figures due to the nature of the sales.
B Gifts are projected to exceed budget by $5k due to higher than budgeted unrestricted giving.
C Other Revenue is projected to be above budget by $18k due to higher than budgeted interest
income.
D Utilities expense is projected to be above budget by $10k due to higher than budgeted actual costs.
E Other Transfers contra expense is projected to be $80k higher than budget due to increased
transfer activity.
Notes
Overall, CCV revenue is projected to exceed budget by $281k for FY18, primarily due to higher than budgeted tuition revenue. Expenses are projected to exceed budget by $485k, including $204k of approved carry forward spending. The expense overage from operations is primarily due to the higher than budgeted wage and benefit expense associated with above budget enrollment. CCV is expecting to have a $910k operating budget surplus due to the return of one time funds.
Community College of VermontDecember 31, 2017
Narrative Highlights for Budget vs. Actual
27

BUDGETED ACTUAL/ESTIMATED
Rate FPE* Revenue FPE* Revenue FPE* Revenue
FALL 2017 (Semester)
Vermonter 5,436 1,112 $6,044,832 1,108 $6,024,110 (4) ($20,722)
Non-Vrmtr (o/s) 13,212 526 $6,949,512 502 6,630,555 (24) (318,957)
NEBHE 13,212 2 32,616 2 24,222 (1) (8,394)
Other 7,104 135 959,040 122 866,688 (13) (92,352)
Grad Vermonter 7,200 48 345,600 51 368,800 3 23,200
Grad Non- Vermonter 7,200 28 201,600 26 184,800 (2) (16,800)
Total 1,851 $14,533,200 1,811 $14,099,175 (41) ($434,025)
SPRING 2018 (Semester)
Vermonter 5,436 1,081 $5,876,316 986 $5,357,532 (95) ($518,784)
Non-Vrmtr (o/s) 13,212 467 6,170,004 463 6,117,156 (4) (52,848)
NEBHE 13,212 2 32,616 2 24,462 (1) (8,154)
Other 7,104 115 816,960 122 866,688 7 49,728
Grad Vermonter 7,200 42 302,400 45 324,000 3 21,600
Grad Non- Vermonter 7,200 28 201,600 27 194,400 (1) (7,200)
Total 1,735 $13,399,896 1,644 $12,884,238 (91) ($515,658)
SUMMER SESSIONS I. (J/Aug) **
Vermonter 4,656 - $0 25 $117,408 25 $117,408
Non-Vrmtr (o/s) 6,984 - - 15 105,070 15 105,070
NEBHE 6,984 - 0 0 0 0
Grad Vermonter 5,803 - - 21 122,771 21 122,771
Grad Non- Vermonter 8,937 - - 8 73,757 8 73,757
Total 0 0 70 419,006 70 419,006
SUMMER SESSIONS II> (May/J) **
Vermonter 5,436 - $0 18 $100,000 18 $100,000
Non-Vrmtr (o/s) 13,212 - - 2 25,000 2 25,000
NEBHE 13,212 - 0 - 0 0
Grad Vermonter 7,200 - - 14 98,000 14 98,000
Grad Non- Vermonter 7,200 - - 8 55,000 8 55,000
Total 0 $0 42 $278,000 42 $278,000
FY 2018 TOTAL (Acad Yr) (Avg)
Fall & Spring
Vermonter 10,872 1,097 $11,921,148 1,047 $11,381,642 (50) ($539,506)
Non-Vrmtr (o/s) 26,424 497 13,119,516 482 12,747,711 (14) (371,805)
NEBHE 26,424 2 65,232 2 48,684 (1) (16,548)
Other 14,208 125 1,776,000 122 1,733,376 (3) (42,624)
Grad Vermonter 14,400 45 648,000 48 692,800 3 44,800
Grad Non- Vermonter 14,400 28 403,200 26 379,200 (2) (24,000)
S/T 1,793 $27,933,096 1,728 $26,983,413 (66) ($949,683)
Summer Sessions (annualized) 0 0 56 697,006 56 697,006
Total Student Tuition 1,793 $27,933,096 1,783 $27,680,419 (10) ($252,677)
Plus: Non-credit tuition & seminars 470,000 470,000 $0
Student Fees 2,892,000 2,610,000 (282,000)
Total Tution and Fees $31,295,096 $30,760,419 ($534,677)
Less: Waivers (760,000) (500,000) 260,000
Total Net Tuition & Fees $30,535,096 $30,260,419 ($274,677)
Auxiliary:
Room & Board Fall 5,486,529 5,185,629 (300,900)
Room & Board Spring 4,862,118 4,914,371 52,253
Bookstore/Arena 7,000 0 (7,000)
Total Auxiliary 10,355,647 10,100,000 (255,647)
* FPE: Full Paying Equivalent, i.e. # students at full tuition value
** Summer Sessions charge rates utilized in preceeding Academic Year
VARIANCE
VERMONT STATE COLLEGES
FY18 TUITION & FEES REVENUE MONITORING REPORT -
Castleton University12/31/2017
28

Total Board Projection Variance
Actual thru Projected Projected Approved vs Budget Var Total Year FY17 Actual to
Dec 2017 Balance of Total Year Budget Variance > 3% 2017 Actual Projected FY18
2018 2018 2018 Fav/(Unfav) Fav/(Unfav)
REVENUES
Tuition and Fees 15,950 14,310 30,260 30,535 (275) 30,850 (590)
State Appropriations 2,732 2,732 5,464 5,464 - 4,915 549
Room & Board 5,135 4,965 10,100 10,355 (255) 10,310 (210)
Sales and Services 899 401 1,300 1,500 (200) * 2,019 (719)
Gifts 312 388 700 900 (200) * 704 (4)
Other Revenue 277 163 440 440 - 452 (12)
TOTAL REVENUES 25,305 22,959 48,264 49,194 (930) 49,250 (986)
EXPENSES
Employee Wages and Benefits 14,947 14,503 29,450 29,970 520 30,170 720
Services, Supplies and Travel 4,703 4,297 9,000 8,615 (385) * 9,503 503
Scholarships and Fellowships 2,850 2,750 5,600 5,125 (475) * 4,438 (1,162)
Utilities 888 1,140 2,028 2,028 - 1,688 (340)
Other Expenses - 25 25 - (25) - (25)
Debt Service 1,516 1,516 3,032 3,032 - 4,107 1,075
Chancellor's Office 740 740 1,480 1,480 - 1,420 (60)
Other Transfers (1,263) 423 (840) (540) 300 * (54) 786
TOTAL EXPENSES 24,381 25,394 49,775 49,710 (65) 51,272 1,497
NET REVENUES 924 (2,435) (1,511) (516) (995) (2,022) 511
NON-RECURRING ITEMS
Carry-Forward
Strategic Reserve - 116 766
All Other* (924) 2,435 1,511 400 1,256
TOTAL (must equal zero) - - - - -
Vermont State Colleges
Castleton University
For the Quarter Ending December 31, 2017
Budget vs Actual Report
(Amounts rounded to 1,000's)
29
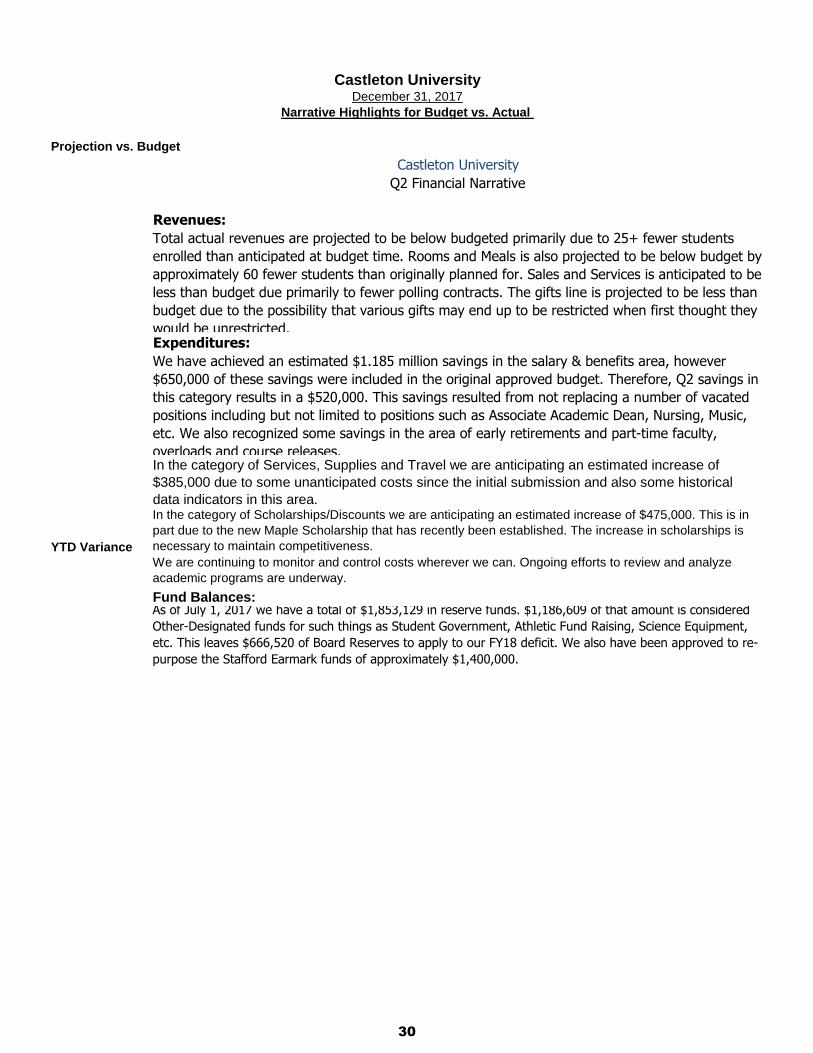
Projection vs. Budget
Castleton University
Q2 Financial Narrative
Revenues:
Total actual revenues are projected to be below budgeted primarily due to 25+ fewer students
enrolled than anticipated at budget time. Rooms and Meals is also projected to be below budget by
approximately 60 fewer students than originally planned for. Sales and Services is anticipated to be
less than budget due primarily to fewer polling contracts. The gifts line is projected to be less than
budget due to the possibility that various gifts may end up to be restricted when first thought they
would be unrestricted.Expenditures:
We have achieved an estimated $1.185 million savings in the salary & benefits area, however
$650,000 of these savings were included in the original approved budget. Therefore, Q2 savings in
this category results in a $520,000. This savings resulted from not replacing a number of vacated
positions including but not limited to positions such as Associate Academic Dean, Nursing, Music,
etc. We also recognized some savings in the area of early retirements and part-time faculty,
overloads and course releases.In the category of Services, Supplies and Travel we are anticipating an estimated increase of $385,000 due to some unanticipated costs since the initial submission and also some historical data indicators in this area.
YTD Variance
In the category of Scholarships/Discounts we are anticipating an estimated increase of $475,000. This is in part due to the new Maple Scholarship that has recently been established. The increase in scholarships is necessary to maintain competitiveness.We are continuing to monitor and control costs wherever we can. Ongoing efforts to review and analyze academic programs are underway.
Fund Balances:
As of July 1, 2017 we have a total of $1,853,129 in reserve funds. $1,186,609 of that amount is considered
Other-Designated funds for such things as Student Government, Athletic Fund Raising, Science Equipment,
etc. This leaves $666,520 of Board Reserves to apply to our FY18 deficit. We also have been approved to re-
purpose the Stafford Earmark funds of approximately $1,400,000.
Castleton UniversityDecember 31, 2017
Narrative Highlights for Budget vs. Actual
30

BUDGETED ACTUAL/ESTIMATED
Rate FPE* Revenue FPE* Revenue FPE* Revenue
FALL 2017 (Semester)
Vermonter 5,316 1,573 $8,360,116 1,512 $8,039,053 (60) ($321,063)
Non-Vrmtr (o/s) 11,400 321 $3,660,270 310 $3,532,973 (11) ($127,297)
NEBHE ($6,696 net) 11,400 380 $4,332,672 358 $4,086,815 (22) ($245,857)
Other - $0 $0 0 $0
Grad Vermonter 5,067 103 $520,096 112 $569,267 10 $49,171
Grad Non- Vermonter 10,656 9 $97,445 8 $83,264 (1) ($14,181)
Total 2,386 $16,970,599 2,301 16,311,372 (85) (659,227)
SPRING 2018 (Semester)
Vermonter 5,316 1,414 $7,514,294 1,359 $7,224,849 (54) ($289,445)
Non-Vrmtr (o/s) 11,400 251 $2,865,070 268 $3,053,573 17 $188,503
NEBHE ($6,984 net) 11,400 354 $4,036,455 326 $3,717,301 (28) ($319,154)
Other - $0 $0 0 $0
Grad Vermonter 5,067 135 $681,834 120 $606,952 (15) ($74,882)
Grad Non- Vermonter 10,656 7 $76,351 5 $49,580 (3) ($26,771)
Total 2,161 $15,174,003 2,077 $14,652,255 (83) ($521,748)
SUMMER SESSIONS I. (J/Aug) **
Vermonter 5,112 173 $884,844 114 $584,523 (59) ($300,321)
Non-Vrmtr (o/s) 10,956 5 $58,318 13 $143,136 8 $84,818
NEBHE 10,956 11 $122,656 15 $167,824 4 $45,168
Grad Vermonter 6,492 27 $177,475 25 $159,698 (3) ($17,777)
Grad Non- Vermonter 13,656 1 $6,955 1 $9,748 0 $2,793
Total 217 1,250,248 168 1,064,930 (49) (185,319)
SUMMER SESSIONS II> (May/J) **
Vermonter 5,316 79 $417,827 92 $489,672 14 $71,845
Non-Vrmtr (o/s) 11,400 10 $112,115 22 $249,360 12 $137,245
NEBHE 11,400 19 $219,888 17 $198,330 (2) ($21,558)
Grad Vermonter 5,067 34 $170,992 24 $120,747 (10) ($50,245)
Grad Non- Vermonter 10,656 1 $13,897 1 $7,210 (1) ($6,687)
Total 143 $934,720 156 $1,065,319 13 $130,599
FY 2018 TOTAL (Acad Yr) (Avg)
Fall & Spring
Vermonter 10,632 1,493 $15,874,410 1,436 $15,263,902 (57) ($610,508)
Non-Vrmtr (o/s) 22,800 286 $6,525,340 289 $6,586,546 3 $61,206
NEBHE 22,800 367 $8,369,127 342 $7,804,116 (25) ($565,011)
Other - $0 0
Grad Vermonter 10,134 119 $1,201,930 116 $1,176,219 (3) ($25,711)
Grad Non- Vermonter 21,312 8 $173,796 6 $132,844 (2) ($40,952)
S/T 2,273 $32,144,602 2,189 $30,963,627 (84) ($1,180,975)
Summer Sessions (annualized) 180 2,184,968 162 $2,130,249 (18) (54,720)
Total Student Tuition 2,453 $34,329,571 2,351 $33,093,876 (102) ($1,235,695)
Student Fees 4,032,764 3,750,945 (281,819)
Total Tution and Fees $38,362,335 $36,844,821 ($1,517,514)
Less: Waivers (4,087,130) (4,292,609) (205,479)
Total Net Tuition & Fees $34,275,205 $32,552,212 ($1,722,993)
Auxiliary:
Room & Board Fall 5,676,747 5,202,568 (474,179)
Room & Board Spring 5,061,253 4,684,896 (376,357)
Bookstore
Total Auxiliary 10,738,000 9,887,464 (850,536)
* FPE: Full Paying Equivalent, i.e. # students at full tuition value
** Summer Sessions charge rates utilized in preceeding Academic Year
VERMONT STATE COLLEGES
FY18 TUITION & FEES REVENUE MONITORING REPORT -
Northern Vermont University12/31/2017
VARIANCE
31
Total Board Projection Variance
Actual thru Projected Projected Approved vs Budget Var Total Year FY17 Actual to
Dec 2017 Balance of Total Year Budget Variance > 3% 2017 Actual Projected FY18
2018 2018 2018 Fav/(Unfav) Fav/(Unfav)
REVENUES
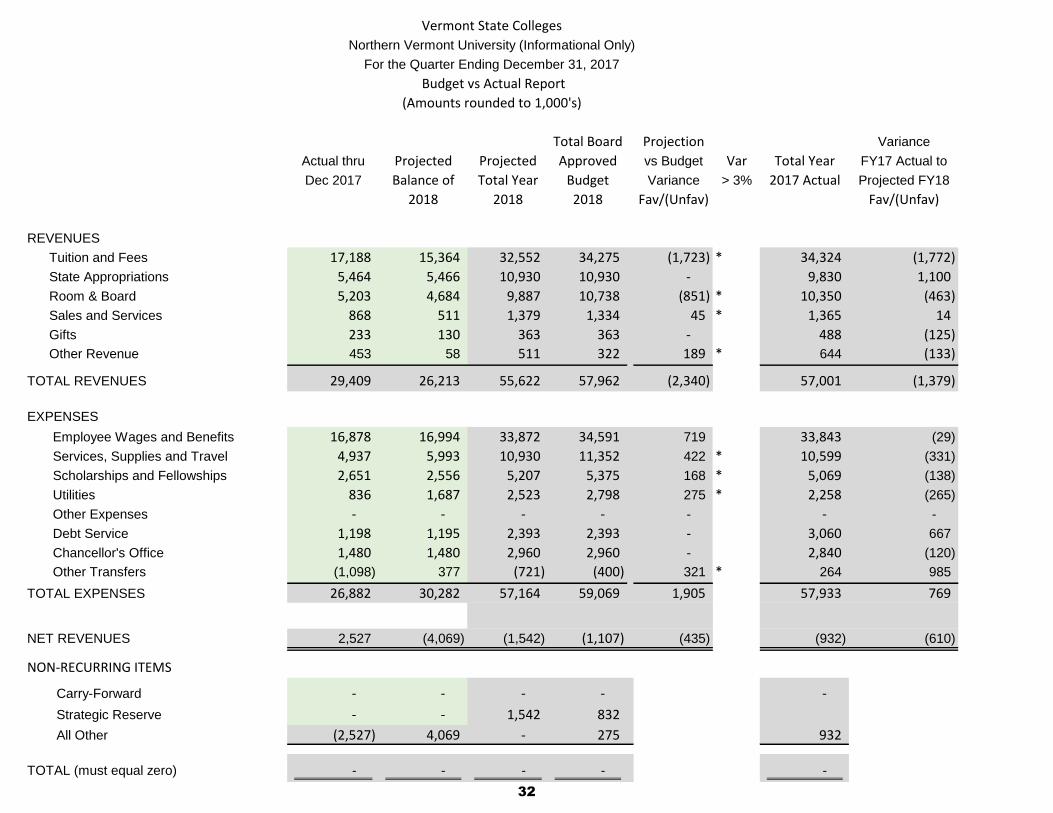
Tuition and Fees 17,188 15,364 32,552 34,275 (1,723) * 34,324 (1,772)
State Appropriations 5,464 5,466 10,930 10,930 - 9,830 1,100
Room & Board 5,203 4,684 9,887 10,738 (851) * 10,350 (463)
Sales and Services 868 511 1,379 1,334 45 * 1,365 14
Gifts 233 130 363 363 - 488 (125)
Other Revenue 453 58 511 322 189 * 644 (133)
TOTAL REVENUES 29,409 26,213 55,622 57,962 (2,340) 57,001 (1,379)
EXPENSES
Employee Wages and Benefits 16,878 16,994 33,872 34,591 719 33,843 (29)
Services, Supplies and Travel 4,937 5,993 10,930 11,352 422 * 10,599 (331)
Scholarships and Fellowships 2,651 2,556 5,207 5,375 168 * 5,069 (138)
Utilities 836 1,687 2,523 2,798 275 * 2,258 (265)
Other Expenses - - - - - - -
Debt Service 1,198 1,195 2,393 2,393 - 3,060 667
Chancellor's Office 1,480 1,480 2,960 2,960 - 2,840 (120)
Other Transfers (1,098) 377 (721) (400) 321 * 264 985
TOTAL EXPENSES 26,882 30,282 57,164 59,069 1,905 57,933 769
NET REVENUES 2,527 (4,069) (1,542) (1,107) (435) (932) (610)
NON-RECURRING ITEMS
Carry-Forward - - - - -
Strategic Reserve - - 1,542 832
All Other (2,527) 4,069 - 275 932
TOTAL (must equal zero) - - - - -
Vermont State Colleges
Northern Vermont University (Informational Only)
For the Quarter Ending December 31, 2017
Budget vs Actual Report
(Amounts rounded to 1,000's)
32

BUDGETED ACTUAL/ESTIMATED
Rate FPE* Revenue FPE* Revenue FPE* Revenue
FALL 2017 (Semester)
Vermonter 5,316 955 $5,074,603 915 $4,863,747 (40) ($210,856)
Non-Vrmtr (o/s) 11,796 115 1,359,510 149 $1,760,805 34 $401,295
NEBHE ($6,696 net) 11,796 96 1,133,520 107 $1,266,693 11 $133,173
Other - 0 $0
Grad Vermonter 5,148 99 509,732 95 $486,752 (4) ($22,980)
Grad Non- Vermonter 7,488 8 56,585 9 $69,056 2 $12,471
Total 1,273 $8,133,950 1,275 8,447,053 3 313,103
SPRING 2018 (Semester)
Vermonter 5,316 865 $4,600,725 805 $4,281,816 (60) ($318,909)
Non-Vrmtr (o/s) 11,796 114 1,345,044 124 1,461,114 10 $116,070
NEBHE ($6,984 net) 11,796 96 1,132,925 101 1,192,196 5 $59,271
Other - 0 $0
Grad Vermonter 5,148 105 540,138 93 480,960 (11) ($59,178)
Grad Non- Vermonter 7,488 7 49,111 7 49,580 0 $469
Total 1,187 $7,667,943 1,130 $7,465,666 (57) ($202,277)
SUMMER SESSIONS I. (J/Aug) **
Vermonter 5,112 86 $439,367 62 $316,525 (24) ($122,842)
Non-Vrmtr (o/s) 11,340 0 4,858 4 48,880 4 $44,022
NEBHE 11,340 4 47,812 0 5,211 (4) ($42,601)
Grad Vermonter 6,600 27 177,475 21 135,944 (6) ($41,531)
Grad Non- Vermonter 9,600 1 6,955 1 9,748 0 $2,793
Total 118 676,467 88 516,309 (30) (160,158)
SUMMER SESSIONS II> (May/J) **
Vermonter 5,316 62 $331,452 44 $235,521 (18) ($95,931)
Non-Vrmtr (o/s) 11,796 1 14,573 12 144,125 11 $129,552
NEBHE 11,796 1 7,783 0 814 (1) ($6,969)
Grad Vermonter 5,148 25 128,516 19 99,833 (6) ($28,683)
Grad Non- Vermonter 7,488 1 5,247 1 7,210 0 $1,963
Total 90 $487,571 77 $487,503 (13) ($68)
FY 2018 TOTAL (Acad Yr) (Avg)
Fall & Spring
Vermonter 10,632 910 $9,675,328 860 $9,145,563 (50) ($529,765)
Non-Vrmtr (o/s) 23,592 115 $2,704,554 137 $3,221,919 22 $517,365
NEBHE 23,592 96 $2,266,445 104 $2,458,889 8 $192,444
Other - $0 0
Grad Vermonter 10,296 102 $1,049,870 94 $967,712 (8) ($82,158)
Grad Non- Vermonter 14,976 7 $105,696 8 $118,636 1 $12,940
S/T 1,230 $15,801,893 1,203 $15,912,719 (27) $110,826
Summer Sessions (annualized) 104 1,164,038 83 $1,003,812 (21) (160,226)
Total Student Tuition 1,334 $16,965,932 1,286 $16,916,531 (48) ($49,401)
Student Fees 1,942,688 1,893,928 (48,760)
Total Tution and Fees $18,908,620 $18,810,459 ($98,161)
Less: Waivers (886,256) (1,546,422) (660,166)
Total Net Tuition & Fees $18,022,364 $17,264,037 ($758,327)
Auxiliary:
Room & Board Fall 2,649,925 2,559,387 (90,538)
Room & Board Spring 2,398,075 2,329,588 (68,487)
Bookstore
Total Auxiliary 5,048,000 4,888,975 (159,025)
* FPE: Full Paying Equivalent, i.e. # students at full tuition value
** Summer Sessions charge rates utilized in preceeding Academic Year
VERMONT STATE COLLEGES
FY18 TUITION & FEES REVENUE MONITORING REPORT -
Johnson State College12/31/2017
VARIANCE
33

Total Board Projection Variance
Actual thru Projected Projected Approved vs Budget Var Total Year FY17 Actual to
Dec 2017 Balance of Total Year Budget Variance > 3% 2017 Actual Projected FY18
2018 2018 2018 Fav/(Unfav) Fav/(Unfav)
REVENUES
Tuition and Fees 9,079 8,185 17,264 18,022 (758) * 17,538 (274)
State Appropriations 2,732 2,733 5,465 5,465 - 4,915 550
Room & Board 2,560 2,329 4,889 5,048 (159) * 4,935 (46)
Sales and Services 323 173 496 496 - 472 24
Gifts 147 77 224 224 - 276 (52)
Other Revenue 163 51 214 178 36 * 288 (74)
TOTAL REVENUES 15,004 13,548 28,552 29,433 (881) 28,424 128
EXPENSES
Employee Wages and Benefits 8,738 8,786 17,524 18,007 483 17,471 (53)
Services, Supplies and Travel 2,472 2,401 4,873 4,999 126 4,603 (270)
Scholarships and Fellowships 1,338 1,374 2,712 2,969 257 * 2,813 101
Utilities 501 896 1,397 1,473 76 * 1,292 (105)
Other Expenses - - - - - - -
Debt Service 530 529 1,059 1,059 - 1,329 270
Chancellor's Office 740 740 1,480 1,480 - 1,420 (60)
Other Transfers (463) 295 (168) (7) 161 * 224 392
TOTAL EXPENSES 13,856 15,021 28,877 29,980 1,103 29,152 275
NET REVENUES 1,148 (1,473) (325) (547) 222 (728) 403
NON-RECURRING ITEMS
Carry-Forward - -
Strategic Reserve 325 272
All Other (1,148) 1,473 - 275 728
TOTAL (must equal zero) - - - - -
Vermont State Colleges
Johnson State College
For the Quarter Ending December 31, 2017
Budget vs Actual Report
(Amounts rounded to 1,000's)
34

Projection vs. Budget
Based on current enrollment and historical trends Johnson State College is forecasting total year
revenue to be $28.6M as compared to a total year budget of $29.4M. Johnson State College
experienced modest growth in fall headcount. This growth is partially off-set by an increase in the
scholarship allowance for JSC Online students (net of revenue) that had been budgeted as an
institutional scholarship (budgeted expense) and fewer spring starts. A targeted increase in Spring
and Summer distance learning, combined with holding the line on discretionary spending, is
projected to deliver results $224,000 better than Johnson's FY18 budget submission. This is a
$91,000 favorable improvement from the Q1 forecast.
Johnson State CollegeDecember 31, 2017
Narrative Highlights for Budget vs. Actual
35

BUDGETED ACTUAL/ESTIMATED
Rate FPE* Revenue FPE* Revenue FPE* Revenue
FALL 2017 (Semester)
Vermonter 5,316 618 $3,285,513 597 $3,175,306 (21) ($110,207)
Non-Vrmtr (o/s) 11,400 202 2,300,760 155 $1,772,168 (46) ($528,592)
NEBHE ($6,696 net) 11,400 281 3,199,152 247 $2,820,122 (33) ($379,030)
Other - 0 $0
Grad Vermonter 5,067 2 10,364 16 $82,515 14 $72,151
Grad Non- Vermonter 10,656 4 40,860 1 $14,208 (3) ($26,652)
Total 1,106 $8,836,649 1,018 7,864,319 (89) (972,330)
SPRING 2018 (Semester)
Vermonter 5,316 548 $2,913,568 554 $2,943,033 6 $29,465
Non-Vrmtr (o/s) 11,400 133 1,520,026 140 1,592,459 6 $72,433
NEBHE ($6,984 net) 11,400 255 2,903,530 222 2,525,105 (33) ($378,425)
Other - 0 $0
Grad Vermonter 5,067 28 141,696 25 125,992 (3) ($15,704)
Grad Non- Vermonter 10,656 3 27,240 0 - (3) ($27,240)
Total 967 $7,506,060 940 $7,186,589 (27) ($319,471)
SUMMER SESSIONS I. (J/Aug) **
Vermonter 5,112 87 445,477$ 52 $267,998 (35) ($177,479)
Non-Vrmtr (o/s) 10,956 5 53,460 9 94,256 4 $40,796
NEBHE 10,956 7 74,844 15 162,613 8 $87,769
Grad Vermonter 6,492 - 4 23,754 4 $23,754
Grad Non- Vermonter 13,656 - 0 0 $0
Total 99 573,781 80 548,621 (19) (25,160)
SUMMER SESSIONS II> (May/J) **
Vermonter 5,316 16 86,375$ 48 $254,151 32 $167,776
Non-Vrmtr (o/s) 11,400 9 97,542 9 105,235 1 $7,692
NEBHE 11,400 19 212,105 17 197,516 (1) ($14,589)
Grad Vermonter 5,067 8 42,476 4 20,914 (4) ($21,561)
Grad Non- Vermonter 10,656 1 8,651 0 (1) ($8,651)
Total 53 $447,149 78 $577,816 26 $130,667
FY 2018 TOTAL (Acad Yr) (Avg)
Fall & Spring
Vermonter 10,632 583 $6,199,081 575 $6,118,339 (8) ($80,742)
Non-Vrmtr (o/s) 22,800 168 $3,820,786 148 $3,364,627 (20) ($456,159)
NEBHE 22,800 268 $6,102,682 234 $5,345,227 (33) ($757,455)
Other - $0 0
Grad Vermonter 10,134 15 $152,060 21 $208,507 6 $56,447
Grad Non- Vermonter 21,312 3 $68,100 1 $14,208 (3) ($53,892)
S/T 1,036 $16,342,709 979 $15,050,908 (58) ($1,291,801)
Summer Sessions (annualized) 76 1,020,930 79 $1,126,437 3 105,507
Total Student Tuition 1,112 $17,363,639 1,058 $16,177,345 (54) ($1,186,294)
Student Fees 2,090,076 1,857,017 (233,059)
Total Tution and Fees $19,453,715 $18,034,362 ($1,419,353)
Less: Waivers (3,200,874) (2,746,187) 454,687
Total Net Tuition & Fees $16,252,841 $15,288,175 ($964,666)
Auxiliary:
Room & Board Fall 3,026,822 2,643,181 (383,641)
Room & Board Spring 2,663,178 2,355,308 (307,870)
Bookstore
Total Auxiliary 5,690,000 4,998,489 (691,511)
* FPE: Full Paying Equivalent, i.e. # students at full tuition value
** Summer Sessions charge rates utilized in preceeding Academic Year
VARIANCE
VERMONT STATE COLLEGES
FY18 TUITION & FEES REVENUE MONITORING REPORT -
Lyndon State College12/31/2017
36

Total Board Projection Variance
Actual thru Projected Projected Approved vs Budget Var Total Year FY17 Actual to
Dec 2017 Balance of Total Year Budget Variance > 3% 2017 Actual Projected FY18
2018 2018 2018 Fav/(Unfav) Fav/(Unfav)
REVENUES
Tuition and Fees 8,109 7,179 15,288 16,253 (965) * 16,786 (1,498)
State Appropriations 2,732 2,733 5,465 5,465 - 4,915 550
Room & Board 2,643 2,355 4,998 5,690 (692) * 5,415 (417)
Sales and Services 545 338 883 838 45 * 893 (10)
Gifts 86 53 139 139 - 212 (73)
Other Revenue 290 7 297 144 153 * 356 (59)
TOTAL REVENUES 14,405 12,665 27,070 28,529 (1,459) 28,577 (1,507)
EXPENSES
Employee Wages and Benefits 8,140 8,208 16,348 16,584 236 16,372 24
Services, Supplies and Travel 2,465 3,592 6,057 6,353 296 * 5,996 (61)
Scholarships and Fellowships 1,313 1,182 2,495 2,406 (89) * 2,256 (239)
Utilities 335 791 1,126 1,325 199 * 966 (160)
Other Expenses - - - - - - -
Debt Service 668 666 1,334 1,334 - 1,731 397
Chancellor's Office 740 740 1,480 1,480 - 1,420 (60)
Other Transfers (635) 82 (553) (393) 160 * 40 593
TOTAL EXPENSES 13,026 15,261 28,287 29,089 802 28,781 494
NET REVENUES 1,379 (2,596) (1,217) (560) (657) (204) (1,013)
NON-RECURRING ITEMS
Carry-Forward - - -
Strategic Reserve - 1,217 560
All Other (1,379) 2,596 - - 204
TOTAL (must equal zero) - - - - -
Vermont State Colleges
LyndonState College
For the Quarter Ending December 31, 2017
Budget vs Actual Report
(Amounts rounded to 1,000's)
37
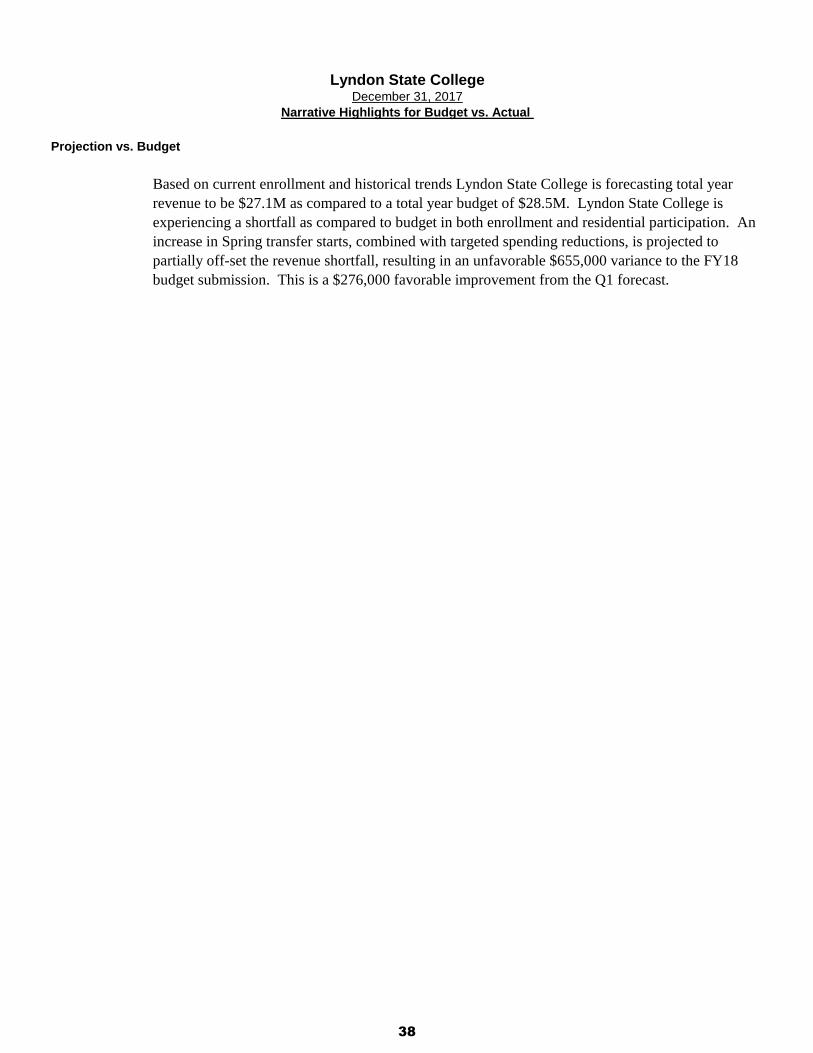
Projection vs. Budget
Based on current enrollment and historical trends Lyndon State College is forecasting total year
revenue to be $27.1M as compared to a total year budget of $28.5M. Lyndon State College is
experiencing a shortfall as compared to budget in both enrollment and residential participation. An
increase in Spring transfer starts, combined with targeted spending reductions, is projected to
partially off-set the revenue shortfall, resulting in an unfavorable $655,000 variance to the FY18
budget submission. This is a $276,000 favorable improvement from the Q1 forecast.
Lyndon State CollegeDecember 31, 2017
Narrative Highlights for Budget vs. Actual
38

BUDGETED ACTUAL/ESTIMATED
Rate FPE* Revenue FPE* Revenue FPE* Revenue
FALL 2017 (Semester)
Vermonter 6,756 1,274 $8,609,611 1,244 $8,406,970 (30) ($202,641)
Non-Vrmtr (o/s) 12,912 92 1,182,165 89 $1,154,341 (2) ($27,824)
NEBHE ($6,696 net) 12,912 125 1,617,847 122 $1,579,769 (3) ($38,078)
Other - 0 $0
Grad Vermonter 6,336 - 0 0 $0
Grad Non- Vermonter 13,914 - 0 0 $0
Total 1,491 $11,409,624 1,456 11,141,080 (35) (268,544)
SPRING 2018 (Semester)
Vermonter 6,756 1,096 $7,405,814 1,070 $7,231,506 (26) ($174,308)
Non-Vrmtr (o/s) 12,912 87 1,123,057 85 1,096,624 (2) ($26,433)
NEBHE ($6,984 net) 12,912 112 1,441,769 109 1,407,834 (3) ($33,935)
Other - 0 $0
Grad Vermonter 6,336 - 0 0 $0
Grad Non- Vermonter 13,914 - 0 0 $0
Total 1,295 $9,970,639 1,264 $9,735,964 (30) ($234,675)
SUMMER SESSIONS I. (J/Aug) **
Vermonter 6,228 11 66,324$ 10 $64,763 (0) ($1,561)
Non-Vrmtr (o/s) 11,916 - 0 0 $0
NEBHE 11,916 - 0 0 $0
Grad Vermonter - 0 $0
Grad Non- Vermonter - 0 $0
Total 11 66,324 10 64,763 (0) (1,561)
SUMMER SESSIONS II> (May/J) **
Vermonter 6,756 125 842,348$ 122 $822,522 (3) ($19,826)
Non-Vrmtr (o/s) 12,912 - 0 0 $0
NEBHE 12,912 7 95,187 7 92,947 (0) ($2,240)
Grad Vermonter - 0 $0
Grad Non- Vermonter - 0 $0
Total 132 $937,535 129 $915,469 (3) ($22,066)
FY 2018 TOTAL (Acad Yr) (Avg)
Fall & Spring
Vermonter 13,512 1,185 $16,015,425 1,157 $15,638,476 (28) ($376,949)
Non-Vrmtr (o/s) 25,824 89 $2,305,222 87 $2,250,965 (2) ($54,257)
NEBHE 25,824 118 $3,059,616 116 $2,987,603 (3) ($72,013)
Other - $0 0
Grad Vermonter - $0 0 $0 0 $0
Grad Non- Vermonter - $0 0 $0 0 $0
S/T 1,393 $21,380,263 1,360 $20,877,044 (33) ($503,219)
Summer Sessions (annualized) 71 1,003,859 70 $980,232 (2) (23,627)
Total Student Tuition 1,464 $22,384,122 1,430 $21,857,276 (33) ($526,846)
Student Fees 3,630,366 3,544,919 (85,447)
Total Tution and Fees $26,014,488 $25,402,195 ($612,293)
Less: Waivers (1,206,488) (1,178,091) 28,397
Total Net Tuition & Fees $24,808,000 $24,224,104 ($583,896)
Auxiliary:
Room & Board Fall 2,014,530 2,130,939 116,409
Room & Board Spring 1,786,470 1,889,701 103,231
Bookstore
Total Auxiliary 3,801,000 4,020,640 219,640
* FPE: Full Paying Equivalent, i.e. # students at full tuition value
** Summer Sessions charge rates utilized in preceeding Academic Year
VERMONT STATE COLLEGES
FY18 TUITION & FEES REVENUE MONITORING REPORT -
Vermont Technical College12/31/2017
VARIANCE
39

Total Board Projection Variance
Actual thru Projected Projected Approved vs Budget Var Total Year FY17 Actual to
Dec 2017 Balance of Total Year Budget Variance > 3% 2017 Actual Projected FY18
2018 2018 2018 Fav/(Unfav) Fav/(Unfav)
REVENUES
Tuition and Fees 12,120 12,104 24,224 24,808 (584) 23,595 629
State Appropriations 3,311 3,086 6,397 6,397 - 5,850 547
Room & Board 2,064 1,957 4,021 3,801 220 * 3,873 148
Sales and Services 622 529 1,151 1,178 (27) 1,224 (73)
Gifts 41 59 100 100 - 365 (265)
Other Revenue 276 137 413 397 16 * 619 (206)
TOTAL REVENUES 18,434 17,872 36,306 36,681 (375) 35,526 780
EXPENSES
Employee Wages and Benefits 11,133 11,496 22,629 23,356 727 * 22,145 (484)
Services, Supplies and Travel 3,449 4,197 7,646 7,646 - 7,505 (141)
Scholarships and Fellowships 844 703 1,547 1,098 (449) * 1,190 (357)
Utilities 433 863 1,296 1,295 (1) 1,132 (164)
Other Expenses - - - - - - -
Debt Service 648 647 1,295 1,516 221 * 1,741 446
Chancellor's Office 740 740 1,480 1,480 - 1,420 (60)
Other Transfers (1,079) 766 (313) (390) (77) * (827) (514)
TOTAL EXPENSES 16,168 19,412 35,580 36,001 421 34,306 (1,274)
NET REVENUES 2,266 (1,540) 726 680 46 1,220 (494)
NON-RECURRING ITEMS
Carry-Forward -
Strategic Reserve - (680)
All Other (2,266) 1,540 (726) - (1,220)
TOTAL (must equal zero) - - - - -
Vermont State Colleges
Vermont Technical College
For the Quarter Ending December 31, 2017
Budget vs Actual Report
(Amounts rounded to 1,000's)
40
Total Board Projection Variance
Actual thru Projected Projected Approved vs Budget Var Total Year FY17 Actual to
Dec 2017 Balance of Total Year Budget Variance > 3% 2017 Actual Projected FY18
2018 2018 2018 Fav/(Unfav) Fav/(Unfav)
REVENUES
Tuition and Fees - - - - -
State Appropriations 214 214 428 428 - 428 -
Room & Board - - - - -
Sales and Services 237 364 601 724 (123) * 632 (31)
Gifts - - - - -
Other Revenue 4 12 16 - 16 7 9
TOTAL REVENUES 455 590 1,045 1,152 (107) 1,067 (22)
EXPENSES
Employee Wages and Benefits 403 438 841 976 135 * 903 62
Services, Supplies and Travel 312 312 624 671 47 * 618 (6)
Scholarships and Fellowships - - - - - -
Utilities - - - - - -
Other Expenses - 3 3 - (3) - (3)
Debt Service - - - - - -
Chancellor's Office - - - - - -
Other Transfers (197) (235) (432) (495) (63) * (591) (159)
TOTAL EXPENSES 518 518 1,036 1,152 116 930 (106)
NET REVENUES (63) 72 9 - 9 137 (128)
NON-RECURRING ITEMS
Carry-Forward -
Strategic Reserve -
All Other 63 (72) (9) - (137)
TOTAL (must equal zero) - - - - -
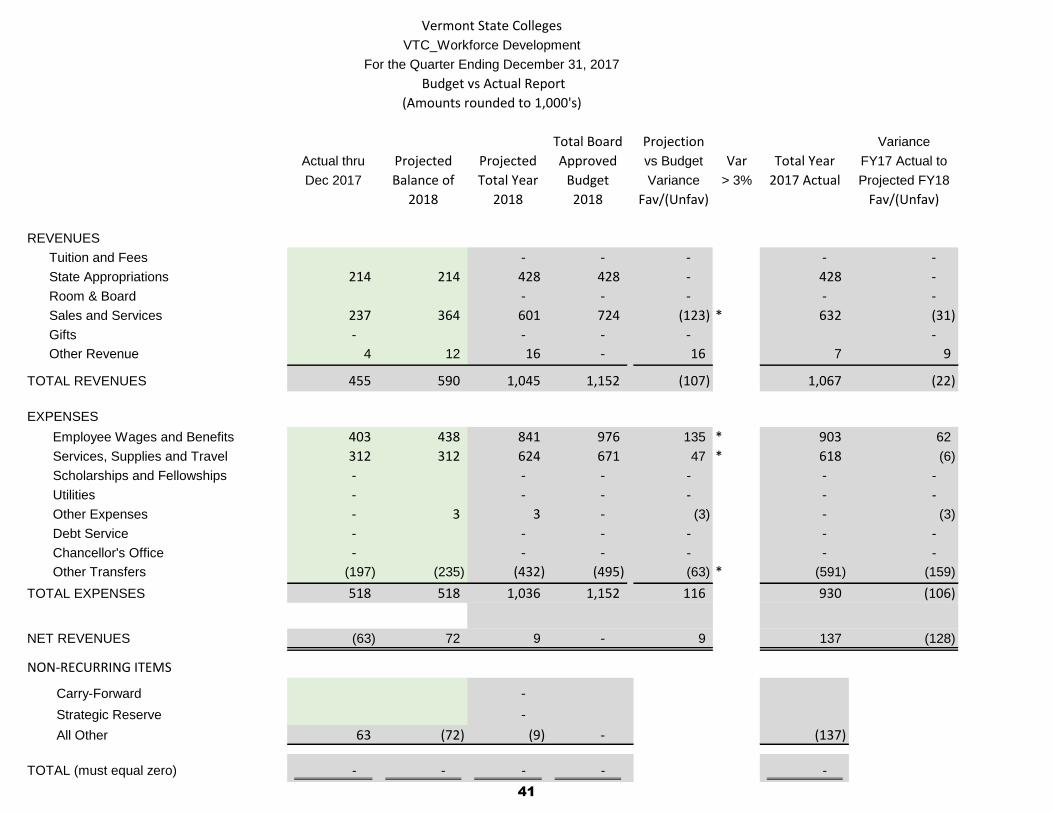
Vermont State Colleges
VTC_Workforce Development
For the Quarter Ending December 31, 2017
Budget vs Actual Report
(Amounts rounded to 1,000's)
41

Projection vs. Budget
Vermont Technical College projects to close the fiscal year with an operating surplus of $726,000, compared to a
budget of $680,000. The most significant drivers of this slightly favorable variance are the balancing effects of: (1) an
overall decline in enrollment; and (2) a significant decrease in group insurance costs due to excellent enrollment in the
Healthy Saver high deductible plan. With continued economic diligence on the part of the College, VTC still projects to
close the year with positive net revenue.
Tuition & Fees: Enrollment revenue is down approximately 2.4% from budget, caused by an overall enrollment decline (we had budgeted for an increase of 0.9%).
YTD VarianceRoom & board: Residential enrollment was budgeted do decline by 5% (a net revenue decrease of 2%, inclusive of a 3% rate increase). Residential enrollment has actually increased modestly. We approximately 5.8% better than budget for FY18.
FA: We're seeing an increased "take rate" on scholarships, in particular, those designed to attract students through our Beyer-recommended Vertical Marketing and Transfer Students initiatives. Costs up ~30% over budget.
Wages & Benefits. Group insurance cost is significantly down from budget (~$450,000) due to better than
expected enrollment in high deductible plans.
Debt service: Variance reflect the restructuring of operating debt repayment, following the closing of VIT's books.
Vermont Technical CollegeDecember 31, 2017
Narrative Highlights for Budget vs. Actual
42
Total Board Projection Variance
Actual thru Projected Projected Approved vs Budget Var Total Year FY17 Actual to
Dec 2017 Balance of Total Year Budget Variance > 3% 2017 Actual Projected FY18
2018 2018 2018 Fav/(Unfav) Fav/(Unfav)
REVENUES
Tuition and Fees - - - - -
State Appropriations 125 125 250 250 - - 250
Room & Board - - - - -
Sales and Services - - - -
Gifts - - - - - -
Other Revenue - - - - - -
TOTAL REVENUES 125 125 250 250 - - 250
EXPENSES
Employee Wages and Benefits 2,167 1,936 4,103 4,267 164 * 4,169 66
Services, Supplies and Travel 2,563 879 3,442 3,070 (372) * 3,131 (311)
Scholarships and Fellowships - - - -
Utilities 15 54 69 63 (6) * 73 4
Other Expenses 250 250 250 - - (250)
Debt Service - - - - - -
Chancellor's Office (3,700) (3,700) (7,400) (7,400) - (7,100) 300
Other Transfers - - - - -
TOTAL EXPENSES 1,045 (581) 464 250 (214) 273 (191)
NET REVENUES (920) 706 (214) - (214) (273) 59
NON-RECURRING ITEMS
Carry-Forward -
Strategic Reserve -
All Other 920 (706) 214 - 273
TOTAL (must equal zero) - - - - -
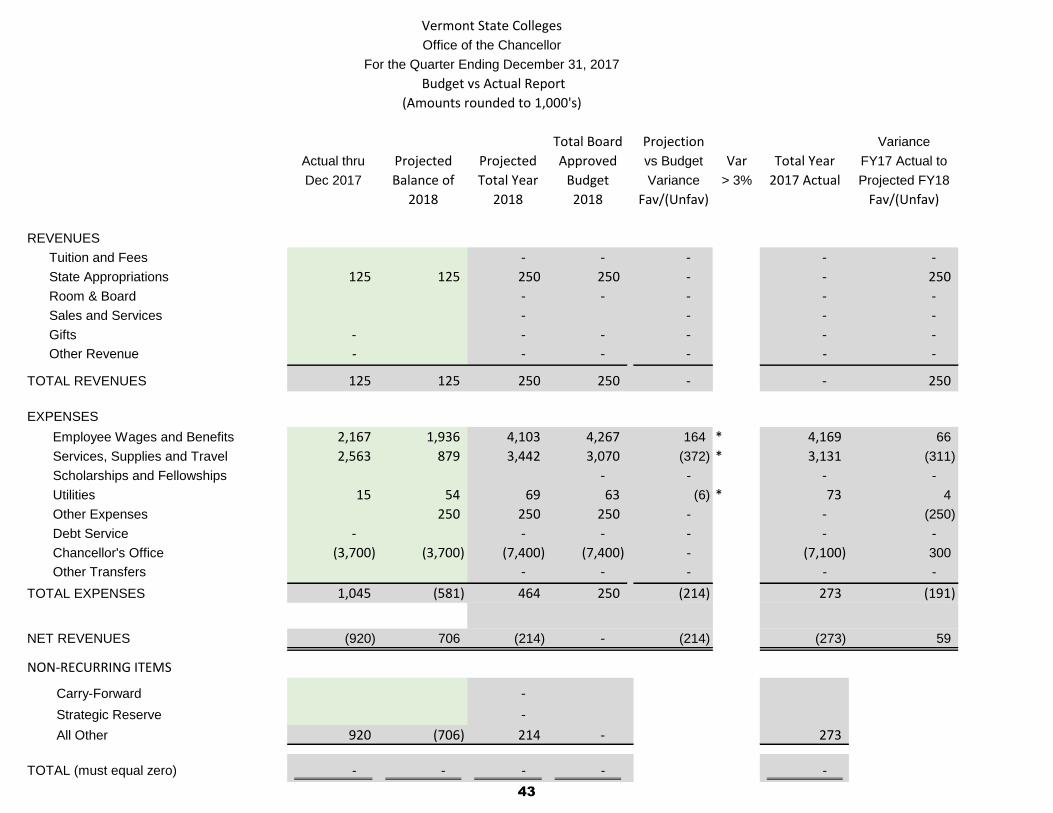
Vermont State Colleges
Office of the Chancellor
For the Quarter Ending December 31, 2017
Budget vs Actual Report
(Amounts rounded to 1,000's)
43

Item 4: February 1 Admissions Summary
44

% of Fall 2017
Fall 2018 Fall 2017 Year-to-year Total from Total rec'd
from 2/1/18 from 2/1/17 % Change Fall 2017 by 2/1/17
Applications
Castleton University 1,745 1,903 -8% 2,670 71%
Northern Vermont University 1,608 1,946 -17% 3,183 61%
Johnson State College 772 837 -8% 1,584 53%
Lyndon State College 836 1,109 -25% 1,599 69%
Vermont Technical College 1,262 1,010 25% 1,756 58%
Total 4,615 4,859 -5% 7,609 64%
Acceptances
Castleton University 1,403 1,245 13% 2,172 57%
Northern Vermont University 990 1,411 -30% 2,601 54%
Johnson State College 478 609 -22% 1,322 46%
Lyndon State College 512 802 -36% 1,279 63%
Vermont Technical College 558 378 48% 1,037 36%
Total 2,951 3,034 -3% 5,810 52%
Deposits
Castleton University 32 36 -11% 595 6%
Northern Vermont University 55 92 -40% 857 11%
Johnson State College 22 37 -41% 512 7%
Lyndon State College 33 55 -40% 345 16%
Vermont Technical College 37 34 9% 659 5%
Total 124 162 -23% 2,111 8%
Enrolled
Castleton University 0 0 N/A 582 0%
Northern Vermont University 0 0 N/A 780 0%
Johnson State College 0 0 N/A 470 0%
Lyndon State College 0 0 N/A 310 0%
Vermont Technical College 0 0 N/A 620 0%
Total 0 0 N/A 1,982 0%
Summer 2017
Summer 2018 Summer 2017 Year-to-year Total from Total rec'd
from 2/1/18 from 2/1/17 % Change Summer 2017 by 2/1/17
Community College of Vermont
Applications 377 354 6%
Acceptances 169 156 8%
Enrolled 0 0 N/A
Vermont State Colleges System
February 1, 2018 vs. Prior YearWeekly Admissions Comparison
PLEASE NOTE: DIFFERENCES FROM PRIOR YEAR MAY BE DUE TO SYSTEMIC, PROCESS AND
TECHNOLOGY ENHANCEMENTS IMPLEMENTED THIS YEAR
45

Item 5: Historical Enrollment and Demographic Data
46

Historical Data from 2001-2017
February 12, 2018
47

FTE enrollment peaked in 2010 with the “echo boom”
• Five debt issuances totalling $152 million in the lead-up to peak 2010 FTEs
• Physical infrastructure built for 20% more FTEs than currently in System
0
2,000
4,000
6,000
8,000
10,000
Fall 2001 Fall 2002 Fall 2003 Fall 2004 Fall 2005 Fall 2006 Fall 2007 Fall 2008 Fall 2009 Fall 2010 Fall 2011 Fall 2012 Fall 2013 Fall 2014 Fall 2015 Fall 2016 Fall 2017
Full Time Equivalent Enrollment, Fall 2001 to 2017
Castleton University Johnson State College Lyndon State College Vermont Tech Community College of VT
$5.2mm TD Loan
$72mm TD Loan
$2.75mm TD Loan
$41.4mm Bonds
$30.9mm Bonds
48
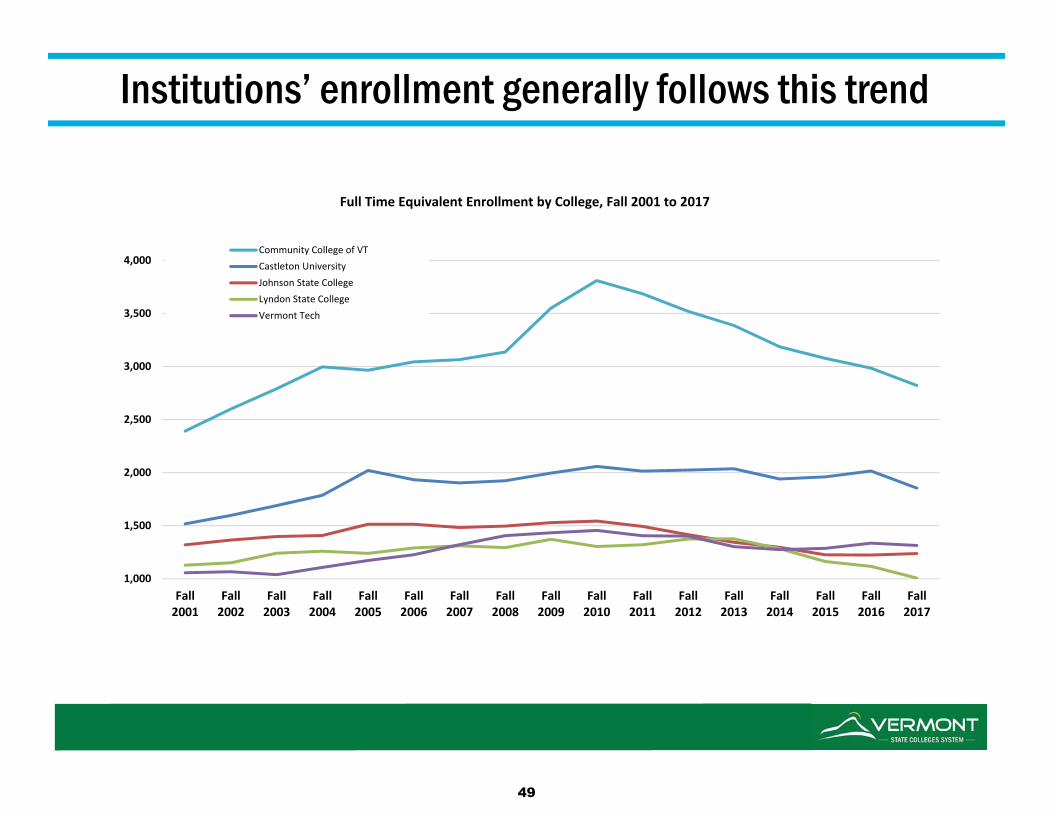
Institutions’ enrollment generally follows this trend
1,000
1,500
2,000
2,500
3,000
3,500
4,000
Fall2001
Fall2002
Fall2003
Fall2004
Fall2005
Fall2006
Fall2007
Fall2008
Fall2009
Fall2010
Fall2011
Fall2012
Fall2013
Fall2014
Fall2015
Fall2016
Fall2017
Full Time Equivalent Enrollment by College, Fall 2001 to 2017
Community College of VTCastleton UniversityJohnson State CollegeLyndon State CollegeVermont Tech
49

Enrollment is also shifting from full to part time
49%
52%50%
53%50%
48% 48% 47% 47% 48% 49% 49% 50%52% 52% 52%
57%
0%
10%
20%
30%
40%
50%
60%
0
1,000
2,000
3,000
4,000
5,000
6,000
7,000
8,000
Fall2001
Fall2002
Fall2003
Fall2004
Fall2005
Fall2006
Fall2007
Fall2008
Fall2009
Fall2010
Fall2011
Fall2012
Fall2013
Fall2014
Fall2015
Fall2016
Fall2017
Full vs. Part Time, Fall 2001 to 2017
Part Time Full Time % Part Time
• Part time enrollment has risen from 47% of total in 2010 to 57% in 2017
• Online delivery exacerbates this trend, negative for room & board revenue
50

Vermont’s demographics difficult for foreseeable future
• Vermont‘s 2016 birthrate is the lowest since the Civil War
• Demographics of New England and Northeast similarly challenged
Vermont Live Births, 1920 to 2015
10,000
9,000
8,000
7,000
6,000
5,000
2000 to 2015 births are the 2018 to 2033 18‐year‐olds
51

System’s geographic market has been very stable
• Competing colleges in region facing the same demographic challenge
• Almost all public college competitors are better-funded and resourced
0%
10%
20%
30%
40%
50%
60%
70%
80%
90%
100%
Fall2001
Fall2002
Fall2003
Fall2004
Fall2005
Fall2006
Fall2007
Fall2008
Fall2009
Fall2010
Fall2011
Fall2012
Fall2013
Fall2014
Fall2015
Fall2016
Fall2017
Students by Geographic Region
Vermont
Other New England
Mid‐Atlantic
Other U.S.
International
52
Item 6: Preliminary FY2019-21 Budget Projections
[provided at meeting]
53
Item 7: Memorandum from Fossil Free VSC
54
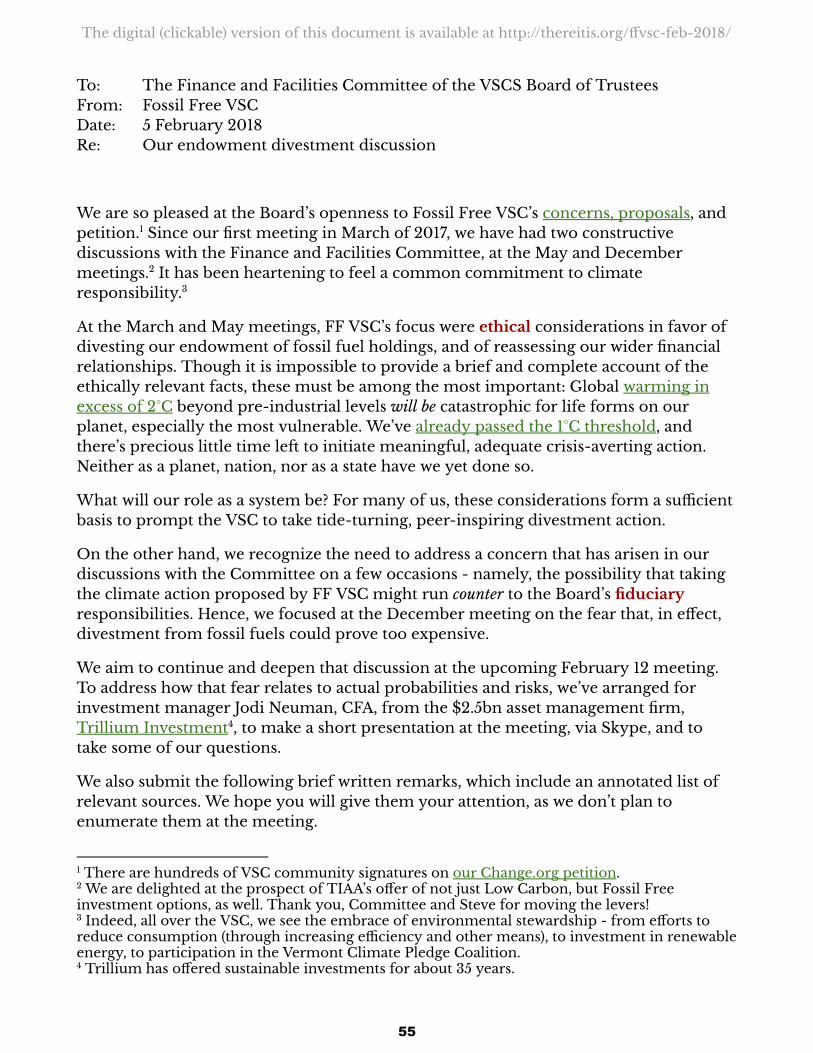
The digital (clickable) version of this document is available at http://thereitis.org/ffvsc-feb-2018/
To: The Finance and Facilities Committee of the VSCS Board of Trustees From: Fossil Free VSC Date: 5 February 2018 Re: Our endowment divestment discussion
We are so pleased at the Board’s openness to Fossil Free VSC’s concerns, proposals , and petition. Since our first meeting in March of 2017, we have had two constructive 1
discussions with the Finance and Facilities Committee, at the May and December meetings. It has been heartening to feel a common commitment to climate 2
responsibility. 3
At the March and May meetings, FF VSC’s focus were ethical considerations in favor of divesting our endowment of fossil fuel holdings, and of reassessing our wider financial relationships. Though it is impossible to provide a brief and complete account of the ethically relevant facts, these must be among the most important: Global warming in excess of 2°C beyond pre-industrial levels will be catastrophic for life forms on our planet, especially the most vulnerable. We’ve already passed the 1°C threshold , and there’s precious little time le� to initiate meaningful, adequate crisis-averting action. Neither as a planet, nation, nor as a state have we yet done so.
What will our role as a system be? For many of us, these considerations form a sufficient basis to prompt the VSC to take tide-turning, peer-inspiring divestment action.
On the other hand, we recognize the need to address a concern that has arisen in our discussions with the Committee on a few occasions - namely, the possibility that taking the climate action proposed by FF VSC might run counter to the Board’s fiduciary responsibilities. Hence, we focused at the December meeting on the fear that, in effect, divestment from fossil fuels could prove too expensive.
We aim to continue and deepen that discussion at the upcoming February 12 meeting. To address how that fear relates to actual probabilities and risks, we’ve arranged for investment manager Jodi Neuman, CFA, from the $2.5bn asset management firm, Trillium Investment , to make a short presentation at the meeting, via Skype, and to 4
take some of our questions.
We also submit the following brief written remarks, which include an annotated list of relevant sources. We hope you will give them your attention, as we don’t plan to enumerate them at the meeting.
1 There are hundreds of VSC community signatures on our Change.org petition . 2 We are delighted at the prospect of TIAA’s offer of not just Low Carbon, but Fossil Free investment options, as well. Thank you, Committee and Steve for moving the levers! 3 Indeed, all over the VSC, we see the embrace of environmental stewardship - from efforts to reduce consumption (through increasing efficiency and other means), to investment in renewable energy, to participation in the Vermont Climate Pledge Coalition. 4 Trillium has offered sustainable investments for about 35 years.
55

The digital (clickable) version of this document is available at http://thereitis.org/ffvsc-feb-2018/
Responsible, informed leaders are increasingly concerned that not divestment, but failure to divest , might ultimately prove to be in greater tension with fiduciary responsibilities. How so?
In short, we’re inside a carbon bubble. And unless our assets are fossil free before it 5
pops, our endowment remains vulnerable in proportion to those fossil fuel holdings.
According to the U.N. Intergovernmental Panel on Climate Change (IPCC), “If the world burned all the coal, oil, and natural gas already known to exist and profitably extractable, roughly 3,000 gigatonnes of CO 2 would enter the atmosphere—nearly three times as much as the [IPCC’s] suggested CO 2 budget ” ( Sci. Am . ). It is not yet illegal to 6
explore for more fossil fuel, nor to burn the forbidden ones (e.g., like those derived from the Canadian tar sands in which TD Bank, Wells Fargo, Morgan Stanley, and others are invested).
But if the nations that accepted the Paris Agreement act to fulfill their promise to keep global temperatures below the threshold of crisis, these activities will be prohibited. The Bank of England and other financial organizations express concern that if and when this justice prevails, the value of fossil fuel companies’ holdings will plummet, thus rendering their unburnable carbon-based fuels valueless “stranded assets.”
FF VSC asks the Committee to consider that its fiduciary responsibility might actually require divestment. We recommend these articles and reports to you for your perusal.
● UN chief Antonio Guterres warned in November that continued investment in fossil fuel “does not make financial sense,” and that markets must be “re-oriented away from the counter-productive.”
● The list of institutional divestments at GoFossilFree.org now totals $6.01tr – 15% 7 8
of which is due to educational institutions. (See also New York Times: "Investment Funds Worth Trillions Are Dropping Fossil Fuel Stocks.”)
● Norway took its historic divestment action primarily for fiduciary reasons: “ The world's largest sovereign wealth fund … divest[ed $37 billion] from oil and gas… to make the Norwegian government's wealth less vulnerable to a permanent drop in oil prices.” (Reuters, 11/16/17)
● New York City is citing both ethical and fiduciary reasons for its decision to divest: They’re moving ~$5bn from companies that own fossil fuel reserves, “because,” as Mayor Bill de Blasio put it , “it makes sense for our portfolio – and our planet.”
5 … the analysis of which has been pioneered by the Carbon Tracker Initiative . 6 The journalists at The Guardian put it in terms of these two key numbers:
● 565 gigatons = the amount of CO 2 we can safely release into the atmosphere and still stay below 2°C ● 2,795 gigatons = the amount of CO 2 that would be released if even just existing reserves were burned
7 4 February 2018. 8 That’s up from $5.57tr in December.
56

The digital (clickable) version of this document is available at http://thereitis.org/ffvsc-feb-2018/
● Relatedly, this piece in the Guardian reports that NYC pensions, and 15 of Australia’s top funds, lost $135m and $5.6bn (respectively) during 2014-2015 “because of … fossil fuel holdings.”
● Forbes’ late-2017 profile of green-investor, Lucas White , discusses how to make money while divesting.
● This piece in the Guardian , from 2015, reports that, “Fossil fuel-free funds outperformed conventional ones, analysis shows. Investors who dumped holdings in coal, oil, and gas earned an average return of 1.2% more a year over last five years… according to analysis by the world’s leading stock market index company, MSCI.” ( This more recent discussion in the Financial Times , from mid-2017, cites the same study in a discussion of the divestment trend leading up to Norway’s action.)
Reports
● “Trillion Dollar Transformation: Fiduciary Duty, Divestment, and Fossil Fuels in an Era of Climate Risk” (from the Center for International Environmental Law, 2016)
“A failure to properly consider climate change as a risk factor could result in lawsuits under various theories of liability for breaches of fiduciary duties…. By not adequately accounting for climate risks, public pension fund fiduciaries may be ignoring responsibilities they owe to the beneficiaries of the funds they manage.”
● “The Global Fossil Fuel Divestment and Clean Energy Investment Movement” (from Arabella Advisors, 2016)
“[A]s large private and institutional asset holders recognize the reputational, financial, and legal risks of remaining invested in fossil fuels, divestment has spread to new sectors, including large insurers, pension funds, and banking institutions…. [F]iduciaries who fail to consider climate change risks in their investment analyses and decisions may be at risk of breaching their legal duty as fiduciaries. The emerging view that fiduciary duty may actively compel divestment of fossil fuels has the potential to pressure financial managers and institutions that once argued their fiduciary roles acted as a barrier to consideration of climate risk.”
● “Emerging Research on Climate Change Risk and Fossil-Fuel Divestment” (from Veris Wealth Partners, 2014)
● “Beyond Fossil Fuels: The Investment Case for Fossil Fuel Divestment” (from Impax Asset Management, 2013)
57

The digital (clickable) version of this document is available at http://thereitis.org/ffvsc-feb-2018/
“Fossil Free” actions and commitments are emerging world-wide, as GoFossilFree.org/divestment and Google News demonstrate. They are happening - 9
right now - in towns across Vermont, and in our state legislature, as well. 10
Our hope is that the Vermont State Colleges System will step decisively in the direction of a fossil free future, both for our own good, and in order to help change our planetary trajectory of disaster. 11
Fossil Free VSC, February 2018
9 An irresistible footnote: In December, 2017, when France became the first country on Earth “to ban any new oil exploration licences ...,” it made sure the world knew the name of its official climate plan: #MakeOurPlanetGreatAgain . 10 On February 2, VPR reported that 40 towns around Vermont will consider “Fossil Free resolutions,” calling for an end to new fossil fuel projects and a fast and “just transition to 100% renewable energy for all.” In the Legislature, Rep. Mary Sullivan of Burlington has introduced a bill, H-746, to ban new fossil fuel infrastructure . 11 Bill McKibben’s December, 2017 piece from Rolling Stone is all too relevant here: “Winning Slowly Is the Same as Losing.” Hank Snow’s song, “90 Miles An Hour,” applies here, too, with a vengeance. It’s about an ill-fated love affair:
Warning signs are flying by us / But we pay no heed, Instead of slowing down the pace / We keep pickin' up the speed. Disaster's getting closer every time we meet. Doin' 90 miles an hour down a dead end street.
58

Item 8: Morgan Stanley Presentation
59

Morgan Stanley Consulting Group
Vermont State Colleges
February 12, 2018
60

INVESTING WITH IMPACT 2
The Consulting Group overview
The Consulting Group is an independent arm of Morgan Stanley with a long
history of providing investment consulting advice and services to institutional clients
Deep global resources offered with experienced local service and perspective
KEY BENEFITS
� Over 40 years of experience in the industry advising clients on portfolio
solutions as a fiduciary partner. Local team leaders average over 20 years of
experience.
� Dedicated team of 45+ professionals focused exclusively on due diligence and
investment manager selection for the firm�s investment advisory platform
� Process-driven approach that seeks quality managers and strategies
designed to optimize portfolio return potential in various market environments
� This extensive third-party manager due diligence , including comprehensive
quantitative and qualitative tools used for all manager assessments
� Open architecture approach using external, non-proprietary managers with full
disclosure and transparency of pricing
� Uses insight from the firm�s Global Investment Committee, to integrate asset
allocation and thought leadership into advisory programs
61

INVESTING WITH IMPACT 3
Local relationship team
Carrie Raftery, John Myhre, Tim Candon, Brian Pelkey & Danielle Hogan
Brian A. PelkeySenior Vice President, Financial Advisor
33 Years of investment experience at
Morgan Stanley and its predecessor firms
Focus: Capital Markets, portfolio construction and
Investment Manager Selection
John O. Myhre Vice President, Financial Advisor
28 Years of investment experience at
Morgan Stanley and its predecessor firms
Focus: Portfolio construction, ongoing monitoring,
fiduciary review and board communication
Danielle A. HoganVice President, Financial Advisor
29 years of investment experience at
Morgan Stanley and its predecessor firms
Focus: Reporting and Lead Administrative Contact
Carrie Raftery
Portfolio Associate
17 Years of Industry Experience
Focus: Operations
Timothy Candon, CFP®
Financial Advisor
17 Years Industry Experience
Formerly with Fiduciary Trust Co. of Boston
Focus: Research & Analytics
62

INVESTING WITH IMPACT 4
Consulting Group Manager Due Diligence
45 dedicated analysts
63

INVESTING WITH IMPACT 5
The team conducts rigorous qualitative and quantitative evaluations to develop opinion�based analysis that
is substantiated by conviction level.
Manager Due Diligence & Analysis
Focus List
� Higher level of conviction
� Explicit focus on identifying potential to add value over time
� Intensive due diligence process, generally including on-site visits,
business reviews, etc.
� Detailed reporting, including portfolio and performance analysis
Approved List
� Responsive to client needs and industry trends
� Information on a broad universe of investment managers and
products
� Meets GIMA�s qualitative and quantitative standards
Tactical Opportunities List
� Draws from both the Focus and Approved Lists
� Leverages manager analysis capabilities, as well as capital
markets analysis by the Global Investment Committee (GIC)
� Based on potential short-term performance
���������
TACTICAL OPPORTUNITIES LIST
���� ������
64

INVESTING WITH IMPACT 6
Our Approach: Guided by Our Mutual Fiduciary Obligations
Consulting Group advisors partner with their clients with undivided loyalty and
utmost good faith
� Vermont State Colleges Trustees must discharge their duties solely in the
interest of their institutions and the stakeholders they represent, for the
exclusive purpose of protecting portfolio assets and defraying the associated
expenses
� Morgan Stanley, as your Investment Consultants, have a fundamental
obligation to act in the best interests of their advisory clients and to provide
investment advice in those client�s best interests
65

INVESTING WITH IMPACT 7
No current screening or sensitivity to Environmental, Social or Governance
considerations are part of the portfolio�s management.
Manage the portfolio:
� To maximize long term performance
� For an accepted level of risk
� To best support the educational mission and finances of the Vermont State
Colleges
The portfolio�s structure is built:
� On a core of passive investments (indexing) to gain broad market exposure
at low cost.
� Enhanced by active, positive �alpha� managers to improve risk adjusted
performance. These are in both SMAs and Mutual Funds.
VSC Investment Policy Statement Directives
66

67

68

Large Cap
GrowthLarge Cap Value
Small / Mid
GrowthSmall / Mid Value International
International
Emerging
Domestic and
High Yield Fixed
International
FixedAlternatives Cash Total
% of Total
Portfolio
CG Advisor
I shares Russell 1000 Growth 3,736,697$ 3,736,697$ 13.1%
I shares Russell 1000 Value 2,964,141$ 2,964,141$ 10.4%
I shares Trust S&P Mid Cap 400 35,828$ 35,828$ 0.1%
iShares Russell 2000 233,188$ 233,188$ 466,375$ 1.6%
William Blair Int Growth 1,663,309$ 1,663,309$ 5.8%
Vanguard FTSE Developed Mkts 1,217,186$ 1,217,186$ 4.3%
Oppenheimer Developing Mkts 720,809$ 720,809$ 2.5%
I shares MSCI Emerging Mkts 380,635$ 380,635$ 1.3%
Lazard Emerging Markets 710,251$ 710,251$ 2.5%
Loomis Bond Fund 1,096,371$ 1,096,371$ 3.8%
Vanguard Sh Tm Invt Gr Inv 1,225,772$ 1,225,772$ 4.3%
Vanguard Total Bd Mkt Indx Inv 1,191,782$ 1,191,782$ 4.2%
Blackrock Hi Yield Bond 1,592,791$ 1,592,791$ 5.6%
Guggenheim Total Return Bond 1,204,035$ 1,204,035$ 4.2%
Dreyfus Standish Global Fixed Inc 792,139$ 792,139$ 2.8%
Money Funds 278,309$ 278,309$ 1.0%
Ishares Dj US Real Estate 268,872$ 268,872$ 0.9%
Vanguard REIT ETF 274,249$ 274,249$ 1.0%
Ironwood HF 548,440$ 548,440$ 1.9%
Skybridge HF 507,724$ 507,724$ 1.8%
Anchor 677,713$ 677,713$ 2.4%
Delaware 1,330,401$ 1,330,401$ 4.7%
Clearbridge 917,409$ 755,513$ 472,196$ 553,144$ 135,405$ 2,833,667$ 9.9%
Thomas Partners 906,559$ 1,205,026$ 83,682$ 242,679$ 287,309$ 64,156$ 2,789,411$ 9.8%
Total Fund 5,560,664$ 4,924,680$ 824,894$ 1,706,723$ 4,498,206$ 1,811,696$ 6,310,751$ 792,139$ 1,599,286$ 477,870$ 28,506,910$ 100.00%
Allocation 19.51% 17.28% 2.89% 5.99% 15.78% 6.36% 22.14% 2.78% 5.61% 1.68% 100.00%
Strategic Target Allocation a/o 6.30.11
By Percent 12.00% 12.00% 6.00% 6.00% 17.00% 7.00% 28.00% 4.00% 8.00% 0.00% 100.00%
By Dollar 3,420,829$ 3,420,829$ 1,710,415$ 1,710,415$ 4,846,175$ 1,995,484$ 7,981,935$ 1,140,276$ 2,280,553$ -$ 28,506,910$
Tactical 12.31.17 16% 16% 5% 5% 16% 6% 26% 4% 6% 0% 100%
Operations Account 99,162$ 17,012$ (money funds) 116,174$
Total All Accounts 28,623,085$
Stocks 68%
Alternatives 6%
Fixed Income/Cash 27%
(common stock)
Basic Asset Allocation:
The above summary/prices/quote/statistics have been obtained from sources we believe to be reliable, but we cannot guarantee its accuracy or completeness. Past performance is no guarantee of future results. The information provided in this summary is for illustrative purposes only and does not represent an official statement by the firm. You must refer to your monthly statements for an accurate and complete record of your transactions, holdings & balances. Best efforts have been made to reflect the true values of the figures, but we can not guarantee the accuracy or completeness due to the element of human
error. This is not a binding or legal document. This information is based upon the market value of your account as of the close of business on 12.31.17 and is subject to daily market fluctuation. Morgan Stanley Smith Barney, LLC. Member SIPC. Prepared
by: John O. Myhre, Vice President, Financial Advisor
����������������� �
��������� ���� � ����� ����������
�������� ��� ����
69
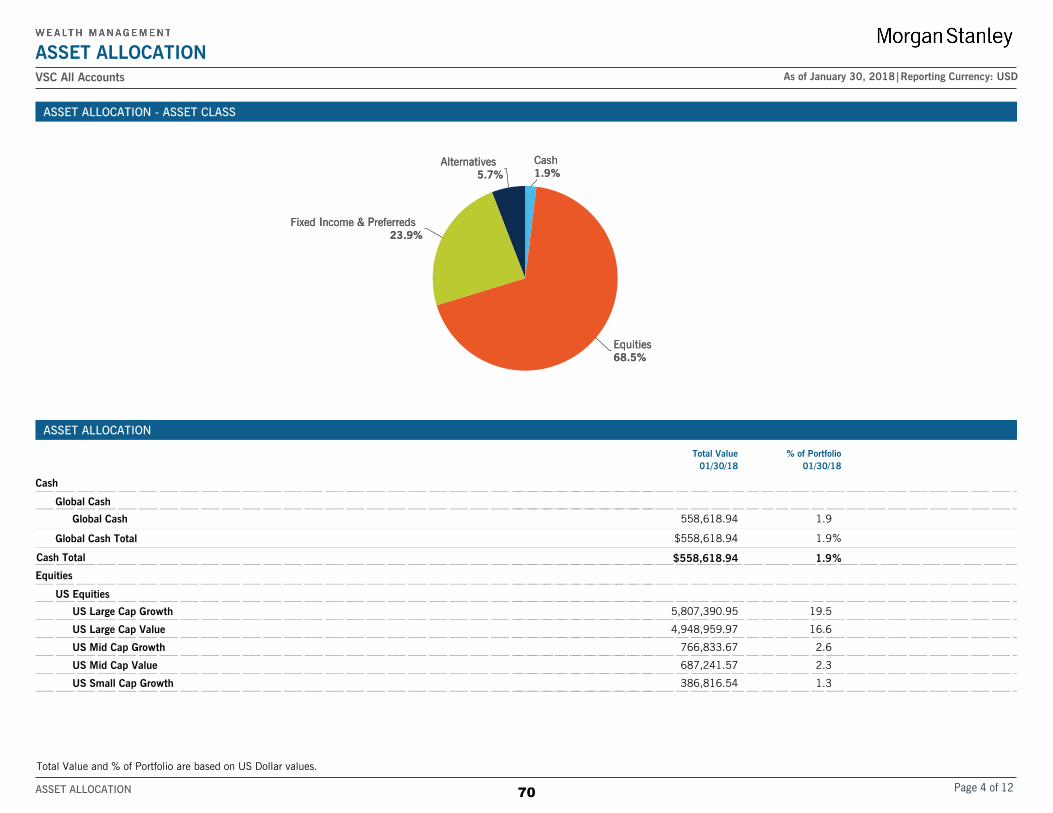
VSC All Accounts
ASSET ALLOCATIONAs of January 30, 2018|Reporting Currency: USD
ASSET ALLOCATION - ASSET CLASS
Cash
1.9%
Equities
68.5%
Fixed Income & Preferreds
23.9%
Alternatives
5.7%
Cash
1.9%
Equities
68.5%
Fixed Income & Preferreds
23.9%
Alternatives
5.7%
ASSET ALLOCATION
Total Value
01/30/18 01/30/18
% of Portfolio
___ ___ ___ ___ ___ ___ ___ ___ ___ ___ ___ ___ ___ ___ ___ ___ ___ ___ ___ ___ ___ ___ ___ ___ ___ ___ ___ ___ ___ ___ ___ ___ ___ ___ __ ___ ___ __ __ __ __ ___ __ ___ ___ ___ ___ ___ ___ ___ ___ ___ _Cash
___ ___ ___ ___ ___ ___ ___ ___ ___ ___ ___ ___ ___ ___ ___ ___ ___ ___ ___ ___ ___ ___ ___ ___ ___ ___ ___ ___ ___ ___ ___ ___ ___ ___ __ ___ ___ __ __ __ __ ___ __ ___ ___ ___ ___ ___ ___ ___ ___ ___ _Global Cash
1.9558,618.94Global Cash
1.9$558,618.94 %Global Cash Total
1.9$558,618.94 %___ ___ ___ ___ ___ ___ ___ ___ ___ ___ ___ ___ ___ ___ ___ ___ ___ ___ ___ ___ ___ ___ ___ ___ ___ ___ ___ ___ ___ ___ ___ ___ ___ ___ ___ ____ ___ ___ ____ ____ ___ ___ ___ ___ ___ ___ ___ ___ ___ __Cash Total
___ ___ ___ ___ ___ ___ ___ ___ ___ ___ ___ ___ ___ ___ ___ ___ ___ ___ ___ ___ ___ ___ ___ ___ ___ ___ ___ ___ ___ ___ ___ ___ ___ ___ __ ___ ___ __ __ __ __ ___ __ ___ ___ ___ ___ ___ ___ ___ ___ ___ _Equities
___ ___ ___ ___ ___ ___ ___ ___ ___ ___ ___ ___ ___ ___ ___ ___ ___ ___ ___ ___ ___ ___ ___ ___ ___ ___ ___ ___ ___ ___ ___ ___ ___ ___ __ ___ ___ __ __ __ __ ___ __ ___ ___ ___ ___ ___ ___ ___ ___ ___ _US Equities
19.55,807,390.95___ ___ ___ ___ ___ ___ ___ ___ ___ ___ ___ ___ ___ ___ ___ ___ ___ ___ ___ ___ ___ ___ ___ ___ ___ ___ ___ ___ ___ ___ ___ ___ ___ ___ __ ___ ___ __ __ __ __ ___ __ ___ ___ ___ ___ ___ ___ ___ ___ ___ _US Large Cap Growth
16.64,948,959.97___ ___ ___ ___ ___ ___ ___ ___ ___ ___ ___ ___ ___ ___ ___ ___ ___ ___ ___ ___ ___ ___ ___ ___ ___ ___ ___ ___ ___ ___ ___ ___ ___ ___ __ ___ ___ __ __ __ __ ___ __ ___ ___ ___ ___ ___ ___ ___ ___ ___ _US Large Cap Value
2.6766,833.67___ ___ ___ ___ ___ ___ ___ ___ ___ ___ ___ ___ ___ ___ ___ ___ ___ ___ ___ ___ ___ ___ ___ ___ ___ ___ ___ ___ ___ ___ ___ ___ ___ ___ __ ___ ___ __ __ __ __ ___ __ ___ ___ ___ ___ ___ ___ ___ ___ ___ _US Mid Cap Growth
2.3687,241.57___ ___ ___ ___ ___ ___ ___ ___ ___ ___ ___ ___ ___ ___ ___ ___ ___ ___ ___ ___ ___ ___ ___ ___ ___ ___ ___ ___ ___ ___ ___ ___ ___ ___ __ ___ ___ __ __ __ __ ___ __ ___ ___ ___ ___ ___ ___ ___ ___ ___ _US Mid Cap Value
1.3386,816.54___ ___ ___ ___ ___ ___ ___ ___ ___ ___ ___ ___ ___ ___ ___ ___ ___ ___ ___ ___ ___ ___ ___ ___ ___ ___ ___ ___ ___ ___ ___ ___ ___ ___ __ ___ ___ __ __ __ __ ___ __ ___ ___ ___ ___ ___ ___ ___ ___ ___ _US Small Cap Growth
Total Value and % of Portfolio are based on US Dollar values.
ASSET ALLOCATION 70

VSC All Accounts
ASSET ALLOCATIONAs of January 30, 2018|Reporting Currency: USD
ASSET ALLOCATION
Total Value
01/30/18 01/30/18
% of Portfolio
1.1323,554.05___ ___ ___ ___ ___ ___ ___ ___ ___ ___ ___ ___ ___ ___ ___ ___ ___ ___ ___ ___ ___ ___ ___ ___ ___ ___ ___ ___ ___ ___ ___ ___ ___ ___ __ ___ ___ __ __ __ __ ___ __ ___ ___ ___ ___ ___ ___ ___ ___ ___ _US Small Cap Value
2.2640,830.01US Equities Other
45.6$13,561,626.76 %___ ___ ___ ___ ___ ___ ___ ___ ___ ___ ___ ___ ___ ___ ___ ___ ___ ___ ___ ___ ___ ___ ___ ___ ___ ___ ___ ___ ___ ___ ___ ___ ___ ___ __ ___ ___ __ __ __ __ ___ __ ___ ___ ___ ___ ___ ___ ___ ___ ___ _US Equities Total
___ ___ ___ ___ ___ ___ ___ ___ ___ ___ ___ ___ ___ ___ ___ ___ ___ ___ ___ ___ ___ ___ ___ ___ ___ ___ ___ ___ ___ ___ ___ ___ ___ ___ __ ___ ___ __ __ __ __ ___ __ ___ ___ ___ ___ ___ ___ ___ ___ ___ _International Equities
0.255,656.00___ ___ ___ ___ ___ ___ ___ ___ ___ ___ ___ ___ ___ ___ ___ ___ ___ ___ ___ ___ ___ ___ ___ ___ ___ ___ ___ ___ ___ ___ ___ ___ ___ ___ __ ___ ___ __ __ __ __ ___ __ ___ ___ ___ ___ ___ ___ ___ ___ ___ _Canadian Equities
4.41,308,476.89___ ___ ___ ___ ___ ___ ___ ___ ___ ___ ___ ___ ___ ___ ___ ___ ___ ___ ___ ___ ___ ___ ___ ___ ___ ___ ___ ___ ___ ___ ___ ___ ___ ___ __ ___ ___ __ __ __ __ ___ __ ___ ___ ___ ___ ___ ___ ___ ___ ___ _European Equities
0.7211,586.66___ ___ ___ ___ ___ ___ ___ ___ ___ ___ ___ ___ ___ ___ ___ ___ ___ ___ ___ ___ ___ ___ ___ ___ ___ ___ ___ ___ ___ ___ ___ ___ ___ ___ __ ___ ___ __ __ __ __ ___ __ ___ ___ ___ ___ ___ ___ ___ ___ ___ _Japan Equities
0.6183,223.94___ ___ ___ ___ ___ ___ ___ ___ ___ ___ ___ ___ ___ ___ ___ ___ ___ ___ ___ ___ ___ ___ ___ ___ ___ ___ ___ ___ ___ ___ ___ ___ ___ ___ __ ___ ___ __ __ __ __ ___ __ ___ ___ ___ ___ ___ ___ ___ ___ ___ _Asia Pac ex Jpn Equities
10.23,039,044.15Intl Equities Other
16.1$4,797,987.64 %___ ___ ___ ___ ___ ___ ___ ___ ___ ___ ___ ___ ___ ___ ___ ___ ___ ___ ___ ___ ___ ___ ___ ___ ___ ___ ___ ___ ___ ___ ___ ___ ___ ___ __ ___ ___ __ __ __ __ ___ __ ___ ___ ___ ___ ___ ___ ___ ___ ___ _International Equities Total
___ ___ ___ ___ ___ ___ ___ ___ ___ ___ ___ ___ ___ ___ ___ ___ ___ ___ ___ ___ ___ ___ ___ ___ ___ ___ ___ ___ ___ ___ ___ ___ ___ ___ __ ___ ___ __ __ __ __ ___ __ ___ ___ ___ ___ ___ ___ ___ ___ ___ _Emerging & Frontier Mkt
0.142,995.04___ ___ ___ ___ ___ ___ ___ ___ ___ ___ ___ ___ ___ ___ ___ ___ ___ ___ ___ ___ ___ ___ ___ ___ ___ ___ ___ ___ ___ ___ ___ ___ ___ ___ __ ___ ___ __ __ __ __ ___ __ ___ ___ ___ ___ ___ ___ ___ ___ ___ _Asia Equities
0.08,036.75___ ___ ___ ___ ___ ___ ___ ___ ___ ___ ___ ___ ___ ___ ___ ___ ___ ___ ___ ___ ___ ___ ___ ___ ___ ___ ___ ___ ___ ___ ___ ___ ___ ___ __ ___ ___ __ __ __ __ ___ __ ___ ___ ___ ___ ___ ___ ___ ___ ___ _Latin America Equities
6.51,943,408.97Emerging Mkt Equities Oth
6.7$1,994,440.76 %Emerging & Frontier Mkt Total
68.5$20,354,055.16 %___ ___ ___ ___ ___ ___ ___ ___ ___ ___ ___ ___ ___ ___ ___ ___ ___ ___ ___ ___ ___ ___ ___ ___ ___ ___ ___ ___ ___ ___ ___ ___ ___ ___ ___ ____ ___ ___ ____ ____ ___ ___ ___ ___ ___ ___ ___ ___ ___ __Equities Total
___ ___ ___ ___ ___ ___ ___ ___ ___ ___ ___ ___ ___ ___ ___ ___ ___ ___ ___ ___ ___ ___ ___ ___ ___ ___ ___ ___ ___ ___ ___ ___ ___ ___ __ ___ ___ __ __ __ __ ___ __ ___ ___ ___ ___ ___ ___ ___ ___ ___ _Fixed Income & Preferreds
___ ___ ___ ___ ___ ___ ___ ___ ___ ___ ___ ___ ___ ___ ___ ___ ___ ___ ___ ___ ___ ___ ___ ___ ___ ___ ___ ___ ___ ___ ___ ___ ___ ___ __ ___ ___ __ __ __ __ ___ __ ___ ___ ___ ___ ___ ___ ___ ___ ___ _Short Term Fixed Income
3.1915,817.84___ ___ ___ ___ ___ ___ ___ ___ ___ ___ ___ ___ ___ ___ ___ ___ ___ ___ ___ ___ ___ ___ ___ ___ ___ ___ ___ ___ ___ ___ ___ ___ ___ ___ __ ___ ___ __ __ __ __ ___ __ ___ ___ ___ ___ ___ ___ ___ ___ ___ _Short Term Govt/Corp
1.0305,272.61Short Term Securitized
4.1$1,221,090.45 %___ ___ ___ ___ ___ ___ ___ ___ ___ ___ ___ ___ ___ ___ ___ ___ ___ ___ ___ ___ ___ ___ ___ ___ ___ ___ ___ ___ ___ ___ ___ ___ ___ ___ __ ___ ___ __ __ __ __ ___ __ ___ ___ ___ ___ ___ ___ ___ ___ ___ _Short Term Fixed Income Total
___ ___ ___ ___ ___ ___ ___ ___ ___ ___ ___ ___ ___ ___ ___ ___ ___ ___ ___ ___ ___ ___ ___ ___ ___ ___ ___ ___ ___ ___ ___ ___ ___ ___ __ ___ ___ __ __ __ __ ___ __ ___ ___ ___ ___ ___ ___ ___ ___ ___ _US Fixed Income Taxable
4.01,177,560.11___ ___ ___ ___ ___ ___ ___ ___ ___ ___ ___ ___ ___ ___ ___ ___ ___ ___ ___ ___ ___ ___ ___ ___ ___ ___ ___ ___ ___ ___ ___ ___ ___ ___ __ ___ ___ __ __ __ __ ___ __ ___ ___ ___ ___ ___ ___ ___ ___ ___ _Intermed Term Govt/Corp
8.52,512,853.48US Taxable Core
12.4$3,690,413.59 %___ ___ ___ ___ ___ ___ ___ ___ ___ ___ ___ ___ ___ ___ ___ ___ ___ ___ ___ ___ ___ ___ ___ ___ ___ ___ ___ ___ ___ ___ ___ ___ ___ ___ __ ___ ___ __ __ __ __ ___ __ ___ ___ ___ ___ ___ ___ ___ ___ ___ _US Fixed Income Taxable Total
___ ___ ___ ___ ___ ___ ___ ___ ___ ___ ___ ___ ___ ___ ___ ___ ___ ___ ___ ___ ___ ___ ___ ___ ___ ___ ___ ___ ___ ___ ___ ___ ___ ___ __ ___ ___ __ __ __ __ ___ __ ___ ___ ___ ___ ___ ___ ___ ___ ___ _Intl Fixed Income
2.0596,857.53Intl Core Fixed Income
2.0$596,857.53 %___ ___ ___ ___ ___ ___ ___ ___ ___ ___ ___ ___ ___ ___ ___ ___ ___ ___ ___ ___ ___ ___ ___ ___ ___ ___ ___ ___ ___ ___ ___ ___ ___ ___ __ ___ ___ __ __ __ __ ___ __ ___ ___ ___ ___ ___ ___ ___ ___ ___ _Intl Fixed Income Total
___ ___ ___ ___ ___ ___ ___ ___ ___ ___ ___ ___ ___ ___ ___ ___ ___ ___ ___ ___ ___ ___ ___ ___ ___ ___ ___ ___ ___ ___ ___ ___ ___ ___ __ ___ ___ __ __ __ __ ___ __ ___ ___ ___ ___ ___ ___ ___ ___ ___ _High Yield Fixed Income
5.41,604,328.03High Yield Fixed Income
Total Value and % of Portfolio are based on US Dollar values.
ASSET ALLOCATION 71

VSC All Accounts
ASSET ALLOCATIONAs of January 30, 2018|Reporting Currency: USD
ASSET ALLOCATION
Total Value
01/30/18 01/30/18
% of Portfolio
5.4$1,604,328.03 %High Yield Fixed Income Total
23.9$7,112,689.60 %___ ___ ___ ___ ___ ___ ___ ___ ___ ___ ___ ___ ___ ___ ___ ___ ___ ___ ___ ___ ___ ___ ___ ___ ___ ___ ___ ___ ___ ___ ___ ___ ___ ___ ___ ____ ___ ___ ____ ____ ___ ___ ___ ___ ___ ___ ___ ___ ___ __Fixed Income & Preferreds Total
___ ___ ___ ___ ___ ___ ___ ___ ___ ___ ___ ___ ___ ___ ___ ___ ___ ___ ___ ___ ___ ___ ___ ___ ___ ___ ___ ___ ___ ___ ___ ___ ___ ___ __ ___ ___ __ __ __ __ ___ __ ___ ___ ___ ___ ___ ___ ___ ___ ___ _Alternatives
___ ___ ___ ___ ___ ___ ___ ___ ___ ___ ___ ___ ___ ___ ___ ___ ___ ___ ___ ___ ___ ___ ___ ___ ___ ___ ___ ___ ___ ___ ___ ___ ___ ___ __ ___ ___ __ __ __ __ ___ __ ___ ___ ___ ___ ___ ___ ___ ___ ___ _Real Assets
1.9551,779.80___ ___ ___ ___ ___ ___ ___ ___ ___ ___ ___ ___ ___ ___ ___ ___ ___ ___ ___ ___ ___ ___ ___ ___ ___ ___ ___ ___ ___ ___ ___ ___ ___ ___ __ ___ ___ __ __ __ __ ___ __ ___ ___ ___ ___ ___ ___ ___ ___ ___ _REITs
0.383,256.90MLP/Energy Infrastructure
2.1$635,036.70 %___ ___ ___ ___ ___ ___ ___ ___ ___ ___ ___ ___ ___ ___ ___ ___ ___ ___ ___ ___ ___ ___ ___ ___ ___ ___ ___ ___ ___ ___ ___ ___ ___ ___ __ ___ ___ __ __ __ __ ___ __ ___ ___ ___ ___ ___ ___ ___ ___ ___ _Real Assets Total
___ ___ ___ ___ ___ ___ ___ ___ ___ ___ ___ ___ ___ ___ ___ ___ ___ ___ ___ ___ ___ ___ ___ ___ ___ ___ ___ ___ ___ ___ ___ ___ ___ ___ __ ___ ___ __ __ __ __ ___ __ ___ ___ ___ ___ ___ ___ ___ ___ ___ _Absolute Return Assets
1.9552,257.87Non-Directional MMgr/FoF
1.9$552,257.87 %___ ___ ___ ___ ___ ___ ___ ___ ___ ___ ___ ___ ___ ___ ___ ___ ___ ___ ___ ___ ___ ___ ___ ___ ___ ___ ___ ___ ___ ___ ___ ___ ___ ___ __ ___ ___ __ __ __ __ ___ __ ___ ___ ___ ___ ___ ___ ___ ___ ___ _Absolute Return Assets Total
___ ___ ___ ___ ___ ___ ___ ___ ___ ___ ___ ___ ___ ___ ___ ___ ___ ___ ___ ___ ___ ___ ___ ___ ___ ___ ___ ___ ___ ___ ___ ___ ___ ___ __ ___ ___ __ __ __ __ ___ __ ___ ___ ___ ___ ___ ___ ___ ___ ___ _Equity Hedge Assets
1.7511,821.71Multi-Manager/FoF
1.7$511,821.71 %Equity Hedge Assets Total
5.7$1,699,116.28 %Alternatives Total
100.0$29,724,479.98 %Total Portfolio
Total Value and % of Portfolio are based on US Dollar values.
ASSET ALLOCATION 72

EQUITIES ASSET ALLOCATIONVSC All Accounts As of January 30, 2018|Reporting Currency: USD
ASSET ALLOCATION - EQUITIES
US Equities
66.6%
International Equities
23.6%
Emerging & Frontier Mkt
9.8%
US Equities
66.6%
International Equities
23.6%
Emerging & Frontier Mkt
9.8%
TOP EQUITY POSITIONS BASED ON TOTAL VALUE
Total Value % ofEquities01/30/18
$3,990,008.45 %19.6ISHARES RUSSELL 1000 GRW ETF___ ___ ___ ___ ___ ___ ___ ___ ___ ___ ___ ___ ___ ___ ___ ___ ___ ___ ___ ___ ___ ___ ___ ___ ___ ___ ___ ___ ___ ___ ___ ___ ___
3,079,522.02 15.1ISHARES RUSSELL 1000 VALUE ETF___ ___ ___ ___ ___ ___ ___ ___ ___ ___ ___ ___ ___ ___ ___ ___ ___ ___ ___ ___ ___ ___ ___ ___ ___ ___ ___ ___ ___ ___ ___ ___ ___
1,761,622.51 8.7WILLIAM BLAIR INTL GROWTH I___ ___ ___ ___ ___ ___ ___ ___ ___ ___ ___ ___ ___ ___ ___ ___ ___ ___ ___ ___ ___ ___ ___ ___ ___ ___ ___ ___ ___ ___ ___ ___ ___
1,277,421.64 6.3VANGUARD FTSE DEVELOPED MKTS E___ ___ ___ ___ ___ ___ ___ ___ ___ ___ ___ ___ ___ ___ ___ ___ ___ ___ ___ ___ ___ ___ ___ ___ ___ ___ ___ ___ ___ ___ ___ ___ ___
775,533.20 3.8OPPENHEIMER DEVELOPING MKTS Y___ ___ ___ ___ ___ ___ ___ ___ ___ ___ ___ ___ ___ ___ ___ ___ ___ ___ ___ ___ ___ ___ ___ ___ ___ ___ ___ ___ ___ ___ ___ ___ ___
759,209.75 3.7LAZARD EMERGING MKTS EQ I___ ___ ___ ___ ___ ___ ___ ___ ___ ___ ___ ___ ___ ___ ___ ___ ___ ___ ___ ___ ___ ___ ___ ___ ___ ___ ___ ___ ___ ___ ___ ___ ___
480,813.62 2.4ISHARES RUSSELL 2000 ETF___ ___ ___ ___ ___ ___ ___ ___ ___ ___ ___ ___ ___ ___ ___ ___ ___ ___ ___ ___ ___ ___ ___ ___ ___ ___ ___ ___ ___ ___ ___ ___ ___
408,666.02 2.0ISHARES MSCI EMERGING MKTS ETF___ ___ ___ ___ ___ ___ ___ ___ ___ ___ ___ ___ ___ ___ ___ ___ ___ ___ ___ ___ ___ ___ ___ ___ ___ ___ ___ ___ ___ ___ ___ ___ ___
278,773.70 1.4UNITEDHEALTH GP INC___ ___ ___ ___ ___ ___ ___ ___ ___ ___ ___ ___ ___ ___ ___ ___ ___ ___ ___ ___ ___ ___ ___ ___ ___ ___ ___ ___ ___ ___ ___ ___ ___
222,200.32 1.1COMCAST CORP (NEW) CLASS A___ ___ ___ ___ ___ ___ ___ ___ ___ ___ ___ ___ ___ ___ ___ ___ ___ ___ ___ ___ ___ ___ ___ ___ ___ ___ ___ ___ ___ ___ ___ ___ ___
$13,033,771.23 64.0%Top Equity Positions
$7,320,283.93 36.0%Other Equity Positions
$20,354,055.16 100.0%Total Equities
ASSET ALLOCATION - EQUITIES
Total Value
% of % of
Portfolio
01/30/18 01/30/18 01/30/18
Equities
66.6 45.6% %$13,561,626.76US Equities___ ___ ___ ___ ___ ___ ___ ___ ___ ___ ___ ___ ___ ___ ___ ___ ___ ___ ___ ___ ___ ___ ___ ___ ___ ___ ___ ___ ___ ___ ___ ___ ___ ___ ___ ___ ___ ___ ___ ___ ___
23.6 16.14,797,987.64International Equities___ ___ ___ ___ ___ ___ ___ ___ ___ ___ ___ ___ ___ ___ ___ ___ ___ ___ ___ ___ ___ ___ ___ ___ ___ ___ ___ ___ ___ ___ ___ ___ ___ ___ ___ ___ ___ ___ ___ ___ ___
9.8 6.71,994,440.76Emerging & Frontier Mkt
100.0% 68.5%$20,354,055.16Total Equities
Total Value, % of Portfolio and % of Equities are based on US Dollar values.
ASSET ALLOCATION 73

FIXED INCOME & PREFERREDS ASSET ALLOCATIONVSC All Accounts As of January 30, 2018|Reporting Currency: USD
ASSET ALLOCATION - FIXED INCOME & PREFERREDS
Short Term Fixed Income
17.2%
US Fixed Income Taxable
51.9%
Intl Fixed Income
8.4%
High Yield Fixed Income
22.6%
Short Term Fixed Income
17.2%
US Fixed Income Taxable
51.9%
Intl Fixed Income
8.4%
High Yield Fixed Income
22.6%
TOP FIXED INCOME & PREFERRED POSITIONS BASED ON TOTAL VALUE
Total Value
% ofFixed Income& Preferreds01/30/18
$1,604,328.03 %22.6BLACKROCK HI YIELD BD PTF INST___ ___ ___ ___ ___ ___ ___ ___ ___ ___ ___ ___ ___ ___ ___ ___ ___ ___ ___ ___ ___ ___ ___ ___ ___ ___ ___ ___ ___ ___ ___ ___ ___
1,221,090.45 17.2VANGUARD SH TM INVT GR INV___ ___ ___ ___ ___ ___ ___ ___ ___ ___ ___ ___ ___ ___ ___ ___ ___ ___ ___ ___ ___ ___ ___ ___ ___ ___ ___ ___ ___ ___ ___ ___ ___
1,198,807.61 16.9GUGGENHEIM TOTAL RETURN BD I___ ___ ___ ___ ___ ___ ___ ___ ___ ___ ___ ___ ___ ___ ___ ___ ___ ___ ___ ___ ___ ___ ___ ___ ___ ___ ___ ___ ___ ___ ___ ___ ___
1,177,560.11 16.6VANGUARD TOTAL BD MKT INDX INV___ ___ ___ ___ ___ ___ ___ ___ ___ ___ ___ ___ ___ ___ ___ ___ ___ ___ ___ ___ ___ ___ ___ ___ ___ ___ ___ ___ ___ ___ ___ ___ ___
1,104,339.17 15.5LOOMIS SAYLES BOND INST___ ___ ___ ___ ___ ___ ___ ___ ___ ___ ___ ___ ___ ___ ___ ___ ___ ___ ___ ___ ___ ___ ___ ___ ___ ___ ___ ___ ___ ___ ___ ___ ___
806,564.23 11.3DREYFUS STANDISH GLB FIX INC I___ ___ ___ ___ ___ ___ ___ ___ ___ ___ ___ ___ ___ ___ ___ ___ ___ ___ ___ ___ ___ ___ ___ ___ ___ ___ ___ ___ ___ ___ ___ ___ ___
$7,112,689.60 100.0% Top Fixed Income & Preferred Positions
- - Other Fixed Income & Preferred Positions
$7,112,689.60 100.0% Total Fixed Income & Preferreds
ASSET ALLOCATION - FIXED INCOME & PREFERREDS
Total Value
% of % of
Portfolio
01/30/18 01/30/18 01/30/18
Fixed Income & Preferreds
17.2 4.1% %$1,221,090.45Short Term Fixed Income___ ___ ___ ___ ___ ___ ___ ___ ___ ___ ___ ___ ___ ___ ___ ___ ___ ___ ___ ___ ___ ___ ___ ___ ___ ___ ___ ___ ___ ___ ___ ___ ___ ___ ___ ___ ___ ___ ___ ___ ___
12.9 3.1915,817.84Short Term Govt/Corp___ ___ ___ ___ ___ ___ ___ ___ ___ ___ ___ ___ ___ ___ ___ ___ ___ ___ ___ ___ ___ ___ ___ ___ ___ ___ ___ ___ ___ ___ ___ ___ ___ ___ ___ ___ ___ ___ ___ ___ ___
4.3 1.0305,272.61Short Term Securitized___ ___ ___ ___ ___ ___ ___ ___ ___ ___ ___ ___ ___ ___ ___ ___ ___ ___ ___ ___ ___ ___ ___ ___ ___ ___ ___ ___ ___ ___ ___ ___ ___ ___ ___ ___ ___ ___ ___ ___ ___
51.9 12.43,690,413.59US Fixed Income Taxable___ ___ ___ ___ ___ ___ ___ ___ ___ ___ ___ ___ ___ ___ ___ ___ ___ ___ ___ ___ ___ ___ ___ ___ ___ ___ ___ ___ ___ ___ ___ ___ ___ ___ ___ ___ ___ ___ ___ ___ ___
16.6 4.01,177,560.11Intermed Term Govt/Corp___ ___ ___ ___ ___ ___ ___ ___ ___ ___ ___ ___ ___ ___ ___ ___ ___ ___ ___ ___ ___ ___ ___ ___ ___ ___ ___ ___ ___ ___ ___ ___ ___ ___ ___ ___ ___ ___ ___ ___ ___
35.3 8.52,512,853.48US Taxable Core___ ___ ___ ___ ___ ___ ___ ___ ___ ___ ___ ___ ___ ___ ___ ___ ___ ___ ___ ___ ___ ___ ___ ___ ___ ___ ___ ___ ___ ___ ___ ___ ___ ___ ___ ___ ___ ___ ___ ___ ___
8.4 2.0596,857.53Intl Fixed Income___ ___ ___ ___ ___ ___ ___ ___ ___ ___ ___ ___ ___ ___ ___ ___ ___ ___ ___ ___ ___ ___ ___ ___ ___ ___ ___ ___ ___ ___ ___ ___ ___ ___ ___ ___ ___ ___ ___ ___ ___
8.4 2.0596,857.53Intl Core Fixed Income___ ___ ___ ___ ___ ___ ___ ___ ___ ___ ___ ___ ___ ___ ___ ___ ___ ___ ___ ___ ___ ___ ___ ___ ___ ___ ___ ___ ___ ___ ___ ___ ___ ___ ___ ___ ___ ___ ___ ___ ___
22.6 5.41,604,328.03High Yield Fixed Income___ ___ ___ ___ ___ ___ ___ ___ ___ ___ ___ ___ ___ ___ ___ ___ ___ ___ ___ ___ ___ ___ ___ ___ ___ ___ ___ ___ ___ ___ ___ ___ ___ ___ ___ ___ ___ ___ ___ ___ ___
22.6 5.41,604,328.03High Yield Fixed Income
100.0% 23.9%$7,112,689.60Total Fixed Income & Preferreds
Total Value, % of Portfolio and % of Fixed Income and Preferreds are based on US Dollar values.
ASSET ALLOCATION 74

VSC All Accounts
TIME WEIGHTED PERFORMANCE SUMMARY - ADVISORY ASSETS ONLYAs of December 31, 2017|Reporting Currency: USD
RETURN % (NET OF FEES) VS. BENCHMARKS
-2%
0%
2%
4%
6%
8%
10%
12%
14%
16%
18%
12/31/15 - 12/30/16 06/30/16 - 06/30/17 06/30/15 - 06/30/16 12/31/12 - 12/31/17 02/27/03 - 12/31/1712/31/16 - 12/31/17
Last 10 Years
12/31/07 - 12/31/17
Performance InceptionLast 5 YearsCustom PeriodCustom PeriodPrevious YearYear to Date
Beginning Total Value $2,759,923.00$16,477,014.59$19,266,288.40$23,399,223.71$23,493,810.71$22,687,417.15$24,642,576.28
184,475.20 185,418.31 12,730.35 -477,020.24 -526,416.80 8,055,411.37Net Contributions/Withdrawals 11,463.55
1,770,683.93 2,779,696.21 81,856.64 9,760,271.15 12,598,941.52 17,734,204.94Investment Earnings 3,895,499.48
Ending Total Value $28,549,539.30$28,549,539.30$28,549,539.30$23,493,810.71$26,458,925.22$24,642,576.28$28,549,539.30
Return % (Net of Fees) 15.81 7.85 11.83 0.35 8.71 5.77 7.69
65% MSCI AC World/35% Barclays Agg 16.45 6.17 11.77 -0.16 7.81 4.77 7.91
Inception dates for advisory account(s) reflect the most recent advisory program or discretion change.
The investment returns shown on this page are time-weighted measurements which exclude the effect of the timing and amount of your contributions and withdrawals.
PERFORMANCE 75

76
77
78

Morgan Stanley’s approach and resources.
Discussion of considering changes to
the investment portfolio to respond to
Environmental, Social and
Governance Issues
79

INVESTING WITH IMPACT 9
ESG “Investing with Impact” STRATEGIES
150+ Investment Strategies
• In concert with the due diligence and research of the
Consulting Group a wide variety of non-proprietary
investment options are available.
50+ Investment Companies
• Names like Blackrock, Ariel, Calvert, Parnassus, Pax
World, TIAA, Apereo, Eaton Vance, Trillium, State Street,
and Clearbridge.
Including the Opportunity for Screened Indices
• To obtain value driven investments in broadly exposed
markets at lower cost.
Bringing value to “mission-based” investing
80

INVESTING WITH IMPACT 10
A Road Map for Investing with Impact Success
ARTICULATE INVESTING WITH IMPACT GOALS
ASSESS EXISTING PORTFOLIO IMPACT
ALIGNMENT
DEFINE STRATEGY; INTEGRATING
FINANCIAL AND IMPACT GOALS
IMPLEMENT PORTFOLIO APPROACH
MONITOR IMPACT AND FINANCIAL
RESULTS; REVISE OR EXPAND
STRATEGY
81

INVESTING WITH IMPACT 11
Integrating Mission Driven Investing
82

INVESTING WITH IMPACT 12
• Fossil fuel company screening can include indicators affecting carbon footprint, non-
sustainable energy resources and climate change. Using data from multiple sources
including MSCI we can screen for:
– Carbon Emissions Intensity. Companies with reported or estimated greenhouse gasses
greater than 3,000 tons CO2 per million.
– Oil Sands Reserves. Companies that have evidence of owning oil sands reserves
– Shale Oil & Gas Reserves. Companies that have evidence of owning shale gas and/or shale
oil reserves.
– Thermal Coal Reserves. Companies that have evidence of owning thermal coal assets.
Fossil Fuel Screening and Scoring
83

INVESTING WITH IMPACT 13
• ESG scoring/screening ranks companies on a percentile basis within their
global peer group on a broad range of ESG indicators. This eliminates some
from investment consideration and increases the attractiveness of others.
Criteria include:
– Multiple Environmental considerations including contributions to climate
change, energy efficiency, air and water pollution and waste generation and
management.
– Social Issues such as corporate accountability, workplace safety, diversity,
training, product safety, responsible marketing, human rights, community
and social investment.
– Governance considerations such as transparency, independence and lack
of conflicts, fair compensation and shareholder rights.
Companies receive an ESG score relative to a peer group defined by
Sustainalytics’ industry classification system.
ESG Screening and Scoring
84
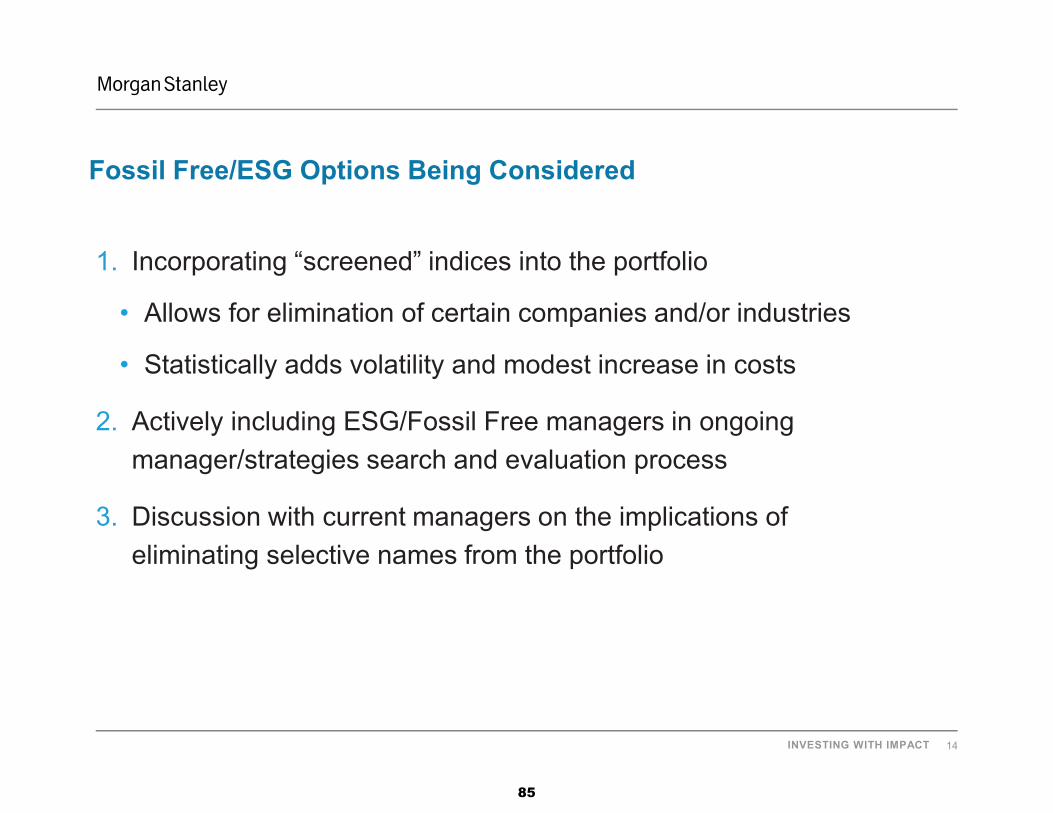
INVESTING WITH IMPACT 14
1. Incorporating “screened” indices into the portfolio
• Allows for elimination of certain companies and/or industries
• Statistically adds volatility and modest increase in costs
2. Actively including ESG/Fossil Free managers in ongoing
manager/strategies search and evaluation process
3. Discussion with current managers on the implications of
eliminating selective names from the portfolio
Fossil Free/ESG Options Being Considered
85
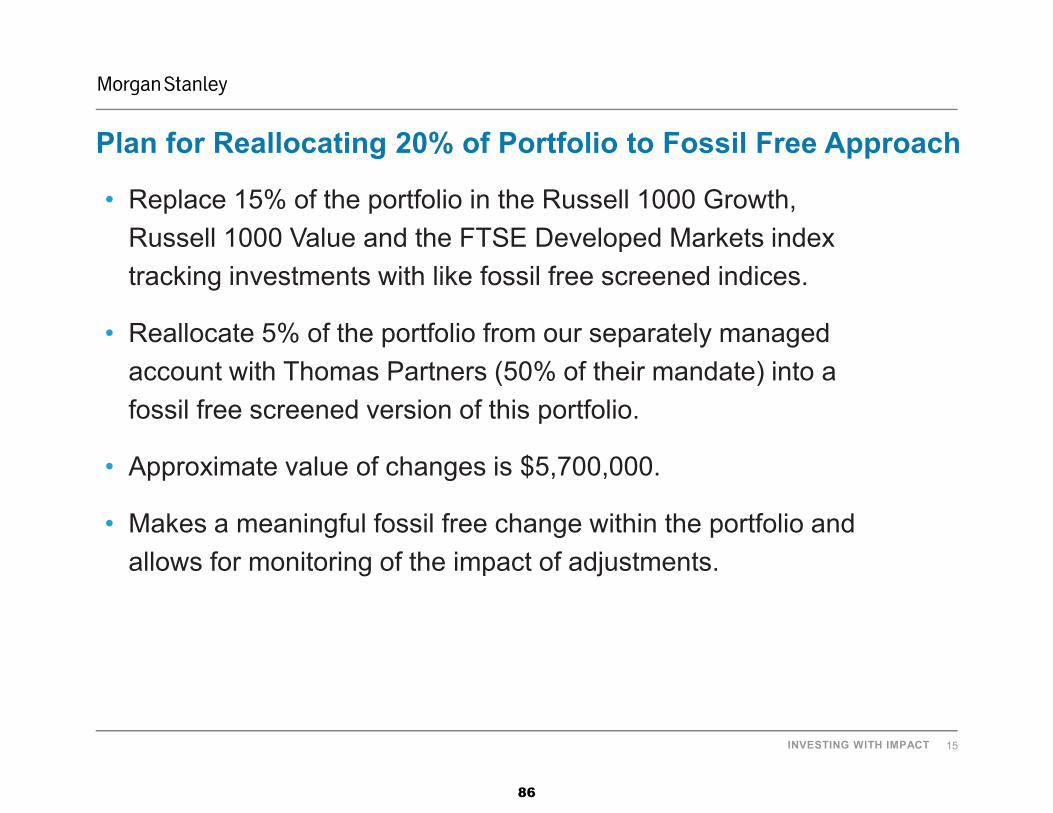
INVESTING WITH IMPACT 15
• Replace 15% of the portfolio in the Russell 1000 Growth,
Russell 1000 Value and the FTSE Developed Markets index
tracking investments with like fossil free screened indices.
• Reallocate 5% of the portfolio from our separately managed
account with Thomas Partners (50% of their mandate) into a
fossil free screened version of this portfolio.
• Approximate value of changes is $5,700,000.
• Makes a meaningful fossil free change within the portfolio and
allows for monitoring of the impact of adjustments.
Plan for Reallocating 20% of Portfolio to Fossil Free Approach
86

Item 9: Memorandum from CFO and
Redlined Investment Policy Statement
87
CASTLETON UNIVERSITY OFFICE OF THE CHANCELLOR COMMUNITY COLLEGE OF VERMONT PO BOX 7 JOHNSON STATE COLLEGE MONTPELIER, VT 05601 LYNDON STATE COLLEGE P (802) 224-3000 VERMONT TECHNICAL COLLEGE F (802) 224-3035
WWW.VSC.EDU [email protected]
MEMORANDUM TO: Chancellor Jeb Spaulding
M. Jerome Diamond J. Churchill Hindes, Chair
Tim Jerman Bill Lippert
Christopher Macfarlane, Vice Chair Linda Milne Michael Pieciak FROM: Steve Wisloski DATE: February 7, 2018 SUBJ: Recommendation Regarding Fossil Fuel Divestment from Endowment
At the Finance and Facilities Committee’s meeting on December 1, 2017, the Committee reviewed a petition from Fossil Free VSC, which included a request to divest the System’s endowment of fossil fuel investments. Fossil Free VSC’s members also requested that low-carbon or fossil fuel free investment alternatives be added to the System’s 403(b) retirement plan. In response to that request, Chancellor’s Office staff reviewed several fund alternatives with TIAA, the System’s 403(b) plan administrator, and plan to add the following funds:
1. TIAA-CREF Social Choice Low Carbon fund (ticker: TNWCX), a large blend domestic
equity fund
2. Pax Global Environmental Markets fund (ticker: PGINX), a global small/mid cap fossil fuel free fund
Staff has also requested low carbon and fossil fuel free bond fund alternatives, and TIAA otherwise has advised us that these funds can be added to the plan within three to four months. These fund choices will enable our plan participants to invest their retirement funds in accordance with their objectives and values.
88

Finance & Facilities Committee Recommendation Regarding Fossil Fuel Divestment from Endowment February 7, 2018 Page 2 Also at that meeting, the Committee members requested further information regarding two possible divestment approaches suggested by Morgan Stanley, the System’s financial advisor, as follows:
Maintain the current structure of the portfolio but remove a list of identifiable specific fossil fuel companies (for example, Exxon, Chevron, etc.)
Convert a portion of the portfolio to sustainable and/or environmental, social and governance (ESG) objectives, and if performance is comparable, then consider growing this allocation over time
Since that meeting, both the Chancellor and I have further investigated fossil fuel investment screening approaches with Morgan Stanley, and determined that the least disruptive strategy combines elements of both of the above approaches. In lieu of targeting specific fossil fuel companies, or allocating a portion of the portfolio to an entirely new strategy, Morgan Stanley determined that they could screen all fossil fuel holdings for several of VSC’s larger passive equity index funds, and determined that active fund manager Thomas Partners is able to screen fossil fuel investments as well. Morgan Stanley will discuss this approach during their presentation to the Committee at the February 12 meeting, and a summary follows:
89

Finance & Facilities Committee Recommendation Regarding Fossil Fuel Divestment from Endowment February 7, 2018 Page 3 In my November 21 memorandum to the Committee, I stated that divestment was “possible to implement, at moderate annual cost and/or greater variability of expected returns.” To assist the committee’s deliberations, I estimated the dollar impact of divesting to be in the range of 0.16% to 0.33% annually, or $44,500 to $91,000 per year. Assuming that screening was limited to 20% of the portfolio, this would correspond to about $9,000 to $18,000 per year. These are estimates and should be expected to vary, perhaps considerably, from the realized outcome. However, as Chief Financial Officer, with a fiduciary responsibility to the System, I recommend against divesting the System’s endowment of fossil fuel investments – to include screening approaches – for the following reasons: 1. By definition, this reduces portfolio diversification, and as such increases the risk associated
with a comparable level of investment return. This is especially true for a market sector such as fossil fuels, which comprises a significant portion of investable assets. Conceptually, divestment is similar to increasing the percentage of the portfolio invested in stocks vs. bonds, without expecting higher returns as a result.
2. Staff and the Committee do not possess the investment expertise to select (or de-select) market sectors, industries or individual stocks; it is for this reason that we delegate this function to a professional investment advisor, who in turn selects professional investment managers, none of whom pursues divestment as a strategy, or has advised us that divestment will improve risk-adjusted return. By divesting, the Committee is asserting an investment thesis, intended or not, that our professional managers do not share.
3. Divestment will increase management fees. Morgan Stanley advises that the screened
versions of the above portfolios will increase fees by 0.15% annually; on $5.35 million of assets this is estimated to be $8,000 per year. While this is considerably less than initially presented, it is still an elective, and in my view non-value added, expense.
Finally, I am concerned that fossil fuel divestment will set a precedent for future such initiatives, with further potential for less-than-optimal investment returns, and corresponding reductions to the System’s ability to provide scholarships and other student support. Should the Committee vote to recommend a fossil fuel screening alternative to the full Board, then Morgan Stanley could implement the above-described approach shortly following the Board’s approval at its regularly-scheduled meeting in March.
90

Finance & Facilities Committee Recommendation Regarding Fossil Fuel Divestment from Endowment February 7, 2018 Page 4 The “least disruptive” fossil fuel screening approach described above also enables an ongoing side-by-side comparison between the screened and non-screened alternatives, and I recommend that the Committee monitor and evaluate the impact of fossil fuel screening to overall portfolio risk and return going forward. Finally, regardless of whether the Committee and Board pursue fossil fuel screening, I recommend adoption of the updated investment policy, both to incorporate previously-identified suggested changes, and to state unambiguously that the Committee and Board are authorized to pursue environmental, social and governance (ESG) objectives in addition to maximizing risk-adjusted return. Should you have any questions regarding this memorandum, please contact me at [email protected] or (802) 224-3022. Thank you. Attachment: 1. Investment policy statement with proposed redlined updates cc: Professor Brendan Lalor, Fossil Free VSC
91

INVESTMENT POLICY STATEMENT
For
The Endowed Funds of the
Vermont State Colleges
Amended September, 2014
DRAFT Amended and Restated
March 31, 2017
In RED DRAFT as of
March 31, 2017 With suggested
ammendments April 4, 2017 Investment Sub -Committee Meeting and
CFO.
Additional suggested ammendments as of
August 9, 2017
INVESTMENT POLICY STATEMENT
92
- 2 -
Purpose The purpose of this Investment Policy Statement (the “IPS”) is to assist the Vermont State Colleges (VSC) in effectively supervising, monitoring and evaluating the investment of the Endowed Funds of the VSC system. This IPS supports VSC Endowment Investment and Spending Policy #430.
The IPS represents the prudent investment process that implements the investment goals set by the Board of Trustees. The IPS sets forth the investment structure for managing assets, including appropriate asset classes, asset allocation and acceptable ranges. Together, these investment principles are expected to produce a sufficient level of overall diversification and total investment return over the long-term to meet the investment goals of the VSC.
The IPS is intended to comply with all applicable fiduciary, ethical and due diligence requirements that experienced investment professionals would employ. It will also adhere to all applicable laws, rules and regulations from various local, state, federal and international political governmental entities that may impact the Plan’s assets. It seeks to be in full compliance with all aspects of the Uniform Prudent Management of Institutional Funds Act as adopted in the State of Vermont.
Background The VSC holds endowed funds to be managed for the benefit of VSC system. These assets are managed with a long-term time horizon of ten years or greater and are maintained and managed for perpetuity. Within this Investment Policy Statement these assets shall be referred to as the Fund. Duties and Responsibilities of Involved Parties
The Vermont State Colleges Board of Trustees The Board is responsible for setting overall Investment Policy and acting on advisory recommendations made by the Finance & Facilities Committee.
The Finance Committee of the Board of Trustees
The Finance & Facilities Committee of the Board of Trustees
The Finance & Facilities Committee shall be responsible for developing advisory recommendations to the Board. of Trustees in the following areas: The Finance & Facilities Committee may designate an Investment Subcommittee to assist in its responsibilities. These responsibilities include:
Fiduciary oversight of the Fund. Investment objectives and policies of the Fund.
93

- 3 -
Advising the Chancellor on the selection and retention of investment managers. Changes in investment policy, guidelines, and objectives. Responsibility to exercise all rights, including voting rights, as are acquired through the purchase
of securities.
The Chancellor
The Chancellor shall be responsible for developing the IPS, day-to-day communications with the Advisor, day-to-day oversight of the Fund, and making decisions not otherwise vested in the Board of Trustees. The Chancellor may employ either investment managers that actively select securities or utilize index funds that passively track an appropriate benchmark index. The Chancellor, or the Chief Financial Officer on behalf of the Chancellor, shall be responsible for implementing and monitoring the IPS, day-to-day oversight of the Fund, authorizing the selection and retention of investments or investment managers, day-to-day communications with the Advisor, authorizing actions as directed by the Board and making decisions not otherwise vested in the Board of Trustees.
The Advisor
The Advisor is a Registered Investment Advisor and shall act as the investment advisor to the Board of Trustees, the Finance and Facilities Committee and the Chancellor until it is decided otherwise.
The Advisor, at the direction of the Chancellor or his designee, may employ either investment managers that actively select securities or utilize index funds or vehicles that passively track an appropriate benchmark index. The Advisor shall be responsible for:
Designing and implementing an appropriate asset allocation plan consistent with the investment objectives, time horizon, risk profile, guidelines and constraints outlined in this statement.
Advising the Board of Trustees, Finance & Facilities Committee, and Chancellor about the selection of and the allocation of asset categories.
Identifying specific assets and investment managers within each asset category. Providing “due diligence”, or research, on the Investment Manager(s) Monitoring the performance of all selected assets the advisor consults to. Periodically reviewing the suitability of the investments for the Board of Trustees and/or Finance
Committee. Being available to meet with the Board of Trustees and/or Finance & Facilities Committee at least
four times each year. Being available at such other times within reason at the Board of Trustees and/or Finance
Committee's request. Preparing and presenting appropriate reports. Assisting in the development and periodic review of investment policy.
94

- 4 -
The Advisor shall be responsible for:
• Designing and implementing an appropriate asset allocation plan consistent with the investment objectives, time horizon, risk profile, guidelines and constraints outlined in this statement.
• Advising the Board of Trustees, Finance & Facilities Committee, and Chancellor about the selection of and the allocation of asset categories.
• Identifying specific assets and investment managers within each asset category. • Providing “due diligence”, or research, on the investment manager(s) • Monitoring the performance of all selected assets the advisor consults to. • Periodically reviewing the suitability of the investments and report to the Board of Trustees
and/or Finance & Facilities Committee thereon. • Being available to meet with the Board of Trustees and/or Finance & Facilities Committee at
least four times each year. • Being available at such other times within reason at the Board of Trustees and/or Finance
& Facilities Committee's request. • Preparing and presenting appropriate reports. • Assisting in the development and periodic review of investment policy.
The Advisor shall not:
Have discretionary control of the portfolio. Have authority to withdraw funds from the Fund’s accounts, except to cover payment of
previously agreed to fees or to rebalance the portfolio or at the Board of Trustees or its designee’s specific direction.
Change the investment policy, including the targeted strategic asset allocation, of the Fund without the Board of Trustees prior approval.
The Investment Manager(s)
Each Investment Manager will have full discretion to make all investment decisions for assets placed under its jurisdiction, while observing and operating within all policies, guidelines, constraints, and philosophies as outlined in this statement. Managers shall maintain the general investment style and risk level as stated at time of hiring unless VSC is specifically notified in advance otherwise. Specific responsibilities of the Investment Manager(s) include:
Implementing discretionary investment management including decisions to buy, sell, or hold individual securities, and to alter asset allocation within the guidelines established in this statement.
Reporting, on a timely basis, periodic investment performance results. Communicating any major changes in investment strategy or any other factor which might affect
implementation of investment process. Informing the Advisor regarding any qualitative change to investment management organization:
Examples include changes in portfolio management personnel, ownership structure, investment policy, etc.
Voting proxies, unless otherwise directed by the Board of Trustees or the Chancellor.
95

- 5 -
Selection of Investment Managers
The Chancellor or his designee, after the recommendation of the Advisor, will select appropriate investment managers to manage the fund assets. Managers must meet the following minimum criteria:
Be a bank, insurance company, investment management company, or investment adviser as defined by the Registered Investment Advisers Act of 1940.
Provide historical quarterly performance numbers calculated on a time-weighted basis, based on a composite of all fully discretionary accounts of comparable investments, and reported net and gross of fees.
Provide performance evaluation reports prepared by an objective third party that illustrate the risk/return profile of the manager relative to other managers of like investment style.
Provide detailed information on the history of the firm, key personnel, key clients, fee schedule, and support personnel. This information can be a copy of a recent Request for Proposal (RFP) completed by the manager.
Clearly articulate the investment strategy that will be followed and document that the strategy has been successfully adhered to over time.
Maintain minimum assets under management of $250 million. Plan Objectives and Time Horizon
Time Horizon The investment time horizon of the Fund is ten years or greater, as the existence and obligations of the Plan are long term and ongoing. The Board of Trustees may alter this time horizon if factors change making shorter-term liquidity more important.
Risk Tolerances In establishing the market risk tolerances of the Plan, the ability to withstand short and intermediate term variability was analyzed. The Board of Trustees and Finance Committee recognize that “moderate” risk and volatility, including periods of portfolio declines, must be assumed in order to achieve the long-term investment objective of prudent capital appreciation. As a general guideline, the assumed risk on Fund assets is targeted to be less than the projected volatility of U.S. domestic equities as measured by the Standard & Poor's 500 Stock Index and greater than a portfolio comprised of 50% of the Standard & Poor's 500 Stock Index and 50% the Barclay’s Aggregate Bond Index. As a general guideline, the assumed risk on Fund assets is targeted to be less than the projected volatility of U.S. domestic equities as measured by the Standard & Poor's 500 Stock Index and greater than a portfolio comprising 50% of the Standard & Poor's 500 Stock Index and 50% the Barclay’s Aggregate Bond Index.
96
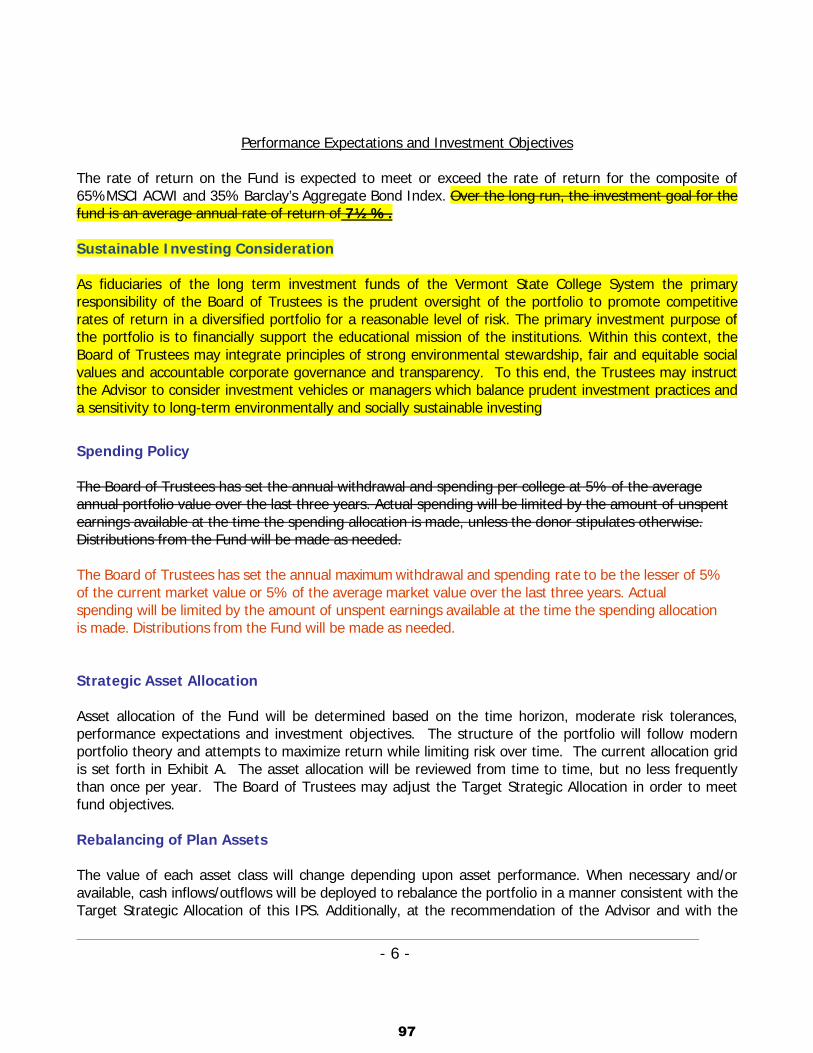
- 6 -
Performance Expectations and Investment Objectives The rate of return on the Fund is expected to meet or exceed the rate of return for the composite of 65%MSCI ACWI and 35% Barclay’s Aggregate Bond Index. Over the long run, the investment goal for the fund is an average annual rate of return of 7½%. Sustainable Investing Consideration As fiduciaries of the long term investment funds of the Vermont State College System the primary responsibility of the Board of Trustees is the prudent oversight of the portfolio to promote competitive rates of return in a diversified portfolio for a reasonable level of risk. The primary investment purpose of the portfolio is to financially support the educational mission of the institutions. Within this context, the Board of Trustees may integrate principles of strong environmental stewardship, fair and equitable social values and accountable corporate governance and transparency. To this end, the Trustees may instruct the Advisor to consider investment vehicles or managers which balance prudent investment practices and a sensitivity to long-term environmentally and socially sustainable investing
Spending Policy The Board of Trustees has set the annual withdrawal and spending per college at 5% of the average annual portfolio value over the last three years. Actual spending will be limited by the amount of unspent earnings available at the time the spending allocation is made, unless the donor stipulates otherwise. Distributions from the Fund will be made as needed. The Board of Trustees has set the annual maximum withdrawal and spending rate to be the lesser of 5% of the current market value or 5% of the average market value over the last three years. Actual spending will be limited by the amount of unspent earnings available at the time the spending allocation is made. Distributions from the Fund will be made as needed. Strategic Asset Allocation Asset allocation of the Fund will be determined based on the time horizon, moderate risk tolerances, performance expectations and investment objectives. The structure of the portfolio will follow modern portfolio theory and attempts to maximize return while limiting risk over time. The current allocation grid is set forth in Exhibit A. The asset allocation will be reviewed from time to time, but no less frequently than once per year. The Board of Trustees may adjust the Target Strategic Allocation in order to meet fund objectives. Rebalancing of Plan Assets The value of each asset class will change depending upon asset performance. When necessary and/or available, cash inflows/outflows will be deployed to rebalance the portfolio in a manner consistent with the Target Strategic Allocation of this IPS. Additionally, at the recommendation of the Advisor and with the
97

- 7 -
approval of the Chancellor, the assets will be reviewed quarterly and rebalanced, in order to more closely align with the Target Strategic Allocation. Asset Managers The Chancellor may employ either asset managers that actively select securities or utilize index funds that passively track an appropriate benchmark index. Duties and Responsibilities of the Asset Managers The duties and responsibilities of each money manager or fund company retained by the Vermont State Colleges include the following:
Managing the fund assets under its care, custody and/or control in accordance with the IPS objectives and guidelines set forth herein.
Exercising investment discretion (including holding cash equivalents as an alternative) within the IPS objectives and guidelines set forth herein.
Passively tracking an appropriate benchmark index. Investment Policies and Guidelines for the Investment Managers Every investment manager selected to manage fund assets must adhere to the following investment policy and guidelines. If mutual funds are employed, only those that meet the following relevant criteria shall be selected:
Equity holdings in any one company should not exceed more than 10% 3% of the market value of the Plan's equity portfolio.
The manager shall have the discretion to invest a portion of the assets in cash reserves when they
deem appropriate. Cash is to be employed productively at all times by investment in short term cash equivalents to provide safety, liquidity and return. Nonetheless, the managers will be evaluated against their peers on the performance of the total funds under their direct management.
Prohibited Assets Private Placements Limited Partnerships Venture Capital Investments Brokerage Policy All transactions effected for the Fund will be subject to the best price and execution.
98

- 8 -
Monitoring of Investment Managers Quarterly performance will be evaluated to monitor progress toward the attainment of longer-term targets. It is understood that there are likely to be short-term periods during which performance deviates from market indices. During such times, greater emphasis shall be placed on performance comparisons with managers employing similar styles. On a timely basis the Advisor will assess each asset manager relative to the following:
Overall adherence to the IPS guidelines. Material changes in the managers’ organization, investment philosophy and/or personnel. Comparisons of the managers’ results to appropriate indices and peer groups. Comparison of Up/Down market capture ratios. Other comparisons as agreed to by the Chancellor and the Advisor.
Review of this Investment Policy Statement The Finance and Facilities Committee will review these guidelines on an annual basis or in the interim whenever substantive changes to the guidelines are proposed by the Chancellor.
99
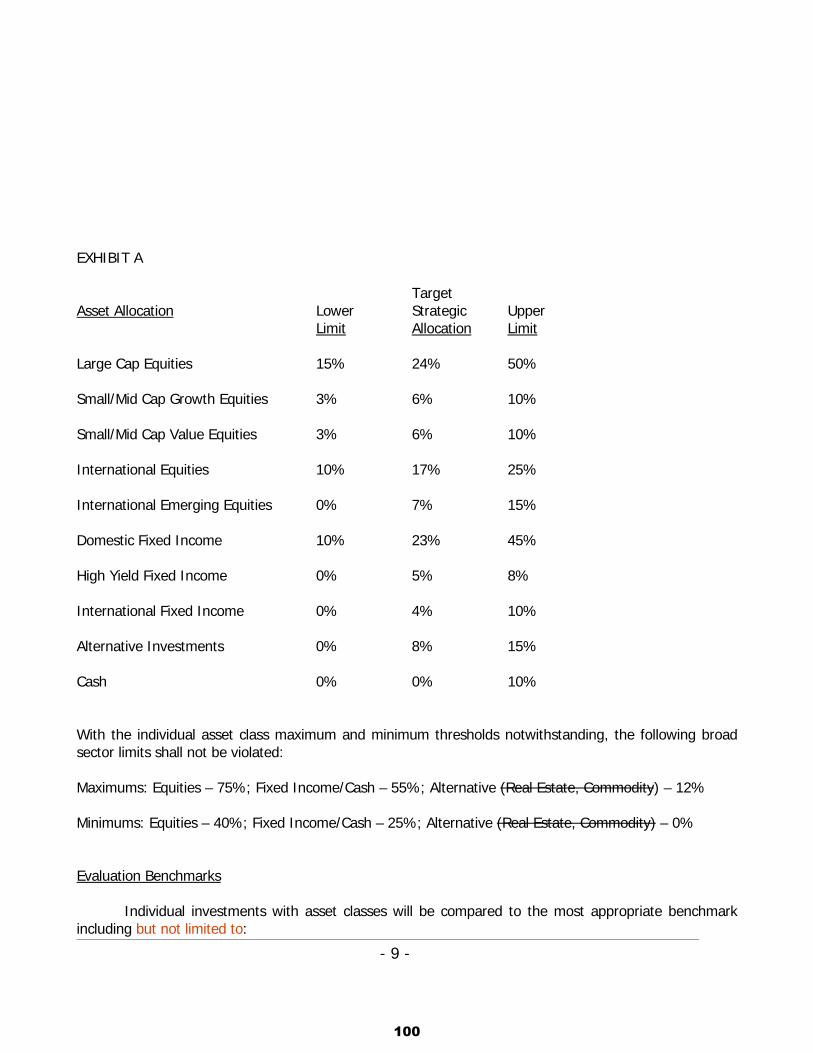
- 9 -
EXHIBIT A Target Asset Allocation Lower Strategic Upper Limit Allocation Limit Large Cap Equities 15% 24% 50% Small/Mid Cap Growth Equities 3% 6% 10% Small/Mid Cap Value Equities 3% 6% 10% International Equities 10% 17% 25% International Emerging Equities 0% 7% 15% Domestic Fixed Income 10% 23% 45% High Yield Fixed Income 0% 5% 8% International Fixed Income 0% 4% 10% Alternative Investments 0% 8% 15% Cash 0% 0% 10% With the individual asset class maximum and minimum thresholds notwithstanding, the following broad sector limits shall not be violated: Maximums: Equities – 75%; Fixed Income/Cash – 55%; Alternative (Real Estate, Commodity) – 12% Minimums: Equities – 40%; Fixed Income/Cash – 25%; Alternative (Real Estate, Commodity) – 0% Evaluation Benchmarks Individual investments with asset classes will be compared to the most appropriate benchmark including but not limited to:
100

- 10 -
Standard & Poor's 500 Stock Index MSCI All Country World Index
Russell 1000 Large Capitalization Growth Index Russell 1000 Large Capitalization Value Index
Russell 2000 Small Capitalization Equity Growth Index Russell 2000 Small Capitalization Value Index MSCI EAFE Index MSCI Emerging Markets Index Barclay’s Aggregate Bond Index Barclay’s High Yield Bond Index JPM Non-US Govt. Index HFRI Fund of Funds Index – Conservative and/or Composite Dow Jones Real Estate Index S&P GSCI The most appropriate benchmark will be used to evaluate individual manager performance.
101
Item 10: FY2018 Committee Meetings Schedule
102

Mtg # Date
Topic Count
Northern Vermont
UniversitySystem Shared
ServicesFY19 Budget Development
FY20 Tuition, Fees, Room &
Board
Quarterly Results, Metrics
Appropriation Requests
Cash, Investments, Endowment
Debt Management
Capital Planning and
ProjectsFacilities
ManagementGrants and
GiftsPolicies and Procedures Special Topics
1Wed, Aug 23, 2017 (2:45pm - 5:00pm)
6
Q4 FY17 Results,
reserves and system loans
Budget Adjustment and Appropriations Bills due mid-
September
Regular quarterly report (per Policy 404)
Capital projects update
Review of draft revised
Investment Policy
Review of Questions from May 31 (various
topics)
Wed, Sep 27, 2017 *
2Wed, Oct 25, 2017 (9:00am - 11:10am)
5
Initial discussion
informed by Q1 FY18 results
Review final Fall 2017
Enrollment, Q1 FY18 Results,
Reserves
Big Bill due 10/16, Capital Bill due 10/27,
BAA TBD
Capital projects list review
Introduce Policy 504, Campus Safety Policy
3Thu, Dec 1, 2017
(9:45am - 12:10pm)* 8
FY2019 and 3-year initial
System outlook
Discuss amending Policy 301,
Residency for In-State Tuition
Vote to approve carryover,
System funds discussion
Vote to approve budget request, BAA proposal (if
any)
Regular quarterly report
(per Policy 404), response
to FFVSC
Vote to approve capital projects
list
Vote to approve Policy 504,
Campus Safety Policy
VSC report (Act 85 Sec.
E.101(c)) due to Legislature Jan
15
4Mon, Feb 12, 2018
(rescheduled)* 4
3-year enrollment and budget outlooks
by Institution
Q2 FY18 Results
Morgan Stanley presentation,
continue discussion with
FFVSC
Investment policy annual
review
5 Mon, Feb 19, 2018
6 Mon, Apr 2, 2018 7Preliminary
FY19 Budgets discussed
Discussion of net cost of
attendance for in vs. out of
state students
Expanded fund balances
discussion
Regular quarterly report (per Policy 404)
Debt "201" discussion, compliance procedures
Policy 403 discussion
GASB 75/ OPEB liability
review
7 Mon, Apr 30, 2018 5Preliminary
FY19 Budgets presented
Initial FY20 Tuition
discussion
Q3 FY18 Results
Deferred maintenance
update
AGB Report update
8 Wed, May 30, 2018 3Vote on FY19
Budgets
Preliminary FY20 Tuition
request
Regular quarterly report, Annual Banking
& Investment Resolution (per
Policy 404)
9 Wed, Jun 20, 2018 * 2Vote on FY20
Tuition AGB Report
update
* Last meeting before quarterly Board of Trustees Meeting
Finance and Facilities CommitteeMeeting Schedule for Fiscal Year 2018
as of February 12, 2018
Meeting Cancelled; Board of Trustees Meeting to include update on Northern Vermont University, and presentation on Admissions and Enrollment
Meeting Cancelled
103

Attachment
Fossil Free VSC
Jodi Neuman, CFA
Trillium Asset Management Presentation
104
FOSSIL FUEL FREE INVESTING
Two Financial Center | 60 South Street, Suite 1100 | Boston, MA 02111
www.trilliuminvest.com 617-423-6655
1105

HISTORY & FIRM OVERVIEW
106
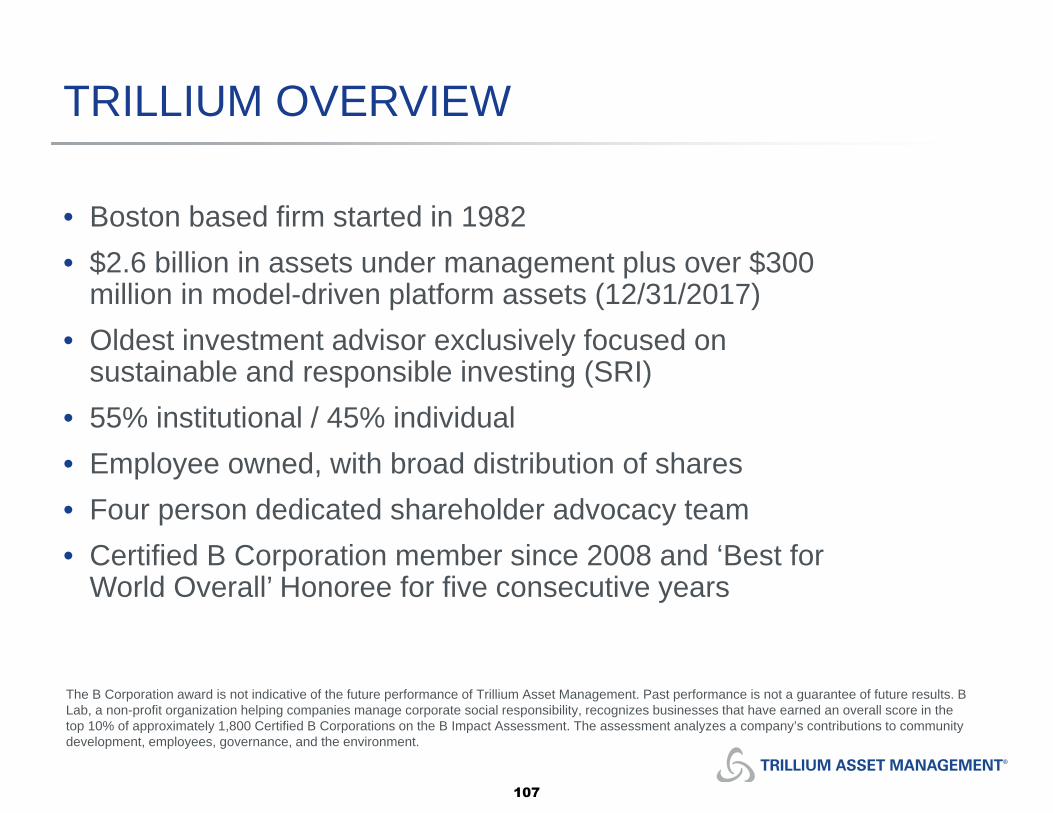
TRILLIUM OVERVIEW
• Boston based firm started in 1982
• $2.6 billion in assets under management plus over $300million in model-driven platform assets (12/31/2017)
• Oldest investment advisor exclusively focused onsustainable and responsible investing (SRI)
• 55% institutional / 45% individual
• Employee owned, with broad distribution of shares
• Four person dedicated shareholder advocacy team
• Certified B Corporation member since 2008 and ‘Best forWorld Overall’ Honoree for five consecutive years
The B Corporation award is not indicative of the future performance of Trillium Asset Management. Past performance is not a guarantee of future results. B Lab, a non-profit organization helping companies manage corporate social responsibility, recognizes businesses that have earned an overall score in the top 10% of approximately 1,800 Certified B Corporations on the B Impact Assessment. The assessment analyzes a company’s contributions to community development, employees, governance, and the environment.
107

FIDUCIARY DUTY
• Can a reasonable person expect a divested portfolio to perform similarto or better than a non-divested portfolio? If so, it meets the fiduciaryduty standard.
• To answer this question, lets take a look backward and a look forwardat the potential market behavior of the oil and gas industry.
108
LOOKING BACK
109

Chart of 10 Year Performance through 2/6/2018:
S&P 500 (Black), Oil & Gas (Gold), Coal Sector (Blue)
Reviewing past ten years, avoidance of traditional energy and coal positive for investors
•Chart created at www.bigcharts.com•The NYSE ARCA Oil Index (XOI) , represented by the gold line, is designed to measure the performance of the oil industry through changes in the prices ofa cross section of widely held corporations involved in the exploration, production and development of petroleum.•Dow Jones U.S. Coal index, represented by the gold line, is a subindex of the Dow Jones U.S. Indices and seeks to track all stocks classified in the coalsubsector (1771) of the Dow Jones Sector Classification Standard traded on major U.S. stock exchanges.
RECENT UNDERPERFORMANCE CYCLE
110

INDEPENDENT STUDIES
• Aperio1: Aperio found that over the 25-year period from 1988 through 2013 a portfolioexcluding all fossil fuel companies outperformed its benchmark by a fraction of apercent (0.05%). In addition, Aperio estimated that over the same 25-year period, thefossil fuel free portfolio would have an annual tracking error from its Russell 3000benchmark of just 0.77%.
• Advisor Partners2: Conducted another 25-year historical study which also found thatremoving fossil fuel stocks did not meaningfully change investment risk and return of awell-diversified portfolio.
• University of Groginen3: Over a period of 88-years, from before the GreatDepression to after the Great Recession, “divestment did not reduce risk adjustedreturns…these findings can be explained by the fact that fossil fuel company portfoliosdo not generate above-market performance and [fossil fuel companies] providerelatively limited diversification benefits.”
1) Patrick Geddes, Lisa Goldberg, Robert Tymoczko, Michael Branch. “Building a Carbon Free Portfolio”. Retrieved fromhttps://www.aperiogroup.com/resource/138/node/download.
2) Jim Blachman, CFA, Gerard Cronin, CFA, Daniel Kern, CFA. “Fossil Fuel Divestment: Risks and Opportunities”. Retrieved fromwww.advisiorpartners.com.
3)Trinks, Pieter Jan; Scholtens, Lambertus; Mulder, Machiel; Dam, Lammertjan: “Divesting Fossil Fuels: The Implications for Investment Portfolios”.University of Groningen. 2017
111

FORECAST OF OIL AND GAS SECTOR
112

S&P 1500 SECTOR WEIGHTS:1997 VS. 2017
December 26, 1997
Financials 17.3%
Consumer Discretionary 12.6%
Information Technology 12.3%
Industrials 12.2%
Consumer Staples 11.3%
Health Care 10.9%
Energy 8.1%
Telecommunication Services 6.3%
Materials 4.8%
Utilities 4.2%
Source: Factset 9
December 26, 2017
Information Technology 23.0%
Financials 15.0%
Health Care 13.4%
Consumer Discretionary 12.4%
Industrials 10.9%
Consumer Staples 7.7%
Energy 5.9%
Real Estate 3.4%
Materials 3.3%
Utilities 3.1%
Telecommunication Services 1.9%
113
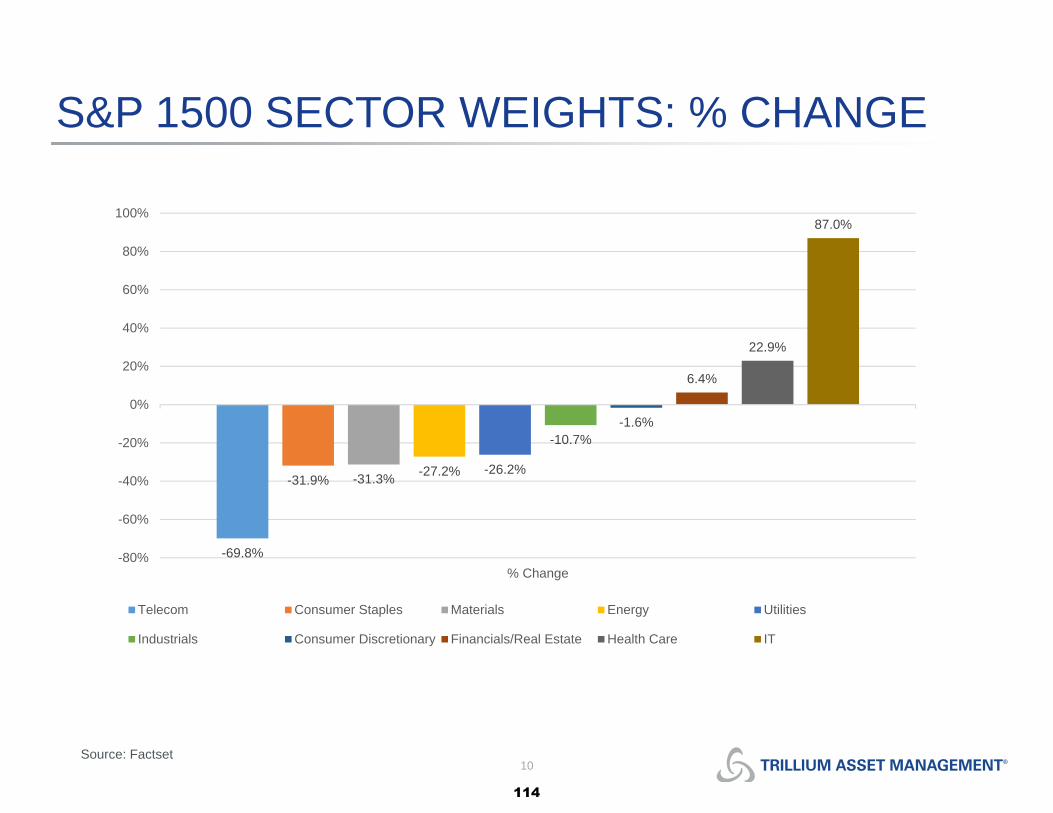
S&P 1500 SECTOR WEIGHTS: % CHANGE
Source: Factset10
-69.8%
-31.9% -31.3%-27.2% -26.2%
-10.7%-1.6%
6.4%
22.9%
87.0%
-80%
-60%
-40%
-20%
0%
20%
40%
60%
80%
100%
% Change
Telecom Consumer Staples Materials Energy Utilities
Industrials Consumer Discretionary Financials/Real Estate Health Care IT
114
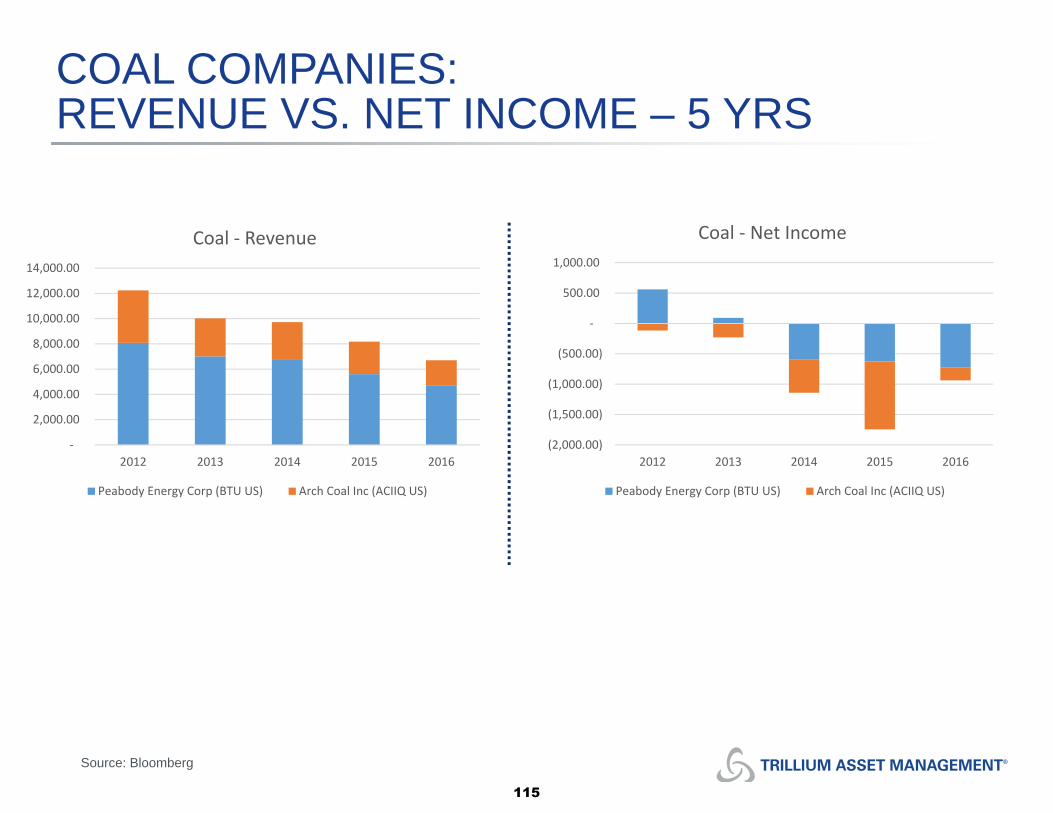
COAL COMPANIES: REVENUE VS. NET INCOME – 5 YRS
Source: Bloomberg
‐
2,000.00
4,000.00
6,000.00
8,000.00
10,000.00
12,000.00
14,000.00
2012 2013 2014 2015 2016
Coal ‐ Revenue
Peabody Energy Corp (BTU US) Arch Coal Inc (ACIIQ US)
(2,000.00)
(1,500.00)
(1,000.00)
(500.00)
‐
500.00
1,000.00
2012 2013 2014 2015 2016
Coal ‐ Net Income
Peabody Energy Corp (BTU US) Arch Coal Inc (ACIIQ US)
115
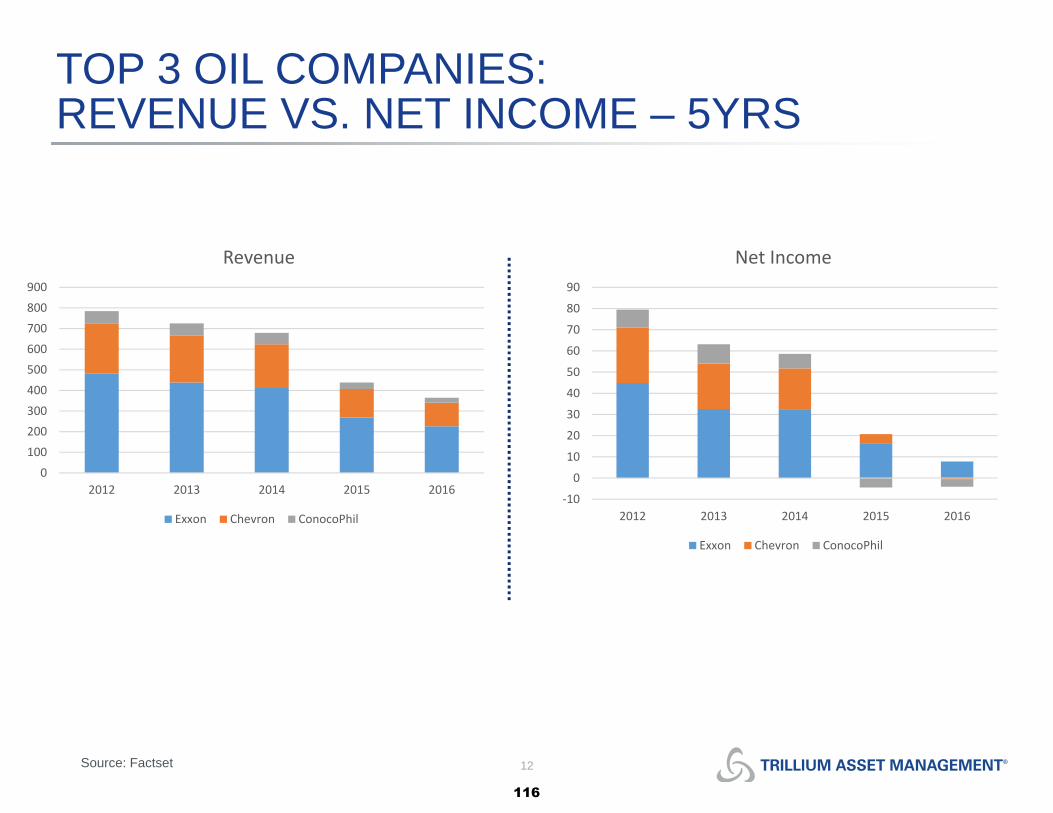
TOP 3 OIL COMPANIES:REVENUE VS. NET INCOME – 5YRS
Source: Factset 12
0
100
200
300
400
500
600
700
800
900
2012 2013 2014 2015 2016
Revenue
Exxon Chevron ConocoPhil‐10
0
10
20
30
40
50
60
70
80
90
2012 2013 2014 2015 2016
Net Income
Exxon Chevron ConocoPhil
116
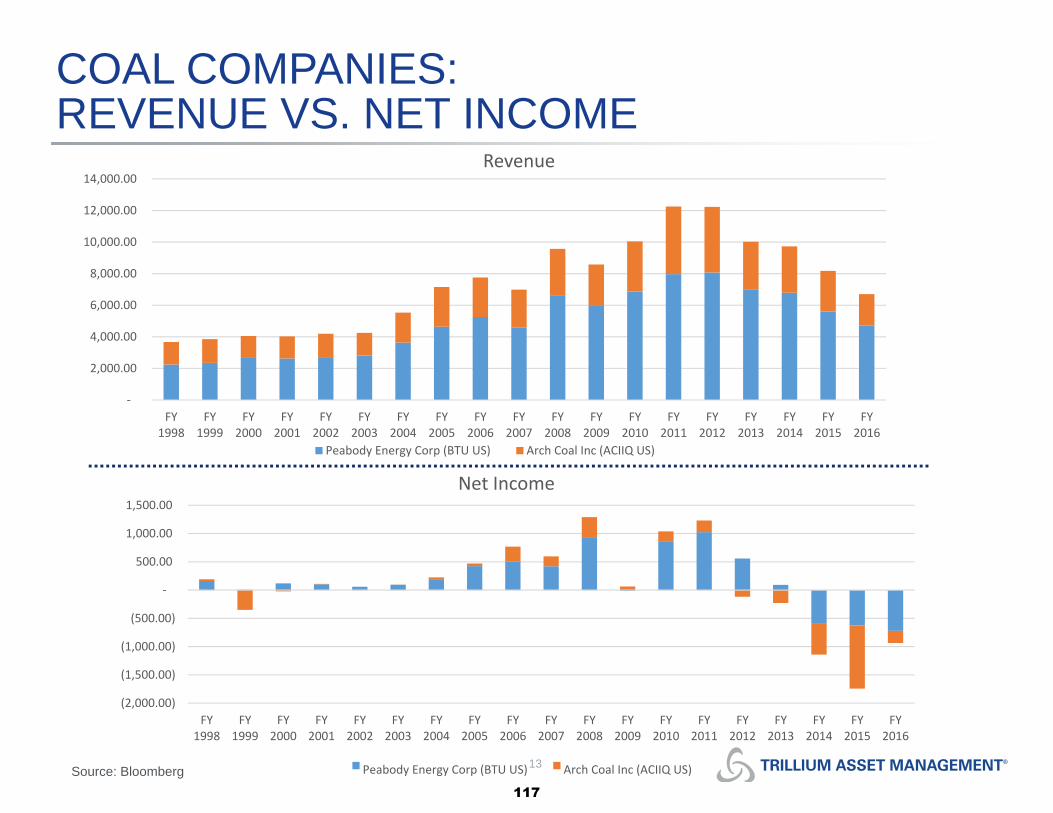
COAL COMPANIES: REVENUE VS. NET INCOME
Source: Bloomberg
‐
2,000.00
4,000.00
6,000.00
8,000.00
10,000.00
12,000.00
14,000.00
FY1998
FY1999
FY2000
FY2001
FY2002
FY2003
FY2004
FY2005
FY2006
FY2007
FY2008
FY2009
FY2010
FY2011
FY2012
FY2013
FY2014
FY2015
FY2016
Revenue
Peabody Energy Corp (BTU US) Arch Coal Inc (ACIIQ US)
(2,000.00)
(1,500.00)
(1,000.00)
(500.00)
‐
500.00
1,000.00
1,500.00
FY1998
FY1999
FY2000
FY2001
FY2002
FY2003
FY2004
FY2005
FY2006
FY2007
FY2008
FY2009
FY2010
FY2011
FY2012
FY2013
FY2014
FY2015
FY2016
Net Income
Peabody Energy Corp (BTU US)13 Arch Coal Inc (ACIIQ US)
117

TOP 3 OIL COMPANIES:REVENUE VS. NET INCOME
Source: Bloomberg
‐
200,000
400,000
600,000
800,000
1,000,000
1,200,000
1997 1998 1999 2000 2001 2002 2003 2004 2005 2006 2007 2008 2009 2010 2011 2012 2013 2014 2015 2016
Revenue
EXXON CHEVRON CONOCOPHILS
(20,000)
‐
20,000
40,000
60,000
80,000
100,000
1997 1998 1999 2000 2001 2002 2003 2004 2005 2006 2007 2008 2009 2010 2011 2012 2013 2014 2015 2016
Net Income
EXXON CHEVRON CONOCOPHILS
118

TOP 3 OIL COMPANIES: FREE CASH FLOW – 5 YRS
Source: Factset 15
‐15
‐10
‐5
0
5
10
15
20
25
30
35
2012 2013 2014 2015 2016
Free Cash Flow
Exxon Chevron ConocoPhil
119

S&P 1500 SECTOR WEIGHTS: % CHANGE
Source: Factset16
-69.8%
-31.9% -31.3%-27.2% -26.2%
-10.7%-1.6%
6.4%
22.9%
87.0%
-80%
-60%
-40%
-20%
0%
20%
40%
60%
80%
100%
% Change
Telecom Consumer Staples Materials Energy Utilities
Industrials Consumer Discretionary Financials/Real Estate Health Care IT
120

FORWARD LOOKING VIEW
• Mercer: Assessing the Prospective Investment Impacts of a LowCarbon Economic Transition1 – Conclusions
• “Investing in assets ex-Fossil Fuel improves portfolio return and risk”
• “On balance, literature reviewed suggests that, at a minimum, there does notappear to be a performance penalty over the long term from the application of SRIcriteria generally or fossil fuel screens specifically”
• Deputy Governor of Norway’s Central Bank, Egil Matsen, made asimilar point when divesting Norway’s $1 trillion sovereign wealthfund. “Our perspective here is to spread the risks for the state’swealth, we can do that better by not adding oil price risk through thefund.”
1) Mercer LLC. “Assessing the Prospective Investment Impacts of a Low Carbon Economic Transition”. Retrieved fromhttps://www.mercer.com/our-thinking/assessing-the-prospective-investment-impacts-of-a-low-carbon-economic-transition.html.
121

Trillium recommends a diversified approach to reinvestment that looks across sectors for companies working to mitigate climate change within these 7 Pillars:
Energy Efficiency
Power Generation
Storage & Distribution
Transportation Water Sustainable Agriculture
Sustainable Design
WHERE TO REINVEST
122

APPENDIX
123

HIGH QUALITY APPROACH
Trillium is a long-term investor, with a three to five year investment horizon seeking companies demonstrating high quality characteristics, such as:
• Financial Statement Integrity
• Conservative Debt Management
• Positive and Growing Cash Flow from Operations
• Above Peer Return on Invested Capital (ROIC)
• Sector-leading Policies and Performance Related to KeyEnvironmental, Social, and Governance (ESG) Risks and Opportunities
124

ExclusionaryESG
Criteria
ExclusionaryESG
Criteria
Passive Strategy
Pos
itive
Env
ironm
enta
l &
Soc
ial I
mpa
ct
TRILLIUM APPROACH
ExclusionaryESG
Criteria
ExclusionaryESG
Criteria
PositiveESG Criteria
PositiveESG Criteria
PositiveESG Criteria
ShareholderAdvocacy
ShareholderAdvocacy
Public Policy
MULTIPLE APPROACHES MAXIMIZESOCIAL DIVIDENDS℠
125
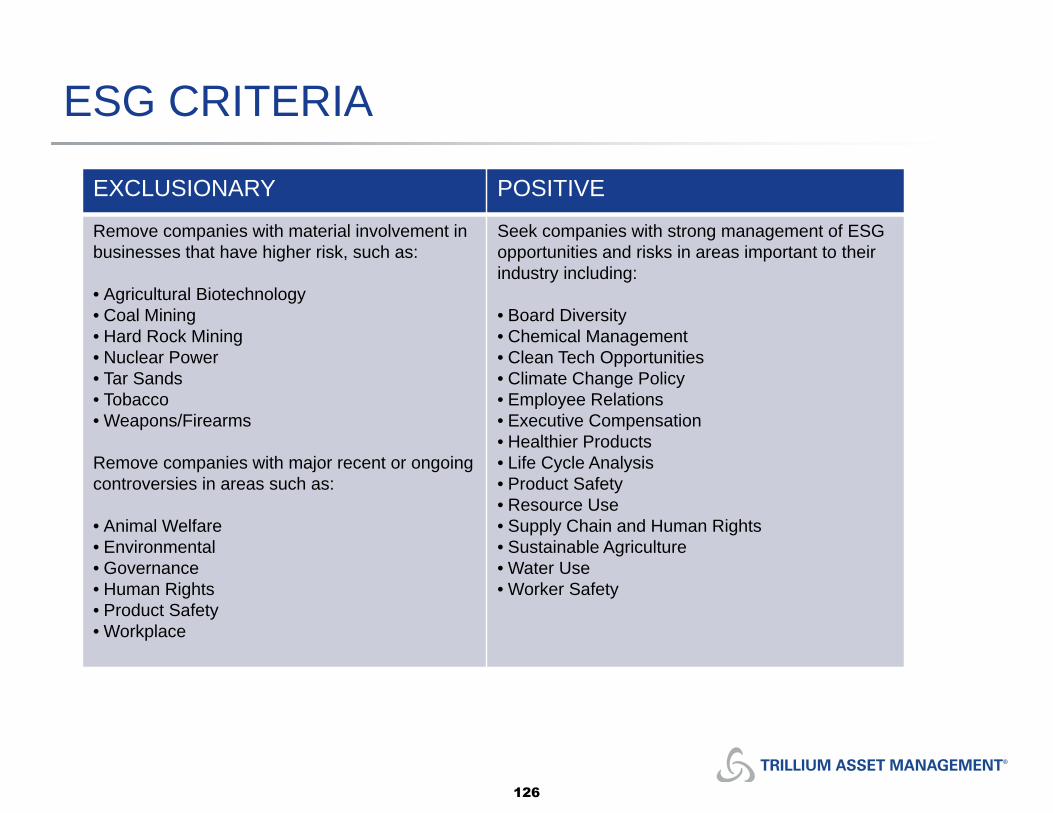
ESG CRITERIA
EXCLUSIONARY POSITIVE
Remove companies with material involvement in businesses that have higher risk, such as:
• Agricultural Biotechnology• Coal Mining• Hard Rock Mining• Nuclear Power• Tar Sands• Tobacco• Weapons/Firearms
Remove companies with major recent or ongoing controversies in areas such as:
• Animal Welfare• Environmental• Governance• Human Rights• Product Safety• Workplace
Seek companies with strong management of ESG opportunities and risks in areas important to their industry including:
• Board Diversity• Chemical Management• Clean Tech Opportunities• Climate Change Policy• Employee Relations• Executive Compensation• Healthier Products• Life Cycle Analysis• Product Safety• Resource Use• Supply Chain and Human Rights• Sustainable Agriculture• Water Use• Worker Safety
126

COMPREHENSIVE FOSSIL FUEL SCREEN
BASELINE
* Based on total “proved” reserves (>10%)** Based on power generating capacity/revenues (>10%)
CARBON RISK MANAGEMENT APPROACHES
Avoids Tar Sands*, Coal Mining and Coal-Based Utilities**, Industry ESG Laggards,
Advocacy on Energy NamesAll Cap Core; Large Cap Core
RESERVES SCREEN
No Fossil Fuel Energy or Utility Companies Fossil Fuel Free Core; Global Equity;Sustainable Opportunities
Small / Mid Cap CoreNo Companies with Material Reserves
127

DISCLOSURE: IMPORTANT INFORMATION
The S&P Indices are widely recognized, unmanaged indices of common stock. It is not possible to invest directly in an index. The S&P 500 Index is recognized as a gauge of the large cap U.S. equities market. The S&P 1000 combines the S&P MidCap 400 and the S&P SmallCap 600, to form a benchmark for the mid-small cap universe of the U.S. equity market. The S&P 1500 combines three indices, the S&P 500, the S&P MidCap 400, and the S&P SmallCap 600 to cover approximately 90% of the U.S. market capitalization.
The MSCI EAFE Index is a broadly recognized index to measure international equity performance. It comprises the MSCI country indexes capturing large and mid-cap equities across developed markets in Europe, Australasia and the Far East, excluding the U.S. and Canada.
The Russell 2500 Index is a broad index featuring 2,500 stocks that cover the small and mid cap market capitalizations. The Russell 2500 is a market cap weighted index that includes the smallest 2,500 companies covered in the Russell 3000 universe of United States-based listed equities. The index is designed to be broad and unbiased in its inclusion criteria, and is recompiled annually to account for the inevitable changes that occur as stocks rise and fall in value.
Investments in smaller companies generally carry greater risk than is customarily associated with larger companies for various reasons, such as narrower markets, limited financial resources and less liquid stock.
The views expressed are those of the authors and Trillium Asset Management, LLC as of the date referenced and are subject to change at any time based on market or other conditions. These views are not intended to be a forecast of future events or a guarantee of future results. These views may not be relied upon as investment advice. The information provided in this material should not be considered a recommendation to buy or sell any of the securities mentioned. It should not be assumed that investments in such securities have been or will be profitable. To the extent specific securities are mentioned, they have been selected by the authors on an objective basis to illustrate views expressed in the commentary and do not represent all of the securities purchased, sold or recommended for advisory clients. The information contained herein has been prepared from sources believed reliable but is not guaranteed by us as to its timeliness or accuracy, and is not a complete summary or statement of all available data. This piece is for informational purposes and should not be construed as a research report.
128

Attachment: Memorandum from Jason Kaiser, Lyndon State College
129
To: The Finance and Facilities Committee of the VSC Board of Trustees
From: Jason Kaiser, Lyndon State College Department of Atmospheric Sciences Data Systems
Administrator, M.S. Applied Meteorology, Fossil Free VSC member
Date: 12 February 2018
Re: Comments on memorandum: “Recommendation Regarding Fossil Fuel Divestment from
Endowment”, dated February 7, 2018.
I want to first acknowledge and thank the Finance and Facilities Committee for working with the
Chancellor’s Office staff and TIAA to offer the TIAACREF Social Choice Low Carbon fund Pax
Global Environmental Markets fund. The crux of Fossil Free VSC’s endeavor is not only “to allow
plan participants to invest their retirement funds in accordance with their objectives and values,” as
stated on page 1 of the memorandum, but also to transition part or all of the Vermont State College
Systems’ portfolio to a fossilfree approach, in order to uphold the objectives and values of our own
Systemwide institutions of higher education. The Vermont State Colleges System provides
“affordable, high quality, studentcentered, and accessible education” as stated in the Vermont State
Colleges Mission Statement . In order to do this, at the core, we teach facts. For decades, the fossil fuel 1
industry has been knowingly aware of the facts regarding their industry's direct effect on climate
change through the release of greenhouse gas emissions, and yet they continue to favor their own
profit, duplicitous to the world’s inhabitants. The Vermont State Colleges Mission is, in part, realized
through “VSCS structures and delivery systems will be flexible enough to both anticipate and quickly
adapt to shifting internal and external forces.” I believe that a full or partial fossil fuel divestment can
be considered as a shifting external force, for reasons outlined here.
Most of the concerns on page three of the memorandum are valid concerns, but I do not believe that
they should be taken as simply the end of this dialogue, for the these reasons (responses to each
numerical point on page three of the memorandum):
1. Divestment of fossil fuels themselves do and should not imply that there is no reinvestment in
other comparable fossilfree assets (and therefore subsequent portfolio diversification). I would
consider a fossil free divestment approach that did not involve reinvesting in additional fossil
fuelfree assets as irresponsible. Fossil Free VSC is advocating for the divestment of fossil fuel
assets and reinvestment in fossil fuelfree assets.
2. Regarding “Staff and the Committee do not possess the investment expertise to select (or
deselect) market sectors” I see this as as opportunity, and not an impasse. I recommend to
the Chancellor Office and/or Committee staff to explore making a decision to choose different
1 https://www.vsc.edu/systemfacts/missionvision/
130
professional advisors/managers who do share a fossilfree divestment thesis. These 2
professional advisors/managers do exist. (If they did not, the 35+ higher education institutions
in the U.S. alone who have either decided to divest from fossil fuels, either partially or fully,
would likely not have been able to do so without their own professional advisors/managers who
have experience with divestment.) I strongly encourage exploratory research into these higher
education institutions to determine who their professional advisors/managers are, and what
processes they are following to divest their assets from from fossil fuels. 3
I am concerned that Morgan Stanley currently has a conflict of interest regarding research into
and offering fossil fuelfree assets , as Fossil Free VSC has provided to the Committee
documentation that “Morgan Stanley is listed as providing $225 million or 2.2% of the $10.25 4
billion of total financing to the Energy Transfer Family of firms,” i.e. that Morgan Stanley is
knowingly funding fossil fuel infrastructure. I propose screening for fossil fuel assets using a
third party, the The Carbon Underground 200™ list, “compiled and maintained by Fossil Free
Indexes℠, [which] identifies the top 100 coal and the top 100 oil and gas publiclytraded reserve holders globally, ranked by the potential carbon emissions content of their reported
reserves." There are just 100 companies responsible for 71% of global emissions . The Carbon 5 6
Underground 200™'s intent is to identify those companies that have shown to be most
responsible for climate change due to their potential greenhouse gas emissions based on their
reported reserves. While screening using only The Carbon Underground 200™ likely leaves
many fossil fuel companies in the portfolio, The Carbon Underground 200™ by definition
causes the elimination of these 200 fossil fuel companies from a portfolio to indeed make an
impact. Several of the 35+ higher education institutions in the U.S. that have partially divested
their portfolios of fossil fuel assets have done so using only The Carbon Underground 200™ as
the screening tool. It should be noted that use of The Carbon Underground 200™ list by asset
managers and consultants is only permissible with a paid subscription. 7
3. I would like to know how exactly Morgan Stanley proposes to screen the portfolios. I would
assume this determines nearly directly to what percentage the fees are increased. I hope
this will be discussed and clarified at the February 12 meeting.
2 This is the second of the Fossil Free VSC proposals presented to the Vermont State Colleges System Board in March, 2017. 3 Please refer to https://gofossilfree.org/divestment/commitments/ for a list institutions who have divested (either partially or fully) from fossil fuel assets. 4 The Discussion of Fossil Free VSC Requests memorandum, dated November 21, 2017. 5 https://fossilfreefunds.org/carbonunderground200/ 6 https://www.theguardian.com/sustainablebusiness/2017/jul/10/100fossilfuel Companiesinvestorsresponsible71globalemissionscdpstudyclimatechange , which cites: https://b8f65cb373b1b7b15febc70d8ead6ced550b4d987d7c03fcdd1d.ssl.cf3.rackcdn.com/cms/reports/documents/000/002/327/original/CarbonMajorsReport2017.pdf 7 http://fossilfreeindexes.com/divestinvest/
131

Finally, to address the concern over "setting a precedent." Divesting from fossil fuels by definition sets
a precedent. I would also argue the ethical protests and divestment surrounding the ending of apartheid
set a precedent. By 1988, a total of 155 colleges had at least partially divested . There is nothing 8
inherently wrong with setting a precedent. I suggest building into the process ways to reduce risk from
"lessthanoptimal investment returns" from hypothetical future initiatives. There is something inherently and morally wrong with
“the continued exploitation of fossil fuel reserves alone [having] the potential to increase
greenhouse gases and global temperature well beyond the 2°C threshold required to prevent the
worst effects of climate change. ... The necessity to keep the resources in the ground has a direct
impact on the valuation of fossil fuel industry assets. They are predominantly influenced not only
by production, but also by the value of proven fossilfuel reserves. In other words, if these
resources cannot be exploited, their value will depreciate. ... Investors withdraw their funds to
either mitigate financial risks or for ethical reasons. But the question remains whether divestment
and divestment announcements have a financial impact on the share price of fossil fuel
companies.”
A team of researchers at the School of Environment, Enterprise and Development (SEED) at the
University of Waterloo conducted an analysis that suggests divestment announcements have a
statistically significant negative impact on the price of fossil fuel shares. Their study aggregates
the impact of more than 20 announcements across 200 publicly traded fossil fuel companies.
“The results suggest that share prices dropped on the days that institutional investors announced
they were divesting of fossil fuels.
We’ve concluded that investors, and the market as a whole, perceive divestment as integral to the
longterm valuation of the fossil fuel industry. Lower share prices increase the costs of capital for
the fossil fuel industry, which in turn decreases their ability to explore new resources and exploit
proven resources.
And if the majority of proven reserves remains in the ground, we may be able to meet our climate
change goals.” 9
I completely agree that the job of a CFO and a fiduciary is to have a fiduciary responsibility to the
institution and/or people they represent, which includes, as part of that responsibility, to reduce the risk
of "lessthanoptimal investment returns.” The concern here is that divesting portfolios from fossil fuel
assets implies a higher risk of "lessthanoptimal investment returns" than the status quo. Several
studies (cited below) have determined this argument is not a valid concern, in fact the opposite is
highly probable:
8 https://www.investopedia.com/articles/economics/08/protestdivestmentsouthafrica.asp 9 https://theconversation.com/howdivestingoffossilfuelscouldhelpsavetheplanet88147
132

“Divesting from fossil fuels may benefit investors financially in both the long and short term.
According to global index provider MSCI, sustainable strategies have often performed in line with or
even better than their traditional counterparts over shorter and longer time periods.” 10
“Corporations that are actively managing and planning for climate change secure an 18% higher return
on investment (ROI) than companies that aren’t – and 67% higher than companies who refuse to
disclose their emissions. The findings could help answer the longdebated industry question of whether
sustainability undermines or improves financial results.” 11
Furthermore,
“the necessity to keep the resources in the ground has a direct impact on the valuation of fossil
fuel industry assets. They are predominantly influenced not only by production, but also by the
value of proven fossilfuel reserves. In other words, if these resources cannot be exploited, their
value will depreciate.
A sudden depreciation would lead to a burst of the socalled carbon bubble, leaving fossil fuel
investments stranded.
To avoid the risk of stranded assets, a number of influential private and institutional investors
have pledged to reduce their fossil fuel investments or divest from the fossil fuel industry
entirely.” 8
Please refer to page 43 of the 2014 World Energy Investment Outlook Special Report that answers 12
the question in detail of how large the risk is of stranded energy sector investment.
In early 2018, it cannot be disputed that the international fossil fuel divestment movement's momentum
continues to grow (e.g. New York City’s plan to divest $5 billion from fossil fuels ). If the Vermont 13 14
State Colleges System chooses at this point in time not to divest, either partially or fully, from fossil
fuels, I believe there is a higher risk of stranded assets to the current portfolio mix, as the fossilfree
divestment movement as a whole eventually causes a depreciation value of fossil fuel assets.
Ultimately, we owe it to future generations of Vermont State Colleges System students and
subsequently the vitality of the System itself for them to have some semblance of a habitable world
10 https://divestmentguide.org/howto/mythsandfactsaboutfossilfuelfreeinvesting/ 11 Granted, this Guardian article specifically references "sustainability strategies" but I would argue that divestment from fossil fuels can and should be considered part of a "sustainability strategy." This Guardian article cites this study: https://web.archive.org/.../CDPSP500leadersreport2014... (the link from the article no longer exists). 12 https://www.iea.org/publications/freepublications/publication/WEIO2014.pdf 13 https://www.newyorker.com/news/dailycomment/themovementtodivestfrom fossilfuelsgainsmomentum 14 https://www.theguardian.com/usnews/2018/jan/10/newyorkcity planstodivest5bnfromfossilfuelsandsueoilcompanies
133

and lifestyle. Partial or full divestment of the endowment from fossil fuel assets, and reinvestment in
comparable fossil fuelfree assets, while a complex process, is therefore a highly effective way to be an
institutionally proud leader in the State of Vermont, by standing up to the fossil fuel industry, and
hindering their capability to produce greenhouse gas emissions.
Respectfully submitted,
Jason Kaiser
134