finals 8
DESCRIPTION
sampleTRANSCRIPT
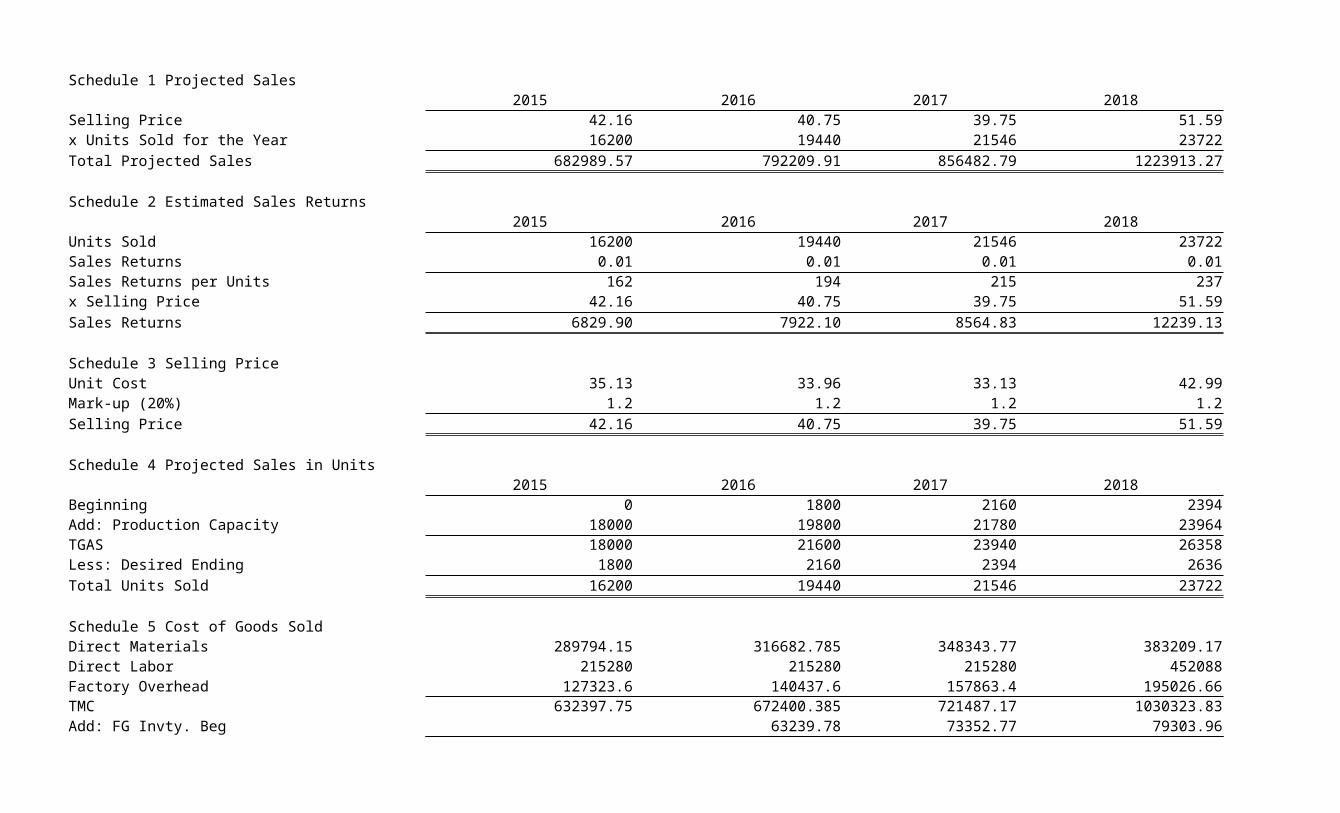
Schedule 1 Projected Sales2015 2016 2017 2018 2019
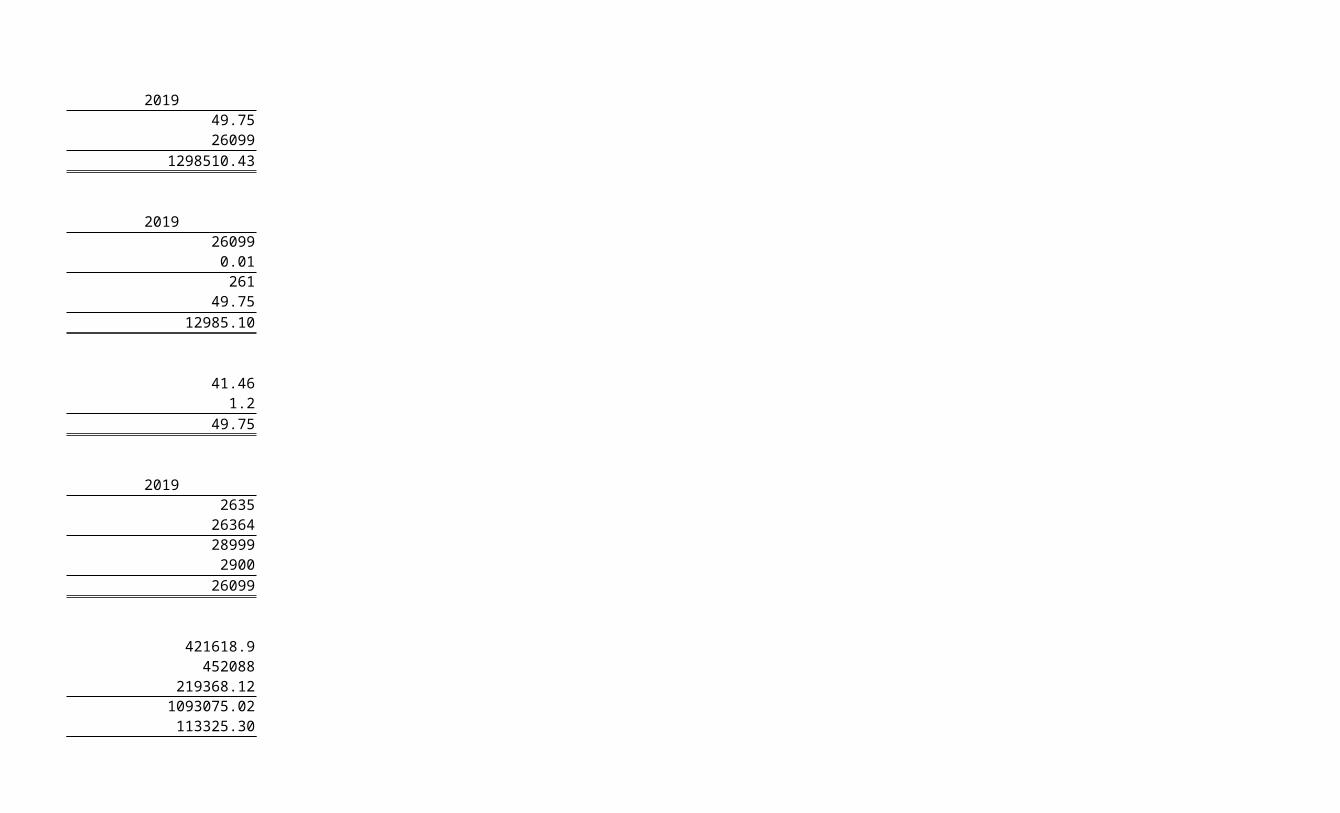
Selling Price 42.16 40.75 39.75 51.59 49.75x Units Sold for the Year 16200 19440 21546 23722 26099Total Projected Sales 682989.57 792209.91 856482.79 1223913.27 1298510.43
Schedule 2 Estimated Sales Returns2015 2016 2017 2018 2019
Units Sold 16200 19440 21546 23722 26099Sales Returns 0.01 0.01 0.01 0.01 0.01Sales Returns per Units 162 194 215 237 261x Selling Price 42.16 40.75 39.75 51.59 49.75Sales Returns 6829.90 7922.10 8564.83 12239.13 12985.10
Schedule 3 Selling PriceUnit Cost 35.13 33.96 33.13 42.99 41.46Mark-up (20%) 1.2 1.2 1.2 1.2 1.2Selling Price 42.16 40.75 39.75 51.59 49.75
Schedule 4 Projected Sales in Units2015 2016 2017 2018 2019
Beginning 0 1800 2160 2394 2635Add: Production Capacity 18000 19800 21780 23964 26364TGAS 18000 21600 23940 26358 28999Less: Desired Ending 1800 2160 2394 2636 2900Total Units Sold 16200 19440 21546 23722 26099
Schedule 5 Cost of Goods SoldDirect Materials 289794.15 316682.785 348343.77 383209.17 421618.9Direct Labor 215280 215280 215280 452088 452088Factory Overhead 127323.6 140437.6 157863.4 195026.66 219368.12TMC 632397.75 672400.385 721487.17 1030323.83 1093075.02Add: FG Invty. Beg 63239.78 73352.77 79303.96 113325.30

TGAS 632397.75 735640.16 794839.939272727 1109627.79166116 1206400.32258363Less: Desired FG End 63239.78 73352.77 79303.96 113325.30 120232.45COGS 569157.98 662287.39 715535.98 996302.49 1086167.87
Schedule 6 Unit CostTMC 632397.75 672400.385 721487.17 1030323.83 1093075.02Divided by: Units Produced 18000 19800 21780 23964 26364Unit Cost 35.13 33.96 33.13 42.99 41.46
Schedule 7 Raw Materials2015 2016 2017 2018 2019
Beginning Inventory 13761 15135.9 16651.8 18319.8Add: Purchases 263961 276571.9 304225.8 334675.8 368234 Freight In 39594.15 41485.785 45633.87 50201.37 55235.1Total DM Avail. 303555.15 331818.685 364995.57 401528.97 441788.9Less: Desired Ending 13761 15135.9 16651.8 18319.8 20170Total DM Used 289794.15 316682.785 348343.77 383209.17 421618.9
Schedule 8 Direct Labor2015 2016 2017 2018 2019
Seamstress Monthly Rate 9620 9620 9620 10101 10101x No. Of Workers 1 1 1 2 2Total - Seamstress 9620 9620 9620 20202 20202Production Worker 8320 8320 8320 8736 8736x No. Of Workers 1 1 1 2 2Total - PW 8320 8320 8320 17472 17472Total Monthly Rate 17940 17940 17940 37674 37674No. Of Months 12 12 12 12 12Annual Cost 215280 215280 215280 452088 452088
Schedule 9 Factory OH2015 2016 2017 2018 2019
Utilities Expenses 18660 17410 17410 19458 18208
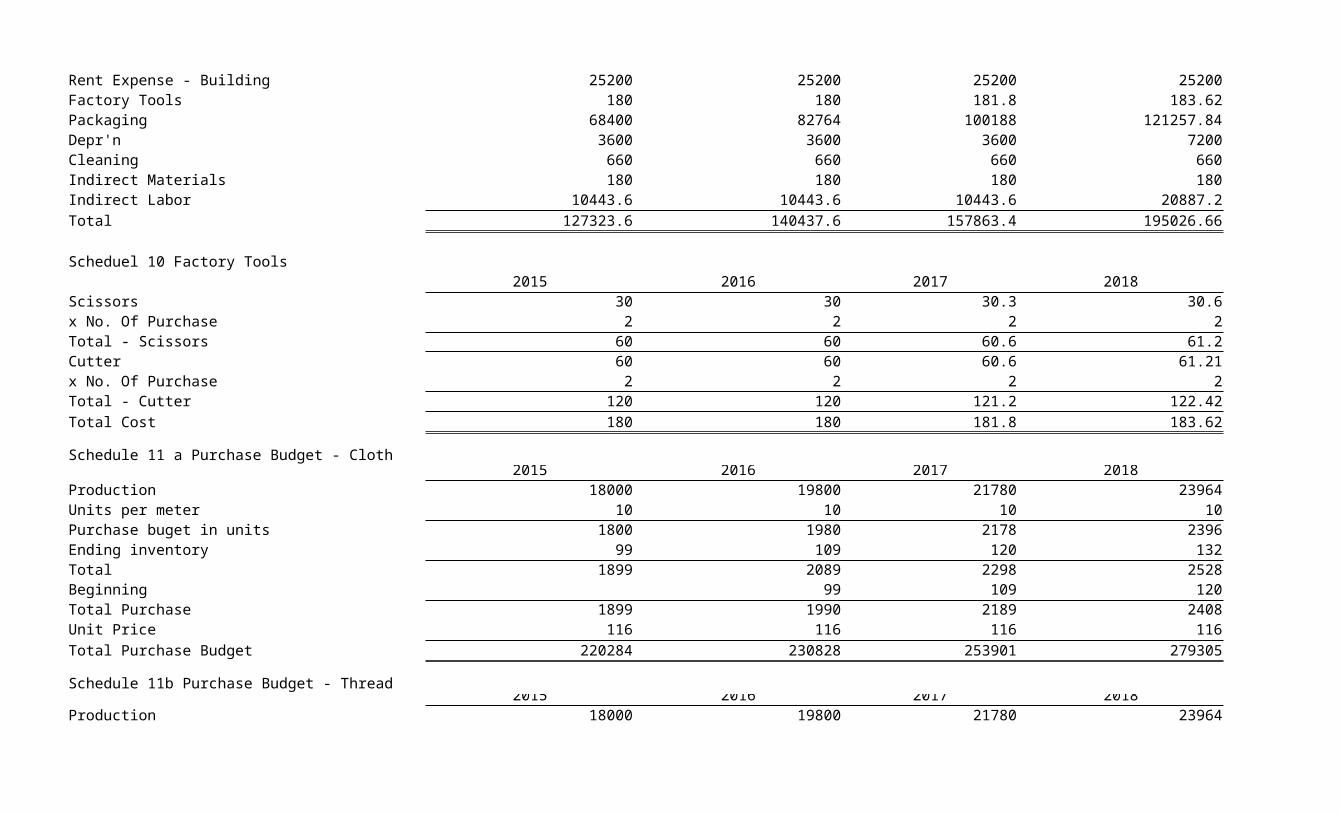
Rent Expense - Building 25200 25200 25200 25200 25200Factory Tools 180 180 181.8 183.62 185.44Packaging 68400 82764 100188 121257.84 146847.48Depr'n 3600 3600 3600 7200 7200Cleaning 660 660 660 660 660Indirect Materials 180 180 180 180 180Indirect Labor 10443.6 10443.6 10443.6 20887.2 20887.2Total 127323.6 140437.6 157863.4 195026.66 219368.12
Scheduel 10 Factory Tools2015 2016 2017 2018 2019
Scissors 30 30 30.3 30.6 30.9x No. Of Purchase 2 2 2 2 2Total - Scissors 60 60 60.6 61.2 61.8Cutter 60 60 60.6 61.21 61.82x No. Of Purchase 2 2 2 2 2Total - Cutter 120 120 121.2 122.42 123.64Total Cost 180 180 181.8 183.62 185.44
Schedule 11 a Purchase Budget - Cloth2015 2016 2017 2018 2019
Production 18000 19800 21780 23964 26364Units per meter 10 10 10 10 10Purchase buget in units 1800 1980 2178 2396 2636Ending inventory 99 109 120 132 145Total 1899 2089 2298 2528 2781Beginning 99 109 120 132Total Purchase 1899 1990 2189 2408 2649Unit Price 116 116 116 116 116Total Purchase Budget 220284 230828 253901 279305 307284
Schedule 11b Purchase Budget - Thread2015 2016 2017 2018 2019
Production 18000 19800 21780 23964 26364

Units per meter 50 50 50 50 50Purchase buget in units 360 396 435 479 527Ending inventory 20 22 24 26 29Total 380 418 459 505 556Beginning 20 22 24 26Total Purchase 380 398 437 481 530Unit Price 40 40 40 40 40Total Purchase Budget 15192 15910 17478 19254 21200
Schedule 11c Purchase Budget - Garter Cord2015 2016 2017 2018 2019
Production 18000 19800 21780 23964 26364Units per meter 20 20 20 20 20Purchase buget in units 900 990 1089 1198 1318Ending inventory 50 54 60 66 73Total 950 1044 1149 1264 1391Beginning 50 54 60 66Total Purchase 950 994 1095 1204 1325Unit Price 15 15 15 15 15Total Purchase Budget 14242.5 14916.75 16423.5 18058.5 19875
Schedule 11d Purchase Budget - Velcro Tape2015 2016 2017 2018 2019
Production 18000 19800 21780 23964 26364Units per meter 20 20 20 20 20Purchase buget in units 900 990 1089 1198 1318Ending inventory 50 54 60 66 73Total 950 1044 1149 1264 1391Beginning 50 54 60 66Total Purchase 950 994 1095 1204 1325Unit Price 15 15 15 15 15Total Purchase Budget 14242.5 14916.75 16423.5 18058.5 19875
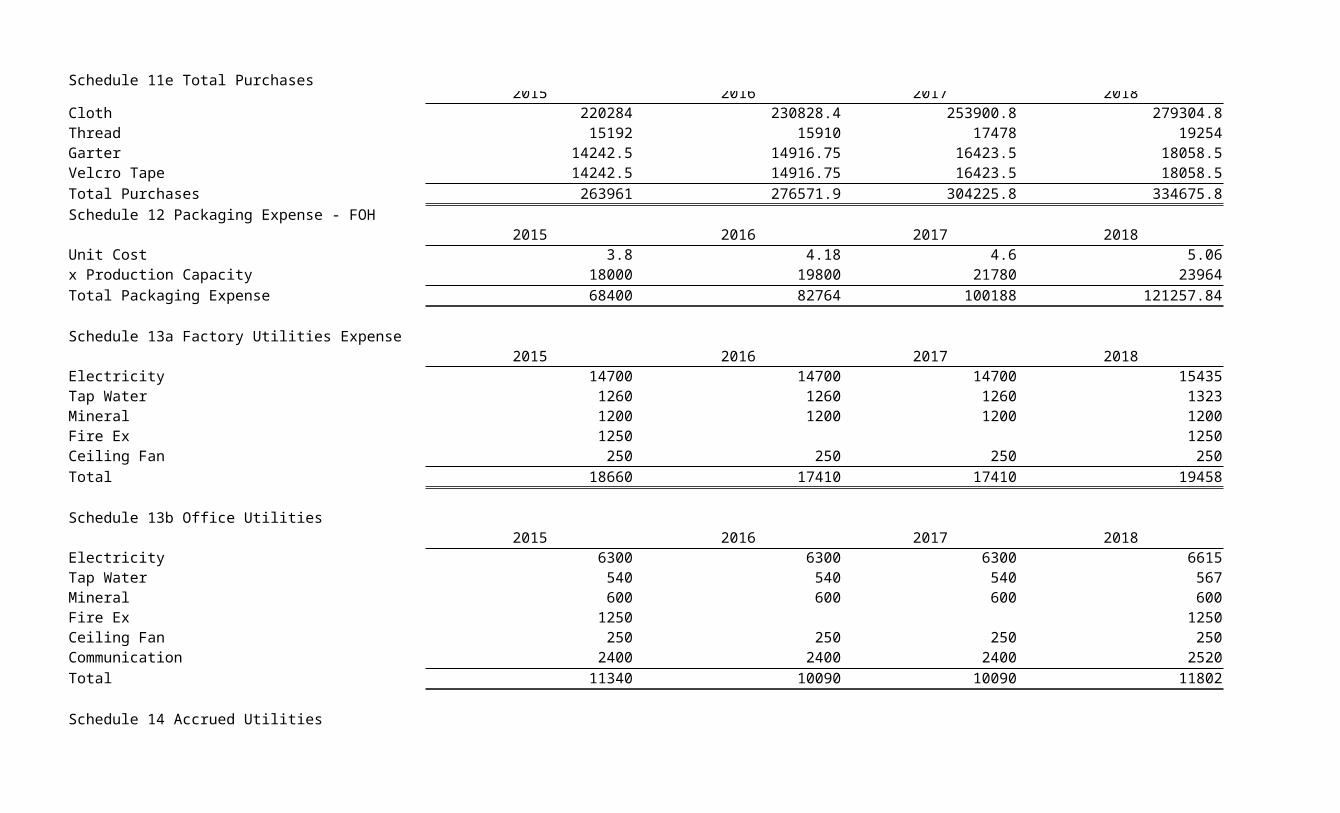
Schedule 11e Total Purchases2015 2016 2017 2018 2019
Cloth 220284 230828.4 253900.8 279304.8 307284Thread 15192 15910 17478 19254 21200Garter 14242.5 14916.75 16423.5 18058.5 19875Velcro Tape 14242.5 14916.75 16423.5 18058.5 19875Total Purchases 263961 276571.9 304225.8 334675.8 368234Schedule 12 Packaging Expense - FOH
2015 2016 2017 2018 2019Unit Cost 3.8 4.18 4.6 5.06 5.57x Production Capacity 18000 19800 21780 23964 26364Total Packaging Expense 68400 82764 100188 121257.84 146847.48
Schedule 13a Factory Utilities Expense2015 2016 2017 2018 2019
Electricity 14700 14700 14700 15435 15435Tap Water 1260 1260 1260 1323 1323Mineral 1200 1200 1200 1200 1200Fire Ex 1250 1250Ceiling Fan 250 250 250 250 250Total 18660 17410 17410 19458 18208
Schedule 13b Office Utilities2015 2016 2017 2018 2019
Electricity 6300 6300 6300 6615 6615Tap Water 540 540 540 567 567Mineral 600 600 600 600 600Fire Ex 1250 1250Ceiling Fan 250 250 250 250 250Communication 2400 2400 2400 2520 2520Total 11340 10090 10090 11802 10552
Schedule 14 Accrued Utilities
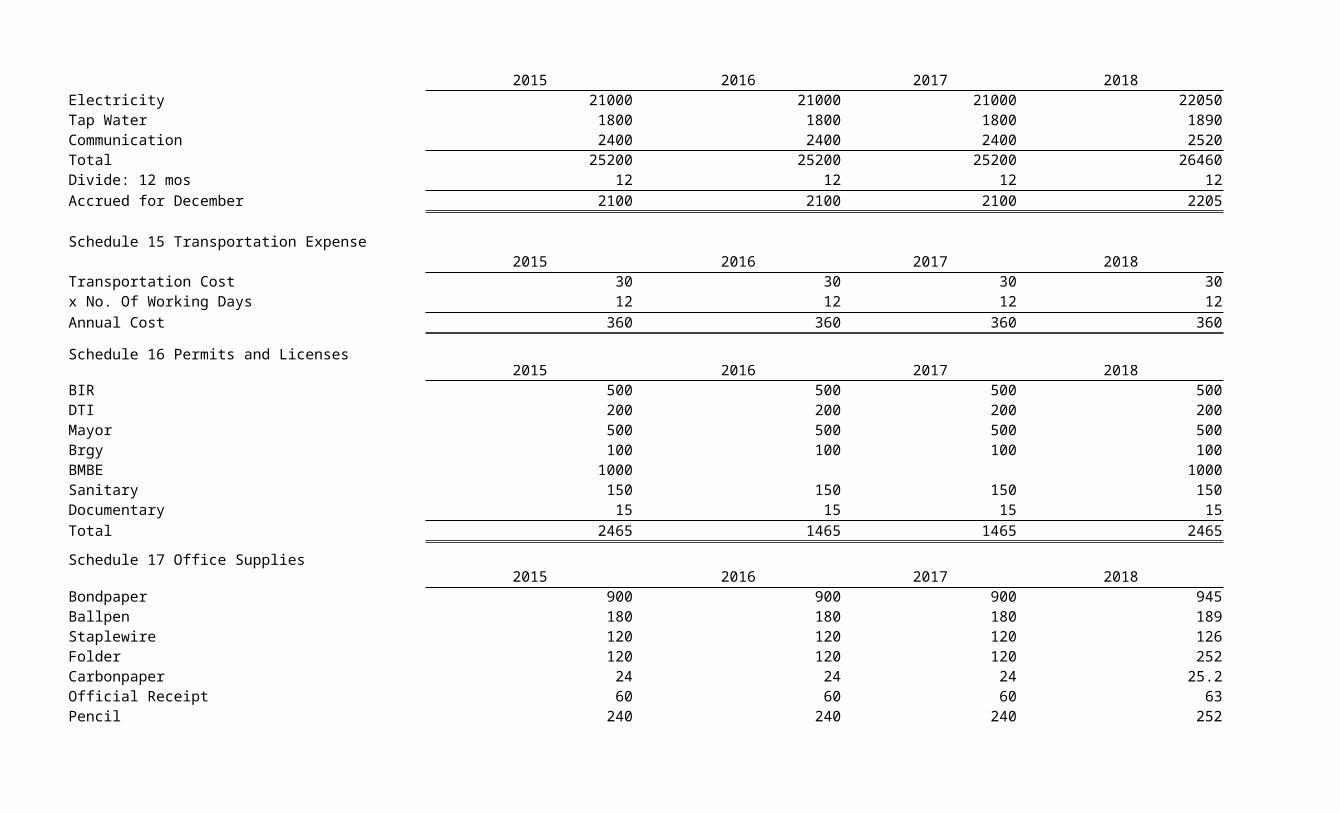
2015 2016 2017 2018 2019Electricity 21000 21000 21000 22050 22050Tap Water 1800 1800 1800 1890 1890Communication 2400 2400 2400 2520 2520Total 25200 25200 25200 26460 26460Divide: 12 mos 12 12 12 12 12Accrued for December 2100 2100 2100 2205 2205
Schedule 15 Transportation Expense2015 2016 2017 2018 2019
Transportation Cost 30 30 30 30 30x No. Of Working Days 12 12 12 12 12Annual Cost 360 360 360 360 360
Schedule 16 Permits and Licenses2015 2016 2017 2018 2019
BIR 500 500 500 500 500DTI 200 200 200 200 200Mayor 500 500 500 500 500Brgy 100 100 100 100 100BMBE 1000 1000Sanitary 150 150 150 150 150Documentary 15 15 15 15 15Total 2465 1465 1465 2465 1465
Schedule 17 Office Supplies2015 2016 2017 2018 2019
Bondpaper 900 900 900 945 945Ballpen 180 180 180 189 189Staplewire 120 120 120 126 126Folder 120 120 120 252 252Carbonpaper 24 24 24 25.2 25.2Official Receipt 60 60 60 63 63Pencil 240 240 240 252 252
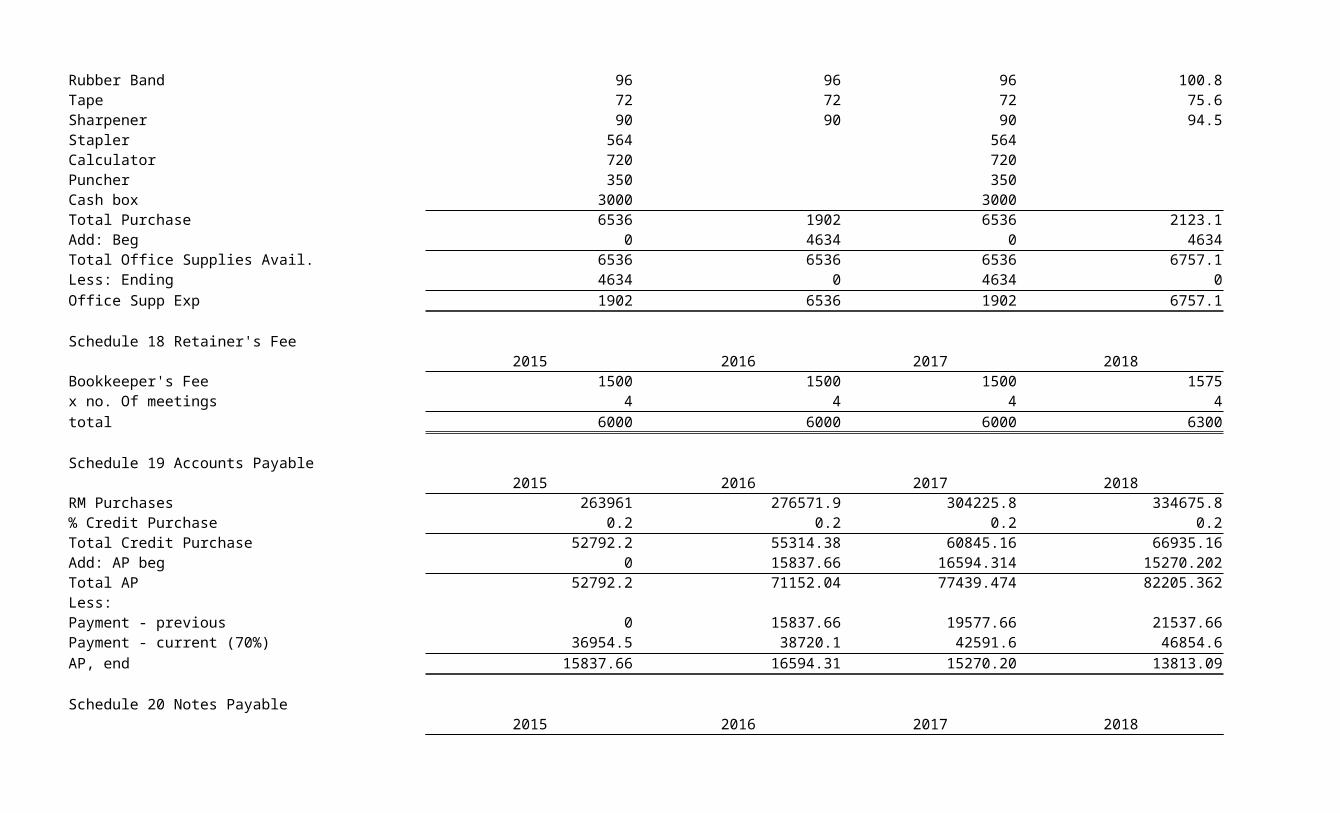
Rubber Band 96 96 96 100.8 100.8Tape 72 72 72 75.6 75.6Sharpener 90 90 90 94.5 94.5Stapler 564 564 592.2Calculator 720 720 756Puncher 350 350 367.5Cash box 3000 3000 3150Total Purchase 6536 1902 6536 2123.1 6988.8Add: Beg 0 4634 0 4634 0Total Office Supplies Avail. 6536 6536 6536 6757.1 6988.8Less: Ending 4634 0 4634 0 4865.7Office Supp Exp 1902 6536 1902 6757.1 2123.1
Schedule 18 Retainer's Fee2015 2016 2017 2018 2019
Bookkeeper's Fee 1500 1500 1500 1575 1575x no. Of meetings 4 4 4 4 4total 6000 6000 6000 6300 6300
Schedule 19 Accounts Payable2015 2016 2017 2018 2019
RM Purchases 263961 276571.9 304225.8 334675.8 368234% Credit Purchase 0.2 0.2 0.2 0.2 0.2Total Credit Purchase 52792.2 55314.38 60845.16 66935.16 73646.8Add: AP beg 0 15837.66 16594.314 15270.202 13813.09Total AP 52792.2 71152.04 77439.474 82205.362 87459.89Less:Payment - previous 0 15837.66 19577.66 21537.66 23679.9Payment - current (70%) 36954.5 38720.1 42591.6 46854.6 51552.8AP, end 15837.66 16594.31 15270.20 13813.09 12227.23
Schedule 20 Notes Payable2015 2016 2017 2018 2019

Principal 30000 20000 10000Less: Payment 10000 10000 10000NP, bal 20000 10000 0
Current Portion 10000 10000Non-current portion 10000 0NP, Bal 20000 10000
Schedule 21 Interest Expense2015 2016 2017 2018 2019
NP 30000 20000 10000Interest rate 5% 5% 5%Total expense 1500 1000 500
Schedule 22 Advertising Expense2015 2016 2017 2018 2019
Flyers 1500 1500 1500 1500 1500Tarpaulins 1500 1500 1500 1500 1500Business Cards 900 900 900 900 900Total 3900 3900 3900 3900 3900
Schedule 23 EBC2015 2016 2017 2018 2019
SSS 457.8 457.8 457.8 915.6 915.6PhilHealth 212.5 212.5 212.5 425 425PAG-IBIG 200 200 200 400 400Total 870.3 870.3 870.3 1740.6 1740.6x no. Of months 12 12 12 12 12Total Employee Benefits 10443.6 10443.6 10443.6 20887.2 20887.2
Schedule 24a - Accrued SSS Contribution2015 2016 2017 2018 2019
Workers 2 2 2 4 4
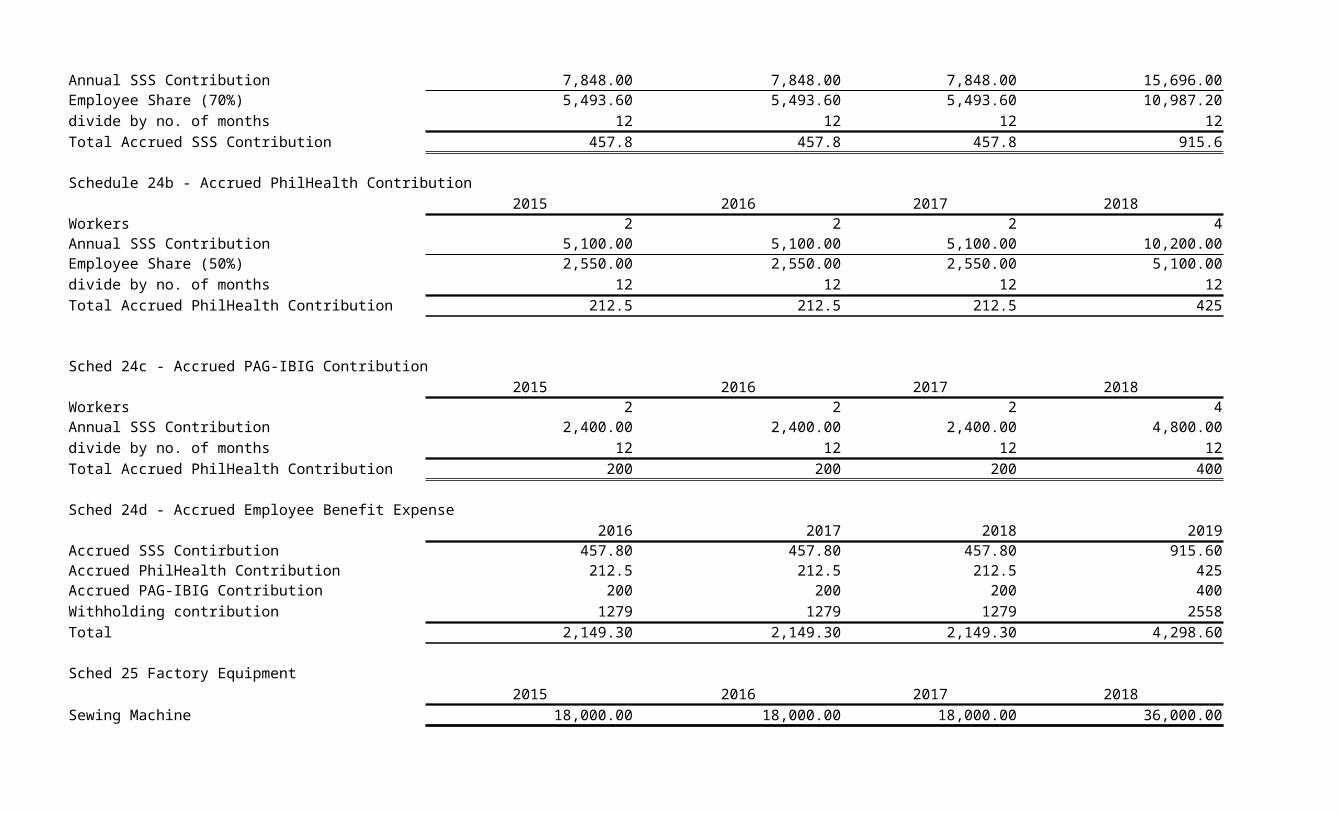
Annual SSS Contribution 7,848.00 7,848.00 7,848.00 15,696.00 15,696.00Employee Share (70%) 5,493.60 5,493.60 5,493.60 10,987.20 10,987.20divide by no. of months 12 12 12 12 12Total Accrued SSS Contribution 457.8 457.8 457.8 915.6 915.6
Schedule 24b - Accrued PhilHealth Contribution2015 2016 2017 2018 2019
Workers 2 2 2 4 4Annual SSS Contribution 5,100.00 5,100.00 5,100.00 10,200.00 10,200.00Employee Share (50%) 2,550.00 2,550.00 2,550.00 5,100.00 5,100.00divide by no. of months 12 12 12 12 12Total Accrued PhilHealth Contribution 212.5 212.5 212.5 425 425
Sched 24c - Accrued PAG-IBIG Contribution2015 2016 2017 2018 2019
Workers 2 2 2 4 4Annual SSS Contribution 2,400.00 2,400.00 2,400.00 4,800.00 4,800.00divide by no. of months 12 12 12 12 12Total Accrued PhilHealth Contribution 200 200 200 400 400
Sched 24d - Accrued Employee Benefit Expense2016 2017 2018 2019 2020
Accrued SSS Contirbution 457.80 457.80 457.80 915.60 915.60Accrued PhilHealth Contribution 212.5 212.5 212.5 425 425Accrued PAG-IBIG Contribution 200 200 200 400 400Withholding contribution 1279 1279 1279 2558 2558Total 2,149.30 2,149.30 2,149.30 4,298.60 4,298.60
Sched 25 Factory Equipment2015 2016 2017 2018 2019
Sewing Machine 18,000.00 18,000.00 18,000.00 36,000.00 36,000.00
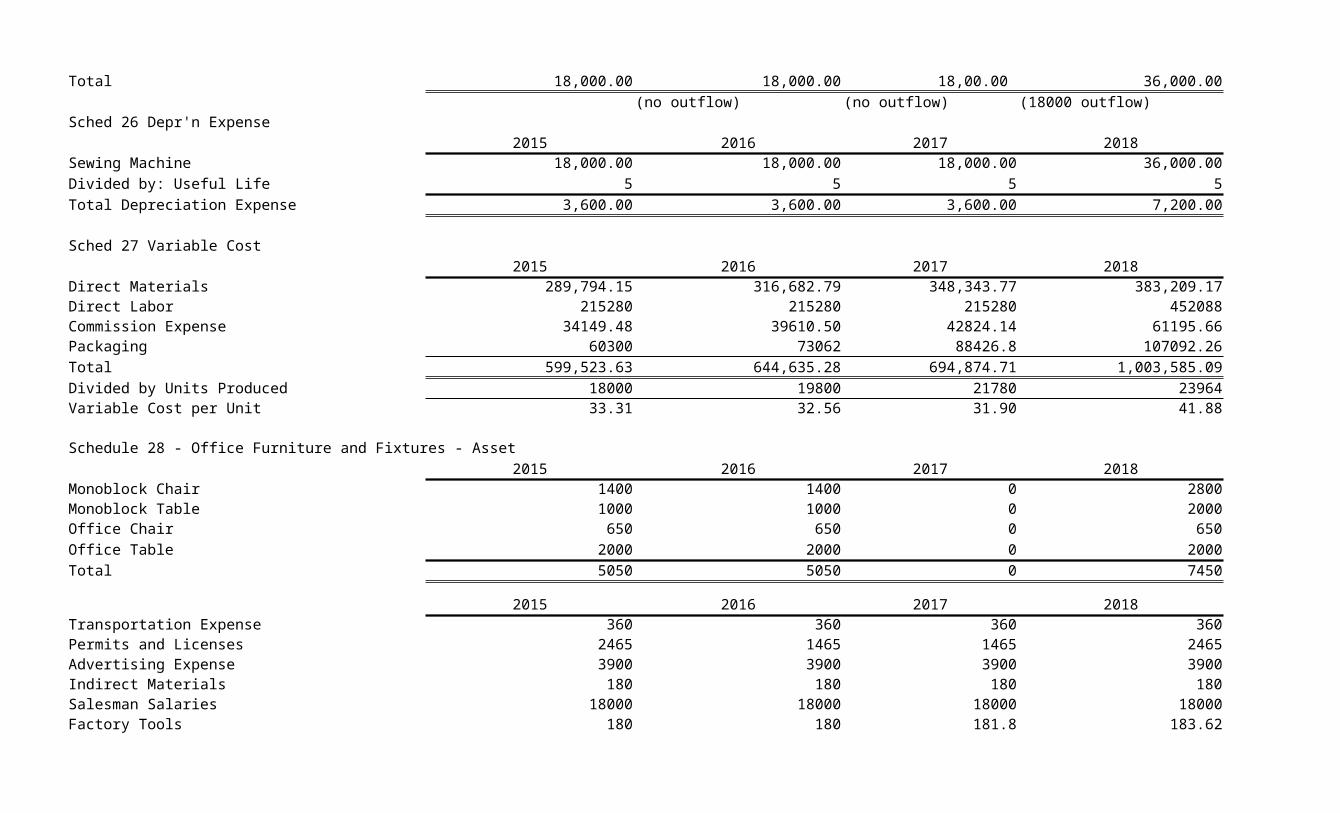
Total 18,000.00 18,000.00 36,000.00(no outflow) (no outflow) (18000 outflow) (no outflow)
Sched 26 Depr'n Expense2015 2016 2017 2018 2019
Sewing Machine 18,000.00 18,000.00 18,000.00 36,000.00 36,000.00Divided by: Useful Life 5 5 5 5 5Total Depreciation Expense 3,600.00 3,600.00 3,600.00 7,200.00 7,200.00
Sched 27 Variable Cost2015 2016 2017 2018 2019
Direct Materials 289,794.15 316,682.79 348,343.77 383,209.17 421,618.90Direct Labor 215280 215280 215280 452088 452088Commission Expense 34149.48 39610.50 42824.14 61195.66 64925.52Packaging 60300 73062 88426.8 107092.26 129661.68Total 599,523.63 644,635.28 694,874.71 1,003,585.09 1,068,294.10Divided by Units Produced 18000 19800 21780 23964 26364Variable Cost per Unit 33.31 32.56 31.90 41.88 40.52
Schedule 28 - Office Furniture and Fixtures - Asset2015 2016 2017 2018 2019
Monoblock Chair 1400 1400 0 2800 2800Monoblock Table 1000 1000 0 2000 2000Office Chair 650 650 0 650 650Office Table 2000 2000 0 2000 2000Total 5050 5050 0 7450 7450
2015 2016 2017 2018 2019Transportation Expense 360 360 360 360 360Permits and Licenses 2465 1465 1465 2465 1465Advertising Expense 3900 3900 3900 3900 3900Indirect Materials 180 180 180 180 180Salesman Salaries 18000 18000 18000 18000 18000Factory Tools 180 180 181.8 183.62 185.44
18,00.00 36,000.00

Retainer’s Fee 6000 6000 6000 6300 6300Cleaning Supplies Expense 660 660 660 660 660Office Supplies Expense 6536 1902 6536 2123.1 6988.8Factory Equipment - Depreciation 3,600.00 3,600.00 3,600.00 7,200.00 7,200.00Office Utilities Expense 11,340.00 10,090.00 10,090.00 11,802.00 10,552.00Factory Utilities Expense 18,660.00 17,410.00 17,410.00 19,458.00 18,208.00Rent Expense - Building 36000 36000 36000 36000 36000Indirect Labor - EBC 10443.6 10443.6 10443.6 20887.2 20887.2Interest Expense 1500 1000 500 0 0Business Plan Cost 1204Total Fixed Cost 121028.6 111190.6 115326.4 129518.92 130886.44
Sched 29 Operating Expense2015 2016 2017 2018 2019
Selling Expense:Packaging Expense 600.00 600.00 600.00 600.00 600.00Transportation Expense 360.00 360.00 360.00 360.00 360.00Commission Expense 34,149.48 39,610.50 42,824.14 61,195.66 64,925.52Tax Expense - OPT 20,284.79 23,528.63 25,437.54 36,350.22 38,565.76Advertising Expense 3,900.00 3,900.00 3,900.00 3,900.00 3,900.00Total Selling Expense 59,294.27 67,999.13 73,121.68 102,405.89 108,351.28Administrative Expense:Rent Expense - Building 10800.00 10800.00 10800.00 10800.00 10800.00Permits and Licenses 2,465.00 1,465.00 1,465.00 2,465.00 1,465.00Office Supplies Expense 1,902.00 6,536.00 1,902.00 6,757.10 2,123.10Utilities Expense 11,340.00 10,090.00 10,090.00 11,802.00 10,552.00Retainer's Fee 6,000.00 6,000.00 6,000.00 6,000.00 6,300.00Other Expenses 5,050.00Business Plan Cost 1,204.00Total Administrative Expense 33,711.00 34,891.00 35,307.00 37,824.10 31,240.10Total Operating Expense 93,005.27 102,890.13 108,428.68 140,229.99 139,591.38
Uniprod Manufacturing
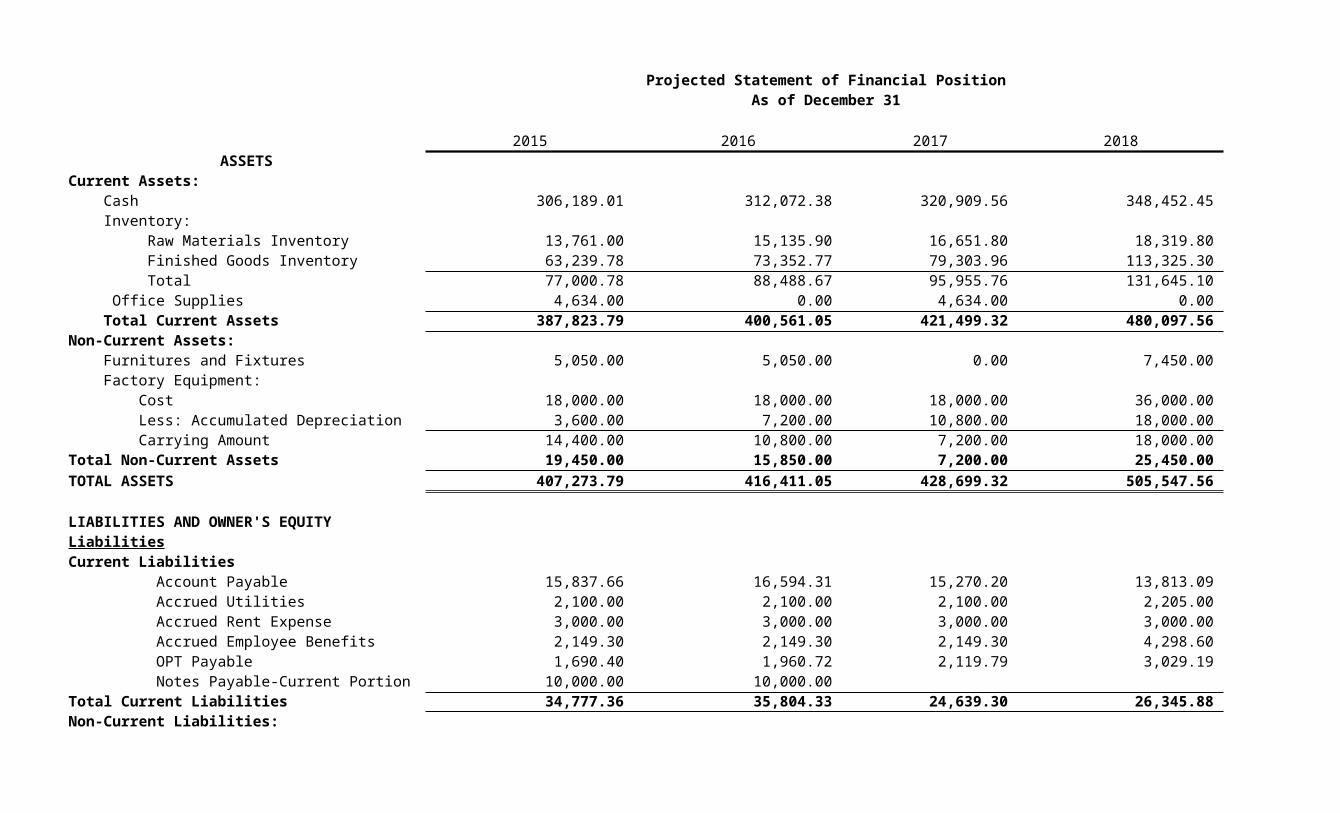
Projected Statement of Financial PositionAs of December 31
2015 2016 2017 2018 2019ASSETS
Current Assets: Cash 306,189.01 312,072.38 320,909.56 348,452.45 400,394.25 Inventory: Raw Materials Inventory 13,761.00 15,135.90 16,651.80 18,319.80 20,170.00 Finished Goods Inventory 63,239.78 73,352.77 79,303.96 113,325.30 120,232.45 Total 77,000.78 88,488.67 95,955.76 131,645.10 140,402.45 Office Supplies 4,634.00 0.00 4,634.00 0.00 4,865.70 Total Current Assets 387,823.79 400,561.05 421,499.32 480,097.56 545,662.40 Non-Current Assets: Furnitures and Fixtures 5,050.00 5,050.00 0.00 7,450.00 7,450.00 Factory Equipment: Cost 18,000.00 18,000.00 18,000.00 36,000.00 36,000.00 Less: Accumulated Depreciation 3,600.00 7,200.00 10,800.00 18,000.00 25,200.00 Carrying Amount 14,400.00 10,800.00 7,200.00 18,000.00 10,800.00 Total Non-Current Assets 19,450.00 15,850.00 7,200.00 25,450.00 18,250.00 TOTAL ASSETS 407,273.79 416,411.05 428,699.32 505,547.56 563,912.40
LIABILITIES AND OWNER'S EQUITYLiabilitiesCurrent Liabilities Account Payable 15,837.66 16,594.31 15,270.20 13,813.09 12,227.23 Accrued Utilities 2,100.00 2,100.00 2,100.00 2,205.00 2,205.00 Accrued Rent Expense 3,000.00 3,000.00 3,000.00 3,000.00 3,000.00 Accrued Employee Benefits 2,149.30 2,149.30 2,149.30 4,298.60 4,298.60 OPT Payable 1,690.40 1,960.72 2,119.79 3,029.19 3,213.81 Notes Payable-Current Portion 10,000.00 10,000.00 Total Current Liabilities 34,777.36 35,804.33 24,639.30 26,345.88 24,944.64 Non-Current Liabilities:

Notes Payable-Non-Current Portion 10,000.00 Total Non-Current Liabilities 10,000.00 Total Liabilities 44,777.36 35,804.33 24,639.30 26,345.88 24,944.64 Owner's Equity Owner's Capital 350000.00 362,496.43 380,606.72 404,060.02 479,201.68 Add: Net Income 12496.43 18110.29 23453.30 75141.66 59766.07Total Owner's Equity 362,496.43 380,606.72 404,060.02 479,201.68 538,967.75TOTAL LIABILITIES AND OWNER'S EQUITY 407,273.79 416,411.05 428,699.32 505,547.56 563,912.40
UniProd ManufacturingProjected Income Statement
For the Year Ended, December 31
2015 2016 2017 2018 2019Projected Sales 682,989.57 792,209.91 856,482.79 1,223,913.27 1,298,510.43 Less: Estimated Sales Returns 6,829.90 7,922.10 8,564.83 12,239.13 12,985.10 Net Sales 676,159.67 784,287.81 847,917.96 1,211,674.14 1,285,525.33 Less: Cost of Goods Sold 569,157.98 662,287.39 715,535.98 996,302.49 1,086,167.87 Gross Profit 107,001.70 122,000.42 132,381.98 215,371.65 199,357.46 Less: Operating Expense 93,005.27 102,890.13 108,428.68 140,229.99 139,591.38 Operating Income 13,996.43 19,110.29 23,953.30 75,141.66 59,766.07 Less: Interest Expense 1,500.00 1,000.00 500.00 0.00 0.00 Net Income 12,496.43 18,110.29 23,453.30 75,141.66 59,766.07
UniProd ManufacturingProjected Changes in Owner's Equity
For the Year Ended, December 31
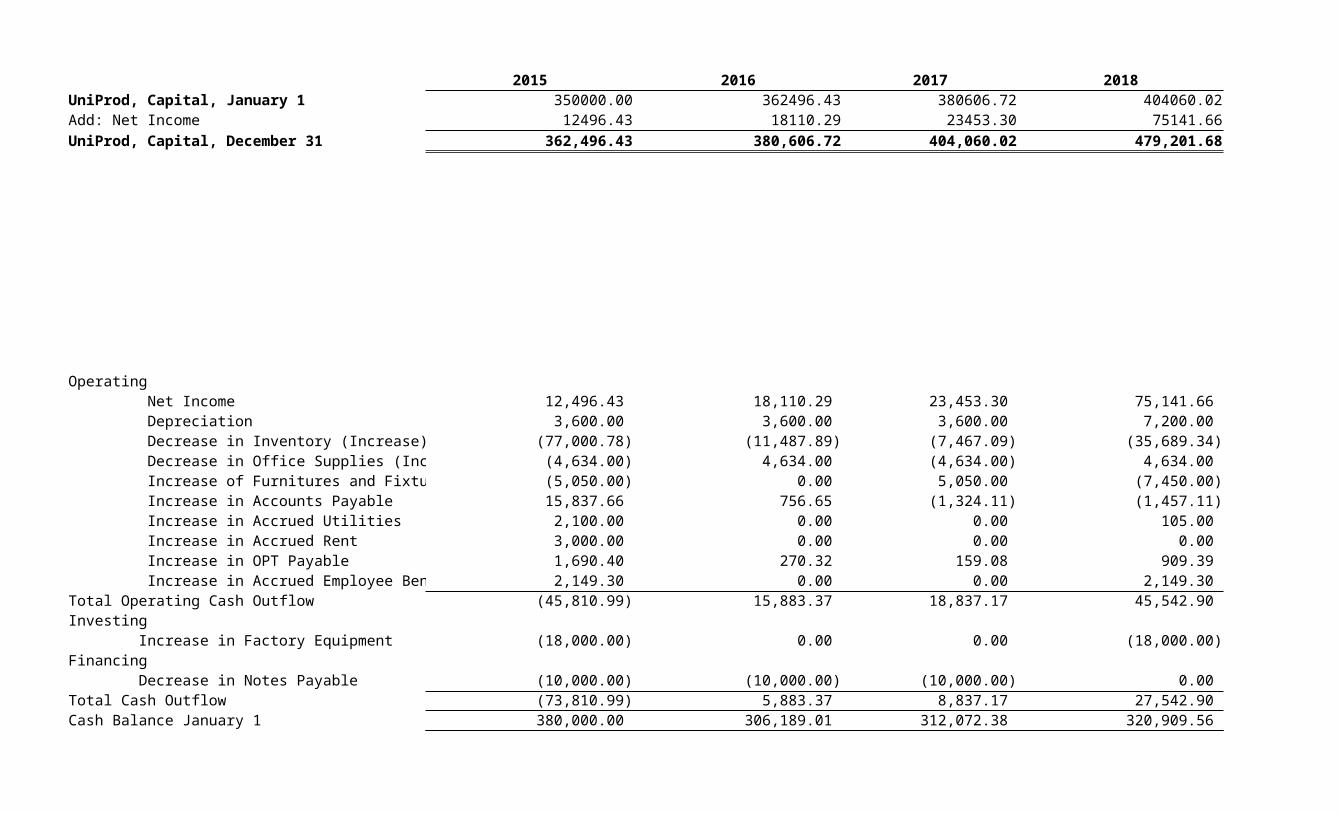
2015 2016 2017 2018 2019UniProd, Capital, January 1 350000.00 362496.43 380606.72 404060.02 479201.68Add: Net Income 12496.43 18110.29 23453.30 75141.66 59766.07UniProd, Capital, December 31 362,496.43 380,606.72 404,060.02 479,201.68 538,967.75
Operating Net Income 12,496.43 18,110.29 23,453.30 75,141.66 59,766.07 Depreciation 3,600.00 3,600.00 3,600.00 7,200.00 7,200.00 Decrease in Inventory (Increase) (77,000.78) (11,487.89) (7,467.09) (35,689.34) (8,757.35) Decrease in Office Supplies (Increase) (4,634.00) 4,634.00 (4,634.00) 4,634.00 (4,865.70) Increase of Furnitures and Fixtures (5,050.00) 0.00 5,050.00 (7,450.00) 0.00 Increase in Accounts Payable 15,837.66 756.65 (1,324.11) (1,457.11) (1,585.86) Increase in Accrued Utilities 2,100.00 0.00 0.00 105.00 0.00 Increase in Accrued Rent 3,000.00 0.00 0.00 0.00 0.00 Increase in OPT Payable 1,690.40 270.32 159.08 909.39 184.63 Increase in Accrued Employee Benifits 2,149.30 0.00 0.00 2,149.30 0.00 Total Operating Cash Outflow (45,810.99) 15,883.37 18,837.17 45,542.90 51,941.80 Investing Increase in Factory Equipment (18,000.00) 0.00 0.00 (18,000.00) 0.00 Financing Decrease in Notes Payable (10,000.00) (10,000.00) (10,000.00) 0.00 0.00 Total Cash Outflow (73,810.99) 5,883.37 8,837.17 27,542.90 51,941.80 Cash Balance January 1 380,000.00 306,189.01 312,072.38 320,909.56 348,452.45

Cash Balance December 31 306,189.01 312,072.38 320,909.56 348,452.45 400,394.25
Schedule 2X OPT Expense2015 2016 2017 2018 2019
Net Sales 676,159.67 784,287.81 847,917.96 1,211,674.14 1,285,525.33 Percentage Tax 0.03 0.03 0.03 0.03 0.03OPT/Tax Expense 20284.79 23528.63 25437.54 36350.22 38565.76
Schedule 2X OPT Payable2015 2016 2017 2018 2019
Net Sales 676,159.67 784,287.81 847,917.96 1,211,674.14 1,285,525.33 Divided by No. of Months 12 12 12 12 12Est. Sales per Month 56346.64 65357.32 70659.83 100972.84 107127.11Percentage Tax 0.03 0.03 0.03 0.03 0.03OPT Payable 1690.40 1960.72 2119.79 3029.19 3213.81
Ratios: Column1 Column2 Column3 Column4 Column52015 2016 2017 2018 2019
Current Ratio 11.15 11.19 17.11 18.22 21.87 Quick Ratio 8.80 8.72 13.02 13.23 16.05 Invty Turnover 7.39 8.00 7.76 8.75 7.99No. Of Days Inventory 49.38 45.60 47.04 41.69 45.71Debt to Equity 0.12 0.09 0.06 0.05 0.05 Debt to Asset 0.11 0.09 0.06 0.05 0.04 Times Interest Earned 9.33 19.11 47.91 0 0Net Margin Profit on Sales 0.018 0.023 0.028 0.062 0.046Operating Leverage 7.64 6.38 5.53 2.87 3.34Return on Assets 0.03 0.04 0.06 0.16 0.11
Breakeven Sales2015 2016 2017 2018 2019
Fixed Cost 121028.6 111190.6 115326.4 129518.92 130886.44Divided by: Contribution Margin
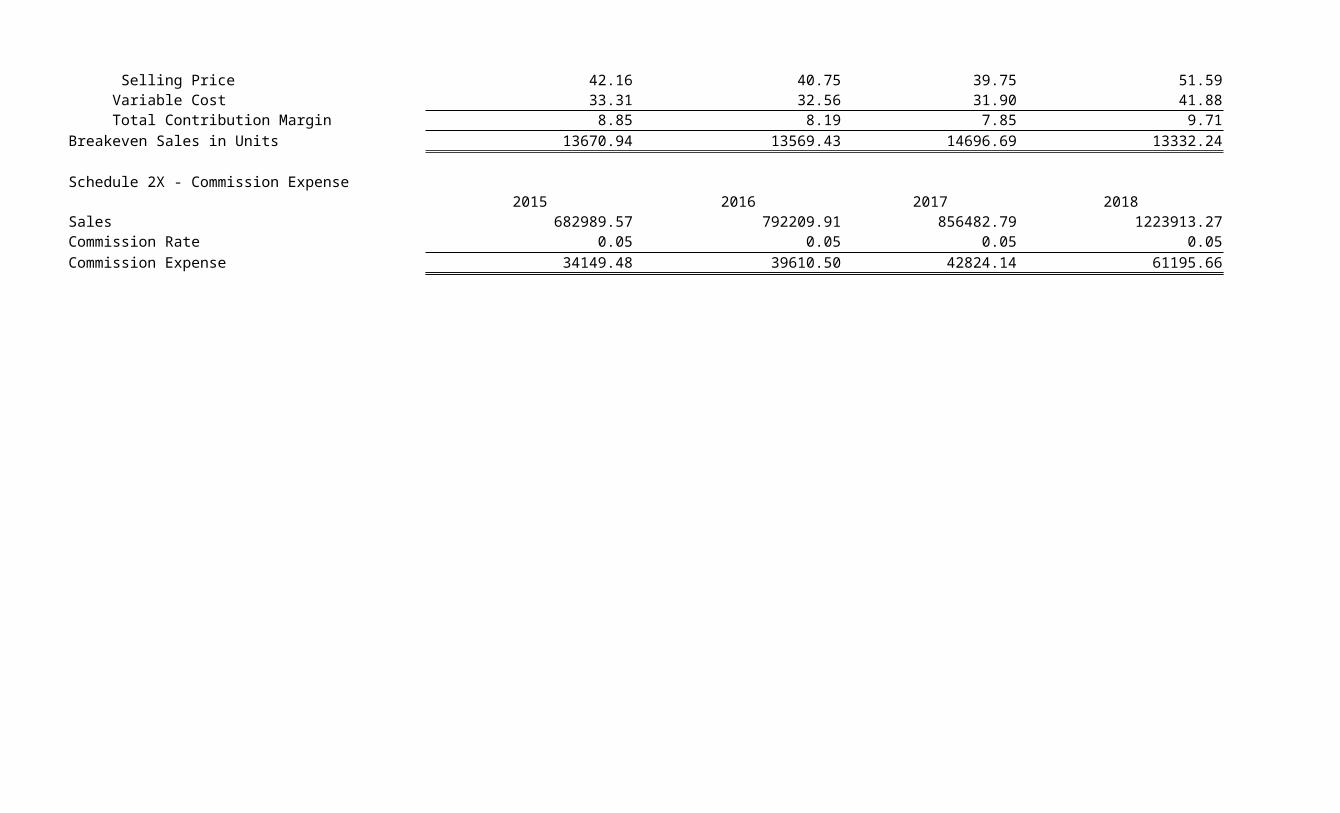
Selling Price 42.16 40.75 39.75 51.59 49.75 Variable Cost 33.31 32.56 31.90 41.88 40.52 Total Contribution Margin 8.85 8.19 7.85 9.71 9.23Breakeven Sales in Units 13670.94 13569.43 14696.69 13332.24 14177.27
Schedule 2X - Commission Expense2015 2016 2017 2018 2019
Sales 682989.57 792209.91 856482.79 1223913.27 1298510.43Commission Rate 0.05 0.05 0.05 0.05 0.05Commission Expense 34149.48 39610.50 42824.14 61195.66 64925.52
UniProd ManufacturingProjected Income Statement
For the Year Ended, December 312015 2016 2017
Projected Sales #REF! #REF! #REF!Less: Estimated Sales Returns #REF! #REF! #REF!Net Sales #REF! #REF! #REF!Less: Cost of Goods Sold #REF! #REF! #REF!Gross Profit #REF! #REF! #REF!Less: Operating Expense #REF! #REF! #REF!Operating Income #REF! #REF! #REF!Less: Interest Expense 1,500.00 1,000.00 500.00 Net Income #REF! #REF! #REF!

2018 2019#REF! #REF!#REF! #REF!#REF! #REF!#REF! #REF!#REF! #REF!#REF! #REF!#REF! #REF!0.00 0.00
#REF! #REF!