finalreportp - meat & livestock australia
TRANSCRIPT

finalrepport
This publication is published by Meat & Livestock Australia Limited ABN 39 081 678 364 (MLA). Care is taken to ensure the accuracy of information in the publication. Reproduction in whole or in part of this publication is prohibited without the prior written consent of MLA.
Project code: FLOT. 131
Prepared by: Bob Hunter
Peter Kennedy
CSIRO LIVESTOCK INDUSTRIES
Jim Sparke
AQUILA AGRIBUSINESS PTY
LIMITED
Aaron Cottrell
Geoff Rigby
Peter Scaife
Phil Brown
Louis Wibberley
CSIRO ENERGY TECHNOLOGY
Date published: September 2007
ISBN: 9781741918317
PUBLISHED BY Meat & Livestock Australia Limited Locked Bag 991 NORTH SYDNEY NSW 2059
Impact on the cattle feedlot industry in Eastern Australia from grain-based ethanol production

Impact on the cattle feedlot industry in Eastern Australia from grain-based ethanol production
2
Abstract
The Australian Government is committed to the establishment of a grain-based ethanol production industry. Any increased competition for grain could adversely affect the cattle feedlot industry. While the sector could benefit from a plentiful supply of distillers grain by-product, if it became available, the most energetically efficient and environmentally friendly ethanol plants use the distillers grains as a source of fuel within the plant, and none becomes available for sale to the livestock industries.
The additional grain demands for E10 ethanol production could be met from national grain production in years of above average and average yields, but not in years of low yields. Within a region with a major feedlot capacity, one 160ML ethanol plant would lead to grain being imported into the region in some years. If distillers grains were available for inclusion in feedlot diets, a 160 ML plant would provide enough sorghum distillers grain to support a ration contribution of 25% of the dry matter for 80,000 feedlot cattle every day of the year within the zone of economic transport of the distillers grain.

Impact on the cattle feedlot industry in Eastern Australia from grain-based ethanol production
3
Executive Summary
1 INTRODUCTION
In recent years, the Australian Federal Government has articulated a commitment to the development of the biofuels industry through the production of biodiesel and ethanol, with attention currently being focussed on expanding Australia’s production capacity.
Australia currently has an annual ethanol production capacity of about 165 ML, although actual production is usually in the range of 108–145 ML. The Australian Government has introduced a number of measures to encourage ethanol production as part of a broader policy agenda to promote the use of biofuels in Australia. These measures have three main components as outlined below:
A commitment that biofuels produced in Australia from renewable resources should contribute at least 350 ML annually to Australia’s total fuel supply by June 2010. [It should be noted that this target of 350ML includes both biodiesel and ethanol production.]
The Biofuels Capital Grants Program [introduced in July 2003 and modified in March 2004] to provide one-off capital subsidy for new and/or expanded projects producing biofuels from renewable resources or biomass waste products. Grants were limited to a maximum of $10 million per project, and at its completion, seven projects were offered grants totalling $37.6 million – a total of $12.4 million for three ethanol projects and the balance for the four bio-diesel projects.
The Ethanol Production Grants Program which effectively offsets the excise on domestically produced biofuels until 30 June 2011. From 1 July 2011 to 1 July 2015, the excise will be phased in through five equal annual instalments to reach a final rate of 19.1 cents per litre for bio-diesel and 12.5 cents per litre for ethanol. The final rate represents a 50% discount on excise as compared to other fuels with the same energy content. It will apply to imported ethanol as well.
About 10 new plants are in various stages of planning. Their production capacity is projected to be 1265 ML per annum. Currently there is uncertainty surrounding the details of some proposals. The planning for some has progressed, albeit slowly, and some are stalled. Uncertainties about the cost and supply of feed grains and the sale of ethanol and the by–products are limiting progress. However it is realistic to estimate that across Australia, feed-grain based ethanol production may contribute in the order of 275 to 350 ML annually by 2010. This equates to 1.5% of Australian petrol consumption. If Australia were to mandate 10% ethanol in petrol (E10), 2500 ML of ethanol would be used annually.
Because of concerns about the possible impacts on grain supply for the cattle feedlot industry related to the use of grain for ethanol production, the MLA commissioned this project to address the pertinent major issues. These are, in particular, the potential impact on grain supplies, the availability of the distillers grain by-product, and the capacity of the feedlot industry to utilise this by-product. The particular focus was to establish the likely supply of distillers grain products under Australian crop and ethanol production conditions, and to assess its potential usage in the feedlot industry, taking into consideration its suitability as a feedstuff, costs, established industry practice, infrastructure, and operational considerations.

Impact on the cattle feedlot industry in Eastern Australia from grain-based ethanol production
4
The project provides the Australian feedlot industry, and its participants, with detailed information on the likely impact on grain supply, the resource energy use and the environmental consequences of an ethanol industry with a competitive advantage for grain purchase. It also provides current information on the nutritive value of distillers grains and the extent to which they can be included in feedlot diets.
The objectives of the project were to:
Establish the likely grain usage (total and regional) and subsequent production (total and regional) of distillers grain given current and proposed development of grain–based ethanol production facilities to meet the existing government annual target of 350 ML ethanol production, assuming 75% of this production will occur from feed grains.
Extrapolate this data to evaluate the potential situation should the government move to a position of mandating an E10 inclusion policy.
Provide a technical assessment of the energetic costs and benefits of ethanol production from grain, under Australian crop and ethanol production conditions.
Determine a realistic feed value of both the wet and dried distillers grain products under Australian conditions and establish a protocol, which accounts for the variability in the base product because of ethanol extraction efficiency and variable water content, for determining this value.
Evaluate the likely potential usage of the wet and dried distillers grains in the feedlot sector, given the location, production quantities, and costs of the distillers grain supply in relation to potential feedlot users and likely ration inclusion levels.
Recommend any additional R&D necessary to establish the value of wet and dried distillers grain under Australian conditions.
The project was undertaken by a consortium of CSIRO Divisions (Livestock Industries, and Energy Technology), and Aquila Agribusiness Pty Limited. Each of these groups has produced a separate report (included as Appendices), with this report summarising the approach and key findings relevant to the objectives.
The roles of the three organisations were:
Aquila Agribusiness Pty Limited investigated the availability of grain in Eastern Australia, current plans for feed-grain based ethanol production, and the availability and likely use of the distillers grain by–product by the cattle feedlot industry.
CSIRO Livestock Industries undertook a scientific evaluation of the nutritive value of distillers grains in Australia and the limits to their inclusion rates in feedlot diets.
CSIRO Energy Technology prepared an overview of world ethanol developments and used a 160 ML per annum hypothetical ethanol plant in New South Wales to prepare a life cycle analysis which documented the energy use and generation, water balances and greenhouse

Impact on the cattle feedlot industry in Eastern Australia from grain-based ethanol production
5
gas implications. A techno–economic analysis for ethanol production at this plant was also carried out. Both studies considered wheat and sorghum as feedstocks.
Coordination of the project, and a contemporary industrial focus of the whole project, was achieved through regular interaction with an MLA Advisory Committee.
2 GRAIN SUPPLY AND DEMAND
Over the last decade, grain production in eastern Australia (barley, corn, oats, sorghum, triticale, wheat) fluctuated between 11 and 27 million tonnes, depending on the season. Within the eastern Australian Statistical Divisions, annual productions were commonly 30 – 50% of maximum annual yields. Yields as low as 15% of the maximums also occurred. Ethanol production would require significant supplies of grain feedstock, with the indicative amounts depending on the type of grain as shown in Table 1.
Table 1 Ethanol production - feedstock and products
Parameter Unit Corn Wheat Barley Sorghum
Dry matter % AR 88.0 90.0 88.0 88.0
Starch % DM 70.0 65.3 60.0 74.6
Ethanol yield L/t grain 382 365 327 407
Grain to produce t/160 ML 419,000 439,000 489,000 393,000
Wet distillers grain@ 30% dry matter
t/160 ML 386,000 481,000 591,000 310,000
Dry distillers grain @90% dry matter
t/160 ML 129,000 160,000 197,000 103,000
AR, as received DM, dry matter
These results show that a typical plant of 160 ML requires between 390,000 and 490,000 tonnes of grain per annum, and produces between 100,000 and 200,000 tonnes of dry distillers grain (90% DM basis). The current Commonwealth government annual target of 350 ML, of which 75% is assumed to be derived from grain, therefore requires 650,000 to 800,000 tonnes of grain each year.
The cattle feedlot industry in eastern Australia is a major user of feed grain, with usage in 2006 estimated at 2.5 million tonnes. Grain, surplus to domestic requirements for the intensive livestock industries and human consumption, is exported. In recent years, with average seasonal conditions, exports were in the order of 15 million tonnes. In the low yielding years of 1998 and 2006, the exports were as low as 3.5 million tonnes.
Murrumbidgee in New South Wales is a major grain producing Statistical Division, and has a substantial cattle feedlot industry (133,000 Standard Cattle Units (SCU’s) in June 2006). Annual grain yields fluctuate between 1 and 2.5 million tonnes. Even in low grain yielding years, this region could support current grain demand in addition to that of a 160 ML ethanol plant. In such years, the surplus grain would be 100,000 – 200,000 tonnes, depending on the level of distillers grain incorporated into feedlot rations.

Impact on the cattle feedlot industry in Eastern Australia from grain-based ethanol production
6
The situation is quite different in the south east Queensland Statistical Divisions of Darling Downs, Moreton, Brisbane and Wide Bay–Burnett. The annual grain production in this region varies between 1.2 and 2.6 million tonnes. Its cattle feedlot capacity is the largest in the country at almost 400,000 SCU’s. Any new grain demand by a 160ML ethanol plant, in addition to current grain demands, could only be met under the best seasonal conditions. In average years, the grain deficit would be 400,000 tonnes, and in the years with poor seasonal conditions, almost a million tonnes. The interdivisional movement of grain could reduce or remove the deficit. However the transport of up to a million tonnes of grain in any one year requires considerable transport infrastructure. It would also increase the cost of grain delivered to feedlots.
The northern New South Wales Statistical Division is eastern Australia’s major grain producing region with the second largest feedlot capacity (158,000 SCU’s). Grain yields fluctuate from 3.8 million tonnes in good years to 1 million tonnes in poor years. The additional grain demand by a 160ML ethanol plant could be met locally every year. Even in years of low grain production, the surplus would be almost half a million tonnes, although the majority of this surplus would likely be required in the south east Queensland region if this area was also experiencing a low production year.
Impact of an E10 inclusion policy
If Australia mandated an E10 inclusion policy (10% ethanol in petrol), the annual ethanol demand would be 2500 ML. In the short term, it is likely that the majority of this ethanol would be derived from grain-based production. The supply of 75% of this amount of ethanol from grain would require annually 5.1 million tonnes of wheat, or 4.6 million tonnes of sorghum. If 95% of the ethanol was from grain the tonnages would be 6.5 and 5.8 million tonnes respectively. This would lead to a national shortfall of grain in some years, and would be exacerbated within a region in low yielding years.
Over the whole of eastern Australia, assuming the transport of grain between regions was logistically and economically feasible, the additional demand of these quantities of grain could only be met in high and average grain yielding years. In the lowest yielding years, the deficit would be up to 4 million tonnes annually, depending on the proportion of ethanol derived from grain. In this situation, the ethanol industry’s demand for feed grains will significantly impact the intensive livestock industries. Grain shortages in areas such as south east Queensland will become more acute and more frequent. Cattle feedlots that continue to operate will be faced with higher grain prices. It is likely that the adverse effect of the feedlot industry will flow onto the entire Australian cattle industry, given that 34% of slaughter cattle or 2.6 million head are currently finished in feedlots.
3 NUTRITIVE VALUE OF DISTILLERS GRAINS
The principal by-products of ethanol production in a conventional plant are wet distillers grains and condensed distillers solubles. These are commonly mixed to produce wet distillers grains with solubles. This product has a dry matter content of about 30%. The product can be dried to produce dry distillers grains with solubles. This product has a dry matter content of about 90%.
The chemical composition of distillers grains depends on the composition of the parent grain, the efficiency of conversion of starch to ethanol and the composition of the solubles in the grain; the more efficient the conversion, the less starch remains as residual in the distillers grains. The

Impact on the cattle feedlot industry in Eastern Australia from grain-based ethanol production
7
fermentation process removes starch and other soluble sugars, thereby concentrating up the other chemical components of the parent grain.
There is plentiful information from the United States on the chemical composition and nutritive value of wet distillers grain from corn, and some information from barley and sorghum. There are also some data from the UK for corn, wheat and barley and the resultant distillers grains. The residual starch content of the distillers grains varies from 1-2% in barley, 2-7% in corn, 5-10% in sorghum and 1-5% in wheat on a dry matter basis, depending on the process efficiency. Principally because of concentration of fat, the energy density of distillers grains is usually higher than that of the parent grain. Literature values for metabolisable energy content of northern hemisphere distillers grains vary from 11 MJ/kg dry matter for sorghum to 16 MJ/kg dry matter for corn. Barley and wheat are intermediate at between 12 and 13 MJ/kg dry matter. Crude protein content varies from 21-30% for barley, 9-19% for corn, 23-50% for sorghum and 30-44% for wheat. Typical fat contents vary from 3 - 4% for wheat and barley to up to 11% for sorghum and corn. The concentration of minerals in distillers grains need to be taken into account in the formulation of total mixed rations. Phosphorus contents vary from about 0.7% for barley to 0.9% for sorghum so there is potential for accumulation in the environment unless mineral contents of other ration inclusions are adjusted accordingly. The greater availability of nutrients from steam flaked compared to dry rolled grain will also influence the formulation of rations which include distillers grains.
There are currently no data on the chemical composition and nutritive value of distillers grains in Australia, apart from that produced at the Manildra plant in Nowra. This plant mostly uses starch from other grain processing operations, but sometimes uses grain to provide additional feedstock. In order to evaluate the nutritive value of distillers grains derived from Australian barley, corn, sorghum and wheat, a methodology has been adopted that assumes that mass balances can be calculated for changes in chemical composition of the grain as a consequence of removal of fermentable carbohydrate during ethanol production. On average, from northern hemisphere data, 2% of the starch and 10% of soluble non-starch carbohydrate remain unfermented by yeast during ethanol production. These values were assumed to apply in determining the likely chemical composition of Australian distillers grains. There is some uncertainty about the role that grain solubles play in determining ethanol/distillers grain yields for grains of interest in Australia and refinement of these estimates will be possible as more experience emerges.
The Project Team and the MLA Advisory Committee agreed that the starch compositions of Australian barley, corn, sorghum and wheat, from Rendell (2006) would be those used in the determination of nutritive value, as those values typified the average compositions of Australian grains. Further, it was agreed that the range of compositions, encountered in Australia, would be accommodated by increasing and decreasing the Rendell starch content by 5%. Thus, the starch contents used for barley were from 57-63%, for corn 67-74%, for sorghum 71-78% and for wheat 62-67%. The consequent changes in the other components were made according to patterns established in existing information on Australian grains.
The nutritive value of grains and distillers grains for ruminant feeding in the USA was determined using the Cornell Net Carbohydrate and Protein System (CNCPS). Estimations of the nutritive value of distillers grains in Australia were made, using the CNCPS software. Using the grain compositions discussed above, and assuming the levels of starch conversions to ethanol by fermentation noted previously, the compositions of distillers grains were calculated. These data were then used to predict the upper limits to the inclusion rates of distillers grains in illustrative feedlot diets formulated to contain 15% crude protein. The model also predicted the liveweight gain of cattle fed these diets.

Impact on the cattle feedlot industry in Eastern Australia from grain-based ethanol production
8
The inclusion rates of distillers grains in the diets were governed by the protein content of the distillers grains. Lower protein content allowed more of the distillers product to be included under the cap of 15% protein in the total diet. Inclusion rates varied from 5% for low starch, high protein wheat to 40% for low protein, high starch barley. Limits to inclusion rate for corn and sorghum were in the range of 23-35%. In all these illustrative diets, distillers grain was substituted for the protein meal component of the ration. For wheat based diets, the predicted liveweight gain did not vary by more than 0.1kg/d irrespective of whether cotton seed meal or distillers grain was included in the diet (1.9-2.0 kg/d). For sorghum, predicted liveweight gain varied from 1.7 kg/d for low starch sorghum and sorghum distillers grain to 2.1 kg/d for high starch sorghum and distillers grain.
Predicted liveweight gains for diets which included distillers grains were generally in the vicinity of 1.9 to 2.1 kg/d, with the exception of distillers grains from low starch sorghum which was 1.7 kg/d. Diets without distillers grains where cotton seed meal was the major protein source, generally also achieved liveweight gains in the vicinity of 1.9 to 2.0 kg/d.
Potential use of distillers grain in cattle feedlot industry
As shown in Table 1, a 160 ML per annum ethanol plant would produce 591,000, 386,000, 310,000 or 480,000 tonnes of wet distillers grain from input grains of barley, corn, sorghum or wheat respectively, each year. E10 production of 2500 ML per annum of ethanol would produce about 9.2, 6.2, 4.8, and 7.5 million tonnes of wet distillers grains from these grains, respectively.
The 4.8 million tonnes of sorghum wet distillers grain that could potentially be produced each year under E10 is sufficient to feed about 1.25 million head for 365 days a year. This assumes a feed intake of 15 kg per head per day on an as fed basis and an inclusion rate of 25% of sorghum distillers grain in the dry matter of the diet. The feedlot industry does not have this capacity currently. Surveyed feedlot capacity in 2006 was 1.13 million head. On a regional basis, a 160 ML per annum ethanol plant producing 310,000 tonnes of sorghum distillers grain per year could support the daily feed requirements of about 80,000 head of cattle for 365 days a year.
For these calculations to be of practical significance to the feedlot industry, most of the distillers grains would need to be produced sufficiently close to feedlots to make transport cost effective.
4 ETHANOL PRODUCTION The role of CSIRO Energy Technology (CET) was “to provide a technical assessment of the energetic costs and benefits of ethanol production from grain, under Australian crop and ethanol production conditions”, and to assist CSIRO Livestock Industries to “determine a realistic feed value of both the wet and dried distillers grain products under Australian conditions and establish a protocol, which accounts for the inherent variability in the product due to differences in the base product, ethanol extraction efficiency and water content, by which this value can be calculated”. In assisting with the latter objective, CET was tasked with determining a realistic economic and environmental value of wet distillers grain, by examining the costs and greenhouse gas emissions of drying and transport. These objectives for CET were addressed by carrying out a life cycle and techno-economic analysis for ethanol production from wheat and sorghum, using a number of options for processing the
Impact on the cattle feedlot industry in Eastern Australia from grain-based ethanol production
9
stillage. The analysis was based on a hypothetical plant located at Gunnedah, with a capacity of 160 ML of ethanol per annum. Whilst a mature technology, ethanol production is continuing to evolve, with improvements throughout the entire process. Anaerobic digestion of stillage is becoming of increasing interest in the USA as a result of over supplies of distillers grain, as well as for offsetting increasing gas and electricity prices. The analysis considered the life cycle issues of resource energy, greenhouse gas emissions (GGEs), and water consumption, as well as techno-economics. Resource energy quantifies energy depletion, and relates only to fossil energy inputs; solar energy used for growing the grain is excluded, since it does not represent a depletion of energy resources. Greenhouse gas emissions are emissions of CO2 and CH4 that are generated in the production and combustion of fossil fuels, as well as nitrous oxide produced from the use of nitrogenous fertilisers. Carbon sequestered from the atmosphere by grain, provides a GGE credit. Water consumption relates to the amount of fresh water used in the production of fertilisers, fuels, etc (in the form of process water), and is used to quantify the depletion of fresh water resources. Water from rainfall used in grain production is not included. The study considered 3 systems for the Life Cycle Analyses (LCAs):
1) grain production (wheat and sorghum),
2) grain through to ethanol with 7 stillage processing options, and
3) grain through to 1 GJ of delivered heat energy (ie as combusted ethanol).
For ethanol production, the base process routes were fermentation with the production of dry distillers grain, and fermentation with anaerobic digestion and electricity production. This resulted in 7 case studies, for alternative stillage processing:
Case 1 Wet Distillers Grain (WDG) direct to feedlot. Case 2 Dry Distillers Grain with Solubles (DDGS) with conventional drying. Case 3 DDGS with high efficiency drying. Case 4 Anaerobic digestion, with gas engine electricity generation (33% efficiency; HHV
basis). Case 5 Anaerobic digestion, with combined cycle electricity generation from biogas (50%
efficiency). Case 6 WDG for electricity generation by fluidised bed combustion (20% efficiency). Case 7 WDG for electricity generation using integrated drying and gasification combined
cycle (IDGCC; 40% efficiency).

Impact on the cattle feedlot industry in Eastern Australia from grain-based ethanol production
10
Life Cycle Analyses (LCAs)
For grain production, the major resource energy component is for the production of fertiliser (70% of the total). GGEs are dominated by the CO2 taken up by the grain during photosynthesis, while fresh water is dominated by the water used to grow the grain (500-1000 m3/t grain). It should be noted that the CO2 sequestered in the grain will ultimately be returned to the atmosphere, partly during production of ethanol, and also when the ethanol is combusted. However, the LCA methodology (with the boundary conditions of either grain production, or ethanol production) requires that the CO2 sequestered in the grain be included. Values without such sequestration have been included for comparison with other non-compliant LCA studies. When the grain is processed to ethanol, all indicators are dependent on the processing of the stillage, and by-product credits. Process water consumption is again several orders of magnitude less than that used for growing the grain. There are 3 key findings for resource energy for ethanol production:
With direct sale of WDG, the resource energy is considerably lower than that for DDGS, due to the large amount of energy required for drying (can be substantially reduced using a higher efficiency process).
When the stillage is anaerobically digested, the resource energy also becomes negative, since there is no requirement for purchased electricity or natural gas for ethanol production and credits are allocated for by-product fertilizers and exported electricity.
There are also significant credits for by-product fertilisers and exported electricity. If the WDG is combusted to produce electricity (requires a technology similar to high moisture lignite or biomass), a negative overall resource energy is produced.
The main findings for GGE for ethanol production are as follows:
All cases have a negative GGE, due to sequestration of CO2 as grain.
Direct use of WDG by feedlots gives a lower GGE than for DDGS, due to the emissions associated with drying (again, reduced by a higher efficiency process).
Use of WDG or DDGS as feed to replace grain increases the overall GGE, as this displaces grain production and lowers the CO2 being sequestered by photosynthesis.
WDG can be transported for a large distance (>1000 km) before the GGEs from transport exceeds the GGEs from drying and transport of the DDGS (cf the economical distance of only 50-60 km).
Anaerobic digestion of the stillage gives lower GGE, due to the use of combined heat and power; i.e. the use of waste heat from power generation for the fermentation. A similar conclusion applies to the combustion of WDG for electricity generation.

Impact on the cattle feedlot industry in Eastern Australia from grain-based ethanol production
11
All of the alternative technologies reduce the overall GGE, with the highest efficiency electricity generation case (with biogas combined cycle, or IDGCC) virtually offsetting the upstream GGEs for ethanol production.
Comparison with other LCA studies In comparison with the other Australian studies on wheat production, similar GGEs and process water values were obtained, when compared on a similar basis. The values for resource energy, however, vary considerably (some of which may be attributed to different locations). For ethanol production, comparison with other studies is complicated by uncertainties in how by-products have been credited, and in some cases by the use of petrol blends as the functional unit. In addition, many of the studies, incorrectly, do not consider the CO2 sequestered by the grain through photosynthesis, as required by LCA methodology; this significantly reduces the GGE benefit of ethanol production from grain. Comparison of ethanol and petrol Using current technology, the life cycle GGEs for ethanol are always less than those for petrol, with ethanol cases involving exported electricity being very much lower. This benefit is likely to be greater in the future due to the potential use of CO2 capture technologies in the ethanol plant and in power generation from stillage. Most previous studies have compared ethanol and petrol on the basis of equivalent energy delivered - as fossil energy replacement. Most US studies (based on corn) have shown that, on a fossil fuel basis, the production of ethanol results in approximately 30% more energy than the fossil energy used in its production. The present study has shown similar results for the WDG case. DDGS results in a small negative net energy. If DDGS were to be the likely by-product from ethanol production in Australia, then, from a resource energy perspective, ethanol production would not contribute to a reduction in the overall energy required for transport, when taking a life cycle approach. For anaerobic digestion (with electricity generation using internal combustion engines) there is a marked improvement in net energy – 2.5-3 times better than for WDG, or than for previous overseas studies. Overall, ethanol production from grain gives significant resource energy and GGE benefits in comparison to petrol. The exception is for resource energy when DDGS is the by-product. Of course, a number of other issues also need to be taken into account, such as grain availability, acceptability, economics, etc.
Techno-economics
Because of the potential variations in key cost parameters, a matrix of values was used for grain price, electricity price/cost, and by-product credits. The findings are that:
The techno-economic analysis shows the dominating role that the grain feedstock plays (50-80c/L of the ethanol production cost).

Impact on the cattle feedlot industry in Eastern Australia from grain-based ethanol production
12
The next most significant issue is the choice of stillage processing – whether to produce WDG, DDGS, or biogas/solid fuel for electricity production. In practice, the choice of process will also depend on a number of interrelated factors – capacities, the process route, by-product credits, and the ability to exploit opportunity biomass, such as straw.
Sorghum gives lower unit feed cost, but overall production costs are similar due to lower credits (higher level of starch in the sorghum produces a higher yield of ethanol, but less electricity and fertiliser credits).
The cost of ethanol production was 57-103 c/L for wheat, and 62-96 c/L for sorghum, depending on the combination of assumptions.
The amount of power generated and exported is very dependent on the amount of stillage, the type of stillage processing, and the generation technology. For the alternative stillage processing options, the cost of ethanol production is lowest for AD-GTCC, due to its high efficiency and low capital cost (particularly for generation plant over 50 MW).
Production of WDG versus DDGS An interesting question for the study was the trade-off between selling WDG directly, or drying the WDG to provide DDGS, as an animal feed. Drying would cost around $37-61/t DDGS depending on energy costs, and, from a cost perspective, WDG can only be transported around 50-70 km before it is economically preferable to produce DDGS. WDG, with its limited storage life, handling characteristics, significantly lower value, and reliance on local use, is likely to provide a lower co-product credit than the equivalent dried product. Overall, credits will depend on the marketability of the various products for the particular plant location.
4 CONCLUSIONS Impact on feedlot industry
The development of a feed-grain based ethanol production capacity in eastern Australia will present significant challenges for the cattle feedlot industry, as well as for the other intensive livestock industries. It will adversely affect grain supplies, and a review of grain importation procedures to cover low crop yield years will be necessary.
The by-products can be valuable feedstuffs, although there are limits to their use in feedlot diets. The most energetically efficient and environmentally friendly ethanol production uses the distillers grains in an anaerobic digestion process to provide fuel for the plant. In this case no by-product is available for the feedlot industry. If wet distillers grain is available, it is only economic to transport it 50-70 km.
The economics of ethanol production are very dependent on grain price and availability, and there are clearly challenges for ethanol producers which will impact on existing domestic grain consumers (such as feedlots) – oil price volatility, availability of long term contracts for grain (and grain price), and competing uses of the stillage (distillers grain as feed component, or for electricity generation).

Impact on the cattle feedlot industry in Eastern Australia from grain-based ethanol production
13
Further analysis of these interactions is required, with the impacts of climate change also taken into consideration.
While this study serves as a guide to the probable impact of a grain based ethanol industry on the eastern Australia feedlot industry, it is imperative that, if ethanol production plants are established across Australia, a full assessment of the implications are carried out on a plant by plant basis, under Australian conditions.
The variability of grain production in Australia, likely to increase with climate change, provides a strong driver for location of the ethanol plant adjacent to alternative sources of grain supply, eg imports or transfers from other regions of the country. This favours location at a port, as being planned by Primary Energy for plants at Kwinana, and Brisbane. The biodigestion of the stillage (thereby avoiding production of dry distillers grains) avoids the issue of location in the proximity of markets for the dry distillers grain by-product.
From both the techno-economics, and the Life Cycle Analysis results, it is apparent that biodigestion of the overall stillage has a number of important benefits:
Reduces the net energy input to the ethanol plant.
Generates excess electricity, and fertiliser credits, which exceed the credits which are associated with the sale of the dry distillers grains.
A potential consequence for the feedlot industry is that using the distillers grain for fuel within the plant does not produce any distillers grain for sale ; i.e. does not provide a feed component to partially replace the feed value of the original grain. However, the impact of diverting the wet distillers grain away from the feedlot industry could be alleviated to some extent if the surplus distillers grain in the US could by imported at cheap price. This is likely to be only a short term solution as the increasing cost of energy supplies is now driving interest in the USA in anaerobic digestion of the stillage, which would be expected to impact on the availability and price of dry distillers grain for Australian import.
Finally, there is some doubt as to the long term availability of grain in Australia for conversion to liquid fuels at an economic price (lack of rainfall, competing uses for grain leading to price increases). There is also the developing technology for conversion of cellulose to ethanol, which is likely to shift the focus to the cheaper source of biomass. As the situation unfolds, and new regulatory environments develop, further techno-economic and LCA studies would be worth consideration.
Further R&D
As grain–based ethanol production does not currently occur in Australia (apart from the Manildra plant at Nowra that uses some grain on occasions), compilation of this report has necessitated extrapolation from overseas data. Once plants are established in Australia, it is suggested that an assessment of the implications be undertaken on a plant by plant and a region by region basis. The areas of investigation should largely be those considered in this report.
Those plants which biodigest stillage to produce biogas and electricity are the most energetically efficient, with the lowest overall greenhouse gas emissions. Under certain conditions (grain and electricity prices), they produce ethanol at the lowest price. There is therefore a real possibility that

Impact on the cattle feedlot industry in Eastern Australia from grain-based ethanol production
14
there may be limited or no distillers grain for the feedlot industry to use as a substitute for whole grain. Competition for feed grains will increase. This scenario demands that the location of ethanol plants and future feedlots be carefully considered as the dependency on imported grains may become acute. In addition, developments in the USA ethanol industry should be reviewed periodically, to assess the impact on dry distillers grain availability and price for import into Australia.

Impact on the cattle feedlot industry in Eastern Australia from grain-based ethanol production
15
Contents Page
1 Background ...................................................................... 16
2 Project Objectives ........................................................... 17
3 Methodology .................................................................... 18
4 Results and Discussion .................................................. 18
5 Success in Achieving Objectives ................................... 19
6 Impact on Meat and Livestock Industry – now & in five years time ......................................................................... 19
7 Conclusions and Recommendations ............................. 20
8 Bibliography ..................................................................... 21
9 Appendices ...................................................................... 21
9.1 Appendix 1 - Grain supply, grain demands for ethanol production and use of distillers grains by the feedlot industry ....................................................21
9.2 Appendix 2 - Nutritive value of distillers grains ...........................................80
9.3 Appendix 3 – Ethanol production ................................................................105

Impact on the cattle feedlot industry in Eastern Australia from grain-based ethanol production
16
1 Background
In recent years, the Australian Federal Government has articulated a commitment to the development of the biofuels industry through the production of biodiesel and ethanol, with attention currently being focussed on expanding Australia’s production capacity. This interest is part of increased global activity. Total world production of 46 GL/y is approximately equivalent to 140% of Australia’s total petrol consumption, on an energy content basis. Currently Brazil and the USA are the major producers of ethanol, with Australia’s total existing production capacity equivalent to one medium sized ethanol plant. Rapid expansion in the world wide production of ethanol has occurred over the past 2 to 3 years as a result of:
Recent increases in the cost of crude oil and the current high petroleum prices.
The desire of many countries to reduce dependence on imported fuels and extend existing oil capacity.
An increasing demand for more renewable fuels.
Attempts to reduce greenhouse gas emissions.
An attempt to reduce exhaust emissions from cars and the associated health risks.
The phasing out of methyl tertiary butyl ether (MTBE) as an oxygenate additive for petrol, coupled with the suitability of ethanol as a substitute for MTBE.
The existence of government policies in some countries to promote the ethanol industry.
The existing production capacity for ethanol in Australia is ~155 ML/y, although the actual production (2005-2006) was ~105 ML (fuel and industrial use) due to limitations in market demand. Contract commitments for ethanol for blending with petrol are only 21 ML/y.
The Australian Government has introduced a number of measures to encourage ethanol production as part of a broader policy agenda to promote the use of biofuels in Australia. These measures have three main components:
A commitment that biofuels produced in Australia from renewable resources should contribute at least 350 ML annually to Australia’s total fuel supply by June 2010. [It should be noted that this target of 350ML includes both biodiesel and ethanol production.]
The Biofuels Capital Grants Program [introduced in July 2003 and modified in March 2004] to provide one-off capital subsidy for new and/or expanded projects producing biofuels from renewable resources or biomass waste products. Grants were limited to a maximum of $10 million per project and at its completion, seven projects were offered grants totalling $37.6 million – a total of $12.4 million for three ethanol projects and the balance for the four bio-diesel projects.

Impact on the cattle feedlot industry in Eastern Australia from grain-based ethanol production
17
The Ethanol Production Grants Program which effectively offsets the excise on domestically produced biofuels until 30 June 2011. From 1 July 2011 to 1 July 2015, the excise will be phased in through five equal annual instalments to reach a final rate of 19.1 cents per litre for bio-diesel and 12.5 cents per litre for ethanol. The final rate represents a 50% discount on excise as compared to other fuels with the same energy content. It will apply to imported ethanol as well.
About 10 new plants are in various stages of planning. Their production capacity is projected to be 1265 ML. Currently there is uncertainty surrounding the details of some proposals. Some are progressing slowly and some are stalled. Uncertainties about the cost and supply of feed grains and the sale of ethanol and the by–products are limiting progress. However it is realistic to estimate that across Australia, feed - grain based ethanol production may contribute in the order of 275 to 350 ML annually by 2010.
Currently the Australian cattle feedlot industry uses about 2.5 million tonnes of grain per year with significant increases predicted in future years as the industry expands. Establishment of an ethanol production industry would increase competition, and perhaps price, for feed grains. A by–product of grain–based ethanol production is distillers grain which has the potential to be a partial substitute for whole grain in feedlot diets.
The purpose of this study is to provide information for an Australian context, providing the cattle feedlot industry with current knowledge about the ethanol production processes, grain supply, the by-products produced, and their value for inclusion in feedlot diets. In addition, regions suitable for the production of grain-based ethanol are identified and the effects on the feedlot industry in these and adjacent regions examined, taking into consideration both the competition for grain and/or provision of a by-product feedstuff.
2 Project Objectives
The objectives of the project were to:
Establish the likely grain usage (total and regional) and subsequent production (total and regional) of wet distillers grain given current and proposed development of grain–based ethanol production facilities to meet the existing government annual target of 350 ML ethanol production, assuming 75% of this production will occur from feed grains.
Extrapolate this data to evaluate the potential situation should the government move to a position of mandating an E10 inclusion policy.
Provide a technical assessment of the energetic costs and benefits of ethanol production from grain, under Australian crop and ethanol production conditions.
Determine a realistic feed value of both the wet and dried wet distillers’ grain products under Australian conditions and establish a protocol, which accounts for the variability in the base

Impact on the cattle feedlot industry in Eastern Australia from grain-based ethanol production
18
product because of ethanol extraction efficiency and variable water content, for determining this value.
Evaluate the likely potential usage of the wet and dried wet distillers’ grain products in the feedlot sector, given the location, production quantities, and costs of the wet distillers’ grain supply in relation to potential feedlot users and likely ration inclusion levels.
Recommend any additional R&D necessary to establish the value of wet and dried wet distillers’ grain products under Australian conditions.
3 Methodology
The project was undertaken by a consortium of CSIRO Divisions (Livestock Industries, and Energy Technology), and Aquila Agribusiness Pty Limited. Each of these groups produced a separate report. They are in the Appendices. The roles of the three organisations were:
Aquila Agribusiness Pty Limited investigated the availability of grain in eastern Australia, current plans for feed-grain based ethanol production and the availability and likely use of the distillers grain by–product by the cattle feedlot industry.
CSIRO Livestock Industries undertook a scientific evaluation of the nutritive value of distillers grains in Australia, and the limits to their inclusion rates in feedlot diets.
CSIRO Energy Technology prepared an overview of world ethanol developments and used a 160 ML per annum hypothetical ethanol plant in New South Wales to prepare a life cycle analysis which documented the energy use and generation, water balances and greenhouse gas implications. A techno–economic analysis for ethanol production at this plant was also carried out. Both studies considered wheat and sorghum as feedstocks.
During the data gathering phase of the project, an MLA Advisory Committee provided advice on the direction to the investigations so that the outputs were aligned with current industry needs.
Each of the three investigations was a “desk-top” study. Data available publicly and restricted information made available to the researchers were integrated and used in the calculations presented. This source information is provided so data used and assumptions made are open to scrutiny. Methodological details for each section are given in the relevant Appendix.
4 Results and Discussion
The results and discussion for each of the three sections of the report are presented in the Appendices.

Impact on the cattle feedlot industry in Eastern Australia from grain-based ethanol production
19
Appendix 1 deals with the seasonal supply of grain in eastern Australia, projected usage of feed-grain for ethanol production given likely production targets, and the availability and likely use of the distillers grain by–product by the cattle feedlot industry.
Appendix 2 reports the nutritive value of distillers grains for feedlot cattle, the limits to the inclusion of distillers grains in feedlot diets and the resultant effects on the liveweight gain of cattle.
Appendix 3 uses a 160 ML per annum hypothetical ethanol plant in New South Wales to carry out Life Cycle Analyses which document the energy use and generation, water balances and greenhouse gas implications for various options. A techno–economic analysis for ethanol production at this plant is also reported. Both studies considered wheat and sorghum as feedstocks.
5 Success in Achieving Objectives
All six objectives were met.
The report aligns seasonal grain production with feedlot capacity in Statistical Divisions of importance to the feedlot industry. This is the first time that such defined data have been calculated.
Realistic estimates of Australia’s ethanol production over the coming years is provided. These assessments were made from personal contact with project managers of proposed ethanol plants and officials of government departments.
The Life Cycle Analyses and the techno-economics for an example of a 160ML ethanol plant at Gunnadah in New South Wales used data from current operating plants overseas and from plants in Australia that are on the drawing board.
The simulations on the nutritive value of distillers grains, their inclusion rates in feedlot diets and the predictions of cattle liveweight gain used the same computer software as that used in the United States for the same purpose.
6 Impact on Meat and Livestock Industry – now & in five years time
The major effect from the establishment of an ethanol industry will be on the availability and price of feed grains. Experience in the USA is that feed grain prices have increased markedly in response to competition from the grain-based ethanol industry. The magnitude of the effect will be proportional to the volume of domestic ethanol production from grain. The Australian Government plans to stimulate biofuel production to achieve an annual production of 350 ML of ethanol and biodiesel by 2010. If 75% of this is from ethanol, the annual grain demand in 5 years time would be 3.2-4 million tonnes. This additional demand could be met from grain currently exported in years of above average and average eastern Australian grain yields, but not in years of low grain yield. The current regional shortfalls in grain supply that occur in some years would be exacerbated.

Impact on the cattle feedlot industry in Eastern Australia from grain-based ethanol production
20
Within a region, a 160 ML ethanol plant would supply sufficient distillers grain to be included in the ration of about 80,000 cattle. If distillers grains were available locally at an economic price, any shortfall in grain supply would be partially alleviated. However it is most unlikely that the cost of feed for a feedlot would decrease. Feed costs are approximately 80% of the cost of feedlot operations. An inexpensive supply of distillers grains comprising from 5% to 40% of a ration is unlikely to balance the increase in grain costs for the remainder of the ration.
7 Conclusions and Recommendations
The development of a grain-based ethanol production capacity in eastern Australia will present significant challenges and opportunities for the cattle feedlot industry, as well as for the other intensive livestock industries. It will adversely affect grain supplies, and a review of grain importation procedures to cover low crop yield years will be necessary.
The by-products can be valuable feedstuffs, although there are limits to their inclusion rates in feedlot diets. Ultimately, it will be for individual feedlots to make an assessment of the overall potential benefit of distillers grain by-products on the basis of value and cost-effectiveness according to their individual circumstances.
The economics of ethanol production depend on many more factors than the annual price and availability of grain. Volatility in the oil market, availability of long-term grain contracts, impacts of climate change and the competing usage of stillage (distillers grains v electricity generation) are among the factors influencing investment decisions.
The variability of grain production in Australia, likely to increase with climate change, provides a strong driver for location of ethanol plants adjacent to alternative sources of grain supply, eg imports or transfers from other regions of the country. This favours location at a port, as being planned by Primary Energy for plants at Kwinana and Brisbane. The biodigestion of the stillage, thereby avoiding production of distillers grain, avoids the issue of location so there is a market for the by-product.
Developments in the USA ethanol industry should be reviewed periodically, to assess the impact on dry distillers grain availability and price for import into Australia.
Technology and research developments will continue to offer new options for optimising plant flexibility, by-products, yields and overall costs for particular plant locations. Ongoing monitoring of these advances will be useful in ascertaining the likely effects on areas of interest to MLA.
From both the techno-economics, and the Life Cycle Analysis results, it is apparent that biodigestion of the overall stillage has a number of important benefits:
Reduces the net energy input to the ethanol plant.
Generates excess electricity, and fertiliser credits, which exceed the credits which are
associated with the sale of the distillers grains.

Impact on the cattle feedlot industry in Eastern Australia from grain-based ethanol production
21
As grain–based ethanol production does not currently occur in Australia (apart from the Manildra plant at Nowra that uses some grain on occasions), compilation of this report has necessitated extrapolation from overseas data. Once plants are established in Australia, it is suggested that an assessment of the implications be undertaken on a plant by plant and a region by region basis. The areas of investigation should largely be those considered in this report.
8 Bibliography
Full source material is given in the Appendices
9 Appendices
9.1 Appendix 1 - Grain supply, grain demands for ethanol production and use of distillers grains by the feedlot industry
9.2 Appendix 2 - Nutritive value of distillers grains
9.3 Appendix 3 – Ethanol production

21
APPENDIX 1
Grain supply, grain demands for ethanol production and use of distillers’ grains by the feedlot industry E.J. Sparke Aquila Agribusiness Pty Ltd
FOR CONTACT: Jim Sparke
E-mail: [email protected] Ph: 02 4997 3100

22
Contents
1 Background ....................................................................................................... 26
1.1 Purpose of study ....................................................................................... 26
2 Objectives .......................................................................................................... 27
2.1 Study Part B ............................................................................................. 27
3 Grain and Cattle Feedlot Production .............................................................. 28
3.1 Cereal feed-grains – An overview ............................................................. 28
3.1.1 Cereal grain production in Australia ................................................. 28
3.1.2 Cereal grain production in Eastern Australia .................................... 29
3.1.3 Eastern Australia regional production 1998 - 2006 ........................... 30
3.2 The cattle feedlot industry in Eastern Australia – An overview ................. 33
3.2.1 The cattle feedlot industry in Australia .............................................. 33
3.2.2 Australian feedlot capacity ............................................................... 33
3.2.3 NFAS capacity and cereal feed-grain production ............................. 35 4 Feed-grain Based Ethanol Production ............................................................ 37
4.1 Ethanol production in Australia – An overview .......................................... 37
4.1.1 Current capacity and production ...................................................... 37
4.1.2 Government policy – Biofuels assistance ......................................... 37
4.1.3 Government policy – The Biofuels Action Plan ................................. 38
4.2 Feed-grain based ethanol production in Eastern Australia ....................... 40
4.2.1 Ethanol production scenarios ........................................................... 40
4.2.2 Feed-grains, usage and yields in ethanol production........................ 41 5 Research on the Use of Ethanol Production By-products in the
Feedlot Industry ................................................................................................ 43
5.1 Feed-grain based ethanol production by-products ................................... 43
5.1.1 Principal feedstuffs ........................................................................... 43
5.1.2 Distiller grain nutrient values ............................................................ 43
5.1.3 Fresh [WDGS] and dried [DDGS] distiller grain by-product .............. 45
5.1.4 WDGS and DDGS in feedlot diets .................................................... 46
5.1.5 Distiller grain and meat quality ......................................................... 48
5.1.6 Additional considerations ................................................................. 48
5.2 SWOT assessment ................................................................................... 49
6 Potential Usage for WDGS and DDGS in the Eastern Australian Feedlot Industry ................................................................................................ 51
6.1 Factors influencing usage ......................................................................... 51
6.1.1 Availability ........................................................................................ 51
6.1.2 Cost and nutrient value evaluation ................................................... 52
6.1.3 Industry capacity to utilise distiller grain ........................................... 53
6.2 Impact of grain based ethanol production on feed-grain supply in Eastern Australia.................................................................................................... 55
6.2.1 Grain demand .................................................................................. 55

23
6.2.2 Grain supply ..................................................................................... 56
6.2.3 By-product substitution for grain ....................................................... 58
6.3 Examples of regional impacts for the feedlot industry in Eastern Australia60
6.3.1 Overview .......................................................................................... 60
6.3.2 Indicative impacts on regional feedlot industries .............................. 62 7 Conclusion ........................................................................................................ 69
8 Attachments ...................................................................................................... 70
8.1 Statistical Division, Australian Bureau of Statistics ................................... 71
9 Bibliography ...................................................................................................... 76

24
List of Tables
Table 1.1 Eastern Australia cereal grain production by states 29
Table 1.2 Eastern Australia cereal grain production by principal crops [as at
3 September 2006] 30
Table 1.3 Eastern Australia grain production by Statistical Division 1998 - 2006
[Tonnes] 30
Table 1.4 Average annual grain production and the highest [maximum] and lowest [minimum] individual production yields for Eastern Australia Statistical Divisions 1998 - 2006 32
Table 1.5 Average number of days fed for feedlot-finished cattle [2005] 33 Table 1.6 Aus-meat NFAS feedlot capacity [SCU] by size and State 34
Table 1.7 Aus-meat NFAS feedlot capacity [SCU] by State and Statistical Division 35
Table 1.8 Calculated regional Eastern Australia feedlot industry feed-grain demand
[2006] 36
Table 1.9 Current ethanol capacity [ML] in Australia 37
Table 1.10 Excise transition path for fuels entering the excise net 38
Table 1.11 Proposed ethanol production capacity [ML] by June 2010 39
Table 1.12 Sales of automotive gasoline by state marketing area for the fiscal year
2006 [ML] 40
Table 1.13 Study ethanol production scenarios and comparable gasoline energy equivalents, relative to Eastern Australia automotive gasoline sales 41
Table 1.14 Eastern Australia feed-grains by typical average composition 41
Table 1.15 Yields of ethanol, WDGS, DDGS and grain demand for study scenarios 42
Table 1.16 Comparison of typical average wet distiller grain with soluble [WDGS], dry rolled and steam flaked grains 44
Table 1.17 WDGS and DDGS produced relative to ethanol production and gasoline
sales 51
Table 1.18 Calculated value of sorghum WDGS and DDGS relative to other typical
dry-rolled feed grains and whole white cotton seed on metabolisable
energy [ME] basis alone 52
Table 1.19 Calculated value of sorghum WDGS and DDGS relative to typical protein
meals and whole white cotton seed on crude protein basis alone 53
Table 1.20 Potential distiller grain usage for a range of feedlot capacity take-up at 0%
to 25% [DM] diet inclusion rates 54
Table 1.21 Feed-grain demand for levels of grain based ethanol production 56
Table 1.22 Supply and disposal of Australian grains 57
Table 1.23 Effect of ethanol production on net feed availability with sorghum as the sole base grain 58 Table 1.24 Effect of feedlot industry up-take and ration inclusion rate on distiller
grain consumption with sorghum as the sole base grain 59
Table 1.25 Overview impact of ethanol production in Eastern Australia on
grain availability 61

25
Table 1.26 Potential impact of ethanol production on grain availability in the South
East Queensland Statistical Divisions of Darling Downs, Moreton,
Brisbane, Wide Bay-Burnett 63
Table 1.27 Potential impact of ethanol production on grain availability in the Northern
NSW Statistical Division 65
Table 1.28 Potential impact of ethanol production on grain availability in
the Murrumbidgee NSW Statistical Division 67

26
1 Background
1.1 Purpose of study
In recent years, the Australian Federal Government has articulated a commitment to the development of the biofuels industry through the production of biodiesel and ethanol. Attention is currently focused on expanding Australia‟s capacity to produce biodiesel and ethanol however, it is also critical that the consequences of this new policy on other industries are investigated. This study raises and discusses issues relating to ethanol production which are relevant to the cattle feedlot industry, particularly the potential impact on grain supplies and the availability of a distiller grain by-product. The proponents of grain based ethanol production imply the feeding value of the distiller grain by-product introduces significant benefits to the intensive livestock industries. It is suggested that the distiller grain products have a greater feeding value than the original cereal grain, and can be used as a major part of the cattle‟s diet. These claims are based on experimentation and observations in the United States [US] based on the use of corn as feedstock. Studies show that there is variability between production facilities and fermentation processes throughout the US, that result in differences in chemical compositions of the by-products produced. The purpose of this study is to provide information for an Australian context, providing the cattle feedlot industry with relevant and current knowledge about the ethanol production processes and by-products. This will enable feedlot participants to make informed decisions about the use of distiller grain in their operations. In addition, regions suitable for the production of grain-based ethanol are identified and the effects on the feedlot industry in these and adjacent regions examined, taking into consideration both the competition for grain and/or provision of a by-product feedstuff.

27
2 Objectives
2.1 Study Part B
Aquila Agribusiness Pty Limited will address 1, 2, and 5 of the project objectives as described below. 1. Establish the likely grain usage [total and regional] and subsequent production [total
and regional] of distiller grains given the current and proposed development of grain based ethanol production facilities to meet the existing Government annual target of 350 ML ethanol production, assuming 75% of this production will occur from feed-grains.
2. Extrapolate this data to evaluate the potential situation should the Government
move to a position of mandating an E10 inclusion policy. 3. Provide a technical assessment of the energetic costs and benefits of ethanol production
from grain under Australian crop and ethanol production conditions. 4. Determine a realistic feed value of both the wet and dried distiller grain products under
Australian conditions and establish a protocol, which accounts for the variability in the base product because of ethanol extraction efficiency and variable water content, for determining this value.
5. Evaluate the likely potential usage of the wet and dried distiller grain products in the
feedlot sector, given the location, production quantities, and costs of the distiller grain supply in relation to potential feedlot users and likely ration inclusion levels.
6. Recommend any additional research and development necessary to establish the value of
wet and dried distiller grain products under Australian conditions.

28
3 Grain and Cattle Feedlot Production
This section provides background information about Australia‟s grain production, including trend analysis for the last eight years‟ production in Eastern Australia. In addition, data showing the size and distribution of the cattle feedlot industry are examined.
3.1 Cereal feed-grains – An overview
3.1.1 Cereal grain production in Australia
Australian grain production has been trending upwards since the early 1990‟s. This trend has been achieved principally through increases in the area sown to grains and increases in crop yields[1]. For example, Australian grain production in 2004-05 was 34.745 million tonnes, comprising of 22.605 million tonnes of wheat and 12.14 million tonnes of coarse grains [barley, corn, oats, sorghum, and triticale]. Export values totalled $5.045 billion. By comparison, the production for 2005-06 increased by almost 15% to 39.741 million tonnes, 25.090 million tonnes of wheat and 14.651 million tonnes coarse grains. Projected production for 2010-11 is 42.602 million tonnes, comprising of 27.678 million tonnes and 14.924 million tonnes for wheat and coarse grains respectively[2]. During the past decade, there has also been a steady increase in the sale of feed-grains on the domestic market, with the increase associated primarily with feeding in the intensive livestock industries. The major intensive livestock industries are the cattle feedlot, dairy, pig and poultry industries. Barley, corn, sorghum, and wheat are the main grains with lesser tonnages of oats and triticale. In parts of Eastern Australia, feed-grains are an increasingly scarce commodity as the demand from the intensive livestock industries outstrips local supply, particularly during dry seasons. Drought is a common occurrence in Australia and can severely affect grain production and supply[3]. It is the key contributor to cyclical grain and feedstuff shortages. In recent times, because the severity of droughts has been inconsistent across regions of Australia, there has been a sufficient feed-grains produced to meet the demand. However, it is important to note that both nationally and internationally the livestock industry is growing strongly and will require increased quantities of feed-grains to meet these growth requirements. Hafi and Connell[4] determined grain use by the major intensive livestock industries in the fiscal year 2003-04 to be 6.880 million tonnes, with the projection in 2007-08 to increase to 8.448 million tonnes. This expansion by the major intensive livestock and industrial users of grain, combined with the high inter-annual variability in seasonal grain growing conditions, has given rise to industry concern about the reliability of grain supply[5]. In Australia, grain is grown in two relatively narrow inland belts – the Eastern Australian grain belt stretching through Central Queensland, New South Wales, Victoria and South Australia; and the Western Australian grain belt which is bordered by Geraldton in the north, Albany to the south and Esperance to the east[4]. The intensive livestock industries are concentrated in Eastern Australia, particularly in Queensland and New South Wales, where their future growth will be greatest. It is likely that this expansion will further reduce grain exports from these areas, although these states have also experienced the most acute feed-grain supply shortages in recent times. Consequently, it is in Eastern Australia where a drought induced domestic feed-grain deficiency will potentially be most severe. For short periods, it would be possible to satisfy part of the increased growth demand for feed-grains with interstate transfers from Western and South Australia, but this will be at great cost in terms of transportation.

29
In the event of a severe back-to-back continental drought, substantial quantities of feed-grains would need to be imported, if the intensive livestock industries were to maintain production. Under the provisions of the Australian Quarantine and Inspection Service [AQIS), such imported grains must be used principally in metropolitan areas to service poultry and compound stockfeed manufacturers [Meat and Livestock Australia[3]. The major intensive livestock industries inland from ports are unable to access imported grains. It is logical that an Eastern Australia feed-grain based ethanol industry will further add to the escalating domestic demand for feed-grains, and as a consequence, will further increase the likelihood of acute seasonal domestic grain shortages. 3.1.2 Cereal grain production in Eastern Australia
The annual fluctuation in Eastern Australia cereal grain production is illustrated in Table 1.1. The fluctuations in the principal grain crops are shown in Table 1.2.
Table 1.1 Eastern Australia cereal grain production by states
1998 1999 2000 2001 2002 2003 2004 2005
Queensland 2,383,705 3,460,029 3,688,853 2,585,064 2,517,781 1,809,854 2,879,742 2,685,164
New South Wales
7,815,548 8,812,695 10,625,612 10,070,297 10,436,862 3,619,524 10,132,049 10,386,984
Victoria 2,446,371 2,331,902 3,834,957 4,761,983 4,442,434 1,385,902 5,428,569 3,234,374
South Australia
4,714,361 5,359,031 3,993,044 6,481,176 7,555,698 3,511,695 6,181,521 4,600,358
TOTALS 17,359,986 19,963,657 22,142,466 23,898,520 24,952,775 10,326,975 24,621,881 20,906,880
Source: Australian Bureau of Statistics[6]

30
Table 1.2 Eastern Australia cereal grain production by principal crops [as at 13 September 2006]
Queensland
New South Wales
Victoria South
Australia
Tonnes Tonnes Tonnes Tonnes
Barley
2005-06 latest ABARE estimate 259,000 2,245,000 2,059,000 2,685,000
Five year average to 2004-05 [a] 175,000 1,345,800 1,476,800 2,344,400
Corn
2005-06 latest ABARE estimate 183,300 183,808 7,000
Five year average to 2004-05 [a] 174,400 201,400 6,700
Oats
2005-06 latest ABARE estimate 4 492 260 129
Sorghum
2005-06 latest ABARE estimate 1,170,000 840,000 4,500
Five year average to 2004-05 [a] 1,158,600 724,800 2,000
Wheat
2005-06 latest ABARE estimate 1,385,000 7,921,000 2,705,000 3,578,000
Five year average to 2004-05 [a] 987,800 6,646,400 2,366,600 3,424,600
Note: [a] Based on data from ABS, Principal Agricultural Commodities, cat. No. 7111.0; ABS, Agricultural
Commodities, Australia, cat. No. 7121.0 and ABARE estimates.
Source: ABARE[7]
3.1.3 Eastern Australia regional production 1998 - 2006
In Table 1.3, the Eastern Australian regional grain production for the fiscal years 1998 - 2006 is tabulated according to the Statistical Divisions defined by the Australian Bureau of Statistics [See Attachments for maps]. The crops included are barley, corn, oats, sorghum, triticale, wheat. The extent of the annual fluctuations across regions and states is evident from the data provided.
Table 1.3 Eastern Australia grain production by Statistical Division 1998 - 2006 [Tonnes]
State Statistical Division Production for fiscal year ending
1998 1999 2000 2001 2002 2003 2004 2005 2006
Qld 05 Brisbane 821 608 1,409 614 890 325 523 353
Qld 10 Moreton 29,862 30,946 33,714 18,734 17,830 13,275 17,083 17,323 15,865
Qld 15 Wide Bay-Burnett 81,896 126,906 139,213 90,464 80,340 84,835 76,618 56,254 54,380
Qld 20 Darling Downs 1,449,205 1,952,037 2,452,082 1,133,891 1,620,926 1,216,239 1,909,044 1,698,752 1,795,200
Qld 25 South West 231,010 429,530 364,308 202,376 300,910 69,918 238,285 435,025 422,750
Qld 30 Fitzroy 393,535 651,424 541,226 752,198 359,330 283,770 448,080 356,649 707,850
Qld 35 Central West 3,025 5,183 4,567 445 905 300
Qld 40 Mackay 190,593 256,556 139,785 375,013 124,912 110,943 154,397 79,792 272,500
Qld 45 Northern 711 3 622 1,556 200 2,162 11,384
Qld 50 Far North 17,003 25,874 28,957 17,658 18,184 34,184 39,433 39,144
Qld 55 North West 425
Totals 2,398,086 3,479,068 3,705,882 2,591,392 2,524,878 1,813,690 2,886,530 2,694,976 3,268,545
Continued…

31
Table 1.3 continued
State Statistical Division Production for fiscal year ending
1998 1999 2000 2001 2002 2003 2004 2005 2006
NSW 05 Sydney 885 4,285 7,618 386 5,636 69 430 131
NSW 10 Hunter 113,855 162,617 152,259 128,515 129,880 70,091 167,093 186,641 92,980
NSW 15 Illawarra 1,791 1 9,283 1,237 1,056 240 447 480
NSW 20 Richmond-Tweed 9,580 10,671 6,777 11,870 27,131 15,908 18,882 6,970
NSW 25 Mid North Coast 8,232 3,679 13,091 4,084 150 1,605 1,260
NSW 30 Northern 2,355,477 2,131,354 3,241,860 1,928,802 3,051,810 960,514 2,755,108 3,798,156 2,727,650
NSW 35 North Western 1,589,316 1,952,746 2,150,265 1,700,546 1,905,148 492,353 1,959,343 2,048,281 1,770,500
NSW 40 Central West 1,722,975 2,169,408 1,963,844 2,218,830 2,133,619 517,685 1,613,300 1,605,057 2,537,500
NSW 45 South Eastern 248,293 304,499 293,336 333,034 329,884 135,555 267,525 322,061 314,800
NSW 50 Murrumbidgee 1,654,533 2,022,770 2,089,307 2,509,568 2,072,130 1,055,728 2,207,239 1,751,029 1,929,000
NSW 55 Murray 855,608 1,035,805 1,333,043 1,789,066 1,414,842 632,261 2,039,997 1,373,286 1,661,250
NSW 60 Far West 10,084 6,113 21,847 17,219 19,515 7,931 3,668 6,575
ACT 05 Canberra 1 1 1 1,750 120 1,959 2,080 66
ACT 10 ACT-Bal 183 176 110 88 95 40 25
Totals 8,570,814 9,804,126 11,282,641 10,644,995 11,091,017 3,890,293 11,036,758 11,100,018 11,033,680
Vic 05 Melbourne 5,428 11,426 14,378 18,601 12,356 9,953 13,398 9,929
Vic 10 Barwon 59,196 68,981 83,981 137,316 122,932 119,994 200,751 210,016 115,900
Vic 15 Western District 128,464 111,459 118,330 169,125 175,360 203,031 244,003 182,259 297,000
Vic 20 Central Highlands 136,113 183,761 246,495 288,531 290,580 229,583 328,188 313,425 255,750
Vic 25 Wimmera 1,195,722 1,156,678 1,582,972 1,858,631 1,894,041 536,423 2,304,387 1,212,533 2,071,000
Vic 30 Mallee 965,022 926,545 1,585,376 2,086,914 1,706,760 364,496 2,029,517 974,675 2,005,630
Vic 35 Loddon 249,261 210,100 342,324 403,358 397,820 83,802 502,459 313,988 379,650
Vic 40 Goulburn 225,385 272,505 335,598 419,638 434,873 163,815 552,670 450,623 386,390
Vic 45 Ovens-Murray 32,240 23,772 46,317 35,980 31,692 16,771 36,815 41,761 33,915
Vic 50 East Gippsland 300 923 7,413 9,206 7,790 17,288 7,095
Vic 55 Gippsland 633 228 3,047 1,683 1,265 4,878 1,860 2,856
Totals 2,997,766 2,966,380 4,366,231 5,428,983 5,067,680 1,740,536 6,231,335 3,719,159 5,545,235
SA 05 Adelaide 9,765 4,011 7,179 3,233 83 6,765 8,913 2,204
SA 10 Outer Adelaide 243,374 281,305 213,847 299,139 351,941 186,640 295,658 246,873 206,900
SA 15 Yorke & Lower North 1,631,356 1,836,547 1,461,742 2,088,939 2,450,027 1,179,702 1,944,753 1,695,740 1,678,580
SA 20 Murray Lands 745,711 953,142 796,362 1,082,243 1,127,017 351,618 1,103,669 652,806 1,152,700
SA 25 South East 231,862 231,934 206,195 252,715 342,710 252,345 304,764 207,293 282,725
SA 30 Eyre 1,748128 1,787,196 1,029,746 2,133,790 2,518,419 1,287,043 2,225,612 1,441,164 2,152,250
SA 35 Northern 396,555 589,400 464,400 895,487 1,147,264 385,328 589,007 516,863 770,700
Totals 5,006,751 5,683,536 4,179,470 6,755,546 7,937,462 3,649,440 6,472,375 4,762,944 6,243,855
TOTALS 18,973,416 21,933,110 23,534,225 25,420,917 26,621,036 11,093,960 26,626,998 22,277,098 26,091,315
Source: Australian Bureau of Statistics[6]
The average annual grain production [including barley, corn, oats, sorghum, triticale, wheat] for the period 1998 to 2006 is tabulated by region in Table 1.4. Also shown is the highest [maximum] and the lowest [minimum] regional yields which illustrate the fluctuations primarily due to seasonal conditions.

32
Table 1.4 Average annual grain production and the highest [maximum] and lowest [minimum] individual production yields for Eastern Australia Statistical Divisions 1998 - 2006
State Statistical Division Grain production yields 1998 - 2006 [Tonnes]
Average Maximum Minimum
QLD 05 Brisbane 693 1,409 325
QLD 10 Moreton 21,626 33,714 13,275
QLD 15 Wide Bay-Burnett 87,878 139,213 54,380
QLD 20 Darling Downs 1,691,931 2,452,082 1,133,891
QLD 25 South West 299,346 435,025 69,918
QLD 30 Fitzroy 499,340 752,198 283,770
QLD 35 Central West 2,404 5,183 300
QLD 40 Mackay 189,388 375,013 79,792
QLD 45 Northern 2,080 11,384
QLD 50 Far North 27,555 39,433 17,003
QLD 55 North West 142 425
NSW 05 Sydney 2,430 7,618 69
NSW 10 Hunter 133,770 186,641 70,091
NSW 15 Illawarra 1,817 9,283 1
NSW 20 Richmond-Tweed 13,473 27,131 6,777
NSW 25 Mid North Coast 4,586 13,091 150
NSW 30 Northern 2,550,081 3,798,156 960,514
NSW 35 North Western 1,729,833 2,150,265 492,353
NSW 40 Central West 1,831,358 2,537,500 517,685
NSW 45 South Eastern 283,221 333,034 135,555
NSW 50 Murrumbidgee 1,921,256 2,509,568 1,055,728
NSW 55 Murray 1,348,351 2,039,997 632,261
NSW 60 Far West 11,619 21,847 3,668
VIC 05 Melbourne 11,934 18,601 5,428
VIC 10 Barwon 124,341 210,016 59,196
VIC 15 Western District 181,003 297,000 111,459
VIC 20 Central Highlands 252,492 328,188 136,113
VIC 25 Wimmera 1,534,710 2,304,387 536,423
VIC 30 Mallee 1,404 993 2,086,914 364,496
VIC 35 Loddon 320,307 502,459 83,802
VIC 40 Goulburn 360,166 552,670 163,815
VIC 45 Ovens-Murray 33,251 46,317 16,771
VIC 50 East Gippsland 6,252 17,288
VIC 55 Gippsland 2,056 4,878 228
SA 05 Adelaide 5,269 9,765 83
SA 10 Outer Adelaide 258,408 351,941 186,640
SA 15 Yorke and Lower North 1,774,154 2,450,027 1,179,702
SA 20 Murray Lands 885,030 1,152,700 351,618
SA 25 South East 256,949 342,710 206,195
SA 30 Eyre 1,813,705 2,518,419 1,029,746
SA 35 Northern 639,445 1,147,264 385,328
Source: Australian Bureau of Statistics[6]

33
3.2 The cattle feedlot industry in Eastern Australia – An overview
3.2.1 The cattle feedlot industry in Australia
The cattle feedlot industry is a vital component of the integrated Australian beef cattle industry. It is a keystone to the industry‟s growth and security, as well as that of peripheral agricultural businesses, and contributes significantly to the national economy [8]. The feedlot industry has had a stabilising effect on the national cattle herd by lessening the impact of irregular rainfall, dry conditions and/or drought. In recent times, it has also assisted the national turnoff of cattle at a younger age resulting in increased production and the release of a greater proportion of pastoral resources for breeding and other pursuits. The feedlot industry supports greater slaughter carcass weights of higher valued beef, thus enhancing the industry‟s overall profitability. The Australian cattle feedlot industry uses grain to finish cattle, rather than to grow cattle. It delivers to the market‟s growing expectation, a consistent and assured supply of pre-determined quality beef regardless of seasonal conditions. The feedlot finishing of cattle has facilitated improved beef eating qualities and has encouraged increased consumer spending in both the domestic and export beef markets. Table 1.5 shows that during the calendar year 2005, 81% of feedlot-finished cattle were fed for less than 130 days, and 57 % for less than 100 days. Of the 19% of cattle fed for more than 130 days, only six per cent were fed for more than 200 days. Table 1.5 Average number of days fed for feedlot-finished cattle [2005]
3.2.2 Australian feedlot capacity
There have been two recent of feedlot capacity, one by ALFA/MLA on numbers of head and the other by AUSmeat on a Standard Cattle Units (SCU) basis. As at 30 June 2006, ALFA/MLA recorded the capacity at 1.13 million head, expanding by just over 10% in 12 months and 25% since late 2003. There were over 940,000 head on feed, a seven per cent rise from June 2005. Capacity utilisation was 83%. In terms of Eastern Australia, the feedlot capacity was 1,026,712 head with 901,110 on feed, utilising 88% of capacity [Australian Lot Feeders‟ Association, personal communication, 2006]. During the fiscal year 2005-06, Australian feedlots marketed a record 2.59 million cattle – up five per cent on the record set the previous year and accounting for 34% of Australia‟s total adult
Number of days fed % %
< 50 days 10
50-100 days 47
100-130 days 24
Total less than 130 days 81
130-200 days 13
> 200 days 6
Total more than 130 days 19
Source: Barnard [9]

34
cattle slaughter[10]. In the calendar year 2005, feedlots marketed 34% of Australia‟s total adult cattle, representing around 40% of all beef produced[9]. Also at 30 June 2006, the National Feedlot Accreditation Scheme [NFAS] had the capacity at 1,093,650 Standard Cattle Units [SCU] with the distribution by state described in Table 1.6.
Table 1.6 Aus-meat NFAS feedlot capacity [SCU] by size and State
Size [SCU] 500 and less 501-1,000 1,001-10,000 10,001-30,000 30,001 plus Totals
Queensland
Establishments 317 53 50 11 1 432
Capacity 56,173 47,899 178,635 180,290 50,000 512,997
New South Wales
Establishments 38 32 23 9 2 104
Capacity 10,329 30,651 83,100 165,000 88,333 377,413
Victoria
Establishments 3 8 4 2 17
Capacity 1,225 6,100 13,000 40,000 60,325
South Australia
Establishments 20 11 6 37
Capacity 5,027 8,182 12,345 25,554
Tasmania
Establishments 1 1
Capacity 16,000 16,000
Western Australia
Establishments 66 19 25 110
Capacity 23,486 17,075 60,800 101,361
Australia
Establishments 444 123 108 23 3 701
Capacity 96,240 109,907 347,880 401,290 138,333 1,093,650
Source: Aus-meat NFAS, personal communication [2006]
The regional capacity of Australian feedlots is shown in Table 1.7. It can be seen that 26 feedlots have a capacity exceeding 10,000 SCU, accounting for almost 50% of the national capacity. In Eastern Australia, including Tasmania, these same 26 feedlots account for almost 55% of the NFAS capacity of 992,289 standard cattle units.

35
Table 1.7 Aus-meat NFAS feedlot capacity [SCU] by State and Statistical Division
State Statistical Division Capacity SCU
Queensland 05 Brisbane 185
10 Moreton 9,614
15 Wide Bay-Burnett 52,665
20 Darling Downs 331,160
25 South West 25,804
30 Fitzroy 62,063
40 Mackay 10,107
45 Northern 999
50 Far North 20,400
512,997
New South Wales 10 Hunter 2,449
20 Richmond-Tweed 300
25 Mid-North Coast 1,000
30 Northern 157,838
35 North Western 23,568
40 Central West 22,428
45 South Eastern 3,100
50 Murrumbidgee 133,232
55 Murray 33,498
377,413
Victoria 10 Barwon 3,600
15 Western District 1,900
25 Wimmera 6,000
30 Mallee 25,000
40 Goulburn 1,200
45 Ovens-Murray 22,220
55 Gippsland 405
60,325
South Australia 10 Outer Adelaide 7,690
15 Yorke and Lower North 3,432
20 Murray Lands 5,045
25 South East 1,538
30 Eyre 500
35 Northern 7,349
25,554
Tasmania 15 Northern 16,000
16,000
Western Australia 05 Perth 400
10 South West 26,495
15 Lower Great Southern 23,786
20 Upper Great Southern 16,370
25 Midlands 9,950
30 South Eastern 13,900
35 Central 10,460
101,361
Total 1,093,650
Source: Aus-meat NFAS, personal communication [2006]
3.2.3 NFAS capacity and cereal feed-grain production
The cattle feedlot industry is the major user of feed - grains amongst the intensive livestock industries. It is estimated that in 2003 it accounted for 22% to 27% of domestically consumed feed-grains[3]. A comprehensive study[4] in 2003 projected that in 2004, the feedlot industry would account for 31% of the grain consumed by the livestock industries, increasing to almost 33% by 2008.

36
For 2006, the Eastern Australia feedlot grain consumption has been calculated to total 2,509,063 tonnes, distributed between the regions on a pro rata basis as in Table 1.8. Table 1.8 Calculated regional Eastern Australia feedlot industry feed-grain demand [2006]
State Statistical Division Feedlot feed-grain demand 2006
Tonnes
Qld 05 Brisbane 475
Qld 10 Moreton 24,708
Qld 15 Wide Bay-Burnett 135,349
Qld 20 Darling Downs 851,081
Qld 25 South West 88,316
Qld 30 Fitzroy 159,502
Qld 35 Central West
Qld 40 Mackay 25,975
Qld 45 Northern 2,568
Qld 50 Far North 52, 428
Qld 55 North West
Total 1,318,402
NSW 05 Sydney
NSW 10 Hunter 6,294
NSW 15 Illawarra
NSW 20 Richmond-Tweed 771
NSW 25 Mid North Coast 2,570
NSW 30 Northern 405,644
NSW 35 North Western 60,570
NSW 40 Central West 57,640
NSW 45 South Eastern 7,967
NSW 50 Murrumbidgee 342,406
NSW 55 Murray 86,090
NSW 60 Far West
Total 969,952
Vic 05 Melbourne
Vic 10Barwon 9,252
Vic 15 Western District 4,883
Vic 20 Central Highlands
Vic 25 Wimmera 15,420
Vic 30 Mallee 64,250
Vic 35 Loddon
Vic 40 Goulburn 3,084
Vic 45 Ovens-Murray 57,105
Vic 50 East Gippsland
Vic 55 Gippsland 1,041
Total 155,035
SA 05 Adelaide
SA 10 Outer Adelaide 19,763
SA 15 Yorke and Lower North 8,820
SA 20 Murray Lands 12,966
SA 25 South East 3,953
SA 30 Eyre 1,285
SA 35 Northern 18,887
Total 85,674
Total 2,509,063
Source: Australian Bureau of Statistics[6]
; Aus-meat NFAS, personal communication; M George, personal
communication [2006].

37
4 Feed-grain Based Ethanol Production
This section provides an overview of the current capacity to produce ethanol and Federal Government targets for feed-grain based ethanol production in Australia. Detailed analysis of the usage of feed-grains in ethanol production in Eastern Australia is also presented, along with an overview of the process through which the distiller grain by-products are produced.
4.1 Ethanol production in Australia – An overview
4.1.1 Current capacity and production
At present, Australia has a limited ethanol production capacity of approximately 165 million litres [ML] annually, using principally cane juice or molasses and wheat starch waste [Table 1.9]. Table 1.9 Current ethanol capacity [ML] in Australia
Company Location State Annual capacity Feedstock
ML
CSR Ethanol Sarina, Yarraville Queensland, Victoria 60 Cane molasses
Manildra Group
Rocky Point Distillery
Bombaderry
Woongoolba
New South Wales
Queensland
75-125
5
Wheat starch
Cane molasses
Tarac Technologies Berri, Nuriootpa, Griffith South Australia, New South Wales
1 Grape marc
Total existing capacity 141-191
Source: Department of Industry Tourism and Resources, ACT, personal communication [2006]; Urbanchuk et al.,[11]
Current ethanol production is in the order of 108 to 145 ML annually, which is lower than the available capacity. It is notable that in the fiscal year 2005-06:
41 ML was blended with fuel;
approximately 30 to 35 ML was exported by CSR Ethanol; and
approximately 50 ML was used in a range of domestic industries. 4.1.2 Government policy – Biofuels assistance
The Australian Government has introduced a number of measures to encourage ethanol production as part of a broader policy agenda to promote the use of biofuels in Australia. These measures have three main components as outlined below.
A commitment that biofuels produced in Australia from renewable resources should contribute at least 350 ML annually to Australia‟s total fuel supply by June 2010. [It should be noted that this target of 350ML includes biodiesel and ethanol production.]
The Biofuels Capital Grants Program [introduced in July 2003 and modified in March 2004] to provide one-off capital subsidy for new and/or expanded projects producing biofuels from renewable resources or biomass waste products. Grants were limited to a maximum of $10 million per project and at its completion, seven projects were offered

38
grants totalling $37.6 million – a total of $12.4 million for three ethanol projects and the balance for the four bio-diesel projects.
The Ethanol Production Grants Program which effectively offsets the excise on domestically produced biofuels until 30 June 2011. From 1 July 2011 to 1 July 2015, the excise will be phased in through five equal annual instalments to reach a final rate of 19.1 cents per litre for bio-diesel and 12.5 cents per litre for ethanol. The final rate represents a 50% discount on excise as compared to other fuels with the same energy content.
Table 1.10 shows the excise transition path for these fuels in terms of the fiscal year 2005.
Table 1.10 Excise transition path for fuels entering the excise net
Fuel type Unit July 2003
to July 2010
July 2011 July 2012 July 2013 July 2014 July 2015
High-energy content fuels
Bio-diesel c/L
0 3.8 7.6 11.4 15.3 19.1
Mid-energy content fuels
LPG, LNG, Ethanol c/L 0 2.5 5.0 7.5 10.0 12.5
Low-energy content fuels
Methanol c/L 0 1.7 3.4 5.1 6.8 8.5
Other
Compressed Natural Gas c/m
3 0 3.8 7.6 11.4 15.2 19.0
Source: Energy Grants [Cleaner Fuels] Scheme [Consequential Amendments] Bill 2003, Parliament of Australia
Ethanol imports are subject to a customs duty of 38.143 cents per litre until 30 June 2011. From 1 July 2011, imported ethanol will attract a customs duty equal to the excise applicable to domestic ethanol. As a result, imported ethanol will have open access to the currently protected Australian market. This is likely to result in increased competition for domestic producers as imports from low-cost ethanol producing countries are able to enter Australia. Ethanol imported from countries such as Brazil will be landed excise and duty paid in Australia at a price which is financially marginal or even non-viable for proposed local ethanol producers[12].
At present, the Federal Government does not support a mandate for the use of ethanol, stating that in the interests of consumer choice, “we are not persuaded to mandate the use of ethanol” [13] [14.]
4.1.3 Government policy – The Biofuels Action Plan
The Federal Government has received action plans from the major oil companies, members of the Independent Petroleum Group, and major retailers. These plans collectively provide achievable annual volumetric milestones and underpin progress towards the Government‟s target of 350 ML of biofuels [made up of both ethanol and biodiesel] by 2010. These targets are reflected in Table 1.11, the notes to which show the type of feed-grain or sugar utilised by each development.

39
Table 1.11 Proposed ethanol production capacity [ML] by June 2010
Ethanol capacity June 2010
ML
Australian Ethanol Ltd, Swan Hill, Vic [a]
100
Babcock & Brown, Leeton, NSW [b]
150
CSR Ethanol, Sarina, Qld [c]
100
Dalby Bio-Refinery Limited, Dalby, Qld [d]
84
Downs Fuel Farmers Pty Ltd, Dalby, Q [e]
160
Lemon Tree Ethanol Pty Ltd, Millmerran, Qld [fd]
76
Manildra Group, Bombaderry, NSW [g]
100
Primary Energy, Kwinana, WA [h]
160
Primary Energy, Pinkenba, Qld [i]
160
Primary Energy, Gunnedah, NSW [j]
160
Rocky Point Distillery, Woongoolba, Qld [ k]
15
Total capacity: 1,265
Notes: [a] Stage 1 - construction started Aug 2006; - production 2007/8; barley/corn/wheat based
[b] MoU with Rockdale Beef; feasibility stage; barley/wheat based [c] Capital grant $4.16 million; expansion under-way, net of exports; cane molasses based [d] Planning 2008 commissioning; sorghum based [e] Planning Stage 1 for 80ML; commissioning 2008-10; sorghum based [f] Capital grant $5.85 million approved; sorghum/wheat based [g] Expansion of existing fuel ethanol production; waste wheat starch based [h] MoU with BP Australia for total output; construction to start 2007; wheat based [i] MoU with BP Australia; HoA with GrainCorp; construction planned 2007-08; sorghum based [i] MoU with BP Australia; HoA with GrainCorp; construction planned 2007-08; sorghum/wheat based [k] Capital grant $2.4 million approved expansion; cane molasses based
Source: Personal communications with proponents [2006]; personal communications with the Department of Industry Tourism and Resources, ACT, [2006]; media releases
The Biofuels Taskforce Report to the Prime Minister dated August 2005 identifies current and proposed biofuel production capacities totalling 1,529.3 ML by the fiscal year 2010. This will consist of 1,005.2 ML of ethanol and 524.1 ML of bio-diesel. Table 1.11 provides a summary of currently known plant developments and it can be seen that there is a potential ethanol capacity totalling 1,265 ML. It is projected that production will rapidly increase from the base capacity to exceed the target of 350ML as early as 2008 [Prime Minister, Media release, 22 December 2005; I Macfarlane, Daily Telegraph, 20 August 200614]. It should be noted that new proposals for ethanol production plants are announced from time to time. There is often vagueness surrounding the detail of these proposals and although some have progressed, others have advanced slowly or have stalled. It would appear that at this stage there are major hurdles to developing „bankable‟ projects because of variables associated with the cost and supply of the grain feedstock, as well as the sale returns for ethanol and its by-products. As such, it is difficult to forecast with certainty the size, number and/or location of additional ethanol production plants in Eastern Australia and the analysis undertaken in this study is based on data presented in Table 1.11.

40
4.2 Feed-grain based ethanol production in Eastern Australia
4.2.1 Ethanol production scenarios
This report has clearly identified a number of factors which will impact upon the growth of Australia‟s ethanol production capacity, including the importation of ethanol from countries such as Brazil at highly competitive prices and the domestic development/expansion of production capacity from both feed-grains and sugar. Setting aside the issue of imported ethanol, this report will now focus on examining scenarios related to feed-grain based ethanol production in Eastern Australia. It is realistic to estimate that across Australia, feed-grain based ethanol production may contribute in the order of 275 to 350 ML annually to gasoline supplies by the fiscal year 2010, which equates to approximately 1.5% of the Australian petrol consumption. To produce such quantities, approximately 700,000 to 900,000 tonnes of mixed grain stock would be required. It should be noted that the Kwinana plant in Western Australia is the only one located outside Eastern Australia and it produces 160 ML of ethanol and requires approximately 440,000 tonnes of feed-grain. Across Australia, the total sales of all petroleum products in the fiscal year 2006 amounted to 48,627.1 ML, of which automotive gasoline was 19,017.7 ML [Table 1.12]. Table 1.12 Sales of automotive gasoline by state marketing area for the fiscal year 2006 [ML]
NSW [a] Vic Qld SA WA Tas NT Australia
Lead Replacement 0.6 2.1 2.8 6.7 2.7 0.3 0.0 15.2
Premium Unleaded 610.2 420.3 438.1 111.8 196.3 76.9 13.8 1,867.4
Proprietary Brand 471.9 333.3 216.4 45.6 80.9 0.0 0.0 1,148.1
Regular unleaded 4,941.3 4,129.0 3,546.4 1,192.1 1,611.7 387.2 124.1 15,931.8
Ethanol Blended Fuel
7.7 1.3 46.2 0.0 0.0 0.0 0.0 55.2
Totals 6,031.7 4,886.0 4,249.9 1,356.2 1,891.6 464.4 137.9 19,017.7
Note: [a] Includes ACT
Source: Australian Petroleum Statistics, [15]
From the table, it can be seen that Eastern Australia‟s [Queensland, NSW, Victoria, and South Australia] automotive gasoline sales were 16,523.8 ML. By way of background, it should be noted that a litre of ethanol has an energy content [mega joules per litre] which is typically 68% that of a litre of gasoline, regardless of the feedstock used to produce the ethanol [16]. This obviously means that more ethanol is required to reach the same energy content of gasoline. This study will examine, in detail, scenarios in which 250 ML, 500 ML, 1,000 ML, 2,500 ML and 5,000 ML of grain based ethanol is produced annually for inclusion in the Eastern Australia automotive gasoline market. Table 1.13 compares these ethanol production scenarios to the equivalent automotive gasoline quantities in terms of energy content and as a proportion of market sales in Eastern Australia. The data show that if the Federal Government were to move towards mandating an E10 inclusion policy, this equates to the production of approximately 2,500 ML of ethanol.

41
Table 1.13 Study ethanol production scenarios and comparable gasoline energy equivalents, relative to Eastern Australia automotive gasoline sales
Ethanol production scenario Automotive gasoline equivalents Proportion of Eastern Australia Automotive gasoline sales [a]
ML ML %
250 170 1.03
500 340 2.06
1,000 680 4.12
2,500 1,700 10.29
5,000 3,400 20.58
Note: [a] Based on figures for Eastern Australia for the fiscal year 2006 – 16,523.8 ML
4.2.2 Feed-grains, usage and yields in ethanol production
Ethanol producers require a consistent supply of grain at a „realistic‟ price. Historically, in North America, corn is the most common substrate for ethanol production due to its abundance and greater yield of ethanol relative to other cereal grains[17]. Sorghum is used in the southern states with satisfaction[18]. In Canada wheat is the main fermentation substrate due to its availability, however, barley, rye, and triticale may be used during periods of high wheat prices[19]. Corn is a minor crop in Eastern Australia and sorghum is limited to the more sub-tropical areas. The typical average composition for feed-grains available for ethanol production in Eastern Australia is presented in Table 1.14. There will be recognised composition variation between and within grain types on the basis of varieties and cultural practice and according to seasonal conditions and soil fertility.
Table 1.14 Eastern Australia feed-grains by typical average composition
Unit Barley Corn Sorghum Wheat
Dry Matter [DM] % 88.0 88.0 88.0 90.0
Metabolisable Energy MJ/kg DM 12.5 12.8 12.3 13.3
Net Energym MJ/kg DM 8.5 9.0 8.2 9.4
Net Energyg MJ/kg DM 5.6 6.0 5.4 6.0
Fat % DM 2.1 4.3 3.1 2.3
Starch % DM 60.0 70.0 75.0 65.0
Crude Protein % DM 12.0 9.0 11.0 14.0
ADF %DM 7.0 3.0 6.0 4.0
NDF % DM 20.0 9.0 15.0 12.0
Calcium % DM 0.06 0.02 0.04 0.05
Phosphorus % DM 0.35 0.30 0.32 0.43
Sulphur % DM 0.16 0.12 0.14 0.15
Source: Coventry[20]
; National Research Council [NRC][21];
Preston[22]
; adapted with starch after Rendell[23]
Grain based ethanol production processes result in residual by-products, some of which are potential feedstuffs suitable for the livestock industries. Following distillation to extract the ethanol, the spent mash goes to a screen press or centrifuge to separate the maximum amount of liquid. The separated liquid either goes back into the cooking system to be sold as livestock feed, or is partially dehydrated into syrup called condensed distiller soluble [CDS]. The spent

42
grains can be sold as livestock feed as wet distiller grains [WDG] or dried distiller grains [DDG]. The syrup [CDS] can be added to both the wet distiller grains [WDGS] or dried distiller grains [DDGS]. Table 1.15 presents the likely yield of ethanol, WDGS and DDGS from the base grains available in Eastern Australia, together with the grain demand for each of the ethanol production scenarios and the corresponding by-product [WDGS and DDGS] produced. Looking at the figures for ethanol production from corn, it can be seen that 654,587 tonnes is required to produce 250ML of ethanol with 603,125 tonnes of WDGS or 201,042 tonnes of DDGS as the by-product. In the Eastern Australian context, it is more likely that wheat, sorghum and barley will be used to produce ethanol and the yield of ethanol production and by-product will vary accordingly.
Table 1.15 Yields of ethanol, WDGS, DDGS and grain demand for study scenarios
Unit Barley Corn Sorghum Wheat
Dry Matter [DM] % 88.0% 88.0% 88.0% 90.0%
Starch [DM] in grain % 60.0% 70.0% 74.6% 65.3%
Yields per tonne feed-grain [‘As is’]
Ethanol [a] litre 327 382 407.0 364.4
Wet distillers grain [30%DM] [b] tonne 1.209 0.921 0.789 1.095
Dried distillers grain [90%DM] [b] tonne 0.403 0.307 0.263 0.365
Feed-grains [‘As is’] consumed to produce:
Ethanol production 1 ML tonne 3,055 2,618 2,457 2,744
Stu
dy
scen
ari
os
250 ML tonne 763,685 654,587 614,224 686,108
500 ML tonne 1,527,370 1,309,175 1,228,448 1,372,216
1,000 ML tonne 3,054,741 2,618,349 2,456,896 2,744,433
2,500 ML tonne 7,636,852 6,545,873 6,142,241 6,861,082
5,000 ML tonne 15,273,705 13,091,747 12,284,481 13,722,165
Wet distiller grain with soluble [30%DM] produced
Ethanol production 1 ML tonne 3,694 2,413 1,938 3,006
Stu
dy s
ce
na
rio
s
250 ML tonne 923,438 603,125 484,375 751,563
500 ML tonne 1,846,875 1,206,250 968,750 1,503,125
1,000 ML tonne 3,693,750 2,412,500 1,937,500 3,006,250
2,500 ML tonne 9,234,375 6,031,250 4,843,750 7,515,625
5,000 ML tonne 18,468,750 12,062,500 9,687,500 15,031,250
Dried distiller grain with soluble [90%DM] produced
Ethanol production 1 ML tonne 1,231 804 646 1,002
Stu
dy s
ce
na
rio
s
250 ML tonne 307,813 201,042 161,458 250,521
500 ML tonne 615,625 402,083 322,917 501,042
1,000 ML tonne 1,231,250 804,167 645,833 1,002,083
2,500 ML tonne 3,078,125 2,010,417 1,614,583 2,505,208
5,000 ML tonne 6,156,250 4,020,833 3,229,167 5,010,417
Note: [a] Assume yield of 620 litres/tonne starch

43
5 Research on the Use of Ethanol Production By-products in the Feedlot Industry
This section provides a summary of the research to date regarding the use of by-products from ethanol production in the feedlot industry. It is important to note that almost all studies have been undertaken in North America and the relevance of findings to the Australian feedlot industry will need to be verified when Australian plants are operational. The section concludes with a SWOT analysis of the potential value of ethanol production by-products to the cattle feedlot industry.
5.1 Feed-grain based ethanol production by-products
5.1.1 Principal feedstuffs
The principal by-products are wet distiller grain [WDG], dried distiller grain [DDG] and condensed distiller soluble [CDS]. The soluble may be dried and added to the WDG to produce wet distiller grains with soluble [WDGS] or added to the DDG to produce dried distiller grains with soluble [DDGS]. North American experience highlights the significant variability in product quantities and compositions associated with differences in distilling plants and distilling processes. The more recent advances in engineering and technology enable newly established plants to achieve greater efficiencies. Procedures have been modified to influence by-product nutrient composition. The by-product composition, as with many by-product feeds, is also influenced by multiple variables such as the type and variety of grain, agricultural practices on - farm, seasonal conditions and soil fertility[24; 25]. The DDGS composition is not standardised in North America[26]. In contrast with many feedstuffs, there is no grading system to differentiate quality and value among DDGS sources and there is no grading system to differentiate quality within ethanol by-product categories. The standardisation of DDGS composition and the introduction of a grading system have been opposed by many in the US ethanol industry. This study assumes that the distiller grains will contain some soluble but this can vary from plant to plant. Clearly, an assessment of by-product quality for a plant yet to be built in Australia can only be viewed as suggestive, being based on information gained from experience overseas. 5.1.2 Distiller grain nutrient values
Distiller grain by-products clearly offer a potential feedstuff to livestock feeding industries. Suitably priced WDGS and DDGS may be a useful source of nutrient energy, protein and minerals for feedlot cattle. Individual feedlot operators will need to assess by-product nutrient values, respective costs, optimum feeding levels and the economic value to their business when the by-product is sourced. As a starting point, this study offers a comparison of the nutrient value of the cereal grains which are currently processed by dry-rolling or steam-flaking for consumption by feedlot cattle, to that of the distiller grain by-products. The typical nutrient composition for the WDGS, steam-flaked and dry-rolled form of each grain is given as a guide in Table 1.16.

44
Table 1.16 Comparison of typical average wet distiller grain with soluble [WDGS], dry rolled and steam flaked grains
Barley Corn Sorghum Wheat
Unit
Barley grain dry rolled
[a] [b]
Barley grain steam flaked
[a] [b] Barley WDGS
[a] [b]
Corn grain dry rolled
[a] [b]
Corn grain steam flaked
[a] [b] Corn WDGS
[a] [b]
Sorghum grain dry
rolled [a] [b]
Sorghum grain steam
flaked [a] [b]
Sorghum WDGS
[a] [b] [c] [d]
Wheat grain dry rolled
[a] [b]
Wheat grain steam flaked
[a] [b] Wheat WDGS
[e] [f]
Dry matter [DM] % AF 88.0 82.0 30.0 88.0 82.0 30.0 88.0 82.0 30.0 90.0 82.0 30.0
Metabolisable Energy MJ/kg DM 12.5 13.9 10.9 12.8 13.8 14.9 12.3 13.3 13.0 13.3 13.9 n.a.
Net Energym MJ/kg DM 8.5 9.2 7.6 9.0 9.6 10.4 8.2 9.2 8.6 9.0 9.4 n.a.
Net Energyg MJ/kg DM 5.6 6.5 4.9 6.0 6.5 6.9 5.4 6.3 5.7 6.0 6.4 n.a.
Fat % DM 2.1 2.1 3.7 4.3 4.1 11.0 3.1 3.1 11.0 2.3 2.3 3.2
Crude protein % DM 12.0 12.0 30.0 9.0 9.0 30.0 11.0 11.0 31.0 14.0 14.0 40.0
ADF % DM 7.0 7.0 22.0 3.0 3.0 15.0 6.0 6.0 19.0 4.0 4.0 n.a.
NDF % DM 20.0 20.0 45.0 9.0 9.0 39.0 15.0 15.0 47.0 12.0 12.0 29.2
Calcium % DM 0.06 0.06 0.15 0.02 0.02 0.20 0.04 0.04 0.06 0.05 0.05 n.a.
Phosphorus % DM 0.35 0.35 0.67 0.30 0.30 0.80 0.32 0.32 0.94 0.43 0.43 n.a.
Notes: [a] [b] [c] [d] [e] [f]
After Preston [22]
After NRC
[21]
Adapted from Lodge et al.. [18]
Kansas Grain Sorghum Producers Association
[27]
After Akayezu et al.. [28]
Adapted from Nyachotic et al..
[29]

45
It has been noted recently[30] that in 1996 the National Research Council estimated the metabolisable energy for steam-flaked corn and sorghum at 5.6% and 15.6% higher than dry-rolled grain respectively, although a more recent review[31] found that the metabolisable energy for steam-flaked barley, corn, sorghum and wheat was higher than that for dry-rolled grain by 0%, 15.5%, 21.0%, and 13.6% respectively [based on 605 comparisons]. This suggests that for corn, sorghum and wheat based distiller grain the steam-flaked equivalent grain type offers more energy. Tabulated values for WDGS are provided only as a guide and it must be stressed that the by-products require a full assessment upon the establishment of individual plants. 5.1.3 Fresh [WDGS] and dried [DDGS] distiller grain by-product
Distiller grain in the fresh form [WDGS] has a dry matter content of approximately 30%; in the dried form [DDGS] it has a dry matter content of approximately 90%. The drying process is expensive and results in a small loss of nutrient energy of approximately 3% to 6%. WDGS can deteriorate rapidly when exposed to air. The cost and ease of commodity shipping, storage, handling, milling and delivery to animal all influence feedstuff nutrient evaluations and financial worth. Comparative appraisals adjust for the relative dry matter content. Feedstuffs with low dry matter, such as silage, may be valuable feedstuffs when sourced from a site adjacent to the feedlot but rapidly become financially less attractive once further cartage is required. WDGS has a low dry matter content which means that handling is difficult and its feedstuff value is noticeably reduced as the distance increases between the ethanol plant and feedlot. The extra bulk incurs extra handling at each stage from ethanol plant to animal. As dry matter costs increase, the optimum inclusion rate will decline and consequently, the value of WDGS needs to be appropriately discounted to compensate for the disadvantages associated with its low DM. Additionally, the shelf life of WDGS is restricted to approximately four days before spoilage in warm weather. Mould usually occurs upon storage, potentially adversely affecting palatability to livestock. It is possible to extend shelf life by adding preservatives during processing and/or ensiling but these incur additional costs. In the dry form, DDGS offers enhanced ease in commodity shipping, storage, handling, milling and delivery to animal. However, these benefits to the feedlot as a result of drying, incur increased plant production costs which may or may not be able to be absorbed in the market place. Consequently, drying is frequently discouraged and the distiller grain is more commonly fed as WDGS to ruminants when transport distances are minimal. In summary, the decision to use either WDGS or DDGS in the feedlot cattle‟s diet should be principally based on an analysis of its cost as a source of protein and energy relative to those from alternative available feedstuffs within sound nutritional practices.

46
5.1.4 WDGS and DDGS in feedlot diets
In North America, distiller grains are used widely in feedlot rations, primarily corn and to a limited extent, sorghum grain. The feedstuff is fed fresh as WDGS [approximately 30% dry matter [DM], or dried as DDGS [approximately 90% DM]. Typical inclusion rates range from 5% to 25% [DM] depending on sound ration management and the full cost appreciation of the range of feedstuffs available. In feedlot diets, fresh corn WDGS and DDGS are palatable and readily consumed by cattle. The moisture in fresh WDGS has the ability to assist the conditioning of dry rations. For corn and sorghum, there is an approximate three-fold concentration of protein, fat and minerals in WDGS as compared to the whole grain. The increased fat proportion contributes to the nutrient energy, compensating for the extracted starch, and digestible fibre maintains high digestible energy. WDGS and DDGS provide an alternative energy and protein source to grain – approximately 50% is the un-degraded intake protein [UIP] or „by-pass protein‟ and approximately 50% the degraded intake protein [DIP]. The nutrient values for both WDGS and DDGS are similar on the basis of dry matter, although energy values are usually lower in the DDGS as a result of fat loss from high temperatures applied during the drying process. Distiller grains dried at higher temperatures are also less digestible[32]. In the US, much of the research on distiller grains as an energy source has focused on finishing cattle fed dry-rolled corn or dry-rolled corn/high-moisture corn combinations. Results suggest that feeding corn WDGS results in better performance than DDGS[33], primarily due to the higher energy content. Erickson et al., [2006] reviewed a number of studies on WDGS in ruminant diets and found that the replacement of corn grain with WDGS consistently improved feed efficiency. For example, WDGS contained 120% to 150% the energy value of dry-rolled corn in beef finishing diets and by comparison, DDGS was found to have 120% to 127% the energy value of dry-rolled corn in high roughage rations. When using WDGS, with its starch largely extracted, there was an associated decline in acidosis. It is likely that acidosis control produces the higher apparent energy values and this is one of the major advantages of using distiller grains in the feedlot industry. In addition, studies have found that it is possible to minimise roughages in diets containing distiller grains relative to inclusion rates[34] and this is significant in terms of finishing rations. Another advantage of the high un-degraded intake protein value of distiller grain is that it provides a valuable protein source for young, growing cattle and lactating cows. Drying distiller by-products reduces their net energy value but does not seem to affect their protein value[33; 25]. Specific studies on diet inclusion rates In general, the US research suggests there are two nutritional philosophies regarding the use of distiller grain in feedlot finishing diets. Distiller grains may be fed at five to 15% of the diet dry matter to serve as a source of supplemental protein. Alternatively, if fed at higher levels [>15% diet DM], the primary role of distiller grain is to provide an alternative source of energy to the ration grain[35]. It is common for WDGS to be fed at higher levels than DDGS [on a DM basis] to supply both protein and energy to the animal. This is because WDGS rations delivered at the bunk are cheaper than DDGS given that costs associated with drying are reduced or eliminated in the wet by-product. On

47
the other hand, the transportation costs of WDGS are higher as a consequence of its water content and the feedlot must also consider its disadvantages such as a limited shelf-life and difficulties associated with storage, handling and volume. Given that drying reduces its net energy value, DDGS is routinely fed as a supplemental protein source, priced relative to other supplemental protein sources. Trenkle36 showed that WDGS and DDGS can be fed to growing and finishing Holstein steers at 10% or 20% [on a DM basis] without affecting performance or carcass value in the market. Calves fed 40% WDGS consumed less fed and had slower gains in weight whereas steers fed 10% WDGS consumed less feed with the same weight gain and improved efficiency. As Table 1.16 showed previously, it is important to consider the processing [e.g. dry-rolled, steam-flaked] of the ration grain when evaluating distiller grains as a diet component substitute. Gordon et al..[37] experimented to determine the optimal level of DDGS in heifer finishing diets based on steam-flaked corn. The study compared diets containing six levels of DDGS [0%, 15%, 30%, 45%, 60%, and 75%] and found that an inclusion rate of 15% was optimal. DDGS affected average daily gain, final weight and hot carcass weight, all of which increased with 15% DDGS but decreased as additional DDGS was added. Heifers on diets containing 15% DDGS finished at a heavier final and hot carcass weight, gained more weight per day, were more efficient and had a higher percentage of cattle graded as „prime‟. It is interesting to note that the growth of heifers fed 30% DDGS was similar to those fed 0% and that the inclusion of more than 45% DDGS in the diet tended to reduce performance and carcass grade. Similarly, in an experiment to determine the optimum use of sorghum WDGS in steam-flaked corn finishing diets, it was Daubert et al..[38] found that an inclusion rate of 15% was optimal and concluded that the replacement of steam-flaked corn with sorghum based WDGS was a viable option for improving dry matter intake, average daily gain and feed efficiency. WDGS was added at proportions as high as 24% without compromising performance during the last two months before slaughter. Vander Pol et al..[39] evaluated six levels of dietary inclusion of corn WDGS [0%, 10%, 20%, 30%, 40%, 50% DM] in terms of feedlot performance and carcass characteristics of yearling steers. The study also compared the energy value of corn WDGS relative to dry-rolled corn. For inclusion rates of 0% to 50%, final body weight, dry matter intake and average daily gain increased quadraticly and feed to gain decreased quadraticly. The energy value of corn WDGS relative to dry-rolled corn was above 100% for all inclusion levels, decreasing from 178% to 121% as dietary corn WDGS inclusion increased from 10% to 50% of dry matter. It was concluded that corn WDGS can be used effectively in finishing diets with optimum feed conversion observed at 30% to 40% dietary inclusion. Specific studies on the type of distiller grain Studies comparing corn versus sorghum based distiller grain have found generally similar production efficiencies in cattle diets. For example, when comparing sorghum and corn based WDGS by-products at 30% of diet DM, Lodge et al..[18] found the sorghum based by-product to have a lower energy value although statistically, the by-products had similar feeding values. The sorghum based product was equal or slightly higher in net energy for gain as compared with dry-rolled corn grain. Similarly, in a comparison of feeding sorghum and corn based distiller grains in both beef finishing and dairy lactation experiments, Al-Suwaiegh et al..[40] recorded the average daily gain and efficiency of gain to be alike. Hot carcass weights, fat thickness and yields were greater for steers fed distiller

48
grains than for controls. Corn and sorghum distiller grains resulted in relatively similar performances when fed to beef or dairy cattle. There is little relevant data relating to the nutrition value of wheat, and barley based distiller grain for ruminants. On the basis of experiments conducted in Canada,[29] it was concluded that wheat based DDGS could be effectively used in pig diets as a high level source of nutrient energy, protein, amino acids and non-phytate phosphorus. Other results of Mustafa et al..[19] indicated barley based distiller grain was characterised by low protein and high fibre contents although the fibre was less degradable than that from wheat based distiller grain. To date, there is an inadequate amount of creditable research or experience to judge the value of wheat distiller grain in Australia. The data that is available [Refer to Table 5.1.2.1] suggests wheat based distiller grain would have less nutrient energy than the corn or sorghum based by-product as it contains less fat, but on the other hand, would have a higher crude protein value. Again based on the figures, it is expected that barley based by-products would have less nutrient energy than those derived from wheat. 5.1.5 Distiller grain and meat quality
Studies show that corn based distiller grain has no an adverse affect on meat quality when included at customary rates in finishing diets. Roeber et al..[41] concluded that feeding corn based dried distiller grain at up to 50% of dietary dry matter in finishing rations did not affect the tenderness or sensory traits of the meat and was therefore a viable feed alternative. However, the study found that at higher levels, corn based dried distiller grain may have a negative effect on colour stability during retail display, and at low to moderate inclusion rates [10%-25% DM], may enhance retail shelf life without affecting cooked beef palatability. Evaluating the effect of distiller grain at varying diet inclusion levels, Gordon[42] concluded that the effects on meat sensory traits and display colour stability were too small to warrant the feeding of DDGS to improve these traits. Gordon et al..[37] found the percentage of carcasses graded as „choice‟ or „prime‟ tended to be lower for heifers fed 60% or 70% DDGS as compared to heifers fed 0%, 15%, 30% and 45% DDGS in their diet. 5.1.6 Additional considerations
Sulphur and phosphorous levels in distiller grains are relatively high, having been concentrated in the residual after the starch removal. Sulphur in excess of 0.4% of distiller grain DM may cause an excess sulphur level in the diet. If distiller grain is used when there are high sulphur levels in drinking water or other dietary feed products, dietary sulphur content could exceed the recommended maximum tolerable dietary levels from all sources [21]. High dietary sulphur can interfere with copper absorption and Cmetabolism, an antagonism made worse in the presence of molybdenum. Sulphur excess can be managed via monitoring and ration adjustment. Distiller grain by-products also have a high phosphorus content. This may necessitate the correction of ill-matched dietary calcium:phosphorus ratio with calcium supplementation. Additionally, a resultant high phosphorous content in feedlot waste necessitates the close monitoring of waste management programs and potentially has an adverse affect on costs associated with manure

49
management. Evaluation of the cost of managing feedlot manure high in phosphorus suggests that the cost of handling additional manure generated by feeding by-products such as WDGS is between US$0.75 to US$1.00 per head for inclusion rates of 0% to 30% and 40% respectively.[43;44,45] Another consideration is that diet nutrient excesses such as crude protein can reduce the efficiency of energy utilisation. Excess nitrogen is metabolised and excreted as urea and so requires energy. This can contribute to excessive body heat which is a potential concern under hot conditions[46]. Furthermore, excess dietary nitrogen excreted to the pen surface can create additional discomforting ammonia release under certain surface conditions and may necessitate additional monitoring and care in waste management. Having said this, in a trial incorporating an assessment of odour emissions, Benson[47] was unable to detect any odour characteristics attributable to the DDGS feed finishing steers at varying inclusion rates to 35% DM. The possible effects of increased levels of contaminants such as chemical weedicide and pesticides, moulds or ergots concentrated in the distiller grain residual is largely unknown. Whilst these may be considered faint possibilities at this stage, it will be necessary to examine the distiller grain for such contaminants once production units are established.
5.2 SWOT assessment
The following SWOT assessment has been undertaken to summarise the key findings of the research on the use of ethanol production by-products in the Australian feedlot industry. This analysis will assist the industry in understanding and assessing the comparative appeal of WDGS and DDGS by-products. Strengths of ethanol production by-products
The increased availability of a high quality ruminant feedstuff with high energy, protein and phosphorus values [based on DM], and highly digestible fibre when using corn and sorghum.
There is substantial North American research on corn and sorghum WDGS and DDGS in finishing rations to suggest that by-products can be substituted in cattle diets at optimal inclusion rates of between 5% and 25%.
Fresh corn and sorghum WDGS and DDGS are palatable and readily consumed by cattle. The moisture in WDGS may assist in the conditioning of dry rations.
A decrease in acidosis in high concentrate rations, relative to the inclusion rate, has been observed.
In dried form, DDGS is able to be more efficiently transported, stored, handled and processed, and has an extended shelf-life.
WDGS and DDGS are available around the year and further grain processing is unnecessary.
Experiments and observations reported indicate there is nil adverse effect on meat quality.
Weaknesses of ethanol production by-products
In the low dry matter WDGS, the high moisture adversely affects shipping, handling, storage and feeding costs and also limits shelf life, thus reducing its value as a feedstuff.

50
The production process for drying distiller grain is energy intensive and expensive, and also reduces the nutrient energy content of the feedstuff.
The absence of a standardised, descriptive grading system for ongoing composition, quality, and potential contaminant status creates risks and effectively reduces the value of ethanol production by-products as a feedstuff.
Research suggests that the maximum desirable ration inclusion rate for corn and sorghum based distiller grain is approximately 25% to 30% of dry matter – meaning that feedlots remain dependant on alternative high nutrient energy sources.
There is limited data about the impact of feeding wheat or barley based WDGS and DDGS in the feedlot industry.
Wheat based distiller grain is assessed to have less nutrient energy than corn or sorghum based by-products as a result of a lower fat content. The barley based by-product has less energy again.
Both the wheat and barley based by-products have higher protein levels, thus increasing the risk of animal overheating.
Product composition and quality fluctuates between plants and is subject to multiple variables affecting the feedstock grain.
The tabulated feeding values can only be used as a guide and the final products will require further testing when a plant is established in Eastern Australia.
The relative high fat content of distiller grains may affect maximum dietary inclusion rates.
Diet content must be closely monitored given the high phosphorous and sulphur levels.
High phosphorous and diet crude protein excess may cause undesirable environmental impacts on loss of ammonia from manure and use of cattle manure as a fertiliser.
Opportunities associated with the use of ethanol production by-products
WDGS and DDGS are a potential alternative source of ruminant nutrient energy and protein.
The evaluation of by-products when produced in Australia on a plant to plant basis will lead to the determination of the optimum, cost effective product use.
WDGS and DDGS may be used by feedlots as a means of controlling acidosis and reducing roughage levels in finishing diets.
There is an opportunity for savings to the feedlot industry if the WDGS shelf life can be extended without significantly increasing the by-product costs.
Some studies suggest that at low to moderate inclusion rates, corn based distiller grain may enhance retail meat shelf life without affecting cooked beef palatability.
Threats associated with the use of ethanol by-products
The grain based ethanol industry will compete with the intensive livestock industries for grain, increasing the overall nutrient energy costs.
There will be a net loss of high nutrient energy feedstuffs available to the intensive livestock industries.

51
The actual nutrient value of the ethanol production by-products will not be fully known until individual plants are in operation and are thoroughly tested.
Feedlots must factor in higher costs associated monitoring high phosphorus and sulphur levels at upper ration inclusion rates, animal body heat, ammonia levels, and the feedlot‟s waste management processes.
6 Potential Usage for WDGS and DDGS in the Eastern Australian Feedlot Industry
This section considers the factors affecting the usage of distiller grain by-products across in the Eastern Australian feedlot industry. It also examines in detail the potential impact of ethanol production on grain availability in Eastern Australia with particular reference to meeting the Federal Government‟s targets for biofuels and ethanol production [approximately 250ML under the current policy and 2,500 ML if an E10 inclusion policy was mandated].
6.1 Factors influencing usage
6.1.1 Availability
The potential WDGS or DDGS availability has been assessed for each of the study scenarios level of ethanol production [Table 1.17]. Table 1.17 WDGS and DDGS produced relative to ethanol production and gasoline sales
Ethanol production Representative 2006
Eastern Australia gasoline sale
Barley Corn Sorghum Wheat
% Tonnes Tonnes Tonnes Tonnes
1. WDGS [30% DM]
Stu
dy s
ce
na
rio
s 1 ML 3,694 2,413 1,938 3,006
250 ML 1.03 923,500 603,250 484,500 751,500
500 ML 2.06 1,847,000 1,206,500 969,000 1,503,000
1,000 ML 4.12 3,694,000 2,413,000 1,938,000 3,006,000
2,500 ML 10.29 9,235,000 6,032,500 4,845,000 7,515,000
5,000 ML 20.58 18,470,000 12,065,000 9,690,000 15,030,000
2. DDGS [90%DM]
Stu
dy s
ce
na
rio
s 1 ML 1,231 804 646 1,002
250 ML 1.03 307,833 201,083 161,500 250,500
500 ML 2.06 615,667 402,167 323,000 501,000
1,000 ML 4.12 1,231,333 804,333 646,000 1,002,000
2,500 ML 10.29 3,078,333 2,010,833 1,615,000 2,505,000
5,000 ML 20.58 6,156,667 4,021,667 3,230,000 5,010,000

52
6.1.2 Cost and nutrient value evaluation
Sorghum and wheat will be the predominant base grains in an Eastern Australia grain based ethanol industry. The nutrient value of these distiller grains can be determined via a number of methodologies, dependant on the purpose for which it is utilised. The cattle feedlot industry will have to rely on the guidance provided by the US research (as discussed in the previous section) but the industry is likely to value the product firstly as an energy source feedstuff replacing grain in rations, and secondly, as an organic-based protein source. Sorghum WDGS and DDGS are evaluated as a source of nutrient energy and crude protein relative to typical dry-rolled feed grains and protein meals in Tables 1.18 and 1.19. Table 1.18 illustrates the calculated value of sorghum distiller grain relative to dry-rolled grains and whole white cotton seed on nutrient energy [ME] basis alone. For example, sorghum WDGS has 106% and 36% of the relative ME value of dry-rolled sorghum on a DM and „as is‟ basis respectively. Similarly, sorghum DDGS has 99% and 102% of the relative ME value respectively. Furthermore, if the DDGS and dry-rolled grain have similar DM [say 90%], the relative values are both 99%. Table 1.18 Calculated value of sorghum WDGS and DDGS relative to other typical dry-rolled feed grains and
whole white cotton seed on metabolisable energy [ME] basis alone
Comparative ME Value of Sorghum Distiller Grain
Grain DM ME WDGS DDGS
[a] [30% DM product] [90% DM product]
DM ‘As is’ DM ‘As is’ DM ‘As is’
% MJ/kg MJ/kg % % % %
[c] [d] [c] [d]
Barley 88 12.5 11.0 104 35 98 100
Corn 88 12.8 11.3 102 35 95 98
Sorghum 88 12.3 10.8 106 36 99 102
Wheat 90 13.3 12.0 98 33 92 92
White cotton seed 92 14.5 13.3 90 29 84 82
Sorghum WDGS 30 13.0 3.9 94 282
Sorghum DDGS [b] 90 12.2 11.0 106 35
Note: [a] [b] [c] [d]
Grains, dry-rolled processed basis Assuming 6% nutrient energy loss in drying process Compares like with like, DM with DM Compares like with like, „as is‟ with „as is‟
On the next page, Table 1.19 illustrates the calculated value of the sorghum based distiller grain relative to protein meals on the basis of crude protein alone. For example, sorghum WDGS has 82% and 27% of the relative crude protein value of canola meal on a DM basis and „as is‟ basis respectively. Similarly, sorghum DDGS has 82% and 82% the relative crude protein value respectively.

53
Table 1.19 Calculated value of sorghum WDGS and DDGS relative to typical protein meals and whole white cotton seed on crude protein basis alone
Comparative CP Value of Sorghum Distiller Grain
Protein Source DM Crude Protein WDGS DDGS
[30% DM product] [90% DM product]
DM ‘As is’ DM ‘As is’ DM ‘As is’
% % % % % % %
[a] [b] [a] [b]
Canola meal 90 38.0 34.2 82 27 82 82
Copra meal, Lupins 90 21.0 18.9 148 49 148 148
Cotton seed meal 90 44.0 39.6 70 23 70 70
Linseed meal 90 35.0 31.5 89 30 89 89
Lupins 90 31.0 27.9 100 33 100 100
Palm kernel meal 90 16.5 14.9 188 63 188 188
Peanut meal 90 42.0 37.8 74 25 74 74
Soybean meal 90 50.0 45.0 62 21 62 62
Sunflower 90 42.0 37.8 74 25 74 74
White cotton seed 92 23.0 21.2 135 44 135 132
Sorghum WDGS 30 31.0 9.3 100 300
Sorghum DDGS [c] 90 31.0 27.9 100 33
Note: [a] [b]
Compares like with like, DM with DM Compares like with like, „as is‟ with „as is‟
Ultimately, the product‟s nutrient value [metabolisable energy, protein, mineral, vitamin and possible specialised qualities] and cost can only be determined in the process of applying sound ration formulation principles to optimise the return on funds employed on an individual feedlot basis. 6.1.3 Industry capacity to utilise distiller grain
The following tables provide an analysis of the Australian feedlot industry‟s capacity to utlise distiller grain based on a range of inclusion rates [0% to 25% DM] as well as varying capacity take-up rates across the industry [25%, 50%, 75%, 100%]. It has been also reported that the feedlot industry‟s consumption of grain is increasing – 3.8 million tonnes of total feedstuffs in 2005-06 [adapted from Hafi and Connell[4]; [10]; Aus-meat NFAS, personal communication, 2006]. Thus, the following table presents figures for a total industry consumption of 3, 4, 5, and 6 million tonnes. Table 1.20 presents the calculated usage of distiller grain using sorghum based WDGS. The calculation adjusts for individual commodity feedstuff and diet DM as the inclusion proportions vary. The table demonstrates, for example, that when the feedlot industry consumes in total 4,000,000 tonnes [„as is‟] of feedstuffs and that 25% of industry capacity utilises WDGS at a diet inclusion rate of 15% of DM, the potential industry demand is approximately 383,750 tonnes of WDGS „as is‟ [30% DM]. It is significant to note that this represents about 80% of the by-product of a sorghum based industry which produces 250 ML annually but only just over eight per cent of the by-product if the industry produces 2,500 ML annually [Refer to Table 1.17].

54
In the unlikely scenario of 100% of industry capacity utilising WDGS at a diet inclusion rate of 15% [DM], the potential industry demand rises to 1,535,000 tonnes. This equates to approximately 30% of potential distiller grain production from a 2,500 ML sorghum based ethanol industry. It should be noted that if various grains, including wheat and barley, are used for ethanol production, the likelihood of grain shortages based on feedlot industry demand is considerably reduced. Table 1.20 Potential distiller grain usage for a range of feedlot capacity take-up at 0% to 25% [DM] diet
inclusion rates
Eastern Australia feedlot industry
Diet inclusion rate [DM]
Potential distiller grain usage [30% DM] for varying total feedstuff consumption [a]
Tonnes Tonnes Tonnes Tonnes
Total feedstuffs consumed annually „as is‟
3,000,000 4,000,000 5,000,000 6,000,000
Fe
ed
lot
ca
pa
cit
y t
ak
e-u
p o
f d
isti
lle
r g
rain
25% 0%
5% 102,813 137,083 171,354 205,625
10% 198,750 265,000 331,250 397,500
15% 287,813 383,750 479,688 575,625
20% 370,000 493,333 616,667 740,000
25% 445,313 593,750 742,188 890,625
50% 0%
5% 205,625 274,167 342,708 411,250
10% 397,500 530,000 662,500 795,000
15% 575,625 767,500 959,375 1,151,250
20% 740,000 986,667 1,233,333 1,480,000
25% 890,625 1,187,500 1,484,375 1,781,250
75% 0%
5% 308,438 411,250 514,063 616,875
10% 596,250 795,000 993,750 1,192,500
15% 863,438 1,151,250 1,439,063 1,726,875
20% 1,110,000 1,480,000 1,850,000 2,220,000
25% 1,335,938 1,781,250 2,226,563 2,671,875

55
Table 1.20 continued
Eastern Australia feedlot industry
Diet inclusion rate [DM]
Potential distiller grain usage [30% DM] for varying total feedstuff consumption [a]
100% 0%
5% 411,250 548,333 685,417 822,500
10% 795,000 1,060,000 1,325,000 1,590,000
15% 1,151,250 1,535,000 1,918,750 2,302,500
20% 1,480,000 1,973,333 2,466,667 2,960,000
25% 1,781,250 2,375,000 2,968,750 3,562,500
Note: [a] Sorghum WDGS basis for all grains „as is‟ [30% DM]
6.2 Impact of grain based ethanol production on feed-grain supply in Eastern Australia
6.2.1 Grain demand
As stated in the objective of this study, the Federal Government‟s current target is to annually produce 350 ML of biofuels in Australia by 2010, 75% of which will come from feed-grain based ethanol production. This equates to 262.5 ML and so for the purposes of assessing the impact of current Government policy, attention should be focused on the data presented for the 250ML ethanol production scenario. In order to assess the potential impact of a mandated E10 inclusion policy on the feed-grain supply in Eastern Australia, attention should be focused on the data presented for the 2,500ML ethanol production scenario [based on the equivalent proportion of automotive gasoline as presented in Table 1.13]. Table 1.21 presents the various grain demands for ethanol production levels. For 250 ML [approximately 1%] and 2,500ML [approximately 10%] production targets, the sorghum based grain demand would be in the order of 614,000 and 6,142,000 tonnes respectively. Alternatively, if wheat were to be used, approximately 686,000 tonnes would be needed to produce 250 ML of ethanol and 6,861,000 tonnes for 2,500ML of ethanol. The totals can be determined on a pro rata basis if there are multi-grain sources.

56
Table 1.21 Feed-grain demand for levels of grain based ethanol production
Ethanol production
Representative 2006 Eastern Australia
gasoline sales
[a]
Barley Corn Sorghum Wheat
% Tonnes Tonnes Tonnes Tonnes
Stu
dy s
ce
na
rio
s 1 ML 3,055 2,618 2,457 2,744
250 ML 1.03 763,685 654,587 614,224 686,108
500 ML 2.06 1,527,370 1,309,175 1,228,448 1,372,216
1,000 ML 4.12 3,054,741 2,618,349 2,456,896 2,744,433
2,500 ML 10.29 7,636,852 6,545,873 6,142,241 6,861,082
5,000 ML 20.58 15,273,705 13,091,747 12,284,481 13,722,165
Note: [a] Refer Table 1.13
6.2.2 Grain supply
The establishment of a grain based ethanol industry will obviously increase the domestic demand for grain in Eastern Australia. Based on the above figures, it can be seen that at the 2,500 ML level, the demand for grain ranges from between 6,142,000 and 6,860,000 tonnes annually. This represents about 25% and 65% of cereal grain produced in Eastern Australia in 2002, and the drought year 2003 respectively [Refer to Table 1.1]. Sorghum grain is produced in northern New South Wales and Queensland. The five-year average production to 2005 is approximately 30% of that required for a 2,500 ML grain based ethanol industry [Refer to Table 1.2]. However, as Table 1.22 shows, the current volume of sorghum grain is largely consumed in the domestic market and it is therefore possible that a grain based Eastern Australia ethanol industry may encourage increased sorghum production in a movement away from other crops. Alternatively, the ethanol production industry will be dependant on wheat as its principal source feed-grain. Approximately 50% of Eastern Australia wheat produced comes from New South Wales [Refer to Table 1.2]. The demand on wheat supplies to support a 2,500 ML grain based ethanol industry would severely diminish the national wheat volume for export. For example, Table 1.22 shows that 38% of the 2004 nationally exported crop would be required for ethanol production or 73% of the drought affected 2003 exported crop.

57
Table 1.22 Supply and disposal of Australian grains
2001-02 2002-03 2003-04 2004-05 2005-06 [s] 2006-07 [f]
„000
Tonnes
„000 Tonnes
„000
Tonnes
„000 Tonnes
„000
Tonnes
„000 Tonnes
Barley Production 8,280 3,865 10,382 7,740 9,869 5,840 Domestic use 2,535 2,016 2,476 2,685 2,805 2,921 – as malt and other human use
161
165
168
172
176
180
– feed 2,200 1,650 2,100 2,300 2,450 2,560 – seed 174 201 208 213 180 181 Export 5,274 2,608 6,996 4,862 5,760 5,031 – feed barley 2,971 885 4,241 2,798 3,401 2,972 – malting barley 1,705 1,099 2,135 1,464 1,765 1,493 – malt [grain equivalent] 600 624 624 601 595 565 Corn Production 454 310 395 420 380 385 Domestic use 440 294 385 302 374 378 – human, industrial 101 104 106 109 112 115 – feed 338 189 277 192 261 262 – seed 1 1 1 1 1 1 Export [c] 63 16 10 5 6 6 Oats Production 1,434 957 2,018 1,283 1,416 1,080 Domestic use 1,244 836 1,809 1,182 1,229 919 – human 125 128 131 134 138 141 – feed 1,076 656 1,635 1,007 1,053 740 – seed 44 52 43 41 38 39 Export 190 121 210 138 224 272 Sorghum Production 2,021 1,465 2,009 2,011 2,019 2,287 Domestic use 1,646 1,401 1,386 1,935 1,721 2,198 – feed 1,643 1,397 1,382 1,930 1,717 2,193 – seed 3 4 3 4 4 5
2002-03 2003-04 2004-05 2005-06 2006-07 2007-08
Export [c] 375 64 623 259 276 121 Triticale [b] Production 860 327 826 610 676 525 Domestic use 860 327 826 615 676 525 – feed 840 305 809 598 660 508 – seed 20 22 17 17 16 17 Wheat Production 24,299 10,132 26,132 21,905 25,090 16,408 Domestic use 4,894 5,666 5,139 5,282 5,457 5,660 – human and industrial 2,291 2,378 2,351 2,361 2,408 2,458 – feed [b] 2,100 2,700 2,185 c 2,338 c 2,548 c 2,637 c – seed 503 588 603 584 501 564 Exports 16,317 9,107 17,867 14,675 15,388 16,649 Change in stocks 3,088 -4,641 3,126 1,948 4,244 -5,901 Total grains Production 37,348 17,056 41,762 33,969 39,449 26,524 Domestic use 11,620 10,540 12,020 12,002 12,262 12,600 Exports [a] 22,219 11,916 25,707 19,938 21,655 22,079
Note: [a] Wheat export figures are for winter crop years defined as October – September. Production may not equal the sum of apparent domestic use and exports in any one year due to reductions or increases in stock levels.
[b] Calculated as a residual: production less exports less change in stocks [c] Does not include imports [s] ABARE estimate [f] ABARE forecast Source: ABARE
[7]

58
6.2.3 By-product substitution for grain
The figures provided in the previous section, clearly show that ethanol production from feed-grain will cause a net loss of available high energy feedstuffs, particularly to the cattle feedlot industry but also more generally to the intensive livestock industries. These losses are to some extent offset by the use of distiller grain as a substitute for part of the grain in feedlot diets and Table 6.2.3.1 illustrates the scenario in which sorghum is the sole base grain for ethanol production. Table 1.23 Effect of ethanol production on net feed availability with sorghum as the sole base grain
Ethanol production
Feed-grain
demand Distiller grain produced
High energy feedstuff net gain/[loss] to the intensive
livestock industries
Sorghum Sorghum WDGS Sorghum DDGS
Sorghum grain less Sorghum DDGS
[Annual] [88% DM] [30% DM] [90% DM] [88% DM; 90% DM]
Tonnes Tonnes Tonnes Tonnes
Stu
dy s
ce
na
rio
s 1 ML 2,457 1,938 646 [1,811]
250 ML 614,224 484,375 161,458 [452,766]
500 ML 1,228,448 968,750 322,917 [905,531]
1,000 ML 2,456,896 1,937,500 645,833 [1,811,063]
2,500 ML 6,142,241 4,843,750 1,614,583 [4,527,657]
5,000 ML 12,284,481 9,687,500 3,229,167 [9,055,314]
For example, ethanol production at 250 ML demands approximately 615,000 tonnes of sorghum annually, with a by-product of approximately 161,000 tonnes of DDGS [or equivalent] of similar dry matter content and nutrient energy value to dry-rolled sorghum. Ethanol production at 2,500 ML produces approximately 1,615,000 tonnes of DDGS of similar nutrient value to dry rolled sorghum. The net loss of high energy feedstuffs to the intensive livestock industries would be approximately 470,000 tonnes at 250 ML and 4,700,000 tonnes at 2,500 ML ethanol production levels. In addition, the limitations associated with the use and incorporation of distiller grain in diets restricts its use [Refer to Section 5.2]. At typical industry diet inclusion rates of 5% to 25% the amount of by-product rapidly exceeds that capable of being gainfully consumed by the existing feedlot industry as shown in Table 1.20. The fact that a significant proportion of the cattle‟s diet must come from additional dry matter diminishes the counterbalancing effect of the distiller grain on the reduced supply of grain associated with ethanol production. Table 1.24 illustrates that if 25% of the Eastern Australia feedlot capacity included distiller grain in feedlot diets at 15% DM, there would be in the order of approximately 33,500 tonnes surplus of DDGS [or equivalent] at the 250 ML and this rises significantly to approximately 1,487,000 tonnes for 2,500 ML ethanol production levels. If feedlots were to include DDGS at 20% of the diet, the table shows that there would be a shortfall of approximately 3,000 tonnes for 250ML ethanol production but a surplus of approximately 1,450,000 tonnes for 2,500 ML ethanol production levels.

59
Table 1.24 Effect of feedlot industry up-take and ration inclusion rate on distiller grain consumption with sorghum as the sole base grain
Eastern Australia feedlot industry
Potential distiller
grain consumption [a]
Distiller grain surplus/[deficiency] for feedlot industry
demand and ethanol production levels
Capacity take-up
% Diet
[DM]
Sorghum WDGS
Sorghum DDGS
[Sorghum DDGS produced less potential demand]
[30% DM] [90% DM] [90% DM] [90% DM] [90% DM] [90% DM] [90% DM]
Tonnes Tonnes Tonnes Tonnes Tonnes Tonnes Tonnes
At 250 ML
At 500 ML
At 1000 ML
At 2500 ML
At 5000 ML
Fe
edlo
t capacity t
ake
-up o
f dis
tille
r gra
in
25% 0%
5% 137,083 45,694 115,764 277,222 600,139 1,568,888 3,183,471
10% 265,000 88,333 73,125 234,583 557,500 1,526,249 3,140,832
15% 383,750 127,917 33,542 195,000 517,916 1,486,666 3,101,248
20% 493,333 164,444 [2,986] 158,472 481,389 1,450,138 3,064,721
25% 593,750 197,917 [36,458] 125,000 447,916 1,416,666 3,031,248
50% 0%
5% 274,167 91,389 70,069 231,528 554,444 1,523,194 3,137,776
10% 530,000 176,667 [15,208] 146,250 469,166 1,437,916 3,052,498
15% 767,500 255,833 [94,375] 67,083 390,000 1,358,749 2,973,332
20% 986,667 328,889 [167,431] [5,972] 316,944 1,285,694 2,900,276
25% 1,187,500 395,833 [234,375] [72,917] 250,000 1,218,749 2,833,332
75% 0%
5% 411,250 137,083 24,375 185,833 508,750 1,477,499 3,092,082
10% 795,000 265,000 [103,542] 57,917 380,833 1,349,583 2,964,165
15% 1,151,250 383,750 [222,292] [60,834] 262,083 1,230,833 2,845,415
20% 1,480,000 493,333 [331,875] [170,417] 152,500 1,121,249 2,735,832
25% 1,781,250 593,750 [432,292 ] [270,834[ 52,083 1,020,833 2,635,415
100% 0%
5% 548,333 182,778 [21,320] 140,139] 463,055 1,431,805 3,046,387
10% 1,060,000 353,333 [191,875] [30,417] 292,500 1,261,249 2,875,832
15% 1,535,000 511,667 [350,208] [188,750] 134,166 1,102,916 2,717,498
20% 1,973,333 657,778 [496,320] [334,861] [11,945] 956,805 2,571,387
25% 2,375,000 791,667 [630,208] [468,750] [145,834] 822,916 2,437,498
Note: [a] Based on Eastern Australia feedlot industry total feed consumption 4,000,000 tonnes annually, adjusted for DM.

60
6.3 Examples of regional impacts for the feedlot industry in Eastern Australia
6.3.1 Overview
Table 1.25 examines the variability of Eastern Australia grain production over the years 1998 to 2006 as well as the adequacy of grain production during past high, average, and low yielding years in relation to the existing domestic demand. It also considers the extra requirements imposed by the development and expansion of the ethanol industry. Eastern Australia grain is consumed domestically [primarily for human use and intensive livestock industries] and is also exported. In recent average years, there was in the order of approximately 15,100,000 tonnes for export, rising to approximately 19,200,000 tonnes in high yielding years. In the most recent year of lowest yield between 1998 and 2006 there was only a small surplus of approximately 3,700 tonnes for domestic requirements. A small grain based ethanol industry producing 250 ML would further reduce this overall surplus, and an industry producing 2,500 ML would bring about a grain deficiency in Eastern Australia of approximately 2,450,000 tonnes before human consumption [Refer to Table 1.25]. Whilst this shortfall may be reduced by the use of the ethanol by-products in the intensive livestock industries, these make a minor contribution in the overall supply of energy feedstuffs. As such, it is possible that Eastern Australia would be required to import grain in such a year to meet domestic demand.

61
Table 1.25 Overview impact of ethanol production in Eastern Australia on grain availability [i]
Eastern Australia
Unit Year Tonnes
A. Grain Production
Annual Supply
Highest yield [a] tonnes 2004 26,626,998
Average [b] tonnes 1998-2006
22,508,008
Lowest yield [c] tonnes 2003 11,093,960
B. Grain Demand
[a] Established Domestic
Feedlot industry [d] 2,509,063
Other domestic [e] 4,887,467
Total 7,396,530
[b] Add Domestic Ethanol Production
Production Capacity: ML 0 250 2,500
Annual grain demand:
Sorghum [f] tonnes 614,224 6,142,240
Wheat [g] tonnes
Total tonnes 614,224 6,142,240
C. Grain Surplus/[Deficiency] [h]
[a] Currently,
A - Ba
Highest yield [a] tonnes 19,230,468
Average [b] tonnes 15,111,478
Lowest yield [c] tonnes 3,697,430
[b] Situation, following ethanol production grain demand
A - [Ba + Bb]
Highest yield [a] tonnes 19,230,468 18,616,244 13,088,228
Average [b] tonnes 15,111,478 14,497,254 8,969,238
Lowest yield [c] tonnes 3,697,430 3,083,206 [2,444,810]
Notes: [a] Highest 1998-2006 [b] Average 1998-2006 [c] Lowest 1998-2006 [d] Based on 2006 Eastern Australia capacity at 80% utilisation [e] Based on 2005 Eastern Australia; Hafi and Connell
[4]
[f] Sorghum DM - 88% [g] Wheat DM - 90% [h] Based on sorghum starch as average
[i] Domestic, before provision for exports

62
6.3.2 Indicative impacts on regional feedlot industries
The potential impact of a grain based ethanol industry is examined in three major feedlot industry regions with particular respect to their grain supply and demand balance. These are South East Queensland, comprising the Darling Downs, Brisbane, Moreton, Wide-Bay Burnett Statistical Divisions, and in New South Wales the Northern and Murrumbidgee Statistical Divisions. Within each region, four annual levels of ethanol production are examined: 80 ML, 160 ML, 240 ML, and 400 ML. For each of these production levels, it is assumed that 50% of the distiller grain is available to the feedlot industry when commercially and practically attractive. It is assumed that the other 50% will be utilised by intensive livestock industries other than the feedlot industry or further processed [e.g. to electricity, fertiliser, etc]. In all cases, the distiller grain used is DDGS. The examples reflect the contribution that DDGS will make to the feedlot industry at various capacity take-up rates and diet inclusion rates. The regions‟ grain surplus/[deficiency] is estimated with recognition that it may replace grain in feedlot diets [Refer to Section 6.1]. Wherever possible, grain movements between regions may balance the indicated shortfalls but it must be noted that this adds cost to the feedstuff. Further demand will necessitate extra grain importation and associated added cartage costs for all users. South East Queensland [Darling Downs, Brisbane, Moreton, Wide-Bay Burnett] This region embraces Statistical Divisions with a feedlot capacity of 393,624 SCU as at June 2006 [Refer to Table 1.7]. The current grain demand for this capacity at 80% utilisation is assessed at 1,011,614 tonnes annually. Table 1.26 highlights the impact of an ethanol industry, before provision for grain exports and inter-regional transfers. It is notable that:
Based on current feedlot industry practices, there is adequate grain for the domestic demand before exports in the high yield years between 1998 and 2006. Demand exceeds supply in the average and low yield years. In the low yield year, the shortfall exceeds 566,000 tonnes. The region is thus grain deficient in the average and low yield years.
Ethanol production has high grain demand. Taking this into account, there are shortfalls in grain supply in all low yield years [by approximately 764,000 and 1,550,000 tonnes at 80 ML and 400 ML respectively], all average yield years [by approximately 205,000 and 991,000 tonnes at 80 ML and 400 ML respectively] and also in the high yield year with a 400 ML ethanol production capability [by approximately 167,000 tonnes].
The by-product distiller grain can be a useful, although restricted use, feedstuff when favourably priced. Its contribution to the nutrient energy supply is demonstrated for the low yield year. It is notable that:
For a range of feedlot capacity take-ups [25%, 50%, 75% of SCU] and DDGS diet inclusion rates [5%, 15%, 25% DM], there remains major shortfalls in the available grain [or grain plus DDGS] for all ethanol production levels. The example shortfalls range from approximately 500,000 to 1,530,000 tonnes.

63
The grain shortfalls indicated may be fulfilled by increased production on existing cropped land, the development of new agricultural land and/or the change to grain growing from alternative crops. These options may be restricted and the importation of grain from adjoining regions or beyond appears seems most probable. Clearly, an ethanol industry in South East Queensland will exacerbate the region‟s already grain deficient status. Table 1.26 Potential impact of ethanol production on grain availability in the South East Queensland Statistical
Divisions of Darling Downs, Moreton, Brisbane, Wide Bay-Burnett [i]
SE Queensland Darling Downs, Brisbane, Moreton, Wide Bay-Burnett
Unit Year Tonnes
A. Grain Production
Annual Supply
Highest yield [a] tonnes 2000 2,626,418
Average [b] tonnes 1998-2006 1,802,051
Lowest yield [c] tonnes 2001 1,243,703
B. Grain Demand
[a] Established Domestic
Feedlot industry [d] 1,011,614
Other domestic [e] 799,064
Total 1,810,678
[b] Add Domestic Ethanol Production
Production Capacity: ML 0 80 160 240 400
Annual grain demand:
Sorghum [f] tonnes 196,552 393,103 589,655 982,758
Wheat [g] tonnes
Total tonnes 196,552 393,103 589,655 982,758
C. Grain Surplus/[Deficiency]
[h]
[a] Currently,
A - Ba
Highest yield [a] tonnes 815,740
Average [b] tonnes [8,627]
Lowest yield [c] tonnes [566,975]
[b] Situation, following ethanol production grain demand
A - [Ba + Bb]
Highest yield [a] tonnes 815,740 619,189 422,637 226,085 [167,018]
Average [b] tonnes [8,627] [205,178] [401,730] [598,282] [991,385]
Lowest yield [c] tonnes [566,975] [763,526] [960,078] [1,156,630] [1,549,733]
Continued…

64
Table 1.26 continued
SE Queensland Darling Downs, Brisbane, Moreton, Wide Bay-Burnett
[c] Situation, after adding back DDGS included in diet, for lowest yield year
[i], [j]
A - [Ba + Bb] + DDGS [k], [l]
Capacity take-up 25% of SCU
Inclusion rate 5% of diet [745,964] [942,515] [1,139,067] [1,532,170]
15% [710,838] [907,390] [1,103,942] [1,497,045]
Capacity take-up 50% of SCU
Inclusion rate 5% of diet [728,401] [924,953 [1,121,504] [1,514,608]
15% [658,150] [854,702 [1,051,253] [1,444,357]
25% [587,899] [784,451 [981,002] [1,374,106]
Capacity take-up 75% of SCU
Inclusion rate 5% of diet [710,838] [907,390] [1,103,942] [1,497,045]
15% [605,462] [802,013] [998,565] [1,391,668]
25% [500,085] [696,637] [893,189] [1,286,292]
Notes: [a] Highest 1998-2006 [b] Average 1998-2006 [c] Lowest 1998-2006 [d] Based on 2006 capacity at 80% utilisation [e] Based on 2005; Hafi and Connell
[4]
[f] Sorghum DM - 88% [g] Wheat DM - 90% [h] Domestic, before provision for exports [i] DDGS DM - 90% [j] Assumes 50% by-product available as DDGS form; 50% further processed to energy, fertiliser, etc [k] DDGS incorporated at three feedlot capacity take-up rates, three diet inclusion rates
[l] Incorporation of DDGS dependent on commercial acceptance
Northern, New South Wales The Northern New South Wales Statistical Division is Eastern Australia‟s predominant grain producing region with the second largest feedlot capacity of 157,838 SCU as at June 2006 [Refer to Table 1.7. The current grain demand for this capacity at 80% utilisation is assessed at 405,644 tonnes annually. The impact of an ethanol industry in Northern New South Wales before provisions for grain exports or inter-regional transfers is illustrated in Table 1.27.
Based on current feedlot industry practices, there is adequate grain for the domestic demand before exports in high, average and low yield years between 1998 and 2006.

65
Ethanol production has high grain demand. Ethanol production at 240 ML and above will create regional grain shortfalls in the low yield year ranging from approximately146,000 tonnes at 240 ML ethanol production to 553,000 tonnes at 400 ML ethanol production.
As is the case for South East Queensland, the by-product distiller grain can be a useful, although restricted use, feedstuff when favourably priced. Its contribution to the nutrient energy supply is demonstrated for the low yield year. It is notable that:
For a range of feedlot capacity take-ups [25%, 50%, 75% of SCU] and DDGS diet inclusion rates [5%, 15%, 25% DM], there remains major shortfalls in the available grain [or grain plus DDGS] for ethanol production at 240 ML and above. The shortfalls range from approximately 41,000 to 546,000 tonnes.
Whilst the grain shortfalls may be reduced by increased production on existing cropped land, the development of new agricultural land and/or the change to grain growing from alternative crops, these options may be restricted. The region may have to rely on the importation of grain from adjoining regions or beyond. An ethanol industry in Northern New South Wales will lead to grain shortfalls in low yield years, eliminating surpluses for export. This may be further exacerbated with grain transfers to South East Queensland to meet the concurrent potential shortfalls and grain deficit status.
Table 1.27 Potential impact of ethanol production on grain availability in the Northern NSW Statistical Division [i]
Northern, New South Wales
Unit Year Tonnes
A. Grain Production
Annual Supply
Highest yield [a] tonnes 2005 3,798,156
Average [b] tonnes 1998-2006 2,550,081
Lowest yield [c] tonnes 2003 960,514
B. Grain Demand
[a] Established Domestic
Feedlot industry [d] 405,644
Other domestic [e] 90,917
Total 496,561
[b] Add Domestic Ethanol Production
Production Capacity: ML 0 80 160 240 400
Annual grain demand:
Sorghum [f] tonnes 137,586 275,172 412,759 687,931
Wheat [g] tonnes 65,866 131,733 197,599 329,332
Total tonnes 203,453 406,905 610,358 1,017,263
C. Grain Surplus/[Deficiency]
[h]
[a] Currently,
A - Ba
Highest yield [a] tonnes 3,301,595
Average [b] tonnes 2,053,520
Lowest yield [c] tonnes 463,953 Continued…

66
Table 1.27 continued
Northern, New South Wales
[b] Situation, following ethanol production grain demand
A - [Ba + Bb]
Highest yield [a] tonnes 3,301,595 3,098,143 2,894,690 2,691,238 2,284,333
Average [b] tonnes 2,053,520 1,850,068 1,646,615 1,443,163 1,036,258
Lowest yield [c] tonnes 463,953 260,501 57,048 [146,404] [553,310]
[c] Situation, after adding back DDGS included in diet, for lowest yield year
[i], [j]
A - [Ba + Bb] + DDGS [k], [l]
Capacity take-up 25% of SCU
Inclusion rate 5% of diet 267,543 64,091 [139,362] [546,267]
15% 281,628 78,175 [125,277] [532,182]
25% 295,713 92,260 [111,192] [518,097]
Capacity take-up 50% of SCU
Inclusion rate 5% of diet 274,586 71,133 [132,320] [539,225]
15% 302,755 99,303 [104,150] [511,055]
25% 330,925 127,472 [75,980] [482,885]
Capacity take-up 75% of SCU
Inclusion rate 5% of diet 281,628 78,175 [125,277] [532,182]
15% 323,883 120,430 [83,023] [489,928]
25% 366,137 162,685 [40,768] [447,673]
Notes: [a] Highest 1998-2006 [b] Average 1998-2006 [c] Lowest 1998-2006 [d] Based on 2006 capacity at 80% utilisation [e] Based on 2005; Hafi and Connell
[4 ]
[f] Sorghum DM - 88% [g] Wheat DM - 90% [h] Domestic, before provision for exports [i] DDGS DM - 90% [j] Assumes 50% by-product available as DDGS form; 50% further processed to energy, fertiliser, etc [k] DDGS incorporated at three feedlot capacity take-up rates, three diet inclusion rates
[l] Incorporation of DDGS dependent on commercial acceptance
Murrumbidgee, New South Wales Murrumbidgee, New South Wales, is a major grain producing Statistical Division and has the third largest feedlot capacity – 133,232 SCU as at June 2006 [Refer to Table 1.7]. The current grain demand for this capacity at 80% utilisation is assessed at 342,406 tonnes annually.

67
The impact of an ethanol industry in Murrumbidgee before provision for exports or inter-regional transfers is illustrated in Table 1.28. It is notable that:
Based on current feedlot industry practices, there is adequate grain for the domestic demand before exports in the high, average and low yield years between 1998 and 2006.
Ethanol production has high grain demand. With annual ethanol production at 240 ML and above, there are regional grain supply shortfalls in the low yield year. These shortfalls are approximately 113,000 tonnes at 240 ML and 552,000 tonnes at 400 ML.
The by-product distiller grain can be a useful, although restricted use, feedstuff when favourably priced. Its contribution to the nutrient energy supply is demonstrated for the low yield year. It is notable that:
For a range of feedlot capacity take-ups [25%, 50%, 75% of SCU] and DDGS diet inclusion rates [5%, 15%, 25% DM], there remains major shortfalls in the grain available [or grain plus DDGS] for ranges of ethanol production at 240 ML and above. The example shortfalls range from approximately 24,000 to 546,000 tonnes.
As stated previously, grain shortfalls may be reduced by increased production on existing cropped land, the development of new agricultural land and/or the change to grain growing from alternative crops, but these options appear to be restricted. The region may have to rely on the importation of grain from adjoining regions or beyond.
An ethanol industry in Murrumbidgee will lead to grain shortfalls in low yield years, eliminating surpluses for export which may be further exacerbated with regional grain transfers to adjoining regions.
Table 1.28 Potential impact of ethanol production on grain availability in the Murrumbidgee NSW Statistical Division [i]
Murrumbidgee, New South Wales
Unit Year Tonnes
A. Grain Production
Annual Supply
Highest yield [a] tonnes 2001 2,509,568
Average [b] tonnes 1998-2006 1,921,256
Lowest yield [c] tonnes 2003 1,055,728
B. Grain Demand
[a] Established Domestic
Feedlot industry [d] 342,406
Other domestic [e] 167,356
Total 509,762
[b] Add Domestic Ethanol Production
Production Capacity: ML 0 80 160 240 400
Annual grain demand:
Sorghum [f] tonnes
Wheat [g] tonnes 219,555 439,109 658,664 1,097,773
Total tonnes 219,555 439,109 658,664 1,097,773
Continued…

68
Table 1.28 continued
Murrumbidgee, New South Wales
C. Grain Surplus/[Deficiency]
[h]
[a] Currently,
A - Ba
Highest yield [a] tonnes 1,999,806
Average [b] tonnes 1,411,494
Lowest yield [c] tonnes 545,966
[b] Situation, following ethanol production grain demand
A - [Ba + Bb]
Highest yield [a] tonnes 1,999,806 1,780,251 1,560,696 1,341,142 902,033
Average [b] tonnes 1,411,494 1,191,939 972,384 752,830 313,721
Lowest yield [c] tonnes 545,966 326,411 106,856 [112,698] [551,807]
[c] Situation, after adding back DDGS included in diet, for lowest yield year
[i], [j]
A - [Ba + Bb] + DDGS [k], [l]
Capacity take-up 25% of SCU
Inclusion rate 5% of diet 332,356 112,801 [106,754] [545,863]
15% 344,245 124,690 [94,865] [533,974]
25% 356,134 136,579 [82,975] [522,085]
Capacity take-up 50% of SCU
Inclusion rate 5% of diet 338,300 118,746 [100,809] [539,918]
15% 362,078 142,524 [77,031] [516,140]
25% 385,857 166,302 [53,253] [492,362]
Capacity take-up 75% of SCU
Inclusion rate 5% of diet 344,245 124,690 [94,865] [533,974]
15% 379,912 160,357 [59,197] [498,306]
25% 415,579 196,025 [23,530] [462,639]
Notes: [a] Highest 1998-2006 [b] Average 1998-2006 [c] Lowest 1998-2006 [d] Based on 2006 capacity at 80% utilisation [e] Based on 2005; Hafi and Connell
[4]
[f] Sorghum DM - 88% [g] Wheat DM - 90% [h] Domestic, before provision for exports [i] DDGS DM - 90% [j] Assumes 50% by-product available as DDGS form; 50% further processed to energy, fertiliser, etc [k] DDGS incorporated at three feedlot capacity take-up rates, three diet inclusion rates
[l] Incorporation of DDGS dependent on commercial acceptance

69
7 Conclusion
This study has evaluated the competitive effect of a grain based Eastern Australia ethanol industry for grain supplies and the likely impact on the established and expanding intensive livestock industries. The nutritional worth of the principal by-products of such an industry has been reviewed and their worth to the feedlot industry assessed. This study provides a detailed analysis of the likely additional grain usage to support grain based ethanol production in line with the current Federal Governments biofuels agenda. This analysis has been conducted for Eastern Australia as a whole, and also with a particular focus on the primary feedlot industry regions in South East Queensland and in the New South Wales Statistical Divisions of Northern and Murrumbidgee. From these calculations, it has been possible to estimate the potential distiller grain by-product production capacity of a range of ethanol plant production facilities. Furthermore, it has been possible to extrapolate this data to evaluate the impact of a potential change in Federal Government policy should there be a mandate for an E10 inclusion policy. The following primary conclusions can be drawn from the data presented in this study, as well as the North American research in to the use of distiller grains in the feedlot industry:
It is obvious that the ethanol production industry‟s demand for feed-grains will impact on the intensive livestock industries such that shortages which are currently experienced in areas such as South East Queensland will become much more acute. Taking into consideration ongoing drought conditions, it is likely that there will be significant grain shortages in Eastern Australia in average and low yield years, thus resulting in higher costs for the feedlot industry as grain will need to be sourced and transported from other regions. This will adversely affect the entire Australian beef cattle industry.
The feed-grain based ethanol production by-products WDGS and DDGS are recognised as quality feedstuffs which are high in nutrient energy, protein and fibre. North American research suggests that these by-products can positively impact on the growth and weight gain of feedlot cattle at diet inclusion rates between five and 25%. However, these by-products are unable to fully compensate for the grain diverted from the intensive livestock industries, and the feedlot industry will remain dependant on alternative high nutrient energy sources.
The analysis provided in this study serves only as a guide to the probable impact of a grain based ethanol industry on the Eastern Australia feedlot industry. It is imperative that once ethanol production plants are established across Australia, a full assessment of the quality of the by-products will be required on a plant to plant basis, under Australian conditions.
In summary, the development of a feed-grain based ethanol production capacity in Eastern Australia will present significant challenges and opportunities for the cattle feedlot industry, as well as the other intensive livestock industries. It will adversely affect grain supplies and their sources of nutrient energy. A review of grain importation procedures to cover low crop yield years will be necessary. The by-products can be valuable feedstuffs but have associated disadvantages. Ultimately, it will be for individual feedlots to make an assessment of the overall potential benefit of distiller grain by-products on the basis of value and cost-effectiveness according to their individual circumstances.

70
8 Attachments
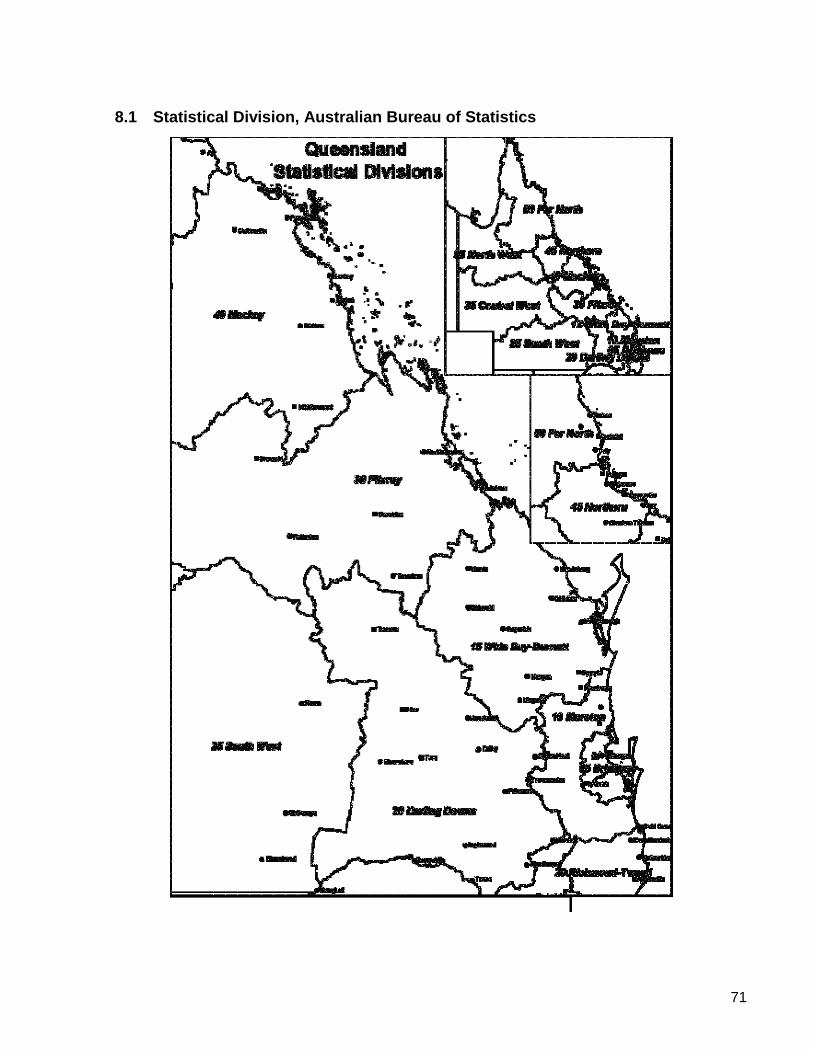
71
8.1 Statistical Division, Australian Bureau of Statistics
Administrative Details Report The Administrative details report is only o

72

73

74

75

76
9 Bibliography
[1] Alexander, F., and Kokic, P., [2005]. Productivity in the Australian Grains Industry. ABARE
eReport 05.3. Canberra. [2] ABARE, [2006a]. Australian Commodities. Vol 13 (1), 1 March Quarter. Commonwealth of
Australia. Canberra. [3] Meat and Livestock Australia Limited, [2003]. Review Options to Reduce Feedstuff Supply
Variability in Australia. Project FLOT.123. MLA. Sydney. [4] Hafi, A., and Connell, P., [2003]. Feed Grains, future supply and demand in Australia. ABARE
eReport 03.21. Canberra. [5] Hammer, G.L., Potgieter, A., and Strahan, R., [2003]. The reliability of supply of feed grains in the
northern region. Proceedings of the Fifth Australian Maize Conference, February 2003. Toowoomba.
[6] Australian Bureau of Statistics, http://www.abs.gov.au/ (last accessed 11/2006).
[7] ABARE, [2006b]. Australian crop report. http://www.abareconomics.com/interactive/cr_sept06/ (last accessed 11/2006).
[8] Meat and Livestock Australia Limited, [2002]. The Impact of Feedlot Investment. Project FLOT.404. MLA. Sydney.
[9] Barnard, P., [2006]. The future of Australia’s cattle industry: grass or grain? Paper presented at the ABARE Outlook Conference, March 2006. Canberra.
[10] Meat and Livestock Australia Limited, [25 August 2006]. Meat and Livestock Weekly. MLA. Sydney. [11] Urbanchuk, J.M., Baker, G., and Wells, W., [2005]. Economics of a Queensland Ethanol Industry.
Paper prepared for the Queensland Department of State Development and Innovation. May, 2005.
[12] CIE, [2005]. Impact of ethanol policies on feed-grain users in Australia. Report prepared for Meat
and Livestock Australia Limited on behalf of the Australian Beef Industry. Centre for International Economics. Canberra.
[13] Howard, J., [14 August 2006]. Statement to Parliament on energy initiatives, Parliament House,
Canberra, A.C.T. [14] Macfarlane, I., [20 August 2006]. Ethanol won’t be mandatory, says minister, Daily Telegraph
Newspaper. [15] Australian Petroleum Statistics, [2006]. Issue No. 109, June 2006. Commonwealth of Australia.
Canberra.

77
[16] Biofuels Taskforce, [2005]. Report of the Biofuels Taskforce to the Prime Minister.
Commonwealth of Australia. Canberra. [17] Aines, G., Klopfenstein, T.J., and Stock, R. A., [1986]. Distiller grains. Nebraska Agricultural
Research Division, MP 51. Nebraska. [18] Lodge,S.L., Stock, R.A., Klopfenstein, T.J., Shain, D.H., and Herold, D.W., [1997]. Evaluation of
corn and sorghum distiller by-products. Journal of Animal Science, Vol. 75: p44. [19] Mustafa, A.F., McKinnon, J.J., Ingledew, M.W., and Christensen, D.A., [2000]. The nutritive value
for ruminants of thin stillage and distiller grains derived from wheat, rye, triticale and barley. Journal of the Science of Food and Agriculture. Vol.80: p607.
[20] Coventry,C., [2006]. Feedstock availability in Australia. Paper presented on behalf of GrainCorp,
Sydney at the Ethanol Conference held in Brisbane, 2006. [21] National Research Council, [1996]. Nutrient requirements for beef cattle. National Academy
Press. Washington, D.C. [22] Preston, R.L., [2006]. 2006 Feed Composition Tables. http://beef-mag.com/mag/beef_feed
composition tables 2/index (last accessed 11/2006) [23] Rendell, S., [2004]. Fuel ethanol production in the Murray and Murrumbidgee river regions of
Australia. GRDC Research Updates. Griffith and Moama. www.grdc.com.au (last accessed 11/2006).
[24] Harty, S.R., Akayezu, J.M., Linn, J.G. and Cassady, J.M., [1998]. Nutrient composition of distiller
grains with added solubles. Journal of Dairy Science, Vol.81: p1201. [25] Stock, R. A., Lewis, J.M., Klopfenstein, T.J., and Milton, C.T., [1999]. Review of new information
on the use of wet and dry milling feed by-products in feedlot diets. Proceedings of the American Society of Animal Sciences, 1999. Available at: http://www.asas.org /jas/symposia/proceedings/0924.pdf. (Last accessed 11/2006).
[26] Shurson, J., and Noll, S., [2005]. Feed and alternative uses for DDGS. Department of Animal
Science, University of Minnesota. http://www.ddgs.umn.edu/articles-industry/2005 (last accessed 11/2006).
[27] Kansas Grain Sorghum Producers Association - http://www.ksgrains.com/sorghum (last
accessed 11/2006). [28] Akayrzu, J.M., Linn, J.G., Harty, S.R., and Cassady, J.S. [1998]. Use of distiller grains and co-
products in ruminant diets. Cargill Animal Nutrition Center, Elk River, Minnesota. [29] Nyachoti, C.M., House, J.D., Slominski, B.A., and Seddon, I.R., [2005]. Energy and nutrient
digestibilities in wheat dried distillers grains with soluble fed to growing pigs. Journal of the Science of Food and Agriculture. Vol. 85: p2581.
[30] Branum, J.M., and George, M., [2002]. Steam-flaking of grains for beef cattle rations. Today‟s
Feed Lotting, Australian Lot Feeders‟ Association, Sydney, 13(3): p21.

78
[31] Owens, F.N., Secrist, D.S., Hill, W.J., and Gill, D.R., [1997]. The effect of grain source and grain
processing on performance of feedlot cattle: A review. Journal of Animal Science. Vol. 75: p868. [32] Trenkle, A., [2005]. The nutritional value of co-products from dry mill ethanol plants. Paper to
Iowa Corn Promotion Board, 2005. Department of Animal Industry. Iowa State University. Iowa. [33] Erickson, G.E., Klopfenstein, T.J., Adams, D.C., Rasby, R.J., [2006]. Ulitilization of corn co-
products in the beef industry. Department of Animal Science. University of Nebraska-Lincoln. Lincoln.
[34] Stock, R. A., Lewis, J.M., Klopfenstein, T.J., and Milton, C.T., [1999]. Review of new information
on the use of wet and dry milling feed by-products in feedlot diets. Proceedings of the American Society of Animal Sciences, 1999. Available at: http://www.asas.org /jas/symposia/proceedings/0924.pdf. (Last accessed 11/2006).
[35] Klopfenstein, T.J., [2001]. Distiller grain for beef cattle. Paper presented at the National Corn
Growers Association Distiller Grain Workshop. Lincoln, Nebraska. [36] Trenkle, A., [2004]. Evaluation of Wet and Dry Distiller grains with Soluble for Finishing Holstein
Steers. Report to Iowa Corn Promotion Board, November 2003. Iowa State University Animal Industry Report. Iowa.
[37] Gordon,C.M., Drouillard, J.S., Gosch, J., Sindt, J.J., Montogomery, S.P., Pike, J.N., Kessen, T.J.,
Sulpizio, M.J., Spire, M.F., and Higgins, J.J., [2002a]. Dakota Gold – Brand dried distiller grains with soluble: Effects on finishing performance and carcass characteristics. Cattlemen‟s Day 2002. Kansas State University. Kansas.
[38] Daubert, R.W., Drouillard, J.S., Loe, E.R., Sindt, J.J., Depenbusch, B.E., Fox, J.T., Greenquist, M.A., and Corrigan, M.E., [2005]. Optimizing use of wet sorghum distillers grains with solubles in flaked-corn finishing diets. Beef Cattle Research, Department of Animal Science and Industry. Kansas State University. Kansas.
[39] Vander Pol, K.J., Erickson, J.G., Klopfenstein, T.J., and Greenquist, M., [2005]. Effect of level of
wet distiller grains on feedlot performance of finishing cattle and energy value relative to corn. Journal of Animal Science. Vol.83 [Supplement 2]: p25.
[40] Al-Suwaiegh, S., Fanning, K.C., Grant, R.J., Milton, C.T. and Klopfenstein T.J., [2002]. Utilization
of distiller grains from the fermentation of sorghum or corn in diets for finishing beef and lactating dairy cattle. Journal of Animal Science, Vol. 80: p1105.
[41] Roeber, D.L., Gill, R.K., and DiCostanzo, A., [2005]. Meat quality responses to feeding distiller
grains to finishing Holstein steers. Journal of Animal Science. Vol. 83: p2455-2460. [42] Gordon,C.M., Drouillard, J.S., Phebus, R.K., Hachmeister, K.A., Dikeman, M.E., Higgins, J.J.,
and Reicks, A.L., [2002b]. The effect of Dakota Gold – Brand dried distiller grains with soluble of varying levels on sensory and colour characterisitics of ribeye steaks. Cattlemen‟s Day 2002. Kansas State University. Kansas.

79
[43] Vander Pol, K.J., Erickson, G.E., Klopfenstein, T.J., and Mark, D.R., [2006a]. Economic optimum
use of wet distiller grains in feedlots. Nebraska Beef Report, 2006. University of Nebraska-Lincoln Extension, Nebraska.
[44] Kissinger, W. E., Erickson, G.E., Klopfenstein, T.J., and Koelsch, R.K., [2006a]. Managing
Phosphorus in Beef Cattle Operations. 2006 Nebraska Beef Report. University of Nebraska-Lincoln Extension. Nebraska. p94.
[45] Kissinger, W. E., Massey, R.E., Koelsch, R.K., and Erickson, G.E. [2006b]. Economics of Manure
Phosphorus Distribution from Beef Feeding Operations. 2006 Nebraska Beef Report. University of Nebraska-Lincoln Extension. Nebraska. p98.
[46] West,J.W., [1999]. Nutritional strategies for managing the heat-stressed dairy cow [Supplement
2], Journal of Animal Science. Vol. 77: p29. [47] Benson, C., Tjardes, K., and Wright, C., [2005]. Effects of feeding varying concentrations of dry
distiller grains with soluble to finishing steers on performance and odorant emissions. Journal of Animal Science, Vol.83 [Supplement 1].

80
APPENDIX 2
Nutritive value of distillers grains Peter Kennedy CSIRO Livestock Industries
FOR CONTACT: Peter Kennedy
CSIRO Livestock Industries Ph: 07 4923 8182
E-mail: [email protected]

81
Contents
1 BACKGROUND AND METHODOLOGICAL APPROACH 83
2 NUTRITIVE VALUE OF AUSTRALIAN GRAINS AND ESTIMATED NUTRITIVE VALUE OF DERIVED DISTILLERSGRAINS 90
3 DISCUSSION 92
3.1 Nutritive value 92
3.2 Growth trials 93
3.3 Quality and consistency 93
4 GENERAL CONCLUSIONS 94
5 BIBLIOGRAPHY 104

82
List of Tables Table 2.1. Chemical composition (dry matter basis) of distillers grains from the northern hemisphere 84 Table 2.2. Chemical compositions (dry matter basis) of Australian grains 88
Table2.3. Nutritive value of distillers grains and predicted liveweight gain of cattle with inclusions of distiller’s grains in the diets. 91

83
1 BACKGROUND AND METHODOLOGICAL APPROACH
General information is plentiful on the nutritive value of wet (WDG) and dry distillers grains with solubles (DDGS) derived from US corn in the Cornell Net Carbohydrate Protein System (CNCPS) listing (essentially the NRC data) but there is a paucity of data for the other grains of interest. The “Preston” 2006 Feed composition tables (http://www.beef-mag.com/mag/beef_feed_composition_tables_2/) shows data for barley distillers grains, sorghum and corn WDG, dry distillers grains (DDG) and DDGS, The RUMNUT UK database (http://www.rumnut.com/) lists proximate analysis for “Distillers grains” for barley, wheat and corn- these data appear to include solubles, as judged from the fat content relative to the corresponding grain, but the origin of the data is not defined. It is uncertain if the reported proximate composition of distillers grains can be related to that of the parent grain, even within the same database. Available data for the chemical composition of distillers grains in the northern hemisphere are tabulated in Table 2.1
In order to evaluate the nutritive value of Distillers grains derived from Australian grains, we have adopted a methodology that assumes that mass balances can be calculated for changes of proximate composition of the grain as a consequence of removal of fermentable carbohydrate during ethanol production (see [1]). In this context, proximate composition comprised ash, neutral detergent fibre (NDF), fat (reported as ether extract in the CNCPS and RUMNUT databases and other literature), starch, and other soluble non-structural carbohydrates including sugars. Where these proximate values did not sum to 100% in the databases, proportional correctional adjustments were made. To calculate the mass balances we assumed that 2% of the starch content and 10% of soluble non-starch carbohydrate of the source grain remained unfermented by yeast enzymes during ethanol production. These were arbitrary assumptions, but were defensible as discussed below. Any contribution to distillers grain protein from yeast, nor loss of fat from the high drying temperatures employed, could not be determined by this methodology.
It is noted that the adoption in the late 1990‟s of dry grinding and batch fermentation in the “new-generation” plants producing distillers grain products from corn in the USA, has resulted in increased extraction efficiency with a decline of starch content in corn DDGS from 10-15% to <5% [2.]. Accordingly data from reports post 1995 are more pertinent for the present exercise.
Calculation of the theoretical nutritive value of distillers grains from Australian barley, corn, sorghum and wheat therefore required the proximate composition of the source grain, reported completely for each sample. This requirement meant that the value of seemingly large databases (e.g. that of the Australian Livestock Feed Ingredient (ALFI), and from the DPI (NSW) “Nutritive value of feeds” (http://www.agric.nsw.gov.au/tools/fes/index.html) was limited, because the required analyses were rarely done on individual samples, and there often was a large difference in sample numbers contributing to means for individual analyses. Complete analyses for barley, sorghum and wheat grain were available from the “Premium Grains for Livestock Production” project, jointly funded by the GRDC and MLA, as contained in the ruminant feedlot software, “AUSBEEF”, while limited data for corn were derived from the Australian Food Information Centre (AFIC) listings. These were used to generate compositional data for grain and derived distillers grains, as described in Table 2.2.

84
Table 2.1. Chemical composition (dry matter basis) of distillers grains from the northern hemisphere
Refs
Starch (%)
Crude Protein
(%)
Fat (%)
Neutral detergent
fibre (%)
Ash (%)
Phosphorus (%)
Sulphur (%)
Acid detergent
fibre (%)
Metabolisable energy
(MJ)
Net energy for
maintenance (MJ/kg DM)
Net energy for gain
(MJ/kg DM)
Distillers products from barley
Dry distillers grain 1
[17] 30 4 45 4.0 0.7 0.4 22 7.6 4.9
" 2
29 56
" 3
6 4.2
" 4
2 27 7 42 5.7 0.9 12.2
Wet distillers grain 5
1 21 8 67 6.0
Distillers products from corn
Dry distillers grain 6
5 32 12 4.3 17
" 7
[11] 30 11 42 5.8 0.9 0.5 16 15.7
" 8
6 31 15 34 4.6 0.9 0.6 17 10.4 7.3
" 8
6 30 18 31 5.5 1.1 0.6 22 10.9 7.8
" 9
5 32 15 32 4.8 1.0 0.4 17 10.6 7.5
" 10
31 11 52* 6 0.8 0.7
“ 11
5 18 11 51 2
"
" 1
31 10 40 4 0.7 0.5 22 10.4 6.9
" 1
30 11 39 5 0.8 0.5 16 10.4 6.9
" 4
2 35 9 30 4 0.8 19 14.8
" 12
5 31 13 34 0.9 0.6 17
" 13
30 12 34 5 0.9
Wet distillers grain 11
5 30 14 52 1
“ 1
28 10 40 6 0.8 0.5 16 10.6 7.1 Wet distillers grain minus solubles
8 7 39 11 45 2.2 0.5 0.5 24 10.1 6.7

85
Refs
Starch (%)
Crude Protein
(%)
Fat (%)
Neutral detergent
fibre (%)
Ash (%)
Phosphorus (%)
Sulphur (%)
Acid detergent
fibre (%)
Metabolisable energy
(MJ)
Net energy for
maintenance (MJ/kg DM)
Net energy for gain
(MJ/kg DM)
Distillers products from sorghum
Dry distillers grain 1
[9] 31 10 47 3 0.7 0.4 19 8.6 5.7
" 1
[9] 32 10 44 3 0.6 0.5 13 8.6 5.7
“ 14
23 7 4 10.9
" 15
5 50 11 4 0.8
" 11
7 31 12 51 2
" 16
30 13 5 0.8 8.9 5.8
“ 17
29 9
" 17
29 9
“ 18
6.7 36 57
Wet distillers grain 1
[9] 32 10 44 3 0.6 0.5 13 8.9 5.9
“ 11
10 32. 11 45 3
Distillers products from wheat
Dry distillers grain 10
3 45 3 47* 6 1.1 0.5 12
" 10
4 31 4 57* 9 1.2 0.6 11
" 10
5 39 5 50* 6 0.8 0.4 11
“ 2
44 36 0.4 16.0
" 19
40 4 31 4.4 13.0
“ 4
5 30 6 35 5.0 0.9 12.5
“ 21
0.5 43 7 5.3
“ 10
39 8 5.5 1.0 17.1
Wet distillers grain 20
26 75 1.6 24.0
" 5
2 31 7 64 5.0 17.5
*total carbohydrates Values in brackets by difference, starch plus non-starch polysaccharides

86
References for Table 2.1. Chemical composition (dry matter basis) of distillers grains from the northern hemisphere
1 Preston, R.L. (2006). Feed Composition Table for Animal Required Nutrients, www.beef-mag.com (last accessed 10/2006).
2 Weiss, W.P., Erickson, D.O., Erickson, G.M., and Fisher, G.R. (1989). Barley distillers grains as a protein supplement for dairy cows. Journal of Dairy Science, 72: p980-987.
3 AFIC, Australian Feed Composition tables: ruminants/ Edited by H.T. Ostrowski-Meissner. Australian Feeds Information Centre – CSIRO, Sydney.
4 Rumnut Data. www.rumnut.com (last accessed 10/2006)
5 Mustafa, A.F., McKinnon, J.J., and Christensen D.A. (2000). The nutritive value of thin stillage and wet distillers grains for ruminants. Asian-Australian Journal of Animal Science, 13: p1609-1618.
6 Belyea, R.L., Rausch, K.D., and Tumbleson, M.E. (2004). Composition of corn and distillers dried grains with solubles from dry grind ethanol processing. Bioresource Technology, 94: p293-298.
7 Spiehs, M.J., Whitney, M.H., and Shurson, G.C. (2002). Nutrient database for distiller’s dried grains with solubles produced from new ethanol plants in Minnesota and South Dakota. Journal of Animal Science, 80: p2639-2645.
8 Sigafus, C. Chart – Badger State Ethanol – Dry Mill process, www.distillersgrains.com/drymillprocess.htm (last accessed 10/2006).
9 Adkins : Energy wet distillers grains. http://ilift.traill.uiuc.edu/distillers/nutrient_profiles/pdfs/Analysis_Database12.xls (last accessed 10/2006).
10 Distillers Grains By-Products in Livestock and Poultry feeds, University of Minnesota. www.ddgs.umn.edu (last accessed 10/2006).
11 Lodge, S.L., Stock, R.A., Klopfenstein, Shain, D.H. and Herold, D.W. (1997). Evaluation for corn and sorghum distillers by-products. Journal of Animal Science, 75: p37-43.
12 Krononoff, P.J., and Janicek, B., (2005). Understanding milling feed by-products for dairy cattle. Neb Guide, 2005, University of Nebraska.
13 Robinson, P.H. (2004). Nutritive value of distillers grains. Conventional vs. Dakota Gold. Department of Animal Science, University of California, Davis, CA. http://animalscience.ucdavis.edu/faculty/robinson/Articles/FullText/pdf/Web200404.pdf (last accessed 10/2006).
14 Senne, B.W., Hancock, J.D., Mavromichalis, I., Johnston, S.L., Sorrell, P.S., Kim, I.H., and Hines, R.H. (1996). Use of sorghum-based distillers grains in diets for nursery and finishing pigs. Swine Day 1996.

87
15 Corredor, D.Y., Bean, S.R., Schober, T., and Wang, D. (2006). Effect of decorticating sorghum on ethanol production and composition of DDGS. Cereal Chemistry, 83(1): p17-21.
16 www.ddgs.umn.edu (last accessed 10/2006).
17 Hancock, J. et al. (1995). Nutrient values of Milo DDGS for dairy cattle. Nutrient values of Milo DDGS for swine and poultry (as fed basis) – tables. Kansas State University, www.ddgs.umn.edu/othertypes/sorghum/2003-%20milo%20DDGS.pdf (last accessed 10/2006).
18 Kleinschmit, D., and Grant, R. Carbohydrate composition of commonly used feedstuffs in the Midwestern U.S. University of Nebraska, Co-operative Extension Dairy Report, 2001-2002, p20-21.
19 Nyachoti, C.M., House, J.D., Slominski, B.A., and Seddon, I.R. (2005). Energy and nutrient digestibilities in wheat dried distillers grains with solubles fed to growing pigs. Journal of the Science of Food and Agriculture, 85: p2581-2586.
20 Ojowi, M., McKinnon, J.J., Mustafa, A., and Christensen, D.A. (1997). Evaluation of wheat-based wet distillers grains for feedlot cattle. Canadian Journal of Animal Science, 77: p447-454.
21 Lee, W.J., Sosulski, F.W., and Sokhansanj, S. (1991). Yield and Composition of soluble and insoluble fractions from corn and wheat stillages. Cereal Chemistry, 68: p559-562.

88
Table 2.2. Chemical compositions (dry matter basis) of Australian grains
Fat %
Protein %
Ash %
Starch %
Fibre %
Soluble carbohydrate
Barley grain Av 3 10 3 60 10 14 5% 3 7 3 63 10 14 -5% 3 13 3 57 10 14 Distiller's grain Av 11 35 9 4 36 5 from barley 5% 12 28 10 5 40 6 -5% 10 42 8 4 33 5 Corn grain Av 4 10 2 70 12 4 5% 4 10 2 74 8 4 -5% 4 10 2 67 15 4 Distiller's grain Av 14 34 6 5 41 1 from corn 5% 16 38 6 6 32 1 -5% 12 30 5 4 47 1 Sorghum grain Av 3 8 1 75 10 3 5% 3 8 1 78 6 3 -5% 3 8 1 71 14 3 Distiller's grain Av 13 33 4 6 42 1 from sorghum 5% 15 40 5 8 31 2 -5% 11 29 4 5 50 1 Wheat grain Av 2 13 3 65 9 8 5% 2 11 2 67 8 8 -5% 2 15 3 62 10 8 Distiller's grain Av 7 45 9 5 31 3 from wheat 5% 7 41 9 5 33 3
-5% 7 49 8 4 30 3

89
The average proximate composition of Australian barley, corn, sorghum and wheat was taken from Rendell [3]. It was a negotiated position with the MLA Oversight Committee that the data provided by Rendell represented average starch of Australian grains. Variations in composition were accommodated by increasing and decreasing the Rendell values by 5% and adjusting the other chemical constituents accordingly (Peter, can you improve on accordingly)
The CNCPS software (v. 5.0, level 1) was used to evaluate the comparative nutritive value of the grain and calculated distillers grain, in a diet that provided, on a dry matter basis, 10% roughage ( 9% crude protein) and a 75% concentrate mixture. The ratio of grain:distillers grain or grain:cotton seed meal adopted for each simulation was that required to give a crude protein content of 15% (dry matter basis) for the entire diet, as is the effective limit tolerated by feedlot operators (Kevin Roberts, pers. comm.). The concentrate component comprised a grain with its daughter distiller‟s grain or cottonseed meal. No additional attempt was made to balance the ration in any other way. For example, the fat content of the ration was not considered, nor were the practical limitations to the inclusion of cotton seed meal. The aim of the simulations was to evaluate the maximal inclusion level of distiller‟s grain allowable with the constraint involved, and to illustrate its potential to replace a commonly used protein supplement.
For inputs, values for ash, NDF, fat, starch and (non-starch) soluble carbohydrate of the grain were the average values [3] or as calculated with variation from the mean grain starch of ± 5% which should encompass the range of grain qualities likely under Australian conditions. The lignin content of the fibre fraction (NDF) of the grain, which determined the digestibility of NDF, used for input into the CNCPS software was the mean value of the relevant grain in the AUSBEEF database (barley,0.056, corn 0.069, sorghum 0.14, wheat 0.081). Lignin/NDF values for distillers grain, for barley and wheat (0.076, 0.24) were taken from the RUMNUT database, for corn the CNCPS value (0.23) was adopted, and for sorghum a value of 0.22 was assumed. Where lignification of distillers grain was markedly higher than the source grain, as was the case for wheat and sorghum, the effect of the increase was to reduce the ME content of distillers grain by approx. 7%.
On the basis of results obtained from the simulations, it would have been possible to refine the diet formulations to minimize urea excretion, but this was not done because acceptably precise results would require better definition of digestion and availability of dietary protein than was available. The aim of the simulations was to evaluate the maximal inclusion level of distillers grain allowable with the constraint involved, and to illustrate its potential to replace a commonly used protein supplement.
90
2 NUTRITIVE VALUE OF AUSTRALIAN GRAINS AND ESTIMATED NUTRITIVE VALUE OF DERIVED DISTILLERSGRAINS
Values for the 3 grain qualities, with respect to starch, within each of the four grains are given in Table 2.3, together with the method of calculation. The standard error of the mean starch content for the 4 grains in the Ausbeef (Australian Feed Information Centre) database was 4.5-4.4%, thus the variation induced by simulating a 5% difference from the mean starch content could be a conservative estimate of the possible variation of grain quality used as feed for the ethanol plant.
The inclusion of distillers grain level allowed by the dietary limit of 15% crude protein, was 23% for average barley, 26% for average corn, 29% for average sorghum, and 11% for average wheat (Table 2.3). If the variation of crude protein content (calculated by inducing the ± 5% in starch content) adequately represents variation encountered in Australian grains used for ethanol production, a maximum of 20% of distillers grain from barley, corn and sorghum can be included. In contrast, as little as 5% distillers grain from wheat varieties was allowable with wheat of high protein content.
As judged by the net energy (NE) content for either maintenance or gain (NEm, NEg) for “average” barley, corn, sorghum and wheat, the energy value of all grains and derived distillers grain was similar, with the exception of sorghum distillers grain, which was about 10% lower (Table 2.3). Variation in grain quality resulted in relatively low variability in NEm and NEg (range of 0.5 MJ/kg) within grains, and in distillers grain from barley and wheat, but distillers grain varied markedly within corn and sorghum by about 1.6-2.1 MJ/kg. The reason for this appeared to relate to the variations in fat content of distillers grain of corn and sorghum, and the poor availability of NDF of sorghum. The effect of flaking for Australian average sorghum was examined by application of the level 2 CNCPS software and the appropriate defaults for flaked sorghum in the CNCPS database. Values for NEm and NEg were increased by 0.2 units compared to level 1 estimates presented in Table 2.3.
The value of distillers grain relative to cottonseed meal in rations formulated to be 15% CP, was comparable for barley, wheat and sorghum, and slightly superior for corn. The best single (negative) predictor of the nutritive value of distillers grain was NDF content of the parent grain (data not shown).
For barley, corn and wheat based diets, the predicted daily liveweight gain did not vary by 0.1, or at the most 0.2, kg/d irrespective of whether cottonseed meal or distillers grains were included in the diet (1.9 – 2.1 kg/d). For sorghum, predicted liveweight gain varied from 1.7 kg/d for low starch sorghum and sorghum distillers grain to 2.1 kg/d for high starch sorghum and distillers grain.

91
Table2.3. Nutritive value of distillers grains and predicted liveweight gain of cattle with inclusions of distiller’s grains in the diets.
Grain (% of diet DM )
Distillers
grain (% diet
DM)
Cottonseed meal
(% of diet DM)
Net energy for
maintenance
(MJ/kg) Grain/Distill
ers grain
Net energy for gain (MJ/kg)
Grain
Liveweight gain (kg/d)
Metabolisable
Energy of diety
(MJ/kg)
Fat (% of diet DM)
Barley
Average 52 23 - 8.9/8.7 6.1/5.9 2.1 11.7 4.3
+5% 36 40 - 8.9/8.4 6.0/5.7 2.0 11.6 6.1
-5% 62 13 - 8.8/8.8 6.0/6.0 2.1 11.7 3.4
Average 57 - 18 2.0 11.4 2.9
+5% 52 - 23 1.9 11.3 3.0
-5% 63 - 12 2.1 11.5 2.8
Corn
Average 49 26 - 9.1/8.8 6.2/6.0 2.1 11.9 5.8
+5% 53 22 - 9.2/9.9 6.4/6.9 2.0 11.6 5.8
-5% 45 30 - 8.9/8.0 6.1/5.3 1.9 11.5 5.8
Average 56 - 19 2.0 11.5 3.5
+5% 56 - 19 2.0 11.6 3.5
-5% 56 - 19 1.9 11.4 3.5
Sorghum Average 46 29 - 8.8/7.9 6.0/5.2 1.9 11.4 5.5
+5% 52 23 - 8.9/9.1 6.1/6.2 2.1 11.9 5.5
-5% 40 35 - 8.6/7.0 5.9/4.4 1.7 10.9 5.5
Average 53 - 22 1.9 11.3 3.1
+5% 53 - 22 1.9 11.4 3.1
-5% 53 - 22 1.8 11.2 3.1
Wheat
Average 64 11 - 8.7/8.8 5.9/6.0 2.0 11.6 2.4
+5% 58 17 - 8.2/8.7 5.5/5.9 2.0 11.5 2.7
-5% 70 5 8.7/8.6 5.9/5.8 2.0 11.5 2.2
Average 63 - 12 1.9 11.4 2.2
+5% 58 17 1.9 11.3 2.3
-5% 68 7 2.0 11.5 2.1

92
3 DISCUSSION
3.1 Nutritive value
Literature from the USA suggests that the nutrient composition of corn distillers grain, as with many byproduct feeds, is influenced by multiple variables including type of grain used, grain quality, grinding procedures, extent of fermentation, drying conditions, quantity of solubles blended back with the cake and particle separation. An approximately three-fold concentration of protein, fat and fiber is found in distiller‟s grain compared to corn grain. The resulting product is deemed to be very palatable and its high digestible energy content is associated with high fat content and digestible fibre. Replacement of corn grain with distillers by - product apparently consistently improves feed conversion efficiency [4] by the increased supply of nutrients such as fat and protein, but also through importantly reduction the incidence of subclinical acidosis [5].
In the USA, corn distillers grain appears to be more valued for the dairy industry than for beef cattle, where the high protein content can lead to wastage of nitrogen. Accordingly heat damage of protein and consequent reduction in digestibility during the production of ethanol is a concern with dairy animals, but not for feedlot animals. Shingoethe [6] stated that some decreases in dry matter intake can occur when fed high amounts of distillers grain, especially when fed as wet distillers grain.
The present simulation results are somewhat dependent on the value of lignin/NDF attributed to the distillers grain. The increased lignification (presumably by formation of „artifact‟ lignin) of distillers grain evident in the databases (RUMNUT and CNCPS) for wheat and corn presumably is a result of heat treatment during the ethanol production process. Heating is stated to result in the decreased nutritive value of DDGS versus wet distillers grain, but we have not attempted to simulate this specifically to evaluate the effect of drying because information seems to be limited to corn for which the mean lignin/NDF in both wet distillers grain and DDGS was similar (20.1 %, Badger State Ethanol data, University of Illinois website at: http://ilift.traill.uiuc.edu/distillers/) However, other authors (Erickson et al. 2006 [4] have reported that NEg of corn wet distillers grain of 8.03 MJ/kg was about 12% higher than that the value (7.20) for DDGS. We therefore suggest a further discount to ME content of about 5% be made for calculation when considering DDGS.
The predicted starch content for Australian distillers grain was from 4 - 8% in the present simulations. For fat in distillers grains, predicted values were about 7% for wheat and 10– 15 % for corn, barley and sorghum (see Table 2.2). Approximate literature values for starch and fat content of distillers grain for barley are 2 and 7%; for corn, 5% and 11%; and for sorghum, 5-10% and 13%; and for wheat, 3% and 5% (see Table 2.1). The predicted fat content for Australian distillers grains were therefore in the higher end of the published range for DDGS, possibly because no accounting was made for loss of volatiles from fat during the drying process. Because fat is the most energy-dense constituent of distillers grain and therefore the single most important determinant of nutritive value, its high content in corn distillers grain provides the explanation of the high ME content. It was more difficult to substantiate the assumption that 90% of soluble polysaccharides were metabolized by yeast during ethanol production, although this assumption lead to a predicted content of 1-5% of soluble non-starch polysaccharides in Australian distillers grains, comparable to reported values for sugars of 2-9% for barley, corn and wheat in the RUMNUT database, and for 4% for corn DDGS in the Badger State Ethanol data.

93
3.2 Growth trials
A direct comparison of wet distillers grains from sorghum and corn was reported by Al-Suwaiegh et al [7]. Both distillers products, when they replaced 30% of the dry matter of corn, resulted in 10% greater liveweight gain and 8% greater feed conversion efficiency than the corn-based control. The improved nutritive value (estimated as net energy for gain) of wet distillers grains was calculated to be 33% (corn) and 25% (sorghum) than that supplied by corn by itself; the increased lipid content accounted for about 45% of the increase. Lodge et al [8] fed (80:20) wet sorghum:corn distillers residues, and reported that efficiency of gain for finishing steers for was about the same as for corn grain, and about 20% higher than sorghum DDGS.
3.3 Quality and consistency
It is thought that some of the lack of consistency in product is introduced at the stage of blending of stillage during the production of distillers grains[9]. This would apply especially to fat content, as the stillage and distillers grain each contain about 50% each of the fat of the original grain[10]. Recent surveys both within and between ethanol plants showed large variations for all nutrients measured, although within plants, fat content and ash were more variable than crude protein and NDF[11]..
The variability of nutritive value of DGGS has been largely attributed by Knott et al (1997)12 and Belyea et al. (2004)13 to the amount of solubles added to the spent grains. The recovery of dry matter in fermentation residues has been summarized by Mustafa[10] as being 29, 35, 32 and 41% from corn, wheat, barley and sorghum respectively. This report also highlights the differences in chemical composition between thin stillage and distillers grains fraction of the fermentation products. For example, in wheat residues, the thin stillage fraction contains 37% of the residual protein but only 13% of NDF.
The data set from the Badger State Ethanol Plant on the U of Illinois website (http://ilift.traill.uiuc.edu/distillers/nutrient_profiles/midwestplant.cfm) shows that the variability measured for 56 samples taken over a 2-year period was comparatively minor. For crude protein, the coefficient of variation was 6.6% for fat, 10.1%, NDF 12.3%, and for calculated net energies of lactation, gain and maintenance, were 7.6-9.2%.

94
4 GENERAL CONCLUSIONS
Given the uncertainties in the calculations made in this section, the broad conclusion that can be made is that the value of the distillers grain to supply net energy is comparable to the parent grain, with the possible exception of sorghum, for which the common practice of grain flaking, and the relatively poor digestibility of the fibre in distillers grain, is likely to lead to poorer nutritive value in the distillers grain. If a dry distillers grain product is to be considered, then the net energy content in the distillers grain product would probably be discounted by at least 5%.

104
5 BIBLIOGRAPHY
[1] Soluski. K., and Soluski, F., Wheat as a feedstock for fuel ethanol. Applied Biochemistry and Biotechnology, 1994, 45/46: p169-180.
[2] Kalscheur, K.F. Feeding distillers grains to dairy cattle: Impact on milk fat, protein and yield. Distillers Grains Quarterly, Second quarter 2006, p24-27.
[3] Rendell, S. Fuel ethanol production in the Murray and Murrumbidgee river regions of Australia. GRDC – Research Updates, July 2004. http://www.grdc.com.au/growers/res_upd/irrigation/i04/rendell.htm (last accessed 10/2006).
[4] Erickson, G.E., Klopfenstein, T.J., Adams, D.C., and Rasby, R.J. Feeding of corn milling co-products to beef cattle. Utilization of corn milling co-products in the Beef Industry. http://www.nebraskacorn.org/publications/index.htm (last accessed 10/2006).
[5] Krehbiel, C.R., Stock, R.A., Herold, D.W., Shain, D.H., Ham, G.A. and Carulla, J.E. Feeding west corn gluten feed to reduce subacute acidosis in cattle. Journal of Animal Science, 1995, 73: p2931-2939.
[6] Shingoethe, D.J. Can we feed more distillers grains? Tri-State Dairy Nutrition Conference, April 2006, P71-78. http://tristatedairy.osu.edu/Schingoethe.pdf#search=%22Kalscheur%2C%202006).%20%22 (last accessed 10/2006).
[7] Al-Suwaiegh, S., Fanning, F.C., Grant, R.J., Milton, C.T. and Klopfenstein, T.J. Utilization of distillers grains from the fermentation of sorghum or corn in diets for finishing beef and lactating dairy cattle. Journal of Animal Science, 2002, 80: p1105-1111.
[8] Lodge, S.L., Stock, R.A.. Klopfenstein, T.J., Shain, D.H. and Herold, D.W. Evaluation of Corn and Sorghum Distillers Byproducts. Journal of Animal Science, 1997, 75: p37-43.
[9] Knott, J. and Shurson, G. Assessment of growth performance and nutrient balance of early-weaned pigs fed diets containing spray dried corn distillers solubles by-products, carbadox, and porcine plasma. Journal of Animal Science, 2005, 83 (Suppl. 2): p74. (2005 ASAS/ADSA Midwest Meeting Abstract).
[10] Mustafa, A.F., McKinnon, J.J., and Christensen D.A. The nutritive value of thin sillage and wet distillers grains for ruminants. (2000) Asian-Australian Journal of Animal Science, 2000, 13: p1609-1618.
[11] Akayezu, J.M., Linn, J.G., Harty, R. and Cassady, J.M. Use of distillers grains and co-products in ruminant diets, 1998. http://www.ddgs.umn.edu/articles-dairy/1998-Akayezu-%20MNC.pdf (last accessed 10/2006).
[12] Knott, J., Shurson, J., and Goihl, J. Effects of the nutrient variability of distillers solubles and grains within ethanol plants and the amount of distillers solubles blended with distillers grains on fat, protein, phosphorus content of DDGS. University of Minnesota, 2004. (http://www.ddgs.umn.edu (last accessed 10/2006).
[13] Belyea, R.L., Rausch, K.D. and Tumbleson, M.E., Composition of corn and distillers dried grains with solubles from dry grind ethanol processing. Bioresource Technology, 2004, 94: p293-298.

105
APPENDIX 3
Ethanol production from grain Life cycle and techno-economic assessment Aaron Cottrell Geoff Rigby Peter Scaife Phil Brown Louis Wibberley
FOR CONTACT: Louis Wibberley
CSIRO Energy Technology Energy and Technology Modelling Group
Ph: 02 4960 6050 E-mail: [email protected]

106
TABLE OF CONTENTS
Table of contents 106
List of tables 109
List of figures 111
Glossary 113
Acknowledgements 116
1. Executive Summary 117
2. Background and global ethanol scene 121
2.1. United States 122
2.2. Brazil 123
2.3. Canada 125
2.4. China 125
2.5. India 125
2.6. European Union 126
2.7. Thailand 127
2.8. Russia 127
2.9. Japan 127
2.10. Australia 128
3. Ethanol Production Technology 131
3.1. Overall process 131
3.2. Process steps 132
3.2.1 Grain grinding and slurry preparation 132
3.2.2 Gelatinisation 132
3.2.3 Saccharification 133
3.2.4 Fermentation 133
3.2.5 Distillation 133
3.2.6 Dehydration 133
3.2.7 CO2 recovery 133
3.2.8 Solids separation 134

107
3.2.9 Drying 134
3.3. Plant Capacities 135
3.4. Plant capital cost 135
4. Grain and process parameters 137
4.1. Grain requirements 137
4.2. Ethanol yield 137
4.3. Distillers grain yield 138
4.4. CO2 generation 138
4.5. Water consumption 138
4.6. Energy consumption 139
5. New developments and potential technological improvements 140
5.1. Liquefaction, saccharification and fermentation 140
5.2. Modifications to the front end of the dry milling process 141
5.2.1 Dry fractionation 142
5.2.2 Modified dry grind processes. 142
5.2.3 Modifications to the back end of the dry grinding process 143
5.3. Other process technology advances 143
5.3.1 Anaerobic digestion of ethanol fermentation residues 143
5.3.2 Optimisation of water in wet distillers grain 144
5.3.3 Biomass gasification and alternative energy supplies 144
5.3.4 Biobutanol 144
5.4. Lignocellulosic route to bioethanol 145
6. Technology Suppliers 150
6.1. ICM Inc. 150
6.2. Delta-T Corporation 150
6.3. Broin Companies 150
6.4. Katzen International Inc. 151
6.5. Vogelbusch GmbH 151
6.6. Praj Industries 151

108
6.7. Bioscan A/S 151
7. Life Cycle Analyses 153
7.1. Grain Production 154
7.2. Ethanol production 160
7.3. LCA results 165
7.3.1 Grain production 166
7.3.2 Ethanol Production 166
7.3.3 Summary of Cases 177
7.4. Comparison of ethanol and petrol – GGE basis 178
7.5. Comparison with other studies 181
8. Techno-economic evaluation 186
8.1. Results 189
8.1.1 Base cases 189
8.1.2 Trade-off between drying and transport 192
8.1.3 Alternative stillage processing options 195
9. Conclusions 205
9.1. LCA 205
9.2. Techno-economics 207
10. References 209

109
LIST OF TABLES
Table 1 Current operating ethanol plants in Australia 128
Table 2 Proposed ethanol plants for Australia 130
Table 3 Typical grain feedstock analyses 137
Table 4 Ethanol production for various grain feedstocks 138
Table 5 Analyses for a selection of potential lignocellulosic feedstocks 146
Table 6 Fertiliser, herbicide and diesel use per tonne of grain[,93]
156
Table 7 Transport breakdown for farm consumables 158
Table 8 Transport resource energy and GGEs 158
Table 9 Storage energy requirement (kWh/t of grain) 159
Table 10 Consumables for the production of 1 tonne of fertilisers, herbicides and
pesticides 159
Table 11 Resource energy, GGEs and water per tonne of fertilisers, herbicides and
pesticides 160
Table 12 Resource energy used per GJ of delivered energy 160
Table 13 Case studies considered for the ethanol LCA 161
Table 14 Impacts for 1 MWh of electricity from the transmission grid 163
Table 15 Yield of distillers grain 164
Table 16 Anaerobic Digestion - intermediates and by-products 164
Table 17 Data for combustion of WDG 164
Table 18 Factors used for system displacement credits 165
Table 19 LCA for grain (1 tonne stored basis) 166
Table 20 Resource energy for wheat based cases (GJ/kL ethanol) 167
Table 21 Resource energy for sorghum based cases (GJ/kL ethanol) 168
Table 22 Greenhouse gas emissions for wheat based cases (t CO2-e/kL ethanol) 170
Table 23 Greenhouse gas emissions for sorghum based cases (t CO2-e/kL ethanol) 171
Table 24 Process water consumption for wheat based cases (m3/kL of ethanol) 175
Table 25 Process water consumption for sorghum based cases (m3/kL of ethanol) 176
Table 26 Collation of LCA results (per kL of ethanol) 178
Table 27 Life cycle GGE for the production and use of ethanol compared to petrol 179
Table 28 LCA for wheat production in Western Australia 181
Table 29 Energy and GGEs for ethanol production - UK study 182

110
Table 30 Matrix of key cost variables 187
Table 31 Basis and assumptions for the techno-economics 188
Table 32 Base case studies for techno-economics 189
Table 33 Cost of ethanol production for the base cases (no value on GGE) 190
Table 34 Basis for estimates (based on nominal 160 ML/y ethanol plant 193
Table 35 Alternative case studies for techno-economics 195
Table 36 Cost of ethanol production for alternative stillage processing (nil value for
GGE) 196
Table 37 Cost of ethanol production for alternative stillage processing ($10/t GGE) 197
Table 38 Cost of ethanol production for alternative stillage processing ($30/t GGE) 198
Table 39 Power generation for the base cases (160 MLpa plant) 204
Table 40 Power generation for the alternative stillage processing options (160 MLpa
plant) 204

111
LIST OF FIGURES
Figure 1 World production of ethanol (all grades) 121
Figure 2 Badger State Ethanol Plant at Monroe, Wisconsin, USA (190 ML/y) [] 131
Figure 3 Basic dry milling ethanol process 132
Figure 4 DDGS in storage at a US ethanol plant (Mid-Missouri Energy, Malta
Bend)[34]
134
Figure 5 Breakdown of capital cost for ethanol plant with anaerobic digestion 136
Figure 6 System boundary for LCA of grain production 156
Figure 7 System boundary for LCA of ethanol production 162
Figure 8 Overall resource energy consumption per kL of ethanol 168
Figure 9 GGEs per kL of ethanol 172
Figure 10 Breakdown of GGE for current practices (wheat) 173
Figure 11 Breakdown of GGE for current practices (sorghum) 173
Figure 12 Breakdown of GGE for alternative drying and electricity technologies
(wheat) 174
Figure 13 Breakdown of GGE for alternative drying and electricity technologies
(sorghum) 174
Figure 14 Process water consumption for all cases 177
Figure 15 Life cycle GGE for the production and use of ethanol for all cases,
compared to petrol (2006 basis). 180
Figure 16 Life cycle GGE for the production and use of ethanol for all cases,
compared to petrol, for both current and 2050 scenarios. 180
Figure 17 Net energy value for ethanol production from corn, with current wheat
and sorghum cases 183
Figure 18 Net GGEs versus net energy for ethanol production from corn, with
current wheat cases) 184
Figure 19 Ethanol production cost for electricity at 4c/kWh and gas at $4/GJ 191
Figure 20 Ethanol production cost for electricity at 5.5c/kWh and gas at $5.5/GJ 191
Figure 21 Ethanol production cost for electricity at 7c/kWh and gas at $7/GJ 191
Figure 22 Comparison of delivered costs for DDGS and an equivalent amount of
WDG, assuming a transport cost of $0.20/t.km and a grain price of $250/t. 194
Figure 23 Comparison of GGE for drying/transportation for DDGS to an equivalent
amount of WDG 194
Figure 24 Ethanol production cost for electricity at 4c/kWh 199

112
Figure 25 Ethanol production cost for electricity at 5.5c/kWh 199
Figure 26 Ethanol production cost for electricity at 7c/kWh 199
Figure 27 Ethanol production cost for electricity at 4c/kWh and CO2 valued at $10/t 200
Figure 28 Ethanol production cost for electricity at 5.5c/kWh and CO2 valued at
$10/t 200
Figure 29 Ethanol production cost for electricity at 7c/kWh and CO2 valued at $10/t 200
Figure 30 Ethanol production cost for electricity at 4c/kWh and CO2 valued at $30/t 201
Figure 31 Ethanol production cost for electricity at 5.5c/kWh and CO2 valued at
$30/t 201
Figure 32 Ethanol production cost for electricity at 7c/kWh and CO2 valued at $30/t 201
Figure 33 Breakdown of ethanol production cost for electricity at grain at $200/t,
4c/kWh and CO2 valued at $0/t 202
Figure 34 Breakdown of ethanol production cost for electricity at grain at $250/t,
5.5c/kWh and CO2 valued at $10/t 203
Figure 35 Breakdown of ethanol production cost for electricity at grain at $300/t,
7c/kWh and CO2 valued at $30/t 203

113
GLOSSARY
AD Anaerobic digestion
AD-GTCC Anaerobic digestion – gas turbine combined cycle
ar As-received basis
Beer Liquid produced by the fermentation of starchy material
derived from grains or other plant sources.
CO2 Carbon dioxide
CO2-e Carbon dioxide equivalent
CRAC China Resources Alcohol Corporation
db Dry basis
Dehydration Process of removing remaining water from ethanol/water
mixture after distillation
DDG Distillers Dried Grains-obtained after the removal of ethyl
alcohol by distillation from the yeast fermentation of a grain
or grain mixture by separating the resultant coarse grain
fraction of the whole stillage and drying it by methods
employed in the grain distilling industry. The predominating
grain is declared as the first word in the name.
DDGS Distillers Dried Grains with Solubles-product obtained after
the removal of ethyl alcohol by distillation from the
fermentation of grain or grain mixture by condensing and
drying at least ¾ of the solids of the resultant whole stillage
by methods employed in the grain distilling industry. The
predominating grain is declared as the first word in the name.
DDGS is sometimes referred to as Meal
DWG (WDG) Distillers Wet Grains-product obtained after the removal of
ethyl alcohol by distillation from the yeast fermentation of a
grain mixture.
DOE Department of Energy (USA)
E10 Ethanol/petrol blend containing 10% by volume ethanol
E25 Ethanol/petrol blend containing 25% by volume ethanol
E85 Ethanol/petrol blend containing 85% by volume ethanol
EC European Commission
EBITA Earnings Before Interest, Tax and Amortisation
ETBE Ethyl tertiary butyl ether- oxygenated fuel blended with
gasoline to make it burn more cleanly
Fermentation Process of converting sugars into ethanol with yeast
FBR Fluidised bed reactor
FFV Flexible Fuel Vehicle

114
Gelatinisation Process of hydrolysing and swelling of grain in hot water to
obtain starch in solution
GGE Greenhouse gas emissions
GHG Greenhouse gases (carbon dioxide, methane and nitrous
oxide)
GRDC Grain Research and Development Corporation
ha Hectare of land; 10,000 m2
HHV Higher heating value (or gross specific energy) basis which
includes the heat of condensation of water vapour at 25C.
IDGCC Integrated drying gasification combined cycle (gas turbine) –
emerging electricity generation process for Victorian brown
coal (42% thermal efficiency, with 60-65% moisture coal)
KPI Key performance indicator
kWh Kilowatt hour (3.6 MJ)
L Litre (a capital letter has been used for clarity)
LCA Life cycle analysis
MTBE Methyl-t-butyl ether-octane enhancing additive
Multiple effect evaporation A multiple step process in which heat from the evaporated
liquid in one stage is used to evaporate liquid in the next
stage (by reducing system pressure), thereby reducing the
overall energy consumption.
MWh Megawatt hour
N2O Nitrous oxide; greenhouse gas equivalent to 310 that of CO2
(on a mass basis)
NGCC Natural gas combined cycle electricity plant.
NREL National Renewable Energy Laboratory (US DOE)
OECD Organisation for Economic Co-operation and Development
PAJ Petroleum Association of Japan
QG Quick Germ process
QGQF Quick Germ Quick Fibre process
RFS Renewable Fuels Standard
R&D Research and development
R&M Repairs and maintenance
RO Reverse osmosis
Saccharification Process of converting starch into dextrin sugars for
fermentation
SMHEA Snowy Mountains Hydro Electric Authority

115
Stillage Residue of non-fermentable (or non-fermented) solids and
water after removal of ethanol from fermented beer by
distillation; thin stillage is produced after removal of solids
SSF Simultaneous Saccharification and Fermentation
SSYPF Simultaneous Saccharification Yeast Propagation and
Fermentation
Stover Dried stalks and leaves of a cereal crop, used as fodder after
the grain has been harvested.
Syrup Concentrated product from stillage after evaporation of
water, sometimes called Condensed Distillers Solubles (CDS)
VEETC Volumetric Ethanol Excise Tax Cedit
VHG Very High Gravity
WDG Wet Distillers Grains-product obtained after the removal of
ethyl alcohol by distillation from the yeast fermentation of a
grain mixture
WUE Water use efficiency; expressed as kg grain/mm H2O/ha
Currency conversion used in this report for comparisons
1A$ = US$0.70
1A$ = Euro 0.60
1A$ = 0.39 GBP

116
ACKNOWLEDGEMENTS
In addition to data from a variety of published resources, as listed in the Reference Section,
the assistance of the following is acknowledged with thanks and appreciation; Matthew
Kelly, Primary Energy Pty Ltd at Gunnedah; Loretta Serafin, Tamworth Agricultural
Institute; NSW Department of Primary Industries, Tamworth; Ian Patterson and
Dominique Kühner, Barr-Rosin Ltd, Maidenhead, Berkshire UK; Peder Fosbøl, Atlas-
Stord from Denmark, and CSIRO staff in the Divisions of Sustainable Ecosystems, and
Marine and Atmospheric Research.

117
1. EXECUTIVE SUMMARY
This study is a component of a project for the Meat and Livestock Association, undertaken
by CSIRO Livestock Industries, and Energy Technology.
The role of CSIRO Energy Technology (CET) was “to provide a technical assessment of
the energetic costs and benefits of ethanol production from grain, under Australian crop
and ethanol production conditions”, and to assist CSIRO Livestock Industries to
“determine a realistic feed value of both the wet and dried Wet Distillers Grain products
under Australian conditions and establish a protocol, which accounts for the inherent
variability in the product due to differences in the base product, ethanol extraction
efficiency and water content, by which this value can be calculated”. In assisting with the
latter objective, CET was tasked with determining a realistic economic and environmental
value of wet distillers grain, by examining the costs and greenhouse gas emissions of
drying and transport.
These objectives for CET were addressed by carrying out a life cycle and techno-economic
analysis for ethanol production from wheat and sorghum, using a number of options for
processing the stillage. The analysis was based on a hypothetical plant located at
Gunnedah, with a capacity of 160 ML of ethanol per annum.
Whilst a mature technology, ethanol production is continuing to evolve, with
improvements throughout the entire process. Anaerobic digestion of stillage is becoming of
increasing interest in the USA as a result of over supplies of distillers grain, as well as for
offsetting increasing gas and electricity prices.
The analysis considered the life cycle issues of resource energy, greenhouse gas emissions
(GGEs), and water consumption, as well as techno-economics.
Resource energy quantifies energy depletion, and relates only to fossil energy inputs; solar
energy used for growing the grain is excluded, since it does not represent a depletion of
energy resources.
Greenhouse gas emissions are emissions of CO2 and CH4 that are generated in the
production and combustion of fossil fuels, as well as nitrous oxide produced from the use
of nitrogenous fertilisers. Carbon sequestered from the atmosphere by grain, provides a
GGE credit.
Water consumption relates to the amount of fresh water used in the production of
fertilisers, fuels, etc (in the form of process water), and is used to quantify the depletion of
fresh water resources. Water from rainfall used in grain production is not included
The study considered 3 systems for the Life Cycle Analyses (LCAs):
1) grain production (wheat and sorghum),
2) grain through to ethanol with 7 stillage processing options, and
3) grain through to 1 GJ of delivered heat energy (ie as combusted ethanol).
For ethanol production, the base process routes were fermentation with the production of
dry distillers grain, and fermentation with anaerobic digestion and electricity production.
This resulted in 7 case studies, for alternative stillage processing:
Case 1 Wet Distillers Grain (WDG) direct to feedlot.
Case 2 Dry Distillers Grain with Solubles (DDGS) with conventional drying.
Case 3 DDGS with high efficiency drying.

118
Case 4 Anaerobic digestion, with gas engine electricity generation (33% efficiency;
HHV basis).
Case 5 Anaerobic digestion, with combined cycle electricity generation from
biogas (50% efficiency).
Case 6 WDG for electricity generation by fluidised bed combustion (20%
efficiency).
Case 7 WDG for electricity generation using integrated drying and gasification
combined cycle (IDGCC; 40% efficiency).
LCAs
For grain production, the major resource energy component is for the production of
fertiliser (70% of the total). GGEs are dominated by the CO2 taken up by the grain during
photosynthesis, while fresh water is dominated by the water used to grow the grain (500-
1000 m3/t grain). It should be noted that the CO2 sequestered in the grain will ultimately be
returned to the atmosphere, partly during production of ethanol, and also when the ethanol
is combusted. However, the LCA methodology (with the boundary conditions of either
grain production, or ethanol production) requires that the CO2 sequestered in the grain be
included. Values without such sequestration have been included for comparison with other
non-compliant LCA studies.
When the grain is processed to ethanol, all indicators are dependent on the processing of
the stillage, and by-product credits. Process water consumption is again several orders of
magnitude less than that used for growing the grain.
There are 3 key findings for resource energy for ethanol production:
With direct sale of WDG, the resource energy is considerably lower than that for
DDGS, due to the large amount of energy required for drying (can be substantially
reduced using a higher efficiency process).
When the stillage is anaerobically digested, the resource energy also becomes
negative, since there is no requirement for purchased electricity or natural gas for
ethanol production.
There are also significant credits for by-product fertilisers and exported electricity.
If the WDG is combusted to produce electricity (requires a technology similar to
high moisture lignite or biomass), a negative overall resource energy is produced.
The main findings for GGE for ethanol production are as follows:
All cases have a negative GGE, due to sequestration of CO2 as grain.
Direct use of WDG by feedlots gives a lower GGE than for DDGS, due to the
emissions associated with drying (again, reduced by a higher efficiency process).
Use of WDG or DDGS as feed to replace grain increases the overall GGE, as this
displaces grain production and lowers the CO2 being sequestered by
photosynthesis.
WDG can be transported for a large distance (>1000 km) before the GGEs from
transport exceeds the GGE from drying and transport of the DDGS (cf the
economical distance of only 50-60 km).
Anaerobic digestion of the stillage gives lower GGE, due to the use of combined
heat and power; ie the use of waste heat from power generation for the
fermentation. A similar conclusion applies to the combustion of WDG for
electricity generation.

119
All of the alternative technologies reduce the overall GGE, with the highest
efficiency electricity generation case (with biogas combined cycle, or IDGCC)
virtually offsetting the upstream GGEs for ethanol production.
Comparison with other LCA studies
In comparison with the other Australian studies on wheat production, similar GGEs and
process water values were obtained, when compared on a similar basis. The values for
resource energy, however, vary considerably (some of which may be attributed to different
locations).
For ethanol production, comparison with other studies is complicated by uncertainties in
how by-products have been credited, and in some cases by the use of petrol blends as the
functional unit. In addition, many of the studies, incorrectly, do not consider the CO2
sequestered by the grain through photosynthesis, as required by LCA methodology; this
significantly reduces the GGE benefit of ethanol production from grain.
Comparison of ethanol and petrol
Using current technology, the life cycle GGEs for ethanol are always less than those for
petrol, with ethanol cases involving exported electricity being very much lower. This
benefit is likely to be greater in the future due to the potential use of CO2 capture
technologies in the ethanol plant and in power generation from stillage.
Most previous studies have compared ethanol and petrol on the basis of equivalent energy
delivered - as fossil energy replacement. Most US studies (based on corn) have shown that,
on a fossil fuel basis, the production of ethanol results in approximately 30% more energy
than the fossil energy used in its production. The present study has shown similar results
for the WDG case. DDGS results in a small negative net energy.
If DDGS were to be the likely by-product from ethanol production in Australia, then, from
a resource energy perspective, ethanol production would not contribute to a reduction in
the overall energy required for transport, when taking a life cycle approach.
For anaerobic digestion (with electricity generation using internal combustion engines)
there is a marked improvement in net energy – 2.5-3 times better than for WDG, or than
for previous overseas studies.
Overall, ethanol production from grain gives significant resource energy and GGE benefits
in comparison to petrol. The exception is for resource energy when DDGS is the by-
product. Of course, a number of other issues also need to be taken into account, such as
grain availability, acceptability, economics, etc.
Techno-economics
Because of the potential variations in key cost parameters, a matrix of values was used for
grain price, electricity price/cost, and by-product credits. The findings are that:
The techno-economic analysis shows the dominating role that the grain feedstock
plays (50-80c/L of the ethanol production cost).
The next most significant issue is the choice of stillage processing – whether to
produce WDG, DGGS, or biogas/solid fuel for electricity production. In practice,
the choice of process will also depend on a number of interrelated factors –
capacities, the process route, by-product credits, and the ability to exploit
opportunity biomass, such as straw.
Sorghum gives lower unit feed cost, but overall production costs are similar due to
lower credits (higher level of starch in the sorghum produces a higher yield of
ethanol, but less electricity and fertiliser credits).

120
The cost of ethanol production was 57-103 c/L for wheat, and 62-96 c/L for
sorghum, depending on the combination of assumptions.
The amount of power generated and exported is very dependent on the amount of
stillage, the type of stillage processing, and the generation technology. For the
alternative stillage processing options, the cost of ethanol production is lowest for
AD-GTCC, due to its high efficiency and low capital cost (particularly for
generation plant over 50 MW).
Production of WDG versus DDGS
An interesting question for the study was the trade-off between selling WDG directly, or
drying the WDG to provide DDGS, as an animal feed. Drying would cost around
$37-61/t DDGS depending on energy costs, and, from a cost perspective, WDG can only
be transported around 50-70 km before it is economically preferable to produce DDGS.
WDG, with its limited storage life, handling characteristics, significantly lower value, and
reliance on local use, is likely to provide a lower co-product credit than the equivalent
dried product. Overall, credits will depend on the marketability of the various products for
the particular plant location.
Concluding comments
The variability of grain production in Australia, likely to increase with climate change,
provides a strong driver for location of the ethanol plant adjacent to alternative sources of
grain supply, eg imports or transfers from other regions of the country. This favours
location at a port, as being planned by Primary Energy for plants at Kwinana, and
Brisbane. The biodigestion of the stillage (thereby avoiding production of DDGS) avoids
the issue of location, in the proximity of markets for the DDGS by-product.
From both the techno-economics, and the LCA results, it is apparent that biodigestion of
the overall stillage has a number of important benefits:
Reduces the net energy input to the ethanol plant.
Generates excess electricity, and fertiliser credits, which exceed the credits which
are associated with the sale of the DDGS.
A potential consequence for the feedlot industry is that the digester route does not produce
any distillers grain; ie does not provide a feed component to partially replace the feed value
of the original grain. However, the impact of diverting the WDG away from the feedlot
industry may be alleviated to some extent by the potential for importing surplus distillers
grain from the USA. At least in the short term, this is likely to be available at an attractive
price compared to grain. However, it should also be noted that this surplus (and increasing
costs of energy supplies) is now driving interest in the USA in anaerobic digestion of the
stillage, which would be expected to impact on availability and price of DDGS for
Australian import.
Finally, there is some doubt as to the long term availability of grain in Australia for
conversion to liquid fuels at an economic price (lack of rainfall, competing uses for grain
leading to price increases). There is also the developing technology for conversion of
cellulose to ethanol, which is likely to shift the focus to the cheaper source of biomass. As
the situation unfolds, and new regulatory environments develop, further techno-economic
and LCA studies would be worth consideration.

121
2. BACKGROUND AND GLOBAL ETHANOL SCENE
Renewed interest in ethanol production and technology is very evident in many parts of the
world. Figure 1 summarises the world production of ethanol (all grades) in 2005[1]
.
0 2,000 4,000 6,000 8,000 10,000 12,000 14,000 16,000 18,000
Brazil
United States
China
India
France
Russia
Germany
South Africa
Spain
United Kingdom
Thailand
Ukraine
Canada
Poland
Indonesia
Argentina
Italy
Australia
Saudi Arabia
Japan
Sweden
Pakistan
Philippines
South Korea
Guatemala
Ecuador
Cuba
Mexico
Nicaragua
Zimbabwe
Kenya
Mauritius
Swaziland
Others
ML/y
Country ML/y
Brazil 16,140
United States 15,999
China 3,800
India 1,690
France 908
Russia 749
Germany 431
South Africa 390
Spain 352
United Kingdom 348
Thailand 299
Ukraine 246
Canada 231
Poland 220
Indonesia 170
Argentina 167
Italy 151
Australia 125
Saudi Arabia 121
Japan 114
Sweden 110
Pakistan 91
Philippines 83
South Korea 64
Guatemala 64
Ecuador 53
Cuba 45
Mexico 45
Nicaragua 26
Zimbabwe 19
Kenya 15
Mauritius 11
Swaziland 11
Others 2,687
Total 45,975
Figure 1 World production of ethanol (all grades)
The total world production of 46 GL/y is approximately equivalent to 140% of Australia’s
total petrol, on an energy content basis. Currently Brazil and the USA are the major

122
producers of ethanol, with Australia’s total existing production capacity equivalent to one
medium sized plant.
Rapid expansion in the world wide production of ethanol has occurred over the past 2 to 3
years as a result of:
Recent increases in the cost of crude oil and the current high petroleum prices.
The desire to create less dependence on imported fuels and extend existing
gasoline capacity.
An increasing demand for more renewable fuels.
Attempts to reduce greenhouse gas emissions.
An attempt to reduce exhaust emissions and health risks.
The phasing out of methyl tertiary butyl ether (MTBE) as an oxygenate additive for
gasoline, coupled with the suitability of ethanol as a substitute for MTBE.
The existence of government policies in some countries to promote the ethanol
industry.
The current position, and some recent developments, in different countries are summarised
briefly below. This enables Australia’s current and planned ethanol industry to be placed in
an international perspective. International developments impact on grain price, cost of
imported ethanol, and the rate of technological progress.
2.1. United States
The current USA ethanol production capacity is 16 GL/y, with 97 plants now in operation.
Twenty three plants, with a total additional production design capacity of 40 GL/y, are
currently under construction, and one new or upgraded plant is being brought into service
approximately every 10 days at the present time[2]
. With the current gasoline usage of
about 600 GL/y, around 5% of the gasoline pool will be supplied by ethanol in the near
future.
The majority of ethanol is produced from corn, mainly using the dry milling process
(discussed later), with sorghum starting to make a small, but increasingly important,
contribution outside the traditional corn belt, where water issues are becoming important.
While the low prices for corn have been an important driver for fuel ethanol production,
there have been a number of government (Federal and State) support measures driving the
rapid growth of the industry.
The USA currently uses ethanol blends containing 5.7%, 7.7% and 10% by volume
ethanol, as well as an E85 blend (85% ethanol, 15% gasoline). Legislation is currently
underway for an E20 blend. Ford, Chrysler and General Motors all produce Flexible Fuel
Vehicles (FFVs), and there are now over 5 million FFVs in use. There are 650 E85 retail
stations in the USA[2]
.
Fuel ethanol expansion has been assisted greatly by the government subsidies which
started 25 years ago, with an exemption from the Federal excise tax on gasoline, various
state tax incentives, capital subsidies and loans. The most important incentive is the
Federal tax credit that is valid until 2010, extended from the initial expiry date of 2007, and
redefined by Congress in 2004 as the Volumetric Ethanol Excise Tax Credit (VEETC).
This is currently US 52 cents/gal (Aust 19.55c/L) of pure ethanol, when used in a 10%
blend with gasoline. Since January 1993, ethanol-gasoline blends, containing 7.7% or 5.7%
ethanol (produced from renewable resources), have received a prorated exemption.

123
As well as Federal support, a number of individual State governments offer incentives for
fuel ethanol production. Some of these incentives include: direct payments on a production
(per gallon) basis, use in public fleets, additional fuel tax exemptions, market mandates,
direct grants or low interest loans to assist funding of new plants, and credits against the
producer’s income tax liabilities[3]
.
In 2005, Pimentel and Patzek[4]
estimated the total annual Federal and state subsidies for
ethanol in the USA at more than US$3billion.
The Energy Policy Act of 2005 includes numerous provisions for corn-to-ethanol and
lignocellulosics-to-ethanol[5,6]
. Among the provisions, the Act:
Establishes definitions for the renewable fuels program, including cellulosic
biomass ethanol, waste-derived ethanol, renewable fuel, and small refineries.
Sets a Renewable Fuels Standard (RFS), which provides for a phase-in for
renewable fuel volumes over seven years--beginning with 4 billion gallons by
2006, and ending at 7.5 billion gallons in 2012. Refiners are allowed to use
renewable fuels when, and where, they are most effective.
Creates a cellulosic biomass ethanol program, which;
establishes a cellulosic biomass (apparently ethanol) program of 250 M gallons
in 2013,
counts every gallon of cellulosic- or waste-derived ethanol as 2.5 gallons
toward RFS requirements,
includes a loan guarantee program of $250 M per facility,
creates a $650 M loan guarantee program for cellulosic ethanol, and
creates $550 M "Advanced Biofuels Technologies Program".
Updates the small ethanol producer definition from 30 to 60 M gallons/year. This
change allows the newer, larger farmer-owned plants access to the existing small
ethanol producer tax credit (SEPTC). The Act creates a similar provision for small
agri-biodiesel producers.
Eliminates the oxygenate standard-but allows refiners who choose to continue
using MTBE to do so - as of August 2005, 25 States have banned MTBE.
Exempts small refineries from the renewable fuels mandate for five years.
Establishes a sugar-to-ethanol program, which creates a;
$36 M program to convert sugar to ethanol in Hawaii, Florida, Louisiana, and
Texas (the U.S. sugar cane growing states),
$250 M loan guarantee program for sugar-to-ethanol facilities
$50 M loan guarantee program for sugar cane-to-ethanol facilities.
In his State of the Union address to the US congress on January 29, 2006, President Bush
reaffirmed his support by stating that “We will also fund additional research in cutting-
edge methods of producing ethanol, not just from corn, but from wood chips, stalks, or
switch grass”.
2.2. Brazil
Until now, Brazil has been the world’s largest producer of fuel ethanol, although
continuing major expansion of the US industry means that this position will shortly be

124
challenged. Brazil currently produces around 18 GL/y fuel ethanol, with production
forecast to reach 26 GL/y in 2010. In contrast to the US, the Brazilian ethanol industry is
based almost entirely on sugar cane feedstock. Ethanol produced from cane is less
expensive than from grain, and hence Brazil is in a good position to capitalise on export
markets for their product (exported 2.4 GL/y in 2004 to a variety of world markets, with
the largest exports to India and the US).
Brazil has a favourable climate, plentiful land and rainfall, in the centre-south of the
country, with 50,000 sugar cane growers and 346 mills and ethanol distilleries. However,
forecasts for ethanol production are difficult due to uncertainties resulting from the
variable weather (droughts can result in below average yields) together with the
complication that sugar cane serves as a raw material for markets of sugar and ethanol
(both local and export). A large number of plants are dual plants, and can switch easily
between sugar and ethanol, based on relative prices.
Bagasse is used extensively for process energy, and provides surplus power for sale.
Current sugar production uses more than 50 commercial cane varieties, and improved
management practices have resulted in significant improvements in recent years. Between
1975 and 2000, sugarcane yields per hectare increased by 33%, sugar content of cane by
8%, ethanol yield from sugar by 14%, and there were major increases in ethanol
fermentation productivity.
Ethanol is distributed through 160 operating distributors and 32,030 petrol stations (92% of
the total stations). Flex-fuel vehicles were first introduced in 2003, with 31 new models
and 7 automakers now in operation. These vehicles can use blends of petrol and neat
ethanol, from 0 to 100%. Today, Flex-fuel vehicles account for 73% of light vehicle sales
in Brazil[7]
.
As with the US, government policies and incentives in Brazil have assisted in establishing
the ethanol business. In the mid-1970s, Brazil launched the National Fuel Alcohol
Program, or Proálcool (the world’s first major program for the production of renewable
fuels), with the objective of increasing the share of domestically produced fuels in the
country's fuel pool. The program employed various forms of support, and has been
extremely successful.
High petrol prices in recent years, and the new generation of flex-fuel vehicles, have
solidified the Brazilian consumers' preference for lower cost ethanol fuels. Of the
flex-fuel vehicles (also called "hybrids"), VW has the lead over other manufacturers selling
flex-fuel vehicles in Brazil.
Vehicles that ran solely on 100% ethanol fell out of favour in the 1990s, because of an
alcohol shortage. The ethanol market became liberalised between 1997 and 1999, when
guaranteed ethanol prices, distribution controls and financial incentives for new plants
were gradually abolished.
State intervention is now restricted to provisions for ethanol blending (companies have to
add between 20% and 25% to fossil petrol, depending on situation and markets) and minor
tax reductions for ethanol storage and use of strategic reserves (value-added tax, and fuel
and other taxes, are about 50% of that applied to petrol).
Tokgoz and Elobeid have reported[8]
that the indicative cost of ethanol from sugar cane in
Brazil (without subsidies), at US$0.83 per gallon (Aust 31.3c/L), is lower than the cost of
production from corn in the US[9]
, at US$1.09 per gallon (Aust 41c/L). Whilst the absolute
costs of production will depend on many factors, these figures, together with the high costs
in the US of transporting ethanol supplies from the Midwest to major population areas, has
led to an increase in competitiveness of Brazilian imports, despite the steep tariffs.

125
With the likely ethanol and sugar prices remaining competitive in the near future, Brazil is
expected to continue to increase sugar cane production for both of these commodities. The
country has enough land to easily double sugar cane harvested. In terms of ethanol,
production is expected to double by 2015-16[8]
.
2.3. Canada
Canada currently produces a relatively small volume of ethanol (≈250 ML in 2004-
equivalent to 0.7% of the country’s petrol consumption). Assuming the government’s
target for future fuels is reached, production would need to increase to 1.4 GL in 2007[3]
.
The Iogen Corporation operates a demonstration plant in Ottawa to produce ethanol from
straw, although commercial quantities are not produced. Iogen is currently looking to
attract C$400 M for a full scale production plant to use 700,000 t/y of straw, and other
agricultural wastes, to produce 220 GL/y of ethanol. It was claimed (in 2005) that ethanol
can currently be produced from the straw for C40c/L, but Iogen want to reduce this to
C32c/L eventually[10]
.
Under its Climate Change plan (part of the response to meeting its Kyoto commitments on
greenhouse gas abatement), the Federal government established a target (by 2010) of
having 35% of the national fuel supply provided by E10, together with 500 ML of
biodiesel produced and consumed. Up to C$118 M has been provided in repayable
contributions to 11 projects across the country, which, in combination with existing
production, will allow Canada to meet its climate change target for ethanol 2 years
earlier[9]
. A fuel excise tax exemption of US$0.10/L on fuel ethanol blended with gasoline
is provided by the Federal government.
In addition to the Federal government initiatives, several Canadian Provincial governments
(including British Columbia, Alberta, Saskatchewan, Manitoba, Ontario and Quebec) offer
various road tax exemptions for ethanol-based fuel blends. Saskatchewan, Manitoba and
Ontario also apply mandatory blending rates.
2.4. China
China is the third largest producer of ethanol with some 1.5 GL of fuel ethanol generated
in 2004, with production expected to increase to around 2.5 GL by 2010[3]
. The majority of
ethanol is produced from grain (largest plant is in the Northeast, with a current capacity of
375 ML/y), with about 10% from sugar cane and 6% from paper pulp waste. Feedstock
priority is afforded to biofuel producers from the State grain reserves at competitive prices.
Surplus grain stockpiled in the 1990s, together with the rapidly growing demand for
transport fuels and a desire to reduce air pollution, resulted in China launching a fuel
ethanol program in 2000. Fuel ethanol is exempt from the 5% consumption tax and 17%
value-added tax.
A number of provinces use 10% ethanol fuel blends exclusively throughout their whole
area, while some use E10 blends in part.
Expansion of the Chinese ethanol industry will be challenged by the need to conserve grain
supplies for food security, and sugar shortages have deferred potential expansion in ethanol
production from this source.
2.5. India
India is the fourth largest producer of ethanol, with a capacity in 2004 of ~2.7 GL,
although only ~1.7 GL was produced, and ~100 ML were blended with petrol. Based on

126
the current ethanol fuel program, it is anticipated that ~1.5 GL will be produced[3,9,11]
in
2010.
The industry has developed from a pilot program launched in 2001 by the Indian
government, to examine the feasibility of blending ethanol with gasoline to absorb surplus
sugar. The sale of E5 (5% blend of ethanol with gasoline) was approved by the government
in 2002, and mandated in a number of states and territories from 1 January 2003.
Currently, E10 blends are used in 10 larger producing States and three contiguous Union
Territories. The government introduced an excise duty exemption of Rs0.75/L for ethanol
sales in February 2003. Additional fiscal measures have been introduced in some States to
encourage local ethanol production.
As a result of a drought in 2003-2005, sugar crops and molasses output were significantly
reduced, and ethanol feedstock prices escalated to a point where ethanol production in the
Southern States was channelled to the industrial and potable alcohol sector. As a result, the
ethanol blending obligation was suspended in late 2004. However, with the recovery of
sugar cane production, ethanol production is being re-established.
The major expansion in ethanol production is reported to be taking place in Uttar Pradesh,
Maharashtra and Tamil Nadu, the key sugar producing states, and will use mainly cane
sugar molasses as a feedstock.
2.6. European Union
Total production of ethanol from the EU (in 2004) was 526 ML, with the major production
coming from Spain (254 ML), France (102 ML), Sweden (71 ML) and Poland[3,1]
. Three
major plants, having a combined capacity of 600 ML/y, have recently started operating in
Germany (2004 production of 25 ML). Minor volumes of ethanol are produced in the
Netherlands, Latvia, Lithuania and Italy. New plants in the United Kingdom, Belgium and
Austria are due for commissioning, or are currently being planned. Fuel ethanol in the EU
is largely overshadowed by the increasing biodiesel market. In 2004, biodiesel production
was close to 2.2 GL, with the biggest producer being Germany (1.15 GL in 2004),
followed by France (387 ML) and Italy (356 ML).
Two major biofuel directives were adopted by the European Commission in 2003:
The “promotional” directive (Directive 2003/30/EC) required Member States to
achieve a 2% share of renewable fuels (pure biofuels, blended fuel or Ethyl
Tertiary Butyl Ether (ETBE)) by the end of 2005, and a 5.5% share by the end of
2010.
The Directive on the Taxation of Energy Products (Directive 2003/96/EC) allows
Member States to exempt, in full or part, products that contain renewable
substances (bioethanol or biodiesel).
As well as these two Directives, the Reform of the EU Common Agricultural Policy (June
2003) maintained/introduced financial support for farmers growing energy crops as feed
stocks for biofuels production. This Policy includes a carbon credit payment[3]
of EUR45
per hectare for land producing “energy crops” that are processed to fuel or gas (provided
that a contract is concluded with the processor).
It appears that, based on Member State submissions to the European Commission (2005),
the EU will only have reached a 1.4% share of renewable fuels by the end of 2005
(compared to the target of 2%).
A “Biomass and Biofuels Action Plan” published by the European Commission in
December 2005, together with information contained in a communication on biofuels

127
published in February 2006, aims to increase the use of renewable energy sources. The
Commission estimates that about 150 Mt of biomass based, oil equivalent fuels will be
produced by 2010, compared to 69 Mt in 2003.
A more detailed analysis of the various developments, and specific taxation regimes for
individual countries within the EU, has been presented by Agra[3]
.
2.7. Thailand
Since 2002, the Thai government has supported the establishment of a large scale fuel bio-
ethanol industry based on cassava, sugar cane and rice as preferred feed material, as a
result of concerns over rising oil costs and the desire to replace MTBE[3]
. To encourage the
development of an E10 fuel mix, the government has announced it will waive excise tax,
contribute to the State Oil Fund and Energy Conservation Fund, provide investment
concessions for new plants, allow duty concessions on imported machinery, and give an
eight year corporate tax holiday to ethanol production.
2.8. Russia
Russia recently confirmed plans[12]
to build its first ethanol plant, to be located in
Mikhailovka in the Volgograd region (a major grain growing area). The plant will produce
300,000t/y of ethanol from 900,000t/y of grain, and is anticipated to cost US$200-250 M.
Work will begin in spring 2007 (to be completed in 2 years).
Three local companies have formed a consortium to fund 40% of the project, with the
remainder coming from loans. The opportunity to take advantage of high oil and gas
prices, together with the rising demand for renewable fuels and an alternative outlet for the
region’s wheat production, are cited as the main reasons for the development.
The majority of the ethanol is likely to be exported, as a result of the existing tax
arrangements in Russia, since local consumption is discouraged by high taxes.
The co-product of distillers grain is planned to be consumed by some 12 huge pig farms to
be established in the area.
2.9. Japan
After the US, Japan is the largest consumer of gasoline, and the Japanese government has
allowed the sale of gasoline containing a 3% ethanol blend (E3, made from sugar cane,
soybeans, wheat and other grains) since August 2003. Concerns over higher NOx
emissions and health concerns, as well as costs, have resulted in little apparent progress
with this objective. Under the Kyoto Greenhouse Gas Initiative, the Japanese “Kyoto
Protocol Target Achievement Plan” includes a goal to use 500 ML fuel derived from
biomass in transport fuels by 2010.
To achieve this aim, it has planned to increase domestic ethanol production in stages, and
is promoting the development of ethanol technologies and demonstration plants using
waste biomass and energy crops.
The Petroleum Association of Japan (PAJ) is suggesting the use of a 7% ethyl tertiary
butyl ether (bio-ETBE-made by compounding ethanol and isobutane) blend with gasoline
as an alternative to ethanol, with the aim of a voluntary target of 20% of the total gasoline
demand by 2010[13,14]
. It has been claimed that gasoline blended with ETBE would require
less investment than direct ethanol injection into gasoline, and could use idle MTBE
facilities (ceased production in 2000 and 2001 due to health and environmental concerns).

128
Whether Japan will import ethanol or ETBE is yet to be determined, although the PAJ
appears to favour the ETBE route. At the earliest, procurement of these imports is not
likely to commence until at least 2008.
2.10. Australia
The existing production capacity for ethanol in Australia is ~155 ML/y (see Table 1),
although the actual production (2005-2006) was ~105 ML (fuel and industrial use) due to
limitations in market demand. Contract commitments for ethanol for blending with petrol
are only 21 ML.
Table 1 Current operating ethanol plants in Australia
Plant/location Production
capacity,
ML/y
Feed material Product mix
Manildra, Nowra NSW 90 Starch plant by-products,
wheat, sorghum, rice
E10,
industrial
CSR Sarina sugar mill, Qld 55 Molasses E10
Rocky Point sugar mill, Qld 10 Molasses E10
Total 155
Table 1 and Table 2 summarise details of the Australian operating and planned ethanol
plants. A number of other potential plants have been foreshadowed in recent years, and
some additional plants to those listed in Table 2 may be in the process of evaluation, as the
overall ethanol market develops[15]
.
In 2000, for biofuels, the Federal government waived the fuel excise tax payable on petrol
and diesel (38c/L), and in September 2001, the Coalition election policy outlined their
policy for “Biofuels for Cleaner Transport”. In September 2002, the government ended the
fuel excise exemption, and replaced it with an ethanol production subsidy at the same rate
for one year. The Federal government legislated in April 2003 to restrict ethanol blended in
gasoline to 10%, and it came into law on 1 July 2003.
On 25 July 2003, the government announced its intention to provide one-off capital grants
(administered by Invest Australia) up to $A37.6 M for Australian projects that provide new
or expanded biofuel capacity. On 1 April 2004, the senate deferred the introduction of
phasing in of the subsidy until 1 July 2011. From 1 July 2011 to 1 July 2015, this support
will be reduced through the phasing in of an excise tax for alternative fuels (including
biofuels), resulting in an excise of 12.5c/L payable in 2015. This is a 50% discount on the
normal excise of 25c/L for mid energy content fuels (ethanol inter alia).
The Federal Government’s Biofuels Task Force report, released in September 2005,
recommended a target use of 350 ML/y by 2010 (biofuels-ethanol plus biodiesel). The
initial less than enthusiastic response from oil companies, together with market resistance,
meant that the government would struggle to see this achieved. As a result of the Prime
Minister calling a meeting with oil company representatives in September 2005, voluntary
commitments to take up and use 89-124 ML in 2006 (increasing to 403-523 ML by 2010)
were obtained, and a Biofuels Action Plan agreed from the major oil companies. To date
(June 2006), it appears that contract ethanol commitments of only 21 ML have been made.
In conjunction with the industry-government partnership established through the
development of the Action Plan, together with the 10% cap on ethanol blends and the

129
$37.6 M Capital Grants program, the government released a number of other
initiatives[16,17]
to support the partnerships. These initiatives include:
Use of E10 blends by the Commonwealth vehicle fleet.
Simplification of the ethanol label, increasing the number of fuel quality
compliance inspections to ensure motorists receive high quality fuel that is safe for
their vehicles.
Vehicle testing of E5 and E10 blends.
Consideration of minor specification changes to help encourage development of
biofuels.
Working with Federal Chamber of Automotive Industries to ensure accurate
information about compatibility of vehicles with ethanol.
The Government will monitor and review progress on a six-monthly basis.

130
Table 2 Proposed ethanol plants for Australia
Plant/location Production
capacity(ML/y)
Feed material
nominal rate
Reference
Dalby Bio-Refinery Ltd, Dalby
Qld
80 (40 initially)
Caltex and
independents
Sorghum [18,19]
Primary Energy Pty Ltd,
Kwinana, WA
160
BP E10 fuel
Wheat
400,000 t/y
[18,20,21]
Primary Energy Pty Ltd,
Gunnedah, NSW
80
Wheat and sorghum
200,000 t/y
[18,22,23]
Primary Energy Pty Ltd,
Brisbane (Pinkenba), Qld
160 Wheat, sorghum and
barley
400,000 t/y
[24,25]
Australian Ethanol,
Swan Hill, Vic.
Blend for
transport fuel
Barley, corn, wheat,
sorghum
300,000 t/y
[18,26,27]
Bundaberg Sugar 10-14
E10 domestic
market
Cane juice and
molasses [18,28]
Lemon Tree Ethanol Pty Ltd,
Milmerran, Qld
60
E10
Cereal grains [18,29]
Grainol,
Kwinana, WA
190 Wheat and barley
500,000 t/y
[30]
Babcock and Brown,
Rockdale Beef Feedlot,
Yanco, NSW
150
Australian
transport fuels
market
[31,32]
Downs Fuels Farmers Pty Ltd,
Darling Downs, Qld
80 (initially)
160 (later)
Sorghum
(mostly)
200,000 t/y (initially)
[33]

131
3. ETHANOL PRODUCTION TECHNOLOGY
3.1. Overall process
Although ethanol is generally produced by the fermentation of sugars, the process of
saccharification (conversion of starch to sugar) has provided the basis for an ever
increasing, cost effective production of bioethanol, for use in blending with gasoline fuel,
from a wide range of grains, including corn, wheat, sorghum, barley, rice and others.
The longer term potential of converting cellulose and hemi cellulose from straw, stalks,
grasses and waste material to ethanol, whilst currently technically feasible, needs to be
demonstrated at commercial scales of operation with reduced capital and operating costs.
While the primary focus of this report is on the use of grains as feedstock, a brief summary
of developments in the cellulose technology route are also presented, since this
development could free up supplies of grain for other uses in the longer term.
The basic chemical conversion of starch to ethanol is represented by:
Starch from grain → (enzyme)
C6O6H12 → (yeast)
2C2H5OH + 2CO2
Although an alternative wet milling process is available, this report will focus on the dry
milling process, as this represents the currently favoured route. In the USA, dry milling
plants have been constructed almost exclusively over the past 15 years, due to the limited
market potential for the range of co-products produced from the wet milling option. Some
brief additional comments about the wet milling option are included later. An example of
this technology is shown in Figure 2.
Figure 2 Badger State Ethanol Plant at Monroe, Wisconsin, USA (190 ML/y) [34]
Figure 3 shows a typical flowsheet for the basic dry milling grain to ethanol process.

132
Milling
Grain
Liquefaction and
gelatinisation
Fermentation
Centrifuge
Dehydration
Saccharification
Distillation
CO2
Ethanol
Drying
Evaporation Syrup
DDG
Water
Figure 3 Basic dry milling ethanol process
3.2. Process steps
The individual process steps in the above diagram are discussed briefly below.
3.2.1 Grain grinding and slurry preparation
The feed grain is mechanically ground in a hammer mill to a coarse meal or flour, typically
to a size of 0.25mm to 0.85mm. The choice of particle size can affect the later processing,
and is chosen to allow water access to the starch inside the grain.
3.2.2 Gelatinisation
After making a slurry with warm water to a concentration that optimises water uptake and
viscosity, the mixture (mash) is cooked with steam at a temperature of between 80 and
100oC, to assist in gelatinising (hydrolysing and swelling) the starch into solution
[35]. Grain
type has a significant effect on processing, and the size distribution and cook temperatures
are chosen to produce optimum conditions. If the slurry is too hot, it can generate a high
viscosity, and, if too cold, longer processing residence times are necessary.
This heating process also sterilises the mash. Typically, a small amount of thin stillage
from the bottom of the beer still is recycled to the slurry to acidify the mixture to a pH of
4.8 – 5.2 (for corn), and encourage optimum enzyme activity.

133
3.2.3 Saccharification
An alpha amylase enzyme is added to convert the starch into dextrin sugars
(saccharification). The mash is then cooled to around 60oC, to achieve a suitable reaction
rate whilst avoiding undesirable side reactions and reduced ethanol yields[36]
. After
cooling, a glucoamylase enzyme is added to make the sugars more readily available for the
yeast reaction.
3.2.4 Fermentation
The mash is further cooled to around 32oC to enable the yeast to grow and multiply during
the fermentation process, which takes place over a period of 36-72 hours. Longer times are
likely to increase the risk of infection by undesirable organisms and shorter times allow
higher productivity. Ongoing research is aimed at minimising fermentation times and some
operators have reported fermentation times of 23 hours. In the majority of ethanol plants,
the fermentation is carried out in a batch-wise mode, primarily to maintain sterility during
the fermentation process, and to allow sterilisation between batches. It is noted that the
Manildra plant in Nowra utilises a multi-stage continuous fermentation process, and
sterility is controlled by monitoring lactic acid and other critical components, and making
adjustments to maintain an appropriate level of control over the various reactions that may
take place[37]
. Fresh yeast is prepared separately, and introduced at the beginning of each
batch (or as required in the continuous process).
The fermentation tanks are agitated and the slurry circulated through external heat
exchangers, to maintain optimum temperature during fermentation and to remove the heat
generated from the yeast reaction. Various additives are used to control foaming during
fermentation, and buffers, nitrogen sources and minerals are utilised to produce the
optimum yeast properties and maximise ethanol output from the fermentation broth.
3.2.5 Distillation
Once fermentation is complete, the fermentation mash (beer) is stored in a beer-well before
transfer to the distillation stage, and the fermentation tanks cleaned for the next batch. The
beer contains about 6-12% ethanol, together with all of the solids from the original
feedstock and from the added yeast. The beer is continuously pumped to a multistage
distillation unit which produces an overhead stream containing >90% ethanol with water.
3.2.6 Dehydration
Ethanol and water cannot be separated to produce 100% ethanol by simple distillation, as
the mixture forms an azeotrope containing 95% ethanol. Removal of the water in the
azeotropic mixture is achieved (in some of the older plants) by azeotropic distillation using
an azeotropic breaking solvent (such as benzene), or more generally using vapour phase
dehydration with molecular sieves. The molecular sieve adsorbs the ethanol while allowing
the water to pass through. When the adsorber bed is saturated, the feed is switched to a
parallel adsorber, and the ethanol desorbed to yield an almost pure anhydrous ethanol
product. Typically, three adsorbers are used.
3.2.7 CO2 recovery
Carbon dioxide produced in the fermentation is collected, scrubbed to remove any ethanol,
and recovered as a by-product in some operations (for example to produce dry ice pellets
for use in dry ice blasting, as a clean alternative means of sand blasting).

134
3.2.8 Solids separation
After distillation and dehydration, the residual liquid (whole stillage), containing all the
insoluble material, soluble non-starch components and the yeast which has grown during
fermentation, is pumped to a mechanical separation step or solid bowl decanter centrifuge
to recover most of the solids. The typical product from a decanter centrifuge (Wet
Distillers Grain-WDG) contains ~30-35% solids. A large proportion of the underflow from
the centrifuge (thin stillage) is recycled to the front end of the process to minimise water
usage, with the remainder concentrated by multiple effect evaporation to recover water for
recycle. In some ethanol plants, all or part of the thin stillage is used for irrigation of
adjacent farming operations.
The concentrated syrup product (sometimes called Condensed Distillers Solubles, CDS)
typically contains ~30-35% solids, and is either blended with the WDG or sold separately
as a high fat animal food. The product containing the syrup is marketed as wet distillers
grain with solubles (wet cake or WDGS).
3.2.9 Drying
WDG is commonly sold to local feedlots and dairies. However, it only has a shelf life of
around 3 days, and direct usage is usually restricted to feedlots within close proximity to
the plant. Alternatively, the wet product (usually including the syrup) is dried to yield a
product containing ~10% moisture (Dried Distillers Grain with Solubles-DDGS). This
product is easily transported and can be readily stored for long periods.
Figure 4 DDGS in storage at a US ethanol plant (Mid-Missouri Energy, Malta Bend)[34]
Some early dryers resulted in thermal damage to the product, and inconsistent quality,
odour and texture, from uneven temperatures and overheating. Modern dryers generally
allow a much more consistent product to be generated. Two main types of dryers have
been used: the rotary dryer and the ring dryer (often called flash and ring dryers).
Approximately 85% of ethanol plants currently use rotary dryers.

135
Rotary dryers utilize either steam tubes or direct fired heating, and ring dryers use direct
fired heating with large volumes of air. Typically, steam dryers use 1kg of steam to remove
between 0.6 and 0.7 kg of water, with some economies resulting from recycling. In direct
fired systems, 2.8-3.1 MJ of energy is utilised to remove 1 kg of water.
The conventional, direct fired, rotary dryer has an inlet air temperature of 300-650oC, with
an outlet temperature of around 98oC, and is run in co-current mode, ie the hottest gases
are in contact with the wettest solids. Rapid evaporation occurs as a result of the fine
particle sizes and convective heat transfer. The high evaporation of water also results in
cooling of the grain, and minimises degradation of the protein and other nutrients. The
dried product migrates to the outlet of the drum, due to the movement of the heated air.
Once discharged from the dryer, the product is separated from the air flow by cyclones.
The exhaust gas either exits the plant directly, or is treated in either a wet gas scrubber or
thermal oxidiser, to remove residual organics (and eliminate odours).
A proportion of the dried product is commonly recycled back to the inlet and mixed with
wet feed to maintain a more uniform condition in the dryer, and assist with additional
conductive heat transfer.
Although the ring dryer has many similar features to the rotary kiln, the drum does not
rotate and the material is conveyed through the dryer pneumatically, with large amounts of
air at velocities high enough to induce centrifugal forces on the particles. This centrifugal
action separates the dried material from the wetter product, which tends to migrate toward
the outer wall of the ductwork as the drier, lighter material migrates toward the inner wall.
Dried product is discharged through an opening in the ductwork, where it is separated and
collected in the cyclones.
Handling and storage of the product is important, as spontaneous combustion can occur in
bulk piles if the material is too hot. Consequently, most plants cool the DDGS with
ambient air before storage. Fine dried residue can sometimes form small balls when the
material comes in contact with sticky recycled syrup.
3.3. Plant Capacities
Ethanol plant capacities have gradually increased over the years as demand has increased,
and as pressures to reduce operating costs have been placed on the industry. In the 1980s,
US plants typically produced 80 kL/y to 25 ML/y. In 2005, 17 of the operating plants (87
in total) had a capacity less than 150 ML/y, with 23 plants having a capacity in the vicinity
of 200 ML/y. Seven plants with capacities greater than 380 ML/y were in operation[2]
. A
100 ML/y US plant typically employs 32 workers, whereas a 380 ML/y plant can operate
with only 45 employees[38]
.
Initial development proposals for new Australian plants were based on plants having a
capacity around 80 ML/y. However, more recent proposals have moved toward larger
capacities (160 ML/y) to achieve more attractive financial outcomes based on economies
of scale.
3.4. Plant capital cost
Plant capital cost data is difficult to obtain for Australia due to lack of recent completed
ethanol projects. Nominal cost data has been estimated for an Australian plant with DDGS
as by-product, using a number of industry sources – a rule of thumb is that the capital cost
is $A 1.0 M/ML annual capacity.

136
For the biodigestion of stillage option, the costs of the digester and associated plant is
probably offset substantially by the removal of the evaporator, dryer and separation
equipment for DDGS production.
0 5 10 15 20 25 30 35 40 45
EP&C, licensing, management
Sitework/buildings
Piping
Electrical
Separation/evaporation
DDGS drying
Process utilities
Fermentation/CO2
Distillation/dehydration
Grain handling
Mash preparation
Installation of equipment
Controls/Instrumentation
Ethanol storage
Miscellaneous
Capital cost A$M
Figure 5 Breakdown of capital cost for ethanol plant with anaerobic digestion

137
4. GRAIN AND PROCESS PARAMETERS
Whilst the primary feedstock for ethanol production in Brazil is sugar cane, and in the
USA corn, the feedstock for the major proportion of ethanol production over the next
decade in Australia will be a variety of grains, with a small proportion from sugar cane by-
products (primarily molasses). The requirements for feed grains, and the associated ethanol
and by-product yields are given below. Some comments on energy and water consumption
are also provided.
4.1. Grain requirements
The particular type of grain used will depend on many factors, including the plant location,
cost and availability of grain, transportation costs and opportunity for maximising ethanol
yields. While more details related to grain availability, location and cost are included in the
other sections of this report, it is important to appreciate some of the technological issues
that are affected by changing grain types, since this can have a significant effect on the
plant design, as well as ethanol production yields and costs. These aspects are discussed
below, and are essentially focussed on the dry milling production process as outlined
earlier.
Grains, such as wheat, corn, barley, sorghum and other cereals, typically contain 55-70%
starch, and various varieties have been adapted to yield high starch levels.
Table 3 summarises some indicative grain analyses for varieties grown in Australia[39,40,15
].
These figures are meant to provide indicative numbers only, since wide variations
(especially in starch) have been reported[41
].
Table 3 Typical grain feedstock analyses
Component Unit Corn Wheat Barley Sorghum
Moisture % ar 12.0 10.0 12.0 12.0
Starch % db 70.0 65.3 60.0 74.6
Protein % db 9.5 13.0 10.0 8.0
Fibre % db 11.5 9.0 10.2 10.0
Fat % db 3.9 2.0 3.0 3.1
Ash % db 1.6 2.5 2.5 1.0
Other solubles % db 3.5 8.7 14.3 3.3
Note: Moisture levels have been modified to represent levels considered appropriate for Australian grains.
The grain feedstock typically contributes 60-70% of the overall ethanol production cost,
and optimisation of both the feedstock and plant design are important aspects for any
project. Ethanol plants can use sub-standard grains which may have been affected by
adverse weather conditions, physical damage or contamination.
4.2. Ethanol yield
Ethanol yields are basically related to the available starch, together with the efficiency of
fermentation and recovery of the ethanol. Whilst there is not necessarily a direct

138
quantifiable correlation between ethanol yield and starch content for the various grain
types, or more particularly for mixed grain feeds[42]
, it is reasonable in the current context
to assume that the ethanol yield is directly proportional to starch content. An indicative
practical yield is 620 L/t of starch, and Table 4 shows the relative difference in unit ethanol
production (based on this figure) for the range of grains of current interest to Australian
ethanol producers[15,40,43]
. These calculations show that a plant processing sorghum (with
the higher starch level quoted) would produce approximately 24% more ethanol compared
to the same quantity of barley, or an additional 12% compared to wheat. It is noted,
however, that starch levels can vary significantly for grain produced in different areas and
under varying seasonal conditions.
Table 4 Ethanol production for various grain feedstocks
Parameter Unit Corn Wheat Barley Sorghum
Moisture % ar 12.0 10.0 12.0 12.0
Starch % db 70.0 65.3 60.0 74.6
Ethanol yield L/t grain 382 365 327 407
Grain to produce t/160 ML 419,000 439,000 489,000 393,000
Wet distillers grain t/160 ML 386,000 481,000 591,000 310,000
Dry distillers grain
@10% moisture
t/160 ML 129,000 160,000 197,000 103,000
The amount of distillers grain produced is inversely proportional to the ethanol yield, as
expected.
4.3. Distillers grain yield
Variations in grain properties and processing will have an influence on the properties and
yields of wet and dry distillers grain. Indicative yields for both wet distillers grain (30%
solids) and dry distillers grain (90% solids) for a 160ML/y ethanol plant are shown in
Table 4. These figures have been estimated by assuming that all of the grain protein, fat,
fibre, solubles and ash, together with 2% of the starch, report to the distillers grain.
There is some uncertainty about the role that the grain “solubles” play in determining
ethanol and distillers grain yields for the various feedstocks. In the above estimates it has
been assumed that all the solubles report to the distillers grain[37]
. Refinements to these
estimates, based on operational experience and research for different grains, could result in
minor changes to the absolute yields.
4.4. CO2 generation
Fermentation of starch produces carbon dioxide (as shown in Equation1). Typically, the
quantity of CO2 produced is 498 kg/t of starch.
4.5. Water consumption
Water is a key component in the processing of grain to ethanol, with several process
circulation loops used in a typical plant. The hydrolysis slurry feed concentration is similar
for all types of grain, and therefore feeds richer in starch, such as sorghum, require less
water than grains with lower starch (such as barley). The consequence of this process
parameter is that plants using sorghum as a primary feedstock require less process volume
(and less power) than those processing the poorer starch grains (with subsequent savings in

139
both operational and capital costs). Plants designed for mixed or variable feedstocks need
to utilise a conservative process flowsheet, and hence would be based on the higher water
utilisation requirement.
The plant uses water for cooling to control fermentation temperatures, for boiler blowdown
and other process steps, as well as water makeup for that lost in the WDG. Where DDG is
produced, this water is normally lost to atmosphere, unless an advanced drying process is
used.
Total consumption ranges from 1-3 m3/kL of ethanol depending on the process.
4.6. Energy consumption
Process energy and electricity typically account for approximately 10-20% of the
operational cost for a bioethanol plant[38]
. This cost is affected largely by the availability
and cost of the energy source. For new plants, ICM give natural gas consumption of
10 MJ/L ethanol. The ICM process is approximately 3 MJ/L less, without the dryer (ie
when WDG is produced).

140
5. NEW DEVELOPMENTS AND POTENTIAL TECHNOLOGICAL IMPROVEMENTS
In the past, the viability of bioethanol plants was seriously threatened by the fall in oil
prices, and the cyclical increases in the price of feedstocks brought about by demands in
other areas. Consequently, there has been a continual attempt to improve the biological
efficiency of ethanol production, and to characterise the properties and identify cost-
effective markets for the co-products. At the same time, improvements in the performance
of the various unit operations aimed at reducing capital equipment cost have made
significant contributions.
In the US industry, ethanol yields in the 1980s were typically around 340 L/t (for corn
feedstock), with production costs around A95c/L. Technological advances and refinements
have resulted in typical current yields of up to 420 L/t, with a production cost of
approximately A50c/L.
To some extent, the current boom in ethanol demand, coupled with taxation relief policies
and unprecedented high fuel prices, has resulted in high rates of return (typically 3 years in
the USA), and has delayed the impetus to adopt new technologies. However, research and
development work will continue to play an important part in improving the technology and
range of co-products for future ethanol plants.
Some of the technological improvements that have been demonstrated, foreshadowed, or
are under development are briefly summarised below.
5.1. Liquefaction, saccharification and fermentation
Industrial enzymes were first introduced into ethanol production in the 1950s. Since then,
major improvements have led to significant advances both in performance and reduced
costs. Ongoing research and development is continually offering new options for
improvements.
The new generation of alpha amylases used to break down the starch do not require the
addition of lime (as originally used) to stabilise the enzyme and tolerate lower pH, so that a
higher proportion of thin stillage can be recycled. These enzymes also reduce the mash
viscosity (leading to improved fermentation rates) and reduced calcium oxalate
production[44]
. Improved enzyme performance and cost of production have reduced the unit
cost of enzymes by as much as 75%. Improved enzymes that allow reduced mash
viscosities have allowed higher dry solids concentrations (increased from 35% to 38-40%)
and, as noted above, have reduced the amount of water (per tonne of feed grain) that needs
to be heated in the cooking process. It has been estimated that for a 150 ML/y ethanol
plant, approximately 15 tonnes per day of steam would be saved by using the higher
concentrations[44]
.
Wheat, rye and barley contain non-starch polysaccharides (grain cell walls), and these
create a gel complex when in contact with water, resulting in a very high viscosity.
Enzyme research has permitted the development of a product range that optimises the
activities and performance for different grains without creating viscosity problems[41]
.
Similar improvements in glucoamylase and protease enzymes (required with some grains
to release the starch bound in the protein matrix) enable multiple grain feedstocks to be
processed by utilising the appropriate enzyme mix, resulting in optimum ethanol
productivity.

141
Although significant progress has been made in the development of thermotolerant yeasts,
fermentation is currently limited to temperatures below 38oC. The primary driving force
for higher fermentation temperature is to increase the rate of fermentation, while a number
of process modifications would be required to accommodate higher reaction rates (such as
increased rates of cooling and enhanced CO2 scrubbing).
The production of glycerol during fermentation can occur when various dissolved salts are
present due to osmotic or chemical stress, resulting in a lower ethanol yield. Extension of
present research with yeasts, produced using techniques such as “metabolic flux
engineering”, could lead to improved commercial practices.
Combined saccharification and fermentation (simultaneous saccharification and
fermentation (SSF)) is a batch system which improves the kinetics of saccharification by
removing (fermenting) the glucose as fast as it is formed. In continuous fermentation
processes, where there is continuous dilution of the high glucose feed in the first-stage
fermenter, saccharification to high glucose levels helps reduce fermentation time.
However, in batch fermentations, osmotic shock created by high glucose concentrations
can stress the yeast. SSF improves ethanol yields and accelerates ethanol production,
thereby reducing the potential for bacterial growth in the fermenter.
Incorporation of yeast propagation with the SSF combination has been included in some
plant designs (known as the Simultaneous Saccharification, Yeast Propagation and
Fermentation Process (SSYPF)) with the objective of increasing yeast contact time and
reducing bacterial growth[44]
. These processes also reduce the storage and handling of large
stocks of yeast.
Raw starch hydrolysis (cold cook process) represents a new process that enables the
conversion of starch to fermentables, without the cooking component. This has been made
possible by the development of some innovative low temperature alpha-amylase and
glucoamylase enzymes. Whilst a number of companies have unveiled various versions of
this process, the combined efforts of Broin and Novozymes (BPX process) over several
years has been reported to have resulted in the successful implementation of the
technology in twelve Broin-managed dry milling facilities, having a total ethanol
production of almost 2.3 GL/y[41,45,46]
. It is claimed that this route to ethanol reduces
energy costs by 8-15%, provides additional starch accessibility for conversion, results in
higher ethanol yields and increased nutrient quality in feed co-products, and lowers the
capital costs for new plants. There are, however, some cost offsets through increased
enzyme costs, and increased cleaning frequency and associated costs.
Processes such as Very High Gravity (VHG) fermentation (originally explored at the
University of Saskatchewan ), using highly concentrated mash with greater than 30%
solids, have the potential to produce ethanol concentrations as high as 23% v/v. However,
concentration levels as high as 23% have apparently only been achieved in the laboratory.
Many major breweries throughout the world are said to be experimenting with VHG
processes[44]
.
5.2. Modifications to the front end of the dry milling process
A number of process modifications to the front end of the ethanol process have been
investigated in an attempt to increase the variety and value of co-products, especially given
the potential for oversupply of DDGS. Whilst this may not become a serious problem in
Australia in the near term, it is useful to briefly review some of the new and developing
options in this area. While detailed descriptions of individual flowsheets are outside the
scope of this review, extensive publications are available by referring to Singh (University
of Illinois, Urbana-Champaign).

142
5.2.1 Dry fractionation
The dry fractionation process[41,47,48,49,50,51]
, effectively separates the grain into its main
components; germ (oil), pericarp fibre, and endosperm (ethanol). This separation increases
the value of co-products and reduces the amount of solids processed through the
fermentation and distillation processes, thereby enabling a decrease in enzyme
consumption, and a slight increase in the ethanol content of the mash (12-14%). These
improvements reduce process energy consumption and potentially increase the capacity of
the plant.
The reduced fibre (cellulose) content of the DDGS with dry fractionation makes the DDGS
suitable as feed for swine, poultry, and fish.
Several variations on dry fractionation have been developed by various technology
suppliers, including: Cereal Process Technologies, LLC (CPT based in Memphis,
Tennessee); Ocrim SpA (based in Cremona, Italy); Applied Milling Systems (AMS
based in Houston, Texas), Satake Corporation (based in Tokyo, Japan and also with a
major division in Cheshire, England), Monsanto (based in St. Louis, Missouri), and the
FWS Group (based in Winnepeg, Manitoba, Canada). Broin has an agreement to use
technology developed in collaboration with Satake, while ICM is using AMS's dry
fractionation technology. Dry fractionation is more appropriate for new plants to take full
advantage of the potentially higher ethanol capacity.
The following typical yields of the various co-products from this process (for corn
feedstock) have been presented by Locke[41]
; per tonne of corn, 380-410 L ethanol, 62 kg
corn germ (35-40% oil), 69 kg corn fibre (60%-70% carbohydrates) and 140 kg modified
DDGS. Other indicated advantages include improved yield of oil extraction from the germ,
increased ethanol yield (435 L/t fibre) and, importantly, higher protein content in DDGS
(from 28% to greater than 58%, with a significant increase in estimated value).
5.2.2 Modified dry grind processes.
Research into improved techniques on the front end of the dry grind process (using the
addition of water), aimed at recovering germ, pericarp and endosperm fibre as co-products,
has attracted significant interest in the USA. A number of these are briefly outlined below.
a) Quick Germ (QG) process
In this process, the grain is firstly soaked and ground in a degermination mill, and the germ
is separated in a series of germ clones before being dried. The underflow from the cyclones
is then further ground to produce a mash, which is processed using the usual dry grind
ethanol route[52]
. Typically, 1 tonne of grain feed (corn/sorghum) produces 59 kg dried
germ, 385 L ethanol and 208 kg DDGS. Potential advantages over the conventional
process include the recovery of valuable germ, an increase in plant ethanol capacity, and an
increase in the protein content of the DDGS.
b) Quick Germ Quick Fibre (QGQF process)
This process is somewhat similar to the QG process, except that, after soaking, both the
germ and pericarp fibre are recovered from the germ clones, and the pericarp and germ are
then separated, after drying, in an air separator. Again, the underflow from the germ clones
is further ground before processing using the usual ethanol route[53]
.
Typically, 1 tonne of grain feed (corn/sorghum) produces 73.4 kg fibre, 61.2 kg germ,
400 L ethanol and 143 kg DDGS. In this case, the recovery of coarse fibre as a valuable
co-product is achieved, as well as an increase in the plant ethanol capacity, an increase in
the protein content of the DDGS, and a reduction in the fibre content of the DDGS.

143
c) Enzymatic dry grind (E-Mill) process
After soaking, as in the above processes, the ground product is pumped to an incubation
stage where enzymes are added. After further grinding, the germ and pericarp fibre are
separated as in the QGQF process. An additional grinding step then allows the endosperm
fibre to be separated prior to the processing of the residual material to ethanol and
DDGS[54]
. The resultant ethanol concentration is higher (with increased plant ethanol
capacity), protein content of DDGS is increased, fibre in the DDGS is very low, and germ,
pericarp and endosperm fibre are recovered prior to ethanol processing. Typically 1 tonne
of grain feed (corn/sorghum) produces 73 kg pericarp fibre, 61 kg germ, 73 kg endosperm
fibre, 400 L ethanol and 69 kg stockfeed product.
5.2.3 Modifications to the back end of the dry grinding process
The Elusieve process[55]
utilises the conventional dry grind ethanol process flowsheet, but
includes a sieving separation section to separate an enhanced heavier DDGS fraction from
the lighter fibre. This process modification uses the conventional dry grinding process
route up to the DDGS product, but separates an enhanced DDGS with higher protein and
lower fibre content. The fibre can be used for recovery of higher value products (including
corn fibre oil and corn fibre gum). Typically, 1 tonne of corn/sorghum grain feed produces
416 L ethanol and 277 kg DDGS. Srinivasan et al[55]
have indicated that a payback period
of 1.2 to 2.2 years could be achieved for a 145 ML/y plant using the Elusieve process.
5.3. Other process technology advances
5.3.1 Anaerobic digestion of ethanol fermentation residues
In a typical dry grind ethanol process, the grain residue is recovered and sold either as wet
distillers grain or subsequently dried and marketed as dry distillers grain.
In some locations and applications, significant interest in the anaerobic digestion of the
residues is developing as a result of oversupplies of distillers grain, but also as a means of
combating the significant (and increasing) operating costs of natural gas and electricity.
Another driver is the potential greenhouse gas credits that can result from the generation of
electricity from the methane produced by the digestion process. Anaerobic digestion also
produces compost and fertiliser co-products that can provide additional income, albeit with
additional capital costs for the overall plant.
In a variation of the above arrangement, some combined feedlot/ethanol plants utilise the
animal manure from the feedlot in a digester to generate methane, and utilise the distillers
grain as feed. If too much distillers grain is produced, it is then diverted to the digester to
optimise the value and feed/solids balance[56]
.
Anaerobic digestion to generate methane from manures and other organic feed materials
has been utilised for many years, with many plants in operation throughout the world. In
ethanol production, anaerobic digestion has been incorporated into a number of plants.
Typically the stillage from the beer column is fed to one or more digesters, and the
methane generated is used in a turbine to generate electricity and steam. The residue from
the digester is processed in an ultrafilter, ammonia stripper and reverse osmosis plant to
produce an organic fertiliser, nitrogen and phosphorus/potassium fertiliser concentrates, as
well as potable water that can be recirculated to the ethanol plant[57]
.
For a plant producing 150 ML ethanol (using 400,000 tonnes of grain feedstock),
EnviroPlus have reported the following products from one of their biodigesters:
120 Mm3 biogas (or 200,000 MWh of green electricity)

144
150,000 tonnes of organic fertiliser
20,000 tonnes of ammonia
375,000 tonnes of CO2-e
RO quality water
steam.
EnviroPlus state that the electricity generated allows the total plant to operate without any
fossil fuel or electricity, which results in the revenue from ethanol alone being a smaller
percentage of the total revenue (around 75% compared to at least 85% for a normal plant).
In addition to the 40,000 MWh per year typically required for this size plant, some
160,000 MWh per year of electricity is reported to be available for export, and the
1,650 TJ per year natural gas requirement is eliminated. The additional cost for the plant
containing the digester operation is estimated to be $35 M (compared to the traditional
plant cost of $85 M). The additional $35 M involves the installation of the power plant.
Indicative revenue of $100 M for the combined plant compares to the $90 M for the
traditional plant (EBITDA of $36 M cf $26 M, respectively).
5.3.2 Optimisation of water in wet distillers grain
Typically, the wet distillers grain is recovered from the beer column stillage in a solid bowl
decanter centrifuge, to yield a product containing 30-35% solids. Developments in
decanter centrifuge technology have been reported to produce material up to 40% solids. In
addition, the use of an additional step involving a pressure dryer/filter could result in a
solids concentration of up to 58%[58]
. This reduction in product water content could offer
improvements in product handleability and value, as well as significant savings in the cost
of drying. Alternatively, the drier product has potential as a feedstock for combustion to
generate steam in the process.
5.3.3 Biomass gasification and alternative energy supplies
Anaerobic digestion (5.3.1) offers one option to reduce (or eliminate) the demand for
natural gas). Other options that are being investigated or installed include biomass
gasification (using wood waste, DDGS, wheat straw), methane from local coal seams,
fluidised bed reactors (using waste syrup, and, in some cases, waste or cheap coal). In one
US plant (Corn Plus in Winnebago, MN)[59]
, the distillers grain dryer stack gases are
recycled to the FBR which acts as a thermal oxidiser to reduce emissions. Other
cogeneration technologies have the potential to impact on ethanol operating costs, and
refinement of these in the future (to take advantage of local synergies and materials) will
play an important role.
5.3.4 Biobutanol
Significant interest in developing processes and equipment for the production of
biobutanol, as an alternative to ethanol, has recently emerged[60,61]
.
Butanol has a lower vapour pressure and a greater tolerance for water contamination in
gasoline blends, thereby facilitating its use in existing gasoline distribution channels
(notably pipelines where ethanol attracts water and results in corrosion). It is also claimed
that butanol can be blended with gasoline at higher concentrations without the need to
retrofit vehicles, and that it offers better economy than similar gasoline-ethanol blends.
BP has recently announced[61]
that it will invest $500 M over ten years to establish a
bioscience energy research laboratory to concentrate on research and development in the

145
bioscience sector related to the production of new, cleaner energy. A major part of this
development involved extending its partnership with DuPont to develop, produce and
market advanced transportation biofuels. The two groups have been working with British
Sugar to convert a UK ethanol fermentation facility to produce n-butanol (termed
biobutanol), with the product expected to come to market as a gasoline biocomponent in
2007.
Since both biobutanol and bioethanol have similar production routes and feedstocks,
existing ethanol production facilities can be retrofitted. Feasibility studies for more
production facilities are in progress, with initial feedstocks of sugar, maize, wheat, and
cassava. Cellulosic materials from fast-growing energy crops are also being considered.
5.4. Lignocellulosic route to bioethanol
The long term production of bioethanol to meet increasing demands in many parts of the
world cannot be achieved with grain or sugarcane based feedstocks alone, and major
research and development programs over many years have sought to utilise a large variety
of cellulosic materials as alternative feedstocks. Although a number of processes have been
proposed, and to some extent demonstrated, to date, the additional processing and
associated capital costs to generate a fermentable material have generally resulted in
unacceptable production costs.
For over a century, the potential for producing ethanol from abundant lignocellulosic
materials has been of great interest to many advocates of renewable biomass energy and
ethanol fuels. By comparison with the grain/starch route to ethanol, lignocellulosic
materials require pretreatment to generate the sugars that can be fermented to ethanol.
Potential lignocellulosic materials include wood, agricultural field crop residues (wheat
straw, barley straw, bagasse), and grasses (switchgrass is a popular option in the USA[62]
).
A range of nominal analyses[63,64,65]
for a selection of potential feedstocks are summarised
in Table 5, noting that analyses can vary substantially between samples and locations.

146
Table 5 Analyses for a selection of potential lignocellulosic feedstocks
(wt%, dry basis)
Component Corn
(kernels)
Corn
stover
Wheat
straw
Switch
grass
Poplar
(hardwood)
Pine
(softwood)
Starch (C6H10O5)n 72.0 0.4 0.9 0.3 0 0.1
Sugar (C12H22O11) 2.0 0 0 0 0 0
Cellulose (C6H10O5)n 4.2 37.3 45.2 39.9 42.7 63.5
Hemicellulose
(C5H8O4)n
(C6H10O5)n
6.3
0
22.7
1.4
18.9
0
22.2
0
19.8
4.2
4.6
0
Lignin - 17.5 20.3 18.3 27.7 31.4
Other (protein, oil,
extractives, acetate)
14.0 14.6 6.4 14.5 4.6 0.2
Ash 1.5 6.1 8.3 4.8 1.0 0.2
Carbon 45.7 43.7 43.2 46.7 48.5 52.5
Typical moisture wt% 15 15 15 50 50 50
Note zeros in the table may simply mean that no values were reported for the particular components.
Lignocellulosic materials are made up of lignin (a very high molecular weight, tar-like
polymeric material containing phenolic-propane units), cellulose (polymers of the C6 sugar
glucose), and hemicellulose (polymers of both C5 and C6 sugars). Converting the cellulose
and hemicellulose to ethanol requires first separating them from lignin (“pre-treatment”),
then hydrolysing them to simple sugars, and finally fermenting the sugars to ethanol with
suitable microorganisms - specifically, genetically modified yeasts or bacteria.
Numerous approaches have been examined for pre-treatment of the feedstock to remove
lignin from cellulose. These can generally be categorised as follows (with some typical
references):
Mechanical - such as milling, grinding, and other forms of comminution, such as
rapid decompression (“steam explosion” or “ammonia explosion”[66]
)
Thermal - using hot water, hot chemical solutions, or high pressure steam
Chemical - using acids or alkalis[67]
Organosolv - using solvents, such as ethanol and acetone[68,69]
Combination processes-using two or more of the above (typical approach)
A number of government and private organizations associated with government funded
research, enzyme and micro-organism developers, process engineering and plant
design/construction firms, and process developers, are actively working towards
commercialisation of these approaches.
Within the USA, the DOE/NREL (National Renewable Energy Laboratory) at Golden,
Colorado have spent several hundred million dollars in lignocellulose to ethanol R&D -
both in awards to industry, institutional and university contractors, as well as in-house
R&D. Outside the USA, there appear to be relatively small ongoing R&D activities in this
field in Canada, the European Union, Japan and some other countries.

147
In the area of cellulase enzymes, the two largest manufacturers in the world, Genencor
International (Palo Alto, California), and Novozymes Inc. (Denmark and Davis, California)
have benefitted from partnerships with the DOE/NREL, with Novozymes announcing in
2005 that they had reduced the cost of the cellulose enzyme for hydrolyzing corn-stover
cellulose from more than US$1.30 to 2.6-4.8 c/L.
Genencor is also working with Cargill Dow LLC to create advanced enzyme systems for a
biomass project supported by the DOE[70]
, and in May 2006 announced its participation in
a 1.2 M euro research consortium to develop economic ethanol production from paper pulp
through the use of know-how and infrastructure in the French forest products industry[71]
.
A number of other biotech companies, including the Diversa Corporation (San Diego,
California), Codexis Inc. (Redwood City, California), Athenix Corp. (Research Triangle
Park, North Carolina) and the J. Craig Venter Institute (Rockville, Maryland) are
undertaking research and development with cellulase enzymes.
Genetic engineering approaches to developing improved microorganisms for fermentation
have been undertaken by various laboratories. Genetically modified microorganisms
generally tend to be less robust than the conventional wild organisms, and in some cases
lead to lower ethanol yields from glucose; hence some of the increased ethanol yields from
the C5 sugars will be offset by the poorer yields from the C6 sugars. The ethanol
concentration in lignocellulosic-to-ethanol fermentation beer may be limited to 3-5%,
requiring significantly higher quantities of steam compared to the grain based option
fermentation option (6-12%).
Some of the key lignocellulosic process developers are:
Iogen Corporation, Based in Ottawa, Canada (reportedly using continuous dilute
acid pre-treatment and enzyme hydrolysis of cellulose). A 3-
4 ML/y pilot plant started operation in 2004, but is being
operated at only 25% of this capacity. Iogen is currently
looking to attract C$400 M for a full scale production plant
to use 700,000 t/y of straw and other agricultural wastes to
produce 220GL/y of ethanol. It was claimed (in 2005) that
ethanol can currently be produced from the straw at C40c/L,
but that Iogen want to reduce this to C32c/L eventually[10]
.
Swan Biomass Company A spin off company from Amoco), near Chicago, Illinois
(dilute acid pre-treatment followed by simultaneous
saccharification and fermentation). Like Iogen, Swan
Biomass carried out some pilot plant investigations at
NREL’s facilities in the 1990s, and have worked with
molecular geneticists at Purdue University to produce
genetically engineered yeasts that produce at least 30% more
ethanol from plant material than the unmodified version of
the yeast[72]
. Although little recent information has been
published, the company has been pursuing at least one major
project – a possible US$300 M sugar cane based ethanol
facility in the Imperial Valley of Southern California, with a
planned ethanol production of 300ML/y[73]
.
Arkenol Fuels Based in Irvine, California) has developed a concentrated
sulphuric acid hydrolysis process, and claims that it will use
a “naturally occurring yeast” that can efficiently co-ferment
C5 and C6 sugars[74]
. Although early interest focussed on
agricultural field crop residues, interest has now moved to

148
the use of “green” material (tree trimmings, yard wastes,
etc), and other urban wood wastes (MSW) that currently go
to landfills or composting. This has resulted from the
apparent difficulty in financing projects based on the crop
residues. Several years ago, Arkenol licensed its technology
to JGC Corporation in Japan, which built a 2 t/d (waste
wood) pilot plant in Izumi. This plant has operated for 3
years, producing 265 l/t waste wood. JGC plans to build
small plants around Japan, and possibly in Thailand and
Indonesia.
BC International Recently renamed to Celunol Corporation, based in Dedham,
Massachusetts plans to commercialise its proprietary dilute
acid hydrolysis technologies to produce ethanol and other
specialty chemicals in biomass refineries. In 1995, BCI
secured an exclusive worldwide licence from the University
of Florida (UFL) to commercialise the mixed sugars
fermentation technology based on their genetically
engineered bacteria (E.coli). Although a number of problems
have been experienced in their attempts to commercialise the
technology (supported by an US$11 M grant from the US
DOE), BCI has reported its intention to go ahead with plans
to build a 380 ML/y ethanol plant in Louisiana using the
UFL bacteria[75]
.
Abengoa Bioenergy A subsidiary of Abengoa S.A. (Spain) is the largest ethanol
producer in Europe, and is now building a 5 ML/y wheat
straw-to-ethanol plant at Salamanca, with start up scheduled
for late 2006[76]
.
Masada OxyNOL Based in Birmingham, Alabama apparently is no longer in
business as its only project was for sale in 2004 after the
main financial backer died[77]
. Masada had been promoting
an MSW-ethanol project at Middletown, New York based on
sulphuric acid hydrolysis. The large tipping fees and
additional revenue from recycled materials associated with
the MSW feedstock would obviously play a key role in the
economic viability of this operation.
Agrol BioTechnologies Ltd Based in Surrey, UK, this company plans to commercialise
biomass refining based on the patented thermophyllic bacillis
strains developed at Imperial College[78]
.
Novozymes This Denmark based company has announced plans to
collaborate with the China Resources Alcohol Corporation
(CRAC) in developing cellulosic ethanol. Both parties have
signed a three year development agreement, and, as an
extension of this agreement, CRAC plans to build a pilot
plant for cellulose ethanol in Zhaodong, China[79]
.
Xethanol Corporation Have recently announced[80]
it will construct a 190 ML/y
cellulosic ethanol plant, scheduled for operation in mid 2007,
on the site it is acquiring from Pfizer pharmaceutical in
Augusta, Georgia, USA. The plant is being designed to run
on a variety of feedstocks from the local forest products
industry, so that they can run at capacity when production

149
begins in mid 2007. By combining Xethanol’s proprietary
technologies with those of Praj, they believe they can
produce low cost ethanol.
Other players Lignol Innovations (Vancouver, Canada) and ICM (through
partnerships with Genencor and Novozymes). These two
groups are planning to further develop their R&D interests in
this area.
Note, although lignocellulosic-to-ethanol economics have not yet been established with
any real reliability, predicted capital costs have generally been estimated to be 2.4 to 4
times that of a grain based ethanol plant[81]
. The lower figure (2.4x) represents the
somewhat optimistic scenario projected by NREL for a mature version of their (yet
unproven) technology using the Z. mobilis microorganism. One of the key factors in the
overall economics will be the delivered cost of feedstock material. Credits that may be
applicable for tipping fees (where feedstocks are otherwise taken to waste facilities) have
been recognised as making a significant contribution to reducing operating costs for this
plant option.
The US EPA Act 2005, which promises substantial governmental assistance to commercial
lignocellulosic based plants, is likely to provide a strong incentive for scale up of
laboratory scale processes currently under development. As noted above, five major
process developers, Iogen, Swan Biomass, Arkenol, BCI and Xethanol appear to moving
toward substantial sized plants.

150
6. TECHNOLOGY SUPPLIERS
Although there are a large number of ethanol plants in operation around the world, it
appears that these have generally been supplied by a limited number of technology
companies with specialised expertise in various aspects of the technology, plant design,
training and operation. With the recent interest in the potential expansion of the ethanol
market in Australia, interested parties have tended to work with existing international
companies to utilise the experience and expertise gained in other parts of the world.
Whilst confidentiality limits specific details in relationships between some of these
companies and potential customers, several companies are exploring participation in the
Australian market. A brief background on some of these technology companies is
summarised below, as a basis for demonstrating the expertise and experience available. It
is not intended to present an exhaustive list, but to outline the involvements known to exist
in some of the proposed Australian developments.
6.1. ICM Inc.
ICM Inc. is a process engineering company founded in 1995 and based in Colwich,
Kansas, and is probably the leading dry milling ethanol process technology supplier in the
USA, having supplied the technology for some 37 plants in operation and 29 additional
plants under construction[38,82]
. In the USA, ICM’s plant construction partner is Fagen Inc.,
which is based in Granite Falls, Minnesota. ICM have supplied two coal-fired bubbling-
bed fluidised bed combustion (BFBC) boiler units for plant steam, as an alternative to
natural gas-fired boilers. ICM has not been involved in the design of wet milling plants.
6.2. Delta-T Corporation
The Delta-T Corporation, based in Williamsburg, Virginia, was formed in 1984, based on
molecular sieve technology for dehydrating ethanol. Delta-T apparently built the first
commercial molecular sieve unit for the vapor-phase dehydration of ethanol, to offer an
alternative to the conventional azeotropic distillation process, and the company claims that,
today, its molecular sieve units are drying and purifying alcohol at over 50 installations
worldwide.
Delta-T provides technology, plants, systems, and services to the fuel, beverage, industrial,
and pharmaceutical alcohol markets. It claims to have provided expertise in producing,
drying and purifying alcohol at over 70 international sites. The company recently formed
an alliance with (TIC) The Industrial Company (industrial plant construction) and T.E.
Ibberson (detailed engineering design and grain handling). Delta-T are reported[83]
to be
providing the ethanol technology for the planned Primary Energy plant at Gunnedah, with
the anaerobic digester design coming from Europe[84]
. It is reported that Delta-T has 10
ethanol plants under construction at present (July 2006), in the US and Canada[85]
.
6.3. Broin Companies
Broin Companies is a group based in Sioux Falls, South Dakota, and is reported to be the
second largest supplier of ethanol plants in the industry. Broin has been in the ethanol
industry 20 years, and has designed and constructed 23 operating ethanol plants, with a
further nine currently under construction or development. By mid 2007, the Broin
Companies will have annualised production exceeding 3.8 Gl of ethanol[86]. Broin are
reported to have 3 new plants under construction at present in the US and Canada[85]
.

151
6.4. Katzen International Inc.
Katzen International Inc is based in Cincinnati, Ohio, and has been a prominent process
engineering company in the fermentation and related chemical engineering fields since Dr.
Raphael Katzen founded the company in 1955. Katzen International built one of the early
large-scale corn-to-ethanol plants (230 ML/y) in South Point, Ohio (commissioned in
1984). Katzen was also prominent in numerous assessments of converting lignocellulosic
feedstocks to ethanol in the 1980s and 1990s. While Dr Katzen retired from the company
in the 1990s, Katzen International remains active in the ethanol and sugar fields
worldwide. One new plant is reported to be under construction in the US at present[85]
.
6.5. Vogelbusch GmbH
Vogelbusch GmbH is based in Vienna, Austria, and is a major global player in the
engineering and construction of plants for bioethanol production. The Houston based
subsidiary Vogelbusch U.S.A. Inc. has supplied some 14 ethanol plants in the United
States with a total capacity of 2.7 GL/y, and has an additional 600 ML/y of capacity under
construction or design. Vogelbusch was also a pioneer in the development of molecular
sieve dehydration of ethanol[87]
. Grainol have reported that they intend to use Vogelbusch
(in conjunction with Vireol of Great Britain) for their proposed plant in Western
Australia[88,89]
.
6.6. Praj Industries
Praj Industries started in India in 1984, with the objective of providing designs and
equipment to the distillery industry, based on the assumption of the Indian sugar industry
being the backbone of the rural economy, and that there was a big future for added value
for the industry through ethanol and other co-products. Praj offers solutions for distillery
and brewery wastewater treatment and utilisation, and has spread its reach beyond India to
over 30 countries. The company claims to be one of the world's largest suppliers of
molasses based distillery technology, plant and equipment, and offers packages for
multiple feedstocks, including cane molasses, cane juice and filtrate, starch based raw
material like corn, sorghum, wheat, tapioca, and tropical sugar beet[90]
.
6.7. Bioscan A/S
Bioscan A/S, based in Odense, Denmark, produces biodigesters for a wide range of
applications and has considerable experience in the technology and operation of large scale
systems in ethanol and related agricultural installations. The BIOREK® process and
associated technology developed by Bioscan was designed and built for large scale
livestock (primarily swine) operations, and can be used in any process where large
amounts of organic materials, sludges and municipal, agricultural or food wastes are
produced.
The BIOREK® process utilises an ultra-filtration system which allows for continuous
recycling of undigested organics, as well as reclamation and re-introduction of active
organic enzymes. Reverse osmosis is used to produce potable water.
Application of biodigesters to process ethanol stillage and produce biogas (typically
around 55% methane and 45% carbon dioxide), organic fertilisers, aqueous ammonia and
potable water is a fairly recent innovation, and offers an alternative to producing the
conventional distillers grain products.
Bioscan technology will be utilised by Primary Energy Pty Ltd in their proposed plants in
Kwinana, Brisbane and Gunnedah.

152
The Econcept Bio-Energy Corporation of Kelowna BC in Canada are promoting their
ENVIROPLUS™ biodigestion system, which appears to be based on the Bioscan
BIOREK® technology
[91]. Econcept and Canadian based Outlook Resources have recently
announced the signing of a Memorandum of Understanding to form a new company,
Nexus Bio-Energy Corporation, to pursue the development of the ENVIROPLUS™
technology for ethanol and biogas projects.

153
7. LIFE CYCLE ANALYSES
This section of the report details the life cycle analysis (LCA) for a number of production
systems for ethanol in Australia. For the purposes of this study, only GGEs, and the
consumption of resource energy and fresh water, will be considered in the LCAs. A
description of these LCA indicators , as well as an overview of the systems studied , are
given below.
LCA Indicators
It should be noted that these indicators are proxies for a wide range of impacts -
environmental and resource depletion:
Resource energy relates only to fossil energy inputs, since they contribute to
depletion of fossil energy resources. It is expressed as GJ consumed to produce the
functional unit (in this study, either 1 tonne of grain, 1000 litres of ethanol, or 1 GJ
of delivered energy by combustion of the ethanol). The resource energy for each
fuel type/energy source is calculated on a “GJ/GJ of delivered energy” basis; this
value is calculated from the resource in the ground, through to the energy form
delivered to the production system for the functional unit. Solar energy used for
growing the grain is excluded, since it does not represent a depletion of energy
resources.
GGEs are emissions of gases into the atmosphere that affect the temperature and
climate of the earth's surface; the main ones are carbon dioxide (CO2), methane
(CH4) and nitrous oxide (N2O). These gases (in particular, CO2 and CH4) are
generated in the production and combustion of fossil fuels, with nitrous oxide
produced, eg, from the use of nitrogenous fertilisers. Each of these gases has a
different weighting in terms of their impact on heat retention in the atmosphere:
with carbon dioxide as unity, methane has a value of 21, and nitrous oxide a value
of 310. The overall impact is quantified on a “tonnes of carbon dioxide equivalent”
basis, expressed as t CO2-e. When inputs to the process contain carbon sequestered
from the atmosphere (eg biomass in general, and grain in particular for this study),
the GGE value represented by this is taken to be a credit in the LCA methodology,
ie it appears as a negative value.
Water consumption relates to the amount of fresh water used in the production of
fertilisers, fuels, etc (in the form of process water), and is used to quantify the
depletion of fresh water resources. It is expressed on a volume per functional unit
basis, eg m3/t of grain, or per kl of ethanol. The water falling as rain on crops is not
included, since this water is not considered to be available as run off, allowing
collection and use, eg for domestic or more intensive agricultural purposes.
However, estimates for the water required for growing of the grain is noted in the
relevant section for comparison with process water consumption.
Systems Studied
The systems studied are:
The production and storage of the grains (wheat and sorghum).
The production of ethanol with 7 variants for the range of by-products, for each of
the grains.
The production of the two grains being used in the study, wheat and sorghum, have been
considered independently to enable ease of comparison with an MLA sponsored LCA

154
study currently underway at the University of New South Wales, examining the grain-to-
feedlot process chain.
This study is based on a hypothetical ethanol production facility located in Gunnedah,
NSW, with an assumed plant capacity of 160 ML/year of ethanol. It is assumed that the
grain production is in the Tamworth/Gunnedah region (transported to Gunnedah for
storage). This location was chosen by the MLA as representative of a large grain growing
region, with scope for ethanol production.
For ethanol production, 2 grain feeds will be used: 100% wheat, and 100% sorghum. Both
wet and dried distillers grain options will be considered.
The wet distillers grain options include:
The sale of wet distillers grain to feedlots at 70% moisture
Biodigestion to produce fuel gas for the process with some electricity for export to
the grid (using two alternative generation technologies of different efficiencies)
The combustion of wet distillers grain to produce electricity for the process, as well
as export electricity (using two alternative generation technologies of different
efficiencies).
The dry distillers grain scenarios only cover the drying of the distillers grain to be sold to
feedlots at 10% moisture. This can be carried out with either conventional drying (lower
energy efficiency), or with new, higher efficiency drying technology.
In carrying out the LCA, fertiliser by-products from biodigestion will also be included as
credits.
Therefore, the cases studied were:
Case 1 WDG direct to feedlot.
Case 2 DDGS with conventional drying.
Case 3 DDGS with high efficiency drying.
Case 4 Anaerobic digestion, with gas engine electricity generation (33%
efficiency).
Case 5 Anaerobic digestion, with NGCC electricity generation (50% efficiency).
Case 6 WDG for electricity generation by fluidised bed combustion (20%
efficiency).
Case 7 WDG for electricity generation using integrated drying and gasification
combined cycle (40% efficiency).
The life cycle inventories were carried out using the CSIRO Xe model, and, unless
otherwise noted, the associated database was used for all of the sub-systems; eg grid
electricity, fuels, some fertilisers.
7.1. Grain Production
While the technology for ethanol production is described in detail in Section 2.2, it is
useful to provide some comments on grain production in the context of this LCA.
Grain crops in the Gunnedah area are typically not irrigated: all water for grain production
is therefore assumed to be from natural rainfall (ie dryland cropping). It is assumed that a
stubble retention practice is used; this reduces erosion and conserves water and nutrients
(compared to some overseas practices of stubble harvesting or burning).

155
In grain production, in addition to the carbon dioxide emissions associated with the use of
fossil fuels for soil preparation, seeding, spraying of herbicides and pesticides, and
harvesting, there are substantial emissions of nitrous oxide from nitrogenous fertiliser
application and land disturbance.
In addition, CO2 from the atmosphere is sequestered as forms of carbon in the grain.
Although all sequestered CO2 is ultimately released back into the atmosphere through
combustion of the ethanol and from other steps in the life cycle, its inclusion is required by
LCA methodology, and enables the GHG effects of ethanol to be correctly calculated for
comparison with the fuel it is intended to displace (ie petrol). Note that the GGE results for
grain production will be given with and without the allowance for CO2 sequestration by
the grain, for the purposes of comparison with other studies.
Functional Units
In establishing the basis for the LCA, it is important to define the functional unit(s),
options to be considered, and the related boundary conditions. This study is a cradle-to-
gate analysis for the production of 1 tonne of dried grain in storage; both wheat and
sorghum are considered separately.
System boundary
The system boundary for the life cycle analysis for the production of 1 tonne of grain,
whether wheat or sorghum, is shown in Figure 6. The boundary considers inputs required
for grain cultivation and harvesting, grain transport to the storage silo in Gunnedah, and for
handling and maintaining grain within the silo. It is assumed that there is only a modest
drying requirement for part of the summer grain crop (further discussed below).
In addition, direct emissions at the farm site are calculated (eg tractor and harvester fuel
consumption and emissions, and nitrous oxide emissions from the use of nitrogenous
fertilisers).
The consumption of resources, (energy and water), and the emissions of greenhouse gases,
(on a CO2 equivalent basis), are then totalled and attributed to 1 tonne of dried and stored
grain.

156
Grain cultivation and
harvesting
Grain drying and storage
Grain transport
Emissions to
air
Waterzv
Seed
Fertilisers
Herbicides
Tractor fuel
Electricity
Fuel for
transport1 tonne
grain
Emissions to
land
Emissions to
water
Figure 6 System boundary for LCA of grain production
Fertilisers and consumables
A summary for the usage of fertilisers, herbicides and diesel for wheat and sorghum grown
in the Gunnedah region are shown in Table 6. It should be noted that the data for fertilisers
used in wheat growing has been based on advice from the District Agronomist (total of
60kg N/ha), rather than the significantly higher values for fertiliser use given in the DPI
Farm Enterprise Budget Series data sheet (2006) for the North East Region.
Table 6 Fertiliser, herbicide and diesel use per tonne of grain[92,93]
Input Usage
for 1 t wheat
Usage for 1 t
sorghum
Ammonia (82%N) kg 19.0 -
DAP (18%N, 20%P) kg 9.3 8.0
Urea (46%N) kg - 42.0
Glyphosate kg 0.7 0.5
Herbicide kg 0.3 0.7
Diesel GJ 0.34 0.24
These applications typically yield 3.5 t of wheat/ha, and 5 t of sorghum/ha for the
Gunnedah region[93]
.
The factors affecting the formation of N2O have been detailed in a report for the GRDC by
Rodriguez et al[94]
. Key factors such as soil moisture, soil temperature, amount of inorganic
nitrogen added, and soil and crop management practices (eg fallow periods), all affect N2O
emissions. It is therefore difficult to assign a specific value to N2O emissions from a grain
crop. Rodriguez et al have recommended that, as representative figures for grain

157
production, a value of 0.25 kg N/ha should be used for the loss of nitrogen as N2O due to
soil disturbance, and that the loss due to fertiliser application, whatever the form of
nitrogenous fertiliser used, be taken to be 1% of the N applied (again as N2O). These
recommended values have been used in this study.
As N2O has a Global Warming Potential (GWP) of 310 times greater than CO2, this
emission will be shown to be very significant in the overall GGEs for grain production.
Water consumption during grain production
In the present study, fresh water consumption for grain production was considered in 2
categories:
From rainfall and soil moisture, used in the growing of the grain.
Process water, obtained from various water supplies, and used in consumables
(mostly fertiliser and electricity).
For dry land crops, as assumed for this study, water used in the growing of the crop can be
from rain that falls during the growing cycle, or from soil moisture (storage of rainfall).
The total amount of water available to a crop depends on both these sources of water and
evaporation. The water use efficiency (WUE) for grain growing is dependent on a number
of factors, and has been increasing due to the greater use of nitrogen fertilisers, and more
water efficient grain varieties. CSIRO Sustainable Ecosystems[95]
has advised that
indicative WUE for wheat and sorghum is in the range 10-20 kg grain/mm H2O/ha. The
water consumptions for the grain crops are therefore in the range 500-1000 m3/t grain. The
data sheets for wheat from the NSW Department of Agriculture for Winter 2006,[96]
provide a WUE value at the bottom of this range, 9.5 kg grain/mm H2O/ha (ie
1,050 m3/t grain).
CSIRO[95]
has advised that the water required for growing of wheat in Victoria, or sorghum
in Queensland, would also fall in the above range.
Data for the fertilisers was mostly from the Xe LCA model. Data for the production of
herbicides and pesticides has not been published, but it would be expected to be negligible,
given the amount used per tonne of grain (an assumption made in previous studies by
others).
Transport
There are a number of transport inputs:
Delivery of fuel and fertilisers to the farm.
Delivery of grain from the farm to the storage silo; an average distance of 70 km
(assumes that grain is received from within a radius of 100 km).
For fertilisers, in order to represent average Australian figures, the transport emissions and
energy requirements are based on the percentage of fertiliser that is imported, relative to
that which is produced in Australia. For the portion that is sourced from overseas, the
assumed freight distance is 15,000 km by sea, and 350 km by road. For locally produced
items, the transport distance is assumed to be 350 km by road (Newcastle to Gunnedah).
Table 7 shows the percentages of each material imported, or supplied, from Australian
sources.

158
Table 7 Transport breakdown for farm consumables
Product Imported
%
Australian
%
Ammonia 0 100
Monoammonium phosphate 79 21
Diammonium phosphate 34 76
Urea 85 15
Diesel 0 100
The resource energy and GGE factors for the transportation steps are shown in Table 8.
Water consumption is assumed to be insignificant.
Table 8 Transport resource energy and GGEs
Transport mode Vehicle Resource energy
(MJ/t.km)
GGE emissions
(kgCO2-e/t.km)
Road[97]
20 t diesel tanker 1.0 0.07
Road[97]
19 t diesel flat-top 1.1 0.08
Sea[98]
20,000 t bulk carrier 0.1 0.007
In this analysis, for road transport, one way operation was assumed, with the vehicle
returning empty. In practice, back loading could be applicable, but would only make a
small contributor to the LCA KPIs.
Farm machinery
It is assumed that the average tractor requirement is 0.635 tractor-hour/ha per season, for
land yielding 3.5 t of wheat or 5 t sorghum. The fuel consumption is assumed to be 48 L/h.
These figures are based on data from the NSW DPI. Diesel fuel is assumed to have an
energy density of 38.6 GJ/m3, with a GGE factor of 69 kg CO2-e/GJ from combustion.
While the energy required to make the machinery used on the farm is normally considered
to be minor, and is usually ignored, Graboski[99]
has made an estimate for corn production
in the USA. His value of 0.32 GJ/ha for the energy embodied in farming equipment has
also been verified by a major recent University of California study[100]
, and has been used
in the present study.
Grain Storage
There are a number of activities[101]
associated with the storage of grain that involve the
use of energy, and some small amount of fumigant. These are discussed below, and the
figure used for the LCA are given in Table 9.
For ventilation, aeration-cooling electrical energy costs are typically 20-50c/t for winter
crops for a season (6 to 9 months of storage). At a nominal power cost of 15c/kWh, the
pro-rata electrical energy consumption is 1.3-3.3 kWh/t of storage.
For aeration-drying, electrical energy costs range from $3.5-$10/t for removing 4% points
of moisture from a summer crop in typical farm stores (usually less than 120 t capacity). At
the nominal power cost of 15c/kWh, the corresponding electrical energy consumption is
30-67 kWh/t.
If additional drying is required, there are a number of different drying systems fired by
diesel or gas, and these generally result in a 33-150% increase in drying energy over that

159
for aeration drying. Drying equipment is not commonplace for all tonnage cropped in
Australia, and is regional, so you could ignore this figure for an Australia wide estimate.
However, for the New England and Liverpool plains areas where summer crops (eg
sorghum) are more prevalent, it is estimated that 33 to 50% of properties regularly use
some form of drying for summer crops (but not as much for winter crops).
Conveying and handling energy costs are typically 10-40c/t per transfer on-farm. For
several transfers at 15c/kWh. An average equivalent electrical energy consumption was
assumed.
Fumigant (phosphine) is applied per volume of store, with one or two fumigations per
season (1.375 g of phosphine per tonne per fumigation). This has not been included in the
LCA, again due to lack of production information, and the insignificant mass of fumigant.
The values for electricity use for storage and handling are given in Table 9.
Table 9 Storage energy requirement (kWh/t of grain)
Wheat Sorghum
Ventilation 2.3 2.3
Aeration drying - 25
Conveying/handling 3.4 3.4
Total (kWh/t) 5.7 30.7
In the study it is assumed that 50% of the sorghum requires aeration drying. No allowance
has been made for drying of wheat.
Fertiliser production
The data for the production of the fertilisers and herbicides mentioned is mostly based on
information from prior CSIRO[102]
studies. Table 10 shows major energy consumption by
source for fertilisers, pesticides and herbicides.
Table 10 Consumables for the production of 1 tonne of fertilisers, herbicides and pesticides
Material Electricity
(MWh/t)
Natural Gas
(GJ/t)
Fuel oil
(GJ/t)
Ammonia103
0.08 31.6 5.33
MAP a 0.04 0.33 -
DAP a 0.03 0.29 -
Urea b 0.17 3.91 -
Glyphosate 14.8 111 55.9
Other herbicides/pesticides 5.08 41.4 83.6
Table 11 shows the equivalent total resource energy, GGE emissions and water
consumption data per tonne of product.
a Note that ammonia and phosphoric acid are inputs for MAP and DAP production. The values shown in this
table are direct consumables for MAP and DAP production rather than lifecycle values. b Note that ammonia is an input for the production of urea. The values shown in this table are direct
consumables for urea production, rather than lifecycle values.

160
Table 11 Resource energy, GGEs and water per tonne of fertilisers, herbicides and pesticides
Material Resource energy
(GJ/t)
GGE emissions
(tCO2-e/t)
Water
(kL/t)
Ammonia 44.9 2.03 25.2
MAP 12.0 0.69 10.8
DAP 19.6 1.0 14.1
Urea 31.6 1.59 14.5
Glyphosate 340 21.4 22.6
Other herbicides/pesticides 194 10.1 7.6
Energy and emissions factors for main fuel sources
The major energy sources used in the production of fertilisers, grains and ethanol are
natural gas, fuel oil, diesel and electricity. For NSW conditions, the resource energy and
GGE for the sub-systems of each energy source, are given in Table 12.
Table 12 Resource energy used per GJ of delivered energy
Energy Source Resource energy
(GJ)
Total
(kg CO2-e/GJ)
NG 1.08 64.0
Fuel oil 1.15 84.1
Diesel 1.15 80.7
Electricity 1.89 268
7.2. Ethanol production
LCAs are affected by the choice of system boundaries, the functional unit, by-products,
and how the impacts from these are allocated. In the present study, credits for the by-
products have been allocated to the main product or functional unit (ie 1 kL of ethanol).
The credit has been calculated as the avoided impacts due to displacement of other
products. For example, production of export electricity replaces electricity from the NSW
grid, organic by-products displace nitrogen and phosphate fertilisers.
This study is based on a hypothetical ethanol production facility located in Gunnedah,
NSW, with an assumed plant capacity of 160 ML/year of ethanol. It is assumed that the
grain production is in the Tamworth/Gunnedah region (transported to Gunnedah for
storage). This location was chosen by the MLA as representative of a large grain growing
region, with scope for ethanol production.
Ethanol production was for 100% wheat, and 100% sorghum. Both wet and dried distillers
grain options will be considered. The wet distillers grain options include; biodigestion to
produce fuel gas for the process with some electricity for export to the grid, the sale of wet
distillers grain to feedlots at 70% moisture, and the combustion of wet distillers grain to

161
produce electricity for the process as well as export electricity. The dry distillers grain
scenarios only cover the drying of the distillers grain to be sold to feedlots at 10%
moisture. Fertiliser by-products from biodigestion will also be included as credits.
Functional Units
The basis for the LCA studies is a cradle-to-gate analysis for the production of 1,000 litres
of ethanol (in storage at the production plant). It should be noted that 100% ethanol is
considered, not the denatured fuel (containing a small quantity of petrol).
Case Studies
The case studies considered for the ethanol production stage are shown in Table 13 below.
Table 13 Case studies considered for the ethanol LCA
Case ID Comments
1 WDG WDG direct to feedlot.
2 DDGS DDGS with conventional drying.
3 DDGS – HE drier DDGS with high efficiency drying.
4 AD – ICE Anaerobic digestion, with gas internal combustion engine electricity
generation (33% efficiency*).
5 AD – GTCC Anaerobic digestion, with gas turbine combined cycle electricity
generation (50% efficiency).
6 WDG-FBC WDG for electricity generation by fluidised bed combustion (20%
efficiency).
7 WDG-IDGCC WDG for electricity generation using integrated drying and
gasification combined cycle (40% efficiency).
* all thermal efficiencies are on a higher heating value basis (HHV)
These cases were investigated for both wheat and sorghum (ie 14 cases in total), with the
case study numbers modified with an added w or s, respectively.
System Boundaries
The system boundaries for ethanol production encompass all raw materials and associated
energies that are used in the production of the grains, as well as in the production of any
consumables utilised as part of ethanol production. It is assumed that the life cycle impacts
associated with the construction of the plant, and any associated equipment is negligible,
and is not considered in this study; this is based on the resource energy value derived by
Graboski[99]
for such capital items for a biorefinery, of 40 MJ/kL of ethanol (ie <0.2% of
the energy content of the produced ethanol).
The system boundaries for the above case studies are shown schematically below.

162
Figure 7 System boundary for LCA of ethanol production c
c Note: For the AD cases, separate data is not available for the centrifuge step. As a result, the AD values
include any contribution for this source. This is expected to be insignificant in the overall context.

163
Credits - electricity
The electricity credits depend on the amount of export electricity generated by the plant
(depends on the amount of stillage and the efficiency of generation), and the LCA
indicators for the grid electricity. In practice, the latter will be location dependent.
However, for the purposes of this study, State grid average indicator values have been
used.
For cases involving the biodigestion and/or combustion of WDG, there is excess electricity
for sale to the grid – this is taken to have a credit for resource energy, GGEs and water,
equivalent to those that apply to electricity supplied by the NSW transmission grid
(averaged).
If located in other states, for example in Queensland (sorghum based), or in Victoria
(wheat based), the indicator values will be significantly different[104]
as given in Table 14.
Table 14 Impacts for 1 MWh of electricity from the transmission grid
NSWd Queensland
e Victoria
d
Resource energy (GJ) 10.41 10.91 13.74
GGE (t CO2) 0.965 0.983 1.437
Fresh water (m3) 1.51 1.83 2.45
The study has assumed 4 types of generation technology, according to fuel type (gas or
solid), and the effect of this on overall thermal efficiency.
When electricity is generated, the waste heat is used for the majority of heating and steam
raising, thereby reducing or eliminating the need for natural gas. It is assumed that 65% of
the waste heat energy from the power plant is recovered as steam, and is used to displace
the natural gas requirement of the plant (assuming a NG to steam energy conversion
efficiency of 80%).
Cases 4w and 4s assume that the electrical efficiency for a gas internal combustion engine
is 33%, which is sufficient to supply all of the plants electricity requirement and heating
(NG) requirements. Cases 5w and 5s assume that a higher efficiency gas turbine with
combined cycle is used, with an electrical efficiency of 50%.
Cases 6w/s and 7w/s deal with the combustion of the WDG by-product, rather than selling
it, in either the dry or wet form, to feed lots. Cases 6w and 6s consider that the energy
available in the WDG is 5.5GJ/t at 70% moisture, and that the efficiency of conversion to
electricity is 20%, whereas Cases 7w and 7s consider the same energy content in grain, but
an electrical efficiency of 40%.
Credits – distillers grain
For those cases involving DDGS and WDG, the yield of these products per kL of ethanol
are given in Table 15. The yields are derived directly from Table 4.
d For year ending December 2003; no contribution from SMHEA or interstate transfers
e For year ending June 2004; no contribution from interstate transfers

164
Table 15 Yield of distillers grain
By-product Unit Wheat Sorghum
WDG t 3.0 1.94
DDGS t 1.0 0.65
This study assumes that a market may exist for both wet as well as dry distillers grain, and
hence Cases 1w and 1s have also been included. The decision to consider the sale of WDG
is based on the fact that this currently occurs in the USA. From a life cycle point of view, it
is assumed that the credits for the DDGS and WDG are the same, due to the same amount
of dry matter being present in each case. However, there will be a difference in the
environmental impact for transport of WDG relative to DDGS on an energy content basis,
due to the transport of the extra water in the case of WDG. All values are shown on the
basis of the production of 1kL of ethanol.
For Cases 2w and 2s, the energy required for WDG drying is based on current plant data
(2.25 MW of electricity and 1,070 TJ/y of natural gas to produce 18 t/h DDGS). As these
energy consumptions are for standard rotary drum drier technology, a higher efficiency
process has been used for Cases 3w and 3s. It was assumed that drying energy can be
reduced by 50% with advanced technology (cf lignite drying).
Credits - fertiliser values
For Cases 4 and 5 (anaerobic digestion of the stillage), there are a number of intermediate
products (italicised), and by-products, from anaerobic digestion. The quantities of these co-
products produced per kL of ethanol are shown in Table 16.
Table 16 Anaerobic Digestion - intermediates and by-products
By-product Units Wheat
(Case 4w)
Sorghum
(Case 4s)
Wheat
(Case 5w)
Sorghum
(Case 5s)
WDG t 3.0 1.94 3.0 1.94
Digestible solids kg 903 582 903 582
Methane GJ 12.4 8.0 12.4 8.0
Electricity MWh 0.99 0.6 1.58 0.98
Fertiliser NPK(6%-8%-8%)
(MAP equivalent)
t 0.33
(0.24)
0.21
(0.15)
0.33
(0.24)
0.21
(0.15)
Ammonia kg 25 16 25 16
Table 17 Data for combustion of WDG
By-product Wheat
(Case 6w)
Wheat
(Cases 7w)
Sorghum
(Case 6s)
Sorghum
(Case 7s)
WDG (t) 3.0 3.0 1.94 1.94
Electricity (MWh) 0.77 1.69 0.46 1.05

165
The by-product values from Table 16 and Table 17 are used to calculate credits for the
respective LCA cases. The factors used for these credits are shown in Table 18.
Note that the composition of the organic fertiliser is approximately 8% nitrogen and 8%
phosphorus. The basis for assigning a credit for this material is the nitrogen content.
monoammonium phosphate, (11% nitrogen), is used as the substituting fertiliser which
results in 100kg of organic fertiliser being equivalent to 73 kg of MAP. The numbers for
the quantity of fertiliser quoted below are those for the 8% fertiliser, for which externalities
are applied based on MAP.
Note also that the greenhouse gas emissions credits applied to feed grain are negative. This
is a consequence of the fact that grain production is a net consumer of CO2.
In addition, the credit applied to the DDGS is based on 85% of the values for the grain,
since it has:
A lower starch content, but is higher in protein and fibre, and
About 85% of the metabolisable energy content of the original grain (under
11 MJ/kg dry mass for DDG, compared with around 13 MJ/kg dry mass for the
feed grain).
As the moisture content of WDG is 70% and for DDGS is 10%, three tonnes of WDG is
required to yield one tonne of DDGS. Therefore, the credit applied to WDG as a feedstock
for cattle is 28.3% of the value for grain.
Table 18 Factors used for system displacement credits
Material Units
Resource energy
(GJ/unit)
GGE emissions
(tCO2-e/unit)
Water
consumption
(m3/unit)
Electricity (NSW) MWh 10.41 0.965 1.51
Anhydrous ammonia t 44.9 2.03 25.2
MAP t 12.0 0.69 10.8
Wheat t 1.91 -1.21 0.61
Sorghum t 2.46 -1.13 0.74
7.3. LCA results
In comparing LCA results from different climatic regions, and countries, it must be
recognised that there are considerable differences in agricultural practices (crop rotations,
fallow periods, rainfall and/or irrigation regimes), and in particular, nitrogenous fertiliser
use, which can have a large impact on resource energy, GGEs, and water consumption for
the particular grain. To this must be added the variations associated with the grain genetics.
These have a major effect on the yields, and starch content. Accordingly, the LCA results
given in this report for grain production should be considered as overall approximations,
which provide a useful understanding and assist in strategy development.
For ethanol production, there is considerably less variability, since a “standard” industrial
process is being considered. However, the biodigestion step is not normally applied in such
plants, and therefore:
The amount of by-products will vary with the grain chemistry and process
operating conditions.

166
The credits attributed to these by-products will vary with the substitutions and their
context (eg for electricity, the credit for GGEs will be far greater in Victoria than in
NSW, as shown in Table 14).
7.3.1 Grain production
For the production of one tonne of grain stored in a silo in Gunnedah, the LCA values for
resource energy, GGEs and water are given in Table 19.
Table 19 LCA for grain (1 tonne stored basis)
Impact assessment
values
Resource
energy
(GJ/t)
Non-LCA GGE
(tCO2-e/t)
(without credit for
carbon in grain)
LCA GGE
(tCO2-e/t)
(with credit for
carbon in grain)
Water
(m3/t)
Wheat 1.91 0.22 -1.21 0.61
Sorghum 2.46 0.27 -1.13 0.74
The GGE values are shown on 2 bases:
LCA GGE including both a credit for the CO2 equivalent of the carbon content of
the grain (assuming no net increase from non-grain biomass; eg straw), as well as
emissions from the use of fossil energy, nitrogenous fertiliser use, and
Non-LCA GGE with excludes the credit for the CO2 equivalent of the carbon
content of the grain. This enables comparison with studies by others, in which the
CO2 sequestered by the grain is not considered.
The results show that the CO2 sequestered in the grain is an important part of the life cycle
GGE, and reduces the GGE for grain production by around 1.4 tCO2-e/t.
It should be noted that the water consumption values given in Table 19 only relate to
process water used to produce fuels, fertilisers, etc. As noted earlier, the amount of water
for cropping is between 500 and 1000 m3/tonne of wheat or sorghum, and is assumed to be
satisfied by rainfall and soil moisture.
7.3.2 Ethanol Production
The results are presented as follows:
Resource energy
Tables giving a detailed breakdown for energy consumption for each stage in
the production chain, for wheat and sorghum cases separately.
A summary graph comparing overall energy for all 14 cases.
GGE
Tables giving a detailed breakdown for GGE from each stage in the production
chain, for wheat and sorghum cases separately.
Comparison graphs showing a breakdown for GGE from each stage in the
production chain for current practices, and for alternative drying and electricity
technologies, for both wheat and sorghum.
A summary graph comparing overall GGE for all 14 cases.
Water

167
Tables giving a detailed breakdown for process water consumption for each
stage in the production chain, for wheat and sorghum cases separately.
A summary graph comparing overall process water for all 14 cases.
Resource energy
The contributions along the processing chain are shown in Table 20 (wheat) and Table 21
(sorghum), and a summary graph for overall production is given in Figure 8.
Table 20 Resource energy for wheat based cases (GJ/kL ethanol)
1w 2w 3w 4w 5w 6w 7w
WDG DDG DDG-HE
drier AD-ICE AD-
GTCC
WDG-
FBC
WDG-
IDGCC
Fertiliser/pesticide 3.48 3.48 3.48 3.48 3.48 3.48 3.48
Fertiliser degradation - - - - - - -
Farming machinery 0.27 0.27 0.27 0.27 0.27 0.27 0.27
Diesel for agriculture 0.92 0.92 0.92 0.92 0.92 0.92 0.92
Transport 0.19 0.19 0.19 0.19 0.19 0.19 0.19
Grain storage 0.16 0.16 0.16 0.16 0.16 0.16 0.16
Ethanol production 9.23 9.23 9.23 0.32 2.19 - -
WDG drying - 8.61 4.30 - - - -
Anaerobic digestion - - - - - - -
Electricity generation - - - - - - -
Other 0.21 0.27 0.27 0.27 0.29 0.22 0.26
Total no credits 14.5 23.1 18.8 5.61 7.50 5.24 5.28
Electricity credits - - 0 -10.3 -16.4 -8.0 -17.6
Ammonia credits - - 0 -1.12 -1.12 - -
Fertiliser credits - - 0 -2.88 -2.88 - -
Feed grain credit* -1.62 -1.62 -1.62 - - - -
Total 12.8 21.5 17.2 -8.69 -12.9 -2.76 -12.3
* based on the amount of grain replaced in the cattle feed mixture by the distillers grain

168
Table 21 Resource energy for sorghum based cases (GJ/kL ethanol)
1s 2s 3s 4s 5s 6s 7s
WDG DDG
DDG-
HE drier AD-ICE
AD-
GTCC
WDG-
FBC
WDG-
IDGCC
Fertiliser/pesticide 4.22 4.22 4.22 4.22 4.22 4.22 4.22
Fertiliser degradation - - - - - - -
Farming machinery 0.15 0.15 0.15 0.15 0.15 0.15 0.15
Diesel for agriculture 0.58 0.58 0.58 0.58 0.58 0.58 0.58
Transport 0.17 0.17 0.17 0.17 0.17 0.17 0.17
Grain storage 0.80 0.80 0.80 0.80 0.80 0.80 0.80
Ethanol production 8.27 8.27 8.27 0.28 1.96 - 1.21
WDG drying - 5.79 2.9 - - - -
Anaerobic digestion - - - - - - -
Electricity generation - - - - - - -
Other 0.06 - 0.07 0.17 0.16 0.12 0.13
Total no credits 14.25 19.98 17.16 6.37 8.04 6.04 7.26
Electricity credits - - - -6.26 -10.2 -4.79 -10.9
Ammonia credits - - - -0.73 -0.73 - -
Fertiliser credits - - - -1.84 -1.84 - -
Feed grain credit* -1.36 -1.36 -1.36 - - - -
Total 12.9 18.6 15.8 -2.46 -4.73 1.25 -3.64
* based on the amount of grain replaced in the cattle feed mixture by the distillers grain
-15
-10
-5
0
5
10
15
20
25
Whe
at-W
DG
Sor
ghum
-WDG
Whe
at-D
DGS
Sor
ghum
-DDG
S
Whe
at-D
DGS -
HE d
rier
Sor
ghum
-DDG
- HE d
rier
Whe
at-A
D -
ICE
Sor
ghum
-AD -
ICE
Whe
at-A
D -
GTC
C
Sor
ghum
-AD -
GTC
C
Whe
at-W
DG
- FBC
Sor
ghum
-WDG -
FBC
Whe
at-W
DG
- ID
GCC
Sor
ghum
-WDG -
IDG
CC
Reso
urc
e e
nerg
y (
GJ/k
l)
-15
-10
-5
0
5
10
15
20
25
Figure 8 Overall resource energy consumption per kL of ethanol

169
From these results, the following conclusions can be drawn:
For grain production (whether wheat or sorghum), fertiliser production is the major
component (70%) of resource energy, with the fuel for agricultural activities of
secondary importance: 20% for wheat, and only 10% for sorghum (due to its
higher grain yield). Transport and storage of grain are only small contributors (3-
10%).
When the grain is processed to ethanol, the resource energy is very dependent on
the processing of the stillage, and what by-product credits are applicable:
For the simplest case, direct sale of WDG, the resource energy is considerably
lower than that for DDG, due to the large amount of energy required for drying.
This difference is considerably reduced if a high efficiency drying process is
used.
When the stillage is anaerobically digested, the resource energy also becomes
negative, since there is no requirement for purchased electricity or natural gas
for ethanol production - the methane from biodigestion is used to make
electricity, with waste heat displacing the full requirement of natural gas. There
are also significant credits for by-product fertilisers and exported electricity.
If the WDG is combusted to produce electricity (requires a technology similar
to high moisture lignite or biomass), a negative overall resource energy is
produced. Again, there is no requirement for purchased electricity or natural gas
for ethanol production, since the waste heat from electricity generation is
sufficient to provide all required process heating. The large credit for exported
electricity (particularly for the 40% electrical conversion efficiency case),
produces a negative resource energy for the chain, from grain through to
ethanol.
It is relevant to note that the overall resource energy is similar, whether the stillage is
anaerobically digested with the methane converted to electricity at 50% efficiency, or the
WDG is directly combusted to produce electricity at an overall efficiency of 40%. In
practice, the choice of electricity generation process will also depend on the overall capital
costs, plus the ability to exploit opportunity biomass, such as straw.
GGEs
The contributions of the various stages along the processing chain, to overall greenhouse
gas emissions, are shown in Table 22 for wheat and in Table 23 for sorghum. These values
are shown graphically in Figure 9.

170
Table 22 Greenhouse gas emissions for wheat based cases (t CO2-e/kL ethanol)
1w 2w 3w 4w 5w 6w 7w
WDG DDG DDG-HE
drier AD-ICE AD-
GTCC
WDG-
FBC
WDG-
IDGCC
Grain absorptionf -3.91 -3.91 -3.91 -3.91 -3.91 -3.91 -3.91
Fertiliser/pesticide 0.17 0.17 0.17 0.17 0.17 0.17 0.17
Fertiliser degradation 0.31 0.31 0.31 0.31 0.31 0.31 0.31
Farming machinery - - - - - - -
Diesel for agriculture 0.06 0.06 0.06 0.06 0.06 0.06 0.06
Transport 0.01 0.01 0.01 0.01 0.01 0.01 0.01
Grain storage 0.02 0.02 0.02 0.02 0.02 0.02 0.02
Ethanol production 1.40 1.40 1.40 0.82 0.93 0.81 0.81
WDG drying 0 0.55 0.27 - - - -
Anaerobic digestion - - - 0.42 0.42 - -
Electricity generation - - - 0.61 0.61 1.4 1.4
Other 0.02 0.09 0.09 0.03 0.05 0.02 0.02
Total without credits -1.92 -1.30 -1.58 -1.46 -1.33 -1.11 -1.11
Electricity credits - - - -0.95 -1.52 -0.74 -1.63
Ammonia credits - - - -0.05 -0.05 - -
Fertiliser credits - - - -0.17 -0.17 - -
Feed grain credit* 1.02 1.02 1.02 - - - -
Total -0.90 -0.28 -0.56 -2.63 -3.07 -1.85 -2.74
* based on the amount of grain replaced in the cattle feed mixture by the distillers grain
f This is the amount of CO2 sequestered by the grain, calculated from the carbon content

171
Table 23 Greenhouse gas emissions for sorghum based cases (t CO2-e/kL ethanol)
1s 2s 3s 4s 5s 6s 7s
WDG DDG DDG-HE
drier AD-ICE AD-
GTCC
WDG-
FBC
WDG-
IDGCC
Grain absorptiong -3.42 -3.42 -3.42 -3.42 -3.42 -3.42 -3.42
Fertiliser/pesticide 0.22 0.22 0.22 0.22 0.22 0.22 0.22
Fertiliser degradation 0.30 0.30 0.30 0.30 0.30 0.30 0.30
Farming machinery 0 0 0 0 0 0 0
Diesel for agriculture 0.04 0.04 0.04 0.04 0.04 0.04 0.04
Transport 0.01 0.01 0.01 0.01 0.01 0.01 0.01
Grain storage 0.07 0.07 0.07 0.07 0.07 0.07 0.07
Ethanol production 1.34 1.34 1.34 0.82 0.92 0.81 0.88
WDG drying 0 0.35 0.18 0 0 0 0
Anaerobic digestion 0 0 0 0.27 0.27 0 0
Electricity generation 0 0 0 0.39 0.39 0.9 0.9
Other 0.1 0.1 0.07 0.02 0.02 0.01 0.14
Total without credits -1.34 -0.99 -1.19 -1.28 -1.18 -1.06 -0.86
Electricity credits 0 0 0 -0.58 -0.95 -0.44 -1.01
Ammonia credits 0 0 0 -0.03 -0.03 0 0
Fertiliser credits 0 0 0 -0.10 -0.10 0 0
Feed grain credit* 0.62 0.62 0.62 0 0 0 0
Total -0.72 -0.37 -0.57 -1.99 -2.26 -1.50 -1.87
* based on the amount of grain replaced in the cattle feed mixture by the distillers grain
g This is the amount of CO2 sequestered by the grain, calculated from the carbon content

172
-4
-3
-2
-1
0
1
2
3
4
Whea
t-WDG
Sor
ghum
-WDG
Whea
t-DDG
S
Sor
ghum
-DDG
S
Whea
t-DDG
S -
HE d
rier
Sor
ghum
-DDG
- HE d
rier
Whea
t-AD -
ICE
Sor
ghum
-AD -
ICE
Whea
t-AD -
GTC
C
Sor
ghum
-AD -
GTC
C
Whea
t-WDG
- FBC
Sor
ghum
-WDG - F
BC
Whea
t-WDG
- ID
GCC
Sor
ghum
-WDG - ID
GCC
GG
E (
tCO
2-e
/kl)
-4.0000
-3.0000
-2.0000
-1.0000
0.0000
1.0000
2.0000
3.0000
4.0000
Figure 9 GGEs per kL of ethanol
From these results, the following conclusions can be drawn:
The majority of the GGEs come from the nitrogenous fertiliser, and the related
quantity of nitrous oxide generated from this. However, the overall GGE is
dominated by the CO2 taken up by the grain (3.4-3.9 t CO2/kL of ethanol) through
photosynthesis. This leads to a negative GGE for all cases.
When the grain is processed to ethanol, GGE are very dependent on the method of
processing the stillage, and what by-product credits are applicable:
For the simplest case, direct sale of WDG, the GGE value is lower than that
when DDGS is the by-product, due to the emissions associated with drying.
Higher efficiency drying provides a lower GGE value, as expected. It should be
noted that the GGE increases with the feed grain credit – as this by-product
displaces feed grain, and therefore results in less CO2 being sequestered by
photosynthesis.
For anaerobic digestion of the stillage, there are lower emissions associated
with ethanol production, due to the use of combined heat and power; ie the use
of waste heat from power generation for the fermentation etc. Again, the
electricity cases, whether from AD or WDG, have similar overall GGEs.
For WDG combustion, the GGE values are far lower than those for the use of
WDG for feed, due to the displacement of grain and production of electricity.
It is instructive to consider GGEs along the processing chain. Figure 10 and Figure 11
show the cumulative values for conventional practices, for wheat and sorghum,
respectively. Figure 12 and Figure 13 show similar results for alternative drying and power
generation technologies.

173
-5
-4
-3
-2
-1
0
1
2
CO2-
e in g
rain
Fertiliser
/pes
ticid
e
Fertiliser
deg
rada
tion
Farm
ing
mac
hine
ry
Diese
l for
agr
icultu
re
Trans
port
Gra
in s
tora
ge
Eth
anol p
rodu
ction
WDG d
rying
Ana
erob
ic d
iges
tion
Elect
ricity
gen
erat
ion
Oth
er
Elect
ricity
cre
dits
Am
mon
ia cre
dits
Fertiliser
cre
dits
Feed
grain
cred
it
GG
E (
tCO
2e
q/k
l)
Wheat-WDG
Wheat-DDGS
Wheat-AD - ICE
GG
E n
eg
ative
GG
E p
ositiv
e
Figure 10 Breakdown of GGE for current practices (wheat)
-5
-4
-3
-2
-1
0
1
2
CO2-
e in g
rain
Fertiliser
/pes
ticid
e
Fertiliser
deg
rada
tion
Farm
ing
mac
hine
ry
Diese
l for
agr
icultu
re
Trans
port
Gra
in s
tora
ge
Eth
anol p
rodu
ction
WDG d
rying
Ana
erob
ic d
iges
tion
Elect
ricity
gen
erat
ion
Oth
er
Elect
ricity
cre
dits
Am
mon
ia cre
dits
Fertiliser
cre
dits
Feed
grain
cred
it
GG
E (
tCO
2e
q/k
l)
Sorghum-WDG
Sorghum-DDGS
Sorghum-AD - ICE
GG
E n
egativ
eG
GE
positi
ve
Figure 11 Breakdown of GGE for current practices (sorghum)

174
-5
-4
-3
-2
-1
0
1
2
CO2-
e in g
rain
Fertiliser
/pes
ticid
e
Fertiliser
deg
rada
tion
Farm
ing
mac
hine
ry
Diese
l for
agr
icultu
re
Trans
port
Gra
in s
tora
ge
Eth
anol p
rodu
ction
WDG d
rying
Ana
erob
ic d
iges
tion
Elect
ricity
gen
erat
ion
Oth
er
Elect
ricity
cre
dits
Am
mon
ia cre
dits
Fertiliser
cre
dits
Feed
grain
cred
it
GG
E (
tCO
2e
q/k
l)
Wheat-DDGS - HE drier
Wheat-AD - GTCC
Wheat-WDG - FBC
Wheat-WDG - IDGCC
GG
E n
eg
ative
GG
E p
ositiv
e
Figure 12 Breakdown of GGE for alternative drying and electricity technologies (wheat)
-5
-4
-3
-2
-1
0
1
2
CO2-
e in g
rain
Fertiliser
/pes
ticid
e
Fertiliser
deg
rada
tion
Farm
ing
mac
hine
ry
Diese
l for
agr
icultu
re
Trans
port
Gra
in s
tora
ge
Eth
anol p
rodu
ction
WDG d
rying
Ana
erob
ic d
iges
tion
Elect
ricity
gen
erat
ion
Oth
er
Elect
ricity
cre
dits
Am
mon
ia cre
dits
Fertiliser
cre
dits
Feed
grain
cred
it
GG
E (
tCO
2e
q/k
l)
Sorghum-DDG - HE drier
Sorghum-AD - GTCC
Sorghum-WDG - FBC
Sorghum-WDG - IDGCC
GG
E n
eg
ative
GG
E p
ositiv
e
Figure 13 Breakdown of GGE for alternative drying and electricity technologies (sorghum)
These figures clearly show that, for the conventional practices, there is marked reduction in
GGE for anaerobic digestion.
All of the alternative technologies reduce the overall GGE, with the highest efficiency
electricity generation case (with NGCC and IDGCC) virtually offsetting the upstream
GGEs for ethanol production.

175
Process Water Consumption
The contributions of the various stages along the processing chain, to overall process water
consumption, are shown in Table 24 (wheat) and Table 25 (sorghum).
Table 24 Process water consumption for wheat based cases (m3/kL of ethanol)
1w 2w 3w 4w 5w 6w 7w
WDG DDG
DDG-HE
drier AD-ICE AD-
GTCC
WDG-
FBC
WDG-
IDGCC
Fertiliser/pesticide 1.63 1.63 1.63 1.63 1.63 1.63 1.63
Fertiliser
degradation - - - - - - -
Farming machinery - - - - - - -
Diesel for
agriculture - - - - - - -
Transport - - - - - - -
Grain storage 0.02 0.02 0.02 0.02 0.02 0.02 0.02
Ethanol production 3.15 3.15 3.15 1.00 1.00 2.93 2.93
WDG drying - 0.19 -1.90 - - - -
Anaerobic digestion - - - - - - -
Electricity
generation - - - - - - -
Other 0.01 0.01 0.01 0.02 - 0.01 0.06
Total without credits 4.81 5.00 2.91 2.67 2.65 4.59 4.64
Electricity credits - - - -1.49 -2.34 -1.16 -2.55
Ammonia credits - - - -0.63 -0.63 - -
Fertiliser credits - - - -2.58 -2.58 - -
Feed grain credit* -0.52 -0.52 -0.52 - - - -
Total 4.29 4.48 2.39 -2.03 -2.90 3.43 2.09
* based on the amount of grain replaced in the cattle feed mixture by the distillers grain

176
Table 25 Process water consumption for sorghum based cases (m3/kL of ethanol)
1s 2s 3s 4s 5s 6s 7s
WDG DDG DDG-HE
drier AD-ICE AD-
GTCC
WDG-
FBC
WDG-
IDGCC
Fertiliser/pesticide 1.71 1.71 1.71 1.71 1.71 1.71 1.71
Fertiliser degradation - - - - - - -
Farming machinery - - - - - - -
Diesel for agriculture - - - - - - -
Transport - - - - - - -
Grain storage 0.11 0.11 0.11 0.11 0.11 0.11 0.11
Ethanol production 2.28 2.28 2.28 0.95 0.95 2.09 2.09
WDG drying - 0.12 -1.24h - - - -
Anaerobic digestion - - - - - - -
Electricity generation - - - - - - -
Other 0.02 0.08 0.18 0.01 - 0.16 0.16
Total without credits 4.12 4.30 3.04 2.78 2.77 4.07 4.07
Electricity credits - - - -0.91 -1.48 -0.69 -1.59
Ammonia credits - - - -0.4 -0.4 - -
Fertiliser credits - - - -1.66 -1.66 - -
Feed grain credit* -0.32 -0.32 -0.32 - - - -
Total 3.80 3.98 2.72 -0.19 -0.77 3.38 2.48
* based on the amount of grain replaced in the cattle feed mixture by the distillers grain
The following conclusions can be drawn:
For grain production (whether wheat or sorghum), there is a significant amount of
process (fresh) water associated with fertiliser production. While figures for
process water consumption for the other components are not readily available, they
are known to be small in this context.
When the grain is processed to ethanol, the process water consumption per kL of
ethanol is dependent on whether the stillage is biodigested, and credits associated
with exported electricity:
when WDG or DDGS are by-products, the water associated with the WDG is
lost to the process, except for the high efficiency drying case (see footnote)
for the WDG combustion cases, credits from exported electricity significantly
reduce the process water consumption (by around 50% in the higher efficiency
case)
in the biodigestion cases, water is substantially recirculated after biodigestion).
There are also substantial credits, and these cases have negative values for
overall process water consumption.
h Note that it is assumed that for vapour recompression drying, (high efficiency drier cases), all removed
water is assumed to be recovered as condensate.

177
It should be noted that, in comparison with these process water totals, the water used for
growing the grain (soil moisture and rainfall) is over 2 orders of magnitude higher (1500 –
3000 m3H2O/kl of ethanol).
These results, summarised in Figure 14 below, show the saving in process water when the
stillage is anaerobically digested, and the biogas used for electricity production. In the case
of WDG combustion, the water credits for electricity production are offset by the loss of
water in the flue gases.
-4
-3
-2
-1
0
1
2
3
4
5
Whe
at-W
DG
Sor
ghum
-WDG
Whe
at-D
DGS
Sor
ghum
-DDG
S
Whe
at-D
DGS -
HE d
rier
Sorgh
um-D
DG
- HE d
rier
Whe
at-A
D -
ICE
Sor
ghum
-AD -
ICE
Whe
at-A
D -
GTC
C
Sor
ghum
-AD -
GTC
C
Whe
at-W
DG
- FBC
Sor
ghum
-WDG -
FBC
Whe
at-W
DG
- ID
GCC
Sor
ghum
-WDG -
IDG
CC
Wate
r co
ns
um
ptio
n (m
3/k
l)
Figure 14 Process water consumption for all cases
7.3.3 Summary of Cases
To enable easy comparison between the cases, across all indicators, the data in the above
tables is summarised in Table 26.
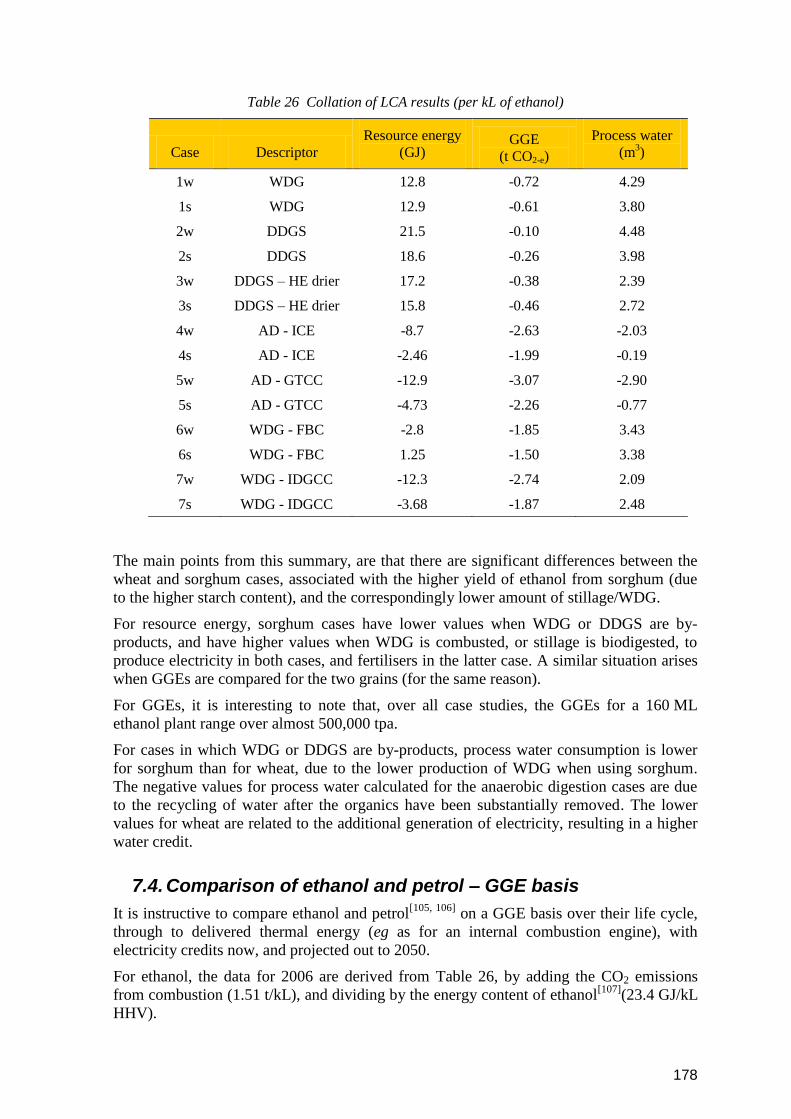
178
Table 26 Collation of LCA results (per kL of ethanol)
Case Descriptor
Resource energy
(GJ) GGE
(t CO2-e)
Process water
(m3)
1w WDG 12.8 -0.72 4.29
1s WDG 12.9 -0.61 3.80
2w DDGS 21.5 -0.10 4.48
2s DDGS 18.6 -0.26 3.98
3w DDGS – HE drier 17.2 -0.38 2.39
3s DDGS – HE drier 15.8 -0.46 2.72
4w AD - ICE -8.7 -2.63 -2.03
4s AD - ICE -2.46 -1.99 -0.19
5w AD - GTCC -12.9 -3.07 -2.90
5s AD - GTCC -4.73 -2.26 -0.77
6w WDG - FBC -2.8 -1.85 3.43
6s WDG - FBC 1.25 -1.50 3.38
7w WDG - IDGCC -12.3 -2.74 2.09
7s WDG - IDGCC -3.68 -1.87 2.48
The main points from this summary, are that there are significant differences between the
wheat and sorghum cases, associated with the higher yield of ethanol from sorghum (due
to the higher starch content), and the correspondingly lower amount of stillage/WDG.
For resource energy, sorghum cases have lower values when WDG or DDGS are by-
products, and have higher values when WDG is combusted, or stillage is biodigested, to
produce electricity in both cases, and fertilisers in the latter case. A similar situation arises
when GGEs are compared for the two grains (for the same reason).
For GGEs, it is interesting to note that, over all case studies, the GGEs for a 160 ML
ethanol plant range over almost 500,000 tpa.
For cases in which WDG or DDGS are by-products, process water consumption is lower
for sorghum than for wheat, due to the lower production of WDG when using sorghum.
The negative values for process water calculated for the anaerobic digestion cases are due
to the recycling of water after the organics have been substantially removed. The lower
values for wheat are related to the additional generation of electricity, resulting in a higher
water credit.
7.4. Comparison of ethanol and petrol – GGE basis
It is instructive to compare ethanol and petrol[105, 106]
on a GGE basis over their life cycle,
through to delivered thermal energy (eg as for an internal combustion engine), with
electricity credits now, and projected out to 2050.
For ethanol, the data for 2006 are derived from Table 26, by adding the CO2 emissions
from combustion (1.51 t/kL), and dividing by the energy content of ethanol[107]
(23.4 GJ/kL
HHV).

179
The results are given in Table 27, for both current (2006) electricity generation technology,
using the NSW grid value of 965kg CO2-e/MWh, and for new generation technologies
likely to be applicable in 2050 (ie with CO2 capture, and a grid average GGE of 300
kg/MWh). Technologies for the latter include post combustion capture applied to advanced
coal based generation, renewable energy sources (such as solar thermal), and possibly
nuclear energy.
By 2050, it is also assumed that similar capture technology will be applied to the ethanol
production process, with capture of 90% of the CO2 from fermentation and anaerobic
digestion, as well as CO2 from electricity generation on site. Note, to allow for the energy
required for CO2 capture, the quantity of electricity generated is reduced by 20%.
Table 27 Life cycle GGE for the production and use of ethanol compared to petrol
Case Descriptor
t CO2-e/GJ (including
combustion)
2006 2050
1w Wheat-WDG 0.034 -0.001
1s Sorghum-WDG 0.039 0.004
2w Wheat-DDGS 0.060 0.025
2s Sorghum-DDGS 0.053 0.019
3w Wheat-DDGS - HE drier 0.048 0.013
3s Sorghum-DDG - HE drier 0.045 0.010
4w Wheat-AD - ICE -0.048 -0.087
4s Sorghum-AD - ICE -0.020 -0.058
5w Wheat-AD - GTCC -0.067 -0.088
5s Sorghum-AD - GTCC -0.032 -0.058
6w Wheat-WDG - FBC -0.014 -0.075
6s Sorghum-WDG - FBC 0.000 -0.051
7w Wheat-WDG - IDGCC -0.053 -0.085
7s Sorghum-WDG - IDGCC -0.015 -0.048
Petrol Petrol 0.077 -0.001
The results are also shown graphically in Figure 15 (2006) and Figure 16 (includes both
2006 and 2050 scenarios).

180
-0.1
-0.05
0
0.05
0.1
Whea
t-WDG
Sor
ghum
-WDG
Whea
t-DDG
S
Sor
ghum
-DDG
S
Whea
t-DDG
S -
HE d
rier
Sor
ghum
-DDG
- HE d
rier
Whea
t-AD -
ICE
Sor
ghum
-AD -
ICE
Whea
t-AD -
GTC
C
Sor
ghum
-AD -
GTC
C
Whea
t-WDG
- FBC
Sor
ghum
-WDG - F
BC
Whea
t-WDG
- ID
GCC
Sor
ghum
-WDG - ID
GCC
Pet
rol
GG
E f
or
de
liv
ere
d e
ne
rgy
(t
CO
2-e
/GJ
)
Figure 15 Life cycle GGE for the production and use of ethanol for all cases, compared to petrol
(2006 basis).
-0.1
-0.05
0
0.05
0.1
Whea
t-WDG
Sor
ghum
-WDG
Whea
t-DDG
S
Sor
ghum
-DDG
S
Whea
t-DDG
S -
HE d
rier
Sor
ghum
-DDG
- HE d
rier
Whea
t-AD -
ICE
Sor
ghum
-AD -
ICE
Whea
t-AD -
GTC
C
Sor
ghum
-AD -
GTC
C
Whea
t-WDG
- FBC
Sor
ghum
-WDG - F
BC
Whea
t-WDG
- ID
GCC
Sor
ghum
-WDG - ID
GCC
Pet
rol
GG
E f
or
de
liv
ere
d e
ne
rgy
(t
CO
2-e
/GJ
)
Without capture (2006)
With capture (2050)
Figure 16 Life cycle GGE for the production and use of ethanol for all cases, compared to petrol,
for both current and 2050 scenarios.

181
From Figure 15, it can be seen that, using current technology, the life cycle GGEs for
ethanol are always less than those for petrol, with ethanol cases involving export electricity
being very much lower. When a comparison is made with the 2050 scenario included
(Figure 15), the projected use of CO2 capture technologies further reduce the GGEs for the
ethanol cases, compared to petrol.
It is clear from these results that ethanol is favoured over petrol as a transport fuel, when
only GGE is used for selection. There are of course a number of other issues which need to
be taken into account, such as availability, performance in the transport fleet, economics,
etc.
7.5. Comparison with other studies
There have been a number of LCAs carried out internationally on ethanol production from
grain, although in Australia there has only been limited work[108]
. These LCAs have
usually been focussed on GGEs and resource energy, and, for many international studies,
have been carried out to quantify the energy available from the product ethanol, net of
credits, compared to the fossil energy inputs in the production chain.
Because of the importance of the latter, this energy balance is discussed in more detail in a
separate section below. In international studies, water data is noticeable by its absence. It
should also be noted that there are no published LCAs for ethanol production from grains,
in which the stillage is biodigested; the only relevant other work is an internal CSIRO
study[102]
by Beer.
In view of the large differences in grain yields in different regions and countries, and
differences in nitrogenous fertiliser practice, variations in LCA results are to be expected,
particularly up to the grain production stage.
Domestic
The most comprehensive grains related, publicly available, LCA, is that undertaken in
2004 by Curtin University for the Grains R&D Corporation. This study[109]
considered
products from Western Australian grains, and was very detailed, with extensive data
collection from grain farmers. The wheat-to-beer data (for the pre-farming and farming
stage) is relevant to this report.
The functional unit in these studies was a loaf of bread. These results were converted to a
tonne of wheat at the farm gate and the data is given in Table 28, with the results from the
present study included for comparison.
Table 28 LCA for wheat production in Western Australia
Parameter Unit Value Present study
Resource energy GJ 6
(read from bar graph)
1.91
GGEs t CO2-e 0.32
(80% from N2O)
0.22*
Process water m3 0.56
0.61
* the GGE value without carbon sequestration in the grain is used for the comparison, to
enable the same basis as the study by Curtin University.
Note that this GGE value is in reasonable agreement with the value for wheat production in
the Gunnedah region from the present study, provided no account is taken of the carbon

182
sequestered in the grain. There is, however, a large difference in resource energy
consumption– possibly because of differences in nitrogen fertiliser use (although this
should also influence the amount of nitrous oxides released). The value for process water is
similar to that from the current study.
Van Berkel has also carried out an LCA for starch production based on Queensland
wheat[110]
, and, for wheat production, has calculated a resource energy of 4.25 GJ/t starch,
and GGE from fossil fuel combustion and electricity use of 0.424 tCO2-e/t starch.
Converted to a wheat basis, assuming that the wheat contains 65% of starch extracted in
the process, these values become 2.8 GJ/t for resource energy, and 0.28 tCO2-e for GGE
(again without carbon sequestration in the grain), both very similar to the current study.
International
Pringer and Steinberg[111]
have recently given estimates of 3.9 GJ/t for wheat, noting that
the dominant contribution is energy embodied in nitrogen fertiliser at 47% of the total
energy input, followed by diesel fuel at 25%, with smaller contributions from energy
embodied in seed grain, petrol, electricity, and phosphorus fertiliser. Again, the importance
of nitrogenous fertiliser is noted (when comparing results between different climatic
regimes, the relationship between nitrogenous input and nitrous oxide emissions will vary,
resulting in somewhat different overall GGEs).
A 2003 report from the UK[112]
analysed carbon and energy balances for a range of biofuel
options, including the production of ethanol from wheat, as well as wheat straw. For
comparison, the values for petrol production from oil are also included. The results are
expressed on a kL of ethanol basis (including the petrol case) in Table 29. Note, the
conversions have assumed a gross CV for ethanol of 29.74 GJ/t, with a density of
0.79 kg/L. IPCC 1996 global warming potentials of 21 for CH4 and 310 for N2O were used
in deriving a total CO2 equivalent value for GGEs.
Table 29 Energy and GGEs for ethanol production - UK study
Sheffield-Hallam
University (UK)
Present study
Energy
(GJ/kL)
Total GGE
(t CO2-e/kL)
Energy
(GJ/kL)
Total GGE
(t CO2-e/kL)
Ethanol from wheat 10.9 0.66 12.8 -0.90
Ethanol from straw -0.66 0.30
Unleaded petrol from oil 27.9 1.90
While the value for resource energy in the present study is comparable to that from the UK
study, the value for GGE is very different. This difference is probably due to 2 key factors;
the UK study did not include:
The CO2 equivalent of the grain (ie due to its carbon content).
Displacement credits (for wheat) for the feed value of DDGS.
Note, the negative value for energy consumption (and methane emissions) for the ethanol
from straw case (UK study) is due to the high level of credits for export of electricity and
acetic acid. The largest source of GGEs for the ethanol from straw case is the additional
ammonium nitrate fertiliser to replace the N lost due to straw removal. As can be seen, this
is substantially offset by the credits. It should be noted that such conversion of straw
(cellulose) to ethanol is not yet commercially available, but the calculation serves to show
the environmental benefits of using such a biomass source, from an LCA perspective.

183
Comparison of fossil energy inputs to energy available from the bioethanol
There has been considerable debate about the merits of bioethanol production compared to
petrol on the basis of equivalent energy delivered (as fuel for an internal combustion
engine). While the focus has been generally on fossil energy replacement, there have been
several recent studies where GGE have also been considered. This has resulted in a number
of different ways of expressing the comparisons:
Net energy = (energy delivered as liquid fuel) – (fossil energy for production)
also expressed as a % or a ratio
Net liquid fuel = (energy delivered as liquid fuel) – (energy from liquid fossil fuels
for production)
GGE for energy delivered = GGE for the production and combustion)
A key recent study was carried out by the Argonne National laboratory to compare the net
energy value for ethanol produced from corn as a function of time for the various
studies[113]
, and these are shown in Figure 17 below. For comparison, results for base cases
in the present study are included.
DDGSs
ADs-ICE
Petrol
WDGs
Ho
Marland and Turhollow
DDGSw
Keeney and DeLuca
Shapouri
Lorenz and Morris Agri. Canada
Wang
Graboski
Kim and Dale
Shapouri
Wang
ShapouriWDGw
ADw -ICE
-10
-5
0
5
10
15
20
25
30
1988 1990 1992 1994 1996 1998 2000 2002 2004 2006 2008
Net
en
erg
y v
alu
e (
GJ/k
l)
Figure 17 Net energy value for ethanol production from corn, with current wheat and sorghum
cases
It can be seen that, on a fossil fuel basis, the production of ethanol from corn results in
more energy than the fossil energy used in its production.
The results from the present study are also shown for the 3 base cases (WDG, DDGS, AD-
ICE):
For WDG, the results are comparable with those of other recent studies.
For DDGS for wheat and sorghum, there is no significant net energy benefit, due to
the large amount of energy required for drying. The value for sorghum is higher
due to the higher ethanol yield and the correspondingly lower amount of WDG for
drying.

184
Anaerobic digestion (with electricity generation using conventional internal
combustion engines) gives a marked improvement in net energy – 2.5-3x higher
than for WDG (or from the other studies shown).
the net energy is actually higher than the energy content in the ethanol product.
Another major comparative study (corn based) was carried out by the University of
California, Berkeley. The results of this study are summarised in Figure 18, with the base
case (WDG, DDGS, AD-ICE) results from the current study also included.
Petrol
Beer (biogas)
Pimentel
Shapouri
Graboski
Wang
EBAMM2Patzek
de Oliviera
EBAMM1
Cellulosic
WDG
DDGS
AD-ICE
-60
-40
-20
0
20
40
60
80
100
120
-10 -5 0 5 10 15 20 25 30 35 40Net energy (MJ/L)
Net
GH
G (
g C
O2-e
/MJ e
than
ol)
Figure 18 Net GGEs versus net energy for ethanol production from corn, with current wheat
cases)
It can be seen that the results of studies by Pimentel and Patzek are inconsistent with those
of others, and also with the present study.
The overall analysis of the present study provides similar results to the Argonne study from
a net energy point of view. The low net GGE value for cellulosic feedstock is due to the
generation and export of electricity from combustion of the lignin, a by-product of ethanol
production using this feed. For the present study, this credit was even larger for the AD-
ICE case, probably due to the high CO2 intensity of the NSW grid (compared to the USA).
An alternative to the use of biomass for ethanol production, whether from grain, or in the
future from cellulosic material, is to use the biomass as a fuel to raise steam and produce
electricity, perhaps as part of a combined heat and power scheme. A report from
CONCAWE[114]
has concluded that “the process is considerably simpler, and the crops can
now be selected solely on their ability to produce large amounts of biomass from a given
land area. Such crops could include various grass varieties or fast-growing wood (short
rotation coppicing). Adapted grass varieties can produce some 200 GJ/ha of net biomass
energy (i.e. after accounting for the production energy), compared to 30 to 60 in the best
scenario for ethanol. When used for power generation this could displace an equivalent
fossil fuel energy with a CO2 emission factor of say 80kg CO2/GJ (typical of heavy fuel oil
or intermediate between gas and coal). This would equate to 16t CO2/ha, four to eight
times more than could be achieved through ethanol production and use”.
This emphasis on bioenergy, rather than liquid biofuel is worth considering in any further
study of the use of land based biomass to reduce Australia’s greenhouse gas emissions, and

185
to improve energy security. The water use aspects of these alternative bioenergy crops
would also need careful consideration.

186
8. TECHNO-ECONOMIC EVALUATION
The objective of this analysis is to determine the cost of ethanol production for a number of
process options, and for a range of economic variables.
As for the LCA, there were 7 cases chosen for the production of ethanol and processing of
the stillage – for both wheat and sorghum:
1. WDG-WDG transported direct to adjacent feedlot.
2. DDGS-DDGS with conventional drying.
3. DDGS – HE dryer-DDGS with high efficiency drying.
4. AD–ICE-Anaerobic digestion, with gas internal combustion engine electricity
generation (33% efficiency*)
5. AD–GTCC-Anaerobic digestion, with gas turbine combined cycle electricity
generation (50% efficiency)
6. WDG-FBC-WDG for electricity generation by fluidised bed combustion (20%
efficiency).
7. WDG-IDGCC-WDG for electricity generation using integrated drying and
gasification combined cycle (40% efficiency).
It is realised that there are many factors that will affect the overall economics of new
ethanol production facilities in Australia. However, the following analysis is provided to
indicate suggested outcomes, as a basis for identifying the major contributors to the
ultimate ethanol production cost, together with some of the sensitivities for various
production and feedstock options.
It should be noted that data has been obtained/derived from typical information reported by
technology providers and project developers. Obviously much more detailed engineering
and plant specific information would be required to develop more accurate estimates. BBI
International, one of the USA based companies working with new developers, typically
estimate that feasibility studies to develop detailed project plans and economics related to a
particular greenfield site cost in the vicinity of US$1 M. Current developers have indicated
that significant expenditure, well above this figure, needs to be incurred to reach the stage
where funding can be guaranteed and a Development Application lodged.
The location will have a particular bearing on the availability, transport, type and cost of
grain, type and cost of energy, as well as some specific design features of the plant and the
potential for sale and export of co-products.
Variable costs (administration, marketing, interest, licence fees, taxes, depreciation etc)
will change for each plant, location and other corporate and local parameters, but typically
amount to an additional 7-10 c/L. Capital funding and recovery of investment for the plant
will be affected by the levels of debt and equity financing. It seems that a number of
proposed Australian plants will involve significant amounts of capital from equity
investments. Hence, total overall costs will vary for individual plants and financing
arrangements.
The nominal capital cost for a 160 ML/y plant is A$200 M. This cost is considered a
realistic overall cost that includes allowances for a number of essential items (including
licensing, cash reserves, insurance etc), in addition to the ethanol plant with digester and
power station, and other associated equipment. The typical capital cost for a conventional
ethanol plant alone in Australia is of the order of $1.0/L ethanol produced annually (in this
case $160 M). As this equates to only 15-20% of the production cost of ethanol, minor

187
variations in capital cost will only have a minimal effect on the overall cost when
compared to the much larger variations resulting from grain costs.
It is emphasised that the costs in this section relate to ethanol production costs, with no
consideration of government subsidies or charges.
Basis and assumptions
The analysis involves a number of key assumptions and leads to a matrix of cases. These
are summarised in Table 30, and further details are provided in Table 31. Note that the
base case cost of electricity of 4c/kWh was based on a recent NSW proposal, and may
have been a project specific agreement. Grain prices were chosen to represent current
values for wheat and sorghum ($200-250/t), with a higher price of $300/t chosen to
represent a potential future situation (associated with changes in demand and supply,
higher fuel and fertiliser costs, lower average rainfall).
Table 30 Matrix of key cost variables
Unit Base Medium High
Grain $/t
(@10% moisture)
200 250 300
Energy cost
Electricity c/kWh 4 5.5 7
Gas $/GJ 4 5.5 7
Value of CO2 $/t CO2-e 0 10 30
The techno-economics considers the base cases (cases 1, 2 and 4 above), followed by a
consideration of ethanol production costs as a function of the key cost variables. In
addition, to compare the trade-offs between drying of WDG and the reduced transportation
costs for DDGS.

188
Table 31 Basis and assumptions for the techno-economics
Assumption Comment Value
Ethanol production ML/yr 160
Capital cost of ethanol plant $M 200
Levelised carrying charge pa 12%
Grain cost $/t 200-300
Cost of natural gas $/GJ 4-7
CO2 abatement credit %/t CO2-e 0-30
Basis for CO2 abatement credit Overall GGE -
Power plant capital cost
ICE $M/MW 1.5
GTCC $M/MW 1.1
FBC $M/MW 1.5
IDGCC $M/MW 1.8
Electricity capital charge pa 12%
Electricity O&M pa 4%
Power station capacity factor 95%
Dryer capital cost (conventional)
Wheat $M 8
Sorghum $M 5.2
Dryer capital cost (high efficiency)
Wheat $M 10
Sorghum $M 6.5
Miscellaneous costs
Anaerobic digestion cases c/L 4
Other cases c/L 0.4
R&M costs c/L 1
Administration costs c/L 1
Chemical costs
Anaerobic digestion chemicals c/L 7.0
Chemicals other cases c/L 3.1
Credits
Electricity cost/credit c/kWh 4-7
Organic fertiliser credit $/t 250
Aqueous ammonia credit $/t 100
Greenpower electricity credit c/kWh 2.5
DDG credit of grain cost 85%
WDG credit of grain cost 25%

189
8.1. Results
The results are presented for the bases cases as a summary table, together with graphs in
which the values for GGE are varied (0, 10 and $30/t GGE).
This is followed by a comparison of DDGS with WDG, for a range of transportation
distances. Finally, ethanol production costs for a number of alternative stillage processing
options are given.
8.1.1 Base cases
The conditions used for the base cases are given in Table 32.
Table 32 Base case studies for techno-economics
Wheat Sorghum
Cases
Attribute
WDG DDGS AD-ICE WDG DDGS AD-ICE
Stillage processing DDG anaerobic
digestion
DDG anaerobic
digestion
Grain moisture % 10 10 10 12 12 12
Grain starch % db 65.3 65.3 74.6 74.6
Grain consumption t/y 439,000 439,000 393,000 393,000
Grain cost $/t 200-300 200-300 200-300 200-300 200-300 200-300
Distillers grain price % of
grain
25% 85% 25% 85%
Electricity cost/price c/kWh 4-7 4-7 4-7 4-7 4-7 4-7
Natural gas cost $/GJ 4-7 4-7 4-7 4-7
Co-products
Ammoniacal liquor
Organic fertiliser
Export electricity
WDG
DDGS
t/y
t/y
MWh
t/y
t/y
480,000
-
-
-
160,000
16,000
70,000
158,400
-
307,200
-
-
-
102,400
10,000
45,000
96,000
-
The resulting ethanol production costs for these cases are shown in Table 33, and in Figure
19 to Figure 21.

190
Table 33 Cost of ethanol production for the base cases (no value on GGE)
Stillage option Grain
$/t
Energy price/cost
(c/kWh or $/GJ)
Ethanol production cost (c/L)
Wheat Sorghum
WDG 200 4 62.9 62.4
DDGS 200 4 64.6 63.5
AD-ICE 200 4 70.5 69.4
WDG 250 4 72.8 72.2
DDGS 250 4 74.0 74.1
AD-ICE 250 4 84.2 81.7
WDG 300 4 82.8 82.1
DDGS 300 4 83.5 83.6
AD-ICE 300 4 97.9 94.0
WDG 200 5.5 62.9 62.4
DDGS 200 5.5 65.7 65.8
AD-ICE 200 5.5 69.0 68.5
WDG 250 5.5 72.8 72.2
DDGS 250 5.5 75.2 75.3
AD-ICE 250 5.5 82.7 80.8
WDG 300 5.5 82.8 82.1
DDGS 300 5.5 84.7 84.8
AD-ICE 300 5.5 96.4 93.1
WDG 200 7 62.9 62.4
DDGS 200 7 66.9 67.0
AD-ICE 200 7 67.5 67.6
WDG 250 7 72.8 72.2
DDGS 250 7 76.4 76.5
AD-ICE 250 7 81.2 79.9
WDG 300 7 82.8 82.1
DDGS 300 7 85.9 86.0
AD-ICE 300 7 94.9 92.2

191
Electricity - 4c/kWh, CO2 tax $0/tCO2
0
20
40
60
80
100
120
180 200 220 240 260 280 300 320
Feed grain cost ($/t)
Pro
du
cti
on
co
st
(c/t
eth
an
ol)
WDG
DDGS
AD-ICE
Figure 19 Ethanol production cost for electricity at 4c/kWh and gas at $4/GJ Electricity - 5.5c/kWh, CO2 tax $0/tCO2
0
20
40
60
80
100
120
180 200 220 240 260 280 300 320
Feed grain cost ($/t)
Pro
du
cti
on
co
st
(c/t
eth
an
ol)
WDG
DDGS
AD-ICE
Figure 20 Ethanol production cost for electricity at 5.5c/kWh and gas at $5.5/GJ Electricity - 7c/kWh, CO2 tax $0/tCO2
0
20
40
60
80
100
120
180 200 220 240 260 280 300 320
Feed grain cost ($/t)
Pro
du
cti
on
co
st
(c/t
eth
an
ol)
WDG
DDGS
AD-ICE
Figure 21 Ethanol production cost for electricity at 7c/kWh and gas at $7/GJ

192
These results show that, for a zero value for GGE, the cost of ethanol production is:
Dominated by the grain price over the range considered.
Is not significantly affected by the type of feed replacement by-product (ie WDG
or DDGS).
Increased by 6-7c/L for the base conditions, and up to 14c/L for high grain cost.
This increase is reduced by higher energy costs.
Not significantly affected by grain type, for the assumptions used.
8.1.2 Trade-off between drying and transport
Drying of stillage is generally assumed to be required to enable distribution of distillers
grain to feedlots which are not in the near vicinity to the ethanol plant. A number of
different dryers and options are available[115,116]
, based on various designs and energy
recovery systems. In addition to the need for a reliable market, the cost of the drying
operation will play an important role in assessing the value of credits for this co-product
from the ethanol process.
The following analysis is included to give an indication of the costs associated with the
drying operation. Typically, dryers use natural gas or steam as the heating medium. In
some designs, recuperation of some of the energy (for example by recirculating a
proportion of the hot exhaust gases to the feed section of the dryer) is incorporated to
reduce the input energy consumption. To provide an indication of the relative drying costs,
budget data provided by the GEA Process Division of Barr-Rosin for a basic partial gas
recycle, direct fired rotary dryer has been used.
Table 34 gives the basis for the calculation of drying costs, for the 3 levels of energy costs.

193
Table 34 Basis for estimates (based on nominal 160 ML/y ethanol plant
Unit Current Medium
energy cost
High
energy cost
WDG (70% moisture) t/y 481,000 481,000 481,000
DDGS (10% moisture) t/y 160,000 160,000 160,000
Dryer capacity (moisture
removed)
t/h 37 37 37
Drying plant
Capital cost $M 8 8 8
Levelised carrying charge %pa 10% 10% 10%
Electrical power MW 2.25 2.25 2.25
Electricity cost c/kWh 4.00 5.50 7.00
Natural gas rate MW 34 34 34
Gas cost $/GJ 4.0 5.5 7.0
Operating costs
Capital charge $/t DDGS 5.0 5.0 5.0
Electricity $/t DDGS 4.93 6.78 8.62
Gas $/t DDGS 26.81 36.86 46.91
Total drying cost
$/t DDGS 36.7 48.6 60.5
c/L ethanol 3.7 4.9 6.1
This analysis shows that drying will cost around $36/t DDGS with current NSW energy
costs (as quoted for a recent ethanol plant proposal); however, this cost would nearly
double with high energy costs.
The costs of transport of WDG are compared to those for DDGS, on an equivalent
moisture basis, in Figure 22. The cost of transport has been assumed to be 20 c/t.km.
The GGE associated with this comparison are shown in Figure 23, with the GGE for the
drying of the WDG (to produce DDGS), using both normal and high drying efficiencies,
given as the intersection with the ordinate.

194
0
50
100
150
200
250
300
0 10 20 30 40 50 60 70 80 90 100
Transport distance (km)
Delivere
d c
ost
($/t
dry
)
DDGS
WDG
Figure 22 Comparison of delivered costs for DDGS and an equivalent amount of WDG, assuming
a transport cost of $0.20/t.km and a grain price of $250/t.
0
0.3
0.6
0.9
1.2
1.5
1.8
0 1000 2000 3000 4000 5000
Transport distance (km)
GG
E (
tCO
2-e
/tD
DG
S) DDGS
WDG
DDGS-HED
Figure 23 Comparison of GGE for drying/transportation for DDGS to an equivalent amount of
WDG

195
From a cost perspective, Figure 22 shows that, for a transport cost of 20 c/t.km and a grain
cost of $250/t, WDG can only be transported around 60 km before it is economically
preferable to produce DDGS. For the lower grain price, the distance reduces to 50 km, and
for the higher grain price it increases to 80 km.
From a GGE perspective, Figure 23 shows that the WDG can be transported up to almost
3000 km before the GGE exceeds those associated with producing and transporting the
DDGS, when the lower efficiency drying process is used. When the higher efficiency dryer
is used, the distance reduces to around 1000 km.
8.1.3 Alternative stillage processing options
The wider range of case studies has been compared to the base cases for the other stillage
processing options (cases 3, 5, 6 and 7). In addition, a sensitivity analysis has been carried
out to show the effect of grain price, local electricity price/cost, and the value of CO2.
The 4 alternative cases are based on the technologies that are most likely to be utilised in
integrated grain based plants to be built in Australia in the foreseeable future.
The data and assumptions related to the four case studies are summarized in Table 35.
Table 35 Alternative case studies for techno-economics
Wheat Sorghum
Cases
Attribute
AD-
GTCC
WDG-
FBC
WDG-
IDGCC
AD-
GTCC
WDG-
FBC
WDG-
IDGCC
Grain moisture % 10 10 10 12 12 12
Grain starch % db 65.3 65.3 65.3 74.6 74.6 74.6
Grain
consumption
t/y 439,000 439,000 439,000 393,000 393,000 393,000
Grain cost $/t 200-300 200-300 200-300 200-300 200-300 200-300
Electricity
cost/price
c/kWh 4-7 4-7 4-7 4-7 4-7 4-7
Natural gas cost $/GJ 4-7 4-7 4-7 4-7
Co-products
Ammoniacal
liquor
Organic
fertiliser
Export
electricity
t/y
t/y
MWh
16,000
70,000
252,800
-
-
123,200
-
-
270,400
10,000
45,000
156,800
-
-
73,600
-
-
168,000
The results for all of the cases and ranges of variables are given in Table 36 (nil value for
GGE), Table 37 ($10/t GGE) and Table 38 ($30/t GGE).

196
Table 36 Cost of ethanol production for alternative stillage processing (nil value for GGE)
Alternative
stillage process
Grain
$/t
Electricity
c/kWh
Ethanol production price (c/L)
Wheat Sorghum
DDGS-HED 200 4 63.1 62.5
AD-GTCC 200 4 67.0 67.2
WDG-FBC 200 4 75.5 70.8
WDG-IDGCC 200 4 73.2 69.4
DDGS-HED 250 4 72.6 72.6
AD-GTCC 250 4 80.7 79.5
WDG-FBC 250 4 89.2 83.1
WDG-IDGCC 250 4 87.0 81.7
DDGS-HED 300 4 82.0 82.1
AD-GTCC 300 4 94.4 91.8
WDG-FBC 300 4 103.0 95.4
WDG-IDGCC 300 4 100.7 94.0
DDGS-HED 200 5.5 63.7 63.7
AD-GTCC 200 5.5 64.6 65.7
WDG-FBC 200 5.5 74.4 70.2
WDG-IDGCC 200 5.5 70.7 67.8
DDGS-HED 250 5.5 73.2 73.2
AD-GTCC 250 5.5 78.4 78.0
WDG-FBC 250 5.5 88.1 82.4
WDG-IDGCC 250 5.5 84.4 80.1
DDGS-HED 300 5.5 82.6 82.7
AD-GTCC 300 5.5 92.1 90.3
WDG-FBC 300 5.5 101.8 94.7
WDG-IDGCC 300 5.5 98.1 92.4
DDGS-HED 200 7 64.3 64.3
AD-GTCC 200 7 62.3 64.3
WDG-FBC 200 7 73.2 69.5
WDG-IDGCC 200 7 68.2 66.2
DDGS-HED 250 7 73.7 73.8
AD-GTCC 250 7 76.0 76.6
WDG-FBC 250 7 86.9 81.7
WDG-IDGCC 250 7 81.9 78.5
DDGS-HED 300 7 83.2 83.3
AD-GTCC 300 7 89.7 88.8
WDG-FBC 300 7 100.6 94.0
WDG-IDGCC 300 7 95.6 90.8

197
Table 37 Cost of ethanol production for alternative stillage processing ($10/t GGE)
Alternative
stillage process
Grain
$/t
Electricity
c/kWh
Ethanol production price (c/L)
Wheat Sorghum
DDGS-HED 200 4 64.3 64.2
AD-GTCC 200 4 65.4 66.4
WDG-FBC 200 4 75.2 70.8
WDG-IDGCC 200 4 72.0 66.7
DDGS-HED 250 4 73.7 73.7
AD-GTCC 250 4 79.1 78.7
WDG-FBC 250 4 88.9 83.1
WDG-IDGCC 250 4 85.7 79.0
DDGS-HED 300 4 83.2 83.2
AD-GTCC 300 4 92.8 91.0
WDG-FBC 300 4 102.6 95.4
WDG-IDGCC 300 4 99.4 94.3
DDGS-HED 200 5.5 64.8 64.8
AD-GTCC 200 5.5 63.0 65.0
WDG-FBC 200 5.5 74.0 70.2
WDG-IDGCC 200 5.5 69.4 65.1
DDGS-HED 250 5.5 74.3 74.3
AD-GTCC 250 5.5 76.7 77.3
WDG-FBC 250 5.5 87.7 82.4
WDG-IDGCC 250 5.5 83.1 80.5
DDGS-HED 300 5.5 83.8 83.8
AD-GTCC 300 5.5 90.4 89.5
WDG-FBC 300 5.5 101.5 94.7
WDG-IDGCC 300 5.5 96.9 92.7
DDGS-HED 200 7 65.4 65.4
AD-GTCC 200 7 60.6 63.5
WDG-FBC 200 7 72.9 69.5
WDG-IDGCC 200 7 66.9 63.5
DDGS-HED 250 7 74.9 74.9
AD-GTCC 250 7 74.4 75.8
WDG-FBC 250 7 86.6 81.7
WDG-IDGCC 250 7 80.6 78.9
DDGS-HED 300 7 84.4 84.4
AD-GTCC 300 7 88.1 88.1
WDG-FBC 300 7 100.3 94.0
WDG-IDGCC 300 7 94.3 91.2

198
Table 38 Cost of ethanol production for alternative stillage processing ($30/t GGE)
Alternative
stillage process
Grain
$/t
Electricity
c/kWh
Ethanol production price (c/L)
Wheat Sorghum
DDGS-HED 200 4 66.6 66.3
AD-GTCC 200 4 62.1 64.9
WDG-FBC 200 4 74.5 70.8
WDG-IDGCC 200 4 69.4 70.5
DDGS-HED 250 4 76.1 75.9
AD-GTCC 250 4 75.8 77.2
WDG-FBC 250 4 88.2 83.1
WDG-IDGCC 250 4 83.1 82.8
DDGS-HED 300 4 85.5 85.4
AD-GTCC 300 4 89.6 89.4
WDG-FBC 300 4 101.9 95.4
WDG-IDGCC 300 4 96.8 95.0
DDGS-HED 200 5.5 67.2 66.9
AD-GTCC 200 5.5 59.8 63.4
WDG-FBC 200 5.5 73.3 70.2
WDG-IDGCC 200 5.5 66.8 68.9
DDGS-HED 250 5.5 76.6 76.5
AD-GTCC 250 5.5 73.5 75.7
WDG-FBC 250 5.5 87.1 82.4
WDG-IDGCC 250 5.5 80.6 81.2
DDGS-HED 300 5.5 86.1 86.0
AD-GTCC 300 5.5 87.2 88.0
WDG-FBC 300 5.5 100.8 94.7
WDG-IDGCC 300 5.5 94.3 93.5
DDGS-HED 200 7 67.8 67.5
AD-GTCC 200 7 57.4 61.9
WDG-FBC 200 7 72.2 69.5
WDG-IDGCC 200 7 64.3 67.3
DDGS-HED 250 7 77.2 77.1
AD-GTCC 250 7 71.1 74.2
WDG-FBC 250 7 85.9 81.7
WDG-IDGCC 250 7 78.0 79.6
DDGS-HED 300 7 86.7 86.6
AD-GTCC 300 7 84.8 86.5
WDG-FBC 300 7 99.6 94.0
WDG-IDGCC 300 7 91.8 91.9

199
Electricity - 4c/kWh, CO2 tax $0/tCO2
0
20
40
60
80
100
120
180 200 220 240 260 280 300 320
Feed grain cost ($/t)
Pro
du
cti
on
co
st
(c/t
eth
an
ol)
WDG
DDGS
DDGS-HED
AD-ICE
AD-GTCC
WDG-FBC
WDG-IDGCC
Figure 24 Ethanol production cost for electricity at 4c/kWh Electricity - 5.5c/kWh, CO2 tax $0/tCO2
0
20
40
60
80
100
120
180 200 220 240 260 280 300 320
Feed grain cost ($/t)
Pro
du
cti
on
co
st
(c/t
eth
an
ol)
WDG
DDGS
DDGS-HED
AD-ICE
AD-GTCC
WDG-FBC
WDG-IDGCC
Figure 25 Ethanol production cost for electricity at 5.5c/kWh Electricity - 7c/kWh, CO2 tax $0/tCO2
0
20
40
60
80
100
120
180 200 220 240 260 280 300 320
Feed grain cost ($/t)
Pro
du
cti
on
co
st
(c/t
eth
an
ol)
WDGDDGSDDGS-HEDAD-ICEAD-GTCCWDG-FBCWDG-IDGCC
Figure 26 Ethanol production cost for electricity at 7c/kWh

200
Electricity - 4c/kWh, CO2 tax $10/tCO2
0
20
40
60
80
100
120
180 200 220 240 260 280 300 320
Feed grain cost ($/t)
Pro
du
cti
on
co
st
(c/t
eth
an
ol)
WDGDDGSDDGS-HEDAD-ICEAD-GTCCWDG-FBCWDG-IDGCC
Figure 27 Ethanol production cost for electricity at 4c/kWh and CO2 valued at $10/t Electricity - 5.5c/kWh, CO2 tax $10/tCO2
0
20
40
60
80
100
120
180 200 220 240 260 280 300 320
Feed grain cost ($/t)
Pro
du
cti
on
co
st
(c/t
eth
an
ol)
WDGDDGSDDGS-HEDAD-ICEAD-GTCCWDG-FBCWDG-IDGCC
Figure 28 Ethanol production cost for electricity at 5.5c/kWh and CO2 valued at $10/t Electricity - 7c/kWh, CO2 tax $10/tCO2
0
20
40
60
80
100
120
180 200 220 240 260 280 300 320
Feed grain cost ($/t)
Pro
du
cti
on
co
st
(c/t
eth
an
ol)
WDGDDGSDDGS-HEDAD-ICEAD-GTCCWDG-FBCWDG-IDGCC
Figure 29 Ethanol production cost for electricity at 7c/kWh and CO2 valued at $10/t

201
Electricity - 4c/kWh, CO2 tax $30/tCO2
0
20
40
60
80
100
120
180 200 220 240 260 280 300 320
Feed grain cost ($/t)
Pro
du
cti
on
co
st
(c/t
eth
an
ol)
WDGDDGSDDGS-HEDAD-ICEAD-GTCCWDG-FBCWDG-IDGCC
Figure 30 Ethanol production cost for electricity at 4c/kWh and CO2 valued at $30/t Electricity - 5.5c/kWh, CO2 tax $30/tCO2
0
20
40
60
80
100
120
180 200 220 240 260 280 300 320
Feed grain cost ($/t)
Pro
du
cti
on
co
st
(c/t
eth
an
ol)
WDGDDGSDDGS-HEDAD-ICEAD-GTCCWDG-FBCWDG-IDGCC
Figure 31 Ethanol production cost for electricity at 5.5c/kWh and CO2 valued at $30/t Electricity - 7c/kWh, CO2 tax $30/tCO2
0
20
40
60
80
100
120
180 200 220 240 260 280 300 320
Feed grain cost ($/t)
Pro
du
cti
on
co
st
(c/t
eth
an
ol)
WDGDDGSDDGS-HEDAD-ICEAD-GTCCWDG-FBCWDG-IDGCC
Figure 32 Ethanol production cost for electricity at 7c/kWh and CO2 valued at $30/t

202
The results show that the cost of ethanol production is:
Increased by 3-12c/L for the alternative processing options (under base conditions).
The AD-GTCC gives the lowest overall cost of the power generation options, due
to its high efficiency and lowest capital cost.
Lower, for power generation cases, when a value is attributed to GGE;
lowest (57c/L) for AD-GTCC, with the high energy cost case and $30/t GGE.
A breakdown of ethanol production costs is shown for the low, medium and high cost
cases (from wheat) in Figure 33, Figure 34 and Figure 35, respectively.
-20
0
20
40
60
80
100
120
WDG
DDGS
DDGS-H
ED
AD-IC
E
AD-G
TCC
WDG
-FBC
WDG
-IDGCC
Co
st
(c/l e
tha
no
l)
Grain cost CAPEXChemicals/admin/other Energy
CO2 abatement credit Misc. CreditsTOTAL
Figure 33 Breakdown of ethanol production cost for electricity at grain at $200/t, 4c/kWh and
CO2 valued at $0/t
-30
0
30
60
90
120
150
WDG
DDGS
DDGS-H
ED
AD-IC
E
AD-G
TCC
WDG
-FBC
WDG
-IDGCC
Co
st
(c/l e
tha
no
l)
Grain cost CAPEXChemicals/admin/other Energy
CO2 abatement credit Misc. CreditsTOTAL

203
Figure 34 Breakdown of ethanol production cost for electricity at grain at $250/t, 5.5c/kWh and
CO2 valued at $10/t
-40
0
40
80
120
160
WDG
DDGS
DDGS-H
ED
AD-IC
E
AD-G
TCC
WDG
-FBC
WDG
-IDGCC
Co
st
(c/l e
than
ol)
Grain cost CAPEXChemicals/admin/other EnergyCO2 abatement credit Misc. CreditsTOTAL
Figure 35 Breakdown of ethanol production cost for electricity at grain at $300/t, 7c/kWh and
CO2 valued at $30/t
Electricity generation
The amount of power generated and exported is very dependent on the amount of stillage, the type
of stillage processing, and the generation technology. The results for the average generated and
export electricity for the base cases are shown in Table 39, with the results for the alternative
stillage processing options shown in
Table 40.

204
Table 39 Power generation for the base cases (160 MLpa plant)
Wheat Sorghum
Cases
Attribute
WDG DDGS AD-ICE WDG DDGS AD-ICE
Average generation (MW) - - 21.9 - - 14.1
Average export
electricity (MW) - - 19.0 - - 11.5
Table 40 Power generation for the alternative stillage processing options (160 MLpa plant)
Wheat Sorghum
Cases
Attribute
AD-
GTCC
WDG-
FBC
WDG-
IDGCC
AD-
GTCC
WDG-
FBC
WDG-
IDGCC
Average
generation (MW) 33.2 17.6 35.3 21.4 11.4 22.7
Average export
electricity (MW) 30.4 14.8 32.5 18.8 8.8 20.2
The amount of electricity used by ethanol production is small compared to that which can
be generated from stillage processing. This results in significant export electricity,
particularly for the high efficiency generation technology. It should be noted that, while
these higher efficiencies are not readily achievable at the scale chosen for the ethanol plant,
they could be achieved with 2-3x larger ethanol plants (as are being constructed in the
USA).

205
9. CONCLUSIONS
9.1. LCA
The LCA study highlighted the importance of considering a number of alternative
technology options related to the processing of the stillage, and these were also included in
the techno-economic analysis. More efficient technologies can be used for converting
biogas or WDG to electricity, and these substantially reduce the resource energy
requirement and GGEs, as well as reducing water consumption.
Resource energy
For grain production, fertiliser production is the major component (70%) of resource
energy, with the fuel for agricultural activities of secondary importance: 20% for wheat,
and only 10% for sorghum.
When the grain is processed to ethanol, the resource energy is very dependent on the
processing of the stillage, and the applicable by-product credits. For direct sale of WDG,
the resource energy is considerably lower than that for DDGS, due to the large amount of
energy required for drying (can be substantially reduced using a higher efficiency process).
When the stillage is anaerobically digested, the resource energy becomes negative, since
there are:
no requirements for purchased electricity or natural gas for ethanol production, and
significant credits for by-product fertilisers and exported electricity.
If the WDG is combusted to produce electricity (requires a technology similar to high
moisture lignite or biomass), a negative overall resource energy is again produced.
It is interesting to note that the overall resource energy is the same, whether the stillage is
anaerobically digested with the methane converted to electricity at 50% efficiency, or the
WDG is directly combusted to produce electricity at an overall efficiency of 40%.
GGEs
For grain production, the majority of the GGEs come from the production of nitrogenous
fertiliser, and the nitrous oxide emissions from its use. However, the overall GGE is
dominated by the CO2 taken up by the grain through photosynthesis. This leads to a
negative GGE for all cases.
When the grain is processed to ethanol, GGEs are very dependent on the method of
processing the stillage, and what by-product credits are applicable. For direct sale of WDG,
the GGE value is lower than that when DDGS is the by-product, due to the emissions
associated with drying (again, reduced by a higher efficiency process). The GGE increases
with the feed grain credit from WDG/DDGS – as this by-product displaces grain
production and lowers the CO2 being sequestered by photosynthesis. When the
transportation of WDG is compared with that for DDGS on a comparable moisture basis, it
was shown that WDG could be transported for a large distance (>1000 km), before the
increased GGEs from transport of the higher moisture content WDG exceeds the GGE
from drying and transport of the DDGS.
Anaerobic digestion of the stillage, gives lower emissions associated with ethanol
production, due to the use of combined heat and power; ie the use of waste heat from
power generation for the fermentation. A similar conclusion applies to the combustion of
WDG for electricity generation.

206
All of the alternative technologies reduce the overall GGE, with the highest efficiency
electricity generation case (with NGCC and IDGCC) virtually offsetting the upstream
GGEs for ethanol production.
Process water consumption
For grain production, there is a significant amount of process (fresh) water associated with
fertiliser production. However, the amount of water used for growing the grain (soil
moisture and rainfall) is over 2 orders of magnitude higher (500 – 1000 m3H2O/t of grain).
The process water consumption per kL of ethanol is dependent on whether the stillage is
biodigested, and the level of credits associated with exported electricity. When WDG or
DDGS are by-products, the water associated with the WDG is lost to the process, except
for the higher efficiency drying case using vapour recompression. If the WDG is
combusted to produce electricity, the water content of the WDG is also lost.
In the biodigestion cases, water is recirculated after biodigestion, and this and the credit
from electricity leads to the lowest process water consumption.
As noted above, in comparison with these process water totals, the water used for growing
the grain is very much higher.
Comparison with other studies
In comparison with the other Australian studies on wheat production, similar GGEs and
process water values were obtained, when compared on a similar basis. The values for
resource energy, however, vary considerably (some of which may be attributed to different
locations).
Since the amount and type of nitrogenous fertiliser varies considerably, depending on crop
rotation practices, the season, and the region or country, it is not surprising that there are
some differences in resource energy and GGE results from LCAs carried out in Australia
and internationally. For GGEs, this is further exacerbated by the range of values attributed
to nitrous oxide emissions as a percentage of added fertiliser.
For ethanol production, comparison with other studies is complicated by uncertainties in
how by-products have been credited, and in some cases by the use of petrol blends as the
functional unit. In addition, many of the studies do not consider the CO2 taken up by the
grain through photosynthesis, which makes the GGEs for grain production negative.
Comparison of ethanol and petrol
Using current technology, the life cycle GGEs for ethanol are always less than those for
petrol, with ethanol cases involving export electricity being very much lower. When a
comparison is made with the 2050 scenario included, the projected use of CO2 capture
technologies further reduce the GGEs for the ethanol cases, compared to petrol.
Previous studies have compared ethanol and petrol on the basis of equivalent energy
delivered - as fossil energy replacement.
Most US studies (based on corn) have shown that, on a fossil fuel basis, the production of
ethanol from corn results in approximately 30% more energy than the fossil energy used in
its production. The present study has shown similar results for the WDG case. DDGS
results in a small negative net energy.
Anaerobic digestion (with electricity generation using gas internal combustion engines)
gives a marked improvement in net energy – 2.5-3x better than for WDG or from the
previous studies.

207
Overall, ethanol is favoured over petrol as a transport fuel, on a resource energy and GGE
basis. There are of course a number of other issues which need to be taken into account,
such as availability, performance in the transport fleet, economics, etc.
9.2. Techno-economics
The techno-economic analysis shows the dominating role that the grain feedstock plays in
the overall ethanol production economics - 50-80c/L of the ethanol production cost.
The next most significant issue is the choice of stillage processing – whether to produce
WDG, DGGS or biogas/solid fuel for electricity production. In practice, the choice will
also depend on the size, overall capital costs, by-product credits, and the ability to exploit
opportunity biomass, such as straw.
Sorghum gives lower unit feed cost, but overall production costs are similar due to lower
credits (higher level of starch in the sorghum produces a higher yield of ethanol, but less
electricity and fertiliser credits).
Over the full range of cases considered, the cost of ethanol production varied over the
range, 57-103 c/L for wheat, and 62-96 c/L for sorghum.
Electricity generation
The amount of power generated and exported is very dependent on the amount of stillage,
the type of stillage processing, and the generation technology. For the alternative stillage
processing options, the cost of ethanol production is:
Increased by 3-12c/L for the alternative processing options to generate electricity
(under base conditions).
The AD-GTCC gives the lowest overall cost of the power generation, due to its
high efficiency and lowest capital cost (particularly for generation plant over
50 MW).
Lower, for power generation cases, when a value is attributed to GGE;
lowest (57c/L) for AD-GTCC, with the high energy cost case and $30/t GGE.
The amount of electricity used by ethanol production is small compared to that which can
be generated from stillage processing. This results in significant export electricity,
particularly for the high efficiency generation technology. It is noted, that these higher
efficiencies are not readily achievable at the scale chosen for the ethanol plant; however,
these could be achieved with 2-3x larger ethanol plants (as are being constructed in the
USA).
Transportation of WDG versus DDGS
This analysis shows that drying will cost around $37-61/t DDGS depending on energy
costs.
From a cost perspective, WDG can only be transported around 50-70 km before it is
economically preferable to produce DDGS.
In allowing for the credits from the sale of distillers grain, it has been assumed that the
product is dried to provide more flexibility in storage and use. Wet distillers grain, with its
limited storage life, handling characteristics, significantly lower value, and reliance on
local use, is likely to provide a lower co-product credit than the equivalent dried product.
Overall, credits will depend on the marketability of the various products.

208
Plant location
From a economic risk management perspective, it will be necessary to take into account
the availability of feedstock grain in a particular rural location (likely to be rather variable,
due to drought cycles, and the increasing likelihood of lower rainfall in many grain
growing regions, due to climate change). This will also impact on grain price; the level of
economic impact will depend on contractual arrangements for grain feedstock. The higher
cost of locating a plant near a port would be a small component of the overall plant cost,
and be offset by infrastructure advantages.
There is therefore a strong driver for location of the ethanol plant adjacent to alternative
sources of grain supply, eg imports or transfers from other regions of the country. This
favours location at a port, as being planned by Primary Energy for plants at Kwinana, and
Brisbane. For Primary Energy, the Kwinana site is also adjacent to the BP Refinery, with
BP being a key customer for the ethanol.
The biodigestion of the stillage (thereby avoiding production of DDGS) avoids the issue of
location, in the proximity of markets for the DDGS by-product. There is also the
possibility that the oversupply of DDGS in USA is likely to introduce cheaper imported
material and hence the profitability for Australian plants producing DDGS could be
affected.

209
10. REFERENCES
1 Renewable Fuels Association, “World ethanol production-all grades 2005”;
http://www.ethanolrfa.org/industry/statistics/
2 Bryan, K, “Ethanol developments in North America”, Paper presented at Ethanol
2006 Conference, Brisbane, 8-11 May 2006; www.ethanol2006.com.
3 Agra CEAS Consulting with Licht F O, “How Canada ranks: a comparative study
of national biofuels policies world-wide”, Report for Canadian Renewable Fuels
Association, 32pp, March 2006.
4 Pimentel, D, and Patzek, T W, “Ethanol production using corn, switchgrass and
wood: Biodiesel production using soybean and sunflower”, Natural Resources
Research, 14, 65-76, March 2005.
5 Renewable Fuels Association, “Summary RFS and renewable tax provisions: The
Energy Policy Act of 2005, Conference Report HR 6”, Issue Brief, Washington,
DC; www.ethanolrfa.org
6 Renewable Fuels Association, “President Bush Signs Historic Energy Bill Into
Law," News release, Washington, DC, August 8, 2005; www.ethanolrfa.org.
7 Trindade, S C, “Fuel ethanol globalization: Brazil and Latin America”, Paper
presented at Ethanol 2006 Conference, Brisbane, 8-11 May 2006;
www.ethanol2006.com
8 Tokgoz, S, and Elobeid, A, “Policy and competitiveness of US and Brazilian
ethanol”, Iowa Ag Review online, Spring 2006, Vol. 12, No.2;
http://www.card.iastate.edu/iowa_ag_review/spring_06/article3.aspx
9 OECD, “Agricultural market impacts of future growth in the production of
biofuels”. Working Party on Agricultural Policies and Markets, AGR/CA/APM
(2005)24/FINAL, 2006; www.oecd.org/dataoecd/58/62/36074135.pdf.
10 Ljunggren, D, “G8 Leaders’ cars to use eco-fuel made from straw”, The Epoch
Times, June 28, 2005; http://www.theepochtimes.com/news/5-6-28/29903.htML
11 Berg, C, 2004 “World fuel ethanol outlook 2005”; www.distill.com/World-Fuel-
Ethanol-A&O-2004.html
12 “Russia to build first bioethanol plant”, The Chemical Engineer, 16, 780, June 2006
13 Moriizumi, Y, “Ethanol developments in Japan”, Paper presented at Ethanol 2006
Conference, Brisbane, 8-11 May 2006; www.ethanol2006.com
14 Planet Ark, “Japan seeks better way to introduce bio-gasoline”, 20 July 2005;
www.planetark.com/dailynewsstory.cfm/newsid/31718/story.htm
15 Rendell, S, “Fuel ethanol production in the Murray and Murrumbidgee river
regions of Australia”, GRDC Research Updates, 2004.
www.grdc.com.au/growers/res_upd/irribation/i04/rendell.htm
16 Payne, S, “Federal government policies for the Australian ethanol industry”, Paper
presented at Ethanol 2006 Conference, Brisbane 8-11 May 2006;
www.ethanol2006.com
17 Prime Minister, “Biofuels target to be met”, News Room Media Release, 22
December, 2005; www.pm.gov.au/news/media_releases/media_Release1734.htML

210
18 Edgar, S, “Biofuel boom ignites crop profitability”, Australian Farm Journal, 6-9,
June 2006
19 www.dalbybiorefinery.com.au
20 Petroleum Exploration Society of Australia, “BP brings biofuels into the
mainstream”, PESA Newsletter, No. 61, April/May, 2006;
www.pesa.com.au/publications/pesa_ news/latest_edition/pesanews_8107.htML
21 ABC, “Wheat growers to supply ethanol plant”, ABC Newsonline, April 1, 2006;
www.abc.net.au/news/newsitems/s1606314.htm
22 Umwelt, “Gunnedah ethanol biorefinery project description report”, January2006;
www.planning.nsw.gov.au/asp/pdf/05_0112_03-project_description_report-
v2%20_final.pdf
23 NENWACC (New England North West Area Consultative Committee), “Ethanol
plant gets $1.1 million funding”, NENWACC News, November 2004
24 Mendez, T, “BP to double ethanol output at Kwinana”, the West Australian,
September 2006;
www.thewest.com.au/default.aspx?MenuID=28&ContentID=7379
25 Ash, P, (2006) “GrainCorp to service Primary Energy ethanol plant”, 2006;
www2.shawstockbroking.com.au/egoli/egoliNewsViewsPage.asp?PageID=%7B41
2CAB55-AB0F-4951-9F6E-33C546637635%7D
26 ABC, “Swan Hill ethanol plant funds found”, 17 March 2006;
http://abc.gov.au/news/items/200603/1594527.htm?milduraswanhill
27 ABC, “Construction begins on Swan Hill ethanol plant”, 21 August 2006;
www.abc.net.au/news/newsitems/200608/s1719505.htML
28 Bunbaberg Sugar, Submission to the Biofuels Taskforce, 24 June 2005;
www.dpmc.gov.au/biofuels/submissions/submission20.pdf
29 “Downs ethanol Christmas present”, Farmonline, 1 January 2005;
http://qcl.farmonline.com.au/news.asp?editorial_id=61409&class_id=1
30 www.grainol.com.au/operations.htML
31 www.babcockbrown.com
32 ABC, “Cattle feedlot to host ethanol plant”, 15 August 2006;
www.abc.net.au/news/newsitems/200608/s1715354.htML.
33 Noller, M, “$200m ethanol plant”, The Toowoomba Chronicle, 9 August 2006;
www.thechronicle.com.au/storyprint.cfm?ID=3695767
34 www.badgerstateethanol.com
35 Forster, L, “Corn to corn co-products-how we get there and why”, Paper presented
at 2006 Spring Conference of the Plains Nutrition Council, San Antonio, Texas, 6
April 2006
36 Maisch, W F, “Fermentation processes and products”, pp695-722, In: Corn
Chemistry and Technology, 2nd
edition, 2003, Pamela J White and Lawrence
Johnson (Eds), American Association of Cereal Chemists Inc, St Paul, MN
37 Tallent, P, Chief Chemist Manildra Group, personal communication, 2006

211
38 Monk, E, “The economics of ethanol production”, Paper presented at Ethanol 2006
Conference, Brisbane 8-11 May 2006; www.ethanol2006.com
39 Coventry, C, “Feedstock availability in Australia”, Paper presented at Ethanol 2006
pre-conference seminar - Ethanol 101, Brisbane 8-11 May 2006;
www.ethanol2006.com
40 Hamilton, C, “Biofuels made easy”, AIE Presentation, March 2004;
http://www.aie.org.au/melb/material/hamilton/Biofuels.pdf
41 Locke, L, “Advances in enzyme technology”. Paper presented at Ethanol 2006
Conference, Brisbane, 8-11 May 2006; www.ethanol2006.com
42 Singh, V, University of Illinois, Urbana-Champaign, personal communication,
2006
43 Shurson, J, and Noll, S, “Feed and alternative uses for DDGS”, 2005;
http://www.farmfoundation.org/projects/documents/Shurson-Nollpaper11-28-
05.pdf
44 Novozymes and BBI International, “Fuel ethanol-a technology revolution”, 18pp,
June 2005
45 Ethanol Producer, “The making of Broin Project X”, 2005;
www.ethanolproducer.com/article-print.jsp?article_id=604
46 Ethanol Producer, “Taking technological root”, 2005;
www.ethanolproducer.com/article-print.jsp?article_id=285
47 Swanson T (ICM Inc.) (2005) Growing the future together," BIOWA Conference,
Iowa State University, Ames, Iowa, August 29-30.
48 Cereal Process Technologies (2005) Memphis, Tennessee; www.cerealprocess.com
49 Satake Corporation (2005) UK Division, Stockport, England; www.satake.co.uk
50 NCGA (National Corn Growers Association) (2005);
www.ncga.com/news/notd/2005/July/070505.htm
51 Murphy G S, Singh V, Johnston D B, Rausch K D and Tumbleson M E. (2006),
“Evaluation and strategies to improve fermentation characteristics of modified dry
grind corn processes”, Cereal Chemistry (in Press)
52 Ponnampalam et al. (2004), Appl. Biochem Biotech,. 115:837-842
53 Dien at al. (2003), Appl. Biochem. Biotech, 115:937-949
54 Wang et al. (2005) Cereal Chem. 82:734-738.
55 Srinivasan et al. (2005) Cereal Chemistry. 82:528-533
56 E3 BioFuels (2005) The E3 BioSolution; www.e3biofuels.com/introduction.html
57 EnviroPlus (2006) Fossil fuel free and energy independent biofuels facility. Paper
presented at Ethanol 2006 Conference organized by BBI International, Brisbane 8-
11 May; www.ethanol2006.com
58 Paterson S (2006) Flottweg, Sydney (personal communication)
59 www.ethanolrfa.org

212
60 Chase, R (2006) Butanol to power UK cars. Timeslearder.com Northeastern
Pennsylvania’s Home Page, June 21.
www.timesleader.com/MLd/timesleader/14865792.htm
61 Anon (a) (2006), “BP:Bioscience proficient?”, The Chemical Engineer: 3, June,
781. July
62 Samson R (2004) Switchgrass: a living solar battery for the prairies,
www.eap.mcgill.ca/MagRack/SF/Fall%2091%20L.htm
63 Wooley R et al. (NREL) (1999) Lignocellulosic biomass to ethanol process design
and economics utilizing co-current dilute acid prehydrolysis enzymatic hydrolysis
current and future scenarios, NREL/TP-580-26157, National Renewable Energy
Laboratory/U.S. Department of Energy, Golden, Colorado, July.
64 McAloon A et al (USDA and NREL) (2000) Determining the cost of producing
ethanol from corn starch and lignocellulosic feedstocks NREL/TP-580-28893,
National Renewable Energy laboratory/US Department of Energy, Golden,
Colorado, October
65 Tolan J S (1999) Alcohol production from cellulosic biomass: the Iogen process, in
The Alcohol Textbook – A reference for the beverage, fuel, and industrial alcohol
industries, 3rd Edition, Nottingham University Press, United Kingdom.
66 Shleser R (1994) Ethanol production in Hawaii, Prepared for State of Hawaii
Department of Business, Economic Development & Tourism, Final report, July.
67 McMillan J D (NREL) (2003) Biomass-to-ethanol technology options, Paper
presented in Sacramento, California, April 15. www.nrel.gov/biomass/bios.html
68 Yawalata D and Paszner L (2004), “Anionic effects in high concentration
organosolvent pulping”, Holzforschung, Vol. 58, pp 1-6, January.
69 Muurinen E (2000) The Alcell Process, in Organosolv Pulping, Academic
Dissertation, presented to the Faculty of Technology, University of Oulu, Finland,
pp. 31-36, June 30.
70 Genencor (2004) Genencor meets first technical milestone in biomass to ethanol
project, http://www.ethanol-gec.org/fall2001/fall15.html
71 Genencor (2006) Ethanol from Paper Pulp: Genencor Announces French
Government Funded Project, www.genencor.com/wt/gcor/pr_1146502670
72 Purdue (2004) Purdue yeast makes ethanol from agricultural waste more
effectively, Purdue News, June 28, www.nancyho.info/Purdue_PressRelease. html
73 Yniguez (2004) Plans for ethanol plant kicked off,
http://www.elcentrochamber.org/newsmore.php?id=264
74 BlueFire Ethanol (2006), “BlueFire Ethanol signs long-term deal with Petro-
Diamond for purchase of waste derived ethanol”;
http://www.greencarcongress.com/2006/08/bluefire_ethano.html
75 Celunol Corporation (2006); www.bcintlcorp.com/jennings.htm
76 Nguyen Q (2005) Overcoming barriers to biomass ethanol commercialization,
World Congress on Industrial Biotechnology and Processing, Orlando, Florida,
April 20-22

213
77 Cahn D (2004); “For sale: A piece of Masada Action”;
http://archive.recordonline.com/archive/2004/06/29/dcmasada.htm
78 Agrol BioTechnologies Ltd (2005) Guildford, Surry, United Kingdom,
www.cc.94.dial.pipex.com
79 Bioenergy 2006 Bioenergy Newsletter, July, www.bioenergyaustralia.org
80 Energy Seeking (2006) Xethanol's New Ethanol Plant Leverages Pfizer Investment,
http://energy.seekingalpha.com/article/14058
81 Aden at al. (2002) Lignocellulosic biomass to ethanol processs design and
economics utilizing co-current dilute acid prehydrolysis and enzymatic hydrolysis
for corn stover. National Renewable Energy laboratory/US Department of Energy,
Golden, Colorado, May 30
82 “Ethanol plants under construction in the USA and Canada”, Biofuels Journal, 20
July 2006;
www.biofuelsjournal.com/articles/Ethanol_Plants_Under_Construction_in_the_Uni
ted_States_and_Canada
83 Umwelt (2006) Gunnedah ethanol biorefinery project description report,
January,12pp;www.planning.nsw.gov.au/asp/pdf/05_0112_03-
project_description_report-v2%20_final.pdf
84 “Gunnedah grain location at heart of planning new ethanol refinery”, Daily Leader,
July 2006
85 Biofuels (2006(a)) Ethanol plants under construction in the United States and
Canada, Biofuels Journal, July 20,
www.biofuelsjournal.com/articles/Ethanol%20Plants%20Under%20Construction%
20in%20the%20United%20States%20and%20Canada-25418.html
86 Broin (2006); www.broin.com
87 Vogelbusch (2006); www.vogelbusch.com
88 Grainol (2006); www.grainol.com.au
89 Vireol (2006); www.vireol.com
90 Rraj (2006); www.praj.net
91 Okanagan Biofuels, Business Plan Phase 1 (2005); www.bioscan-
supporter.dk/kelowna.pdf
92 Farm Enterprise Budget Series – North East NSW, NSW Department of Primary
Industries, http://www.agric.nsw.gov.au/reader/nedlsu/, 2006
93 Bill Manning, District Agronomist, Gunnedah, personal communication
94 Rodriguez, D, “Background study into greenhouse gas emissions from the grains
industry”, GRDC report DAV478
95 Dr Peter Carberry, CSIRO Sustainable Ecosystems, Toowoomba, personal
communication,
96 http://www.agric.nsw.gov.au/reader/nedlwi/wheat-sf-2006.pdf
97 Laird, P.G., “Land Freight Transport Energy Evaluation Main Report - Part One”,
ERDC, 1993
98 Personal communications, 1999

214
99 Graboski, M, “Fossil Energy Use in the Manufacture of Corn Ethanol” (National
Corn Growers Association, 2002)
100 Farrell, A E, et al, “Ethanol can contribute to energy and environmental goals”,
University of California, Berkeley, 2006; http://rael.berkeley.edu/EBAMM
101 Darby, J, CSIRO Entomology, private communication
102 Beer, T, CSIRO Marine and Atmospheric Research, personal communications
(2006).
103 Ammonia production,
http://publicdb.imi.chalmers.se/commdb/scripts/sheet.asp?actid=CPMXFRTOOL1
999-04-15835
104 Studies carried out by CSIRO for the CRC for Coal in Sustainable Development;
reports are not available to the public
105 Bush, S., Holmes, L., Trieu, L., 1995, “Australian energy consumption and
production – historical trends and projections to 2009-10”,
www.abare.gov.au/publications_html/energy/archive/nrg_consproduction.pdf
106 Australian petroleum statistics – November 2001, Australian Bureau of Statistics,
2002
107 Bioenergy conversion factors, Oak Ridge National Laboratory,
http://bioenergy.ornl.gov/papers/misc/energy_conv.html
108 Beer, T, et al, “Comparison of transport fuels”, report to Australian Greenhouse
Office; http://www.greenhouse.gov.au/transport/comparison/index.html
109 Narayanaswamy, V, et al, “Environmental life cycle assessment case studies for
Western Australian grain products”, May 2004, Curtin University of Technology;
http://www.c4cs.curtin.edu.au/resources/research/grains_lca_cases_final.pdf
110 Van Berkel, R, “Application of Life Cycle Assessment for improving the eco-
efficiency of supply chains”, Proceedings of Muresk Conference, Perth, October
2002.
111 Piringer, G, and Steinberg, L, “Reevaluation of energy use in wheat production in
the United States”, Journal of Industrial Ecology, Vol 10, Nos 1-2, pp149-167,
2006
112 Elsayed, M, Matthews, R, and Mortimer, N, “Carbon and Energy Balances for a
Range of Biofuel Options”, Sheffield Hallam University, March 2003;
http://www.shu.ac.uk/rru/reports/scp21-3_main_sections.pdf
113 Wang, M, “Energy and greenhouse gas emissions impacts of fuel ethanol”,
presented at NGCA Renewable Fuels forum, 23 August 2005;
www.anl.gov/Media_Center/News/2005/NCGA_Ethanol_Meeting_050823.ppt
114 CONCAWE Report no 2/02, “Energy and greenhouse gas balance of biofuels for
Europe – an update”, April 2002
115 Barr-Rosin (2006), Information supplied by manufacturer; www.barr-rosin.com
116 Atlas Stord (2006), Information supplied by manufacturer; www.atlas-stord.com