final utah greenhouse gas inventory and reference case
TRANSCRIPT

FINAL Utah GHG Inventory and Reference Case Projection CCS, July 2007
Final Utah Greenhouse Gas Inventory and
Reference Case Projections, 1990-2020
Center for Climate Strategies July 2007
Principal Authors: Stephen Roe, Randy Strait, Alison Bailie, Holly Lindquist, Alison Jamison

[This page intentionally left blank.]

Final Utah GHG Inventory and Reference Case Projection CCS, July 2007
Utah Department of iii Center for Climate Strategies Environmental Quality www.climatestrategies.us
Executive Summary
The Center for Climate Strategies (CCS) prepared this report for the Utah Department of Environmental Quality (UDEQ) under an agreement with the Western Governors’ Association. The report contains an inventory and forecast of the State’s greenhouse gas (GHG) emissions from 1990 to 2020. Utah’s anthropogenic GHG emissions and sinks (carbon storage) were estimated for the period from 1990 to 2020. Historical GHG emission estimates (1990 through 2005, or most recent historical year) were developed using a set of generally-accepted principles and guidelines for state GHG emission estimates, with adjustments by CCS to provide Utah-specific data and inputs when it was possible to do so. The initial reference case emission projections (2006-2020) are based on a compilation of various existing projections of electricity generation, fuel use, and other GHG-emitting activities, along with a set of transparent assumptions. Table ES-1 provides a summary of historical (1990, 2000 and 2005) and reference case projection (2010 and 2020) GHG emissions for Utah. Activities in Utah accounted for approximately 69 million metric tons (MMt) of gross1 carbon dioxide equivalent (CO2e) emissions in 2005, an amount equal to about 1% of total U.S. gross GHG emissions. Utah’s gross GHG emissions are rising at a faster rate than those of the nation as a whole (gross emissions exclude carbon sinks, such as forests). Utah’s gross GHG emissions increased 40% from 1990 to 2005, while national emissions rose by only 16% during this period. Figure ES-1 illustrates the State’s emissions per capita and per unit of economic output. On a per capita basis, Utahns emits about 27 metric tons (Mt) of CO2e annually, slightly higher than the national average of 25 MtCO2e/yr. As in the nation as a whole, per capita emissions in Utah have changed relatively little (with a slight decrease in the post-2000 period), while economic growth exceeded emissions growth throughout the 1990-2005 period (leading to declining estimates of GHG emissions per unit of state product). During the 1990s, emissions per unit of gross product dropped by 40% nationally, and by 52% in Utah. The principal source of Utah’s GHG emissions is electricity use (electricity production netting out electricity exports), accounting for 37% of total State gross GHG emissions in 2005 (see Table ES-1). The next largest contributors to total gross GHG emissions are the transportation sector (25%) and the residential, commercial, and industrial fossil fuel combustion sector (18%). As illustrated in Figure 2 and shown numerically in Table ES-1, under the reference case projections, Utah’s gross GHG emissions continue to grow, and are projected to climb to 96.1 MMtCO2e per year by 2020, 95% above 1990 levels. As shown in Figure ES-3, emissions associated with electricity generated to meet Utah’s demands is projected to be the largest contributor to future emissions growth, followed by emissions from the transportation sector. The figure shows that electricity generation will add more than 10 MMtCO2e to Utah’s emissions by 2020, while the transportation sector will add almost 6 MMtCO2e.
1 Excluding GHG emissions removed due to forestry and other land uses and excluding GHG emissions associated with exported electricity.
Final Utah GHG Inventory and Reference Case Projection CCS, July 2007
Utah Department of iv Center for Climate Strategies Environmental Quality www.climatestrategies.us
Some data gaps exist in this analysis, particularly for the reference case projections. Key tasks include review and revision of key emissions drivers (such as electricity, fossil fuel production, and transportation fuel use growth rates) that will be major determinants of Utah’s future GHG emissions. We expect that Utah’s ongoing climate change action planning process will shed light on these issues. Estimates of carbon sinks within Utah’s forests and agricultural soils have also been included in this report. For forests, the current estimates are based on data from the U.S Forest Service and indicate that about 12.3 MMtCO2e are sequestered annually in Utah forest biomass. As described in Appendix H however, there is a significant degree of uncertainty in the size of the forest sink in Utah. The estimates presented here are believed to be at the high end of the possible range of sequestration estimates. Emissions of aerosols, particularly “black carbon” (BC) from fossil fuel combustion, could have significant climate impacts through their effects on radiative forcing. Estimates of these aerosol emissions on a CO2e basis were developed for Utah based on 2002 and 2018 data from the WRAP. Estimated BC emissions for the year 2002 were a total of 4.9 MMtCO2e, which is the mid-point of a range of estimated emissions (3.1 – 6.6 MMtCO2e). Based on an assessment of the primary contributors, it is estimated that BC emissions will decrease substantially by 2018 after new engine and fuel standards take effect in the onroad and nonroad diesel engine sectors. Details of this analysis are presented in Appendix I to this report. These estimates are not incorporated into the totals shown in Table ES-1 below because a global warming potential for BC has not yet been assigned by the Intergovernmental Panel on Climate Change (IPCC).

Final Utah GHG Inventory and Reference Case Projection CCS, July 2007
Utah Department of v Center for Climate Strategies Environmental Quality www.climatestrategies.us
Table ES-1. Utah Historical and Reference Case GHG Emissions, by Sectora
(Million Metric Tons CO2e) 1990 2000 2005 2010 2020 Explanatory Notes for Projections Electricity Production 15.3 22.5 25.6 27.6 36.6 Coal 28.8 31.7 33.6 33.6 39.7 See electric sector assumptions Natural Gas 0.05 0.6 0.4 2.3 3.1 in Appendix A Oil 0.04 0.04 0.02 0.02 0.03 Net Exported Electricity -13.6 -9.9 -8.4 -8.4 -6.3 Res/Comm/Non-Fossil Ind (RCI) 14.1 15.7 12.2 13.7 16.3 Coal 5.1 5.1 1.4 1.5 1.6 Based on USDOE regional projections Natural Gas 6.5 8.3 7.7 8.7 10.7 Based on USDOE regional projections Oil 2.4 2.3 3.0 3.4 4.0 Based on USDOE regional projections Wood (CH4 and N2O) 0.02 0.03 0.02 0.02 0.02 Based on USDOE regional projections Transportation 10.9 16.1 16.9 18.4 22.4 Motor Gasoline 6.5 9.1 9.4 9.8 12.0 VMT projections from UDOT Diesel 2.1 3.5 4.3 5.2 7.1 VMT projections from UDOT Natural Gas, LPG, other 0.1 0.3 0.4 0.5 0.7 Projected based on historical data Jet Fuel and Aviation Gas 2.2 3.1 2.9 2.9 3.0 Aircraft operations projections from FAA Fossil Fuel Industry 2.5 3.1 4.1 4.4 4.6 Natural Gas Industry 0.8 1.8 1.9 2.1 2.4 Historical trends and USDOE regional Oil Industry 0.2 0.1 0.1 0.1 0.1 projections Coal Mining (Methane) 1.4 1.1 2.1 2.1 2.1 Held flat at 2004 levels Industrial Processes 2.2 2.8 3.7 4.3 5.8 Cement Manufacture 0.5 0.8 0.9 0.9 1.1 Utah manufacturing employment growth Lime Manufacture 0.3 0.5 0.6 0.7 0.8 Utah manufacturing employment growth Limestone and Dolomite Use 0.04 0.1 0.1 0.1 0.1 Utah manufacturing employment growth Nitric Acid Production 0.2 0.1 0.1 0.1 0.1 Utah manufacturing employment growth ODS Substitutes 0.002 0.6 1.1 1.6 2.7 EPA 2004 ODS cost study report Semiconductor Manufacture 0.002 0.005 0.003 0.002 0.001 Based on national projections (USEPA) Magnesium Production 1.0 0.7 0.9 0.9 1.1 Utah manufacturing employment growth SF6 from Electric Utilities 0.2 0.1 0.1 0.1 0.04 Based on national projections (USEPA) Waste Management 1.1 1.7 2.0 2.7 4.7 Solid Waste Management 0.9 1.4 1.7 2.3 4.2 Projected based on 1996-2005 trend Wastewater Management 0.2 0.3 0.3 0.4 0.5 Projected based on population Agriculture 3.1 4.0 4.2 4.6 5.8 Manure Management 1.2 1.4 1.5 1.6 1.9 USDA livestock projections Enteric Fermentation 0.3 0.6 0.7 0.9 1.5 USDA livestock projections Agricultural Soils 1.6 1.8 1.7 1.8 1.9 Projected based on historical trend Agricultural Residue Burning 0.001 0.001 0.001 0.001 0.001 No growth assumed Total Gross Emissions 49.3 65.6 68.8 75.6 96.1 increase relative to 1990 34% 40% 54% 95%
Forestry and Land Use -12.3 -12.3 -12.3 -12.3 -12.3 Historical and projected flux held at 2004 levels (excludes soil carbon flux)
Agricultural Soils -0.7 -0.7 -0.7 -0.7 -0.7 Historical and projected emissions held at 1997 level
Net Emissions (including sinks) 37.0 53.6 56.5 63.4 83.8 increase relative to 1990 45% 53% 72% 127%
a Totals may not equal exact sum of subtotals shown in this table due to independent rounding. NA = not available.

Final Utah GHG Inventory and Reference Case Projection CCS, July 2007
Utah Department of vi Center for Climate Strategies Environmental Quality www.climatestrategies.us
Figure ES-1. Historical Utah and U.S. GHG Emissions, Per Capita and Per Unit Gross Product, 1990-2005
5
10
15
20
25
30
35
1990 1995 2000 2005
US GHG/Capita(tCO2e)
UT GHG/Capita(tCO2e)
US GHG/$(100gCO2e)
UT GHG/$(100gCO2e)
Figure ES-2. Utah Gross GHG Emissions by Sector, 1990-2020: Historical and Projected
0
20
40
60
80
100
1990 1995 2000 2005 2010 2015 2020
MM
tCO
2e
Electricity - in-state Fossil Fuel Industry RCI Fuel UseTransport Gasoline Use Transport Diesel Use Jet Fuel/Other TransportAgriculture ODS Substitutes Other Ind. ProcessWaste Management

Final Utah GHG Inventory and Reference Case Projection CCS, July 2007
Utah Department of vii Center for Climate Strategies Environmental Quality www.climatestrategies.us
Figure ES-3. Sector Contributions to Emissions Growth in Utah, 1990-2020: Reference Case Projections
-4.0 -2.0 0.0 2.0 4.0 6.0 8.0 10.0 12.0
Electricity Production (consumption-based)
RCI Fuel Use
Fossil Fuel Industry
Transport
ODS Substitutes (HFCs)
Other Ind. Process
Agriculture
Waste Management
MMtCO2e
2020 - 2005
2005 - 1990

Final Utah GHG Inventory and Reference Case Projection CCS, July 2007
Utah Department of viii Center for Climate Strategies Environmental Quality www.climatestrategies.us
Table of Contents
Executive Summary ....................................................................................................................... iii Acronyms and Key Terms ............................................................................................................. ix Acknowledgements....................................................................................................................... xii Summary of Preliminary Findings.................................................................................................. 1 Utah Greenhouse Gas Emissions: Sources and Trends .................................................................. 2 Historical Emissions .................................................................................................................... 4
A Closer Look at the Two Major Sources: Electricity and Transportation ............................ 6 Reference Case Projections.......................................................................................................... 7 Key Uncertainties and Next Steps .................................................................................................. 7 Approach....................................................................................................................................... 10
Appendix A. Electricity Use and Supply.................................. A-Error! Bookmark not defined. Appendix B. Residential, Commercial, and Industrial (RCI) Fossil Fuel Combustion..... B-Error!
Bookmark not defined. Appendix C. Transportation Energy Use...................................C-Error! Bookmark not defined. Appendix D. Industrial Processes ............................................. D-Error! Bookmark not defined. Appendix E. Fossil Fuel Industries............................................E-Error! Bookmark not defined. Appendix F. Agriculture ...........................................................F-Error! Bookmark not defined. Appendix G. Waste Management ............................................. G-Error! Bookmark not defined. Appendix H. Forestry................................................................ H-Error! Bookmark not defined. Appendix I. Inventory and Forecast for Black Carbon.............. I-Error! Bookmark not defined. Appendix J. Greenhouse Gases and Global Warming Potential Values: Excerpts from the
Inventory of U.S. Greenhouse Emissions and Sinks: 1990-2000.................. J-Error! Bookmark not defined.

Final Utah GHG Inventory and Reference Case Projection CCS, July 2007
Utah Department of ix Center for Climate Strategies Environmental Quality www.climatestrategies.us
Acronyms and Key Terms
AEO – Annual Energy Outlook, EIA
Ag – Agriculture
bbls – Barrels
BC – Black Carbon
Bcf – Billion Cubic Feet
BLM – United States Bureau of Land Management
BOC – Bureau of Census
BTU – British Thermal Unit
C – Carbon
CaCO3 – Calcium Carbonate
CBM – Coal Bed Methane
CCS – Center for Climate Strategies
CFCs – Chlorofluorocarbons
CH4 – Methane*
CO2 – Carbon Dioxide*
CO2e – Carbon Dioxide Equivalent*
CRP – Federal Conservation Reserve Program
EC – Elemental Carbon
eGRID – U.S. EPA’s Emissions & Generation Resource Integrated Database
EIA – U.S. DOE Energy Information Administration
EIIP – Emissions Inventory Improvement Project (US EPA)
FIA – Forest Inventory Analysis
GHG – Greenhouse Gases*
GSP – Gross State Product
GWh – Gigawatt-hour
GWP - Global Warming Potential*
HFCs – Hydrofluorocarbons*
HNO3 – Nitric Acid
HWP – Harvested Wood Products
IPCC – Intergovernmental Panel on Climate Change*
kWh – Kilowatt-hour

Final Utah GHG Inventory and Reference Case Projection CCS, July 2007
Utah Department of x Center for Climate Strategies Environmental Quality www.climatestrategies.us
LFGTE – Landfill Gas Collection System and Landfill-Gas-to-Energy
LMOP – Landfill Methane Outreach Program
LNG – Liquefied Natural Gas
LPG – Liquefied Petroleum Gas
Mg – Megagrams (equivalent to one metric ton)
Mt - Metric Ton (equivalent to 1.102 short tons)
MMt – Million Metric Tons
MPO – Metropolitan Planning Organization
MSW – Municipal Solid Waste
MW – Megawatt
N – Nitrogen
N2O – Nitrous Oxide*
NO2 – Nitrogen Dioxide*
NAICS – North American Industry Classification System
NASS – National Agricultural Statistics Service
NOx – Nitrogen Oxides
NSCR – Non-selective Catalytic Reduction
ODS – Ozone-Depleting Substances
OM – Organic Matter
PADD – Petroleum Administration for Defense Districts
PFCs – Perfluorocarbons*
PM – Particulate Matter
ppb – parts per billion
ppm – parts per million
ppt – parts per trillion
PSCo – Public Service Company of Utah
PV – Photovoltaic
RCI – Residential, Commercial, and Industrial
RPA – Resources Planning Act Assessment
RPS – Renewable Portfolio Standard
SAR – Second Assessment Report
SCR- Selective Catalytic Reduction

Final Utah GHG Inventory and Reference Case Projection CCS, July 2007
Utah Department of xi Center for Climate Strategies Environmental Quality www.climatestrategies.us
SED – State Energy Data
SF6 – Sulfur Hexafluoride*
SGIT – State Greenhouse Gas Inventory Tool
Sinks – Removals of carbon from the atmosphere, with the carbon stored in forests, soils, landfills, wood structures, or other biomass-related products.
TAR – Third Assessment Report
T&D – Transmission and Distribution
TWh – Terawatt-hours
UDOT – Utah Department of Transportation
UGS – Utah Geological Survey
UNFCCC – United Nations Framework Convention on Climate Change
U.S. EPA – United States Environmental Protection Agency
U.S. DOE – United States Department of Energy
USDA – United States Department of Agriculture
USFS – United States Forest Service
USGS – United States Geological Survey
UDEQ – Utah Department of Environmental Quality
UT - Utah
VMT – Vehicle-Miles Traveled
WAPA – Western Area Power Administration
WECC – Western Electricity Coordinating Council
W/m2 – Watts per Square Meter
WMO – World Meteorological Organization*
WRAP – Western Regional Air Partnership
* - See Appendix J for more information.
Final Utah GHG Inventory and Reference Case Projection CCS, July 2007
Utah Department of xii Center for Climate Strategies Environmental Quality www.climatestrategies.us
Acknowledgements
CCS appreciates all of the time and assistance provided by numerous contacts throughout Utah, as well as in neighboring states, and at federal agencies. Thanks go to the many staff at several Utah state agencies for their inputs, and in particular to Michael Vanden Berg of the Utah Department of Natural Resources, Utah Geological Survey and to Patrick Barickman, Scott Hanks, Brock LeBaron, Ran MacDonald, Deborah McMurtrie, Carol Nielsen, Glade Sowards, Richard Sprott, and Peter Verschoor of the Utah Department of Environmental Quality, Division of Air Quality, who provided key guidance and review for this analytical effort. The authors would also like to express their appreciation to the additional CCS reviewers: Katie Bickel, Michael Lazarus, Lewison Lem, and David Von Hippel.

Final Utah GHG Inventory and Reference Case Projection CCS, July 2007
Utah Department of Environmental Quality
1
Center for Climate Strategies www.climatestrategies.us
Summary of Preliminary Findings Introduction The Center for Climate Strategies (CCS) prepared this report for the Utah Department of Environmental Quality (UDEQ) under an agreement with the Western Governors’ Association. This report presents initial estimates of base year and projected Utah anthropogenic greenhouse gas (GHG) emissions and sinks for the period from 1990 to 2020. These estimates are intended to assist the State with an initial, comprehensive understanding of current and possible future GHG emissions for Utah, and, thereby, to inform future analysis and design of GHG mitigation strategies. Historical GHG emissions estimates (1990 through 2005)2 were developed using a set of generally accepted principles and guidelines for state GHG emissions inventories, as described in Section 2, relying to the extent possible on Utah-specific data and inputs. The initial reference case projections (2006-2020) are based on a compilation of various existing projections of electricity generation, fuel use, and other GHG-emitting activities, along with a set of simple, transparent assumptions described in the appendices of this report. This report covers the six types of gases included in the U.S. Greenhouse Gas Inventory: carbon dioxide (CO2), methane (CH4), nitrous oxide (N2O), hydrofluorocarbons (HFCs), perfluorocarbons (PFCs), and sulfur hexafluoride (SF6). Emissions of these GHGs are presented using a common metric, CO2 equivalence (CO2e), which indicates the relative contribution of each gas to global average radiative forcing on a Global Warming Potential- (GWP-) weighted basis. The final appendix to this report provides a more complete discussion of GHGs and GWPs. Emissions of black carbon were also estimated. Black carbon (BC) is an aerosol species with a positive climate forcing potential (that is, the potential to warm the atmosphere, as GHGs do); however, black carbon currently does not have a GWP defined by the IPCC due to uncertainties in both the direct and indirect effects of BC on atmospheric processes (see Appendices I and J for more details). It is important to note that the preliminary emission estimates reflect the GHG emissions associated with the electricity sources used to meet Utah’s demands, corresponding to a consumption-based approach to emissions accounting (see Approach Section below). Another way to look at electricity emissions is to consider the GHG emissions produced by electricity generation facilities in the State. For many years, Utah power plants have tended to produce more electricity than is consumed in the State; emissions associated with exported electricity are excluded from the consumption-based emissions. This report covers both methods of accounting for emissions, but for consistency, all total results are reported as consumption-based.
2 The last year of available historical data varies by sector; ranging from 2000 to 2005.
Final Utah GHG Inventory and Reference Case Projection CCS, July 2007
Utah Department of Environmental Quality
2
Center for Climate Strategies www.climatestrategies.us
Utah Greenhouse Gas Emissions: Sources and Trends Table 1 provides a summary of GHG emissions estimated for Utah by sector for the years 1990, 2000, 2005, 2010, and 2020. In the sections below, we discuss GHG emission sources (positive, or gross, emissions) and sinks (negative emissions) separately in order to identify trends, projections and uncertainties for each. This next section of the report provides a summary of the historical emissions (1990 through 2005) followed by a summary of the forecasted reference-case projection-year emissions (2006 through 2020), key uncertainties, and suggested next steps. CCS also provides an overview of the general methodology, principles, and guidelines followed for preparing the inventories. Appendices A through H provide the detailed methods, data sources, and assumptions for each GHG sector. Appendix I provides information on 2002 and 2018 BC estimates for Utah. CCS estimated that BC emissions in 2002 ranged from 3.1 – 6.6 MMtCO2e with a mid-point of 4.9 MMtCO2e. A range is estimated based on the uncertainty in the global modeling analyses that serve as the basis for converting BC mass emissions into their carbon dioxide equivalents (see Appendix I for more details). Since the IPCC has not yet assigned a global warming potential for BC, CCS has excluded these estimates from the GHG summary shown in Table 1 below. Based on an assessment of 2018 forecasted emissions for the primary BC contributors from the Western Regional Air Partnership (WRAP), it is estimated that BC emissions will decrease significantly by 2018 after new engine and fuel standards take effect in the onroad and nonroad diesel engine sectors. About 3.7 MMtCO2e was estimated for 2002 BC emissions. Emissions are expected to decrease to 0.9 MMtCO2e by 2018. Appendix I contains a detailed breakdown of emissions contribution by source sector. Appendix J provides background information on GHGs and climate-forcing aerosols.

Final Utah GHG Inventory and Reference Case Projection CCS, July 2007
Utah Department of Environmental Quality
3
Center for Climate Strategies www.climatestrategies.us
Table 1. Utah Historical and Reference Case GHG Emissions, by Sectora
(Million Metric Tons CO2e) 1990 2000 2005 2010 2020 Explanatory Notes for Projections Electricity Production 15.3 22.5 25.6 27.6 36.6 Coal 28.8 31.7 33.6 33.6 39.7 See electric sector assumptions Natural Gas 0.05 0.6 0.4 2.3 3.1 in Appendix A Oil 0.04 0.04 0.02 0.02 0.03 Net Exported Electricity -13.6 -9.9 -8.4 -8.4 -6.3 Res/Comm/Non-Fossil Ind (RCI) 14.1 15.7 12.2 13.7 16.3 Coal 5.1 5.1 1.4 1.5 1.6 Based on USDOE regional projections Natural Gas 6.5 8.3 7.7 8.7 10.7 Based on USDOE regional projections Oil 2.4 2.3 3.0 3.4 4.0 Based on USDOE regional projections Wood (CH4 and N2O) 0.02 0.03 0.02 0.02 0.02 Based on USDOE regional projections Transportation 10.9 16.1 16.9 18.4 22.4 Motor Gasoline 6.5 9.1 9.4 9.8 12.0 VMT projections from UDOT Diesel 2.1 3.5 4.3 5.2 7.1 VMT projections from UDOT Natural Gas, LPG, other 0.1 0.3 0.4 0.5 0.7 Projected based on historical data Jet Fuel and Aviation Gas 2.2 3.1 2.9 2.9 3.0 Aircraft operations projections from FAA Fossil Fuel Industry 2.5 3.1 4.1 4.4 4.6 Natural Gas Industry 0.8 1.8 1.9 2.1 2.4 Historical trends and USDOE regional Oil Industry 0.2 0.1 0.1 0.1 0.1 projections Coal Mining (Methane) 1.4 1.1 2.1 2.1 2.1 Held flat at 2004 levels Industrial Processes 2.2 2.8 3.7 4.3 5.8 Cement Manufacture 0.5 0.8 0.9 0.9 1.1 Utah manufacturing employment growth Lime Manufacture 0.3 0.5 0.6 0.7 0.8 Utah manufacturing employment growth Limestone and Dolomite Use 0.04 0.1 0.1 0.1 0.1 Utah manufacturing employment growth Nitric Acid Production 0.2 0.1 0.1 0.1 0.1 Utah manufacturing employment growth ODS Substitutes 0.002 0.6 1.1 1.6 2.7 EPA 2004 ODS cost study report Semiconductor Manufacture 0.002 0.005 0.003 0.002 0.001 Based on national projections (USEPA) Magnesium Production 1.0 0.7 0.9 0.9 1.1 Utah manufacturing employment growth SF6 from Electric Utilities 0.2 0.1 0.1 0.1 0.04 Based on national projections (USEPA) Waste Management 1.1 1.7 2.0 2.7 4.7 Solid Waste Management 0.9 1.4 1.7 2.3 4.2 Projected based on 1996-2005 trend Wastewater Management 0.2 0.3 0.3 0.4 0.5 Projected based on population Agriculture 3.1 4.0 4.2 4.6 5.8 Manure Management 1.2 1.4 1.5 1.6 1.9 USDA livestock projections Enteric Fermentation 0.3 0.6 0.7 0.9 1.5 USDA livestock projections Agricultural Soils 1.6 1.8 1.7 1.8 1.9 Projected based on historical trend Agricultural Residue Burning 0.001 0.001 0.001 0.001 0.001 No growth assumed Total Gross Emissions 49.3 65.9 68.8 75.7 96.1 increase relative to 1990 34% 40% 54% 95%
Forestry and Land Use -12.3 -12.3 -12.3 -12.3 -12.3 Historical and projected emissions held at 2004 level (excludes soil carbon flux)
Agricultural Soils -0.7 -0.7 -0.7 -0.7 -0.7 Historical and projected emissions held at 1997 level
Net Emissions (including sinks) 37.0 53.6 56.5 63.4 83.8 increase relative to 1990 45% 53% 72% 127%
a Totals may not equal exact sum of subtotals shown in this table due to independent rounding. NA = not available.

Final Utah GHG Inventory and Reference Case Projection CCS, July 2007
Utah Department of Environmental Quality
4
Center for Climate Strategies www.climatestrategies.us
Historical Emissions Overview Our analyses suggest that in 2005, activities in Utah accounted for approximately 68.8 million metric tons (MMt) of gross3 CO2e emissions, an amount equal to 1% of total U.S. gross GHG emissions. Utah’s gross GHG emissions are rising at a faster rate than those of the nation as a whole (gross emissions exclude carbon sinks, such as forests). Utah’s gross GHG emissions increased by about 40% from 1990 to 2005, while national emissions rose by 16% during the same period. On a per capita basis, Utahns emitted about 27 metric tons (Mt) of CO2e in 2005, slightly higher than the national average of 25 MtCO2e/yr. Figure 1 illustrates the State’s emissions per capita and per unit of economic output. Unlike the nation as a whole, where per capita emissions have changed relatively little, per capita emissions have dropped slightly. The figure also shows that economic growth has exceeded emissions growth in Utah throughout the 1990-2005 timeframe. From 1990 to 2005, emissions per unit of gross product dropped by 40% nationally and by 52% in Utah.
Figure 1. Utah and US Gross GHG Emissions, Per Capita and Per Unit Gross Product, 1990-2005
5
10
15
20
25
30
35
1990 1995 2000 2005
US GHG/Capita(tCO2e)
UT GHG/Capita(tCO2e)
US GHG/$(100gCO2e)
UT GHG/$(100gCO2e)
3 Excluding GHG emissions removed due to forestry and other land uses and excluding GHG emissions associated with exported electricity.
Final Utah GHG Inventory and Reference Case Projection CCS, July 2007
Utah Department of Environmental Quality
5
Center for Climate Strategies www.climatestrategies.us
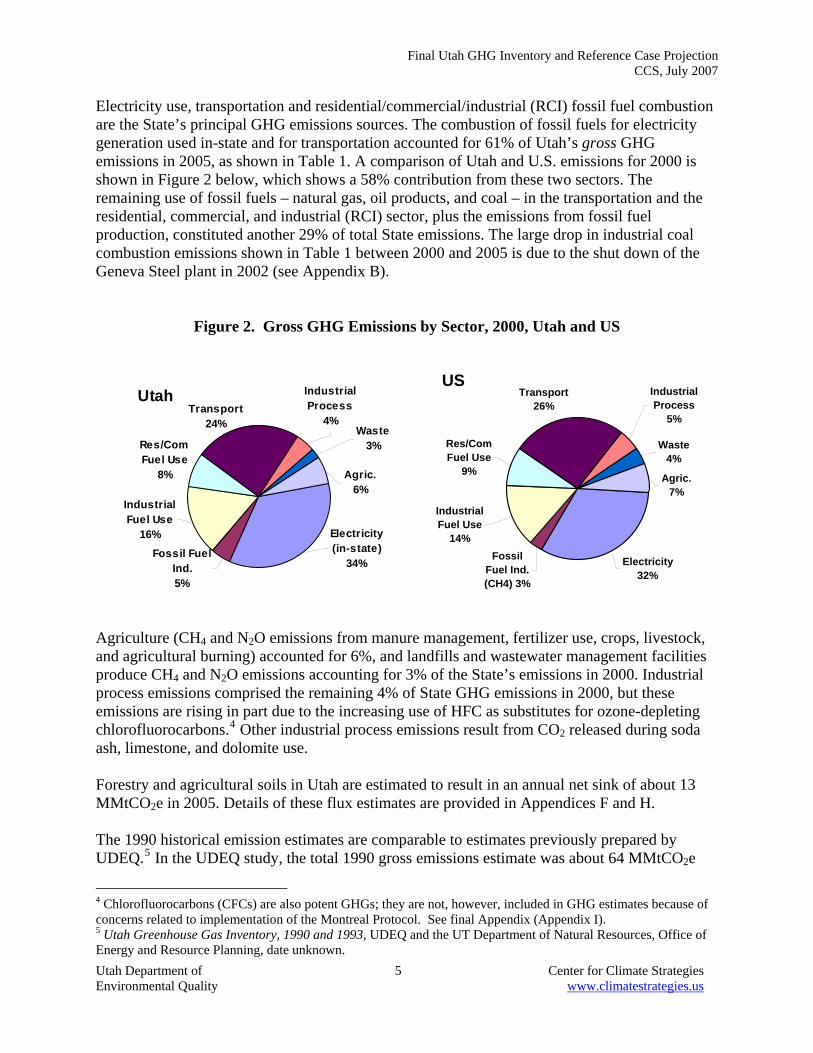
Electricity use, transportation and residential/commercial/industrial (RCI) fossil fuel combustion are the State’s principal GHG emissions sources. The combustion of fossil fuels for electricity generation used in-state and for transportation accounted for 61% of Utah’s gross GHG emissions in 2005, as shown in Table 1. A comparison of Utah and U.S. emissions for 2000 is shown in Figure 2 below, which shows a 58% contribution from these two sectors. The remaining use of fossil fuels – natural gas, oil products, and coal – in the transportation and the residential, commercial, and industrial (RCI) sector, plus the emissions from fossil fuel production, constituted another 29% of total State emissions. The large drop in industrial coal combustion emissions shown in Table 1 between 2000 and 2005 is due to the shut down of the Geneva Steel plant in 2002 (see Appendix B).
Figure 2. Gross GHG Emissions by Sector, 2000, Utah and US
Utah
Res/Com Fuel Use
8%
Fossil Fuel Ind.5%
Industrial Fuel Use
16%
Transport24%
Industrial Process
4%Waste
3%
Agric.6%
Electricity (in-state)
34%
Transport26%
Industrial Process
5%
Res/Com Fuel Use
9%
Fossil Fuel Ind. (CH4) 3%
Industrial Fuel Use
14%
Waste4%
Electricity32%
Agric.7%
US
Agriculture (CH4 and N2O emissions from manure management, fertilizer use, crops, livestock, and agricultural burning) accounted for 6%, and landfills and wastewater management facilities produce CH4 and N2O emissions accounting for 3% of the State’s emissions in 2000. Industrial process emissions comprised the remaining 4% of State GHG emissions in 2000, but these emissions are rising in part due to the increasing use of HFC as substitutes for ozone-depleting chlorofluorocarbons.4 Other industrial process emissions result from CO2 released during soda ash, limestone, and dolomite use. Forestry and agricultural soils in Utah are estimated to result in an annual net sink of about 13 MMtCO2e in 2005. Details of these flux estimates are provided in Appendices F and H. The 1990 historical emission estimates are comparable to estimates previously prepared by UDEQ.5 In the UDEQ study, the total 1990 gross emissions estimate was about 64 MMtCO2e
4 Chlorofluorocarbons (CFCs) are also potent GHGs; they are not, however, included in GHG estimates because of concerns related to implementation of the Montreal Protocol. See final Appendix (Appendix I). 5 Utah Greenhouse Gas Inventory, 1990 and 1993, UDEQ and the UT Department of Natural Resources, Office of Energy and Resource Planning, date unknown.

Final Utah GHG Inventory and Reference Case Projection CCS, July 2007
Utah Department of Environmental Quality
6
Center for Climate Strategies www.climatestrategies.us
compared to the estimate provided in Table 1 of 63 MMtCO2e. Note that the emissions for electricity exports (13.6 MMtCO2e) need to be added to the gross emissions total to make this comparison. Figure 3 shows the historical and forecasted emissions for all sectors and all pollutants in CO2e. The two largest contributing sectors to emissions growth are electricity consumption and transportation emissions. This is shown graphically in Figure 4, which shows that the electricity consumption sector will add over 10 MMtCO2e/yr to Utah’s emissions by 2020, while the transportation sector will add almost 6 MMtCO2e/yr. This figure also shows that these two sectors have been the strongest contributors to historic emissions growth since 1990. A Closer Look at the Two Major Sources: Electricity and Transportation As shown in Table 1, electricity use accounted for about 37% of Utah’s gross GHG emissions in 2005 (25.6 MMtCO2e), which was slightly higher than the national share of emissions from electricity production (32%).6 In total (across the residential, commercial and industrial sectors), Utah has a lower per capita use of electricity than the U.S. as a whole (10,000 kWh per person per year compared to 12,000 kWh/person-yr nationally), which means that the carbon content of electricity consumed in the state is higher than the U.S. as a whole. It is important to note that these preliminary electricity emissions estimates reflect the GHG emissions associated with the electricity sources used to meet Utah demands, corresponding to a consumption-based approach to emissions accounting (see Section 2). Another way to look at electricity emissions is to consider the GHG emissions produced by electricity generation facilities in the State. Utah power plants produce more electricity than is consumed in the State – in the year 2000, for example, Utah exported 28% of the electricity produced in the State. As a result, in 2000, emissions associated with electricity consumption (22.5 MMtCO2e) were much lower than those associated with electricity production (32.4 MMtCO2e).7 While CCS estimated emissions associated with both electricity production and consumption, unless otherwise indicated, tables, figures, and totals in this report reflect electricity consumption-based emissions. The consumption-based approach can better reflect the emissions (and emissions reductions) associated with activities occurring in the State, particularly with respect to electricity use (and efficiency improvements), and is particularly useful for policy-making. Under this approach, emissions associated with electricity exported to other States would need to be covered in those States’ accounts in order to avoid double-counting or exclusions. Arizona, California, Oregon, New Mexico, and Washington are currently considering such an approach. Data to account for the electricity imported into Utah were not factored into the analysis conducted for this report.
6 Unlike for Utah, for the U.S. as a whole, there is relatively little difference between the emissions from electricity use and emissions from electricity production, as the U.S. imports only about 1% of its electricity, and exports far less. 7 Estimating the emissions associated with electricity use requires an understanding of the electricity sources (both in-state and out-of-state) used by utilities to meet consumer demand. The current estimate reflects some very simple assumptions described in Appendix A.

Final Utah GHG Inventory and Reference Case Projection CCS, July 2007
Utah Department of Environmental Quality
7
Center for Climate Strategies www.climatestrategies.us
Like electricity emissions, GHG emissions from transportation fuel use have risen steadily since 1990 at an average rate of slightly over 3% annually. Gasoline-powered vehicles accounted for about 55% of transportation GHG emissions in 2005. Diesel vehicles accounted for another 25% of emissions and air travel for roughly 17%. Marine gasoline, locomotives, and other sources [natural gas and liquefied petroleum gas (LPG) vehicles and lubricants] accounted for the remaining 3% of transportation emissions. As the result of Utah’s population and economic expansion and an increase in total vehicle miles traveled during the 1990s, onroad gasoline use grew by 45% between 1990 and 2005. Meanwhile, onroad diesel use more than doubled during this period, suggesting an even more rapid growth in freight movement within the State. Aviation fuel use grew by 32% from 1990-2005. Reference Case Projections Relying on a variety of sources for projections of electricity and fuel use, as noted below and in the Appendices, we developed a simple reference case projection of GHG emissions through 2020. As illustrated in Figure 3 and shown numerically in Table 1, under the reference case projections, Utah gross GHG emissions continue to grow steadily, climbing to 98 MMTCO2e by 2020, 98% above 1990 levels. Electricity use is projected to be the largest contributor to future emissions growth, followed by the transportation sector and RCI fossil fuel use. Key Uncertainties and Next Steps
Some data gaps exist in this inventory, and particularly in the reference case projections. Key tasks that should be performed in future updates include review and revision of key drivers, such as the electricity and transportation fuel use growth rates that will be major determinants of Utah’s future GHG emissions (see Table 1). These growth rates are driven by uncertain economic, demographic, and land use trends (including growth patterns and transportation system impacts), all of which deserve closer review and discussion. Perhaps the variable with the most important implications for GHG emissions is the type and number of power plants built in Utah between now and 2020. The assumptions on VMT and air travel growth also have large impacts on the GHG emission growth in the State. Finally, uncertainty remains regarding the estimates for historic GHG sinks from forestry, and projections for these emissions will greatly affect the net GHG emissions attributed to Utah.

Final Utah GHG Inventory and Reference Case Projection CCS, July 2007
Utah Department of Environmental Quality
8
Center for Climate Strategies www.climatestrategies.us
Figure 3. Utah Gross GHG Emissions by Sector, 1990-2020: Historical and Projected
0
20
40
60
80
100
1990 1995 2000 2005 2010 2015 2020
MM
tCO
2e
Electricity - in-state Fossil Fuel Industry RCI Fuel UseTransport Gasoline Use Transport Diesel Use Jet Fuel/Other TransportAgriculture ODS Substitutes Other Ind. ProcessWaste Management
*RCI – direct fuel use in residential, commercial and industrial sectors (excluding the fossil fuel production industry)
Figure 4. Sector Contributions to Emissions Growth in Utah, 1990-2020: Historic and Reference Case Projections
-4.0 -2.0 0.0 2.0 4.0 6.0 8.0 10.0 12.0
Electricity Production (consumption-based)
RCI Fuel Use
Fossil Fuel Industry
Transport
ODS Substitutes (HFCs)
Other Ind. Process
Agriculture
Waste Management
MMtCO2e
2020 - 2005
2005 - 1990
*RCI – direct fuel use in residential, commercial and industrial sectors (excluding the fossil fuel production industry)

Final Utah GHG Inventory and Reference Case Projection CCS, July 2007
Utah Department of Environmental Quality
9
Center for Climate Strategies www.climatestrategies.us
Table 3. Key Annual Growth Rates for Utah, Historical and Projected
Key Parameter 1990-
2005 2005-2020
Sources
Population 2.6% 2.1% The Utah Governor's Office of Planning and Budget
Employment Goods Services
2.3% 3.2%
2.4% 1.6%
Utah Department of Workforce Services, The Utah Governor's Office of Planning and Budget
Electricity Sales 3.3% 3.3% EIA data for 1990-2005, Rocky Mountain power for projections
Vehicle Miles Traveled
3.8% 2.3% Utah Department of Transportation
* Population and employment projections for Utah were used together with US DOE’s Annual Energy Outlook 2006 projections of changes in fuel use on a per capita and per employee, as relevant for each sector. For instance, growth in Utah’s residential natural gas use is calculated as the Utah population growth times the change in per capita natural gas use for the Mountain region.
Emissions of aerosols, particularly black carbon from fossil fuel combustion, could have significant impacts in terms of radiative forcing (that is, climate impacts). Methodologies for conversion of black carbon mass estimates and projections to global warming potential involve significant uncertainty at present, but CCS has developed and used a recommended approach for estimating black carbon emissions based on methods used in other States. Current estimates suggest a CO2e contribution of about 7% overall from BC emissions, as compared to the CO2e contributed from the gases (4.9 MMtCO2e from BC in 2002 compared to 66 MMtCO2e from the six GHGs). Emissions from two primary contributing sectors (onroad and nonroad diesel combustion) are expected to decline by 2020 due to new engine and fuel standards.

Final Utah GHG Inventory and Reference Case Projection CCS, July 2007
Utah Department of Environmental Quality
10
Center for Climate Strategies www.climatestrategies.us
Approach The principal goal of compiling the inventories and reference case projections presented in this document is to provide the State with a general understanding of Utah’s historical, current, and projected (expected) GHG emissions. The following explains the general methodology and the general principles and guidelines followed during development of these GHG inventories for Utah. General Methodology CCS prepared this analysis in close consultation with Utah agencies, in particular, with the UDEQ staff. The overall goal of this effort is to provide simple and straightforward estimates, with an emphasis on robustness, consistency, and transparency. As a result, we rely on reference forecasts from best available state and regional sources where possible. Where reliable forecasts are lacking, we use straightforward spreadsheet analysis and linear extrapolations of historical trends rather than complex modeling. In most cases, we follow the same approach to emissions accounting for historical inventories used by the U.S. EPA in its national GHG emissions inventory8 and its guidelines for States.9 These inventory guidelines were developed based on the guidelines from the Intergovernmental Panel on Climate Change, the international organization responsible for developing coordinated methods for national GHG inventories.10 The inventory methods provide flexibility to account for local conditions. The key sources of activity and projection data are shown in Table 4. Table 4 also provides the descriptions of the data provided by each source and the uses of each data set in this analysis. General Principles and Guidelines A key part of this effort involves the establishment and use of a set of generally accepted accounting principles for evaluation of historical and projected GHG emissions, as follows:
• Transparency: We report data sources, methods, and key assumptions to allow open
review and opportunities for additional revisions later based on input from others. In addition, we report key uncertainties where they exist.
8 U.S. EPA, Feb 2005. Draft Inventory of US Greenhouse Gas Emissions and Sinks: 1990-2003. http://yosemite.epa.gov/oar/globalwarming.nsf/content/ResourceCenterPublicationsGHGEmissionsUSEmissionsInventory2005.html. 9 http://yosemite.epa.gov/oar/globalwarming.nsf/content/EmissionsStateInventoryGuidance.html. 10 http://www.ipcc-nggip.iges.or.jp/public/gl/invs1.htm.
Final Utah GHG Inventory and Reference Case Projection CCS, July 2007
Utah Department of Environmental Quality
11
Center for Climate Strategies www.climatestrategies.us
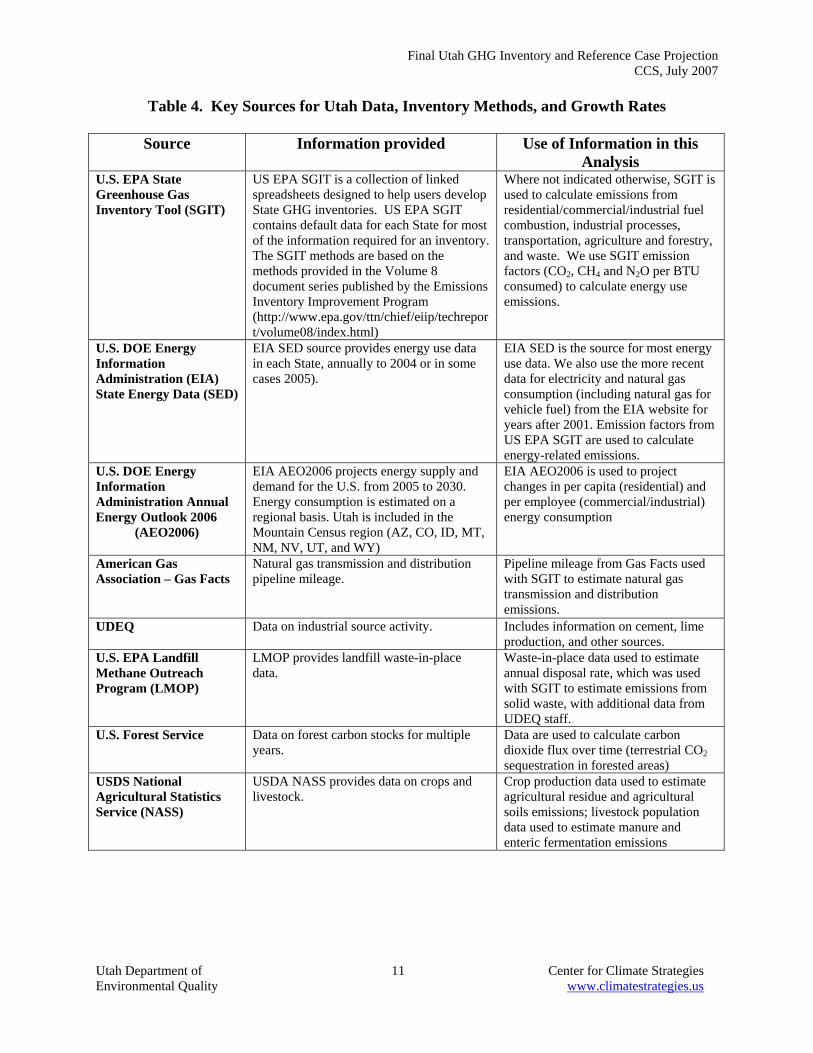
Table 4. Key Sources for Utah Data, Inventory Methods, and Growth Rates
Source Information provided Use of Information in this Analysis
U.S. EPA State Greenhouse Gas Inventory Tool (SGIT)
US EPA SGIT is a collection of linked spreadsheets designed to help users develop State GHG inventories. US EPA SGIT contains default data for each State for most of the information required for an inventory. The SGIT methods are based on the methods provided in the Volume 8 document series published by the Emissions Inventory Improvement Program (http://www.epa.gov/ttn/chief/eiip/techreport/volume08/index.html)
Where not indicated otherwise, SGIT is used to calculate emissions from residential/commercial/industrial fuel combustion, industrial processes, transportation, agriculture and forestry, and waste. We use SGIT emission factors (CO2, CH4 and N2O per BTU consumed) to calculate energy use emissions.
U.S. DOE Energy Information Administration (EIA) State Energy Data (SED)
EIA SED source provides energy use data in each State, annually to 2004 or in some cases 2005).
EIA SED is the source for most energy use data. We also use the more recent data for electricity and natural gas consumption (including natural gas for vehicle fuel) from the EIA website for years after 2001. Emission factors from US EPA SGIT are used to calculate energy-related emissions.
U.S. DOE Energy Information Administration Annual Energy Outlook 2006
(AEO2006)
EIA AEO2006 projects energy supply and demand for the U.S. from 2005 to 2030. Energy consumption is estimated on a regional basis. Utah is included in the Mountain Census region (AZ, CO, ID, MT, NM, NV, UT, and WY)
EIA AEO2006 is used to project changes in per capita (residential) and per employee (commercial/industrial) energy consumption
American Gas Association – Gas Facts
Natural gas transmission and distribution pipeline mileage.
Pipeline mileage from Gas Facts used with SGIT to estimate natural gas transmission and distribution emissions.
UDEQ Data on industrial source activity. Includes information on cement, lime production, and other sources.
U.S. EPA Landfill Methane Outreach Program (LMOP)
LMOP provides landfill waste-in-place data.
Waste-in-place data used to estimate annual disposal rate, which was used with SGIT to estimate emissions from solid waste, with additional data from UDEQ staff.
U.S. Forest Service Data on forest carbon stocks for multiple years.
Data are used to calculate carbon dioxide flux over time (terrestrial CO2 sequestration in forested areas)
USDS National Agricultural Statistics Service (NASS)
USDA NASS provides data on crops and livestock.
Crop production data used to estimate agricultural residue and agricultural soils emissions; livestock population data used to estimate manure and enteric fermentation emissions

Final Utah GHG Inventory and Reference Case Projection CCS, July 2007
Utah Department of Environmental Quality
12
Center for Climate Strategies www.climatestrategies.us
• Consistency: To the extent possible, the inventory and projections will be designed to be externally consistent with current or likely future systems for state and national GHG emission reporting. We have used the EPA tools for state inventories and projections as a starting point. These initial estimates were then augmented and/or revised as needed to conform with state-based inventory and base-case projection needs. For consistency in making reference case projections11, we define reference case actions for the purposes of projections as those currently in place or reasonably expected over the time period of analysis.
• Comprehensive Coverage of Gases, Sectors, State Activities, and Time Periods. This
analysis aims to comprehensively cover GHG emissions associated with activities in Utah. It covers all six GHGs covered by U.S. and other national inventories: CO2, CH4, N2O, SF6, HFCs, and PFCs and black carbon. The inventory estimates are for the year 1990, with subsequent years included up to most recently available data (typically 2002 to 2005), with projections to 2010 and 2020.
• Priority of Significant Emissions Sources: In general, activities with relatively small
emissions levels may not be reported with the same level of detail as other activities.
• Priority of Existing State and Local Data Sources: In gathering data and in cases where data sources conflicted, we placed highest priority on local and state data and analyses, followed by regional sources, with national data or simplified assumptions such as constant linear extrapolation of trends used as defaults where necessary.
• Use of Consumption-Based Emissions Estimates: To the extent possible, we estimated
emissions that are caused by activities that occur in Utah. For example, we reported emissions associated with the electricity consumed in Utah. The rationale for this method of reporting is that it can more accurately reflect the impact of State-based policy strategies such as energy efficiency on overall GHG emissions, and it resolves double counting and exclusion problems with multi-emissions issues. This approach can differ from how inventories are compiled, for example, on an in-state production basis, in particular for electricity.
For electricity, we estimate, in addition to the emissions due to fuels combusted at electricity plants in the State, the emissions related to electricity consumed in Utah. This entails accounting for the electricity sources used by Utah utilities to meet consumer demands. If UDEQ decides to refine this analysis, they may also consider estimating other sectoral emissions on a consumption basis, such as accounting for emissions from combustion of transportation fuel used in Utah, but purchased out-of-state. In some cases this can require venturing into the relatively complex terrain of life-cycle analysis. In general, CCS recommends considering a consumption-based approach where it will significantly improve the estimation of the emissions impact of potential mitigation strategies. For example re-use, recycling, and source reduction can lead to emission reductions resulting from lower energy requirements for material production (such as paper,
11 “Reference case” refers to a projection of the current or “base year” inventory to one or more future years under business-as-usual forecast conditions (for example, existing control programs and economic growth).

Final Utah GHG Inventory and Reference Case Projection CCS, July 2007
Utah Department of Environmental Quality
13
Center for Climate Strategies www.climatestrategies.us
cardboard, and aluminum), even though production of those materials, and emissions associated with materials production, may not occur within the State. Details on the methods and data sources used to construct the inventories and forecasts for each source sector are provided in the following appendices:
• Appendix A. Electricity Use and Supply.
• Appendix B. Residential, Commercial, and Industrial (RCI) Fossil Fuel Combustion (excluding fuel used by the fossil fuel production industry).
• Appendix C. Transportation Energy Use.
• Appendix D. Industrial Processes.
• Appendix E. Fossil Fuel Industries.
• Appendix F. Agriculture.
• Appendix G. Waste Management.
• Appendix H. Forestry. Appendix I contains a discussion of the inventory and forecast for black carbon. Appendix J provides additional background information from the U.S. EPA on greenhouse gases and global warming potential values. [To conserve paper, the appendices can be found online at: http://www.deq.utah.gov/BRAC_Climate/docs/Final_Utah_GHG_I&F_Report_080907.pdf]