final update on the new faculty course evaluation & online system november, 2003
TRANSCRIPT

Final Update on the New Faculty Course Evaluation & Online System
November, 2003

Agenda Motivation for New Instrument Quick History of the Process Demonstration of “Report Back” Features Access for Various Audiences Template for Reporting to Promotion
Committees Initial Implementation Period Issue of Response Rate Endorsements
Motivation for a New Instrument

Why are we doing this? Faculty complaints about the current
FCE over the years Current FCE not reflective of what they do
in class Questions too general & global to be
informative Concern that the two overall questions are
the only data used for promotion decisions

Quick History of Process

Process
Fall 2001 Committee of Faculty & Eberly staff developed instrument (Akin,
Ambrose, Fay, Fischhoff, Kadane, Larkey, Nair) Protocol Study with 20 students - revised instrument accordingly Pilot study in 23 courses (n = 635 student respondents)
Half on-line, half on paper in class In one large class, half on-line, half on paper On-line response rate = 42% (Spring 2000 in class response rate = 52%) Respondents from all colleges Freshmen through graduate students Wide range of class types (e.g. small seminars,labs, studios, lectures, project courses)
Spring 2002 Analyzed data, interviewed pilot faculty and students - revised
accordingly Eberly & OTE continued development and testing of online survey
instrument

Process (cont)
Fall 2002 Met with former and current members of the university RPT committee
members (to discuss summative use of data) Continued development of on-line system
Spring 2003 Pilot Study: 46 courses (n = 490 student responses)
On-line response rate = 46% Respondents from all colleges Freshmen through graduate students Wide range of class types (e.g. small seminars,labs, studios, lectures, project
courses) Analyzed data, secured feedback from pilot faculty and students -revised
accordingly Met with Executive Committee of Faculty Senate - revised accordingly

Process (cont)
Fall 2003 Met with Executive Committee of Faculty
Senate Further review and revision of instrument and
on-line system Analysis of pilot data to examine relationships
among items (regressions, factor analysis, etc)
Our Concerns about Overall Questions Past & current promotion committees’
emphasis on two overall questions Large body of evidence shows that overall
questions have no relationship to questions targeting specific instructor behaviors, learning outcomes or course activities
Our analyses from pilot tests are consistent with these findings

Concerns about overall questions (cont) Research indicates that overall questions are
prone to influence by a variety of factors Course content (e.g., quantitative vs non-
quantitative) Anticipated grades Class size Physical attractiveness of the instructor Difficulty of the course Workload

Our Recommendation Based on the large body of data
supporting bias with these measures, we initially excluded the overall questions. HOWEVER, Response by faculty and department
heads was overwhelmingly negative Hence, under duress and against our
better judgment, we re-inserted the overall questions :(
Our recommendations regarding use of FCEs FCEs should be used in conjunction with other
sources of data in a portfolio Reflective statement from faculty member Course syllabi Examples of assessments (exams, projects,
homework, etc) Samples of student work with feedback (essays,
creative work, lab reports, etc) Alumni letters/ratings Colleague letters (e.g., instructors in follow-up
courses commenting on preparedness of students)
Our recommendations (cont) If overall questions are used for
promotion purposes, minimally the section average ratings should also be included (Learning Outcomes, Instructor Behaviors, Course Activities)
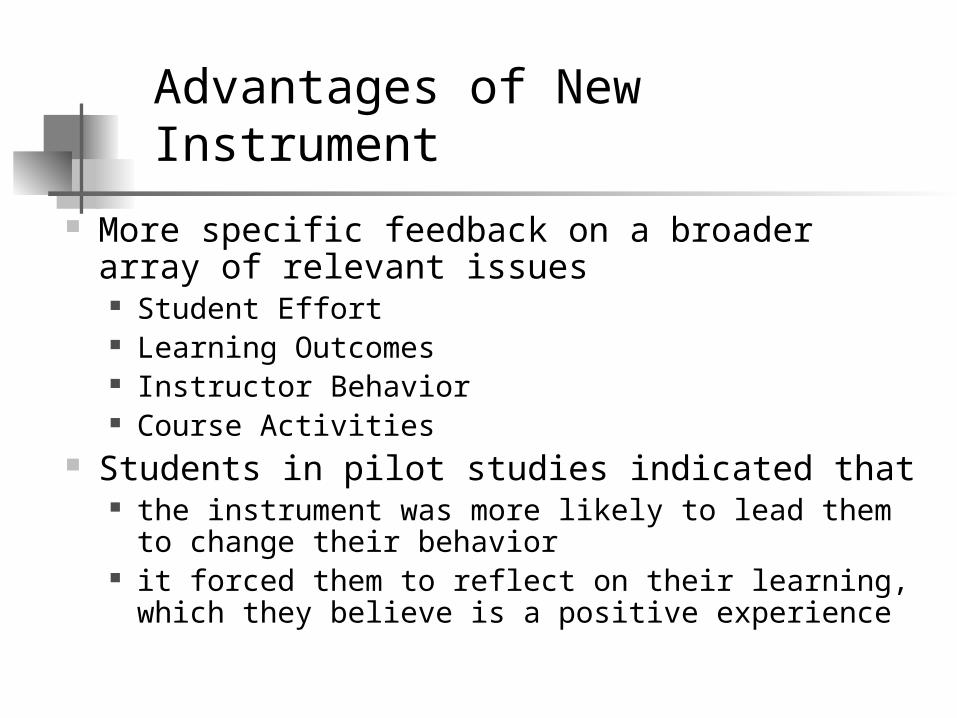
Advantages of New Instrument
More specific feedback on a broader array of relevant issues Student Effort Learning Outcomes Instructor Behavior Course Activities
Students in pilot studies indicated that the instrument was more likely to lead them to change
their behavior it forced them to reflect on their learning, which they
believe is a positive experience

Advantages of On-line System
Provides as little or as much data as faculty members want, including relationships among questions, responses by sub-categories, etc.
Results will be available as soon as grades are turned in
Won’t take class time Provides extended time (may increase response
rate) Reduce current data entry errors
Demonstration of “Report” Back Features
Access

Access Faculty Members Department Heads Deans Students Promotion Committees

Faculty, Department Heads, Deans
To date all three groups have had full access to all information. This current practice will be maintained. Access will include
Course enrollment and response rate Average ratings for each section (learning outcomes, instructor behaviors, course
activities and resources) * Average ratings for overall questions (instructor and course)* Average ratings for individual items* Comparative statistics for department and college on above five items Relationships between items Filtering responses by subgroup (e.g.by major, year, etc) Student comments
*Also included are response distribution, standard deviation and median.

Students To date students have had access to average ratings for
all questions; they were not privy to comments. This current practice will be maintained. Access will include:
Average ratings for each section (learning outcomes, instructor behaviors, course activities and resources)
Average ratings for overall questions (instructor and course) Average ratings for individual items

Promotion Committees
To date promotion committees utilized, among other data, averages of all questions and/or of the two overall questions. The Provost and Deans agreed to pilot the following template, that includes
Course enrollment and response rate Average ratings for each section (learning outcomes, instructor
behaviors, course activities and resources) Average ratings for overall questions (instructor and course) Comparative statistics for department and college on above five
items

Course Summary Sheet Instructor: _______________________
All items are on a 5-pt scale.
Courses & Year Enrollment ResponseRate
LearningOutcomes
CourseActivities
Overall CourseRating
InstructorBehaviors
OverallInstructorRating
University: year - year
College: year - year
Comments/Explanations

Example of Additional Information
Department heads could include, for courses with low [explainable] FCEs Comparison to course ratings over time Comparison for faculty member over time (to show
improvement) Ratings by sub-groups (e.g. majors vs.non-majors) Departmental Comparisons to similar courses (e.g.
large lecture, major-only, upper division, etc)

Supplementary Information: Comparison to other years and/or instructors
Instructor: ______________________________________ Course: ______________________________
Comparative semester/yearCurrent
1. Learning Outcomes (Average rating across N items)1 - None/Not at all] [2 - A Little] [3 - Some] [4 - A Lot] 5 - An Exceptional
Amount]
2. Instructor Behaviors (Average rating across N items) [1 - R-Poor] [2 - D-Fair] [3 - C-Good] [4 - B-Very Good] [5 - A-Excellent]
3. Overall, how would you rate this instructor's teaching? [1 - R=Poor] [2 - D=Fair] [3 - C=Good] [4 - B=Very Good] [5 -
A=Excellent]
4. Course Resources & Activities (Average rating across Nitems).
[1 - Not at all Useful] [2 - Slightly Useful] [3 - Somewhat Useful] [4 - VeryUseful] [5 - Extremely Useful]
5. How would you rate the overall quality of this course?[1 - R=Poor] [2 - D=Fair] [3 - C=Good] [4 - B=Very Good] [5 -
A=Excellent]
Comments/Explanations:
This supplementary form could be used to demonstrate that an instructor’s ratings, although lower than the averagedepartmental ratings, are similar to or better than other instructors’ or other years’ ratings for this course. This would beappropriate when a course is notorious for receiving poor ratings regardless of the instructor.

Supplementary Information: Change in Performance over time
Instructor: ______________________________________ Course(s)__________________________
Semester/Year
1. Learning Outcomes (Average rating across N items)1 - None/Not at all] [2 - A Little] [3 - Some] [4 - A Lot] 5 - An Exceptional
Amount]
2. Instructor Behaviors (Average rating across N items) [1 - R-Poor] [2 - D-Fair] [3 - C-Good] [4 - B-Very Good] [5 - A-Excellent]
3. Overall, how would you rate this instructor's teaching? [1 - R=Poor] [2 - D=Fair] [3 - C=Good] [4 - B=Very Good] [5 -
A=Excellent]
4. Course Resources & Activities (Average rating across Nitems).
[1 - Not at all Useful] [2 - Slightly Useful] [3 - Somewhat Useful] [4 - VeryUseful] [5 - Extremely Useful]
5. How would you rate the overall quality of this course?[1 - R=Poor] [2 - D=Fair] [3 - C=Good] [4 - B=Very Good] [5 -
A=Excellent]
Comments/Explanations:
This form would be appropriate for instructors who may currently have comparatively lower ratings but who have shownsignificant improvement over time.

Initial Implementation Period
The initial four semester period (from Fall 2004 to Spring 2006) will be used for: Analysis of data for recalibration of university, college
and department means Analysis of data from the instrument to investigate the
relationships between ratings and irrelevant factors (anticipated grades, class size, workload, etc)
Analysis of data from the instrument and from students, faculty, department heads, deans and promotion committees to revise guidelines and policies, if necessary

Response Rate Issue Response Rate
Student Senate will promote the new instrument with a media blitz
We will utilize Blackboard, Portal, and E-mail to prompt completion of instrument each semester, including reminders for non-respondents
We will expand length of time for completion of course evaluations
We will prompt faculty to remind students within courses
Endorsements to Date Student Senate Executive Committee of Faculty Senate Department Heads Deans Provost and President University Education Council Graduate Student Organization
Faculty Senate?